hemodialysis adequacy: a complex and evolving...
TRANSCRIPT
Hemodialysis Adequacy:A Complex and Evolving
Paradigm
Balazs Szamosfalvi, MDSaturday, 08/29/2009 12:15-12:45

Adequacy 1943 - 1970
©Fresenius ©Fresenius
• The patient survived the dialysis session
• Uremia improved
• Volume status improved
• Patient survival to recovery of kidney function or transplant
Source: http://www.homedialysis.org/learn/museum/
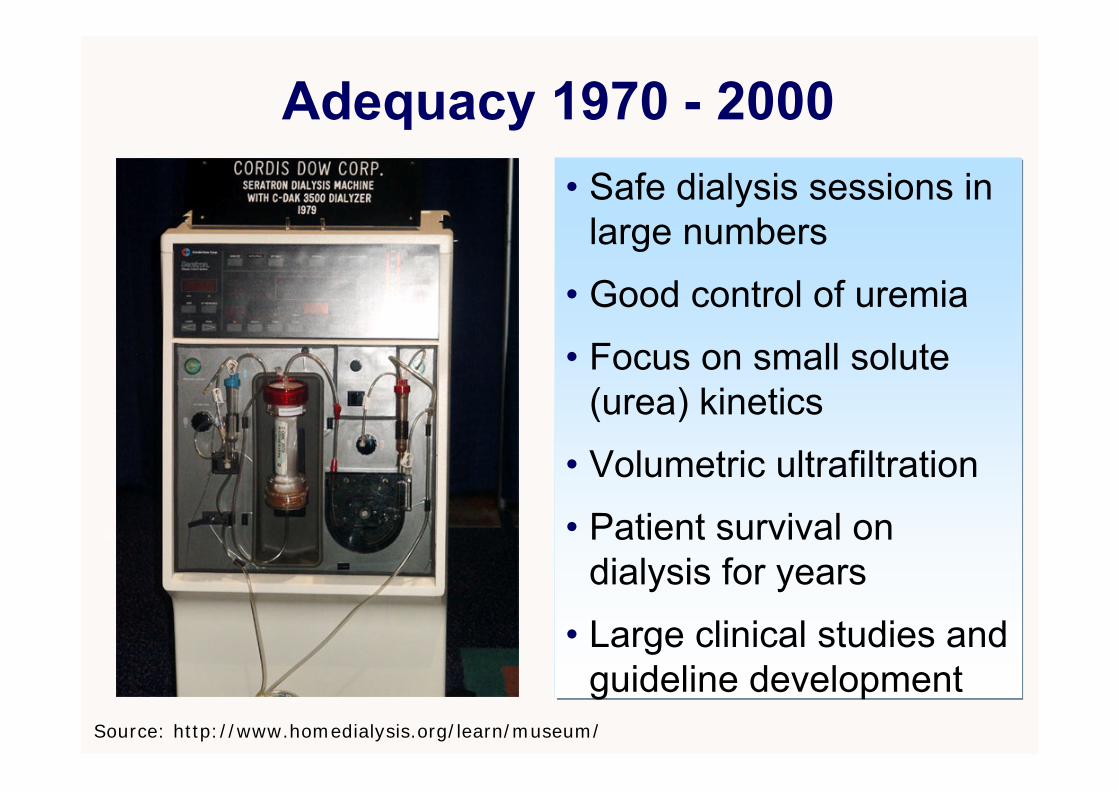
Adequacy 1970 - 2000
©Fresenius ©Fresenius
• Safe dialysis sessions in large numbers
• Good control of uremia
• Focus on small solute (urea) kinetics
• Volumetric ultrafiltration
• Patient survival on dialysis for years
• Large clinical studies and guideline development
Source: http://www.homedialysis.org/learn/museum/
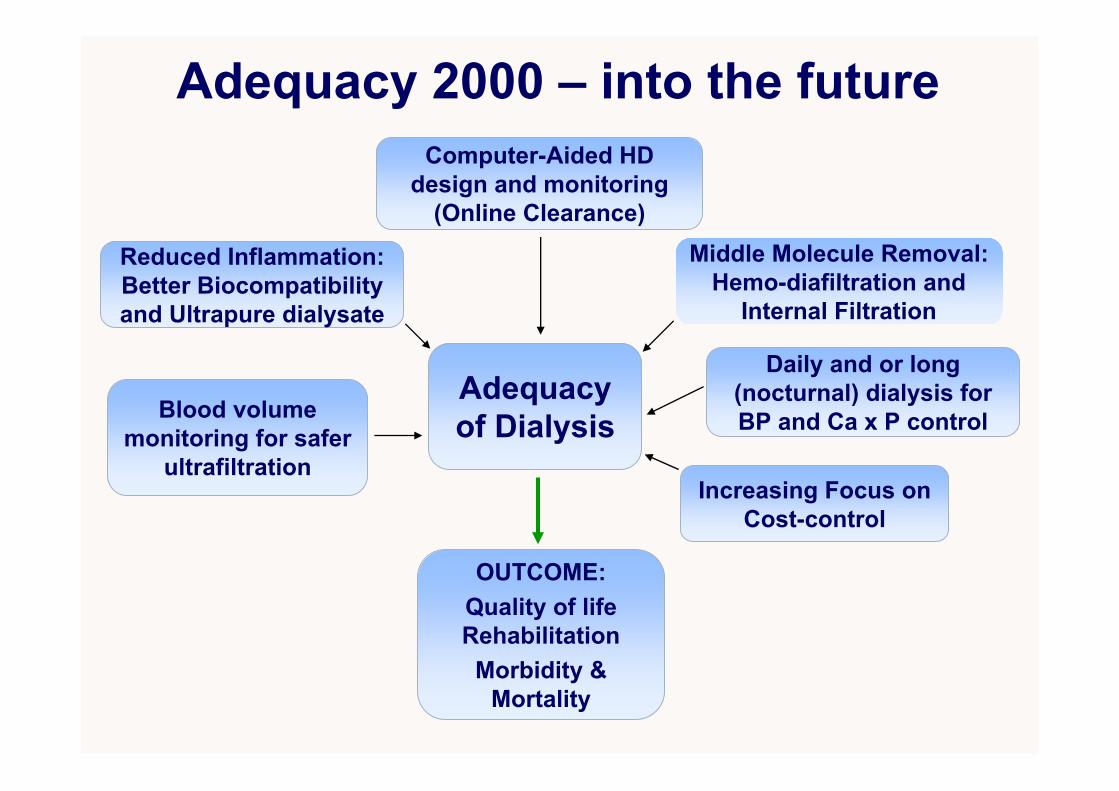
Middle Molecule Removal: Hemo-diafiltration and
Internal Filtration
Reduced Inflammation: Better Biocompatibility and Ultrapure dialysate
Computer-Aided HD design and monitoring
(Online Clearance)
Blood volume monitoring for safer
ultrafiltration
Adequacy of Dialysis
Daily and or long (nocturnal) dialysis for BP and Ca x P control
Adequacy 2000 – into the future
Increasing Focus on Cost-control
OUTCOME:Quality of life Rehabilitation
Morbidity & Mortality
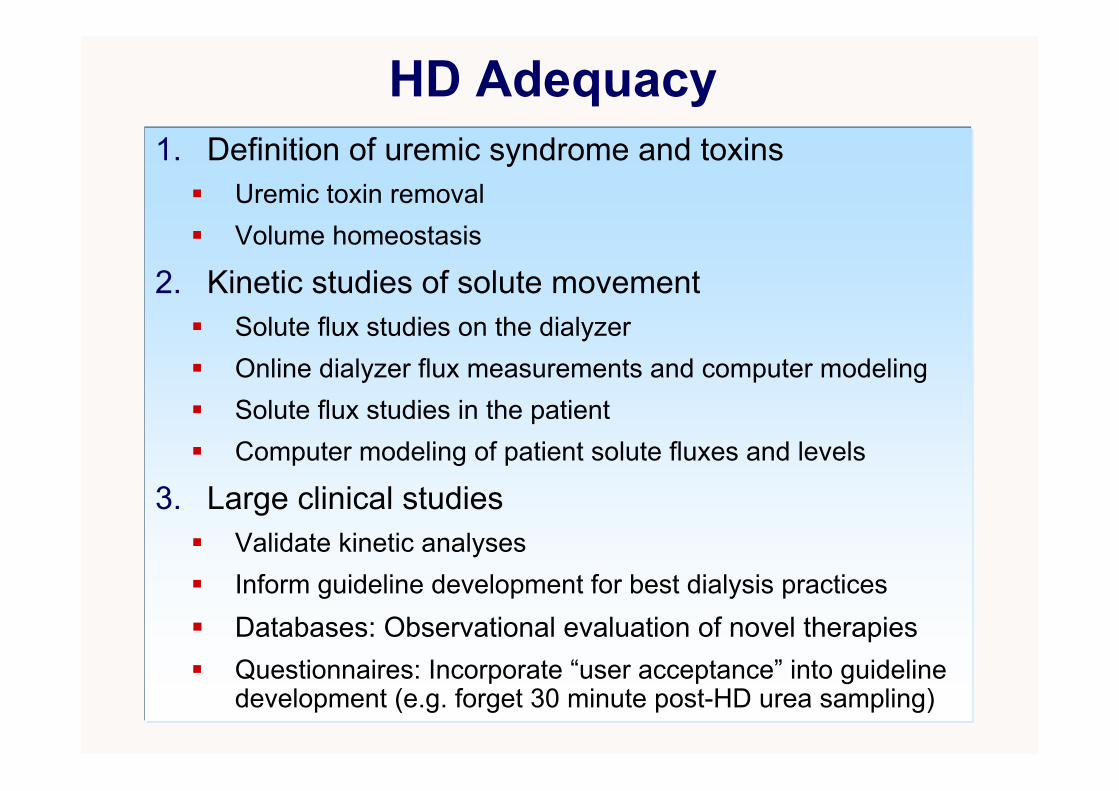
HD Adequacy1. Definition of uremic syndrome and toxins
Uremic toxin removalVolume homeostasis
2. Kinetic studies of solute movement Solute flux studies on the dialyzerOnline dialyzer flux measurements and computer modelingSolute flux studies in the patientComputer modeling of patient solute fluxes and levels
3. Large clinical studiesValidate kinetic analysesInform guideline development for best dialysis practicesDatabases: Observational evaluation of novel therapiesQuestionnaires: Incorporate “user acceptance” into guideline development (e.g. forget 30 minute post-HD urea sampling)
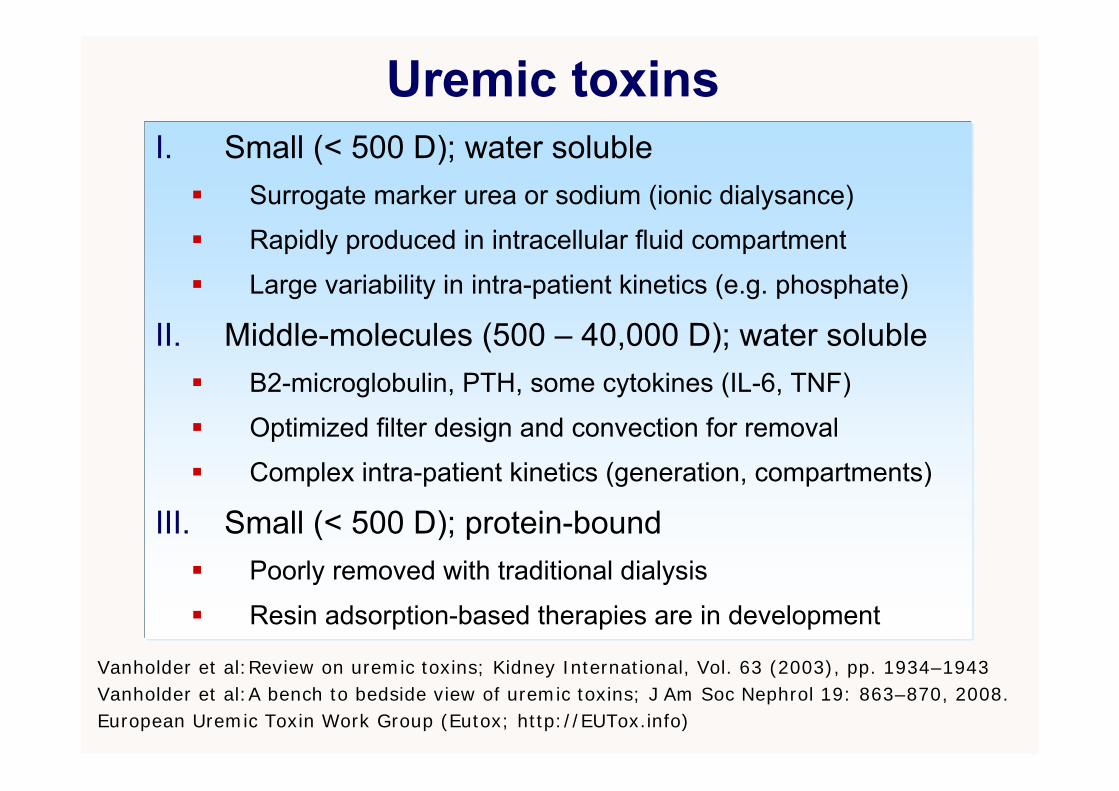
Uremic toxinsI. Small (< 500 D); water soluble
Surrogate marker urea or sodium (ionic dialysance)
Rapidly produced in intracellular fluid compartment
Large variability in intra-patient kinetics (e.g. phosphate)
II. Middle-molecules (500 – 40,000 D); water soluble Β2-microglobulin, PTH, some cytokines (IL-6, TNF)
Optimized filter design and convection for removal
Complex intra-patient kinetics (generation, compartments)
III. Small (< 500 D); protein-boundPoorly removed with traditional dialysis
Resin adsorption-based therapies are in development
Vanholder et al:Review on uremic toxins; Kidney International, Vol. 63 (2003), pp. 1934–1943Vanholder et al:A bench to bedside view of uremic toxins; J Am Soc Nephrol 19: 863–870, 2008.European Uremic Toxin Work Group (Eutox; http://EUTox.info)

Examples of uremic toxins
From Primer On Kidney Diseases, 2nd editition
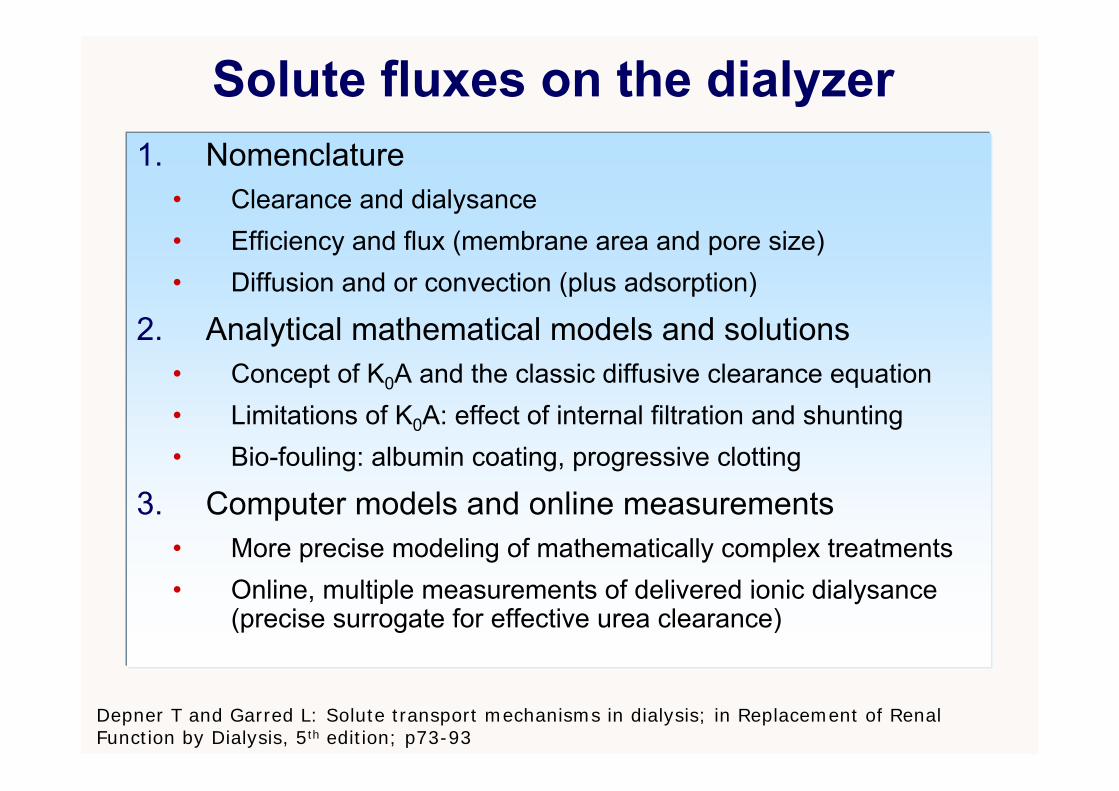
Solute fluxes on the dialyzer1. Nomenclature
• Clearance and dialysance• Efficiency and flux (membrane area and pore size)• Diffusion and or convection (plus adsorption)
2. Analytical mathematical models and solutions • Concept of K0A and the classic diffusive clearance equation• Limitations of K0A: effect of internal filtration and shunting• Bio-fouling: albumin coating, progressive clotting
3. Computer models and online measurements• More precise modeling of mathematically complex treatments• Online, multiple measurements of delivered ionic dialysance
(precise surrogate for effective urea clearance)
Depner T and Garred L: Solute transport mechanisms in dialysis; in Replacement of Renal Function by Dialysis, 5th edition; p73-93
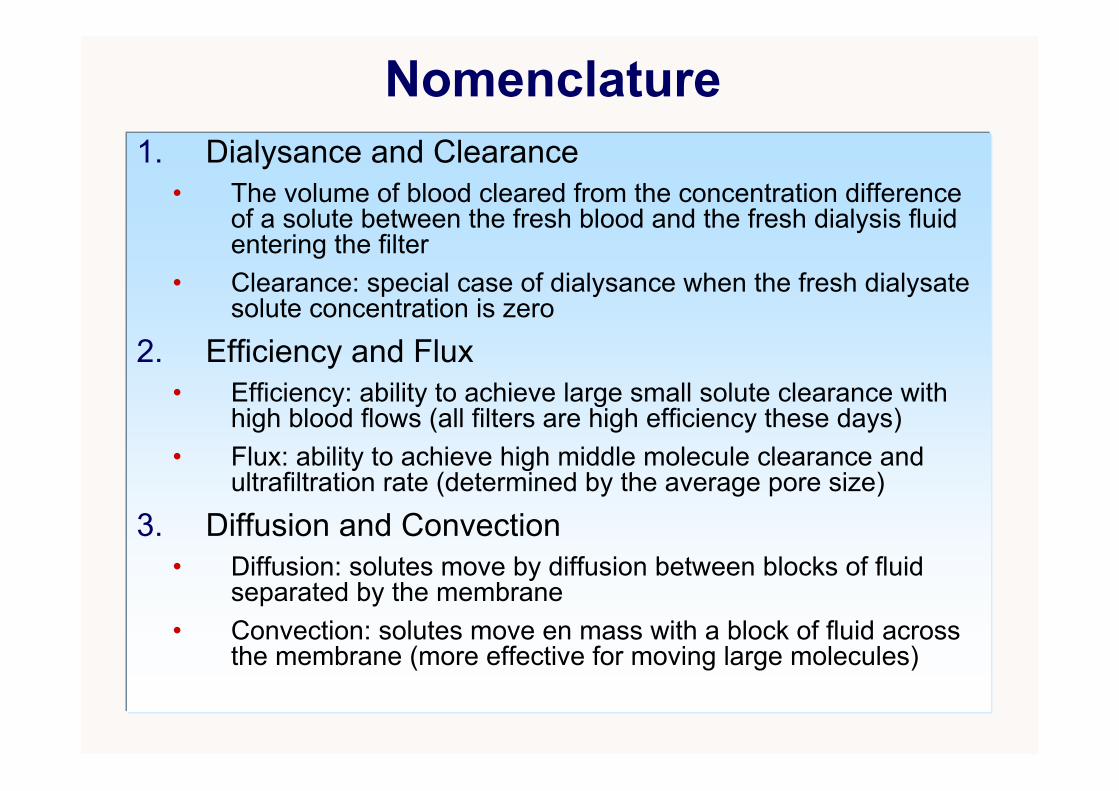
Nomenclature1. Dialysance and Clearance
• The volume of blood cleared from the concentration difference of a solute between the fresh blood and the fresh dialysis fluidentering the filter
• Clearance: special case of dialysance when the fresh dialysate solute concentration is zero
2. Efficiency and Flux• Efficiency: ability to achieve large small solute clearance with
high blood flows (all filters are high efficiency these days)• Flux: ability to achieve high middle molecule clearance and
ultrafiltration rate (determined by the average pore size)
3. Diffusion and Convection• Diffusion: solutes move by diffusion between blocks of fluid
separated by the membrane• Convection: solutes move en mass with a block of fluid across
the membrane (more effective for moving large molecules)

Membrane Flux and Pore Size 1
Sivasankaran Ambalavanan, Gary Rabetoy & Alfred K. Cheung; www.kidneyatlas.org
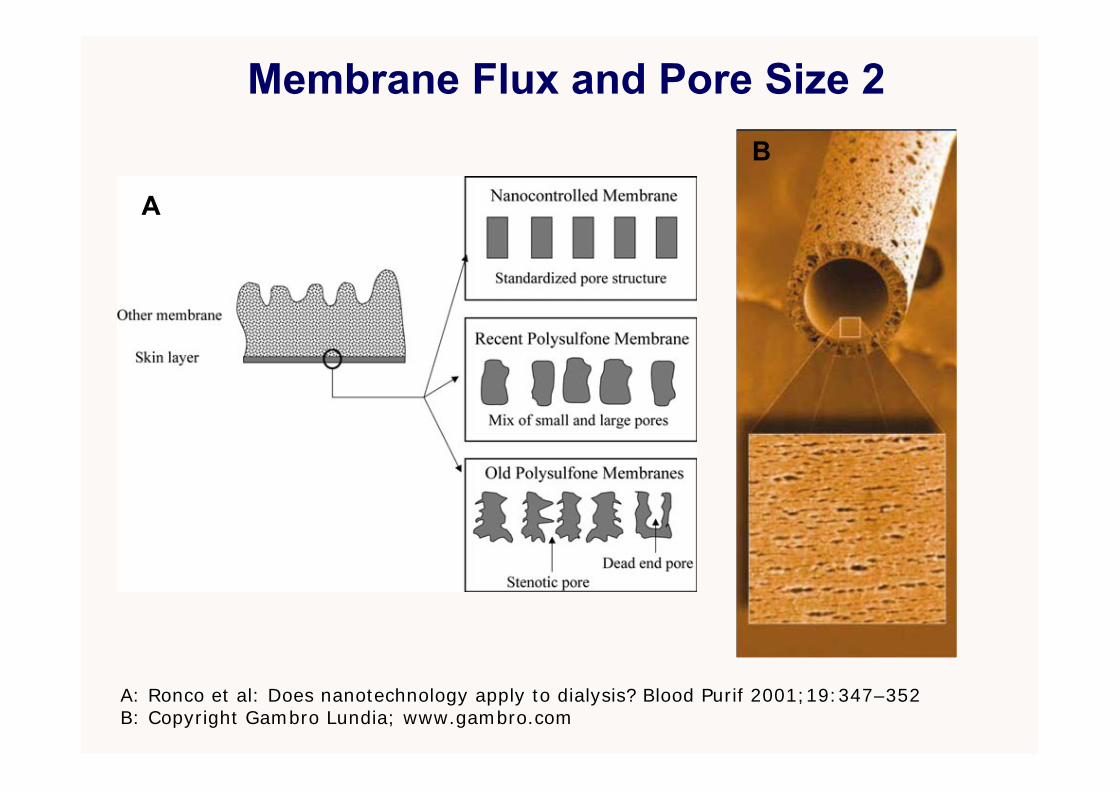
Membrane Flux and Pore Size 2
A: Ronco et al: Does nanotechnology apply to dialysis? Blood Purif 2001;19:347–352B: Copyright Gambro Lundia; www.gambro.com
A
B
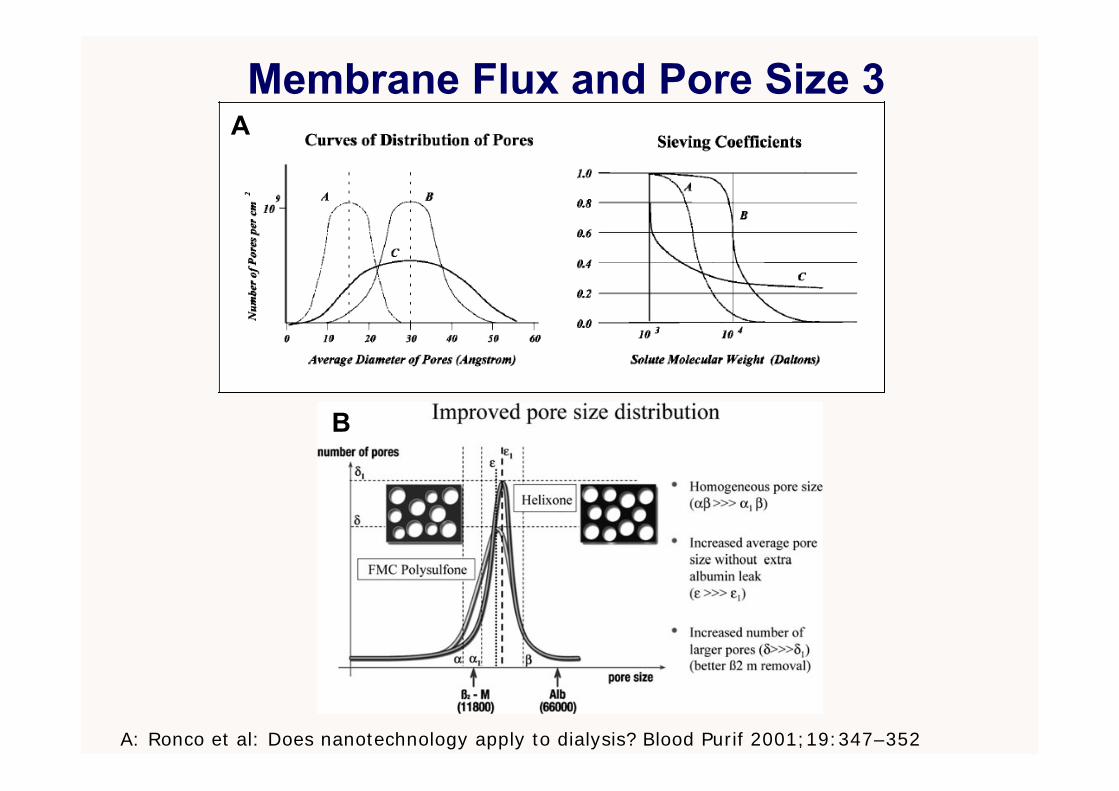
Membrane Flux and Pore Size 3
A: Ronco et al: Does nanotechnology apply to dialysis? Blood Purif 2001;19:347–352
A
B
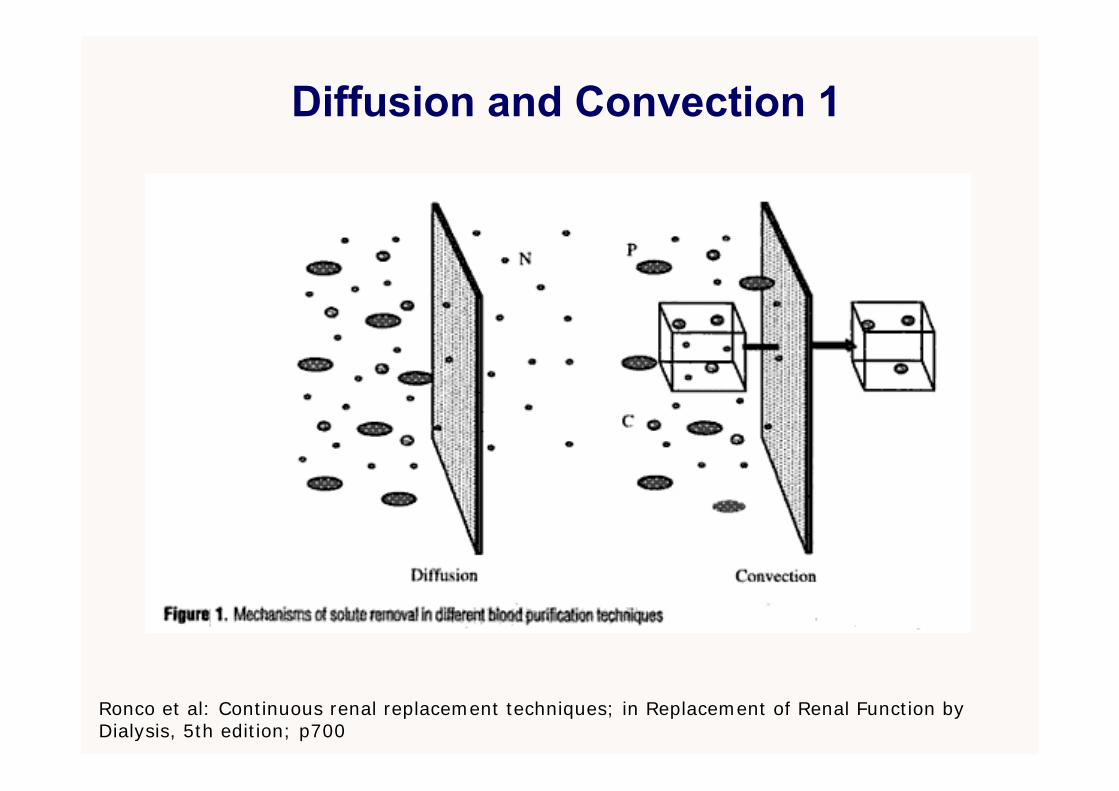
Diffusion and Convection 1
Ronco et al: Continuous renal replacement techniques; in Replacement of Renal Function by Dialysis, 5th edition; p700
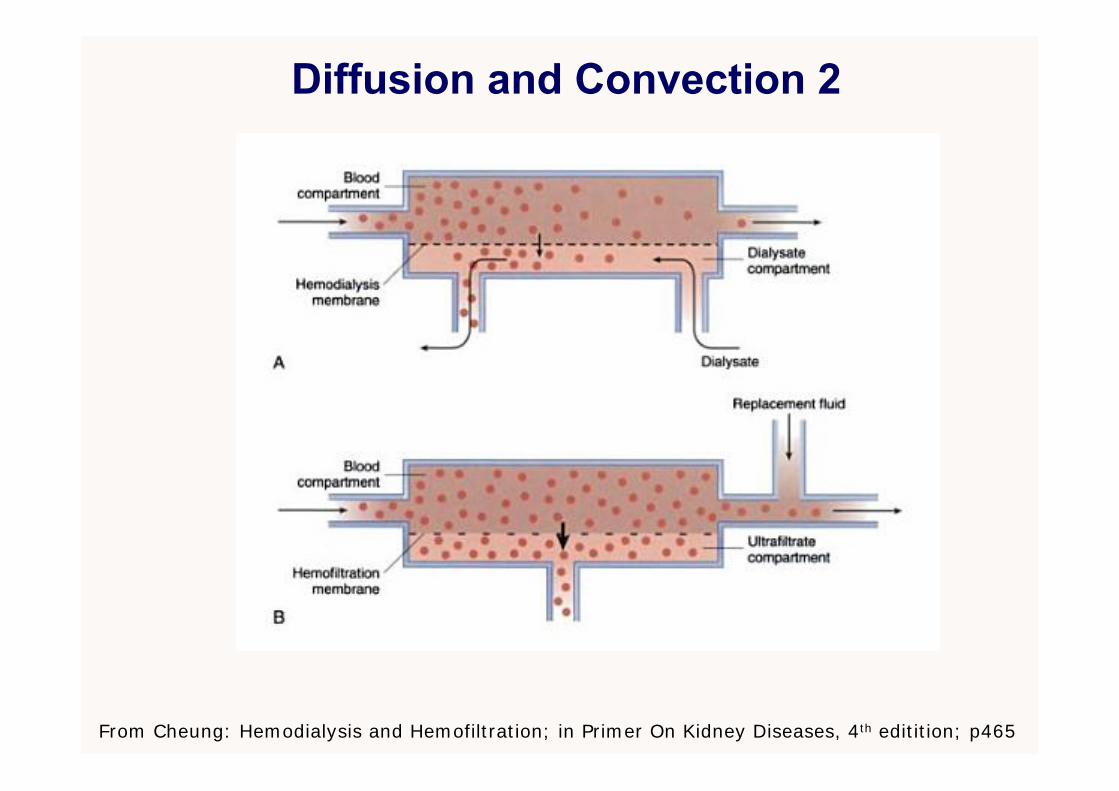
Diffusion and Convection 2
From Cheung: Hemodialysis and Hemofiltration; in Primer On Kidney Diseases, 4th editition; p465
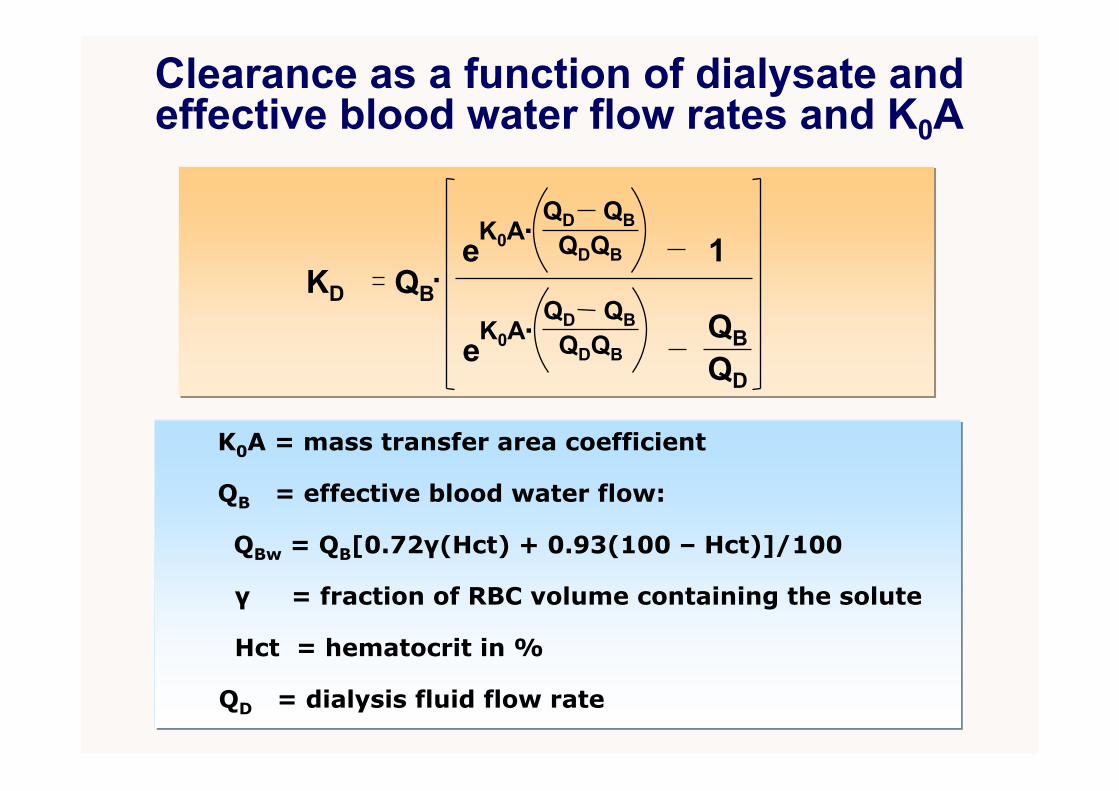
Clearance as a function of dialysate and effective blood water flow rates and K0A
KD.QB
1
QBQD
eQBQD
QDQB.K0A
eQBQD
QDQB.K0A
K0A = mass transfer area coefficient
Hct = hematocrit in %
QB = effective blood water flow:
QBw = QB[0.72γ(Hct) + 0.93(100 – Hct)]/100
QD = dialysis fluid flow rate
γ = fraction of RBC volume containing the solute

Concept of K0A1. Mathematical construct which predicts filter
clearance with clinically good accuracy• Incorporates solute properties• Incorporates fluid layer resistance to diffusion on
both the blood and dialysate side of the membrane• Incorporates membrane resistance to diffusion
2. Limitations• Bio-fouling and partial clotting changes K0A• KoA may change with blood and dialysate flow
depending on filter geometry (effect of shunting, internal filtration)
• Hemodiafiltration, partially protein-bound solutes require more complex equations
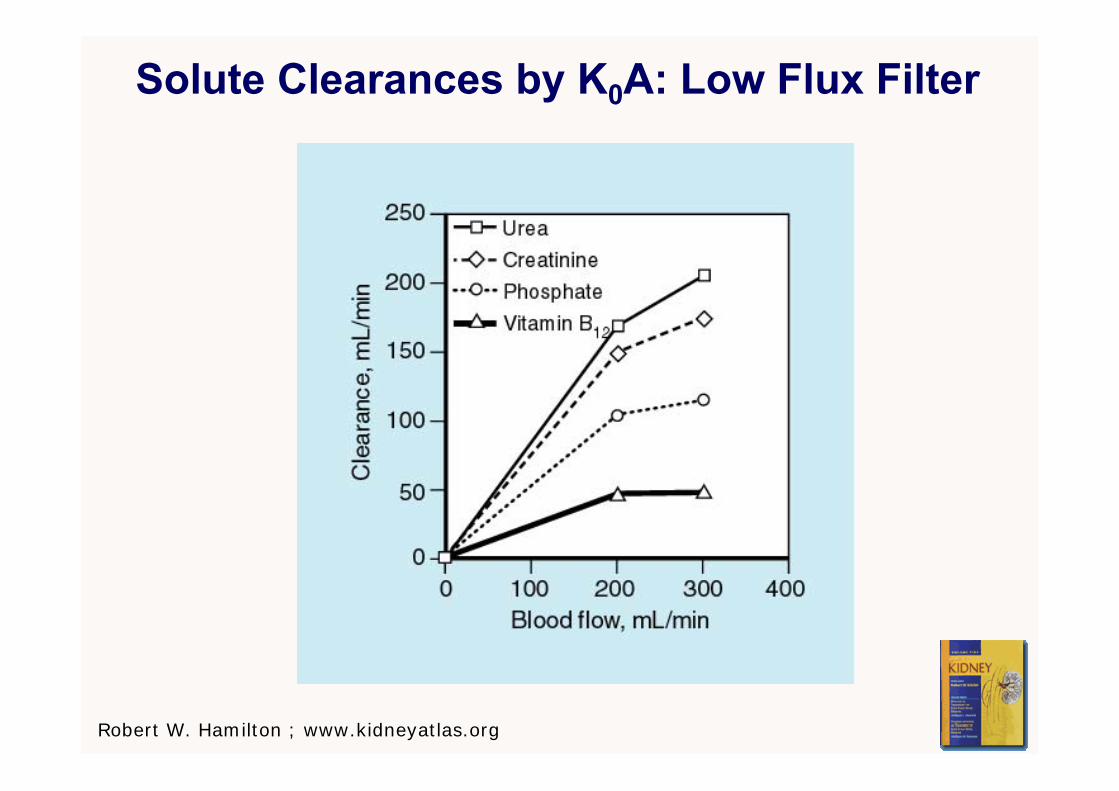
Solute Clearances by K0A: Low Flux Filter
Robert W. Hamilton ; www.kidneyatlas.org
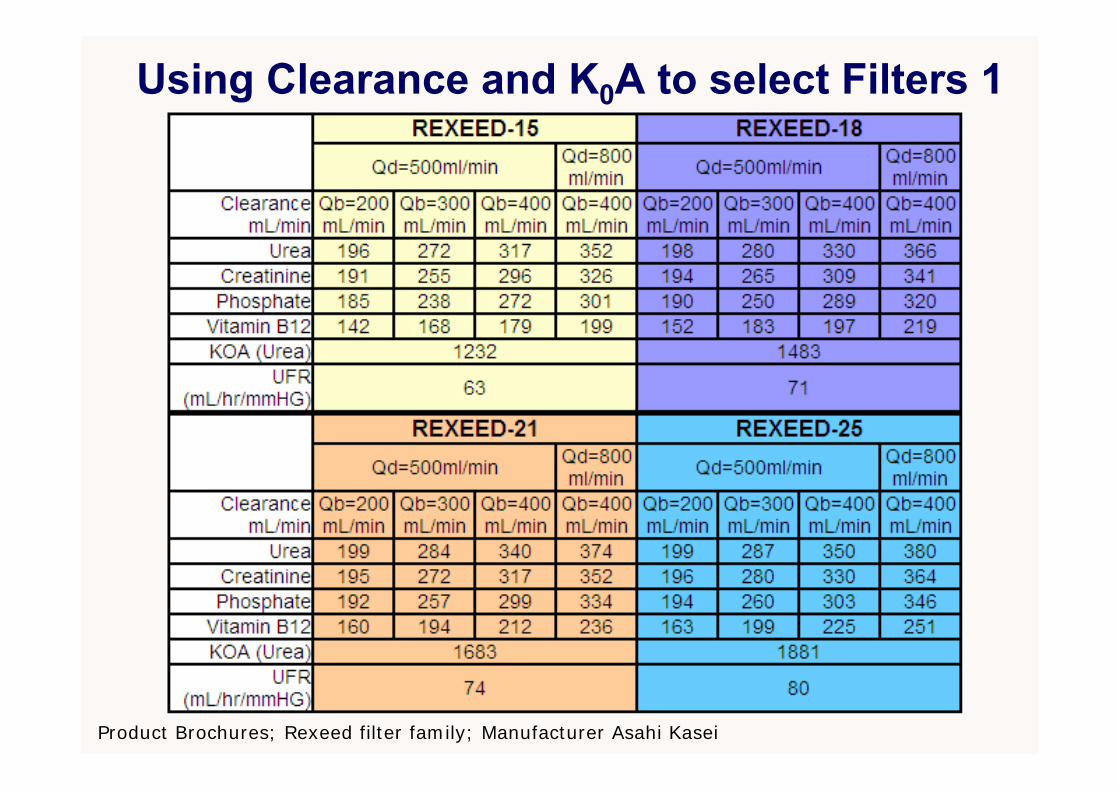
Using Clearance and K0A to select Filters 1
Product Brochures; Rexeed filter family; Manufacturer Asahi Kasei
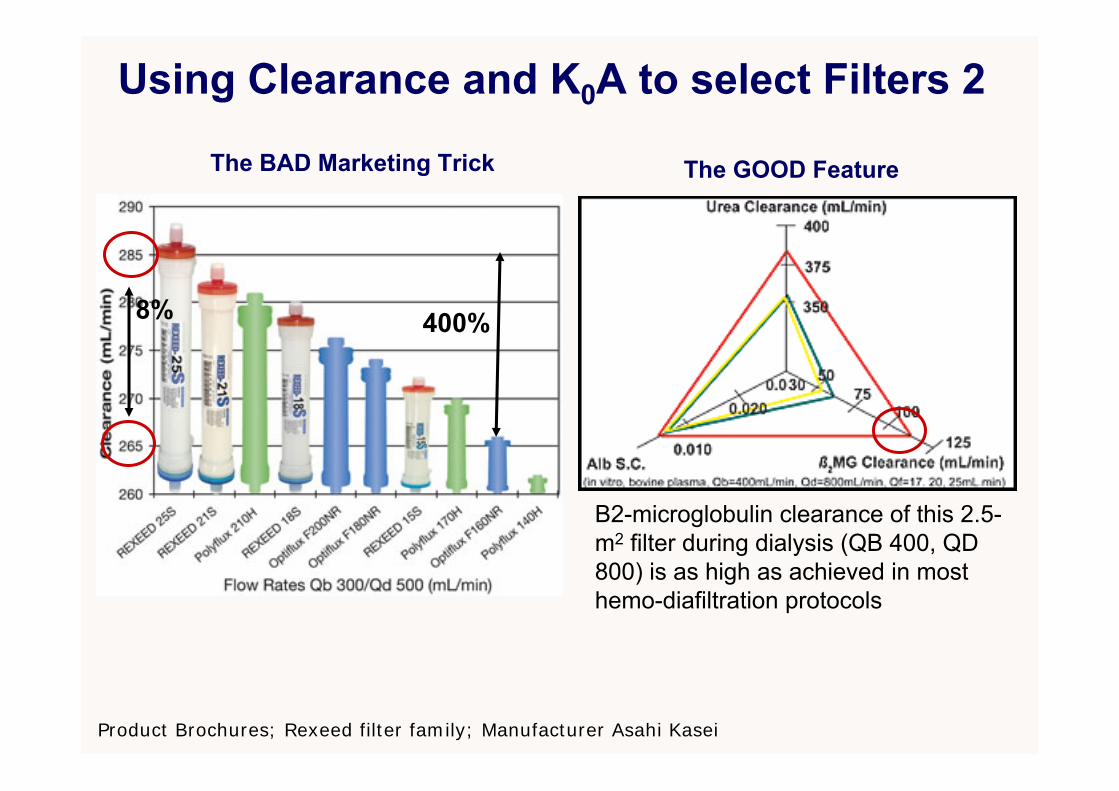
Using Clearance and K0A to select Filters 2
Product Brochures; Rexeed filter family; Manufacturer Asahi Kasei
The BAD Marketing Trick The GOOD Feature
8% 400%
Β2-microglobulin clearance of this 2.5-m2 filter during dialysis (QB 400, QD 800) is as high as achieved in most hemo-diafiltration protocols
Walther et al:Kidney International (2006) 69, 1056–1063.
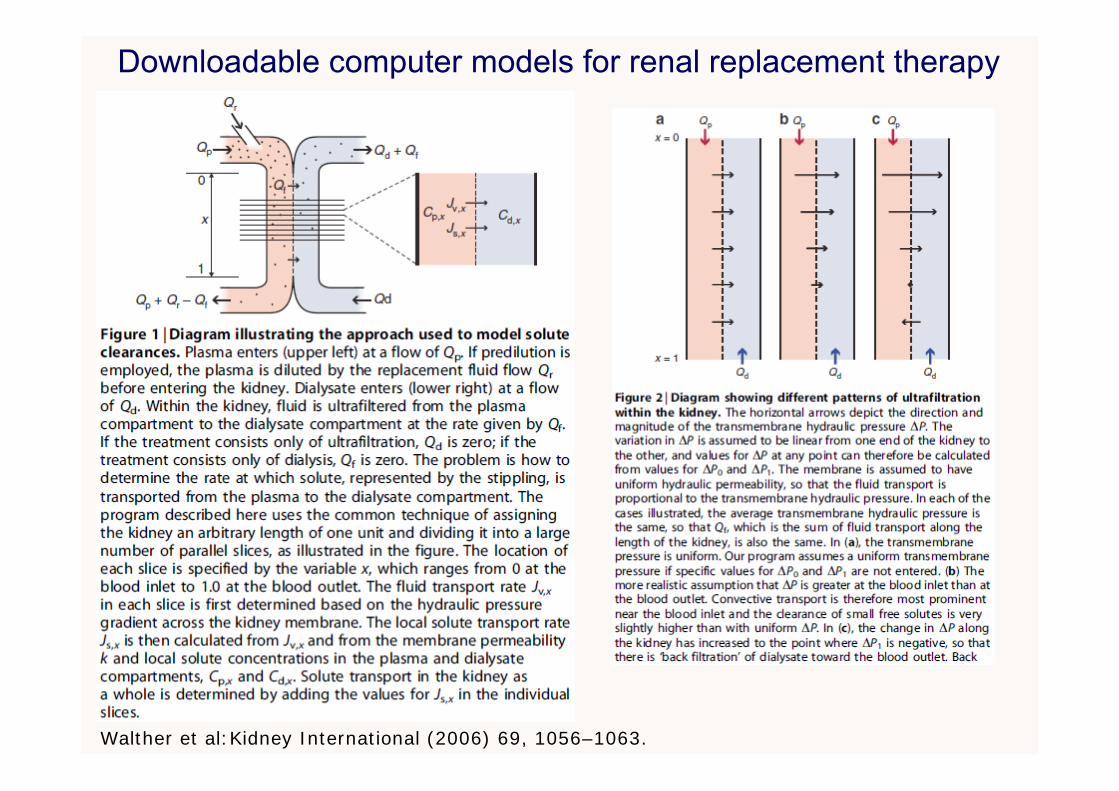
Downloadable computer models for renal replacement therapy
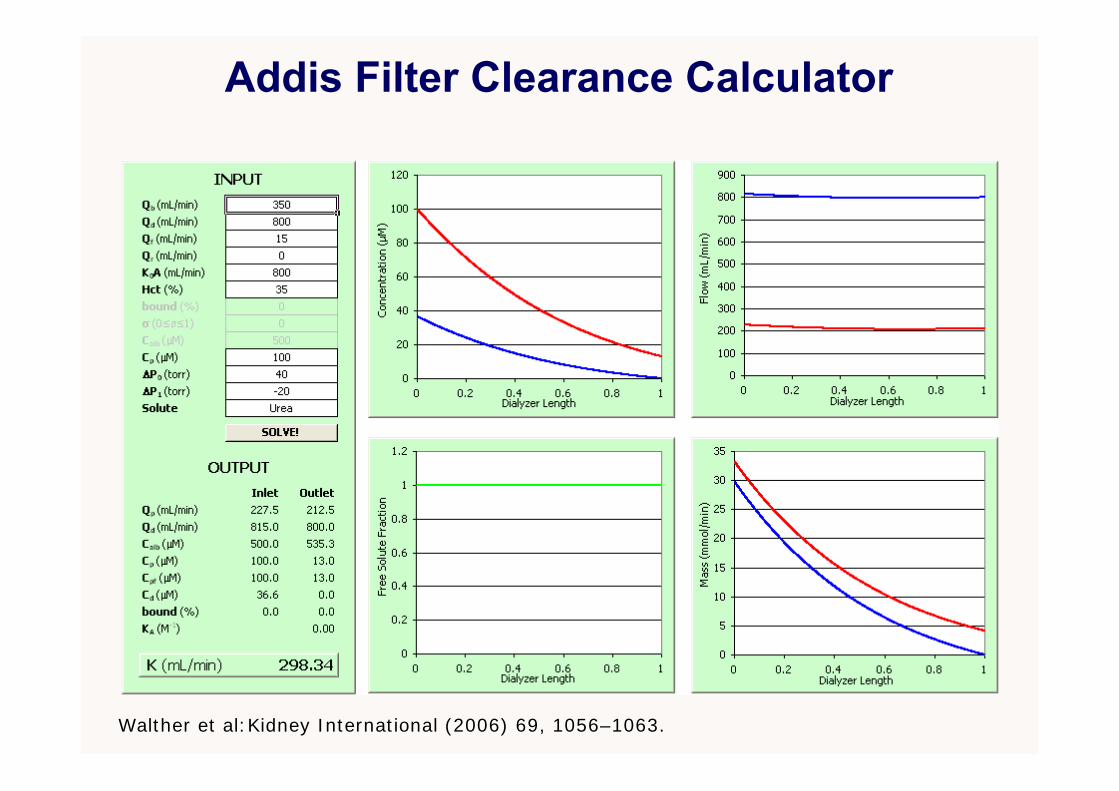
Walther et al:Kidney International (2006) 69, 1056–1063.
Addis Filter Clearance Calculator

Heparin Anticoagulation: Scanning Electron Micrograph of Polysulfone Dialyzer Membrane
1a
1b
Hofbauer et al: Effect of anticoagulation on blood membrane interactions during dialysis; Kidney Int, Vol 56 (1999): pp 1578-1583

Dialysis Machine with Online Clearance
Effluent
Access Catheter
Treatment Data on Machine Display
Display
Internal Balancing Chambers
Dialyzer
Conductivity Sensors

Online clearance measurement 11. Online measured small solute clearance
• Automatically measured ionic (Na+) dialysance• Inexpensive, highly reproducible and accurate• Very robust, unlikely to malfunction• Clinically insignificant effect on the patient• Excellent agreement with measured urea clearance
2. Limitations• Slow acceptance into clinical practice• Has not been implemented for low (< 300 ml/min)
dialysate flow• Does not provide urea generation or nPCR data
Gotch et al:Mechanisms determining the ratio of conductivity clearance to urea clearance; Kidney International, Vol. 66 (2004), pp. S3–24
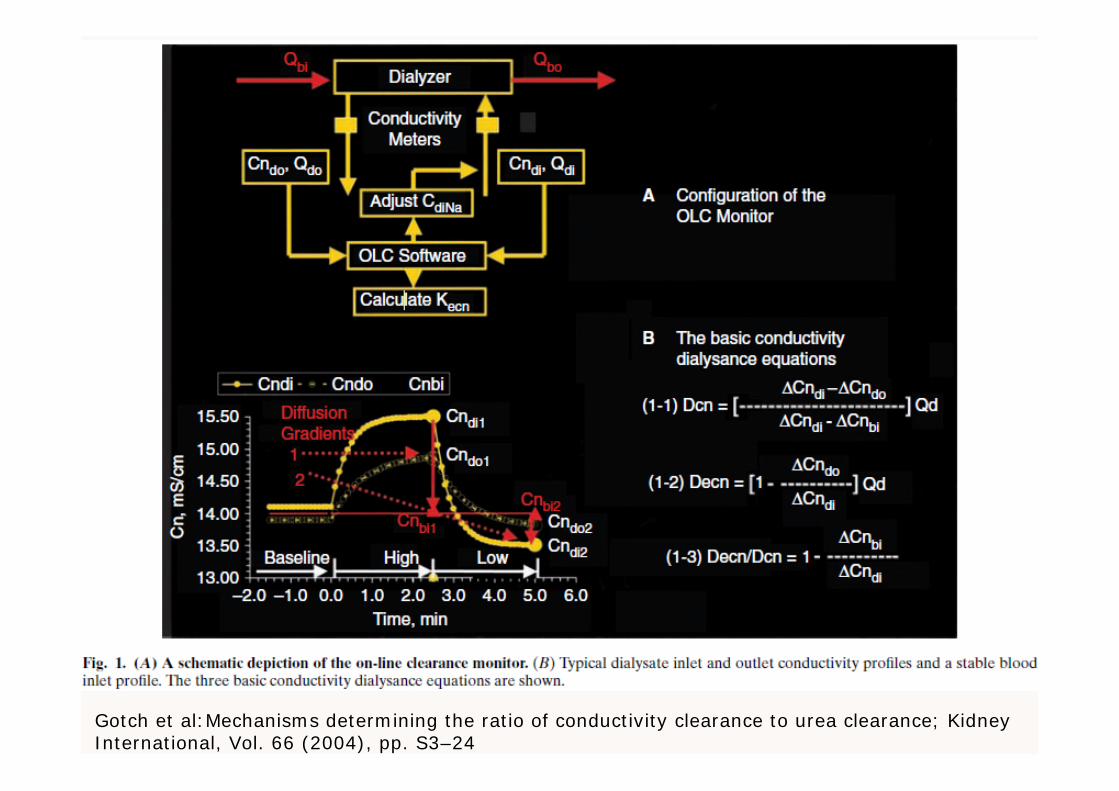
Gotch et al:Mechanisms determining the ratio of conductivity clearance to urea clearance; Kidney International, Vol. 66 (2004), pp. S3–24
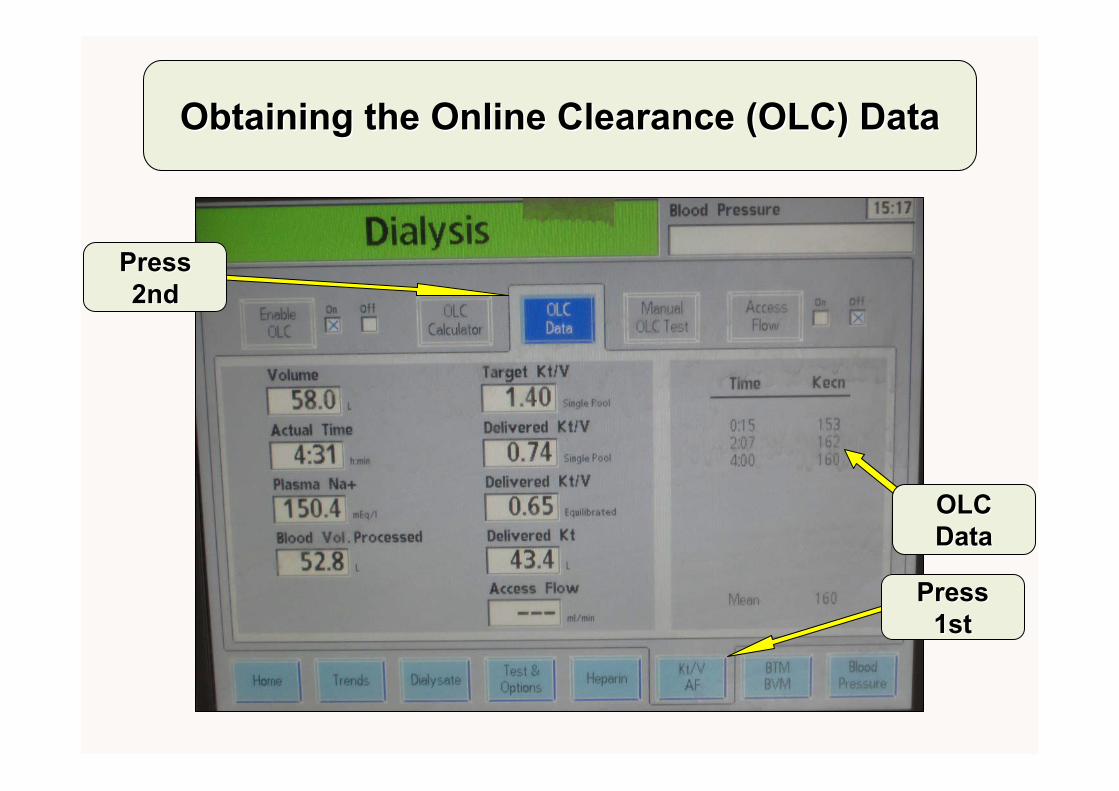
Obtaining the Online Clearance (OLC) Data Obtaining the Online Clearance (OLC) Data
Press Press 2nd2nd
Press Press 1st1st
OLC OLC DataData

G
Liver
Dialyzer
Kidneys
GKCV1 (3.5-14 L)
C1
V2 (10.5-40 L)
C2
KD
KR
Two-compartment variable volume solute kinetic model
G - C1(KD+KR) + KC(C2-C1)d(C1V1)
dt
- KC(C2-C1)d(C2V2)
dt
Adapted from Depner T and Garred L: Solute transport mechanisms in dialysis; in Replacement of Renal Function by Dialysis, 5th edition; p85
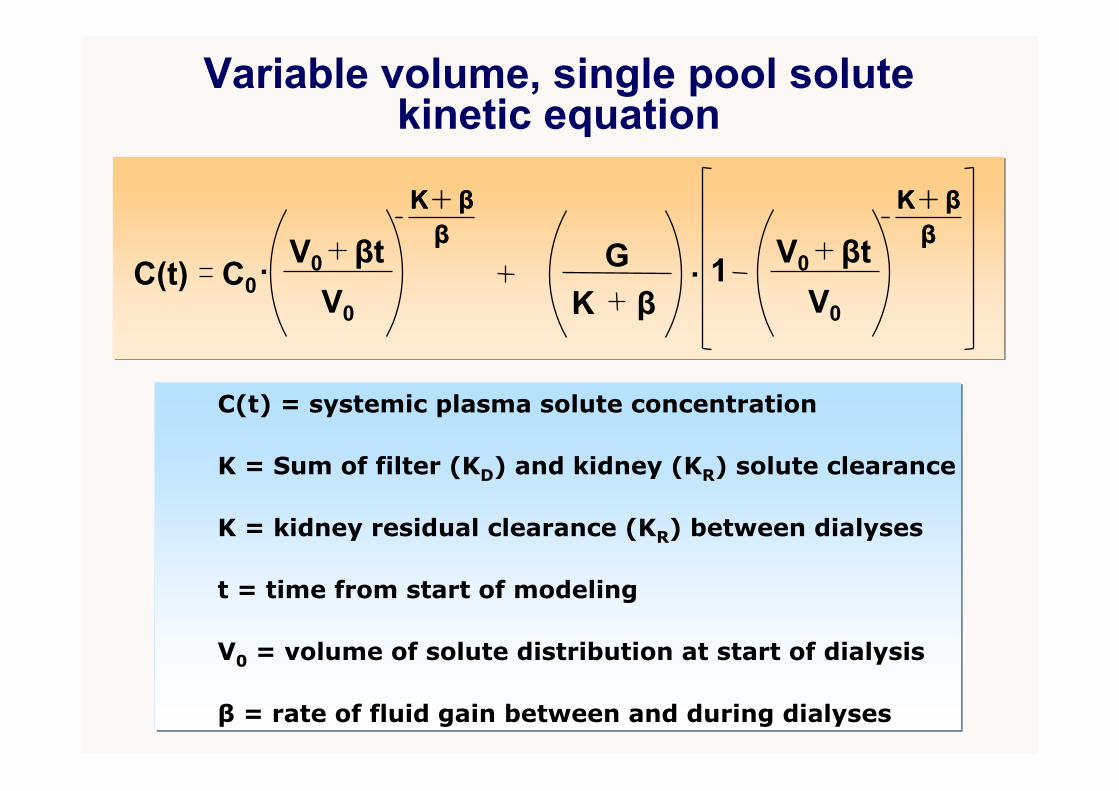
Variable volume, single pool solute kinetic equation
C(t) .C0 1
C(t) = systemic plasma solute concentration
β = rate of fluid gain between and during dialyses
V0 = volume of solute distribution at start of dialysis
K = kidney residual clearance (KR) between dialyses
K = Sum of filter (KD) and kidney (KR) solute clearance
t = time from start of modeling
V0
V0
βtK ββ
K ββ V0
V0
βtK ββ
K ββ
.GK β

Walther et al:Kidney International (2006) 69, 1056–1063.
Coplon Dialysis Simulator 1
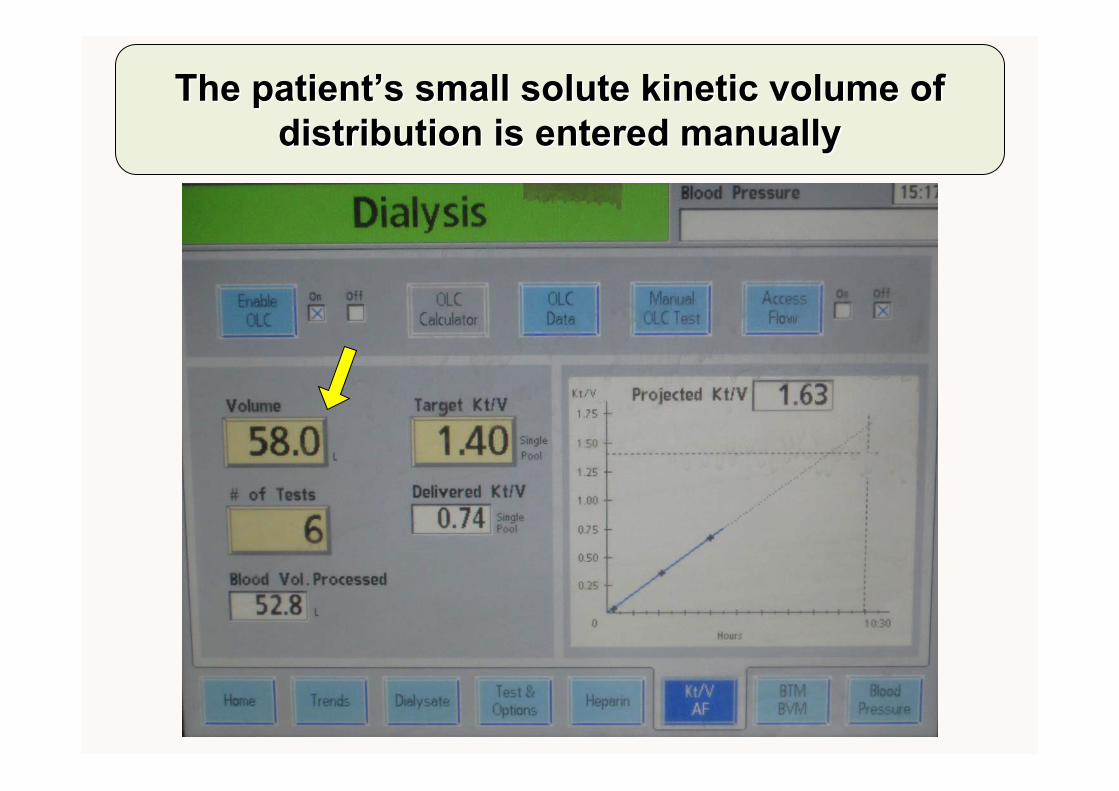
The patientThe patient’’s small solute kinetic volume of s small solute kinetic volume of distribution is entered manually distribution is entered manually
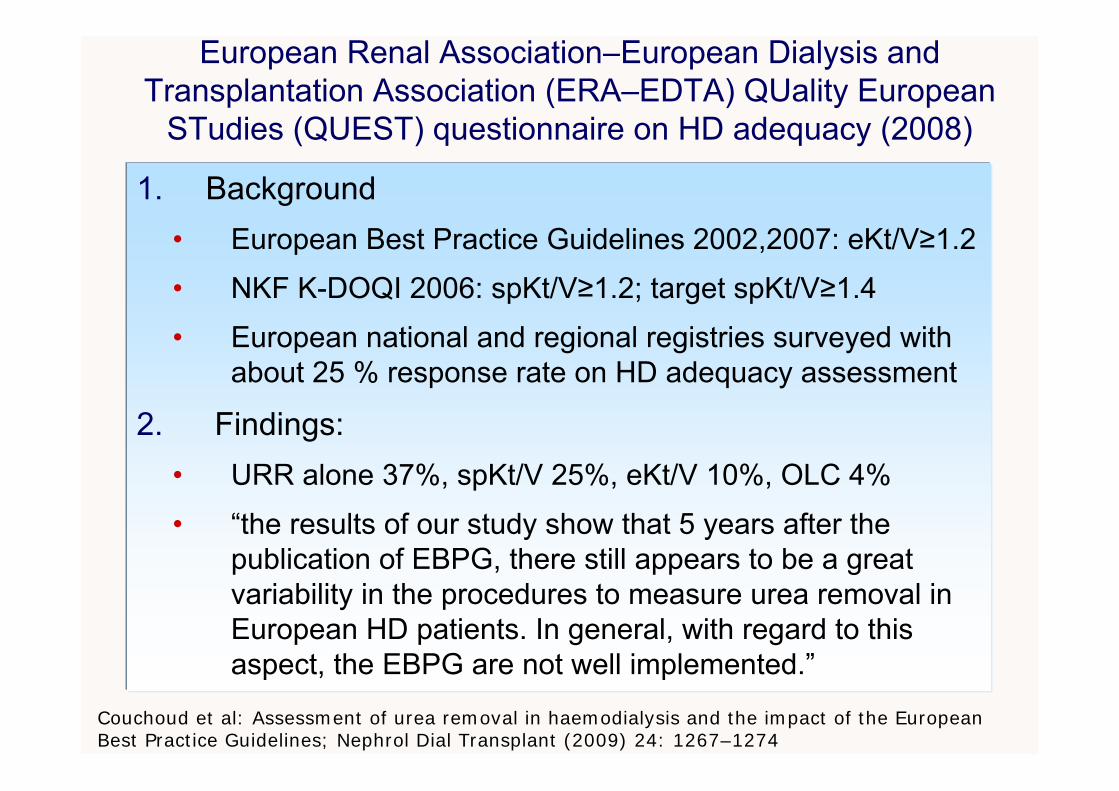
European Renal Association–European Dialysis andTransplantation Association (ERA–EDTA) QUality European
STudies (QUEST) questionnaire on HD adequacy (2008)
1. Background• European Best Practice Guidelines 2002,2007: eKt/V≥1.2
• NKF K-DOQI 2006: spKt/V≥1.2; target spKt/V≥1.4
• European national and regional registries surveyed with about 25 % response rate on HD adequacy assessment
2. Findings:• URR alone 37%, spKt/V 25%, eKt/V 10%, OLC 4%
• “the results of our study show that 5 years after the publication of EBPG, there still appears to be a great variability in the procedures to measure urea removal in European HD patients. In general, with regard to this aspect, the EBPG are not well implemented.”
Couchoud et al: Assessment of urea removal in haemodialysis and the impact of the European Best Practice Guidelines; Nephrol Dial Transplant (2009) 24: 1267–1274

The National Cooperative Dialysis Study (NCDS; 1981)
1. Significance• First large (n=160) clinical outcomes study of dialysis1
• Urea TAC 100 versus 50 mg/dL
• Treatment time = 2.5-3.5 h versus 4.5 – 5.5 h
• Good nutrition and lower urea TAC together better
• Showed pre-HD BUN cannot assess adequacy alone
• Fostered urea kinetic modeling after secondary analysis2
2. Limitations• Excluded diabetics, hypertensives and the elderly
• Low power to define optimal spKt/V, missed effect of time1. Lowrie et al: Effect of the hemodialysis prescription on patient morbidity: Report from the National Cooperative Dialysis Study. N Engl J Med 305:1176–1181, 19812. Gotch FA, Sargent JA: A mechanistic analysis of the National Cooperative Dialysis Study (NCDS). Kidney Int 28:526–534, 1985
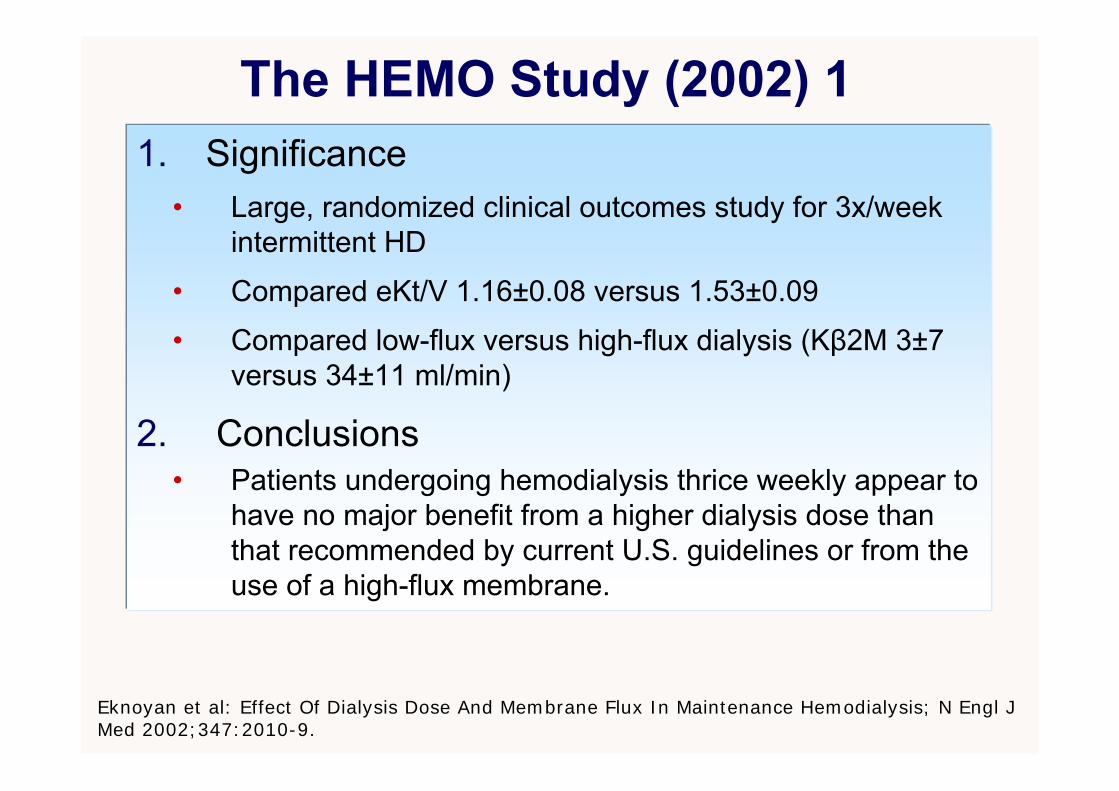
The HEMO Study (2002) 11. Significance
• Large, randomized clinical outcomes study for 3x/week intermittent HD
• Compared eKt/V 1.16±0.08 versus 1.53±0.09
• Compared low-flux versus high-flux dialysis (Kβ2M 3±7 versus 34±11 ml/min)
2. Conclusions• Patients undergoing hemodialysis thrice weekly appear to
have no major benefit from a higher dialysis dose than that recommended by current U.S. guidelines or from the use of a high-flux membrane.
Eknoyan et al: Effect Of Dialysis Dose And Membrane Flux In Maintenance Hemodialysis; N Engl J Med 2002;347:2010-9.
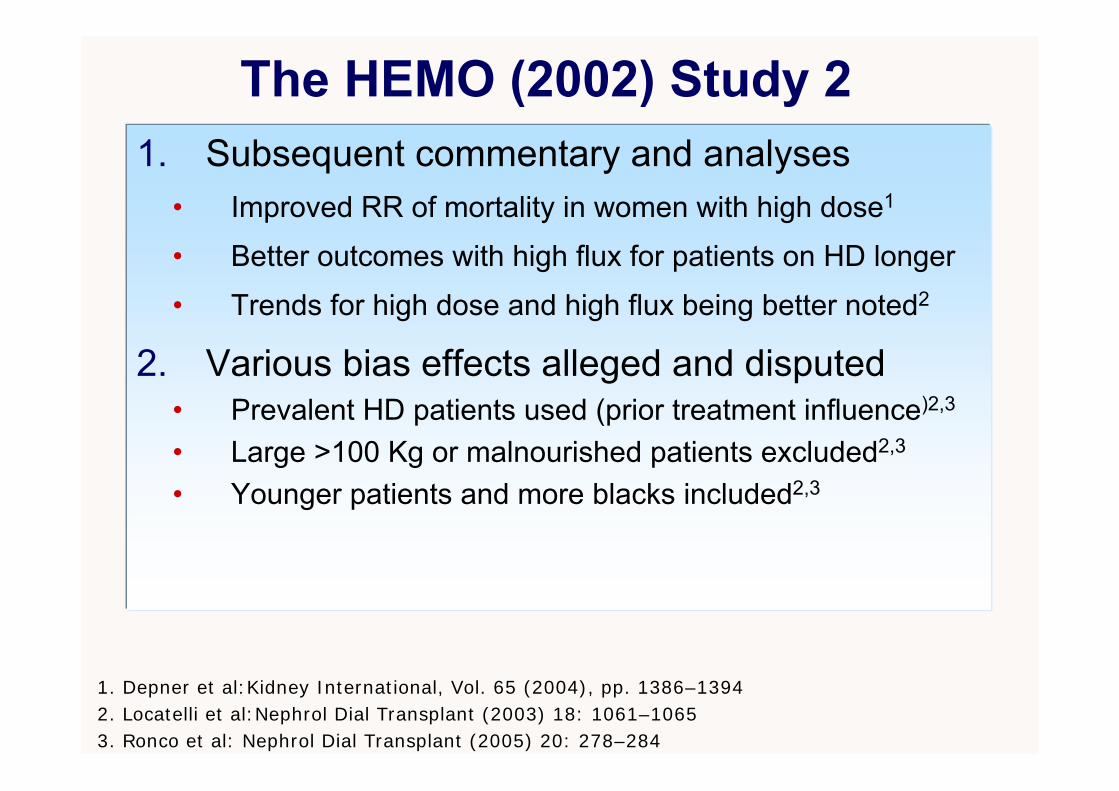
The HEMO (2002) Study 21. Subsequent commentary and analyses
• Improved RR of mortality in women with high dose1
• Better outcomes with high flux for patients on HD longer
• Trends for high dose and high flux being better noted2
2. Various bias effects alleged and disputed • Prevalent HD patients used (prior treatment influence)2,3
• Large >100 Kg or malnourished patients excluded2,3
• Younger patients and more blacks included2,3
1. Depner et al:Kidney International, Vol. 65 (2004), pp. 1386–13942. Locatelli et al:Nephrol Dial Transplant (2003) 18: 1061–10653. Ronco et al: Nephrol Dial Transplant (2005) 20: 278–284
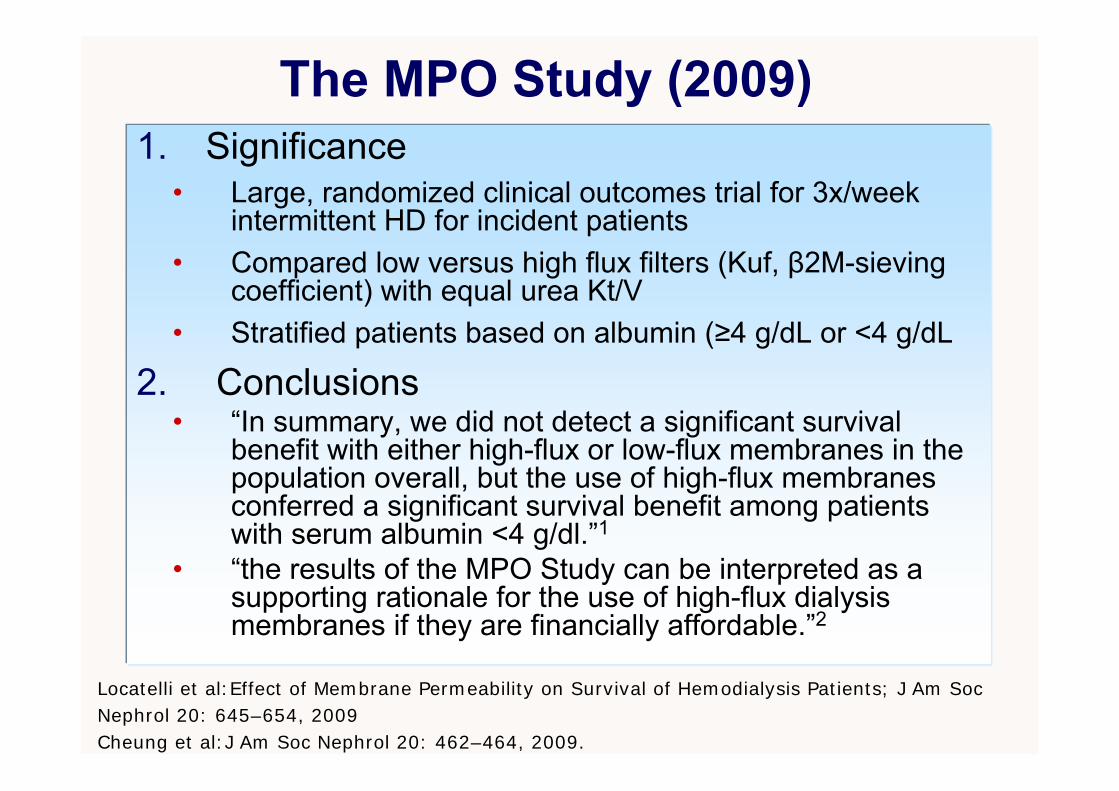
The MPO Study (2009)1. Significance
• Large, randomized clinical outcomes trial for 3x/week intermittent HD for incident patients
• Compared low versus high flux filters (Kuf, β2M-sieving coefficient) with equal urea Kt/V
• Stratified patients based on albumin (≥4 g/dL or <4 g/dL
2. Conclusions• “In summary, we did not detect a significant survival
benefit with either high-flux or low-flux membranes in the population overall, but the use of high-flux membranes conferred a significant survival benefit among patients with serum albumin <4 g/dl.”1
• “the results of the MPO Study can be interpreted as a supporting rationale for the use of high-flux dialysis membranes if they are financially affordable.”2
Locatelli et al:Effect of Membrane Permeability on Survival of Hemodialysis Patients; J Am SocNephrol 20: 645–654, 2009Cheung et al:J Am Soc Nephrol 20: 462–464, 2009.