hemp market value chain profile 2013 see more - …nda.agric.za/doadev/sidemenu/marketing/annual...
TRANSCRIPT

A PROFILE OF THE SOUTH AFRICAN HEMP MARKET VALUE CHAIN
2013
Directorate Marketing Private Bag X 15
Arcadia 0007
Tel: 012 319 8455 Fax: 012 319 8131
E-mail: [email protected] www.daff.gov.za
2
Table of Contents
1. DESCRIPTION OF THE INDUSTRY 3
1.2 Global Hemp Production 3
2. MARKET STRUCTURE 4
2.1. Domestic Market and Prices 4
2.2. Import-Export Analysis 4
3. HEMP EXPORTS 5
4. HEMP IMPORTS 13
5. MARKET INTELLIGENCE 18
6. HEMP MARKET VALUE CHAIN 27
6.1 Hemp Value Chain Tree explaining its various uses 28
7. MARKET ACCESS 31
8. CHALLENGES 33
9. ACKNOWLEDGEMENTS 34

3
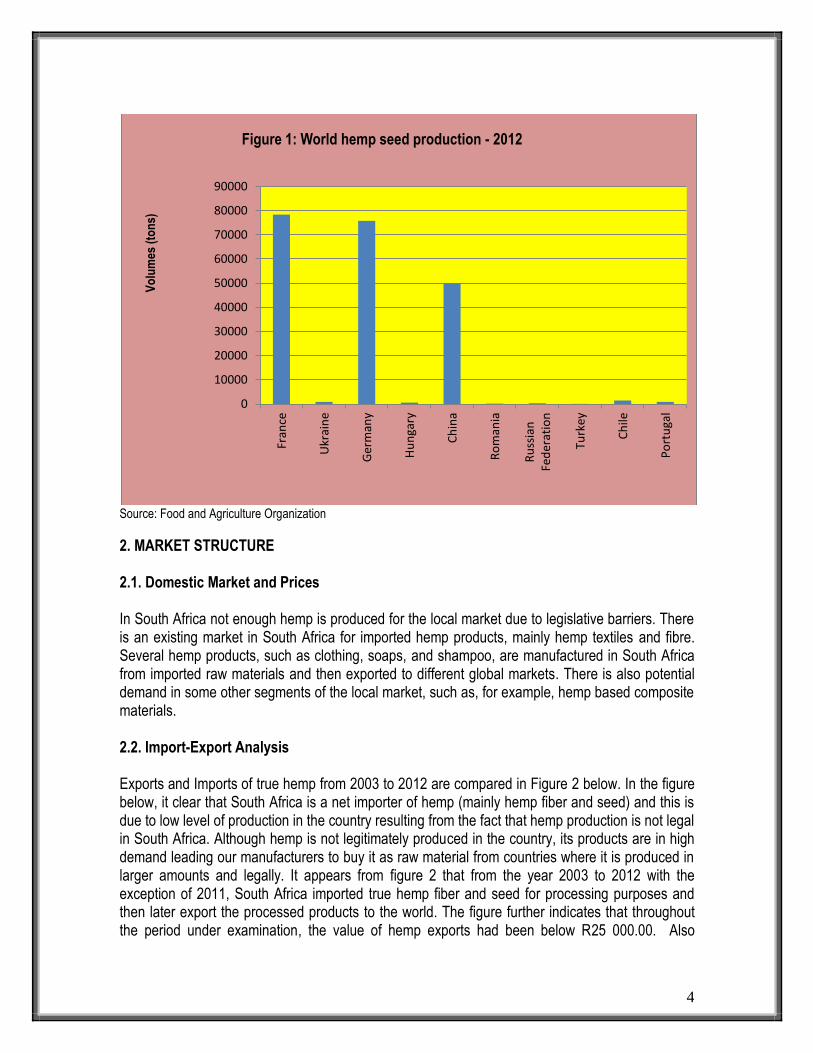
RECENT DEVELOPMENTS The European Union and many South African Companies are planning a R25 million five year project to boost hemp cultivation in South Africa. Projects are being discussed in the Eastern Cape for sustainable hemp production that will produce jobs and income in an already impoverished and poverty-stricken area. Demand for hemp products worldwide has increased by 233% over the past two years and yearly South African Hemp imports have grown from R500 000 to R1-million rands in the last year. 1. DESCRIPTION OF THE INDUSTRY Hemp is one of the most important fiber crops both for South Africa and the rest of the world. It has been cultivated longer than any other fiber crop. There seems to be never-ending list of benefits of the hemp plant with products ranging from clothing and textile to cosmetics and insulating boards. However it is the perceived relationship with Marijuana that gave the plant a bad name. Both come from the plant family Cannabis sativa L., but from different varieties. Hemp has been grown in South Africa for medical purposes for centuries. It has been illegal in South Africa since 1903 when dagga prohibition was passed. The South African government and the private sector are presently engaged in a process of trying to sort out the hemp legislation to create an environment in which this product can be commercialized. The product is currently grown in South Africa mainly for the experimental or research purposes. Hemp fabrics; hemp clothes; hemp oils; also bags, hats, jewellery, cosmetics, hemp animal feed, aeroplane parts, gasoline, charcoal, drinks, sweets and paints are but a few products that can be made out of the Hemp plant. 1.1 Production Areas Hemp is widely distributed in Southern Africa. The first trials were planted in the North West Province in ARC experimental farm near Rustenburg. The other trials were planted by ARC-Institute for Industrial Crops in the Eastern Cape and Western Cape, Limpopo, Gauteng, Mpumalanga, KwaZulu-Natal and Northern Cape. The largest producers of hemp in the world are countries in Eastern Europe (Romania and Poland) and China. At least 26 countries permit commercial cultivation of hemp, UK and Germany being the biggest producers of hemp in Western Europe. 1.2 Global Hemp Production Figure 1 illustrates world hemp seed production during 2012 production season. The figure further illustrates that France was the largest producer of hemp seed in the world, followed by Germany and China over the period under examination. During the same period under review, France produced approximately 78 361 tons of hemp seed while Germany and China produced around 75 800 and 50 000 tons of hemp seed respectively during the same period. The figure also illustrates that Ukraine, Hungary, Russian Federation and Chile had very low levels of hemp seed production during the same period under scrutiny. The figure further illustrates that none of the African countries are producing hemp seed hemp in 2012 due to the legislative issues surrounding the production of hemp especially in South Africa.
4
Source: Food and Agriculture Organization
2. MARKET STRUCTURE
2.1. Domestic Market and Prices In South Africa not enough hemp is produced for the local market due to legislative barriers. There is an existing market in South Africa for imported hemp products, mainly hemp textiles and fibre. Several hemp products, such as clothing, soaps, and shampoo, are manufactured in South Africa from imported raw materials and then exported to different global markets. There is also potential demand in some other segments of the local market, such as, for example, hemp based composite materials. 2.2. Import-Export Analysis Exports and Imports of true hemp from 2003 to 2012 are compared in Figure 2 below. In the figure below, it clear that South Africa is a net importer of hemp (mainly hemp fiber and seed) and this is due to low level of production in the country resulting from the fact that hemp production is not legal in South Africa. Although hemp is not legitimately produced in the country, its products are in high demand leading our manufacturers to buy it as raw material from countries where it is produced in larger amounts and legally. It appears from figure 2 that from the year 2003 to 2012 with the exception of 2011, South Africa imported true hemp fiber and seed for processing purposes and then later export the processed products to the world. The figure further indicates that throughout the period under examination, the value of hemp exports had been below R25 000.00. Also
0
10000
20000
30000
40000
50000
60000
70000
80000
90000
Fran
ce
Ukr
ain
e
Ger
man
y
Hu
nga
ry
Ch
ina
Ro
man
ia
Ru
ssia
n
Fed
erat
ion
Turk
ey
Ch
ile
Po
rtu
gal
Vo
lum
es (
ton
s)
Figure 1: World hemp seed production - 2012

5
interesting to note was that in 2004, 2005, 2010 and 2012 years, hemp import values proved to be far beyond export values. The figure also indicates that in 2007, hemp imports volumes from the world into South Africa experienced very low volumes, while exports of hemp from South Africa to the world slight increased to approximately R496.00. The figure further indicates that in 2009, import value of true hemp started to increase from 3413 in 2004 to R8 753 in 2009. The decline in import value of true hemp was experienced in 2010 and 2011 at lower levels of approximately R7 756, until an increase and a peak was attained in 2012 at about R260 986.00. The increase in exports of true hemp products from South Africa to the world in 2012 represents 2458%, as compared to 2003 marketing season; the increase in imports of true hemp products from the world into South Africa in 2012 represents 25436%, as compared to 2003 marketing season.
Source: Quantec Easy Data
3. HEMP EXPORTS Figure 3 depicts volumes of true hemp exports from South Africa to various regions of the world between 2003 and 2012 marketing season.
2003 2004 2005 2006 2007 2008 2009 2010 2011 2012
Export Value (Rands) 909 1007 42 1178 496 9059 1721 468 3387 23261
Import Value (Rands) 1022 3413 842 492 7 3069 8753 7756 0 260986
0
50000
100000
150000
200000
250000
300000
Val
ue
(Ran
ds)
Period (Years)
Figure 2: True hemp export-import analysis between 2003 and 2012

6
Source: Quantec Easy Data
During the same period under review, South Africa has been exporting its hemp products mainly to the African continent with no competition from the other regions. A peak in volumes of exports of true hemp products occurred in 2003 at approximately 0.29 tons. Exports volumes of hemp started to increase in 2003 until a decline between 2004 and 2007 period. A surge of export volumes took place in 2008 and then a dramatic decline occurred in 2009 with a further decline in 2010 of about 0.01 tons. The graph further depicts that South Africa managed to export low volumes of hemp to Africa between 2004 and 2007 of not more than 0.05 tons. Between 2004 and 2007 of the period under scrutiny, the country exported very low volumes of true hemp to Africa. The graph further depicts that export volumes of hemp products from South Africa to the world experienced an increase in 2011 and 2012 at approximately 0.16 and 0.17 tons as compared to 0.29 tons in 2003. The decline in true hemp exports from South Africa to Africa in 2012 represents 41.4%, as compared to 2003 marketing season. Figure 4 shows volumes of true hemp products exports from South Africa to Africa between 2003 and 2012 marketing season.
2003 2004 2005 2006 2007 2008 2009 2010 2011 2012
Africa 0.29 0.02 0.01 0.05 0.03 0.25 0.05 0.01 0.16 0.17
0.00
0.05
0.10
0.15
0.20
0.25
0.30
0.35
Exp
ort
vo
lum
es (
ton
s)
Period (Years)
Figure 3: Export volumes of true hemp to various regions

7
Source: Quantec Easy Data
The figure further shows that South African produced hemp products were exported mainly to the SADC region over the past decade. This can be ascribed to the fact that there’s preferential tariff agreement between SADC and South Africa, making it cheaper to export to SADC than to other regions. Exports volumes of hemp products from South Africa to SADC started to increase in 2003 and during the same period attained a peak at approximately 0.24 tons and again in 2008 at approximately 0.18 tons. The figure also shows that between 2004 and 2007 of the period under scrutiny, South Africa exported very low levels of hemp products to the SADC region. The figure further shows that in 2011 and 2012, exports volumes of hemp products from South Africa to SADC experienced a dramatic increase of about 0.15 and 0.17 tons as compared to 2010. The decline in true hemp exports from South Africa to SADC in 2012 represents 29.2%, as compared to 2003 marketing season. Figure 5 illustrates volumes of true hemp products exports from South Africa to the SADC region between 2003 and 2012 marketing season.
2003 2004 2005 2006 2007 2008 2009 2010 2011 2012
SADC 0.24 0.02 0.01 0.05 0.03 0.18 0.04 0.00 0.15 0.17
0.00
0.05
0.10
0.15
0.20
0.25
0.30 E
xpo
rts
volu
mes
(to
ns)
Period (Years)
Figure 4: Exports volumes of true hemp to Africa
8
Source: Quantec Easy Data
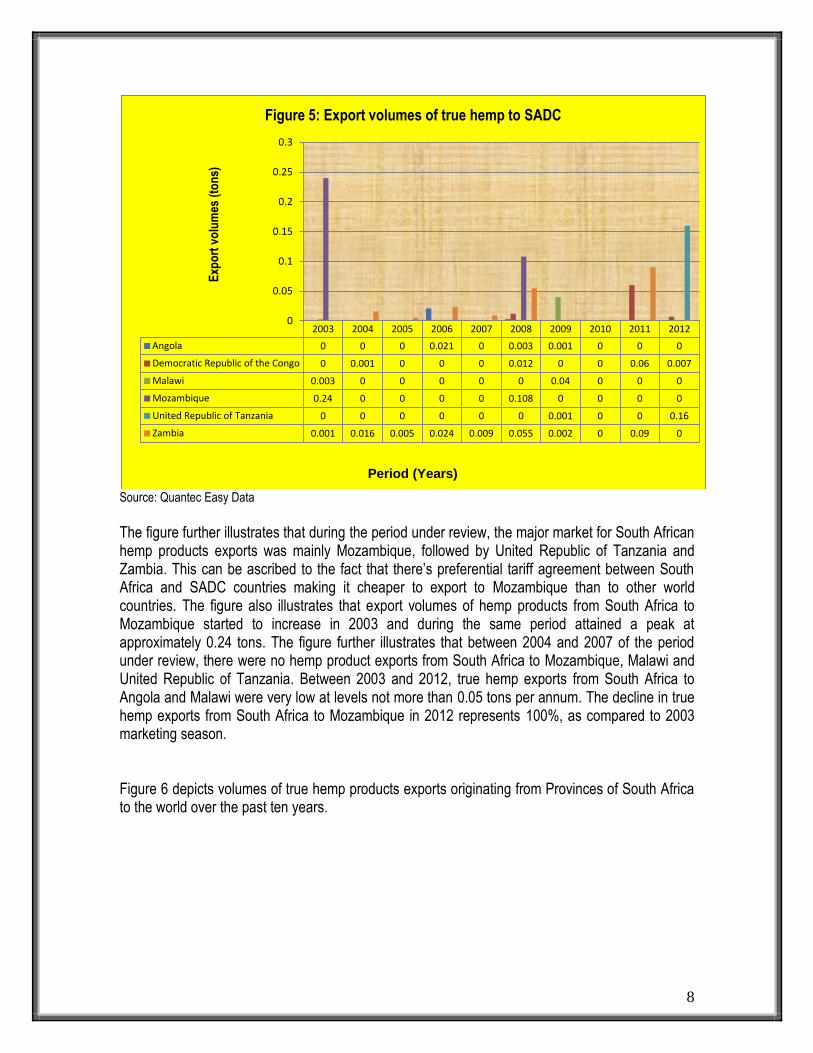
The figure further illustrates that during the period under review, the major market for South African hemp products exports was mainly Mozambique, followed by United Republic of Tanzania and Zambia. This can be ascribed to the fact that there’s preferential tariff agreement between South Africa and SADC countries making it cheaper to export to Mozambique than to other world countries. The figure also illustrates that export volumes of hemp products from South Africa to Mozambique started to increase in 2003 and during the same period attained a peak at approximately 0.24 tons. The figure further illustrates that between 2004 and 2007 of the period under review, there were no hemp product exports from South Africa to Mozambique, Malawi and United Republic of Tanzania. Between 2003 and 2012, true hemp exports from South Africa to Angola and Malawi were very low at levels not more than 0.05 tons per annum. The decline in true hemp exports from South Africa to Mozambique in 2012 represents 100%, as compared to 2003 marketing season. Figure 6 depicts volumes of true hemp products exports originating from Provinces of South Africa to the world over the past ten years.
2003 2004 2005 2006 2007 2008 2009 2010 2011 2012
Angola 0 0 0 0.021 0 0.003 0.001 0 0 0
Democratic Republic of the Congo 0 0.001 0 0 0 0.012 0 0 0.06 0.007
Malawi 0.003 0 0 0 0 0 0.04 0 0 0
Mozambique 0.24 0 0 0 0 0.108 0 0 0 0
United Republic of Tanzania 0 0 0 0 0 0 0.001 0 0 0.16
Zambia 0.001 0.016 0.005 0.024 0.009 0.055 0.002 0 0.09 0
0
0.05
0.1
0.15
0.2
0.25
0.3
Exp
ort
vo
lum
es (
ton
s)
Period (Years)
Figure 5: Export volumes of true hemp to SADC

9
Source: Quantec Easy Data
The figure further shows that during the period under review, the major supplier of true hemp exports from South Africa to the world was Gauteng Province, followed by very low or intermittent supply from KwaZulu-Natal Province. Exports of true hemp from South Africa to the world started to increase in 2004 to 2005, and then a decline occurred between 2006 and 2007. The figure also shows that exports of true hemp from Gauteng province to the world attained a peak in 2008 and 2012 at approximately R65 319.00 and R76 282.00 respectively. The figure also depicts that in 2009 and 2011, there was a slight decline in exports of true hemp products from Gauteng province to approximately R48 433.00 and R46 808.00 respectively. The increase in the value of true hemp exports from Gauteng to the world in 2012 represents 1123%, as compared to 2003 marketing season. Figure 7 depicts value of true hemp products exports by Gauteng Province to the world between 2003 and 2012 marketing season.
2003 2004 2005 2006 2007 2008 2009 2010 2011 2012
Eastern Cape 0 0 0 0 0 0 0 0 594 0
Kwazulu-Natal 0 991 790 0 1072 564 0 246 8806 0
Gauteng 6236 16336 29834 11290 3112 65319 48433 63605 46808 76282
Mpumalanga 0 0 0 0 0 0 0 0 620 0
0
10000
20000
30000
40000
50000
60000
70000
80000
90000 E
xpo
rt V
alu
e (R
and
s)
Period (Years)
Figure 6: Value of tru hemp exports by Provinces

10
Source: Quantec Easy Data
The graph further depicts that during the same period under review, the major supplier of true hemp products from Gauteng province to the world was City of Johannesburg Metropolitan Municipality, followed by decent volumes of true hemp from Ekurhuleni Metro. The graph also depicts that exports of true hemp from the City of Johannesburg Metropolitan Municipality to the world attained a peak in 2008 at an export value of about R58 813. Between 2003 and 2009, there were no exports of true hemp products from the City of Johannesburg Metropolitan Municipality to the world due to short supply in the province. The increase in the value of true hemp exports from the City of Johannesburg Metro to the world in 2012 represents 844%, as compared to 2003 marketing season. Figure 8 indicates value of true hemp products exports by KwaZulu-Natal Province to the world between 2003 and 2012 marketing season.
2003 2004 2005 2006 2007 2008 2009 2010 2011 2012
West Rand District Municipality 182 137 0 0 0 564 139 0 33 16
Ekurhuleni Metropolitan Municipality
529 15899 1418 3118 484 5942 1688 25673 4325 24103
City of Johannesburg Metropolitan Municipality
5525 300 28416 8172 2628 58813 46265 37865 41887 52163
City of Tshwane Metropolitan Municipality
0 0 0 0 0 0 341 67 563 0
0
10000
20000
30000
40000
50000
60000
70000
Exp
ort
Val
ue
(Ran
ds)
Period (Years)
Figure 7: Value of true hemp exports by Gauteng Province

11
Source: Quantec Easy Data
The figure further indicates that during the period under review, the major supplier of true hemp products from KwaZulu-Natal province to the world was eThekwini Metropolitan Municipality with no competition from the other municipalities. The graph also indicates that exports of true hemp from the eThekwini Metropolitan Municipality to the world attained a peak in 2011 at an export value of about R8 806. The figure further indicates that in 2003, 2006, 2009 and 2012, there were no exports of true hemp products from the eThekwini Metropolitan Municipality to the world due to short supply in the province. The figure also indicates that between 2003 and 2010, value of true hemp exports were below R2000.00 per annum. The decrease in the value of true hemp exports from eThekwini Metro to the world in 2012 represents 100%, as compared to 2004 marketing season. 3.1 Share Analysis As shown in Table 1 below, Gauteng and KwaZulu-Natal were the main exporting provinces of true hemp products in South Africa between 2003 and 2012 marketing season. The table further shows that the Gauteng Province commanded the greatest share of hemp products exports over KwaZulu-Natal Province during the past ten years.
2003 2004 2005 2006 2007 2008 2009 2010 2011 2012
eThekwini Metropolitan Municipality
0 991 790 0 1072 564 0 246 8806 0
0
1000
2000
3000
4000
5000
6000
7000
8000
9000
10000
Exp
ort
Valu
e (
ton
s)
Period (Years)
Figure 8: Value of true hemp exports by KwaZulu-Natal Province

12
Table 1: Share of provincial exports to the total RSA hemp exports (%)
Years Province
2003
2004
2005
2006
2007
2008
2009
2010
2011
2012
KwaZulu- Natal
0 5.72 2.58 0 25.62 0.86 0 0.39 15.83 0
Gauteng 100 94.28 97.42 100 74.38
99.14 100 99.61 82.37 100
Source: Calculated from Quantec Data
Table 2 indicates that during the period under review the City of Johannesburg Metropolitan Municipality commanded the greatest share of exports of processed hemp products from Gauteng province with the exception of 2004 year, while the Ekurhuleni Metropolitan Municipality commanded the greatest share in the year 2004. The West Rand District Municipality’s share of processed hemp products was very low with no exports recorded between 2005 and 2007 and again in 2010. Table 2: Share of district hemp exports to the total Gauteng provincial hemp exports (%)
Years District
2003
2004
2005
2006
2007
2008
2009
2010
2011
2012
West Rand
2.92 0.84 0 0 0 0.86 0.29 0 0.07 0.02
Ekurhuleni Metro
8.48 97.32 4.75 27.62 15.55 9.10 3.49 40.36 9.35 31.60
City of Johannesburg
88.60 1.84 95.25 72.38 84.45 90.04 96.20 59.59 89.49 63.38
City of Tshwane
0
0
0
0
0
0
0.70
0.11
1.20
0
Source: Calculated from Quantec Data
Table 3 below indicates that during the period under review, eThekwini Metropolitan Municipality commanded the greatest share of exports of processed hemp products from KwaZulu-Natal province over the past decade.

13
Table 2: Share of district hemp exports to the total KwaZulu-Natal provincial hemp exports (%)
Years District
2003
2004
2005
2006
2007
2008
2009
2010
2011
2012
eThekwini Metro Municipality
0 100 100 0 0 100 0 100 100 0
Source: Calculated from Quantec Data
4. HEMP IMPORTS This section analyses the value of true hemp imports from various regions around the globe into South Africa from 2003 to 2012 marketing season. Figure 9 shows volumes of true hemp products imports originating from various regions into South Africa over the past decade.
Source: Quantec Easy Data
Figure 9 further shows that export markets for true hemp products originated mainly from Asia during the period under review. This is mainly because true hemp production in these regions has been legalized and is produced on a larger scale than in other regions. South Africa normally imports hemp raw materials from these countries for the manufacturing of the products such as clothing, soaps and shampoo (and other health care products). The figure also shows that in 2012, volumes of true hemp imports from Asia into South Africa started to increase and during the same period attained a peak at approximately 1.012 tons. The figure also shows that between 2009 and 2011, there were no true hemp imports from the Asia into South Africa. The increase in true hemp
2003 2004 2005 2006 2007 2008 2009 2010 2011 2012
Asia 0.036 0.101 0.024 0.02 0.001 0.06 0 0 0 1.012
Europe 0 0.002 0 0 0 0 0.049 0.059 0 0.027
0
0.2
0.4
0.6
0.8
1
1.2
Imp
ort
vo
lum
es (
ton
s)
Period (Years)
Figure 9: Import volumes of true hemp from the world into South Africa

14
imports from Asia into South Africa in 2012 represents 2711%, as compared to 2003 marketing season. Figure 10 illustrates volumes of true hemp products imports from Asia into South Africa over a ten year period.
Source: Quantec Easy Data
The figure further illustrates that during the period under scrutiny, imports of processed hemp products from Asia were mainly from South-eastern Asia. Hemp is thought to have been growing in South-central Asia for more than 4500 years and records illustrates that the growing of this plant has never stopped in this continent since then, giving Asia a comparative advantage in the market. Imports of true hemp processed products from South-eastern Asia into South Africa started to increase in 2012 and at the same time attained a peak at approximately 1.012 tons. The graph further illustrates that between 2007 and 2011, there were no imports of true hemp processed products from South-eastern Asia into South Africa. The increase in true hemp import volumes from South-eastern Asia into South Africa in 2012 represents 2711%, as compared to 2003 marketing season. Figure 11 indicates import volumes of true hemp processed products from South-eastern Asia into South Africa over the past decade.
2003 2004 2005 2006 2007 2008 2009 2010 2011 2012
Eastern Asia 0 0.09 0 0 0 0 0 0 0 0
South-central Asia 0 0 0 0 0.001 0.06 0 0 0 0
South-eastern Asia 0.036 0.011 0.024 0.02 0 0 0 0 0 1.012
0
0.2
0.4
0.6
0.8
1
1.2
Imp
ort
vo
lum
es (
ton
s)
Period (Years)
Figure 10: Import volumes of true hemp from Asia into South Africa

15
Source: Quantec Easy Data
The figure further illustrates that during the period under scrutiny, imports of true hemp processed products from South-eastern Asia into South Africa were mainly from Thailand. Imports of true hemp processed products from Philippines into South Africa started to increase in 2012 and at the same time attained a peak at approximately 1.012 tons. Between 2003 and 2006 of the period under scrutiny, imports of true hemp processed products from Thailand into South Africa saw a dramatic decline of below 0.04 tons. The figure further indicates that between 2003 and 2011 of the period under review, there were no imports of true hemp processed products from Philippines into South Africa. The increase in true hemp import volumes from South-eastern Asia into South Africa in 2012 represents 2711%, as compared to 2003 marketing season. Figure 12 indicates imports volumes of true hemp processed products from Europe into South Africa between 2003 and 2012 marketing season.
2003 2004 2005 2006 2007 2008 2009 2010 2011 2012
Philippines 0 0 0 0 0 0 0 0 0 1.012
Thailand 0.036 0.011 0.024 0.02 0 0 0 0 0 0
0
0.2
0.4
0.6
0.8
1
1.2
Imp
ort
vo
lum
es (
ton
s)
Period (Years)
Figure 11: Import volumes of true hemp from South-eastern Asia into South Africa

16
Source: Quantec Easy Data
The figure further indicates that during the period under scrutiny, the major import market for hemp processed products from Europe was mainly from European Union. South Africa imported true hemp products from the European Union into South Africa at approximately 0.14 tons during the past ten years. The figure also indicates that between 2003 and 2008 and again in 2011, there were no imports of true hemp processed products from the European Union into South Africa. The figure further indicates that imports of true hemp products from European Union into South Africa started to increase in 2009, until a peak was attained in 2010 at approximately 0.06 tons. During 2011 of the period under review, the figure also indicates that there were no imports of true hemp products from European Union into South Africa. The increase in true hemp import volumes from European Union into South Africa in 2012 represents 100%, as compared to 2003 marketing season. Figure 13 below indicates import volumes of true hemp processed products from European Union into South Africa between 2003 and 2012 marketing season.
2003 2004 2005 2006 2007 2008 2009 2010 2011 2012
European Union 0.00 0.00 0.00 0.00 0.00 0.00 0.05 0.06 0.00 0.03
0.00
0.01
0.02
0.03
0.04
0.05
0.06
0.07 Im
po
rt v
olu
mes
(to
ns)
Period (Years)
Figure 12: Import volumes of true hemp from Europe into South Africa

17
Source: Quantec Easy Data
The figure further indicates that during the period under scrutiny, the major import market for hemp processed products from European Union was mainly Hungary; followed by Germany and United Kingdom. South Africa imported true hemp materials from Hungary only in 2010 at approximately 0.06 tons during the year period under examination. The figure also indicates that between 2003 and 2009 and again between 2011 and 2012, there were no imports of true hemp processed products from Hungary into South Africa. The figure further indicates that imports of true hemp products from Hungary into South Africa started to increase in 2010 and at the same time attained a peak in 2010 at approximately 0.06 tons. During the same period under review, the figure also indicates that there were no imports of true hemp products from United Kingdom into South Africa between 2003 and 2011. Germany only managed to export true hemp products into South Africa in 2009 at approximately 0.05 tons. The increase in true hemp import volumes from Hungary into South Africa in 2012 represents 100%, as compared to 2003 marketing season.
2003 2004 2005 2006 2007 2008 2009 2010 2011 2012
Germany 0.00 0.00 0.00 0.00 0.00 0.00 0.05 0.00 0.00 0.00
United Kingdom 0.00 0.00 0.00 0.00 0.00 0.00 0.00 0.00 0.00 0.03
Hungary 0.00 0.00 0.00 0.00 0.00 0.00 0.00 0.06 0.00 0.00
0.00
0.01
0.02
0.03
0.04
0.05
0.06
0.07 Im
po
rt v
olu
mes (
ton
s)
Period (Years)
Figure 13: Import volumes of true hemp from European Union into South Africa

18
5. MARKET INTELLIGENCE Table 4: List of importing markets for true hemp exported by South Africa to the world in 2012
Importers
Trade Indicators
Tariff (estimated)
faced by South Africa
(%)
Exported value 2012
(USD thousand)
Share in South
Africa's exports
(%)
Exported quantity
2012 (tons)
Unit value (USD/unit)
Exported growth in
value between
2008-2012 (%, p.a.)
Exported growth in quantity
between 2008-2012 (%, p.a.)
Exported growth in
value between 2011-2012 (%,
p.a.)
World 9 100 2 4500 5 12 13
Mozambique 3 33.3 1 3000 -8 0 -40 0
United Republic of Tanzania 3 33.3 0 0 0
Zambia 2 22.2 1 2000 23 0 0
Zimbabwe 1 11.1 0 0 0 Source: Trade Map
Table 4 shows the list of importing markets for true hemp exported by South Africa to the world in 2012. The table further shows that the top importers for true hemp from South Africa to the world were Mozambique and Zambia during 2012 marketing season. The table also shows that South Africa is a net importer of true hemp as South Africa only managed to export only 2 tons of true hemp, while the imports were approximately 3 tons over the same period. The table further shows that Mozambique and United Republic of Tanzania had a highest share in South Africa’s exports of true hemp of about 33.3% respectively during this period. The table also shows that Zambia had 22.2% share over South Africa’s exports of true hemp products during 2012 season.

19
Figure 14: Growth in demand for true hemp exported by South Africa in 2012
Source: Trade Map

20
Figure 14 indicates growth in demand for true hemp exports from South Africa to the world in 2012. The bubble graph further depicts that South Africa’s annual growth of South Africa’s exports to Mozambique in 2012 has declined by 8% between 2008 and 2012 period. The graph also depicts that during the period under examination, the annual growth of world imports to Mozambique in 2012 has increased by approximately 16.5% between 2008 and 2012 period.

21
Figure 15: Prospects for market diversification for true hemp exported by South Africa in 2012
Source: Trade Map

22
Figure 15 depicts prospects for market diversification for true hemp exports from South Africa to the world in 2012. The bubble graph further depicts that the Mozambique and United Republic of Tanzania’s share of partner countries in South Africa’s exports in 2012 has increased to approximately 33.3% respectively. The graph also depicts that during the period under examination, Zambia was a small but attractive market for South African true hemp product exports. The graph further depicts that annual growth of Mozambique imports grew by 18% and United Republic of Tanzania imports did not grow at 0.00% between 2008 and 2012 period.

23
Table 5: List of supplying markets for true hemp imported by South Africa in 2012
Exporters
Trade Indicators
Tariff (estimated) applied by
South Africa (%)
Imported
value 2012 (USD
thousand)
Share in
South Africa's
imports (%)
Imported quantity
2012 (tons)
Unit value (USD/unit)
Imported growth in
value between
2008-2012 (%, p.a.)
Imported growth in quantity between
2008-2012 (%, p.a.)
Imported growth in
value between
2011-2012 (%, p.a.)
World 33 100 3 11000 9 32 725
Philippines 31 93.9 1 31000 0
China 1 3 2 500 0 0
United Kingdom 1 3 0 0 0
Source: Trade Map
Table 5 presents the list of supplying markets for true hemp products imported by South Africa from the world in 2012. The table further shows that South Africa is a net importer of true hemp during 2012 period as the country imported only 2 tons of true hemp products in 2012. The table also shows that the major supplier of true hemp products from the world into South Africa was China over the period under examination. The table further shows that should the country wish to import true hemp products from the world, Philippines is one of the most attractive markets for South Africa during the same period under scrutiny. The table further shows that Philippines had a highest share of about 93.9% in South Africa’s imports of true hemp during this period, with very low competition from China and United Kingdom.

24
Figure 16: Competitiveness of suppliers to South Africa for true hemp imported by South Africa in 2012
Source: Trade Map
25
Figure 16 depicts competitiveness of suppliers to South Africa for true hemp imported by South Africa from the world in 2012. The bubble graph further depicts that China was the biggest supplier of true hemp products to South Africa during 2012, while United Kingdom was the most competitive supplier of true hemp products to South Africa over the same period. The bubble graph also depicts that China’s share of partner countries in South Africa’s imports were approximately 1.00% and with 9% annual growth of partner countries’s exports to the world between 2008 and 2012. The bubble graph further depicts that United Kingdom’s share of partner countries in South Africa’s imports were approximately 2.00% and with negative 30% annual growth of partner countries’s exports to the world between 2008 and 2012. The graph also depicts that should South Africa decide to diversify its suppliers of imports of true hemp products, small but attractive markets exist in United Kingdom during the period under review.

26
Figure 17: Prospects for diversification of suppliers for true hemp imported by South Africa in 2012
Source: Trade Map

27
Figure 17 above illustrates prospects for diversification of suppliers for true hemp products imported by South Africa from the world in 2012. The bubble graph illustrates that China was the biggest supplier of true hemp products into South Africa over the same period. The graph also illustrates that should South Africa decide to diversify its suppliers of imports of true hemp products, small but attractive markets exist in United Kingdom during the period under examination. 6. HEMP MARKET VALUE CHAIN Figure 18: Hemp Market Value Chain
The hemp value chain begins with seed breeding and multiplication followed by seed storage, soil preparation and planting. After harvesting hemp, the bast fibers must be separated from the rest of the stalk and this is done through the process called retting. Once the stalks are retted, dried and baled, they are taken to a central location for processing. With mechanical process called breaking, stalks are pressed between fluted rollers to crush and break the woody core into short pieces (called hurds), separating some of it from the bast fibre. The remaining hurds and fibre are separated in a process called decortication with one machine called a decorticator. After this process various hemp raw materials are taken to the manufacturers who produce final hemp products such as bags, shoes, socks and cosmetics.
Seed
Breeding
Seed
Multiplication
Seed
Storage
Soil Preparation
Planting Cultivation Harvesting Retting
Baling Bale Storage Transport Decortication
Product
Manufacturing
2nd
Tier Manufacturing
Wholesale
/retail
Consumption

28
6.1 Hemp Value Chain Tree explaining its various uses Figure 19: Hemp value chain tree
Source: Roulac (1997)
The markets for hemp products include high-end value added opportunities such as the oil and health food markets; woven and knitted textile such as carpets and apparel, moulded or pressed textiles; medium to low-end value adding opportunities such as pulp and paper, building materials, beverages, livestock feed and bedding and biomass fuels.
TEXTILES
Apparel
Diapers
Fabrics
Handbags
Working
clothes
Denim
Socks
Shoes
OTHER
INDUSTRIAL
PRODUCTS
Agro-fiber
composites
Brake and
clutch
linings
caulking
PAPER
Printing
paper
Fine and
specialty
paper
Technical
filter
paper
cardboard
BUILDING
MATERIAL
Fiber board
Insulation
material
Fiber glass
substitute
Cement
blocks
Stucco and
mortar
Bast Fibers Hurds (Shives)
Leaves
Animal
bedding
Mulch
Mushroom
Compost
FOODS
Salad oil
Margarine
Food
supplements
PERSONAL
HYGIENE
Soap
Shampoo
Bath gels
Cosmetics
Hemp Oil
Seed
FOODS
Granola
Birdseed
Seed Cake
(After Processing)
Animal feed
Protein-rich
flour
Hemp Stalk
with seeds
Cell Fluid
Abrasive
fluids
HEMP PLANT
Whole Plant Boiler fuel
Pyrolysis feedstock
Agricultural
Benefits
Pest resistance Weed suppression Soil improvement Elimination of
pesticides Pollen
isolation
TECHNICAL
TEXTILES
Twine
Rope
Nets
Canvas bags
Tarps
Carpets
Geo-textiles
TECHNICAL
PRODUCTS
Oil paints
Solvents
Vanishes
Printing
inks
Putty
Coatings
Fuel
29
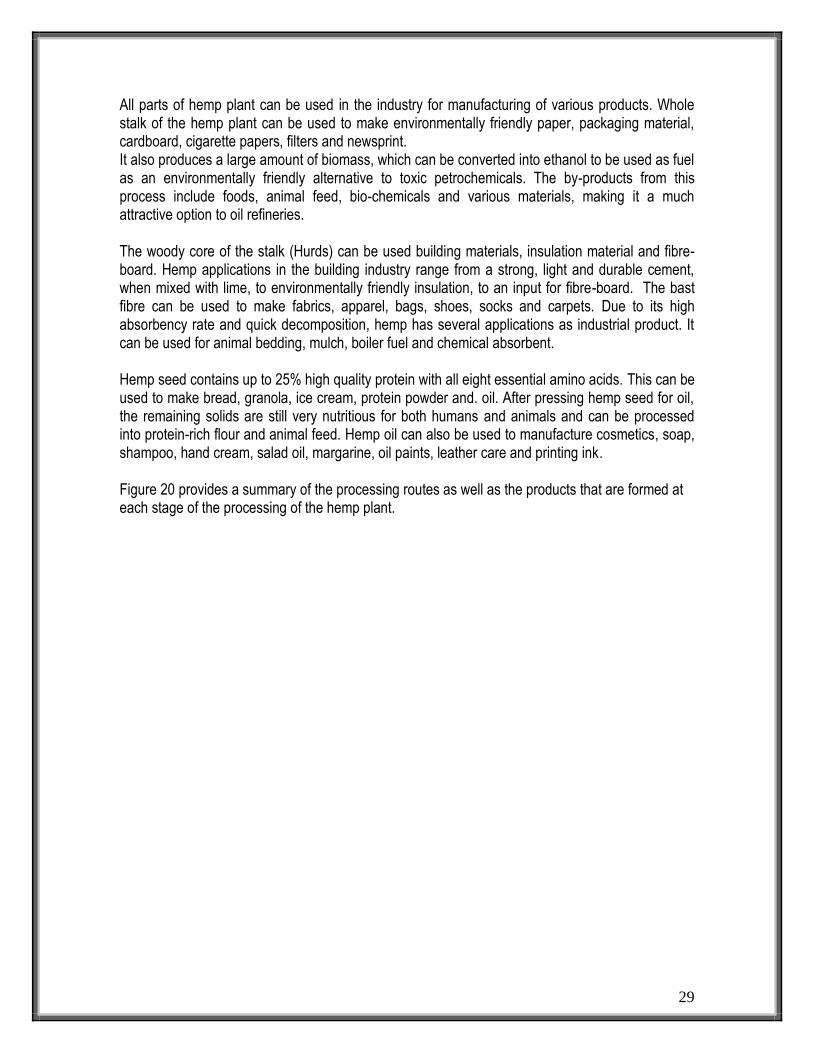
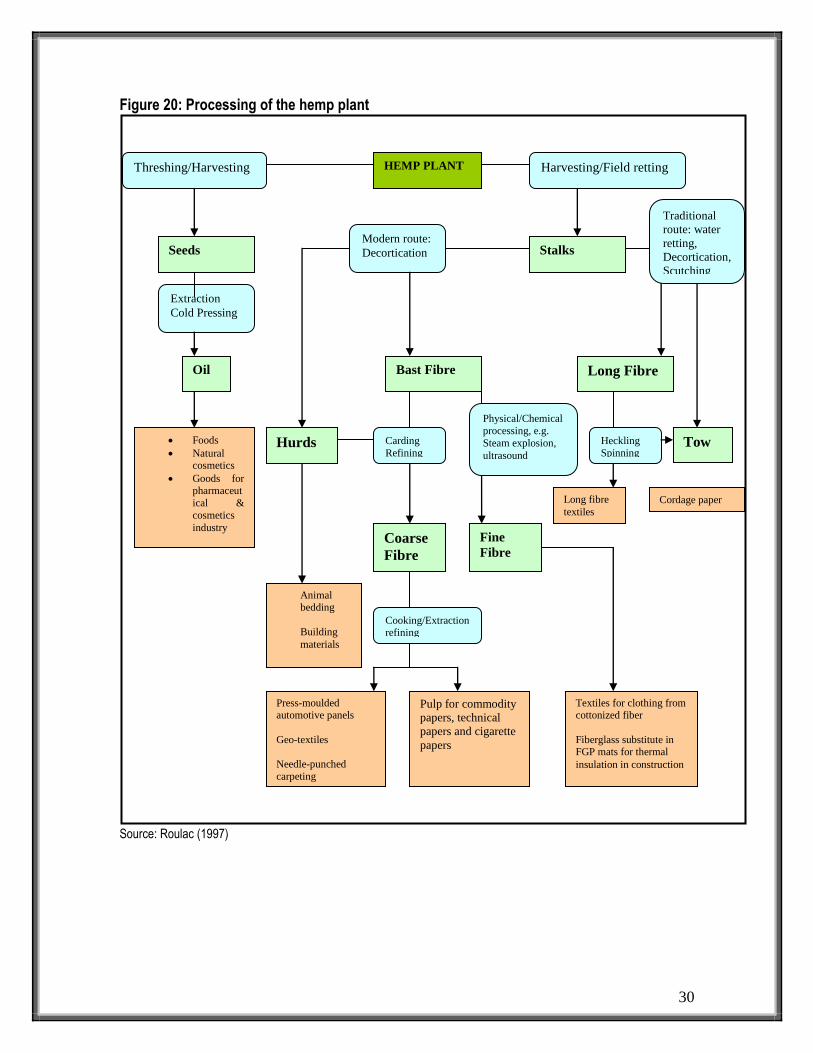
All parts of hemp plant can be used in the industry for manufacturing of various products. Whole stalk of the hemp plant can be used to make environmentally friendly paper, packaging material, cardboard, cigarette papers, filters and newsprint. It also produces a large amount of biomass, which can be converted into ethanol to be used as fuel as an environmentally friendly alternative to toxic petrochemicals. The by-products from this process include foods, animal feed, bio-chemicals and various materials, making it a much attractive option to oil refineries. The woody core of the stalk (Hurds) can be used building materials, insulation material and fibre-board. Hemp applications in the building industry range from a strong, light and durable cement, when mixed with lime, to environmentally friendly insulation, to an input for fibre-board. The bast fibre can be used to make fabrics, apparel, bags, shoes, socks and carpets. Due to its high absorbency rate and quick decomposition, hemp has several applications as industrial product. It can be used for animal bedding, mulch, boiler fuel and chemical absorbent. Hemp seed contains up to 25% high quality protein with all eight essential amino acids. This can be used to make bread, granola, ice cream, protein powder and. oil. After pressing hemp seed for oil, the remaining solids are still very nutritious for both humans and animals and can be processed into protein-rich flour and animal feed. Hemp oil can also be used to manufacture cosmetics, soap, shampoo, hand cream, salad oil, margarine, oil paints, leather care and printing ink. Figure 20 provides a summary of the processing routes as well as the products that are formed at each stage of the processing of the hemp plant.
30
Figure 20: Processing of the hemp plant
Source: Roulac (1997)
HEMP PLANT
Seeds Stalks
Oil Bast Fibre Long Fibre
Hurds
Coarse
Fibre
Fine
Fibre
Foods
Natural cosmetics
Goods for
pharmaceut
ical &
cosmetics
industry
Animal bedding
Building
materials
Long fibre
textiles Cordage paper
Press-moulded automotive panels
Geo-textiles
Needle-punched
carpeting
Pulp for commodity
papers, technical
papers and cigarette
papers
Textiles for clothing from cottonized fiber
Fiberglass substitute in FGP mats for thermal
insulation in construction
Threshing/Harvesting Harvesting/Field retting
Extraction
Cold Pressing
Modern route:
Decortication
Carding
Refining
Physical/Chemical
processing, e.g.
Steam explosion,
ultrasound
Cooking/Extraction refining
Traditional
route: water
retting,
Decortication,
Scutching
Tow Heckling
Spinning

31
7. MARKET ACCESS The major export markets for South African hemp are the SADC countries. The following tariffs are applied by various export markets to hemp and hemp products originating from South Africa based on the data from 2011 and 2012. Table 6: Tariffs applied by major markets of hemp textiles and products originating from South Africa
IMPORTING COUNTRY
TYPE APPLIED TARIFFS
ESTIMATED TOTAL ADVALOREM
APPLIED TARIFFS
ESTIMATED TOTAL ADVALOREM
2011 2012
USA MFN duties (Applied)
0.00% 0.00% 0.00% 0.00%
China MFN duties (Applied)
6.00% 6.00% 6.00% 6.00%
Kenya MFN duties (Applied)
0.00% 0.00% 0.00% 0.00%
Guinea MFN duties (Applied)
5.00% 5.00% 5.00% 5.00%
Ghana MFN duties (Applied)
10.00% 10.00% 10.00% 10.00%
Nigeria MFN duties (Applied)
5.00% 5.00% 5.00% 5.00%
Angola MFN duties (Applied)
2.00% 2.00% 2.00% 2.00%
Preferential Tariff for SADC countries
0.00% 0.00% 0.00% 0.00%
Tanzania MFN duties (Applied)
0.00% 0.00% 0.00% 0.00%
Preferential Tariff for SADC countries
0.00% 0.00% 0.00% 0.00%
DRC MFN duties (Applied)
5.00% 5.00% 5.00% 5.00%
Preferential Tariff for SADC countries
0.00% 0.00% 0.00% 0.00%
Mozambique MFN duties (Applied)
2.50% 2.50% 2.50% 2.50%
Preferential Tariff for
0.00% 0.00% 0.00% 0.00%

32
IMPORTING COUNTRY
TYPE APPLIED TARIFFS
ESTIMATED TOTAL ADVALOREM
APPLIED TARIFFS
ESTIMATED TOTAL ADVALOREM
2011 2012
SADC countries
Brazil MFN duties (Applied)
6.00% 6.00% 6.00% 6.00%
Zambia MFN duties (Applied)
15.00% 15.00% 15.00% 15.00%
Preferential Tariff for SADC countries
0.00% 0.00% 0.00% 0.00%
Zimbabwe MFN duties (Applied)
5.00% 5.00% 5.00% 5.00%
Source: ITC Market Access Map
Table 6 indicates that hemp and hemp products from South Africa can be exported to the SADC countries free of duty due to the SADC Free Trade Agreement. Table 6 further indicates that Ghana and China have a heavily protected hemp industry with tariffs of 10% and 6% respectively, as compared to other countries. These tariffs have not changed in 2011 and 2012. Table 7: Tariffs applied by South Africa to imports of hemp textiles and products from various origins
IMPORTING COUNTRY
TYPE APPLIED TARIFFS
ESTIMATED TOTAL ADVALOREM
APPLIED TARIFFS
ESTIMATED TOTAL ADVALOREM
2011 2012
Thailand MFN duties (Applied)
0.00% 0.00% 0.00% 0.00%
Japan MFN duties (Applied)
0.00% 0.00% 0.00% 0.00%
China MFN duties (Applied)
0.00% 0.00% 0.00% 0.00%
Chinese Taipei
MFN duties (Applied)
0.00% 0.00% 0.00% 0.00%
Republic of Korea
MFN duties (Applied)
0.00% 0.00% 0.00% 0.00%
United States of America
MFN duties (Applied)
0.00% 0.00% 0.00% 0.00%
France MFN duties (Applied)
0.00% 0.00% 0.00% 0.00%
Spain MFN duties (Applied)
0.00% 0.00% 0.00% 0.00%

33
Switzerland MFN duties (Applied)
0.00% 0.00% 0.00% 0.00%
Germany MFN duties (Applied)
0.00% 0.00% 0.00% 0.00%
United Kingdom
MFN duties (Applied)
0.00% 0.00% 0.00% 0.00%
Netherlands MFN duties (Applied)
0.00% 0.00% 0.00% 0.00%
Brazil MFN duties (Applied)
0.00% 0.00% 0.00% 0.00%
Jamaica MFN duties (Applied)
0.00% 0.00% 0.00% 0.00%
Nigeria MFN duties (Applied)
0.00% 0.00% 0.00% 0.00%
Zimbabwe MFN duties (Applied)
0.00% 0.00% 0.00% 0.00%
Zambia MFN duties (Applied)
0.00% 0.00% 0.00% 0.00%
Source: ITC Market Access Map
Table 7 shows that hemp textiles and true hemp products from other countries can enter South Africa free of duty between 2011 and 2012. This is to make it easier for South Africa based manufacturers to import hemp fiber and textiles from other countries to be able to manufacture the products that are demanded in the country. There is a legislation that prohibits commercial growing of hemp in South Africa, but hemp products are amazingly in higher demand and this could be one of those reasons that made our country not to charge any tariff for hemp imports. 8. CHALLENGES In South Africa it is not permissible to cultivate hemp commercially on a large scale. A special permission to grow hemp is granted on conditions issued in terms of Section 22A (9) (a) (i) of the Medicines and Related Substances Act 101 of 1965 to possess and cultivate it for only research purposes. The commercial cultivation of hemp in South Africa is prohibited due to the following legislations:
The Drugs and Drug Trafficking Act, 1992 (Act No 140 of 1992) which describes hemp as dagga. The Act prohibits the possession, processing, transportation and commercialization of hemp. This Act is enforced by the South Africa Police Services,
Medicines and Related Substances Act, 1965 (Act No 101 of 1965) which requires that a permit should be obtained from the Department of Health in accordance with Section 22A (9) (a)(i) of this Act. The Act allows possession and cultivation of hemp for research purposes only,
The Environmental Conservation Act, 1989 (Act No 73 of 1989) describes hemp as a declared weed or invasive alien plant species. This Act is enforced by the Department of Environmental Affairs and Tourism.

34
9. ACKNOWLEDGEMENTS The following organizations are acknowledged: Agricultural Statistics: Department of Agriculture, Forestry and Fisheries Tel: (012) 319 8453 Fax: (012) 319 8031 www.daff.gov.za Quantec Easydata P.O.Box 35466 Menlo Park Pretoria 0102 Tel: 012 361 5154 Fax: 012 348 5874 Website: www.quantec.co.za ITC Market Access Map Website: http://www.macmap.org/South Africa Food and Agriculture Organization of the United Nations Website: www.fao.org Roulac, J.W., 1997: Hemp horizons: The comeback of the world’s most promising plant, Chelsea Green, Vermont House of Hemp, South Africa Website: http://www.houseofhemp.co.za Disclaimer: This document and its contents have been compiled by the Directorate: Marketing of the Department of Agriculture, Forestry and Fisheries for the purpose of detailing the hemp market. Anyone who uses the information as contained in this document does so at his/her own risk. The views expressed in this document are those of the Department of Agriculture, Forestry and Fisheries with regard to the industry, unless otherwise stated. The Department of Agriculture, Forestry and Fisheries therefore accepts no liability that can be incurred resulting from the use of this information.