henrik leonhardt - göteborgs universitet · polycystic ovary syndrome . morphologic and dynamic...
TRANSCRIPT

Polycystic ovary syndrome Morphologic and dynamic evaluation by
magnetic resonance imaging
Henrik Leonhardt
MD
Department of Radiology Institute of Clinical Sciences
The Sahlgrenska Academy University of Gothenburg
Sweden 2013

Polycystic ovary syndrome - Morphologic and dynamic evaluation by magnetic resonance imaging © Henrik Leonhardt [email protected]
ISBN 978-91-628-8677-6 GUPEA: http://hdl.handle.net/2077/32391 Printed in Gothenburg, Sweden 2013, by Ineko

”Utan tvivel är man inte riktigt klok”
Tage Danielsson

ABSTRACT
Polycystic ovary syndrome (PCOS) is a complex endocrine disorder, affecting up to 15% of women of reproductive age. The syndrome is characterized by oligo-anovulation, hyperandrogenism and polycystic ovaries. What constitutes the best definition of PCOS is still a matter of debate. Women with PCOS have a higher risk of developing abdominal obesity, insulin resistance with progression to type 2 diabetes, hypertension, and endometrial hyperplasia/cancer. The etiology of PCOS remains incompletely understood, but insulin resistance may be central in the pathogenesis.
The main aims of this thesis were to: 1) characterize the distribution of abdominal adipose tissue in PCOS, 2) assess whether women with PCOS have altered uterine morphology or peristalsis, 3) compare transvaginal ultrasonography (TVUS) and magnetic resonance imaging (MRI) for estimation of ovarian volume and antral follicle count (AFC), and assess reproducibility and interobserver agreement of MRI measurements, and 4) investigate how well ovarian morphology and perfusion discriminate women with PCOS from controls and to elucidate associations between ovarian morphology and serum anti-Müllerian hormone (AMH), a potential surrogate for AFC.
Sixty women with PCOS and 31 age- and BMI-matched controls were recruited by advertising in the local community. There were no differences in abdominal volumes of total, subcutaneous and visceral adipose tissue, as determined by MRI, between the groups. The endometrium was thinner in PCOS with oligo-amenorrhea compared to controls. Based on cine MRI, uterine peristalsis was less commonly observed in women with PCOS than in controls. 2D MRI revealed more antral follicles, especially of small size, than 3D TVUS. Ovarian volume estimation by 3D MRI provided volumes closer to 2D TVUS values than did 2D MRI. AFC, ovarian volume, ovarian stroma volume, ovarian total cross-sectional area, AMH, and free testosterone differ in women with PCOS compared with controls. AFC and free testosterone are the best variables to distinguish women with PCOS from controls. AMH was not independently associated with PCOS.
In conclusion, women with PCOS display hyperandrogenemia, insulin resistance and adipose tissue abnormalities, although their abdominal adipose tissue distributions were indistinguishable from age/BMI-matched controls. A thinner rather than thicker endometrium was found in women with PCOS and oligo-amenorrhea as compared to controls, contrary to the general belief. Uterine peristalsis was less commonly observed in women with PCOS, but whether disturbed peristalsis contributes to infertility in PCOS remains to be investigated. Our findings suggest, when either oligo-anovulation or clinical signs of hyperandrogenism is absent, that AFC or free testosterone rather than AMH should be added in the estimation if a woman has PCOS or not. MRI had a high ability to

distinguish and count small antral follicles, with an adequate intra- and interobserver reliability. MRI is a method well suited for scientific studies on this heterogeneous syndrome.
Key words: polycystic ovary syndrome, PCOS, magnetic resonance imaging, MRI, ultrasonography, three-dimensional imaging, adrenal hyperplasia, body composition, uterine morphology, uterine peristalsis, ovarian morphology, ovarian perfusion, antral follicle count, AMH, diagnostic accuracy

POPULÄRVETENSKAPLIG SAMMANFATTNING
Polycystiskt ovariesyndrom (PCOS) är den vanligaste hormonella/metabola störningen hos kvinnor i fertil ålder. Mer än var tionde kvinna drabbas. Syndromet karaktäriseras av menstruationstörningar som kan medföra fertilitetsproblem och ökade nivåer av det manliga könshormonet testosteron, vilket kan ge symptom som ökad kroppsbehåring och acne. De metabola störningarna innefattar okänslighet för insulin samt en högre benägenhet för övervikt/fetma. Tillsammans medför detta en högre risk för diabetes. Symtomen debuterar ofta i puberteten och tilltar om kvinnorna går upp i vikt. Kvinnor med PCOS löper en cirka tredubblad risk att insjukna i livmodercancer (endometriecancer) under sin livstid jämfört med kvinnor som inte har syndromet. Benämningen ”polycystiskt” syftar på att flertalet kvinnor med syndromet har ökad mängd omogna äggblåsor (cystor) i de ofta förstorade äggstockarna. Bästa definitionen av PCOS debatteras fortfarande, men de så kallade Rotterdam-kriterierna från 2003 är den vanligast förekommande och innebär att minst två av följande tre villkor ska vara uppfyllda för att en kvinna ska få diagnosen PCOS: 1) menstruationsrubbningar 2) tecken på ökade nivåer av testosteron 3) polycystiska äggstockar påvisade med ultraljud. Att mäta Anti-Mülleriskt Hormon (AMH) kan reflektera antalet cystor i äggstockarna och har föreslagits kunna ersätta ultraljudsundersökningen vid diagnostiken av PCOS. Orsaken till PCOS är fortfarande till stor del okänd, men det finns en ärftlig faktor.
Magnetisk resonanstomografi (MRT) är en ofarlig undersökningsmetod som detaljerat kan avbilda t.ex. äggstockar och livmoder samt ge information om fysikaliska skeenden, såsom blodgenomströmning och rörelser i organ. Magnetkameran har även förmåga att på ett exakt sätt ge information om fördelningen mellan det inre farliga bukfettet och det ytliga, mindre farliga bukfettet.
Ett syfte med den här avhandlingen var att mäta fördelningen av bukfett på kvinnor med PCOS jämfört med kvinnor utan syndromet matchade för ålder och body mass index (BMI), så kallade kontroller. Trots att kvinnorna med PCOS hade högre testosteronvärden och sänkt insulinkänslighet, fann vi inte någon skillnad i fördelningen av bukens fettvävnad jämfört med kontrollerna.
Ett annat syfte var att undersöka om de inre strukturerna i livmodern, inklusive livmoderslemhinnans (endometriets) tjocklek skiljer sig mellan kvinnor med PCOS och friska kontroller. Ökad endometrietjocklek, som man kan förmoda att kvinnor med PCOS som inte menstruerar ut slemhinnan regelbundet har, kan i sällsynta fall leda till cancer. Vi fann inga strukturella skillnader i livmoderns utseende mellan grupperna, utöver att kvinnor med PCOS och menstruationstörningar något

överraskande hade tunnare endometrium än kontrollerna. Med MRT har vi också kunnat studera en vågliknande rörelse i det inre av livmodern, som bl.a. anses ha betydelse för spermietransport och fertilitet. Denna så kallade livmoderperistaltik observerades mindre ofta i PCOS-gruppen än i kontrollgruppen.
Ett tredje syfte var att jämföra modernt 3D-ultraljud med MRT avseende mätning av antalet synliga cystor i äggstockarna. Detta har betydelse som en del i bedömningen om en kvinna har PCOS eller ej, och har även betydelse vid prognostisk bedömning av ovariets funktion vid behandling av infertilitet. Vi fann att flest små cystor kunde identifieras med MRT, som troligen alltså är den känsligaste metoden för cysträkning. Vi har också visat att det är möjligt att mäta äggstockarnas volym med en 3D-MRT teknik, som gör mätningen oberoende av om äggstocken inte är helt rundad i sin form.
Ett fjärde syfte med avhandlingen var att utreda hur väl ovariets utseende och blodgenomströmning kan skilja kvinnor med PCOS från kvinnor utan syndromet och att belysa vissa hormoners samband, inklusive AMH, med PCOS. Vi fann att cysträkning och fritt testosteron i blodet är de variabler som bäst skiljer PCOS från kontroller. AMH är inte oberoende associerat med PCOS.
Sammanfattningsvis visar avhandlingen inte på någon skillnad i fördelning av bukfett hos kvinnor med PCOS jämfört med kontroller. Kvinnor med PCOS och menstruationstörningar hade inte någon ökad tjocklek av livmoderslamhinnan. Med MRT observerades livmoderperistaltik mindre ofta hos kvinnor med PCOS. Cysträkning eller mätning av fritt testosteron med mass-spektrometri bör vara en del av diagnostiska kriterier för PCOS. AMH var inte lika tillförlitligt, men har andra fördelar såsom att det är förhållandevis enkelt att mäta och inte varierar påtagligt under menstruationscykeln, till skillnad från fritt testosteron. Fler studier behövs innan man kan rekommendera internationellt gångbara tröskelvärden för de olika variablerna.
Slutligen har vi kunnat konstatera att MRT är ett bra instrument vid forskning om det komplexa tillståndet PCOS, men på grund av bristande tillgång och relativt hög kostnad kommer ultraljud framgent försvara sin plats som förstahandsmetod vid klinisk PCOS-utredning.

LIST OF PAPERS
The thesis is based on the following papers:
1) Adipose tissue has aberrant morphology and function in PCOS: enlarged adipocytes and low serum adiponectin, but not circulating sex steroids, are strongly associated with insulin resistance Mannerås-Holm L, Leonhardt H, Kullberg J, Jennische E, Odén A, Holm G, Hellström M, Lönn L, Olivecrona G, Stener-Victorin E, Lönn M. J Clin Endocrinol Metab 2011;96:304-11.* 2) Uterine morphology and peristalsis in women with polycystic ovary syndrome Leonhardt H, Gull B, Kishimoto K, Kataoka M, Nilsson L, Janson P O, Stener-Victorin E, Hellström M. Acta Radiol. 2012;53(10):1195-201. 3) Ovarian volume and antral follicle count assessed by MRI and transvaginal ultrasonography; a methodological study Leonhardt H, Gull B, Stener-Victorin E, Hellström M. Submitted 2013. 4) Antral follicle count and free testosterone, but not anti-Müllerian hormone, discriminate women with polycystic ovary syndrome from controls Leonhardt H, Gull B, Lind A-K, Nilsson L, Janson P O, Hellström M, Stener- Victorin E. Submitted 2013. * Paper 1 was included in the doctoral thesis of Louise Mannerås-Holm, 2010 1.
Reprints were made with permissions from the publishers:
Copyright © 2011 the Endocrine Society (Paper 1)
Copyright © 2012 the Foundation Acta Radiologica (Paper 2)
CONTENTS
INTRODUCTION ....................................................................... 16 Magnetic resonance imaging ........................................................ 17 Historical background ..................................................................................... 17 Basic principles ................................................................................................. 17 Receiver coils and artifacts ............................................................................. 18 Image quality ..................................................................................................... 21 Polycystic ovary syndrome ............................................................ 21 Prevalence and clinical presentation ............................................................. 21 Obesity ................................................................................................................. 21 Risk of endometrial hyperplasia and cancer ........................................................... 23 Infertility and uterine function ............................................................................... 24 Ovulatory dysfunction ........................................................................................... 25 Androgen excess and the adrenals ......................................................................... 26 History and definition of PCOS ................................................................... 27 Antral follicle count, androgens and Anti-Müllerian hormone ............... 31 Morphology and imaging appearance of the ovary ................................... 32 The normal ovary .................................................................................................. 32 Influence of the menstrual cycle and age ................................................................. 34 The polycystic ovary ............................................................................................... 35 The multifollicular ovary ....................................................................................... 41 Stroma ................................................................................................................. 42 Blood flow ............................................................................................................. 43 Left-right .............................................................................................................. 43 Transvaginal ultrasonography ............................................................................... 43 Magnetic resonance imaging .................................................................................. 44 Ovarian disorders that may mimic PCOS ............................................................ 44 Treatment of PCOS and resulted ovarian morphologic features ............................. 44 AIMS .............................................................................................. 47 SUBJECTS AND METHODS .................................................... 48 Ethics ............................................................................................. 48 Subjects .......................................................................................... 48

Summary of the methods ............................................................... 49 Anthropometry (Paper 1) ............................................................................... 49 Ultrasonography (Paper 1-4) ......................................................................... 49 Magnetic resonance imaging (Paper 1-4) .................................................... 50 Biochemical analyses (Paper 1 and 4) .......................................................... 54 Insulin sensitivity (Paper 1 and 4) ................................................................. 54 Statistical analyses (Paper 1-4) ....................................................................... 55 SUMMARY OF RESULTS ........................................................... 58 Paper 1 ............................................................................................ 58 Paper 2 ............................................................................................ 58 Paper 3 ............................................................................................ 59 Ovarian volume ................................................................................................ 59 Antral follicle count ......................................................................................... 59 Reproducibility and interobserver agreement of MRI measurements ... 60 Paper 4 ............................................................................................ 60 Ovarian follicle distribution ........................................................................... 60 Stromal signal intensity/echogenicity and vascularity ............................... 60 The peripheral rim ........................................................................................... 61 Predictors of PCOS ......................................................................................... 62 DISCUSSION ................................................................................ 63 The main findings of the present thesis ........................................ 63 Abdominal adipose tissue in PCOS .............................................. 63 Endometrial thickness in PCOS ................................................... 64 Uterine peristalsis in PCOS ........................................................... 65 Ovarian morphology ...................................................................... 67 Diagnostic tests .............................................................................. 69 Intraclass correlation ..................................................................... 71 Generalizability .............................................................................. 74 CONCLUSIONS ........................................................................... 76 FUTURE PERSPECTIVES ......................................................... 77 PERSONAL CONCLUDING REMARKS .................................. 78 ACKNOWLEDGMENTS ............................................................. 79 REFERENCES ............................................................................. 82

ABBREVIATIONS
A Area (total ovarian cross-sectional area)
ACTH Adreno-corticotropic hormone
AE-PCOS Androgen Excess and PCOS Society
AFC Antral follicle count
AMH Anti-Müllerian hormone
ANOVA Analysis of variance
ASRM American Society for Reproductive Medicine
AUC Area under the (ROC) curve
BMI Body mass index
CI Confidence interval
CT Computed tomography
ESHRE European Society for Human Reproduction and Embryology
FSH Follicle stimulating hormone
GDR Glucose disposal rate
GE Gradient echo (MRI sequence)
GnRH Gonadotropin-releasing hormone
HA Hyperandrogenism
HASTE Half-Fourier acquisition single-shot turbo spin-echo (MRI)

HOMA Homeostasis model assessment
ICC Intraclass correlation
IVF In vitro fertilization
L Lumbal (level)
LH Luteinizing hormone
MFO Multifollicular ovary
MRI Magnetic resonance imaging
NIH National Institutes of Health
NSA Number of signal averages (MRI)
OA Oligo-/anovulation
OHT Ovarian hyperthecosis
OR Odds ratio
OSH Ovarian stroma hyperplasia
PCO Polycystic ovary (morphology)
PCOS Polycystic ovary syndrome
RF Radiofrequent
ROC Receiver operating characteristic
S Stromal (cross-sectional area)
SD Standard deviation
SHGB Sex hormone binding globulin
SI Signal intensity (MRI)

SL Stein-Leventhal
SNR Signal-to-noise ratio (MRI)
STARD Standards for Reporting of Diagnostic Accuracy
T1 Longitudinal or spin-lattice relaxation (MRI)
T2 Transverse or spin-spin relaxation (MRI)
TE Time to echo (MRI)
THRIVE Fat-saturated T1-weighted high-resolution isotropic volume gradient echo (MRI)
TR Repetition time (MRI)
TSE Turbo spin-echo (MRI)
TVUS Transvaginal ultrasonography


INTRODUCTION

Polycystic ovary syndrome (PCOS) is a diverse and complex female endocrine and metabolic disorder associated with hyperandrogenism, ovulatory dysfunction and polycystic ovaries (PCO), as determined by transvaginal ultrasonography (TVUS). Women with PCOS have a higher risk of developing hypertension, abdominal obesity, insulin resistance with progression to type 2 diabetes, and endometrial hyperplasia or cancer. Although first described in 1935, the definition of the syndrome is still disputed and the pathogenesis of the condition is not completely understood. Magnetic resonance imaging (MRI) is a non-invasive imaging technique with excellent intrinsic soft tissue contrast and without any known long term health risks. The method offer detailed and objective morphologic and functional information with a global view of the abdomen and pelvis, and may thus be useful in scientific research on PCOS.
Magnetic Resonance Imaging
Historical background
In 1946 Edward Purcell and Felix Bloch independently reported that certain nuclei, when placed in a strong magnetic field, can absorb and emit electromagnetic energy in the radiofrequency range, a phenomenon named nuclear magnetic resonance 2, 3. Bloch and Purcell were awarded the Nobel Prize in 1952. In 1972, Paul Lauterbur presented the idea that nuclear magnetic resonance could be used for imaging, laying the foundation for a new medical imaging modality; magnetic resonance imaging 4. In 1976, Sir Peter Mansfield and co-workers presented cross-sectional images of a finger, produced by selective excitations of single slices by the application of sets of radiofrequency pulses 5. In 2003, Lauterbur and Mansfield were awarded the Nobel Prize for their pioneer work in this research field. MRI has been in medical service since the 1980s.
Basic principles
Magnetic resonance images are constructed from radiofrequent (RF) signals emitted by spinning hydrogen nuclei (protons) in simultaneously applied magnetic fields and externally generated radiofrequency energy. The strength and origin of the resonance

18 Henrik Leonhardt |
signals can be determined by low magnetic field gradients that are superimposed on a magnetic field, enabling the scanning of sectional images in the transaxial, coronal and sagittal planes of the body (Figure 1 and 2). The variables of hydrogen proton magnetic resonance which can be utilized for imaging are: the proton density, the relaxation times T1 (longitudinal or spin-lattice relaxation) and T2 (transverse or spin-spin relaxation), and blood flow. While the proton density in different organic tissues fluctuates only by approximately 10%, the relaxation times may vary by several hundred per cent. Tissue contrast, therefore, is mainly based on relaxation time differences. Depending on different imaging parameters, mainly the RF-pulse sequences and the particular parameters used within the pulse sequence, such as repetition time (TR) and the time to echo (TE), T1 and T2 will contribute to the signal to a varying degree. 6, 7. Fast spin-echo sequences have been considered the standard acquisition technique for imaging the pelvis. T1-weighted sequences utilize short TR and short TE, so that tissue with short T1 value, such as fat, give a high signal and appear bright on MRI, while most other types of tissue give low signal, and therefore appear darker. T2-weighted sequences utilize long TR and long TE, so that materia with long T2, such as water, emit high signal. These T2-weighted images demonstrate MRI´s excellent intrinsic soft tissue contrast resolution in the pelvis, such as seen in the zonal anatomy of the uterus, and in the identification and demarcation of antral follicles in the ovaries 8. Gadolinium is a paramagnetic substance, used as a contrast agent in MRI, causing signal intensity increase in T1-weighted images by shortening of T1 relaxation time of the surrounding tissue 9. The agent is administered intravenously, and usually pre- and post-contrast enhanced T1-weighted fat suppressed sequences are used for evaluation of blood perfusion of tissue. Fast gradient echo (GE) sequences, coupled with automated intravenous contrast injection, enables repeated images through an entire organ or parts thereof, during and after the injection, so called dynamic contrast enhanced imaging. Repeated ultra-fast sequences can also be used to study motion, for instance in the uterus, so called cine MRI 10-12.
Receiver coils and artifacts
The RF-system in an MRI-camera is basically a broadcasting and receiver antenna, emitting RF pulses and receiving the MRI signal as an electrical current. The receiver unit in the camera can be switched off, and instead the signals can be received by a different antenna constructed to be placed on the surface of the body in order to

| Introduction 19
improve signal detection with lower background noise; so called surface coils. With the use of external multiple phased-arrayed surface coils, quality of pelvic imaging has improved significantly in the last decades, with higher resolution, and possibilities to obtain thinner slices with sufficient fields of view and signal-to-noise ratio without increased imaging time. However, artifacts, with the exception of motion artifacts, are more pronounced with the phased-array coils. The phase ghost artefact, caused by the high signal from subcutaneous fat adjacent to the surface coils, can be minimized by using in-field saturation pulses, changing the phase encoding direction, or using fat suppression 9. The chemical shift artifact is caused by the difference in the resonance frequency experienced by protons in different chemical environments such as fat and water, resulting in marked borders between tissues with different fat and water content in the readout direction 13, 14. Through this difference in the resonance frequency between fat and water, protons at the same location are misregistrated by the Fourier transformation when converting the MRI signal to the spatial domain and can be seen as bright or dark bands at the edge of the anatomical structures along the frequency encoding direction, both in spin echo and GE techniques. In addition to the mismapping, GE sequences can show another type of chemical shift induced artifact known as the black boundary artifact (Fig 1), seen as black contours following anatomical structures in all directions at fat-water interfaces 14. If both water and fat protons are present in the same volume element (voxel) at the border of an abdominal organ, the signal disappears and artifactual black lines are seen. These chemical shift effects can be used to confirm, for example, the presence of fat in a lesion. Chemical shift can be reduced by using lower main magnetic field strength, stronger gradients, wider bandwidth or increased matrix size. Use of a spin echo instead of a GE sequences can reduce the black boundary artifact but not chemical shift misregistration. Fat suppressed imaging eliminates the chemical shift misregistration and the black boundary artifact. The truncation artifact appears as multiple concentric rings in the regions of marked transitions in signal intensity, most commonly seen in the phase encoding direction, and is due to computer errors in Fourier transformation (Figure 2a). This effect can be lessened by increasing the matrix and the use of various filters 9, 14. A variety of strategies have been developed to reduce motion artifacts, for instance repeated measurements with increased number of signal averages (NSA), and breath-holding techniques. Motion artifacts by intestinal peristalsis can be minimized by restricted food or drink intake at least four hours before examination, or by pre-scan administration of glucagon or anticholinergic agents (Figure 2b).

20 Henrik Leonhardt |
a b
Figure 1. T1-weighted MRI gradient echo (GE) sequence in the transaxial (a) and coronal (b) plane of the upper abdomen at the level of the adrenals. Note black boundary artifacts at the periphery of organs, such as liver and kidneys.
a b
Figure 2. T2-weighted turbo spin echo (TSE) images in the sagittal plane through the midsagittal plane of the uterus, situated behind and to some extent above the urinary bladder (urine as a waterlike fluid has very high signal on T2). The arrow in (a) indicates a truncation artifact. The uterus in (b) is indistinct due to bowel motion artifacts.

| Introduction 21
Image quality
Three factors influence the quality of the images acquired by any pulse sequence technique: 1) Signal-to-noise ratio (SNR); 2) spatial resolution, and 3) contrast resolution 13. SNR affects the “graininess” of an image and is influenced by both extrinsic instrument factors, such as TR, TE, slice thickness, field-of-view, matrix size, magnetic field strength etc. and intrinsic (patient-related) factors, such as proton density. Spatial resolution refers to the sharpness of the boundaries between different tissues, defined as the ability to resolve closely spaced anatomical details, and depends on slice thickness, field-of-view, and matrix size. Contrast resolution is the ability to discern differences in tissue signal intensity and can be manipulated by selection of imaging parameters, such as flip angle, T1 and T2-weighting.
Polycystic ovary syndrome
Prevalence and clinical presentation
Polycystic ovary syndrome is a heterogeneous disorder associated with oligo-anovulation and hyperandrogenism. The condition is one of the most common endocrine and metabolic disorders also called “the female metabolic syndrome”, affecting up to 15% of women of reproductive age 15, 16. Women with PCOS have a higher risk of developing obesity, hyperlipidemia, hyperinsulinemia and insulin resistance with progression to type 2 diabetes, and hypertension, although the risk of developing cardiovascular disease in older postmenopausal women with previously confirmed PCOS is disputed 17-37. It has been reported that women with PCOS have an eleven-fold increased prevalence of the metabolic syndrome compared with age-matched controls 37. The etiology of PCOS remains incompletely understood, but hyperandrogenism and insulin resistance are both central in the pathogenesis 16, 38.
Obesity
About 50% of women with PCOS are overweight (BMI 25 to 30 kg/m2) or obese (BMI >30 kg/m2), although the frequency figures vary somewhat between countries and ethnic groups 16, 23. Although obesity itself is not considered the causative event for development of the syndrome, obesity can exacerbate associated reproductive and

22 Henrik Leonhardt |
metabolic derangements 23. In particular, obese women with PCOS more often have severe hyperandrogenism and insulin resistance than women with PCOS but normal weight 20. Women with PCOS have been observed to demonstrate predominantly central body fat accumulation, i.e. abdominal adiposity (android fat distribution), which is associated with more severe insulin resistance and related metabolic complications than peripheral body fat distribution (gynoid fat distribution) (Figure 3) 23, 28, 39-46. Chronic androgen excess results in abdominal adiposity in affected women 22. Long-term administration of testosterone in female-to-male transsexual subjects induces abdominal adiposity 47. Androgen excess during fetal life and infancy is associated with increased risk of developing abdominal adiposity later in life 48-50.
Figure 3. Abdominal, and in particular visceral, fat deposition (central, above waist, android, apple-like shape) is associated with metabolic disturbances such as insulin resistance, type 2 diabetes mellitus, dyslipidemia, and hypertension, while accumulation of fat on hips, thighs, and buttocks (peripheral, below waist, gynoid, pear-like shape) is less harmful from a metabolic point of view.
Abdominal fat can be separated into subcutaneous adipose tissue and visceral adipose tissue by imaging techniques such as computed tomography (CT) and MRI, with high precision and reproducibility (Figure 4) 51-62. Although abdominal subcutaneous and visceral adipose tissue are both associated with metabolic risk factors, several studies

| Introduction 23
have shown that visceral adipose tissue is more strongly associated with these risk factors 63-73. Visceral adipose tissue was found to be the most significant variable correlating with metabolic dysfunction in 40 women with anovulatory PCOS 67.
Risk of endometrial hyperplasia and cancer
Women with PCOS have an increased risk of developing endometrial hyperplasia and cancer 23, 74, 75. In a recent systematic review, it was estimated that women with PCOS have a 9% lifetime risk of endometrial cancer compared with 3% in women without the syndrome 75. It is assumed that chronic anovulation, which results in continuous estrogen stimulation of the endometrium unopposed by progesterone, is a causative factor 76. Other risk factors for endometrial cancer associated with PCOS are obesitas, hyperinsulinemia, and nulliparity 77, 78. A positive relationship between endometrial thickness and endometrial hyperplasia, an estrogen-specific response, has been observed in anovulatory women with PCOS 79. Serum concentrations of estrogens are higher in women with PCOS than in controls, but the ranges overlap widely 80, 81. Furthermore, a higher bioavailability of estrogens in the endometrium has been reported in women with PCOS 82-84. Endometrial thickness has been suggested as a clinical determining factor together with age and BMI for endometrial biopsy in women with PCOS 76, 85. Hyperplasia has been suggested to be unlikely in a PCOS population if the endometrial thickness is less than 7 mm 79. Thus, ultrasound screening with endometrial biopsy at an endometrial thickness of >9 mm in obese patients with PCOS has been suggested 85. The endometrium has been observed to be
Figure 4. Transaxial T1-weighted GE acquisition at the level of L5. SAT is subcutaneous adipose tissue, VAT is visceral adipose tissue.

24 Henrik Leonhardt |
thicker in PCOS without insulin resistance 86. In a recent ultrasonographic study, increased endometrial stripe measurements throughout a menstrual cycle in infertile patients with PCOS was observed, when compared to infertile patients without PCOS 87. Otherwise reports on endometrial thickness in PCOS are rare. Infertility and uterine function
Infertility is a major concern for many women with PCOS and is to a large extent explained by oligo-anovulation. However, there may be additional factors influencing fertility associated with the syndrome. For example, reproductive function in PCOS is strongly dependent on body weight and metabolic status 88. Miscarriage rates have been claimed to be increased compared with normal fertile women, although supporting evidence is limited 89. High BMI increases the risk of miscarriage after in vitro fertilization (IVF) 90. In addition, the prevalence of polycystic ovaries has been reported to be higher in women with recurrent miscarriage 91, 92. In contrast, a woman with PCOS has a similar chance for pregnancy or live birth after IVF as a non-PCOS woman, with no differences in implantation or miscarriage rates 93, and in a follow-up study of an unselected population of PCOS the rate of miscarriages was not increased compared to age-matched controls 89. According to a recent Swedish population-based cohort study 94, women with PCOS are at increased risk of adverse pregnancy (gestational diabetes, pre-eclampsia, caecarean section, pre-term birth) and birth outcomes that cannot be explained by assisted reproductive technology.
Factors of importance for normal fertility include morphological and functional status of the uterus. A zonal anatomy of the uterine wall can be visualized by MRI. An inner layer of the myometrium can be outlined, named the subendometrial layer or junctional zone, representing a predominantly circular arrangement of muscular fibers, being lower in signal intensity compared to the outer myometrium on T2-weighted images.
The uterus is not a static organ. Being composed of mainly muscular tissue, it has the ability to contract, not only at labor, but also under non-pregnant conditions. A contraction may involve a large part of the uterine muscular wall and may persist for considerable time, as occasionally shown at MRI or TVUS. Another type of uterine dynamic is uterine peristalsis, less commonly noted unless specifically looked for. Uterine peristalsis is a slow repetitive motion predominantly of the junctional zone. These

| Introduction 25
subtle peristaltic movements have been studied by TVUS and MRI in cine-mode display 10, 11, 95. Under normal conditions, uterine peristalsis has been observed to be most active during the periovulatory phase, with the dominant peristaltic direction being cervicofundal, mainly towards the uterine corner ipsilateral to the dominant ovary, suggesting that it supports sperm transport 96-98. It is known that peristalsis is reduced during the luteal phase, which is thought to aid implantation of the embryo in the endometrium 99. Interestingly, the dominant direction of peristalsis during the menstrual phase is reversed, i.e. fundocervical, which is believed to aid in discharge of menstrual blood 99. Two main patterns of uterine peristalsis have been described; an endometrial stripping movement and a wave conduction of the junctional zone with perceptible direction (Figure 5) 11. These patterns can be observed in isolation or in combination. Uterine peristalsis seems to be affected by several factors, such as hormones, drugs and different diseases 95, 100-117. However, neither uterine zonal anatomy nor peristalsis has previously been studied in PCOS.
Ovulatory dysfunction
Between one-quarter and one-third of all women with anovulation or menstrual dysfunction have PCOS 118. The risk of anovulation is increased with increased number of antral follicles in the ovaries. In contrast, the number of ovulatory cycles increases if the number of antral follicles decreases, no matter if it is due to increased
Figure 5. Schematic view through the uterus in the midsagittal plane illustrating the two different types of peristalsis. The horizontal white arrow indicates the cervicofundal direction of a bulging movement involving mainly the inner layer of the myometrium, i.e. the junctional zone (JZ). The vertical black double-arrow illustrates a non-directional stripping movement visible mainly in the endometrial stripe (ES).

26 Henrik Leonhardt |
age (before menopaus) or after ovarian parenchyma-reducing surgery 119. Women with PCOS usually have increased levels of luteinizing hormone (LH) relative to follicle stimulating hormone (FSH), i.e. the circulating LH to FSH ratio is elevated 16, 81. The increased LH levels stimulate the theca cells to express the enzyme essential for the production of androgens to a higher extent, thus contributing to androgen excess. Also insulin stimulates theca cells to secret androgens. Morphologically, the characteristic feature of polycystic ovaries (PCO) is an apparent failure to select a dominant follicle and the accumulation of small antral follicles 120, 121. Oligo-amenorrhea in PCOS results from ovarian follicle abnormalities that are thought to influence in two different ways 122, 123. First, early follicular growth is excessive, up to the step of follicles becoming sensitive to FSH (i.e. 2–5 mm in diameter). Secondly, the selection of one follicle from the increased pool of selectable follicles (i.e. 6–9 mm in diameter), and its further maturation to a dominant follicle under LH influence, does not occur. This second abnormality in the folliculogenesis is named the follicular arrest and explains the ovulatory disorder of PCOS 121-124. Follicular arrest is associated with excessive stimulation of follicular cells by insulin, LH, or both, contributing to the hyperandrogenic environment 124. There is evidence that the local (follicle-to-follicle) signaling of anti-Müllerian hormone (AMH) and other regulators is abnormal and contributes to the disordered folliculogenesis 121. However, the exact mechanisms of follicular arrest are not fully understood.
Androgen excess and the adrenals
Approximately 60-80% of women with PCOS have high concentrations of circulating testosterone 125. The main part of the androgen excess origins from the ovaries, but 20-30% of patients with PCOS also have an adrenal hyperandrogenism 81, 126-128. In diagnosing PCOS, one must always exclude other causes of androgen excess, including congenital adrenal hyperplasia and androgen secreting adrenal tumors, although very rare 129, 130. This is usually possible by clinical information and different biochemical tests 131. In patients with adrenocorticotropic hormone (ACTH)-dependent Cushing’s syndrome, bilateral hyperplasia of the adrenal cortex can be observed by CT or MRI. Adrenal tumors may also be detected with these imaging modalities 132. Presumably, there is no visible adrenal hyperplasia in PCOS. However, there are no reports on imaging of the adrenals in patients with PCOS.
| Introduction 27
History and definition of PCOS
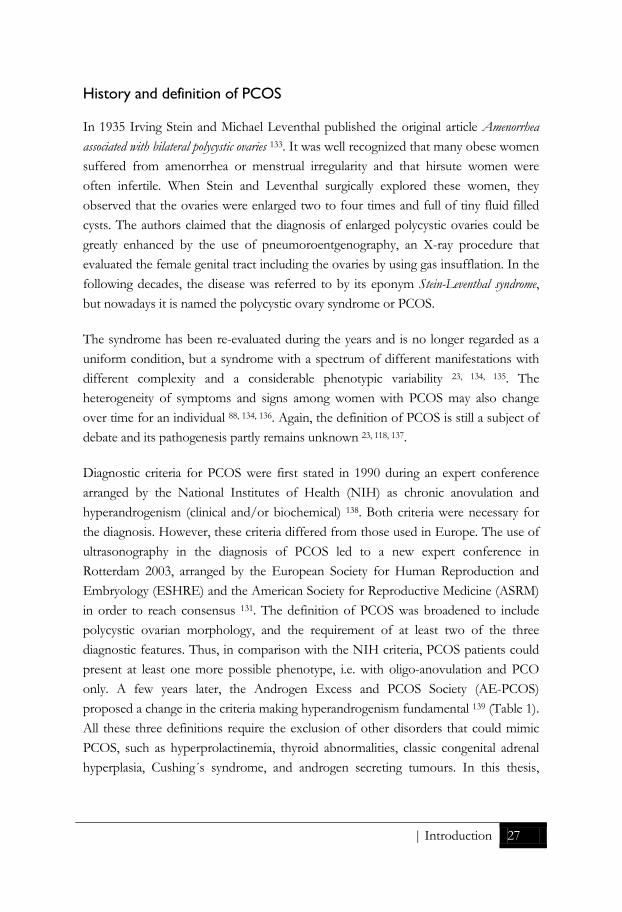
In 1935 Irving Stein and Michael Leventhal published the original article Amenorrhea associated with bilateral polycystic ovaries 133. It was well recognized that many obese women suffered from amenorrhea or menstrual irregularity and that hirsute women were often infertile. When Stein and Leventhal surgically explored these women, they observed that the ovaries were enlarged two to four times and full of tiny fluid filled cysts. The authors claimed that the diagnosis of enlarged polycystic ovaries could be greatly enhanced by the use of pneumoroentgenography, an X-ray procedure that evaluated the female genital tract including the ovaries by using gas insufflation. In the following decades, the disease was referred to by its eponym Stein-Leventhal syndrome, but nowadays it is named the polycystic ovary syndrome or PCOS.
The syndrome has been re-evaluated during the years and is no longer regarded as a uniform condition, but a syndrome with a spectrum of different manifestations with different complexity and a considerable phenotypic variability 23, 134, 135. The heterogeneity of symptoms and signs among women with PCOS may also change over time for an individual 88, 134, 136. Again, the definition of PCOS is still a subject of debate and its pathogenesis partly remains unknown 23, 118, 137.
Diagnostic criteria for PCOS were first stated in 1990 during an expert conference arranged by the National Institutes of Health (NIH) as chronic anovulation and hyperandrogenism (clinical and/or biochemical) 138. Both criteria were necessary for the diagnosis. However, these criteria differed from those used in Europe. The use of ultrasonography in the diagnosis of PCOS led to a new expert conference in Rotterdam 2003, arranged by the European Society for Human Reproduction and Embryology (ESHRE) and the American Society for Reproductive Medicine (ASRM) in order to reach consensus 131. The definition of PCOS was broadened to include polycystic ovarian morphology, and the requirement of at least two of the three diagnostic features. Thus, in comparison with the NIH criteria, PCOS patients could present at least one more possible phenotype, i.e. with oligo-anovulation and PCO only. A few years later, the Androgen Excess and PCOS Society (AE-PCOS) proposed a change in the criteria making hyperandrogenism fundamental 139 (Table 1). All these three definitions require the exclusion of other disorders that could mimic PCOS, such as hyperprolactinemia, thyroid abnormalities, classic congenital adrenal hyperplasia, Cushing´s syndrome, and androgen secreting tumours. In this thesis,

28 Henrik Leonhardt |
PCOS is defined according to the Rotterdam criteria 131, as these are the most commonly used in Europe today, but only PCOS subjects with PCO were included.
Depending on the PCOS definition used, there are different phenotypes of PCOS with the three key diagnostic features of ovulatory dysfunction, hyperandrogenism, and PCO on ultrasonography (Table 1) (Figure 6). This heterogeneity of the condition is further exacerbated by the degree of obesity, insulin resistance, ethnicity, and other factors 135, 139. Knowledge of the specific phenotypes of a study population is important, as exemplified by the evidence that insulin resistance is most prevalent and severe in women with the NIH PCOS phenotype involving both chronic hyperandrogenism and anovulation 23, 44, 140. In addition, the precise prevalence of PCOS is difficult to determine and depends on the definition used. An Australian study by March et al in 2010 estimated that the prevalence using the NIH, Rotterdam and AES criteria were approximately 9%, 18 % and 12% respectively 15. Other studies have reported prevalence of 6-10% with the NIH and up to 20% with the Rotterdam criteria 31. Thus, this variety raises concerns when comparing clinical studies using different definitions. The latest Evidence-based Methodology Workshop on PCOS organized by NIH in December 2012 recommends maintaining the broad, inclusionary diagnostic criteria of Rotterdam (which includes the “classic NIH” and AE-PCOS criteria) while specifically identifying the phenotype. The specific phenotypes should be reported explicitly in all research studies and clinical care 141. Table 1. PCOS diagnostic criteria and phenotypes. Definition Diagnostic criteria Phenotypes
NIH 1990
Requires the presence of 1) Hyperandrogenism (HA) and 2) Chronic anovulation
HA + anovulation
Rotterdam 2003
Requires the presence of at least two of 1) Hyperandrogenism 2) Oligo- and/or anovulation (OA) 3) PCO morphology (PCO)
HA + OA HA + OA + PCO HA + PCO PCO + OA
AES 2006 Requires the presence of 1) Hyperandrogensim and 2) Ovarian dysfunction (OA or PCO)
HA + OA HA + OA + PCO HA + PCO
PCO morphology is defined as 12 or more of follicles measuring 2-9 mm and/or increased ovarian volume (>10 cm3) in at least one ovary.

| Introduction 29
In all young women, irregular menses are common in the years immediately after menarche. Only approximately 40% of adolescent women with menstrual irregularity
have PCO on ultrasonography 23. There is no consensus of PCOS diagnostic criteria during adolescence, emphasizing the difficulty in distinguishing a polycystic ovary from what has traditionally been referred to as a multicystic or multifollicular ovary 142, 143. However, guidelines for diagnosing PCOS during adolescence have recently been proposed 144. A positive diagnosis of adolescent PCOS should require all three elements of the Rotterdam consensus, and it may be better to define hyperandrogenism as hyperandrogenemia. In adolescents, the ultrasonographic examination is often performed transabdominally, rather than transvaginally, even though the resolution is better transvaginally. This problem is further magnified by the inferior ultrasound resolution in obesity, and by the changes of ovarian findings with age (as described in the chapter on morphology and imaging appearance of the ovary). No firm threshold of PCO in postmenopausal women was identified by the 2003 Rotterdam consensus group. What is known is that PCO in postmenopausal women tend to have greater volume (6.4 cm3 versus 3.7 cm3) and demonstrate more follicles (9.0 versus 1.7) than normal postmenopausal ovaries 145. Presence of PCO after
PCO
classic PCOS
HA
classic PCOS
OA..
Figure 6. Venn diagram illustrating the Rotterdam criteria for PCOS and the four possible different phenotypes within the overlapping parts of the circles. The circle borders depend on the definitions and threshold values used. Many women have a constitution close to a border and may cross it with advancing age.

30 Henrik Leonhardt |
menopause correlates with increased concentrations of serum testosterone and triglycerides 145. As defined by the strict NIH diagnostic criteria, 90-100% of women with PCOS have PCO 146-149. In a systematic review it was recognized that morphologic ovarian alterations may be found in >80% of women with a clinical diagnosis of PCOS 118. However, the finding of PCO is not alone sufficient for the diagnosis. Ultrasonographic studies demonstrate that the prevalence of PCO in a general female population of reproductive age is at least 20%, of whom 25-70% have symptoms of menstrual irregularity, infertility or hirsutism, consistent with the diagnosis of PCOS 150-153. In a study on 224 young women, aged 18-25 years, the prevalence was as high as 33% 154. It is well established that the antral follicle count (AFC) decreases with age during the reproductive years in normal women, and it has been suggested that the same is true also in women with PCOS 155, 156. The percentage of women with PCO decreases with increasing age 152, 155, 157. It should be taken into consideration, that in these studies a large proportion of women with PCO at ultrasonography also had irregular menstrual cycles, supranormal serum androgen levels or clinical hyperandrogenism, thus meeting the Rotterdam criteria for PCOS. In a recent study, 95 women with PCO but without symptoms was compared with a group of 95 women with PCOS and 95 women with normal ovaries on ultrasonography and no symptoms (controls), referred for tubal or male infertility 158. It was found that median serum AMH level in the PCO group was intermediate between that of the control and PCOS group, while the mean serum androgen level in the PCO group was similar to that in the control group and significantly lower than that in the PCOS group. The authors concluded that PCO is apparently not a normal variant, but rather a mild phenotype of PCOS with a granulose cell abnormality 158. This is supported by a recent study, demonstrating the ability of serum AMH concentrations to differentiate between women with PCO but no symptoms and women with PCOS 159. However, PCO in women with regular ovulatory cycles does not commonly predispose to development of PCOS over time 160. There is a considerable overlap of the appearances of ovaries between women with and women without the condition, and the proportion is dependent of what cut-off values for AFC and ovarian volume are used, as well as the imaging technique used 153,
161, 162. It is possible that the use of a higher threshold for AFC or solely counting follicles 2-5 mm in size might be more specific for PCOS 122, 163.

| Introduction 31
Metabolic abnormalities are most often seen in women who have both hyperandrogenism and anovulation, with obesity being an amplifier 23, 44. The majority (90-100 %) of women with combined hyperandrogenism and oligo-amenorrhea have PCO 147-149. It has been observed that women with PCO without clinical symptoms of PCOS have disturbances in insulin and glucose metabolism as well as lipid and lipoprotein disturbances 164-166. However, these studies were limited in power by their relatively small sample size, and the other investigations on this issue with larger sample size have failed to find metabolic changes among women with PCO alone 154,
155. Legro et al found, that neither the morphology (10 or more peripheral follicles 8 mm in diameter or less in one plane along with increased central ovarian stroma), nor the volume of the ovaries were associated with distinct metabolic or reproductive phenotypes in women with PCOS 167.
A robust international consensus of the definition of PCOS is of importance when performing studies of the condition. Again, the prevalence of PCOS according to the NIH, ESHRE/ASRM or AE-PCOS criteria may differ significantly in the same population 15, 23, 168. On the other hand, re-evaluation of the criteria from time to time is necessary considering the technical development of laboratory-analysis, ultrasonography, and other imaging techniques, such as MRI 137, 169.
Antral follicle count, androgens and anti-Müllerian hormone
Several studies have reported a positive correlation between AFC and serum concentrations of androgens 149, 162, 163, 170-173. These observations support the hypothesis that intraovarian androgens play a major role in the disturbed folliculogenesis of PCOS 123. AMH is a peptide produced by the granulosa cells of predominantly preantral and small antral follicles. In antral follicles, the overall effect of AMH is to reduce sensitivity to FSH. Measurement of serum AMH is emerging as a potential surrogate for TVUS, because levels correlate closely with AFC in several investigations 162, 169, 173-183. AMH has been reported to be two- or three-fold higher in serum from women with PCOS than in women with normal ovaries, largely due to the increased production of AMH by each follicle and not just a consequence of an increased follicle number 172. Further, serum AMH concentrations show a progressive decline with female ageing, and AMH has been suggested as a marker of ovarian ageing and reserve 183-194. It has also been suggested that AMH may be a

32 Henrik Leonhardt |
better predictor for successful IVF treatment than traditional markers 172, 195. A lower serum AMH concentration preceding or during assisted reproductive techniques was strongly associated with reduced oocyte yield and low oocyte quality 196, 197. Contradictory, in PCOS, those individuals with the highest concentrations of AMH seem to respond less well to treatment of infertility with IVF or weight reduction 172,
198, 199.
Morphology and imaging appearance of the ovary
The normal ovary
In adult women of reproductive age, the ovaries are usually situated in a recess of the pelvic side wall called the ovarian fossa, adjacent to the iliac vessels, and described to be almond-shaped 13, 200. Despite the support of the broad ligament, the ovarian ligament proper and the suspensory ligament of the ovary, normal ovaries are mobile and may be found in the pouch of Douglas, in front of the uterus, or high in the pelvis above the uterus. The ovarian parenchyma consists of the cortex and the medulla. The cortex occupies the greater part of the ovary and its stroma of primitive connective tissue contains the follicles; primordial, primary, secondary and tertiary (or antral, from the term antrum meaning a cavity or chamber, here fluid filled; cystic) follicles. The distribution of primordial and primary follicles is restricted to the outer 1–2 mm of cortex 201. The medulla is the inner parenchymal part of the ovary and its stroma contains loose connective tissue, blood vessels, and nerves, which enter the ovary at the hilus 202. The border between the cortex and medulla cannot be outlined by current imaging modalities. The primitive (primordial, primary, and secondary) follicles are microscopical in size. Only the fluid-containing antral follicles can be distinguished by TVUS or MRI. In this thesis, these are referred to as antral follicles, defined as thin-walled fluid containing structures in the ovary with homogenously high signal intensity on T2-weighted images and low signal intensity on T1-weighted images. At MRI, the stroma is defined as the entire ovarian parenchyma (cortex and medulla) apart from visualized follicles. It appears low or medium in signal intensity on T1-weighted images, and increases in signal intensity with increased T2-weighting (Figure 7). In some MRI literature, a thin peripheral rim with low signal intensity on T2-weighted images referred to as the “cortex” at the outermost part of the ovary is described, as opposed to the remaining majority of the stroma with higher signal

| Introduction 33
intensity on T2-weighted images referred to as the medulla (Figure 8) 203-208. A similar thin peripheral rim of intermediate or low echogenicity can often be observed by TVUS of ovaries. According to the description of the stromal histology above, this peripheral rim cannot represent the entire cortex. The surface epithelium and the basal membrane are microscopically thin. However, together with the thin collagen-rich modified stroma immediately under the basal membrane, the so called tunica albuginea, and the densely packed primitive (non-cystic) follicles in the most peripheral part of the cortex, there may be a rationale for a visible peripheral rim. However, in MRI, evaluation of the thickness of this peripheral rim may be obscured by artifacts from the signal shift of ovarian tissue and surrounding fat or fluid as described in the MRI section.
a b
Figure 7. T2-weighted TSE (a) and T1-weighted TSE (b) MRI acquisitions in the transaxial plane of the pelvis, with normal ovaries at each side of the uterus in a healthy ovulating woman. The fluid-filled antral follicles have high signal on the T2- and low signal on the T1-weighted image. The dominant follicle in the left ovary is close to 2 cm in size. The ovarian stroma is slightly high in signal on the T2- and intermediate in signal on the T1-weighted image.

34 Henrik Leonhardt |
a b
Figure 8. T2-weighted TSE (a) and contrast enhanced fat-suppressed GE (b) MRI acquisitions in the transaxial plane. The arrow indicates a star-like corpus luteum with intense peripheral contrast enhancement in a polycystic ovary. The 1.26 mm measurement is on a low-in-signal-intensity peripheral rim on the T2-weighted scan.
Influence of the menstrual cycle and age
The appearance and physiology of the ovary varies with age. At birth, the ovary measures 1.5 x 0.5 x 0.3 cm and is situated within the false pelvis, i.e. at a more cranial anatomical level 13. In the adolescent, the ovary enlarges and attains the final position in the true pelvis, i.e. at a lower anatomical level. In the mid and late puberty, the ovary may have a multifollicular appearance 209. In the adult, during the reproductive years, the ovary measures approximately 3 x 1.5 x 1 cm 13, presenting a few antral follicles and, monthly, a dominant follicle measuring 1-2 cm in diameter. In the early follicular phase, there is a growth of small antral follicles in both dominant and non-dominant ovaries up to the time of selection of the dominant follicle, assumed to take place on cycle day 6 210. After ovulation, the wall of the dominant cyst collapses, the follicular cells luteinize, and the peripheral tissue is invaded by new blood vessels, giving the characteristic star-like imaging appearance of a corpus luteum (Figure 8), which usually resolves within a few weeks. A follicular (or functional) cyst is a simple thin-walled cyst 3-8 cm in diameter, a follicle that has failed to ovulate or involute 204, 206, 207.

| Introduction 35
Despite these cyclic morphologic changes, AFC has been reported to show little variability throughout the menstrual cycle 203, 210, in particular regarding small follicle counts (≤6 mm) 211. However, significant variation in AFC is seen in particular age groups of healthy females, and the reproducibility of the AFC in two subsequent cycles is moderate 212. After the menopause, the ovary becomes atrophic and measures less than 2 cm in diameter. The postmenopausal ovary contains no or relatively few antral follicles (i.e. atretic cystic follicles) and has increased amounts of fibrous tissue, making them sometimes hard to visualize using imaging techniques 13,
213.
From studies based on ultrasound, reviewed by Duijkers and Klipping 157, or MRI 203, it is known that the number of follicles decreases with age, and that the AFC can be used as a measure of reproductive age 214. Before the age of 37 years, the AFC has a mean yearly decline of approximately 5%, compared with 12% thereafter 212. This is best described as gradually accelerating decline with age 215. As mentioned, the percentage of women with PCO decrease with increasing age 152, 155, 157. The ovarian volume has been observed to decrease with age in adult women, with the greatest decline between age 35-55 216, 217. Also in women with PCOS, AFC and ovarian volume decrease with age, suggesting that age-based criteria to define PCO is necessary in women over the age of 40 years 216.
The polycystic ovary
The poor resolution of the ultrasound equipment used in the early 1970s permitted visualization of the ovarian outline only, and the diagnosis of PCO was based on increased maximum diameter (4.0 cm) only 209. The development of real time sector scanners in the 1980s improved resolution, and cysts less than 1 cm could be recognized. In 1981, Swanson et al 218 described polycystic ovaries as enlarged with a mean volume of 12 cm3, and containing numerous tiny cysts (2-8 mm) arranged in the periphery of an ovary or throughout the parenchyma. In 1985, Adams et al 142 published criteria for PCO based on transabdominal ultrasonography as at least 10 follicles between 2 and 8 mm in diameter, in one imaging plane, arranged peripherally around an echo dense core of stroma, or scattered throughout an increased amount of stroma. These criteria 142 remained in widespread use, even after the introduction of TVUS a decade later 209.

36 Henrik Leonhardt |
The transvaginal approach facilitates the use of high-frequency probes (>6 MHz), which give better spatial resolution at the expense of less examination depth 143. The high resolution of the technique allows visualization of follicles less than 5 mm in diameter (Figure 9) 209. Numerous publications based on TVUS suggested different PCO criteria. These were reviewed, and a refined definition of PCO was agreed at the ESHRE/ASRM consensus meeting 2003, as part of the Rotterdam PCOS criteria 131,
143 (Table 2). The publication that had highest impact on the consensus definition of the cut-off value for the ovarian volume was a study on 80 women with PCOS compared with 30 controls 219, and for the cut-off value for the AFC a study on 214 women with PCOS (based on the association of one clinical criteria of oligo-amenorrhea or hirsutism, with either elevation of at least one serum level of LH/testosterone/androstendione, or an ovarian area greater than 5.5 cm2 unilaterally or bilaterally at TVUS) compared with 112 controls (ovulatory but infertile women with normal ovaries) 163. Both of these studies presented data as the mean of observed values between the left and the right ovary, on an individual level. Notably, according to the 2003 Rotterdam definition, only one ovary meeting either of these criteria is sufficient to establish the presence of PCO. Together with the shift in methodology from prior work, which attempted to define PCO on the basis of its appearance in a single ultrasonographic image plane 142, to the inclusion of the entire ovary, there may be an artificial inflation in the prevalence of PCO. In clinical practice, the ultrasonographer estimates the number of follicles in real time scanning through the ovary in at least two planes and obviously there is a degree of subjectivity. Considering the technological development, some studies demonstrate that using the 2003 Rotterdam proposed threshold of AFC (12 follicles in one ovary) leads to an artificial increase in the prevalence of PCO in normal populations (especially in women younger than 30 years) when using new TVUS equipment 155, 157, 220. Furthermore, by including patients without overt hyperandrogenism (oligo-amenorrhea and PCO) for the diagnosis of PCOS, the Rotterdam classification has been disputed 221, 222. However, Dewailly et al has reported that this is only an apparent controversy, because in fact the presence of PCO morphology turned out, after principal component analysis, to be itself a sign of hyperandrogenism 162. Thus, the authors proposed a simplified classification for the diagnosis of PCOS: oligo-amenorrhea and hyperandrogenism should first be required. When one of these criteria is not present, AFC or AMH could be used as a surrogate for oligo-amenorrhea or hyperandrogenism. However, the authors emphasized that the thresholds have to be revisited and validated worldwide because of the technical evolutions in ultrasound and assay procedures. In a recent study by Dewailly et al on 240 patients referred to
| Introduction 37
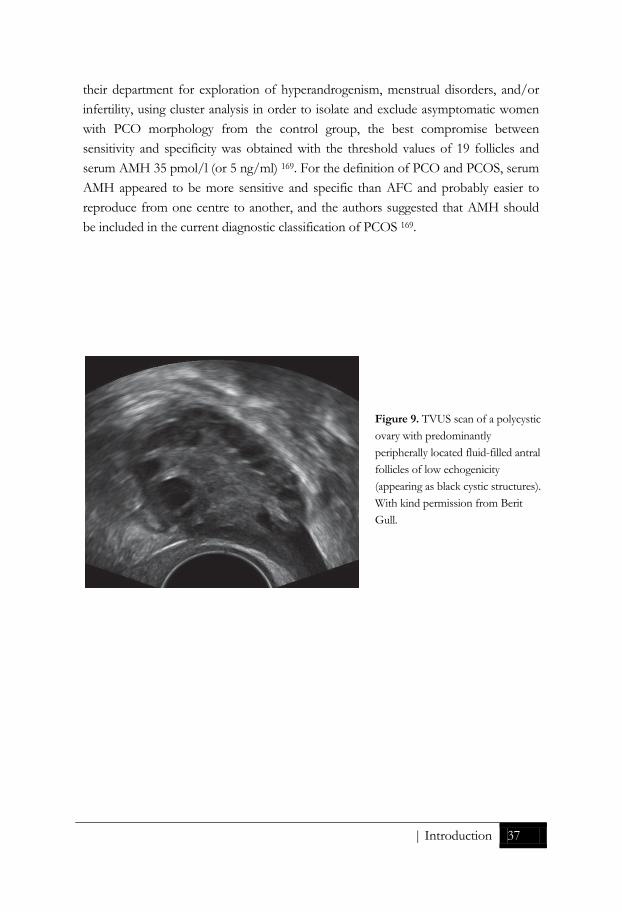
their department for exploration of hyperandrogenism, menstrual disorders, and/or infertility, using cluster analysis in order to isolate and exclude asymptomatic women with PCO morphology from the control group, the best compromise between sensitivity and specificity was obtained with the threshold values of 19 follicles and serum AMH 35 pmol/l (or 5 ng/ml) 169. For the definition of PCO and PCOS, serum AMH appeared to be more sensitive and specific than AFC and probably easier to reproduce from one centre to another, and the authors suggested that AMH should be included in the current diagnostic classification of PCOS 169.
Figure 9. TVUS scan of a polycystic ovary with predominantly peripherally located fluid-filled antral follicles of low echogenicity (appearing as black cystic structures). With kind permission from Berit Gull.

38 Henrik Leonhardt |
Table 2. Ultrasound assessment of the polycystic ovary (PCO): Rotterdam consensus (Balen 2003) Definition 1. The PCO should have at least one of the following: either 12 or more follicles measuring 2-9 mm in diameter or increased ovarian volume (>10 cm3). If there is evidence of a dominant follicle (>10 mm) or a corpus luteum, the scan should be repeated during the next cycle. 2. The subjective appearance of PCOs should not be substituted for this definition. The follicle distribution should be omitted as well as the increase in stromal echogenicity and/or volume. Although the latter is specific to polycystic ovary, it has been shown that measurement of the ovarian volume is a good surrogate for the quantification of the stroma in clinical practice. 3. Only one ovary fitting this definition or a single occurrence of one of the above criteria is sufficient to define the PCO. If there is evidence of a dominant follicle (>10 mm) or corpus luteum, the scan should be repeated next cycle. The presence of an abnormal cyst or ovarian asymmetry, which may suggest a homogeneous cyst, necessitates further investigation. 4. This definition does not apply to women taking the oral contraceptive pill, as ovarian size is reduced, even though the “polycystic” appearance may persist. 5. A woman having PCO in the absence of an ovulation disorder or hyperandrogenism (“asymptomatic PCO”) should not be considered as having PCOS, until more is known about this situation. 6. In addition to its role in the definition of PCO, ultrasound is helpful to predict fertility outcome in patients with PCOS (response to clomiphene citrate, risk for ovarian hyperstimulation syndrome, decision for in-vitro maturation of oocytes). It is recognized that the appearance of PCOs may be seen in women undergoing ovarian stimulation for IVF in the absence of overt signs of PCOS. Ultrasound also provides the opportunity to screen for endometrial hyperplasia. 7. The following technical recommendations should be respected:
• State-of-the-art equipment is required and should be operated by appropriately trained personnel.
• Whenever possible, the transvaginal approach should be preferred, particularly in obese patients.
• Regularly menstruating women should be scanned in the early follicular phase (days 3-5). Oligo-/amenorrhoeic women should be scanned either at random or between days 3-5 after a progestogen-induced bleed.
• If there is evidence of a dominant follicle (>10 mm) or a corpus luteum, the scan should be repeated the next cycle.
• Calculation of ovarian volume is performed using the simplified formula for a prolate ellipsoid (0.5 x length x width x thickness).
• Follicle number should be estimated both in longitudinal, transverse and antero-posterior cross-sections of the ovaries. Follicle size should be expressed as the mean of the diameters measured in the three sections.
The usefulness of 3D ultrasound, Doppler or MRI for the definition of PCO has not been sufficiently ascertained to date, and should be confined to research studies.

| Introduction 39
Any calculation of ovarian volume is, at best, an estimate. The shape of a polycystic ovary tends to be more spherical than ovoid 223. At the ESHRE/ASRM consensus meeting 2003, based on the review by Balen et al 143, the practical calculation of ovarian volume by the simplified formula for a prolate ellipsoid (0.5 x length x width x thickness of the ovary) 218 was decided to be used for the definition of PCO. More
1 x D2 x D3), where D is the maximal diameter in three orthogonal directions. Strictly, the ellipsoid defined with this formula is not prolate, since a prolate ellipsoid is defined mathematically as the shape created by rotating an ellipse around its long axis. Because the mathematic definition of a prolate ellipsoid requires two of its three axes to be equal, it is more accurate to refer to the formula as the simplified formula for an ellipsoid (Figure 10) 120. However, the ovary is not always observed to be a perfect ellipsoid, as there may be surface irregularities, and the shape may be curved as e.g. the shape of a kidney. Measurement by three-dimensional (3D) imaging techniques has the potential to make more accurate volume estimations on non-ellipsoid ovaries. Rotational measurement of ovarian volume from 3D ultrasound data has been demonstrated to be significantly more reliable between observers than volume estimation from basic 2D ultrasound parameters using the prolate ellipsoid formula, but is dependent upon image quality 224, 225.
For many years, ovarian wedge resection was the only treatment for PCOS. Wedge resection is not used to the same extent as before and histological specimens of PCO are hard to get hold of, unless incidentally found in ovaries removed for other reasons. In the original report from Stein and Leventhal, wedge resections of between one half
Figure 10. Drawing illustrating calculation of ovarian volume using the simplified formula for an ellipsoid length x width x height x 0.5. Notice that the directions need to be orthogonal.

40 Henrik Leonhardt |
and three fourths of each ovary were performed in seven patients with oligo-amenorrhea, infertility, and in the majority of the cases obesity and hirsutism. The ovaries were found to be from two to four times the normal size, sometimes distinctly globular in shape. The ovarian cortex was found to be hypertrophied in all of the cases and the surface tunica thickened and fibrotic. There was an estimation of 20 to 100 follicle cysts in each ovary, varying in size from 1 mm to about 15 mm.
In 1982, Hughesdon presented a study on 34 full-thickness Stein-Leventhal (SL) ovarian wedges and 30 age-matched control ovaries, which allowed comparison of the architecture in entire ovarian cross-sections 226. Although there was an overlap, SL ovaries had an average cross-sectional area about twice that of controls, entailing a volume increase of about x 2.8. All forms of ripening follicles were about doubled in number in SL ovaries and the contrast to normal ovaries was best defined in the smaller tertiary (antral) forms under 4 mm in diameter. Subcortical (peripheral) dislocation of small follicles was also about twice as frequent in SL as in control ovaries on average, with much overlap. Much of the SL tunica was more collagenized and abruptly contrasted with the subjacent cortex. The average thickness of the tunica ranged from 0.14 to 0.90 mm (mean 0.44 mm) in SL ovaries and from 0.12 to 0.80 mm (mean 0.28 mm) in control ovaries. The author speculates that this presumably strengthened tunica is probably an active reaction to the increased ovarian distension which would otherwise thin it out. If this thickened tunica is possible to visualize by imaging modalities has not yet been clarified. In SL ovaries, cellular stroma was overall more extensive than in controls. The SL subcortical (deep cortical or medullary) stromal bulk exceeded the average control figure in all but three ovaries, derived partly from regressive conversion of the over-numerous older follicles, and partly from stromal hyperplasia. The SL stromal increase had been described by others, as reviewed in Hughesdon´s report, often titled “hyperthecosis”.
In 2007, Webber et al presented data on laparoscopic cortical biopsies from ovaries in 24 normal women, 16 ovulatory women with PCO and 16 oligomenorrhoeic women with PCO 227. Median follicle density (follicle count per mm3 of tissue) of small preantral follicles, including those at primordial and primary stages, was six-fold greater in anovulatory polycystic ovaries than in normal ovaries, suggesting an intrinsic ovarian abnormality in PCOS. A good correspondence has been shown between ultrasound estimations of PCO morphology (volume and follicle identification with distribution) and histopathological findings obtained at hystero-oophorectomy or after

| Introduction 41
wedge resection 228, 229. Otherwise the literature on correlations between ultrasonography and histology is sparse 143.
It is now known that it is oocyte-containing follicles that are observed by ultrasonography in PCO 143. The size range of follicles has been considered important by some authors, with polycystic ovaries tending to have smaller follicles than normal or multifollicular ovaries 163, 171, 226. Jonard et al reported that the mean number of follicles 2-5 mm in size assessed by TVUS was significantly higher in PCOS than in controls, while it was similar within the 6-9 mm range 163. An AFC of >12 follicles of 2-9 mm gave the best threshold for the diagnosis of PCOS, with sensitivity 75 % and specificity 99 %. Within the 2-5 mm follicular range, a significant positive relationship between the AFC and androgens was found 163.
Not only elevated levels of AMH and androgens, but also obesity and insulin resistance may contribute to the large antral follicle pool and to the increase in ovarian volume in women with PCOS 170. AMH levels are negatively affected (decreased) by increased obesity 230.
The multifollicular ovary
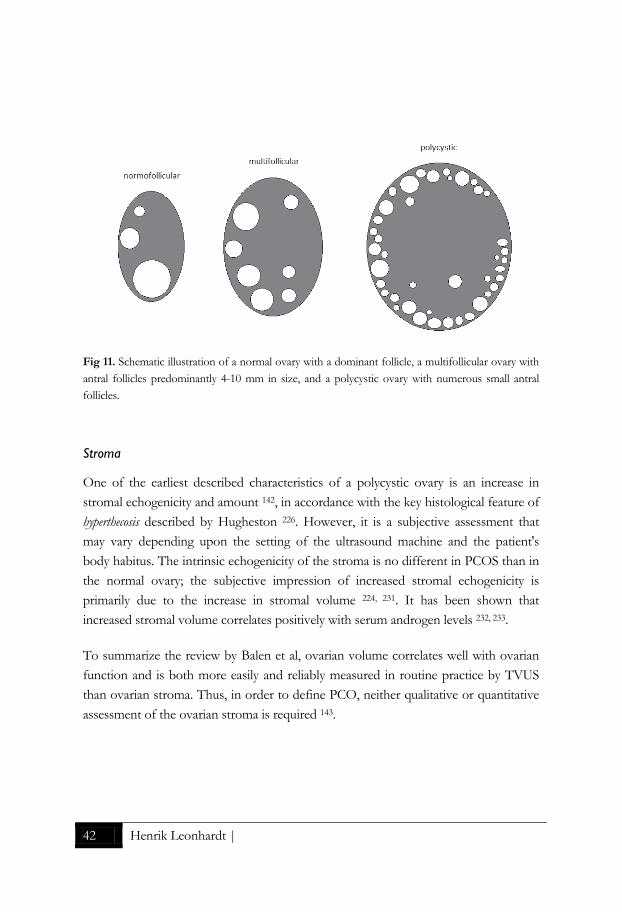
Multifollicular ovaries (MFO) were first described by Adams et al in 1985 142, and are characteristically seen during puberty and in hyperprolactinemia, hypothalamic anovulation, and weight-related amenorrhea 143, 209. They differ from PCO, having fewer follicles (6-10 per ovary), which tend to be larger (4-10 mm in diameter) and distributed throughout the normal sized or slightly enlarged ovary with no stromal hypertrophy (Figure 11) 142. MFO result from incomplete pulsatile gonadotropin-releasing hormone (GnRH) stimulation of ovarian follicular development. Furthermore, MFO resume a normal appearance following weight gain or treatment with pulsatile GnRH, while PCO in general retain their appearance throughout reproductive life, irrespective of time of cycle, pregnancy or drug treatment. Women with MFO have normal levels of LH and testosterone and reduced levels of FSH compared with women with PCO 209.
42 Henrik Leonhardt |
Fig 11. Schematic illustration of a normal ovary with a dominant follicle, a multifollicular ovary with antral follicles predominantly 4-10 mm in size, and a polycystic ovary with numerous small antral follicles.
Stroma
One of the earliest described characteristics of a polycystic ovary is an increase in stromal echogenicity and amount 142, in accordance with the key histological feature of hyperthecosis described by Hugheston 226. However, it is a subjective assessment that may vary depending upon the setting of the ultrasound machine and the patient's body habitus. The intrinsic echogenicity of the stroma is no different in PCOS than in the normal ovary; the subjective impression of increased stromal echogenicity is primarily due to the increase in stromal volume 224, 231. It has been shown that increased stromal volume correlates positively with serum androgen levels 232, 233.
To summarize the review by Balen et al, ovarian volume correlates well with ovarian function and is both more easily and reliably measured in routine practice by TVUS than ovarian stroma. Thus, in order to define PCO, neither qualitative or quantitative assessment of the ovarian stroma is required 143.

| Introduction 43
Blood flow
There are several ultrasound Doppler studies on ovarian blood flow in PCOS with variable findings, but the majority have demonstrated increased blood flow in PCO 143, 224, 234-240. The measurement of Doppler blood flow requires specific expertise and machinery, and has not been included as part of the diagnostic criteria for PCO 143. In a small study (24 women with PCOS, and 12 controls) by dynamic contrast-enhanced MRI of the ovaries, the time to peak enhancement was found to be lower in the PCOS-group than in controls 241. On the other hand, the early-phase enhancement rate, and percentage of washout at 5 minutes after contrast administration were higher in PCOS patients. Examination of the mean signal intensity-time curve revealed that the ovaries in women with PCOS had a faster and greater enhancement and washout 241.
Left-right
As the ovary is a paired organ, the question is which side, or both, should be evaluated when used in the diagnostic criteria of PCOS. According to the 2003 Rotterdam consensus, only one ovary fitting the criteria is sufficient to establish the presence of PCO. In most studies, no significant morphologic difference between the left and the right ovary on a population basis has been found, and the mean or median values between both ovaries per individual have been used for statistical analysis and presentation. This includes the referenced studies in the article presenting the Rotterdam consensus 131, as described. In a clinical situation, women examined with TVUS for detection of PCO may present an AFC close to (below or above) twelve and an ovarian volume close to (below or above) 10 ml in each ovary. The mean of the left and right ovary may not exceed the cut-off values, but the left or right ovary may do so individually. Thus, there may also in this aspect be a concern of an artificial inflation in diagnosing PCOS by the Rotterdam consensus.
Transvaginal ultrasonography
TVUS is the modality of first choice in clinical detection of polycystic ovarian morphology, because of its high performance, availability, cost-effectiveness, and patient friendliness. Regularly menstruating women should undergo scanning during the early follicular phase (cycle days 3-5) (Table 2). Oligo-amenorrhoeic women may be scanned at random, or between cycle days 3 and 5 after progesterone-induced bleeding. The presence of a dominant follicle (>10 mm) or a corpus luteum may

44 Henrik Leonhardt |
increase the ovarian volume above the 10 ml threshold, thus a repeat scan the next cycle is recommended 120, 242.
Magnetic resonance imaging
MRI, with its excellent soft tissue contrast resolution, is a useful non-invasive alternative modality to TVUS, for instance in adolescent and/or very obese women 161, 243. MRI has a high potential to objectively and reproducibly image PCO, and may therefore be suitable for research. There are numerous reports on MRI performance in evaluating ovarian lesions, but studies on MRI in normal 203, 204 or close to normal appearing ovaries, such as PCO 161, 244-246, are quite rare.
Ovarian disorders that may mimic PCOS
Ovarian stroma hyperplasia (OSH) is a non-neoplastic condition characterized histologically by nodular or diffuse proliferation of ovarian stroma. Ovarian hyperthecosis (OHT) represents a similar condition, in which stromal proliferation (deep cortical and medullary) is accompanied by nests of luteinized theca cells 247, 248. Both conditions are associated with increased ovarian production of androgens that may cause hirsutism, oligo-amenorrhea, obesity, hypertension and insulin resistance, thus may mimic PCOS 248, 249. However, these virilizing symptoms (apart from oligo-amenorrhea) may in OSH and OHT occur in postmenopausal women. This strongly points out that OHT is a distinct entity and not a late stage of PCOS, as was suggested by Hugheston 226. Most of the knowledge of these diseases is from case reports and the prevalence is unknown. Although TVUS and MRI case reports of OSH/OHT have described bilaterally enlarged ovaries with increased stroma, sometimes with a nodular appearance, OSH/OHT may occur as a microscopic process in normal-sized ovaries. However, imaging can be useful in the differential diagnosis between OHT and ovarian androgen-secreting tumors 247, 248, 250, 251.
Treatment of PCOS and resultant ovarial morphological features
A surgical method to promote ovulations in women with PCOS is to destroy ovarian androgen producing tissue by laparoscopic ovarian drilling with diathermy or laser. This minimally invasive therapy has only a limited damaging effect on the ovarian capsule and the superficial cortex (approximately 10 perforations per ovary), and this technique is thus not as volume reductive as the first established surgical method of ovarian wedge resection, which was abandoned because of the risk of postsurgical

| Introduction 45
adhesion formation 252. There is still a concern for adhesion formation after ovarian drilling and also for the long-term risk of reduced ovarian reserve, therefore the method should be used restrictively 119.
Wedge resection was replaced by medical ovulation induction with clomiphene citrate and gonadotrophins, stimulating follicle growth 16, 119, 253-256.
Combined estrogen-progesterone oral contraceptives is the most frequently used pharmacologic treatment for symptoms of PCOS 16. Oral contraceptives cause a decrease in ovarian volume and AFC, although it has been reported that the PCO appearance persists despite the use of oral contraceptives 120, 242, 257, 258.
The oral antihyperglycemic drug metformin results in reduced androgenicity, and increased frequency of follicular development and ovulation, in treatment of women with PCOS 259, 260. In a small study on insulin resistant and non-insulin resistant women with PCOS (n=5 in each group), a decrease of AFC after one week of metformin treatment was observed 261. However, in a larger study of obese women with PCOS (n=82), there was no change in the total ovarian volume or the AFC over an 8-month treatment period 259.
Pharmacological treatment is effective but may be associated with negative side effects. Many patients with PCOS and few clinical symptoms do not need active treatment, but maybe advice on lifestyle. A recent Cochrane review concluded that lifestyle interventions (diet, exercise, behavioral, or combined treatments) improve body composition, hyperandrogenism, and insulin resistance in women with PCOS 262. Even a small (2-5%) weight reduction leads to reduction in central fat, improved insulin sensitivity, and restored ovulation in overweight infertile women with PCOS 263. Physical exercise may improve insulin resistance independently of weight loss in women with and without PCOS 264.
Electro-acupuncture is emerging as a non-pharmacological treatment alternative, reducing hyperandrogenism and increasing menstrual frequency, superior to exercise, in women with PCOS 265-267.
In a rat model, electro-acupuncture and exercise improved ovarian morphology 268, as reflected in a higher proportion of healthy antral follicles, but so far there are no reports on human ovarian morphology effects of these non-pharmacological treatments.

46 Henrik Leonhardt |
PRESENT INVESTIGATION

| Aims 47
AIMS
General aims
The overall aim of this thesis was to elucidate how PCOS is associated with morphologic or dynamic changes in the ovaries, uterus, adrenals, and adipose tissue as assessed by MRI. In addition, the aim was to evaluate performance and reproducibility of MRI of ovarian morphology and uterine peristalsis.
Specific aims
Specific aims in Paper 1 - 4 (in numerical order) were to:
1. Characterize the distribution of abdominal adipose tissue of women with PCOS and controls matched pair-wise for age and BMI, and to identify factors associated with insulin sensitivity in PCOS. *
2. Assess whether women with PCOS have altered endometrial thickness, uterine wall morphology or uterine peristalsis.
3. Compare TVUS and MRI for estimation of ovarian volume and AFC, and to assess reproducibility and interobserver agreement of MRI measurements.
4. Investigate whether ovarian morphology, including AFC in different sizes down to 1 mm, discriminates women with PCOS from controls, and to elucidate associations between ovarian morphology and endocrine-metabolic variables including AMH.
*Adipocyte size, lipid metabolism, circulating adipokines, macrophage density, and serum sex steroids association with insulin sensitivity has been presented more thoroughly in the doctoral thesis by Louise Mannerås Holm 2010 1.

48 Henrik Leonhardt |
SUBJECTS AND METHODS
Ethics
All participants gave oral and written consent prior to inclusion. The study was performed in accordance with the Declaration of Helsinki, and it was approved by the Ethical Review Board in the Västra Götaland region.
Subjects
Women with PCOS and controls were recruited by advertising in the region. Recruited women were telephone-interviewed and asked to describe their medical history. Potential participants underwent a gynecologic examination including TVUS, to investigate their ovarian morphology.
Inclusion criteria for women with PCOS were ultrasonographic PCO morphology (12 or more 2–9 mm follicles or ovarian volume >10 ml, in at least one ovary) and clinical signs of hyperandrogenism (hirsutism, acne) and/or oligo-amenorrhea, according to the 2003 Rotterdam criteria 131. Hirsutism was defined as a Ferriman Gallwey score ≥8 269. Acne was determined by an affirmative answer to the question “Do you have excessive acne?”. Oligomenorrhea was defined as an intermenstrual interval >35 days and <8 menstrual bleedings in the past year. Amenorrhea was defined as absent menstrual bleeding or none in the past 90 days.
Exclusion criteria for all women were age <18 or >38 years, pharmacological treatment in the preceding 12 weeks (including hormonal contraceptives), pregnancy, breast feeding in the preceding 24 weeks, cardiovascular disease, diabetes or other endocrine disorders. Potential controls were excluded if they had evidence of PCO, excessive acne or hirsutism, or menstrual irregularities (cycles <28 days or >35 days).

| Subjects and Methods 49
This prospective cross-sectional study was conducted from November 2005 to September 2008, as part of a randomized controlled study on non-pharmacological treatment (electro-acupuncture versus physical exercise) in PCOS. Seventy-four women with PCOS and 31 controls were recruited. Of the 74 women with PCOS, 68 underwent MRI, as did all controls. Eight women with PCOS dropped out after randomization, before baseline serum samples were drawn. Thus, 60 women with PCOS and 31 controls were subjects for further analyses.
Summary of the methods
Anthropometry (Paper 1)
Body height, body weight, waist and hip circumferences, sagittal abdominal diameter, BMI, and waist-to-hip ratio were measured/calculated by standard protocols. Body height (nearest 0.5 cm) and body weight (nearest 0.1 kg) were measured in standing subjects wearing light clothing without shoes, and BMI was calculated as kg/m2. These measurements give information of the degree of adiposity and the general adipose tissue distribution, but they can not distinguish between abdominal subcutaneous and abdominal visceral fat. Therefore MRI was used for a more detailed analysis of body composition.
Ultrasonography (Paper 2-4)
The initial screening ultrasound examinations for inclusion were performed by two experienced gynecologists (A-KL and LN). The ovaries were evaluated transvaginally with a high frequency probe, using a HDI 5000 (ATL Ultrasound Inc, Bothell, WA) ultrasound machine. Ovarian volume was calculated according to a simplified formula for an ellipsoid (ovarian length x width x height x 0.5) 143 and the AFC was estimated in real-time counting follicles 2-9 mm in size in each ovary.
Included subjects were examined by a single experienced gynecologist (BG) on a later date with 2D/3D TVUS, using a Voluson 730™Expert (GE Healthcare, Zipf, Austria) with a multi-Hz vaginal transducer. The ultrasound examination included a 2D assessment of the inner genitals, followed by acquirement of 3D data sets of the

50 Henrik Leonhardt |
ovaries. The 3D data was stored and later evaluated on a workstation. The imaging examinations were performed periovulatory in controls, aiming at days 11–17 of the menstrual cycle, in order to coincide with the time when peristalsis is expected to be most active. Since most women with PCOS had oligo-amenorrhea, the examination day was chosen independently of cycle day.
Endometrial thickness was measured in the midsagittal plane, including both layers at the thickest point. The ovarian volume was calculated as ovarian length x width x height x 0.523. The thickness of the ovarian peripheral rim zone was measured by electronic calipers. The stromal echogenicity was visually estimated and categorized using a five-level scale from low to high. Stromal vascularity was assessed using color-Doppler and visually estimated and categorized using a five-level scale from hypo to high. The number of follicles in the size intervals 1-3, 4-6, 7-9, 10-12, 13-15, 16-18, 19-21, and
(Sono-Automatic Volume Calculation, GE Medical Systems), as described 270-272.
Magnetic resonance imaging (Paper 1-4)
In the study, MRI was used as a multipurpose acquisition technique with collection of volumetric (abdominal fatty tissue compartments, ovary), morphologic (uterine zonal anatomy, ovarian morphology) and dynamic (uterine peristalsis on cine MRI, ovarian perfusion on dynamic contrast enhanced MRI) data. In addition, the adrenal glands were visually evaluated on dedicated MRI sequences in all subjects, but no adrenal mass lesions or hyperplasia were found and these results are not further presented in this thesis.
All MRI examinations were performed with a 1.5-Tesla clinical MRI-scanner (Intera; Philips Medical Systems, Best, The Netherlands) at the Sahlgrenska University Hospital, immediately after the 2D/3D TVUS examination. The MRI images were quality controlled and evaluated by a radiologist (HL) with, by that time, ten years experience of abdominal and pelvic MRI.
MRI provides good tissue contrast and high resolution without exposing the subject to any harmful ionizing radiation. MRI is a validated method for accurately measuring the amount of adipose tissue in the subcutaneous and intra-abdominal compartments 57, 273, 274. Manual analysis of adipose tissue from MRI data is time-consuming and subject to investigator bias. In Paper 1, we used a fully automated algorithm for the

| Subjects and Methods 51
quantification of total, visceral and subcutaneous adipose tissue from abdominal MRI, as described 57. A transaxial multi-slice T1-weighted GE acquisition, consisting of 16 10-mm sections without gaps, centered at the L4–L5 intervertebral disk level, was performed during breath hold. The TR was 129 msec, TE 4.6 msec, flip angle 80 degree, and total acquisition time 16.1 seconds. The whole-body coil was used for signal transmission and reception.
For uterine and ovarian morphologic imaging, pelvic multi-slice T2-weighted turbo spin-echo (TSE) acquisitions were obtained in transaxial, sagittal, and coronal planes (transaxial; TR 3700-4500 msec, TE 120 msec, flip angle 90˚, field of view 230 mm, slice thickness 4 mm, gap 1 mm, matrix 352 x 352) using a phased-array pelvic coil.
MRI data were transferred to a workstation (Centricity Workstation Radiology RA 600; GE Healthcare, Buckinghamshire, UK). T2 signal intensity of the uterine internal structures and ovarian stroma was compared to gluteal muscle, which has low signal intensity. The maximum thickness of the anterior and posterior uterine wall, the junctional zone, and the endometrium from wall to wall, was measured in the midsagittal plane of the uterus (Figure 12). The thickness of the peripheral rim with low signal intensity on T2-weighted images of the ovaries was measured by electronic calipers (Figures 8 and 16). All visible (antral) ovarian follicles were manually counted in at least two planes and categorized to size-intervals; 1–3, 4–6, 7–9, 10–12, 13–15, 16–18, 19–21, and ≥22 mm. Distribution of follicles was defined to be peripheral if the vast majority of follicles were peripherally located in the ovary with none or only a few (<5) in the center, otherwise defined as either central or diffuse. The size of an individual follicle was estimated as the mean of the two largest orthogonal diameters in one plane. Ovarian volume was calculated by the equation ovarian length x width x height x 0.523, using electronic calipers to mark the largest diameters on images obtained in orthogonal planes, referred to as 2D MRI. The outer border of the ovary was manually outlined by a caliper in the maximal plane section and then the total ovarian area (A) was assessed semi-automatically, as described by Fulghesu et al 219 (Figure 13). In the same section, the stroma was outlined to obtain the stromal area (S). The S/A ratio was calculated. For measurement of ovarian stromal signal intensity and perfusion, pelvic fat-saturated T1-weighted high-resolution isotropic volume (THRIVE) gradient-echo sequences (TR 3.6 msec, TE 1.8 msec, flip angle 10˚, field of view 370 mm, slice thickness 4 mm with 2 mm overlapping, matrix 256 x 256) were performed in the transaxial plane before and 30 seconds, 1, 2, 3, 4 and 5 minutes after rapid intravenous injection of a Gadolinium-based contrast agent (gadopentetate

52 Henrik Leonhardt |
dimeglumine, 469 mg/ml, Schering AG, Berlin, Germany) at a dose of 0.2 mmol per kg of bodyweight. Stromal signal intensity before and after administration of contrast medium was measured by placing an ellipsoid region of interest, as large as possible in the center of each ovary predominantly without antral follicles (Figure 14).
a b
Figure 13. T2-weighted TSE scans in the coronal plane. In (a), the outer border in the largest plane section of the left ovary is manually outlined to measure the total cross-sectional area A. In (b), the stroma S is outlined in the same maximal section. The areas are then calculated automatically by the workstation´s software, and the S/A ratio can subsequently be calculated.
Figure 12. T2-weighted TSE MRI scan through the midsagittal plane of the uterus. The 20.74 mm measurement in the uterine center is obtained in the thickest part of the endometrium, from inner wall to the opposite inner wall, approximately halfway between isthmus and fundus. The 19.13 mm measurement is the thickness of the anterior wall of the corpus uteri. The 5.22 mm measurement is the thickness of the junctional zone in the posterior uterine wall.

| Subjects and Methods 53
MRI data were also transferred to another workstation (Advantage Windows Analysis Station; GE Healthcare), allowing semi-automatic volume estimates. The peripheral border of the ovary was outlined by a caliper in the transaxial plane in each slice containing ovarian tissue. By use of the workstation´s semi-automatic software utilizing a seeding procedure, total ovarian volume was then obtained (Figure 14). The volumes of cysts larger than 2 cm were calculated in the same way, then subtracted from the total ovarian volume in these cases. By manually adjusting the threshold limit of signal intensity, fluid filled follicles were maximally visualized with minimal artifacts. The settings are arbitrary and must be determined for each data set. Following determination of the appropriate threshold limit, the number of voxels with signal intensity above this limit was automatically calculated allowing determination of total follicle volume (Figure 15). Total stromal volume was calculated by subtracting total follicle volume from ovarian volume. These 3D data were obtained by a medical student, after initial training and subsequent supervision by an experienced specialist (HL) for quality control.
Figure 14. Dynamic T1-weighted fat-suppressed GE sequences before and during intravenous injection of Gadolinium-based contrast medium. Signal intensity is assessed by placing a region of interest in the ovarian stroma. The workstation´s software can present the increase and steady-state/decline of signal intensity graphically as shown.

54 Henrik Leonhardt |
a b c
Figure 15. T2-weighted MRI scan in the transaxial plane. The outer border of the polycystic ovary is manually outlined in (a). This is completed in every section of the ovary visible, and the computer software “dissects” it from the surrounding tissue and calculates the total volume (b). By manually adjusting the threshold limit of signal intensity, fluid filled follicles are maximally projected and total follicle volume can be estimated (c).
For cine imaging of uterine peristalsis, a half-Fourier acquisition single-shot turbo spin-echo (HASTE) sequence (TR 3000 msec, TE 90 msec, field of view 300 mm, slice thickness 5 mm, matrix 640 x 640) was performed every 2 seconds and repeated, so that 60-90 serial images were obtained over 2-3 minutes in the midsagittal plane of the uterus. Peristalsis was visually evaluated in a fast cine-mode with notation of the peristaltic frequency (waves/min), strength (strong, intermediate, or weak amplitude), pattern (stripping movement and/or wave conduction) and direction.
For test of intraobserver agreement of perception of peristalsis, AFC in the different size intervals and measurement of ovarian volume, the MRI images of 15 randomly selected women (10 PCOS, 5 controls) were re-evaluated by the same observer (HL) after one year in order to avoid recall-bias, blinded to the first set of measurements. For estimation of interobserver agreement, these examinations were independently and blindly evaluated by other radiologists, as described in Paper 2 and Paper 3 respectively.
Biochemical analyses (Paper 1 and 4)
Blood samples were drawn in the morning following an overnight fast and stored at -80˚ C. In controls, the samples were obtained during the early follicular phase (days 1–7 of the menstrual cycle) to match the hormonal milieu of PCOS subjects and to

| Subjects and Methods 55
avoid the preovulatory estrogen rise. In women with PCOS, blood samples were drawn independently of cycle day since the majority of these women had oligo-amenorrhea. For logistic reasons, the imaging examinations were not performed the same day as the serum sampling.
The technical details and the assessed levels of hormones and sex steroids are described elsewhere 81 and in Paper 1. In brief, testosterone was measured by gas chromatography/mass spectroscopy (limit of detection, 0.02 ng/ml), and sex hormone binding globulin (SHGB) was analyzed by chemiluminescent microparticle immunoassay. Taking the concentrations of total testosterone and SHBG into account and assuming a fixed albumin concentration of 43 g/l, we calculated free testosterone as recommended in the 2003 Rotterdam consensus 131, 275. The serum concentrations of AMH were measured by the enzyme immunoassay AMH-EIA (Immunotech Beckman Coulter Company, Marseille, France).
Insulin sensitivity (Paper 1 and 4)
Plasma glucose was measured at 37°C with an enzymatic photometric method (Roche Diagnostics, Mannheim, Germany). Serum insulin was measured with an immunometric two-step sandwich method and chemiluminescence (Advia Centaur Insulin ReadyPack; Bayer HealthCare, Tarrytown, NY).
The euglycemic hyperinsulinemic clamp and homeostasis model assessment (HOMA) was used to assess insulin sensitivity as previously described 276, 277. For logistical reason, 23 of 60 women with PCOS and one control did not undergo clamp evaluation. Simple regression analysis revealed that logHOMA was strongly associated with clamp-derived glucose disposal rate (GDR) (mg/kg x min) and could therefore be predicted for these participants 276, 277.
Statistical analyses (Paper 1-4)
Most statistical analyses were conducted with PASW Statistics (version 18.0 for Windows; SPSS Inc, Chicago, IL). Values are presented as mean ± SD, or median and range if skewed. P <0.05 was considered statistically significant.
In Paper 1, the controls were matched pairwise to 31 women with PCOS by age (±5 years) and BMI (±2 kg/m2), one pair missing MRI data. The matching resulted in a

56 Henrik Leonhardt |
non-negative correlation between the value of the women with PCOS, on any variable, and the corresponding value of her control. We therefore used paired t test for the comparisons between the BMI- and age-matched cases and controls. To identify the relative independent determinants of insulin sensitivity in women with PCOS (n=74), linear regression analyses were performed with GDR as the dependent variable and MRI-estimated abdominal adipose tissue volumes, anthropometric variables, and other variables related to adipose tissue and sex steroids as covariates. All variables were skewed, except age, height and adipocyte volume, and underwent transformation before statistical analysis. We applied the transformation Φ-1(F(x)) to transform continuous variables to normally distributed variables, where Φ-1 was the inverse of the standardized normal distribution function and F was the empirical distribution function (statistician A.O). That transformation yielded an almost perfect normal distribution, which was not the case for logarithm transformation.
In Paper 2, differences between groups were analyzed with Mann Whitney test and logistic regression adjusting for age and BMI. Fisher´s exact test was complementarily used when necessary, i. e. when the dependent variable was present in all subjects and logistic regression not applicable. Intraobserver and interobserver agreements were assessed with estimation of the Kappa coefficient.
In Paper 3, differences between MRI and TVUS measurement were determined by Wilcoxon signed ranks test. Correlation coefficients were assessed by Spearman´s rho. Mean differences between measurements and 95% (2 x SD) intervals on either side of the mean as limits of agreement, were calculated for comparisons and presented as Bland-Altman plots 278. Intraobserver and interobserver agreements were estimated by intraclass correlation coefficients (ICC) [2, 1], which is a two-way random single measures analysis of variance (ANOVA) model with absolute agreement. An ICC coefficient of 0.5 usually represents a moderate agreement, a value of 0.7 is considered a good agreement and above 0.8 a very good agreement.
In Paper 4, differences between groups were analyzed with the Mann Whitney test and logistic regression adjusting for age and BMI. Categorical estimations of ovarian stromal echogenicity and vascularization were tested for trends in contingency. Correlation coefficients between ovarian morphologic parameters and endocrine data were determined by the non-parametric Spearman´s rho. The relative independent effect of endocrine-metabolic variables on ovarian morphology was determined by linear regression analyses (enter) with AMH, free testosterone, and GDR as well as

| Subjects and Methods 57
age and BMI as covariates. The predictive values of ovarian morphology, AMH, free testosterone, and GDR for PCOS were determined by logistic regression with adjustments for age and BMI. Receiver operating characteristic (ROC) curves were constructed to examine diagnostic accuracy (i.e. the ability to discriminate between PCOS and controls) represented by the area under the curve (AUC).

58 Henrik Leonhardt |
SUMMARY OF RESULTS
Results in detail are presented in Paper 1-4 in this thesis. Here, the results are presented in brief, together with a few results not published elsewhere.
Paper 1
Women with PCOS had markedly higher levels of serum testosterone, free testosterone, and free 17β-estradiol, lower levels of serum SHBG, and lower insulin sensitivity. Abdominal adipose tissue volumes/distribution did not differ between the groups, but women with PCOS had higher waist-to-hip ratio, enlarged adipocytes, reduced adiponectin, and lower lipoprotein lipase activity. In regression analyses, adipocyte size, adiponectin, and waist circumference were the factors most strongly associated with insulin sensitivity in PCOS (R2 = 0.681, P < 0.001).
Paper 2
MRI was performed in 60 women with PCOS and in 31 controls, while TVUS data were obtained in 57 women with PCOS and in 30 controls. Two women in the PCOS group became pregnant shortly after inclusion and before all examinations were completed, and were therefore excluded from further analyses. In five individuals an intrauterine device was identified, and these subjects were excluded from this analysis since the device could have a potential effect on uterine peristalsis 113, 279. In one woman with PCOS, peristalsis was not possible to evaluate due to disturbing bowel movements.
The endometrium was thinner in PCOS with oligo-amenorrhea compared to controls, also after adjustments for age and BMI (adjusted P = 0.043). There was no difference in thickness of the junctional zone or the myometrium in cases versus controls.

| Summary of Results 59
Uterine peristalsis was less commonly observed in women with PCOS than in controls (adjusted P = 0.014).
Paper 3
Ninety-nine women were included (60 PCOS, 31 controls, and 8 subjects who were imaged but excluded in the case-control studies as described). In each subject two ovaries were visualized by MRI. Two ovaries on the left side, and one ovary on the right side, were not visualized by 2D/3D TVUS, and for technical reasons 2D TVUS data were not available for a further 9 ovaries and 3D TVUS data were missing in 26 ovaries. Thus, in total 186 ovaries were available for comparison of ovarian volume estimation by 2D TVUS and 2D/3D MRI. However, in 14 ovaries, partly exophytic cysts 20 mm or larger were found, and these non-ellipsoid ovaries were excluded from calculation of ovarian volume, thus 172 ovaries remained for volume analyses. In total, 169 ovaries were available for comparison of follicle counts by 3D TVUS versus 2D MRI.
Ovarian volume
The mean ovarian volume assessed by the reference standard 2D TVUS (13.1 ± 6.4 ml) was larger than assessed by 2D MRI (9.6 ± 4.1 ml) and 3D MRI (11.4 ± 4.5 ml) (P <0.001). The correlation between 2D TVUS - 2D MRI and 2D TVUS - 3D MRI was high (r=0.70 and r=0.75 respectively), and very high between 2D MRI - 3D MRI (r=0.87).
Antral follicle count
The total AFC was higher assessed by 2D MRI (median 33, range 12-102 follicles) than by 3D TVUS (median 22, range 3-110), with a mean difference of 14.3 ± 16.2 (P <0.001). The most prominent difference between 2D MRI and 3D TVUS was observed in the smallest size interval of 1-3 mm with a mean difference of 22.2 ± 17.6 (P <0.001), although all size intervals differed between the methods except for follicle size ≥19 mm. The total AFC by 2D MRI and 3D TVUS was strongly correlated, with a correlation coefficient of 0.66.
60 Henrik Leonhardt |
Reproducibility and interobserver agreement of MRI measurements
The intraobserver agreements for MRI measurements of ovarian volume and AFC, respectively, were very good, with ICC coefficients exceeding 0.86, apart from AFC in size interval 7-9 mm. The interobserver agreements for MRI measurements of ovarian volume were very good (ICC coefficient 0.98), and for total AFC good (ICC coefficient 0.77), but inconsistent in the smaller size intervals.
Paper 4
Cases (n=58) and controls (n=31) were comparable in age and BMI (Table 1 in Paper 1). MRI showed cysts ≥20 mm in 12 of 178 ovaries and 10-19 mm large follicles in 41 ovaries. Ovarian follicle distribution
The proportion of predominantly peripheral follicle distribution in the PCOS group was 98% and in the control group 97% assessed by MRI, and these proportions were 84% and 86% assessed by TVUS. Stromal signal intensity/echogenicity and vascularity
At MRI, all ovaries were visually evaluated to show a slightly high stromal signal intensity on T2 weighted sequences. There were no differences in stromal signal intensity or perfusion between the PCOS group and the control group as measured by MRI (Table 2 in Paper 4). At TVUS, stromal echogenicity was somewhat higher in PCOS compared to controls (P<0.001), presented in Table 3. There was a trend of stromal vascularity to be somewhat higher in PCOS compared to controls visually evaluated by color Doppler TVUS, however not significant (P=0.072), presented in Table 4.

| Summary of Results 61
The peripheral rim
With MRI, a peripheral ovarian rim zone not exceeding 2 mm in thickness with low signal intensity on T2-weighted images was observed in all subjects with no difference between women with PCOS and controls. The corresponding peripheral rim observed by TVUS in the majority of ovaries measured mean 0.5 mm and there was no difference in thickness between the groups.
Table 3. Test for trend in contingency table of stromal echogenicity evaluated by ultrasonography. Visual strength of echogenicity
PCOS (n=51)
Controls (n=29)
Low 1 (2.0) 2 (6.9) Slightly low 14 (27.5) 23 (79.3) Intermediate 28 (54.9) 3 (10.3) Slightly high 8 (15.7) 1 (3.4) High 0 (0.0) 0 (0.0) P <0.001 Column values are numbers of individuals, percentage of the total number in each group within parenthesis.
Table 4. Test for trend in contingency table of stromal vascularity evaluated by color-Doppler ultrasonography. Visual strength of stromal vascularity
PCOS (n=51)
Controls (n=29)
Hypo 5 (9.8) 1 (3.4) Normal 9 (1.8) 15 (51.7) Slightly hyper 21 (41.2) 10 (34.5) Moderately hyper 14 (27.4) 2 (6.8) Hyper 2 (3.9) 1 (3.4) P = 0.072 Column values are numbers of individuals, percentage of the total number in each group within parenthesis

62 Henrik Leonhardt |
Predictors of PCOS
The number of antral follicles assessed by MRI (especially 1-3 mm follicles), ovarian volume, ovarian stromal volume, ovarian total cross-sectional area, AMH, free testosterone, and GDR differed significantly between women with PCOS and controls. In a multivariate approach using regression analyses and ROC analyses, AFC and free testosterone were the best variables to distinguish women with PCOS from controls, with high accuracy. AMH had a strong positive correlation to AFC, but was not independently associated with PCOS.

| Discussion 63
DISCUSSION
In this Discussion section I have chosen to discuss some specific results in the thesis, accompanied with discussion in a broader context. Other results and limitations are discussed in the Papers.
The main findings of the present thesis
• Abdominal adipose tissue volumes in PCOS (total, subcutaneous, and visceral) are indistinguishable from those in controls matched for age and BMI.
• The endometrium is thinner in PCOS with oligo-amenorrhea compared to controls.
• Based on MRI, uterine peristalsis is less commonly observed in women with PCOS than in controls.
• 2D MRI reveals more antral follicles, especially of small size, than 3D TVUS. • Ovarian volume estimation by MRI provides smaller volumes than by the
reference standard 2D TVUS. 3D MRI provides volumes closer to 2D TVUS values than does 2D MRI.
• Reproducibility and interobserver agreement of 2D MRI measurements of ovarian volume and AFC are good.
• The number of antral follicles assessed by MRI (especially 1–3 mm follicles), ovarian volume, ovarian stromal volume, ovarian total cross-sectional area, AMH, and free testosterone are increased in women with PCOS compared with controls, adjusted for age and BMI.
• Of the tested variables, AFC and free testosterone were the best variables to distinguish women with PCOS from controls. AMH is not independently associated with PCOS.
Abdominal adipose tissue in PCOS
It has long been believed that women with PCOS have a predominantly abdominal/visceral fat distribution, independent of BMI. The typical android body fat distribution could partly explain the metabolic disturbances, including insulin

64 Henrik Leonhardt |
resistance, often observed in women with PCOS. When the first MRI study on this issue was published in 2008, it was somewhat surprising that no difference in abdominal/visceral body fat distribution between women with PCOS and controls matched for BMI and fat mass was found 161. However, the women in the study were not matched for age, which is a well-known covariate for weight and fat distribution. The second MRI study published was the present study described in Paper 1. Although a higher waist-to-hip ratio and enlarged mean adipocyte size in women with PCOS were demonstrated, there were no differences in abdominal fat tissue volumes or distribution between women with PCOS and controls pair-wise matched for age and a wide range of BMI. Notably, there was a clear tendency to more visceral fat in women with PCOS, perhaps significant if the sample size had been larger or if the examined compartment of the abdomen (16 cm at the L4-L5 interface) had been wider. It remains to analyze if lean (BMI ≤25) women with PCOS have more visceral fat than lean controls. Endometrial thickness in PCO
After Paper 2 was accepted for publication, another study on endometrial thickness assessed by TVUS in PCOS was published 87. In contrast to our results, this study demonstrated increased endometrial thickness throughout a menstrual cycle (basal = cycle days 3-5, mid-cycle = days 12-14, and late luteal phase = days 24-28) in 58 oligoovulatory infertile patients with PCOS, when compared to an age- and BMI-matched control group of 62 infertile patients without PCOS. Obese (BMI >30) women had been excluded. In our study, a thinner endometrium was found in PCOS with oligo-amenorrhea compared to controls, also after adjustment for age and BMI, independent of measurements assessed by TVUS or MRI. The main differences between the PCOS-groups in these two studies are that we included women with anovulation and also obese women. However, in theory, a larger proportion of individuals with chronic anovulation in the PCOS-group would be expected to result in thicker endometrium. Half of our controls were examined during the periovulatory period within cycle days 11–17, when endometrial thickness is expected to be near maximum, which may have contributed to our unexpected result. When performing subanalysis of PCOS with oligo-amenorrhea compared with controls examined outside cycle days 11–17, the endometrium remained thinner in the PCOS group (P = 0.034), but the result was not significant after adjusting for age and BMI (adjusted P = 0.088) assessed by MRI. However, the question why the endometrium

| Discussion 65
was not found to be thicker in PCOS with oligo-amenorrhea remains to be answered. Maybe the most appropriate cycle phase of controls to be compared to oligo-amenorrhoeic PCOS is the follicular (=proliferative) phase. Only 6 out of the 28 controls were examined in the follicular phase, and we judge that these are too few for a meaningful comparison with the 41 oligo-amenorrhoeic PCOS. Thus, our results on endometrial thickness in PCOS must be interpreted with caution.
Uterine peristalsis in PCOS
Uterine peristalsis is believed to be of importance for female fertility, possibly promoting sperm transportation and embryo implantation 97, 99, 110. Disturbed peristalsis may be a contributing factor of infertility, which can be studied by cine MRI.
Uterine peristalsis has been studied in females with various conditions, such as endometriosis and uterine fibroids 103, 106, 112, 117, 280, 281. To our knowledge, this is the first study to investigate peristalsis in PCOS. We observed peristalsis less often in women with PCOS compared to controls. Estrogen has been observed to stimulate uterine peristalsis 107, 111. Considering the relatively high levels of circulating estradiol in PCOS 81, we expected a high peristaltic activity in women with the syndrome. Our findings, i.e. less detectable peristalsis in PCOS, was in this regard unexpected. However, the abnormal hormonal and metabolic milieu in PCOS, with oligo-amenorrhea in many cases, may offer alternative hypotheses. Our findings of reduced presence of peristalsis in PCOS, also in ovulating women with PCOS, may be an additional explanatory factor for infertility in these women.
Some studies in humans indicate that it may be possible to intervene positively or negatively with peristalsis pharmacologically 102, 104, 105, 111, 113, 114, 116, 282. This may have the potential to affect implantation and live birth rate for subfertile women, or outcome of IVF. It would have been interesting to investigate if the disturbances of peristalsis in PCOS are related to endocrine variables in our population. Indeed, we did perform regression analyses to investigate contribution of age, BMI, and sex hormone parameters to variation in occurrence of peristalsis in the PCOS group, and found that free estradiol displayed a positive association with occurrence of peristalsis in women with PCOS (beta standardized coefficient = 0.27, adjusted determination coefficient R2 = 0.06, P = 0.047), but the association was not statistically significant in
66 Henrik Leonhardt |
the subgroup of PCOS with oligo-amenorrhea. When adding endometrial thickness into the analyses, the results were unchanged. However, these results can be questioned, because serum samples were not drawn the same day as the MRI examinations and estrogen levels are known to vary during the menstrual cycle 283. Thus, we have chosen not to publish these results in Paper 2.
Presuming uterine peristalsis in oligo-amenorrhoeic patients resembles uterine peristalsis in the proliferative phase of a normal menstrual cycle, it may have been more relevant to compare women with PCOS and amenorrhea to controls in the follicular phase. As mentioned, only 6 controls were examined in the follicular phase, thus too few for a reliable analysis. The rationale of examining the controls in the periovulatory phase was to optimize the chance to detect this subtle motion when peristalsis is expected to be most active and mainly directed cervicofundal. Based on previous observations that circulating estradiol levels are higher in women with PCOS than in controls 81, we hypothesized that peristalsis would be increased in PCOS and thus appropriate to be compared to controls in the periovulatory phase with high peristaltic activity. However, our finding in Paper 2, i.e. less detectable peristalsis in PCOS, was in this regard unexpected. Thus, our recommendation for a future study design on this issue is to compare amenhorrhoeic PCOS with controls in the follicular phase, when peristaltic activity is known to be present, although not at maximum.
Anticholinergic agents are known to suppress uterine peristalsis and myometrial contractions, in addition to bowel movements, and are commonly used in pelvic MR imaging to improve image quality 116. In paper 2, despite performing the MRI examinations without the use of antiperistaltic agents, the image quality was overall good and uterine morphology/pathology was possible to evaluate in all subjects. In paper 2, only one subject was excluded because of disturbing bowel motion, making it impossible to evaluate the peristalsis. All ovaries were visualized with no significant interpretation-interfering motion artifacts in Paper 3 and 4. Thus, pelvic MRI may be performed with good image quality without the injection of these drugs, saving time, costs and potential adverse events. In fact, this experience has changed our institute´s routines for female pelvic MR imaging and we do not in general administrate antiperistaltic drugs any longer.

| Discussion 67
Ovarian morphology
A thickened and fibrotic ovarian surface tunica has been described in patients with PCOS 133, 226. In our population, an ovarian peripheral rim not exceeding 2 mm in thickness was observed by MRI and TVUS, with no difference between women with PCOS and controls (Figures 8, 9, and 16). In some cases this rim was found to be of high signal on T2-weighted images on the side of the ovary opposite to the read-out direction, indicating that the finding may be partly due to chemical shift artifacts (Figure 17). However, it could still be observed on fat suppressed GE MRI sequences with no distinct difference in signal intensity or contrast enhancement compared to stroma (Figure 16). Thus, it probably represents the peripheral cortex with its densely packed primitive follicles. In our experience, it is not possible to clearly distinguish between the ovarian “tunica”, cortex or medulla with MRI or TVUS and the imaging nomenclature should therefore rather be the stroma, defined as the entire ovarian tissue apart from the follicles or other identifiable focal structures such as a corpus luteum, until refined imaging techniques are able to better differentiate separate histological or anatomical tissues or layers.
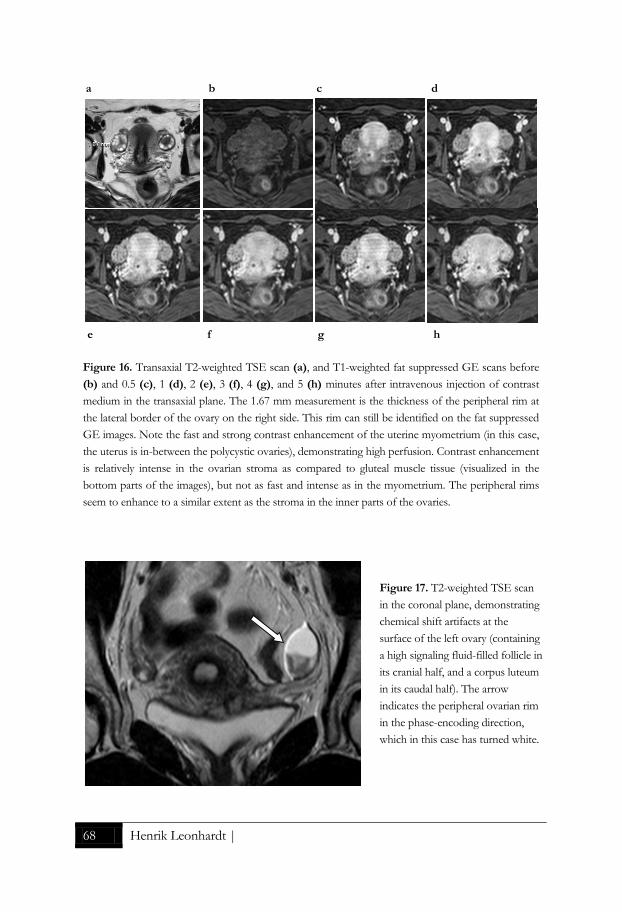
68 Henrik Leonhardt |
a b c d
e f g h
Figure 16. Transaxial T2-weighted TSE scan (a), and T1-weighted fat suppressed GE scans before (b) and 0.5 (c), 1 (d), 2 (e), 3 (f), 4 (g), and 5 (h) minutes after intravenous injection of contrast medium in the transaxial plane. The 1.67 mm measurement is the thickness of the peripheral rim at the lateral border of the ovary on the right side. This rim can still be identified on the fat suppressed GE images. Note the fast and strong contrast enhancement of the uterine myometrium (in this case, the uterus is in-between the polycystic ovaries), demonstrating high perfusion. Contrast enhancement is relatively intense in the ovarian stroma as compared to gluteal muscle tissue (visualized in the bottom parts of the images), but not as fast and intense as in the myometrium. The peripheral rims seem to enhance to a similar extent as the stroma in the inner parts of the ovaries.
Figure 17. T2-weighted TSE scan in the coronal plane, demonstrating chemical shift artifacts at the surface of the left ovary (containing a high signaling fluid-filled follicle in its cranial half, and a corpus luteum in its caudal half). The arrow indicates the peripheral ovarian rim in the phase-encoding direction, which in this case has turned white.

| Discussion 69
In theory, the stromal portion of the ovary in PCOS will become larger with premenopausal ageing, when the excessive follicle maturation and subsequent atresia yields additional stroma 226. Obesity is likely to increase ovarian volume, including stroma, and since women tend to increase their weight with age, it should be taken into consideration 170. In a subanalysis of the PCOS group in our population, stratifying these women into one group younger than 30 years of age (n=32) the other group ≥30 years (n=26), there was, however, no difference in ovarian size. The mean S/A-ratio in the younger group was 0.35 ± 0.10, in the older group 0.39 ± 0.09, but the difference was not significant in our relatively small sample (P=0.094), and definitively not when BMI was included as a covariate in a logistic regression analysis (adjusted P=0.257).
Diagnostic tests
Evaluation of research depends on complete and accurate reporting. In 2003, The Standards for Reporting of Diagnostic Accuracy (STARD) steering group published a consensus 25-item checklist, to improve the accuracy and completeness of reporting of studies of diagnostic accuracy, to allow readers to assess the potential for bias in the study and to evaluate its generalizability 284. In context, this checklist is intended to improve quality of reporting the level of agreement, i.e. diagnostic accuracy, of a new potential index test compared with an established reference standard. Diagnostic accuracy can be expressed in many ways, including sensitivity and specificity, likelihood ratios, diagnostic odds ratio, and the area under an ROC curve. Of these, ROC curves provide the most comprehensive description 285. If the reference standard is close to 100% accurate, which is rarely the case, it may be defined as the gold standard. The STARD guidelines have to some extent been criticized to mainly focus on one test isolated from other information (a diagnose is very seldom univariate), and to not clearly enough distinguish between explorative and confirmative studies 286.
Our studies on reproducibility, agreement and diagnostic accuracy (Paper 3 and 4) should be regarded as explorative.

70 Henrik Leonhardt |
In Paper 3, the reference standard of ovarian volume estimation by 2D TVUS was compared to the index tests 2D MRI and 3D MRI. Lacking the reference standard of AFC assessed by 2D TVUS, we could only compare the index tests 3D TVUS and 2D MRI for AFC. However the 3D TVUS method of AFC has been compared to the reference standard 2D TVUS in a previous study 271. In a concluding remark (Paper 3), we suggest that in research settings with high demands on methods for analysing ovarian morphology in detail, MRI should be the modality of first choice. However, since MRI is less available and more expensive compared with TVUS, the latter modality may be the only option in many study settings and its lower precision in follicle counting could possibly be compensated by increasing the sample size. How much larger sample size would be needed can be calculated statistically in advance, using the correlation coefficient(s) in Table 3, Paper 3.
In Paper 4, we have compared a group of women with known PCOS with a group of healthy controls, and explored associations between ovarian morphology, AMH, free testosterone, and GDR and the possible role of all these variables in the diagnosis of PCOS. We found that AFC and free testosterone were the best variables to distinguish cases from controls, with high sensitivity and specificity in the ROC analyses. In clinical praxis, a test is used when there is a suspicion of a condition, and then the diagnostic accuracy is expected to be lower, so called spectrum bias 286. However, our results can be regarded as an indicator of the potential of these predictors. As MRI is unlikely to be used in routine clinical practice, we have not suggested a cut-off level of AFC based on this technique. Simple and reliable tests for free testosterone and insulin resistance are not available in routine health care today, but may be so in the future. Considering recent technical development of imaging and assay procedures, further validation or re-evaluation of the diagnostic criteria for PCOS, including threshold levels of AFC, serum AMH, and serum free testosterone are needed.
AMH correlates strongly with AFC. In our population mean serum levels of AMH were nearly three-fold higher in the PCOS group (90.0 ± 65.2 pmol/l) compared to controls (33.1 ± 16.7 pmol/l), both groups being similar in age and BMI. In contrast to other potential predictors of PCOS, such as progesterone, estrogen, testosterone, FSH or LH, the intracycle variation in AMH levels has been reported to be of no significance 287, 288, but this may be a matter of debate 289, 290. With the AMH Generation II assay (Immunotech Beckman Coulter), AMH measurement has become more standardized and widespread 291. AMH is used to measure ovarian

| Discussion 71
reserve, with many fertility clinics now routinely assaying AMH before IVF treatment 187, 193. Further, AMH has been proposed to replace AFC in the current classification of PCOS 169. However, it has to be considered that AMH is likely to show covariation with other variables. As described in Paper 4, we found that PCOS is not independently associated with AMH, and in multivariate logistic regression analysis PCOS was independently associated with AFC and free testosterone, but not with AMH. Therefore, we believe that AFC will defend its position as a diagnostic criterion of PCOS. If it can be replaced by AMH in the future remains to be proven in confirmative studies considering covariance with other variables, and if so, an international consortium should first validate the threshold level for AMH. Intraclass correlation
The ICC is a descriptive statistic used to assess the amount of measurement errors, i.e. a reliability index. A common application is the assessment of consistency of measurements made by different observer on the same quantity; interobserver agreement, using ANOVA to estimate variance plus error. ICC can also be used to describe reproducibility, or intraobserver agreement, i.e. comparisons between observations made by a single observer on the same quantity at different time points, the period between the observations being long enough to reduce the risk of recall-bias. For categorical data, such as if uterine peristalsis is detected or not, the Cohen´s kappa statistic can be used to assess inter- or intra-observer agreement.
The ICC coefficient provides a scalar measure of agreement or concordance between the observers. The value 1 represents perfect agreement, and 0 represents no agreement at all. Any value below 1 means that the agreement is not perfect, but there is no universally accepted guideline on interpretation of the magnitude of the ICC coefficient. One suggestion of interpretation is the following: from 0-0.2 indicates poor agreement: 0.3-0.4 indicates fair agreement; 0.5-0.6 indicates moderate agreement; 0.7-0.8 indicates strong agreement; and >0.8 indicates almost perfect agreement. There are numerous versions of ICC (6 options in SPSS, as listed in Table 6) that can give quite different results when applied to the same data. Based on rater reliability design, Shrout and Fleiss described three different major models of ICC 292:

72 Henrik Leonhardt |
1. ICC(1, k); with a random set of k judges (observers), i.e. the judge for each target selected at random, nested design. The judges provide ratings on different targets and no two judges provide ratings for the same target.
2. ICC(2, k); with a random set of judges rating each target, crossed design. Agreement of the ratings from the random judges is assessed.
3. ICC(3, k); with a fixed set of judges, crossed design. Consistency (reliability) of the ratings from the fixed judges is assessed.
Under Case 2 we wish to generalize to other raters within some population, whereas under Case 3 we are interested only in a single rater or a fixed set of k raters 292. When the judge variance is ignored, the ICC can be interpreted in terms of rater consistency rather than rater agreement. Case 2 is the model most frequently encountered in clinical research, when the same observers perform measurements on all the subjects. According to Shrout and Fleiss, choosing the appropriate form of ICC calls for three decisions:
a) Is a one-way or two-way ANOVA appropriate for the analysis of the reliability study?
b) Are differences between the judges' mean ratings relevant to the reliability of interest?
c) Is the unit of analysis an individual rating (single) or the mean of several ratings?
Thus, in SPSS an ANOVA model and type of ICC (consistency/absolute agreement) must be chosen (Table 5): Table 5. Different versions of ICC as described in Shrout & Fleiss 1979 292 ICC versions Option in SPSS ICC(1, 1) One-way random single measures ICC(1, k) One-way random average measures ICC(2, 1) Two-way random single measures (consistency/absolute agreement) ICC(2, k) Two-way random average measures (consistency/absolute agreement) ICC(3, 1) Two-way mixed single measures (consistency/absolute agreement) ICC(3, k) Two-way mixed average measures (consistency/absolute agreement) k refers to the number of observers to produce the ratings in the decision making context. Default in SPSS in bold.

| Discussion 73
In Paper 3, we started to analyze intra- and interobserver reliability with ICC(3, 2), i.e. a two-way mixed average measures ANOVA model with consistency, which resulted in high values of ICC coefficients in general (Table 6 and 7):
Table 6. The intraobserver reliability of 2D MRI measurements of ovarian volume and follicle counts Variable ICC 95% CI Ovarian volume 0.997 0.995 - 0.999 FC 1 - 3 mm 0.977 0.951 - 0.989 FC 4 - 6 mm 0.977 0.951 - 0.989 FC 7 - 9 mm 0.977 0.951 - 0.989 TFC 0.933 0.859 - 0.968 FC is follicle count. TFC is total follicle count. ICC are average intraclass correlation coefficients. CI is confidence intervals.
Table 7. The interobserver reliability of 2D MRI measurements of ovarian volume and follicle counts Variable ICC 95% CI Ovarian volume 0.990 0.980 - 0.995 FC 1 - 3 mm 0.903 0.796 - 0.954 FC 4 - 6 mm 0.690 0.349 - 0.989 FC 7 - 9 mm 0.228 -0.621 - 0.633 TFC 0.915 0.822 - 0.960 FC is follicle count. TFC is total follicle count. ICC are average intraclass correlation coefficients. CI is confidence intervals. However, when choosing single measures rather than average measures (which is more correct if the ratings are not used as consensus or average values between the observers), the values of the ICC coefficients were lower, as presented as an example of output from SPSS on MRI-derived interobserver total AFC ratings (Table 8):

74 Henrik Leonhardt |
Table 8. Output from SPSS on interobserver ICC(3, k) analysis on total follicle count.
On second thought, since ovarian volume and AFC are used as absolute threshold values as part of the diagnostic criteria of PCOS, we wanted to assess absolute agreement in the intra- and interobserver analysis, with a fair possibility to generalize the results. Thus, ICC(2, 1), i.e. a two-way random single measures ANOVA model with absolute agreement, is the statistical test to be used, which resulted in lower values of the ICC coefficients (Table 4 and 5 in Paper 3) as compared to ICC(3, 2), the analyze we started with.
Unfortunately, many researchers fail to report what variant of ICC they have used, and if single or average measures are presented. Most often investigators would like to say that their ratings or measurements are likely to be similar if repeated by a variety of observers and ICC (2, 1) will be most appropriate. Often the absolute measurements are of importance and then single measures should be reported.
Generalizability
In general, the sensitivity is higher and the specificity lower, the higher the prevalence is of a condition to be diagnosed 285, 293. Similarly, transferring a diagnostic test from a
Intraclass Correlation Coefficient
Intraclass
Correlationa
95% Confidence Interval F Test with True Value 0
Lower Bound Upper Bound Value df1 df2 Sig
Single Measures ,844b ,698 ,923 11,830 29 29 ,000
Average
Measures
,915c ,822 ,960 11,830 29 29 ,000
Two-way mixed effects model where people effects are random and measures effects are fixed.
a. Type C intraclass correlation coefficients using a consistency definition-the between-measure variance is excluded from the denominator variance.
b. The estimator is the same, whether the interaction effect is present or not.
c. This estimate is computed assuming the interaction effect is absent, because it is not estimable otherwise.
| Discussion 75
hospital population to be applied on a screening situation will result in a dramatically decreased prevalence, with a marked change of positive and negative predictive values 293. A strength of our study is the community recruitment procedure, which allowed inclusion of women with PCOS without previous health care contacts related to this diagnosis. In this regard, our results may be representative to the general reproductive female population. However, as we have investigated several variables with predictive potentials, our study should be regarded explorative. Further, compared to most other studies on PCOS, we have not followed the 2003 Rotterdam criteria strictly, in that all women in our PCOS group had PCO according to the screening TVUS. The purpose was to highlight ovarian morphology. There is a rationale to exclude asymptomatic women with PCO as controls, since these probably represent a silent form of PCOS that may obscure test results 158, 159, 169.
Thus, confirmative studies with different designs are needed before revised diagnostic criteria for PCOS with threshold-values can be established.

76 Henrik Leonhardt |
CONCLUSIONS
Specific conclusions in Paper 1 - 4 (in numerical order) were:
1. Although increased waist-to-hip ratio indicates abdominal fat accumulation in PCOS, abdominal adipose tissue volumes (total, subcutaneous, and visceral) assessed by MRI in women with the syndrome were indistinguishable from those in controls matched for age and BMI. In multivariate regression analyses, abdominal tissue volumes were not strongly associated with insulin sensitivity in PCOS.
2. The endometrium was thinner in PCOS with oligo-amenorrhea compared to controls. There were no differences in myometrial morphology between PCOS and controls. Based on cine MRI, uterine peristalsis was less commonly observed in women with PCOS than in controls. Whether disturbed peristalsis contributes to infertility in PCOS remains to be investigated.
3. 2D MRI revealed more antral follicles, especially of small size, than 3D TVUS. Ovarian volume estimation by MRI provided smaller volumes than by the reference standard 2D TVUS. 3D MRI provided volumes closer to 2D TVUS values than did 2D MRI. Reproducibility and interobserver agreement of 2D MRI measurements of ovarian volume and AFC were good.
4. AFC, ovarian volume, stromal volume, total cross-sectional area, AMH, and free testosterone were increased in women with PCOS compared with controls. In multivariate logistic regression analyses, PCOS was independently associated with AFC and free testosterone, but not with AMH or GDR. These findings suggest, when either oligo-anovulation or clinical signs of hyperandrogenism is absent, that AFC or free testosterone rather than AMH should be added in the estimation if a woman has PCOS or not.

| Future Perspectives 77
FUTURE PERSPECTIVES
To better understand the complexity of PCOS and to accurately communicate scientific results worldwide, it is important with an updated and generally accepted consensus of the diagnostic criteria. AMH has emerged as a simple blood sample to estimate the number of follicles, and may possibly replace AFC assessed by TVUS in the future. However, as our study indicates, AFC is a strong independent predictor of PCOS and there are still concerns about AMH that need to be elucidated. We judge that there is a need for a new international consensus meeting to revise the diagnostic criteria of PCOS, with the results in Paper 4 as a contributor to the knowledge of today. However, further studies including AMH and TVUS-derived AFC in different kind of populations are needed before threshold-values can be established.
The finding that abdominal adipose tissue volumes in PCOS do not differ from age- and BMI-matched controls is surprising. Notably, there was a clear tendency to more visceral fat in women with PCOS, indicating the need of further research. It also remains to be determined if lean (BMI ≤25) women with PCOS have more visceral fat than lean controls.
Uterine peristalsis is a relatively novel research area, and there are plenty of scientific questions that wait for answers. Is the peristalsis of significant importance for fertility? If so, can it be manipulated in any way by for instance hormones or drugs? The non-invasive cine MRI is a useful instrument in studying uterine peristalsis, but recent TVUS technology may be an alternative.
Women with PCOS need some kind of long-standing treatment. Pharmacological treatment is effective but associated with negative side effects. Therefore, there is a need for evaluation of non-pharmacological therapies. That physical exercise and low-frequency electro-acupuncture may modulate disturbed reproductive and neuroendocrine function and coagulation factors in women with PCOS is in accordance with previous clinical experience and reports 264-267, 294-306.
We plan to elucidate if the morphologic ovarian and uterine peristaltic disturbances in women with PCOS can be affected by physical exercise or electro-acupuncture. This will be a part of a randomized controlled trial 301, 303, 304, utilizing the knowledge we have gained using the present imaging methods.

78 Henrik Leonhardt |
PERSONAL CONCLUDING REMARKS
If you ask me to boil down the essence of this thesis to only a couple of concluding remarks of major clinical and scientific importance, I would say: To count antral follicles still matters! AFC remains a strong independent
predictor of PCOS and cannot yet be replaced by serum AMH in the diagnostic criteria for PCOS.
MRI is an excellent instrument for further research on this complex syndrome!

| Acknowledgements 79
ACKNOWLEDGEMENTS
This thesis is part of a larger multidisciplinary project, named “Polycystic ovary syndrome and the metabolic syndrome - pathophysiology, morphological assessment and treatment”, and the result of inspiring teamwork. Numerous people have, directly or indirectly, contributed to this thesis, and I would like to express my very sincere gratitude to all who have made this work possible! In particular, I would like to thank: Mikael Hellström, my principal supervisor, for giving me the opportunity to spend time on this research project and make it possible to finance the numerous expensive MRI examinations. Despite being the only and very busy professor in Radiology (one of the largest medical disciplines) at the Sahlgrenska University Hospital during these years, you have always been available and with great patience answered my endless questions and created time for meetings in your full-scheduled calendar. Your calmness and words of encouragement have put me back on the track in moments of doubt. I admire your skill to create bright formulations in text on tricky issues, even in the middle of the night! Your knowledge of science in radiology has been invaluable.
Elisabet Stener-Victorin, my assistant supervisor and head of the entire PCOS-project, for practical guidance with enormous patience on basic research issues, such as statistical analyzing. Being a world authority on PCOS, your immense knowledge in this field has been of great importance for the structure of the thesis. Your never-ending enthusiasm and encouragement has been inspiring along this winding road.
Lars Lönn, who initially guided me into the parallel universe of science when I strived to learn the profession of radiology as a senior resident. Further, Lars talked me into this project of PCOS, with the idea that MRI, beside precise measurement of abdominal fat, could contribute to evaluate other things in these women. Lars was also assistant supervisor in Paper 1, and introduced me to Joel Kullberg in Uppsala for the semi-automatic analyses of the abdominal fat compartments. However, I guess that Lars´ wife, Malin Lönn, was responsible for asking Lars if MRI could be used for the fat-measurements. Malin is a co-author and a major contributor in Paper 1. I thank you all!
80 Henrik Leonhardt |
Berit Gull, gynecologist and distinguished expert on TVUS, for putting a tremendous amount of time and effort into the project, not giving up despite several technical problems and practical difficulties. I appreciate our discussions and exchange of knowledge of gynecological imaging from a TVUS versus MRI standpoint, with mutual curiosity and respect of the different modalities instead of competition.
Louise Mannerås Holm, co-author of Paper 1, for your support in many ways and for interesting discussions on fat tissue.
Elizabeth Jedel, Anna-Karin Lind, and Lars Nilsson for taking part in the inclusion of women. The discussions with Lars on ovarian morphology have been very interesting and educating.
Per Olof Janson, a pioneer researcher in the field of PCOS and co-author, for generously sharing your immense knowledge and valuable time, kindly guiding me in how to write for gynecologists/endocrinologists.
Keiko Kishimoto, radiologist and co-author in Paper 2, by the beginning of the project a scholarship-student at our Institution, through the Scandinavian Japanese Radiological Society, for help with several practical matters and bringing up the idea to study uterine peristalsis in PCOS. Keiko introduced us to Masako Kataoka, who assisted us with her excellent expertise in MRI imaging of uterine peristalsis and agreed to put a lot of effort into Paper 2. I am happy to have had the opportunity to get to know you, and sincerely thank both of you!
Tina Lund, by that time medical student doing her examination project with us, performing the 3D MRI measurements on the ovaries.
Magnus Palmér, senior resident at our Department, for performing the ovarian MRI estimations for the interobserver analyses.
The staff at the Sahlgrenska MRI center for performing the MRIs, and especially Stig Eriksson for sharing your great technical MRI knowledge and warm humor with me.

| Acknowledgements 81
Anders Odén for excellent statistical guidance, and for your patience in explaining for me even the simplest statistical confusions, such as that Exp(B) in SPSS is the same as OR!
Our research nurse Lena Björneld for administrative support, including feeding data into Excel files.
Lotta Robertsson, for kindly guiding me in the university administration and taking care of practical things.
Gothenburg University, the CEROSS research school, and all teachers for my scientific education.
My chiefs at the Department of Radiology at Sahlgrenska John Brandberg and Anne Olmarker, who have provided time and facilities for me to perform research. John has also contributed with his knowledge of body composition imaging, and discussed my research with genuine interest.
My colleagues at the Department of Radiology at Sahlgrenska, for your friendship, interest, encouragement, and support.
Above all I am very grateful for the love and support of my family. My beloved wife Zumreta has put the extra effort needed at home and with our children, making this work possible. Love and care from a beautiful wife can do wonders for a tired scientist. Thank you for artistic support (Figure 3). Thank you darling, for sharing your life with me! I love you with all of my heart!
The studies were generously supported by grants from the Swedish Medical Research Council, the Swedish federal government under the LUA/ALF agreement, and the Regional Research and Development agreement, Jane and Dan Olsson Foundations, Novo Nordisk Foundation, Hjalmar Svensson Foundation, Adlerbert Research Foundation, Göteborg Medical Society (Fred G. and Emma E. Kanold Foundation, Hildur Wingquist Foundation, Kristina Stenborgs Foundation), and the Swedish Society of Radiology.

82 Henrik Leonhardt |
REFERENCES
1. Mannerås-Holm L. Polycystic ovary syndrome - studies of metabolic and ovarian disturbances and effects of physical exercise and electro-acupuncture. Doctoral Thesis, University of Gothenburg. 2010
2. Bloch F. Nuclear induction. Physical Review. 1946;70:460-474 3. Purcell E. Resonance absorption by nuclear magnetic moments in a solid. Physical
Review. 1946;69:37-38 4. Lauterbur P. Image formation by induced local interactions: Examples of employing
nuclear magnetic resonance. Nature. 1973;242:190-191 5. Mansfield P, Maudsley AA. Medical imaging by nmr. Br J Radiol. 1977;50:188-194 6. Chilton HM, Ekstrand KE. Principles and applications of nuclear magnetic resonance
imaging. Am J Hosp Pharm. 1984;41:763-768 7. Huk WJ, Gademann G. Magnetic resonance imaging (mri): Method and early clinical
experiences in diseases of the central nervous system. Neurosurg Rev. 1984;7:259-280 8. Outwater EK, Mitchell DG. Magnetic resonance imaging techniques in the pelvis.
Magn Reson Imaging Clin N Am. 1994;2:161-188 9. Anderson JC, ed. Gynecologic imaging. Churchill Livingstone/Harcourt Brace & Co.
Sydney1999. 10. Nakai A, Togashi K, Kosaka K, Kido A, Hiraga A, Fujiwara T, Koyama T, Fujii S.
Uterine peristalsis: Comparison of transvaginal ultrasound and two different sequences of cine mr imaging. J Magn Reson Imaging. 2004;20:463-469
11. Nakai A, Togashi K, Yamaoka T, Fujiwara T, Ueda H, Koyama T, Kobayashi H, Kagimura T, Fujii S, Konishi J. Uterine peristalsis shown on cine mr imaging using ultrafast sequence. J Magn Reson Imaging. 2003;18:726-733
12. Togashi K. Uterine contractility evaluated on cine magnetic resonance imaging. Ann N Y Acad Sci. 2007;1101:62-71
13. Hricak H, Carrington BM, eds. MRI of the pelvis: A text atlas. Appleton & Lange. Norwalk, Conneticut/San Mateo, California. 1991
14. Rinck P, ed. Magnetic resonance in medicine. Blackwell Scientific Publications. Oxford. 1993 15. March WA, Moore VM, Willson KJ, Phillips DI, Norman RJ, Davies MJ. The
prevalence of polycystic ovary syndrome in a community sample assessed under contrasting diagnostic criteria. Hum Reprod. 2010;25:544-551
16. Norman RJ, Dewailly D, Legro RS, Hickey TE. Polycystic ovary syndrome. Lancet. 2007;370:685-697
17. Carmina E, Bucchieri S, Esposito A, Del Puente A, Mansueto P, Orio F, Di Fede G, Rini G. Abdominal fat quantity and distribution in women with polycystic ovary syndrome and extent of its relation to insulin resistance. J Clin Endocrinol Metab. 2007;92:2500-2505
18. Dahlgren E, Janson PO, Johansson S, Lapidus L, Lindstedt G, Tengborn L. Hemostatic and metabolic variables in women with polycystic ovary syndrome. Fertil Steril. 1994;61:455-460
19. Dahlgren E, Janson PO, Johansson S, Lapidus L, Oden A. Polycystic ovary syndrome and risk for myocardial infarction. Evaluated from a risk factor model based on a prospective population study of women. Acta Obstet Gynecol Scand. 1992;71:599-604
20. Diamanti-Kandarakis E. Role of obesity and adiposity in polycystic ovary syndrome. Int J Obes (Lond). 2007;31 Suppl 2:S8-13; discussion S31-12

| References 83
21. Ehrmann DA, Liljenquist DR, Kasza K, Azziz R, Legro RS, Ghazzi MN. Prevalence and predictors of the metabolic syndrome in women with polycystic ovary syndrome. J Clin Endocrinol Metab. 2006;91:48-53
22. Escobar-Morreale HF, San Millan JL. Abdominal adiposity and the polycystic ovary syndrome. Trends Endocrinol Metab. 2007;18:266-272
23. Fauser BC, Tarlatzis BC, Rebar RW, Legro RS, Balen AH, Lobo R, Carmina E, Chang J, Yildiz BO, Laven JS, Boivin J, Petraglia F, Wijeyeratne CN, Norman RJ, Dunaif A, Franks S, Wild RA, Dumesic D, Barnhart K. Consensus on women's health aspects of polycystic ovary syndrome (pcos): The amsterdam eshre/asrm-sponsored 3rd pcos consensus workshop group. Fertil Steril. 2012;97:28-38 e25
24. Giallauria F, Orio F, Palomba S, Lombardi G, Colao A, Vigorito C. Cardiovascular risk in women with polycystic ovary syndrome. J Cardiovasc Med (Hagerstown). 2008;9:987-992
25. Hudecova M, Holte J, Olovsson M, Larsson A, Berne C, Poromaa IS. Diabetes and impaired glucose tolerance in patients with polycystic ovary syndrome - a long term follow-up. Hum Reprod. 2011;26:1462-1468
26. Hudecova M, Holte J, Olovsson M, Larsson A, Berne C, Sundstrom-Poromaa I. Prevalence of the metabolic syndrome in women with a previous diagnosis of polycystic ovary syndrome: Long-term follow-up. Fertil Steril. 2011;96:1271-1274
27. Legro RS, Gnatuk CL, Kunselman AR, Dunaif A. Changes in glucose tolerance over time in women with polycystic ovary syndrome: A controlled study. J Clin Endocrinol Metab. 2005;90:3236-3242
28. Lim SS, Davies MJ, Norman RJ, Moran LJ. Overweight, obesity and central obesity in women with polycystic ovary syndrome: A systematic review and meta-analysis. Hum Reprod Update. 2012
29. Schmidt J, Landin-Wilhelmsen K, Brannstrom M, Dahlgren E. Cardiovascular disease and risk factors in pcos women of postmenopausal age: A 21-year controlled follow-up study. J Clin Endocrinol Metab. 2011;96:3794-3803
30. Shaw LJ, Bairey Merz CN, Azziz R, Stanczyk FZ, Sopko G, Braunstein GD, Kelsey SF, Kip KE, Cooper-Dehoff RM, Johnson BD, Vaccarino V, Reis SE, Bittner V, Hodgson TK, Rogers W, Pepine CJ. Postmenopausal women with a history of irregular menses and elevated androgen measurements at high risk for worsening cardiovascular event-free survival: Results from the national institutes of health--national heart, lung, and blood institute sponsored women's ischemia syndrome evaluation. J Clin Endocrinol Metab. 2008;93:1276-1284
31. Wild RA, Carmina E, Diamanti-Kandarakis E, Dokras A, Escobar-Morreale HF, Futterweit W, Lobo R, Norman RJ, Talbott E, Dumesic DA. Assessment of cardiovascular risk and prevention of cardiovascular disease in women with the polycystic ovary syndrome: A consensus statement by the androgen excess and polycystic ovary syndrome (ae-pcos) society. J Clin Endocrinol Metab. 2010;95:2038-2049
32. Holte J. Disturbances in insulin secretion and sensitivity in women with the polycystic ovary syndrome. Baillieres Clin Endocrinol Metab. 1996;10:221-247
33. Holte J, Bergh T, Berne C, Lithell H. Serum lipoprotein lipid profile in women with the polycystic ovary syndrome: Relation to anthropometric, endocrine and metabolic variables. Clin Endocrinol (Oxf). 1994;41:463-471
34. Holte J, Gennarelli G, Berne C, Bergh T, Lithell H. Elevated ambulatory day-time blood pressure in women with polycystic ovary syndrome: A sign of a pre-hypertensive state? Hum Reprod. 1996;11:23-28
35. Hudecova M, Holte J, Moby L, Olovsson M, Stridsberg M, Larsson A, Berglund L, Berne C, Sundstrom Poromaa I. Androgen levels, insulin sensitivity, and early insulin

84 Henrik Leonhardt |
response in women with polycystic ovary syndrome: A long-term follow-up study. Fertil Steril. 2011;95:1146-1148
36. Hudecova M, Jan H, Christian B, Poromaa Inger S. Long-term reproductive and metabolic consequences of pcos. Curr Diabetes Rev. 2012;8:444-451
37. Dokras A, Bochner M, Hollinrake E, Markham S, Vanvoorhis B, Jagasia DH. Screening women with polycystic ovary syndrome for metabolic syndrome. Obstet Gynecol. 2005;106:131-137
38. Dunaif A. Insulin resistance and the polycystic ovary syndrome: Mechanism and implications for pathogenesis. Endocr Rev. 1997;18:774-800
39. Bengtsson C, Bjorkelund C, Lapidus L, Lissner L. Associations of serum lipid concentrations and obesity with mortality in women: 20 year follow up of participants in prospective population study in gothenburg, sweden. BMJ. 1993;307:1385-1388
40. Canoy D, Boekholdt SM, Wareham N, Luben R, Welch A, Bingham S, Buchan I, Day N, Khaw KT. Body fat distribution and risk of coronary heart disease in men and women in the european prospective investigation into cancer and nutrition in norfolk cohort: A population-based prospective study. Circulation. 2007;116:2933-2943
41. Canoy D, Luben R, Welch A, Bingham S, Wareham N, Day N, Khaw KT. Fat distribution, body mass index and blood pressure in 22,090 men and women in the norfolk cohort of the european prospective investigation into cancer and nutrition (epic-norfolk) study. J Hypertens. 2004;22:2067-2074
42. Evans DJ, Hoffmann RG, Kalkhoff RK, Kissebah AH. Relationship of body fat topography to insulin sensitivity and metabolic profiles in premenopausal women. Metabolism. 1984;33:68-75
43. Lundgren H, Bengtsson C, Blohme G, Lapidus L, Sjostrom L. Adiposity and adipose tissue distribution in relation to incidence of diabetes in women: Results from a prospective population study in gothenburg, sweden. Int J Obes. 1989;13:413-423
44. Moran L, Teede H. Metabolic features of the reproductive phenotypes of polycystic ovary syndrome. Hum Reprod Update. 2009;15:477-488
45. Ohlson LO, Larsson B, Svardsudd K, Welin L, Eriksson H, Wilhelmsen L, Bjorntorp P, Tibblin G. The influence of body fat distribution on the incidence of diabetes mellitus. 13.5 years of follow-up of the participants in the study of men born in 1913. Diabetes. 1985;34:1055-1058
46. Yusuf S, Hawken S, Ounpuu S, Dans T, Avezum A, Lanas F, McQueen M, Budaj A, Pais P, Varigos J, Lisheng L. Effect of potentially modifiable risk factors associated with myocardial infarction in 52 countries (the interheart study): Case-control study. Lancet. 2004;364:937-952
47. Elbers JM, Giltay EJ, Teerlink T, Scheffer PG, Asscheman H, Seidell JC, Gooren LJ. Effects of sex steroids on components of the insulin resistance syndrome in transsexual subjects. Clin Endocrinol (Oxf). 2003;58:562-571
48. Alexanderson C, Eriksson E, Stener-Victorin E, Lystig T, Gabrielsson B, Lonn M, Holmang A. Postnatal testosterone exposure results in insulin resistance, enlarged mesenteric adipocytes, and an atherogenic lipid profile in adult female rats: Comparisons with estradiol and dihydrotestosterone. Endocrinology. 2007;148:5369-5376
49. Franks S. Adult polycystic ovary syndrome begins in childhood. Best Pract Res Clin Endocrinol Metab. 2002;16:263-272
50. Xita N, Tsatsoulis A. Review: Fetal programming of polycystic ovary syndrome by androgen excess: Evidence from experimental, clinical, and genetic association studies. J Clin Endocrinol Metab. 2006;91:1660-1666
51. Abate N, Garg A. Heterogeneity in adipose tissue metabolism: Causes, implications and management of regional adiposity. Prog Lipid Res. 1995;34:53-70

| References 85
52. Brandberg J, Lonn L, Bergelin E, Sjostrom L, Forssell-Aronsson E, Starck G. Accurate tissue area measurements with considerably reduced radiation dose achieved by patient-specific ct scan parameters. Br J Radiol. 2008;81:801-808
53. Chowdhury B, Sjostrom L, Alpsten M, Kostanty J, Kvist H, Lofgren R. A multicompartment body composition technique based on computerized tomography. Int J Obes Relat Metab Disord. 1994;18:219-234
54. Elbers JM, Haumann G, Asscheman H, Seidell JC, Gooren LJ. Reproducibility of fat area measurements in young, non-obese subjects by computerized analysis of magnetic resonance images. Int J Obes Relat Metab Disord. 1997;21:1121-1129
55. Kuk JL, Church TS, Blair SN, Ross R. Does measurement site for visceral and abdominal subcutaneous adipose tissue alter associations with the metabolic syndrome? Diabetes Care. 2006;29:679-684
56. Kuk JL, Church TS, Blair SN, Ross R. Measurement site and the association between visceral and abdominal subcutaneous adipose tissue with metabolic risk in women. Obesity (Silver Spring). 2010;18:1336-1340
57. Kullberg J, Ahlstrom H, Johansson L, Frimmel H. Automated and reproducible segmentation of visceral and subcutaneous adipose tissue from abdominal mri. Int J Obes (Lond). 2007;31:1806-1817
58. Kullberg J, Angelhed JE, Lonn L, Brandberg J, Ahlstrom H, Frimmel H, Johansson L. Whole-body t1 mapping improves the definition of adipose tissue: Consequences for automated image analysis. J Magn Reson Imaging. 2006;24:394-401
59. Kullberg J, Brandberg J, Angelhed JE, Frimmel H, Bergelin E, Strid L, Ahlstrom H, Johansson L, Lonn L. Whole-body adipose tissue analysis: Comparison of mri, ct and dual energy x-ray absorptiometry. Br J Radiol. 2009;82:123-130
60. Kullberg J, von Below C, Lonn L, Lind L, Ahlstrom H, Johansson L. Practical approach for estimation of subcutaneous and visceral adipose tissue. Clin Physiol Funct Imaging. 2007;27:148-153
61. Kvist H, Chowdhury B, Grangard U, Tylen U, Sjostrom L. Total and visceral adipose-tissue volumes derived from measurements with computed tomography in adult men and women: Predictive equations. Am J Clin Nutr. 1988;48:1351-1361
62. Liou TH, Chan WP, Pan LC, Lin PW, Chou P, Chen CH. Fully automated large-scale assessment of visceral and subcutaneous abdominal adipose tissue by magnetic resonance imaging. Int J Obes (Lond). 2006;30:844-852
63. Brochu M, Starling RD, Tchernof A, Matthews DE, Garcia-Rubi E, Poehlman ET. Visceral adipose tissue is an independent correlate of glucose disposal in older obese postmenopausal women. J Clin Endocrinol Metab. 2000;85:2378-2384
64. Carr DB, Utzschneider KM, Hull RL, Kodama K, Retzlaff BM, Brunzell JD, Shofer JB, Fish BE, Knopp RH, Kahn SE. Intra-abdominal fat is a major determinant of the national cholesterol education program adult treatment panel iii criteria for the metabolic syndrome. Diabetes. 2004;53:2087-2094
65. Fox CS, Massaro JM, Hoffmann U, Pou KM, Maurovich-Horvat P, Liu CY, Vasan RS, Murabito JM, Meigs JB, Cupples LA, D'Agostino RB, Sr., O'Donnell CJ. Abdominal visceral and subcutaneous adipose tissue compartments: Association with metabolic risk factors in the framingham heart study. Circulation. 2007;116:39-48
66. Liu J, Fox CS, Hickson DA, May WD, Hairston KG, Carr JJ, Taylor HA. Impact of abdominal visceral and subcutaneous adipose tissue on cardiometabolic risk factors: The Jackson heart study. J Clin Endocrinol Metab. 2010;95:5419-5426
67. Lord J, Thomas R, Fox B, Acharya U, Wilkin T. The central issue? Visceral fat mass is a good marker of insulin resistance and metabolic disturbance in women with polycystic ovary syndrome. BJOG. 2006;113:1203-1209

86 Henrik Leonhardt |
68. Nguyen-Duy TB, Nichaman MZ, Church TS, Blair SN, Ross R. Visceral fat and liver fat are independent predictors of metabolic risk factors in men. Am J Physiol Endocrinol Metab. 2003;284:E1065-1071
69. Oka R, Miura K, Sakurai M, Nakamura K, Yagi K, Miyamoto S, Moriuchi T, Mabuchi H, Koizumi J, Nomura H, Takeda Y, Inazu A, Nohara A, Kawashiri MA, Nagasawa S, Kobayashi J, Yamagishi M. Impacts of visceral adipose tissue and subcutaneous adipose tissue on metabolic risk factors in middle-aged japanese. Obesity (Silver Spring). 2010;18:153-160
70. Piche ME, Lapointe A, Weisnagel SJ, Corneau L, Nadeau A, Bergeron J, Lemieux S. Regional body fat distribution and metabolic profile in postmenopausal women. Metabolism. 2008;57:1101-1107
71. Ross R, Aru J, Freeman J, Hudson R, Janssen I. Abdominal adiposity and insulin resistance in obese men. Am J Physiol Endocrinol Metab. 2002;282:E657-663
72. Ross R, Freeman J, Hudson R, Janssen I. Abdominal obesity, muscle composition, and insulin resistance in premenopausal women. J Clin Endocrinol Metab. 2002;87:5044-5051
73. Wheeler GL, Shi R, Beck SR, Langefeld CD, Lenchik L, Wagenknecht LE, Freedman BI, Rich SS, Bowden DW, Chen MY, Carr JJ. Pericardial and visceral adipose tissues measured volumetrically with computed tomography are highly associated in type 2 diabetic families. Invest Radiol. 2005;40:97-101
74. Chittenden BG, Fullerton G, Maheshwari A, Bhattacharya S. Polycystic ovary syndrome and the risk of gynaecological cancer: A systematic review. Reprod Biomed Online. 2009;19:398-405
75. Haoula Z, Salman M, Atiomo W. Evaluating the association between endometrial cancer and polycystic ovary syndrome. Hum Reprod. 2012
76. Navaratnarajah R, Pillay OC, Hardiman P. Polycystic ovary syndrome and endometrial cancer. Semin Reprod Med. 2008;26:62-71
77. Amant F, Moerman P, Neven P, Timmerman D, Van Limbergen E, Vergote I. Endometrial cancer. Lancet. 2005;366:491-505
78. Fader AN, Arriba LN, Frasure HE, von Gruenigen VE. Endometrial cancer and obesity: Epidemiology, biomarkers, prevention and survivorship. Gynecol Oncol. 2009;114:121-127
79. Cheung AP. Ultrasound and menstrual history in predicting endometrial hyperplasia in polycystic ovary syndrome. Obstet Gynecol. 2001;98:325-331
80. Fox R, Corrigan E, Thomas PG, Hull MG. Oestrogen and androgen states in oligo-amenorrhoeic women with polycystic ovaries. Br J Obstet Gynaecol. 1991;98:294-299
81. Stener-Victorin E, Holm G, Labrie F, Nilsson L, Janson PO, Ohlsson C. Are there any sensitive and specific sex steroid markers for polycystic ovary syndrome? J Clin Endocrinol Metab. 2010;95:810-819
82. Bacallao K, Leon L, Gabler F, Soto E, Romero C, Valladares L, Vega M. In situ estrogen metabolism in proliferative endometria from untreated women with polycystic ovarian syndrome with and without endometrial hyperplasia. J Steroid Biochem Mol Biol. 2008;110:163-169
83. Leon L, Bacallao K, Gabler F, Romero C, Valladares L, Vega M. Activities of steroid metabolic enzymes in secretory endometria from untreated women with polycystic ovary syndrome. Steroids. 2008;73:88-95
84. Villavicencio A, Bacallao K, Avellaira C, Gabler F, Fuentes A, Vega M. Androgen and estrogen receptors and co-regulators levels in endometria from patients with polycystic ovarian syndrome with and without endometrial hyperplasia. Gynecol Oncol. 2006;103:307-314
| References 87
85. McCormick BA, Wilburn RD, Thomas MA, Williams DB, Maxwell R, Aubuchon M. Endometrial thickness predicts endometrial hyperplasia in patients with polycystic ovary syndrome. Fertil Steril. 2011;95:2625-2627
86. Iatrakis G, Tsionis C, Adonakis G, Stoikidou M, Anthouli-Anagnostopoulou F, Parava M, Vouxinou A, Georgopoulos NA, Kourounis G. Polycystic ovarian syndrome, insulin resistance and thickness of the endometrium. Eur J Obstet Gynecol Reprod Biol. 2006;127:218-221
87. Eryilmaz OG, Sarikaya E, Gulerman C, Akar S, Cicek N. Endometrial thickness measurement throughout a menstrual cycle in non-obese infertile patients with polycystic ovary syndrome. Arch Gynecol Obstet. 2012
88. Hirschberg AL. Polycystic ovary syndrome, obesity and reproductive implications. Womens Health (Lond Engl). 2009;5:529-540; quiz 541-522
89. Hudecova M, Holte J, Olovsson M, Sundstrom Poromaa I. Long-term follow-up of patients with polycystic ovary syndrome: Reproductive outcome and ovarian reserve. Hum Reprod. 2009;24:1176-1183
90. Bellver J, Ayllon Y, Ferrando M, Melo M, Goyri E, Pellicer A, Remohi J, Meseguer M. Female obesity impairs in vitro fertilization outcome without affecting embryo quality. Fertil Steril. 2010;93:447-454
91. Clifford K, Rai R, Watson H, Regan L. An informative protocol for the investigation of recurrent miscarriage: Preliminary experience of 500 consecutive cases. Hum Reprod. 1994;9:1328-1332
92. Rai R, Backos M, Rushworth F, Regan L. Polycystic ovaries and recurrent miscarriage--a reappraisal. Hum Reprod. 2000;15:612-615
93. Kuivasaari-Pirinen P, Hippelainen M, Hakkarainen H, Randell K, Heinonen S. Cumulative baby take-home rate among women with pcos treated by ivf. Gynecol Endocrinol. 2010;26:582-589
94. Roos N, Kieler H, Sahlin L, Ekman-Ordeberg G, Falconer H, Stephansson O. Risk of adverse pregnancy outcomes in women with polycystic ovary syndrome: Population based cohort study. BMJ. 2011;343:d6309
95. van Gestel I, MM IJ, Hoogland HJ, Evers JL. Endometrial wave-like activity in the non-pregnant uterus. Hum Reprod Update. 2003;9:131-138
96. Kunz G, Beil D, Deiniger H, Einspanier A, Mall G, Leyendecker G. The uterine peristaltic pump. Normal and impeded sperm transport within the female genital tract. Adv Exp Med Biol. 1997;424:267-277
97. Kunz G, Beil D, Deininger H, Wildt L, Leyendecker G. The dynamics of rapid sperm transport through the female genital tract: Evidence from vaginal sonography of uterine peristalsis and hysterosalpingoscintigraphy. Hum Reprod. 1996;11:627-632
98. Zervomanolakis I, Ott HW, Hadziomerovic D, Mattle V, Seeber BE, Virgolini I, Heute D, Kissler S, Leyendecker G, Wildt L. Physiology of upward transport in the human female genital tract. Ann N Y Acad Sci. 2007;1101:1-20
99. Koyama T, Togashi K. Functional mr imaging of the female pelvis. J Magn Reson Imaging. 2007;25:1101-1112
100. Aguilar HN, Mitchell BF. Physiological pathways and molecular mechanisms regulating uterine contractility. Hum Reprod Update. 2010;16:725-744
101. Eytan O, Halevi I, Har-Toov J, Wolman I, Elad D, Jaffa AJ. Characteristics of uterine peristalsis in spontaneous and induced cycles. Fertil Steril. 2001;76:337-341
102. Fanchin R, Ayoubi JM, Olivennes F, Righini C, de Ziegler D, Frydman R. Hormonal influence on the uterine contractility during ovarian stimulation. Hum Reprod. 2000;15 Suppl 1:90-100
103. Kataoka M, Togashi K, Kido A, Nakai A, Fujiwara T, Koyama T, Fujii S. Dysmenorrhea: Evaluation with cine-mode-display mr imaging--initial experience. Radiology. 2005;235:124-131

88 Henrik Leonhardt |
104. Kido A, Togashi K, Hatayama H, Nakayama T, Yamamoto A, Kataoka M, Tulandi T. Uterine peristalsis in women with repeated ivf failures: Possible therapeutic effect of hyoscine bromide. J Obstet Gynaecol Can. 2009;31:732-735
105. Kido A, Togashi K, Nakai A, Kataoka ML, Koyama T, Fujii S. Oral contraceptives and uterine peristalsis: Evaluation with mri. J Magn Reson Imaging. 2005;22:265-270
106. Kido A, Togashi K, Nishino M, Miyake K, Koyama T, Fujimoto R, Iwasaku K, Fujii S, Hayakawa K. Cine mr imaging of uterine peristalsis in patients with endometriosis. Eur Radiol. 2007;17:1813-1819
107. Kissler S, Siebzehnruebl E, Kohl J, Mueller A, Hamscho N, Gaetje R, Ahr A, Rody A, Kaufmann M. Uterine contractility and directed sperm transport assessed by hysterosalpingoscintigraphy (hssg) and intrauterine pressure (iup) measurement. Acta Obstet Gynecol Scand. 2004;83:369-374
108. Kunz G, Beil D, Huppert P, Leyendecker G. Structural abnormalities of the uterine wall in women with endometriosis and infertility visualized by vaginal sonography and magnetic resonance imaging. Hum Reprod. 2000;15:76-82
109. Kunz G, Beil D, Huppert P, Leyendecker G. Oxytocin--a stimulator of directed sperm transport in humans. Reprod Biomed Online. 2007;14:32-39
110. Kunz G, Leyendecker G. Uterine peristaltic activity during the menstrual cycle: Characterization, regulation, function and dysfunction. Reprod Biomed Online. 2002;4 Suppl 3:5-9
111. Kunz G, Noe M, Herbertz M, Leyendecker G. Uterine peristalsis during the follicular phase of the menstrual cycle: Effects of oestrogen, antioestrogen and oxytocin. Hum Reprod Update. 1998;4:647-654
112. Leyendecker G, Kunz G, Herbertz M, Beil D, Huppert P, Mall G, Kissler S, Noe M, Wildt L. Uterine peristaltic activity and the development of endometriosis. Ann N Y Acad Sci. 2004;1034:338-355
113. Maslow KD, Lyons EA. Effect of oral contraceptives and intrauterine devices on midcycle myometrial contractions. Fertil Steril. 2003;80:1224-1227
114. Maslow KD, Lyons EA. Effect of prostaglandin and antiprostaglandin on midcycle myometrial contractions. Fertil Steril. 2004;82:511-513
115. Mueller A, Siemer J, Schreiner S, Koesztner H, Hoffmann I, Binder H, Beckmann MW, Dittrich R. Role of estrogen and progesterone in the regulation of uterine peristalsis: Results from perfused non-pregnant swine uteri. Hum Reprod. 2006;21:1863-1868
116. Nakai A, Togashi K, Kosaka K, Kido A, Kataoka M, Koyama T, Fujii S. Do anticholinergic agents suppress uterine peristalsis and sporadic myometrial contractions at cine mr imaging? Radiology. 2008;246:489-496
117. Yoshino O, Hayashi T, Osuga Y, Orisaka M, Asada H, Okuda S, Hori M, Furuya M, Onuki H, Sadoshima Y, Hiroi H, Fujiwara T, Kotsuji F, Yoshimura Y, Nishii O, Taketani Y. Decreased pregnancy rate is linked to abnormal uterine peristalsis caused by intramural fibroids. Hum Reprod. 2010;25:2475-2479
118. Azziz R, Carmina E, Dewailly D, Diamanti-Kandarakis E, Escobar-Morreale HF, Futterweit W, Janssen OE, Legro RS, Norman RJ, Taylor AE, Witchel SF. The androgen excess and pcos society criteria for the polycystic ovary syndrome: The complete task force report. Fertil Steril. 2009;91:456-488
119. Holt J. Polycystiskt ovariesyndrom och hirsutism. In Janson PO, Landgren B-M, eds. Gynekologi. Studentlitteratur. Lund. 2010
120. Lee TT, Rausch ME. Polycystic ovarian syndrome: Role of imaging in diagnosis. Radiographics. 2012;32:1643-1657
121. Franks S, Stark J, Hardy K. Follicle dynamics and anovulation in polycystic ovary syndrome. Hum Reprod Update. 2008;14:367-378
| References 89
122. Dewailly D, Catteau-Jonard S, Reyss AC, Maunoury-Lefebvre C, Poncelet E, Pigny P. The excess in 2-5 mm follicles seen at ovarian ultrasonography is tightly associated to the follicular arrest of the polycystic ovary syndrome. Hum Reprod. 2007;22:1562-1566
123. Jonard S, Dewailly D. The follicular excess in polycystic ovaries, due to intra-ovarian hyperandrogenism, may be the main culprit for the follicular arrest. Hum Reprod Update. 2004;10:107-117
124. Franks S, Mason H, White D, Willis D. Etiology of anovulation in polycystic ovary syndrome. Steroids. 1998;63:306-307
125. Chang WY, Knochenhauer ES, Bartolucci AA, Azziz R. Phenotypic spectrum of polycystic ovary syndrome: Clinical and biochemical characterization of the three major clinical subgroups. Fertil Steril. 2005;83:1717-1723
126. Glintborg D, Hermann AP, Brusgaard K, Hangaard J, Hagen C, Andersen M. Significantly higher adrenocorticotropin-stimulated cortisol and 17-hydroxyprogesterone levels in 337 consecutive, premenopausal, caucasian, hirsute patients compared with healthy controls. J Clin Endocrinol Metab. 2005;90:1347-1353
127. Vassiliadi DA, Barber TM, Hughes BA, McCarthy MI, Wass JA, Franks S, Nightingale P, Tomlinson JW, Arlt W, Stewart PM. Increased 5 alpha-reductase activity and adrenocortical drive in women with polycystic ovary syndrome. J Clin Endocrinol Metab. 2009;94:3558-3566
128. Yildiz BO, Azziz R. The adrenal and polycystic ovary syndrome. Rev Endocr Metab Disord. 2007;8:331-342
129. Rachon D. Differential diagnosis of hyperandrogenism in women with polycystic ovary syndrome. Exp Clin Endocrinol Diabetes. 2012;120:205-209
130. Pall M, Azziz R, Beires J, Pignatelli D. The phenotype of hirsute women: A comparison of polycystic ovary syndrome and 21-hydroxylase-deficient nonclassic adrenal hyperplasia. Fertil Steril. 2010;94:684-689
131. Rotterdam ESHRE/ASRM-Sponsored PCOS Consensus Workshop Group.Revised 2003 consensus on diagnostic criteria and long-term health risks related to polycystic ovary syndrome (pcos). Hum Reprod. 2004;19:41-47
132. Lumachi F, Marchesi P, Miotto D, Motta R. Ct and mr imaging of the adrenal glands in cortisol-secreting tumors. Anticancer Res. 2011;31:2923-2926
133. Stein LM. Amenorrhea associated with bilateral polycystic ovaries. Am J Obstet Gynecol. 1935:181-191
134. Balen AH, Conway GS, Kaltsas G, Techatrasak K, Manning PJ, West C, Jacobs HS. Polycystic ovary syndrome: The spectrum of the disorder in 1741 patients. Hum Reprod. 1995;10:2107-2111
135. Teede H, Deeks A, Moran L. Polycystic ovary syndrome: A complex condition with psychological, reproductive and metabolic manifestations that impacts on health across the lifespan. BMC Med. 2010;8:41
136. Elting MW, Korsen TJ, Rekers-Mombarg LT, Schoemaker J. Women with polycystic ovary syndrome gain regular menstrual cycles when ageing. Hum Reprod. 2000;15:24-28
137. Barth JH, Yasmin E, Balen AH. The diagnosis of polycystic ovary syndrome: The criteria are insufficiently robust for clinical research. Clin Endocrinol (Oxf). 2007;67:811-815
138. Zawadski JK DA. Diagnostic criteria for polycystic ovary syndrome: Towards a rational approach. In: Dunaif A, Givens JR, Haseltine FP, Merriam GR, eds. Polycystic ovary syndrome. Boston: Blackwell scientific publications 1992
139. Azziz R, Carmina E, Dewailly D, Diamanti-Kandarakis E, Escobar-Morreale HF, Futterweit W, Janssen OE, Legro RS, Norman RJ, Taylor AE, Witchel SF. Positions statement: Criteria for defining polycystic ovary syndrome as a predominantly

90 Henrik Leonhardt |
hyperandrogenic syndrome: An androgen excess society guideline. J Clin Endocrinol Metab. 2006;91:4237-4245
140. Azziz R, Woods KS, Reyna R, Key TJ, Knochenhauer ES, Yildiz BO. The prevalence and features of the polycystic ovary syndrome in an unselected population. J Clin Endocrinol Metab. 2004;89:2745-2749
141. NIH. Evidence-based methodology workshop on polycystic ovary syndrome. 2012 142. Adams J, Franks S, Polson DW, Mason HD, Abdulwahid N, Tucker M, Morris DV,
Price J, Jacobs HS. Multifollicular ovaries: Clinical and endocrine features and response to pulsatile gonadotropin releasing hormone. Lancet. 1985;2:1375-1379
143. Balen AH, Laven JS, Tan SL, Dewailly D. Ultrasound assessment of the polycystic ovary: International consensus definitions. Hum Reprod Update. 2003;9:505-514
144. Carmina E, Oberfield SE, Lobo RA. The diagnosis of polycystic ovary syndrome in adolescents. Am J Obstet Gynecol. 2010;203:201 e201-205
145. Birdsall MA, Farquhar CM. Polycystic ovaries in pre and post-menopausal women. Clin Endocrinol (Oxf). 1996;44:269-276
146. Carmina E, Lobo RA. Do hyperandrogenic women with normal menses have polycystic ovary syndrome? Fertil Steril. 1999;71:319-322
147. Carmina E, Orio F, Palomba S, Longo RA, Lombardi G, Lobo RA. Ovarian size and blood flow in women with polycystic ovary syndrome and their correlations with endocrine parameters. Fertil Steril. 2005;84:413-419
148. Dewailly D, Catteau-Jonard S, Reyss AC, Leroy M, Pigny P. Oligoanovulation with polycystic ovaries but not overt hyperandrogenism. J Clin Endocrinol Metab. 2006;91:3922-3927
149. Welt CK, Gudmundsson JA, Arason G, Adams J, Palsdottir H, Gudlaugsdottir G, Ingadottir G, Crowley WF. Characterizing discrete subsets of polycystic ovary syndrome as defined by the rotterdam criteria: The impact of weight on phenotype and metabolic features. J Clin Endocrinol Metab. 2006;91:4842-4848
150. Clayton RN, Ogden V, Hodgkinson J, Worswick L, Rodin DA, Dyer S, Meade TW. How common are polycystic ovaries in normal women and what is their significance for the fertility of the population? Clin Endocrinol (Oxf). 1992;37:127-134
151. Farquhar CM, Birdsall M, Manning P, Mitchell JM, France JT. The prevalence of polycystic ovaries on ultrasound scanning in a population of randomly selected women. Aust N Z J Obstet Gynaecol. 1994;34:67-72
152. Koivunen R, Laatikainen T, Tomas C, Huhtaniemi I, Tapanainen J, Martikainen H. The prevalence of polycystic ovaries in healthy women. Acta Obstet Gynecol Scand. 1999;78:137-141
153. Polson DW, Adams J, Wadsworth J, Franks S. Polycystic ovaries--a common finding in normal women. Lancet. 1988;1:870-872
154. Michelmore KF, Balen AH, Dunger DB, Vessey MP. Polycystic ovaries and associated clinical and biochemical features in young women. Clin Endocrinol (Oxf). 1999;51:779-786
155. Johnstone EB, Rosen MP, Neril R, Trevithick D, Sternfeld B, Murphy R, Addauan-Andersen C, McConnell D, Pera RR, Cedars MI. The polycystic ovary post-rotterdam: A common, age-dependent finding in ovulatory women without metabolic significance. J Clin Endocrinol Metab. 2010;95:4965-4972
156. Piltonen T, Morin-Papunen L, Koivunen R, Perheentupa A, Ruokonen A, Tapanainen JS. Serum anti-mullerian hormone levels remain high until late reproductive age and decrease during metformin therapy in women with polycystic ovary syndrome. Hum Reprod. 2005;20:1820-1826
157. Duijkers IJ, Klipping C. Polycystic ovaries, as defined by the 2003 rotterdam consensus criteria, are found to be very common in young healthy women. Gynecol Endocrinol. 2010;26:152-160

| References 91
158. Catteau-Jonard S, Bancquart J, Poncelet E, Lefebvre-Maunoury C, Robin G, Dewailly D. Polycystic ovaries at ultrasound: Normal variant or silent polycystic ovary syndrome? Ultrasound Obstet Gynecol. 2012;40:223-229
159. Homburg R, Ray A, Bhide P, Gudi A, Shah A, Timms P, Grayson K. The relationship of serum anti-mullerian hormone with polycystic ovarian morphology and polycystic ovary syndrome: A prospective cohort study. Hum Reprod. 2013
160. Murphy MK, Hall JE, Adams JM, Lee H, Welt CK. Polycystic ovarian morphology in normal women does not predict the development of polycystic ovary syndrome. J Clin Endocrinol Metab. 2006;91:3878-3884
161. Barber TM, Alvey C, Greenslade T, Gooding M, Barber D, Smith R, Marland A, Wass JA, Child T, McCarthy MI, Franks S, Golding SJ. Patterns of ovarian morphology in polycystic ovary syndrome: A study utilising magnetic resonance imaging. Eur Radiol. 2010;20:1207-1213
162. Dewailly D, Pigny P, Soudan B, Catteau-Jonard S, Decanter C, Poncelet E, Duhamel A. Reconciling the definitions of polycystic ovary syndrome: The ovarian follicle number and serum anti-mullerian hormone concentrations aggregate with the markers of hyperandrogenism. J Clin Endocrinol Metab. 2010;95:4399-4405
163. Jonard S, Robert Y, Cortet-Rudelli C, Pigny P, Decanter C, Dewailly D. Ultrasound examination of polycystic ovaries: Is it worth counting the follicles? Hum Reprod. 2003;18:598-603
164. Adams JM, Taylor AE, Crowley WF, Jr., Hall JE. Polycystic ovarian morphology with regular ovulatory cycles: Insights into the pathophysiology of polycystic ovarian syndrome. J Clin Endocrinol Metab. 2004;89:4343-4350
165. Chang PL, Lindheim SR, Lowre C, Ferin M, Gonzalez F, Berglund L, Carmina E, Sauer MV, Lobo RA. Normal ovulatory women with polycystic ovaries have hyperandrogenic pituitary-ovarian responses to gonadotropin-releasing hormone-agonist testing. J Clin Endocrinol Metab. 2000;85:995-1000
166. Kousta E, Cela E, Lawrence N, Penny A, Millauer B, White D, Wilson H, Robinson S, Johnston D, McCarthy M, Franks S. The prevalence of polycystic ovaries in women with a history of gestational diabetes. Clin Endocrinol (Oxf). 2000;53:501-507
167. Legro RS, Chiu P, Kunselman AR, Bentley CM, Dodson WC, Dunaif A. Polycystic ovaries are common in women with hyperandrogenic chronic anovulation but do not predict metabolic or reproductive phenotype. J Clin Endocrinol Metab. 2005;90:2571-2579
168. Yildiz BO, Bozdag G, Yapici Z, Esinler I, Yarali H. Prevalence, phenotype and cardiometabolic risk of polycystic ovary syndrome under different diagnostic criteria. Hum Reprod. 2012
169. Dewailly D, Gronier H, Poncelet E, Robin G, Leroy M, Pigny P, Duhamel A, Catteau-Jonard S. Diagnosis of polycystic ovary syndrome (pcos): Revisiting the threshold values of follicle count on ultrasound and of the serum amh level for the definition of polycystic ovaries. Hum Reprod. 2011;26:3123-3129
170. Chen MJ, Yang WS, Chen CL, Wu MY, Yang YS, Ho HN. The relationship between anti-mullerian hormone, androgen and insulin resistance on the number of antral follicles in women with polycystic ovary syndrome. Hum Reprod. 2008;23:952-957
171. Pache TD, de Jong FH, Hop WC, Fauser BC. Association between ovarian changes assessed by transvaginal sonography and clinical and endocrine signs of the polycystic ovary syndrome. Fertil Steril. 1993;59:544-549
172. Pellatt L, Rice S, Mason HD. Anti-mullerian hormone and polycystic ovary syndrome: A mountain too high? Reproduction. 2010;139:825-833
173. Woo HY, Kim KH, Rhee EJ, Park H, Lee MK. Differences of the association of anti-mullerian hormone with clinical or biochemical characteristics between women with and without polycystic ovarian syndrome. Endocr J. 2012
92 Henrik Leonhardt |
174. Eilertsen TB, Vanky E, Carlsen SM. Anti-mullerian hormone in the diagnosis of polycystic ovary syndrome: Can morphologic description be replaced? Hum Reprod. 2012;27:2494-2502
175. Eldar-Geva T, Margalioth EJ, Gal M, Ben-Chetrit A, Algur N, Zylber-Haran E, Brooks B, Huerta M, Spitz IM. Serum anti-mullerian hormone levels during controlled ovarian hyperstimulation in women with polycystic ovaries with and without hyperandrogenism. Hum Reprod. 2005;20:1814-1819
176. Hart R, Doherty DA, Norman RJ, Franks S, Dickinson JE, Hickey M, Sloboda DM. Serum antimullerian hormone (amh) levels are elevated in adolescent girls with polycystic ovaries and the polycystic ovarian syndrome (pcos). Fertil Steril. 2010;94:1118-1121
177. Laven JS, Mulders AG, Visser JA, Themmen AP, De Jong FH, Fauser BC. Anti-mullerian hormone serum concentrations in normoovulatory and anovulatory women of reproductive age. J Clin Endocrinol Metab. 2004;89:318-323
178. Lin YH, Chiu WC, Wu CH, Tzeng CR, Hsu CS, Hsu MI. Antimullerian hormone and polycystic ovary syndrome. Fertil Steril. 2011;96:230-235
179. Nardo LG, Yates AP, Roberts SA, Pemberton P, Laing I. The relationships between amh, androgens, insulin resistance and basal ovarian follicular status in non-obese subfertile women with and without polycystic ovary syndrome. Hum Reprod. 2009;24:2917-2923
180. Parco S, Novelli C, Vascotto F, Princi T. Serum anti-mullerian hormone as a predictive marker of polycystic ovarian syndrome. Int J Gen Med. 2011;4:759-763
181. Pigny P, Merlen E, Robert Y, Cortet-Rudelli C, Decanter C, Jonard S, Dewailly D. Elevated serum level of anti-mullerian hormone in patients with polycystic ovary syndrome: Relationship to the ovarian follicle excess and to the follicular arrest. J Clin Endocrinol Metab. 2003;88:5957-5962
182. Rosenfield RL, Wroblewski K, Padmanabhan V, Littlejohn E, Mortensen M, Ehrmann DA. Antimullerian hormone levels are independently related to ovarian hyperandrogenism and polycystic ovaries. Fertil Steril. 2012
183. Almog B, Shehata F, Suissa S, Holzer H, Shalom-Paz E, La Marca A, Muttukrishna S, Blazar A, Hackett R, Nelson SM, Cunha-Filho JS, Eldar-Geva T, Margalioth EJ, Raine-Fenning N, Jayaprakasan K, McIlveen M, Wunder D, Freour T, Nardo LG, Balasch J, Penarrubia J, Smeenk J, Gnoth C, Godehardt E, Lee TH, Lee MS, Levin I, Gamzu R, Tulandi T. Age-related normograms of serum antimullerian hormone levels in a population of infertile women: A multicenter study. Fertil Steril. 2011;95:2359-2363, 2363 e2351
184. Broer SL, Eijkemans MJ, Scheffer GJ, van Rooij IA, de Vet A, Themmen AP, Laven JS, de Jong FH, Te Velde ER, Fauser BC, Broekmans FJ. Anti-mullerian hormone predicts menopause: A long-term follow-up study in normoovulatory women. J Clin Endocrinol Metab. 2011;96:2532-2539
185. Carmina E, Campagna AM, Mansuet P, Vitale G, Kort D, Lobo R. Does the level of serum antimullerian hormone predict ovulatory function in women with polycystic ovary syndrome with aging? Fertil Steril. 2012;98:1043-1046
186. Freeman EW, Sammel MD, Lin H, Boorman DW, Gracia CR. Contribution of the rate of change of antimullerian hormone in estimating time to menopause for late reproductive-age women. Fertil Steril. 2012;98:1254-1259 e1251-1252
187. La Marca A, Spada E, Grisendi V, Argento C, Papaleo E, Milani S, Volpe A. Normal serum anti-mullerian hormone levels in the general female population and the relationship with reproductive history. Eur J Obstet Gynecol Reprod Biol. 2012;163:180-184
188. Lie Fong S, Visser JA, Welt CK, de Rijke YB, Eijkemans MJ, Broekmans FJ, Roes EM, Peters WH, Hokken-Koelega AC, Fauser BC, Themmen AP, de Jong FH,

| References 93
Schipper I, Laven JS. Serum anti-mullerian hormone levels in healthy females: A nomogram ranging from infancy to adulthood. J Clin Endocrinol Metab. 2012;97:4650-4655
189. Rosen MP, Johnstone E, McCulloch CE, Schuh-Huerta SM, Sternfeld B, Reijo-Pera RA, Cedars MI. A characterization of the relationship of ovarian reserve markers with age. Fertil Steril. 2012;97:238-243
190. van Rooij IA, Broekmans FJ, te Velde ER, Fauser BC, Bancsi LF, de Jong FH, Themmen AP. Serum anti-mullerian hormone levels: A novel measure of ovarian reserve. Hum Reprod. 2002;17:3065-3071
191. Visser JA, Schipper I, Laven JS, Themmen AP. Anti-mullerian hormone: An ovarian reserve marker in primary ovarian insufficiency. Nat Rev Endocrinol. 2012;8:331-341
192. Yang YS, Hur MH, Kim SY, Young K. Correlation between sonographic and endocrine markers of ovarian aging as predictors for late menopausal transition. Menopause. 2011;18:138-145
193. Anderson RA, Nelson SM, Wallace WH. Measuring anti-mullerian hormone for the assessment of ovarian reserve: When and for whom is it indicated? Maturitas. 2012;71:28-33
194. Seifer DB, Baker VL, Leader B. Age-specific serum anti-mullerian hormone values for 17,120 women presenting to fertility centers within the united states. Fertil Steril. 2011;95:747-750
195. Kunt C, Ozaksit G, Keskin Kurt R, Cakir Gungor AN, Kanat-Pektas M, Kilic S, Dede A. Anti-mullerian hormone is a better marker than inhibin b, follicle stimulating hormone, estradiol or antral follicle count in predicting the outcome of in vitro fertilization. Arch Gynecol Obstet. 2011;283:1415-1421
196. La Marca A, Giulini S, Tirelli A, Bertucci E, Marsella T, Xella S, Volpe A. Anti-mullerian hormone measurement on any day of the menstrual cycle strongly predicts ovarian response in assisted reproductive technology. Hum Reprod. 2007;22:766-771
197. Silberstein T, Trimarchi JR, Gonzalez L, Keefe DL, Blazar AS. Pregnancy outcome in in vitro fertilization decreases to a plateau with repeated cycles. Fertil Steril. 2005;84:1043-1045
198. Gruijters MJ, Visser JA, Durlinger AL, Themmen AP. Anti-mullerian hormone and its role in ovarian function. Mol Cell Endocrinol. 2003;211:85-90
199. Moran LJ, Noakes M, Clifton PM, Norman RJ. The use of anti-mullerian hormone in predicting menstrual response after weight loss in overweight women with polycystic ovary syndrome. J Clin Endocrinol Metab. 2007;92:3796-3802
200. Pretorius ES, Outwater EK, Hunt JL, Siegelman ES. Magnetic resonance imaging of the ovary. Top Magn Reson Imaging. 2001;12:131-146
201. Lass A, Silye R, Abrams DC, Krausz T, Hovatta O, Margara R, Winston RM. Follicular density in ovarian biopsy of infertile women: A novel method to assess ovarian reserve. Hum Reprod. 1997;12:1028-1031
202. DiFiore M. Human histology. Philadelphia: Lea & Febiger. 1981. 203. Hauth EA, Jaeger HJ, Libera H, Lange S, Forsting M. Magnetic resonance imaging of
the ovaries of healthy women: Determination of normal values. Acta Radiol. 2006;47:986-992
204. Outwater EK, Mitchell DG. Normal ovaries and functional cysts: MR appearance. Radiology. 1996;198:397-402
205. Semelka R AS, Reinhold C. MRi of the abdomen and pelvis: A text atlas. New York: Wiley-Liss. 1997
206. Tamai K, Koyama T, Saga T, Kido A, Kataoka M, Umeoka S, Fujii S, Togashi K. Mr features of physiologic and benign conditions of the ovary. Eur Radiol. 2006;16:2700-2711

94 Henrik Leonhardt |
207. Togashi K. Mr imaging of the ovaries: Normal appearance and benign disease. Radiol Clin North Am. 2003;41:799-811
208. Hamn B KP, Laniado M, Volkmar N, Taupitz M. Mr imaging of the abdomen and pelvis. Stuttgart/New York: Thieme; 2010.
209. Lakhani K, Seifalian AM, Atiomo WU, Hardiman P. Polycystic ovaries. Br J Radiol. 2002;75:9-16
210. Pache TD, Wladimiroff JW, de Jong FH, Hop WC, Fauser BC. Growth patterns of nondominant ovarian follicles during the normal menstrual cycle. Fertil Steril. 1990;54:638-642
211. Deb S, Campbell BK, Clewes JS, Pincott-Allen C, Raine-Fenning NJ. Intracycle variation in number of antral follicles stratified by size and in endocrine markers of ovarian reserve in women with normal ovulatory menstrual cycles. Ultrasound Obstet Gynecol. 2013;41:216-222
212. Scheffer GJ, Broekmans FJ, Dorland M, Habbema JD, Looman CW, te Velde ER. Antral follicle counts by transvaginal ultrasonography are related to age in women with proven natural fertility. Fertil Steril. 1999;72:845-851
213. Outwater EK, Talerman A, Dunton C. Normal adnexa uteri specimens: Anatomic basis of mr imaging features. Radiology. 1996;201:751-755
214. Scheffer GJ, Broekmans FJ, Looman CW, Blankenstein M, Fauser BC, teJong FH, teVelde ER. The number of antral follicles in normal women with proven fertility is the best reflection of reproductive age. Hum Reprod. 2003;18:700-706
215. Rosen MP, Sternfeld B, Schuh-Huerta SM, Reijo Pera RA, McCulloch CE, Cedars MI. Antral follicle count: Absence of significant midlife decline. Fertil Steril. 2010;94:2182-2185
216. Alsamarai S, Adams JM, Murphy MK, Post MD, Hayden DL, Hall JE, Welt CK. Criteria for polycystic ovarian morphology in polycystic ovary syndrome as a function of age. J Clin Endocrinol Metab. 2009;94:4961-4970
217. Pavlik EJ, DePriest PD, Gallion HH, Ueland FR, Reedy MB, Kryscio RJ, van Nagell JR, Jr. Ovarian volume related to age. Gynecol Oncol. 2000;77:410-412
218. Swanson M, Sauerbrei EE, Cooperberg PL. Medical implications of ultrasonically detected polycystic ovaries. J Clin Ultrasound. 1981;9:219-222
219. Fulghesu AM, Ciampelli M, Belosi C, Apa R, Pavone V, Lanzone A. A new ultrasound criterion for the diagnosis of polycystic ovary syndrome: The ovarian stroma/total area ratio. Fertil Steril. 2001;76:326-331
220. Kristensen SL, Ramlau-Hansen CH, Ernst E, Olsen SF, Bonde JP, Vested A, Toft G. A very large proportion of young danish women have polycystic ovaries: Is a revision of the rotterdam criteria needed? Hum Reprod. 2010;25:3117-3122
221. Azziz R. Controversy in clinical endocrinology: Diagnosis of polycystic ovarian syndrome: The rotterdam criteria are premature. J Clin Endocrinol Metab. 2006;91:781-785
222. Franks S. Controversy in clinical endocrinology: Diagnosis of polycystic ovarian syndrome: In defense of the rotterdam criteria. J Clin Endocrinol Metab. 2006;91:786-789
223. Nardo LG, Buckett WM, Khullar V. Determination of the best-fitting ultrasound formulaic method for ovarian volume measurement in women with polycystic ovary syndrome. Fertil Steril. 2003;79:632-633
224. Lam PM, Johnson IR, Raine-Fenning NJ. Three-dimensional ultrasound features of the polycystic ovary and the effect of different phenotypic expressions on these parameters. Hum Reprod. 2007;22:3116-3123
225. Raine-Fenning NJ, Campbell BK, Clewes JS, Johnson IR. The interobserver reliability of ovarian volume measurement is improved with three-dimensional ultrasound, but dependent upon technique. Ultrasound Med Biol. 2003;29:1685-1690

| References 95
226. Hughesdon PE. Morphology and morphogenesis of the stein-leventhal ovary and of so-called "hyperthecosis". Obstet Gynecol Surv. 1982;37:59-77
227. Webber LJ, Stubbs S, Stark J, Trew GH, Margara R, Hardy K, Franks S. Formation and early development of follicles in the polycystic ovary. Lancet. 2003;362:1017-1021
228. Saxton DW, Farquhar CM, Rae T, Beard RW, Anderson MC, Wadsworth J. Accuracy of ultrasound measurements of female pelvic organs. Br J Obstet Gynaecol. 1990;97:695-699
229. Takahashi K, Ozaki T, Okada M, Uchida A, Kitao M. Relationship between ultrasonography and histopathological changes in polycystic ovarian syndrome. Hum Reprod. 1994;9:2255-2258
230. Piouka A, Farmakiotis D, Katsikis I, Macut D, Gerou S, Panidis D. Anti-mullerian hormone levels reflect severity of pcos but are negatively influenced by obesity: Relationship with increased luteinizing hormone levels. Am J Physiol Endocrinol Metab. 2009;296:E238-243
231. Buckett WM, Bouzayen R, Watkin KL, Tulandi T, Tan SL. Ovarian stromal echogenicity in women with normal and polycystic ovaries. Hum Reprod. 1999;14:618-621
232. Fulghesu AM, Angioni S, Frau E, Belosi C, Apa R, Mioni R, Xamin N, Capobianco GP, Dessole S, Fruzzetti F, Lazzarini V, Minerba L, Melis GB, Lanzone A. Ultrasound in polycystic ovary syndrome--the measuring of ovarian stroma and relationship with circulating androgens: Results of a multicentric study. Hum Reprod. 2007;22:2501-2508
233. Kyei-Mensah AA, LinTan S, Zaidi J, Jacobs HS. Relationship of ovarian stromal volume to serum androgen concentrations in patients with polycystic ovary syndrome. Hum Reprod. 1998;13:1437-1441
234. Adali E, Kolusari A, Adali F, Yildizhan R, Kurdoglu M, Sahin HG. Doppler analysis of uterine perfusion and ovarian stromal blood flow in polycystic ovary syndrome. Int J Gynaecol Obstet. 2009;105:154-157
235. Battaglia C, Artini PG, D'Ambrogio G, Genazzani AD, Genazzani AR. The role of color doppler imaging in the diagnosis of polycystic ovary syndrome. Am J Obstet Gynecol. 1995;172:108-113
236. Jarvela IY, Mason HD, Sladkevicius P, Kelly S, Ojha K, Campbell S, Nargund G. Characterization of normal and polycystic ovaries using three-dimensional power doppler ultrasonography. J Assist Reprod Genet. 2002;19:582-590
237. Ng EH, Chan CC, Yeung WS, Ho PC. Comparison of ovarian stromal blood flow between fertile women with normal ovaries and infertile women with polycystic ovary syndrome. Hum Reprod. 2005;20:1881-1886
238. Pan HA, Wu MH, Cheng YC, Li CH, Chang FM. Quantification of doppler signal in polycystic ovary syndrome using three-dimensional power doppler ultrasonography: A possible new marker for diagnosis. Hum Reprod. 2002;17:201-206
239. Pascual MA, Graupera B, Hereter L, Tresserra F, Rodriguez I, Alcazar JL. Assessment of ovarian vascularization in the polycystic ovary by three-dimensional power doppler ultrasonography. Gynecol Endocrinol. 2008;24:631-636
240. Zaidi J, Campbell S, Pittrof R, Kyei-Mensah A, Shaker A, Jacobs HS, Tan SL. Ovarian stromal blood flow in women with polycystic ovaries--a possible new marker for diagnosis? Hum Reprod. 1995;10:1992-1996
241. Erdem CZ, Bayar U, Erdem LO, Barut A, Gundogdu S, Kaya E. Polycystic ovary syndrome: Dynamic contrast-enhanced ovary mr imaging. Eur J Radiol. 2004;51:48-53
242. Franks S, Adams J, Mason H, Polson D. Ovulatory disorders in women with polycystic ovary syndrome. Clin Obstet Gynaecol. 1985;12:605-632

96 Henrik Leonhardt |
243. Yoo RY, Sirlin CB, Gottschalk M, Chang RJ. Ovarian imaging by magnetic resonance in obese adolescent girls with polycystic ovary syndrome: A pilot study. Fertil Steril. 2005;84:985-995
244. Hauth EA, Umutlu L, Libera H, Kimmig R, Forsting M. [magnetic resonance imaging of the pelvis in patients with polycystic ovary syndrome]. Rofo. 2009;181:543-548
245. Kimura I, Togashi K, Kawakami S, Nakano Y, Takakura K, Mori T, Konishi J. Polycystic ovaries: Implications of diagnosis with mr imaging. Radiology. 1996;201:549-552
246. Mitchell DG, Gefter WB, Spritzer CE, Blasco L, Nulson J, Livolsi V, Axel L, Arger PH, Kressel HY. Polycystic ovaries: Mr imaging. Radiology. 1986;160:425-429
247. Occhipinti KA, Frankel SD, Hricak H. The ovary. Computed tomography and magnetic resonance imaging. Radiol Clin North Am. 1993;31:1115-1132
248. Rosenkrantz AB, Popiolek D, Bennett GL, Hecht EM. Magnetic resonance imaging appearance of ovarian stromal hyperplasia and ovarian hyperthecosis. J Comput Assist Tomogr. 2009;33:912-916
249. Goldman JM, Kapadia LJ. Virilization in a postmenopausal woman due to ovarian stromal hyperthecosis. Postgrad Med J. 1991;67:304-306
250. Rousset P, Gompel A, Christin-Maitre S, Pugeat M, Hugol D, Ghossain MA, Buy JN. Ovarian hyperthecosis on grayscale and color doppler ultrasound. Ultrasound Obstet Gynecol. 2008;32:694-699
251. Fujii S, Kiyokawa T, Tsukihara S, Senda T, Tahara T, Kaminou T, Ogawa T. Magnetic resonance imaging findings of ovarian stromal hyperthecosis. Acta Radiol. 2009;50:954-957
252. Farquhar C, Brown J, Marjoribanks J. Laparoscopic drilling by diathermy or laser for ovulation induction in anovulatory polycystic ovary syndrome. Cochrane Database Syst Rev. 2012;6:CD001122
253. Leerentveld RA, van Gent I, van der Stoep M, Wladimiroff JW. Ultrasonographic assessment of Graafian follicle growth under monofollicular and multifollicular conditions in clomiphene citrate-stimulated cycles. Fertil Steril. 1985;43:565-569
254. MacDougall MJ, Tan SL, Hall V, Balen A, Mason BA, Jacobs HS. Comparison of natural with clomiphene citrate-stimulated cycles in in vitro fertilization: A prospective, randomized trial. Fertil Steril. 1994;61:1052-1057
255. Polson DW, Kiddy DS, Mason HD, Franks S. Induction of ovulation with clomiphene citrate in women with polycystic ovary syndrome: The difference between responders and nonresponders. Fertil Steril. 1989;51:30-34
256. Shalev J, Goldenberg M, Kukia E, Lewinthal D, Tepper R, Mashiach S, Blankstein J. Comparison of five clomiphene citrate dosage regimens: Follicular recruitment and distribution in the human ovary. Fertil Steril. 1989;52:560-563
257. Bentzen JG, Forman JL, Pinborg A, Lidegaard O, Larsen EC, Friis-Hansen L, Johannsen TH, Nyboe Andersen A. Ovarian reserve parameters: A comparison between users and non-users of hormonal contraception. Reprod Biomed Online. 2012;25:612-619
258. Christensen JT, Boldsen J, Westergaard JG. Ovarian volume in gynecologically healthy women using no contraception, or using iud or oral contraception. Acta Obstet Gynecol Scand. 1997;76:784-789
259. Fleming R, Harborne L, MacLaughlin DT, Ling D, Norman J, Sattar N, Seifer DB. Metformin reduces serum mullerian-inhibiting substance levels in women with polycystic ovary syndrome after protracted treatment. Fertil Steril. 2005;83:130-136
260. Lord JM, Flight IH, Norman RJ. Metformin in polycystic ovary syndrome: Systematic review and meta-analysis. BMJ. 2003;327:951-953

| References 97
261. Bayrak A, Terbell H, Urwitz-Lane R, Mor E, Stanczyk FZ, Paulson RJ. Acute effects of metformin therapy include improvement of insulin resistance and ovarian morphology. Fertil Steril. 2007;87:870-875
262. Moran LJ, Hutchison SK, Norman RJ, Teede HJ. Lifestyle changes in women with polycystic ovary syndrome. Cochrane Database Syst Rev. 2011:CD007506
263. Huber-Buchholz MM, Carey DG, Norman RJ. Restoration of reproductive potential by lifestyle modification in obese polycystic ovary syndrome: Role of insulin sensitivity and luteinizing hormone. J Clin Endocrinol Metab. 1999;84:1470-1474
264. Hutchison SK, Stepto NK, Harrison CL, Moran LJ, Strauss BJ, Teede HJ. Effects of exercise on insulin resistance and body composition in overweight and obese women with and without polycystic ovary syndrome. J Clin Endocrinol Metab. 2011;96:E48-56
265. Jedel E, Labrie F, Oden A, Holm G, Nilsson L, Janson PO, Lind AK, Ohlsson C, Stener-Victorin E. Impact of electro-acupuncture and physical exercise on hyperandrogenism and oligo/amenorrhea in women with polycystic ovary syndrome: A randomized controlled trial. Am J Physiol Endocrinol Metab. 2011;300:E37-45
266. Stener-Victorin E, Waldenstrom U, Tagnfors U, Lundeberg T, Lindstedt G, Janson PO. Effects of electro-acupuncture on anovulation in women with polycystic ovary syndrome. Acta Obstet Gynecol Scand. 2000;79:180-188
267. Johansson J, Redman L, Veldhuis PP, Sazonova A, Labrie F, Holm G, Johannsson G, Stener-Victorin E. Acupuncture for ovulation induction in polycystic ovary syndrome: A randomized controlled trial. Am J Physiol Endocrinol Metab. 2013
268. Manneras L, Cajander S, Lonn M, Stener-Victorin E. Acupuncture and exercise restore adipose tissue expression of sympathetic markers and improve ovarian morphology in rats with dihydrotestosterone-induced pcos. Am J Physiol Regul Integr Comp Physiol. 2009;296:R1124-1131
269. Hatch R, Rosenfield RL, Kim MH, Tredway D. Hirsutism: Implications, etiology, and management. Am J Obstet Gynecol. 1981;140:815-830
270. Deb S, Batcha M, Campbell BK, Jayaprakasan K, Clewes JS, Hopkisson JF, Sjoblom C, Raine-Fenning NJ. The predictive value of the automated quantification of the number and size of small antral follicles in women undergoing art. Hum Reprod. 2009;24:2124-2132
271. Deb S, Campbell BK, Clewes JS, Raine-Fenning NJ. Quantitative analysis of antral follicle number and size: A comparison of two-dimensional and automated three-dimensional ultrasound techniques. Ultrasound Obstet Gynecol. 2010;35:354-360
272. Deb S, Jayaprakasan K, Campbell BK, Clewes JS, Johnson IR, Raine-Fenning NJ. Intraobserver and interobserver reliability of automated antral follicle counts made using three-dimensional ultrasound and sonoavc. Ultrasound Obstet Gynecol. 2009;33:477-483
273. Abate N, Burns D, Peshock RM, Garg A, Grundy SM. Estimation of adipose tissue mass by magnetic resonance imaging: Validation against dissection in human cadavers. J Lipid Res. 1994;35:1490-1496
274. Goodpaster BH. Measuring body fat distribution and content in humans. Curr Opin Clin Nutr Metab Care. 2002;5:481-487
275. Vermeulen A, Verdonck L, Kaufman JM. A critical evaluation of simple methods for the estimation of free testosterone in serum. J Clin Endocrinol Metab. 1999;84:3666-3672
276. Manneras-Holm L, Baghaei F, Holm G, Janson PO, Ohlsson C, Lonn M, Stener-Victorin E. Coagulation and fibrinolytic disturbances in women with polycystic ovary syndrome. J Clin Endocrinol Metab. 2011
277. Manneras-Holm L, Leonhardt H, Kullberg J, Jennische E, Oden A, Holm G, Hellstrom M, Lonn L, Olivecrona G, Stener-Victorin E, Lonn M. Adipose tissue has aberrant

98 Henrik Leonhardt |
morphology and function in pcos: Enlarged adipocytes and low serum adiponectin, but not circulating sex steroids, are strongly associated with insulin resistance. J Clin Endocrinol Metab. 2011;96:E304-311
278. Bland JM, Altman DG. Statistical methods for assessing agreement between two methods of clinical measurement. Lancet. 1986;1:307-310
279. Kido A, Togashi K, Kataoka ML, Nakai A, Koyama T, Fujii S. Intrauterine devices and uterine peristalsis: Evaluation with MRI. Magn Reson Imaging. 2008;26:54-58
280. Nishino M, Togashi K, Nakai A, Hayakawa K, Kanao S, Iwasaku K, Fujii S. Uterine contractions evaluated on cine MR imaging in patients with uterine leiomyomas. Eur J Radiol. 2005;53:142-146
281. Orisaka M, Kurokawa T, Shukunami K, Orisaka S, Fukuda MT, Shinagawa A, Fukuda S, Ihara N, Yamada H, Itoh H, Kotsuji F. A comparison of uterine peristalsis in women with normal uteri and uterine leiomyoma by cine magnetic resonance imaging. Eur J Obstet Gynecol Reprod Biol. 2007;135:111-115
282. Fanchin R, Righini C, Olivennes F, Taylor S, de Ziegler D, Frydman R. Uterine contractions at the time of embryo transfer alter pregnancy rates after in-vitro fertilization. Hum Reprod. 1998;13:1968-1974
283. Rothman MS, Carlson NE, Xu M, Wang C, Swerdloff R, Lee P, Goh VH, Ridgway EC, Wierman ME. Reexamination of testosterone, dihydrotestosterone, estradiol and estrone levels across the menstrual cycle and in postmenopausal women measured by liquid chromatography-tandem mass spectrometry. Steroids. 2011;76:177-182
284. Bossuyt PM, Reitsma JB, Bruns DE, Gatsonis CA, Glasziou PP, Irwig LM, Lijmer JG, Moher D, Rennie D, de Vet HC. Towards complete and accurate reporting of studies of diagnostic accuracy: The stard initiative. Radiology. 2003;226:24-28
285. Metz CE. Receiver operating characteristic analysis: A tool for the quantitative evaluation of observer performance and imaging systems. J Am Coll Radiol. 2006;3:413-422
286. Gellerstedt M, Furberg B. Diagnostik - en tolkningsfråga? Holmbergs. Malmö. 2007 287. La Marca A, Stabile G, Artenisio AC, Volpe A. Serum anti-mullerian hormone
throughout the human menstrual cycle. Hum Reprod. 2006;21:3103-3107 288. Tsepelidis S, Devreker F, Demeestere I, Flahaut A, Gervy C, Englert Y. Stable serum
levels of anti-mullerian hormone during the menstrual cycle: A prospective study in normo-ovulatory women. Hum Reprod. 2007;22:1837-1840
289. Overbeek A, Broekmans FJ, Hehenkamp WJ, Wijdeveld ME, van Disseldorp J, van Dulmen-den Broeder E, Lambalk CB. Intra-cycle fluctuations of anti-mullerian hormone in normal women with a regular cycle: A re-analysis. Reprod Biomed Online. 2012;24:664-669
290. Robertson DM, Hale GE, Fraser IS, Hughes CL, Burger HG. Changes in serum antimullerian hormone levels across the ovulatory menstrual cycle in late reproductive age. Menopause. 2011;18:521-524
291. Nelson SM, Anderson RA, Broekmans FJ, Raine-Fenning N, Fleming R, La Marca A. Anti-mullerian hormone: Clairvoyance or crystal clear? Hum Reprod. 2012;27:631-636
292. Shrout PE, Fleiss JL. Intraclass correlations: Uses in assessing rater reliability. Psychol Bull. 1979;86:420-428
293. Brismar J, Jacobsson B. Definition of terms used to judge the efficacy of diagnostic tests: A graphic approach. AJR Am J Roentgenol. 1990;155:621-623
294. Moro C, Pasarica M, Elkind-Hirsch K, Redman LM. Aerobic exercise training improves atrial natriuretic peptide and catecholamine-mediated lipolysis in obese women with polycystic ovary syndrome. J Clin Endocrinol Metab. 2009;94:2579-2586
295. Palomba S, Falbo A, Giallauria F, Russo T, Rocca M, Tolino A, Zullo F, Orio F. Six weeks of structured exercise training and hypocaloric diet increases the probability of

| References 99
ovulation after clomiphene citrate in overweight and obese patients with polycystic ovary syndrome: A randomized controlled trial. Hum Reprod. 2010;25:2783-2791
296. Randeva HS, Lewandowski KC, Drzewoski J, Brooke-Wavell K, O'Callaghan C, Czupryniak L, Hillhouse EW, Prelevic GM. Exercise decreases plasma total homocysteine in overweight young women with polycystic ovary syndrome. J Clin Endocrinol Metab. 2002;87:4496-4501
297. Thomson RL, Buckley JD, Noakes M, Clifton PM, Norman RJ, Brinkworth GD. The effect of a hypocaloric diet with and without exercise training on body composition, cardiometabolic risk profile, and reproductive function in overweight and obese women with polycystic ovary syndrome. J Clin Endocrinol Metab. 2008;93:3373-3380
298. Feng Y, Johansson J, Shao R, Manneras L, Fernandez-Rodriguez J, Billig H, Stener-Victorin E. Hypothalamic neuroendocrine functions in rats with dihydrotestosterone-induced polycystic ovary syndrome: Effects of low-frequency electro-acupuncture. PLoS One. 2009;4:e6638
299. Feng Y, Johansson J, Shao R, Manneras-Holm L, Billig H, Stener-Victorin E. Electrical and manual acupuncture stimulation affect oestrous cyclicity and neuroendocrine function in an 5alpha-dihydrotestosterone-induced rat polycystic ovary syndrome model. Exp Physiol. 2012;97:651-662
300. Johansson J, Feng Y, Shao R, Lonn M, Billig H, Stener-Victorin E. Intense electroacupuncture normalizes insulin sensitivity, increases muscle glut4 content, and improves lipid profile in a rat model of polycystic ovary syndrome. Am J Physiol Endocrinol Metab. 2010;299:E551-559
301. Manneras L, Jonsdottir IH, Holmang A, Lonn M, Stener-Victorin E. Low-frequency electro-acupuncture and physical exercise improve metabolic disturbances and modulate gene expression in adipose tissue in rats with dihydrotestosterone-induced polycystic ovary syndrome. Endocrinology. 2008;149:3559-3568
302. Manni L, Lundeberg T, Holmang A, Aloe L, Stener-Victorin E. Effect of electro-acupuncture on ovarian expression of alpha (1)- and beta (2)-adrenoceptors, and p75 neurotrophin receptors in rats with steroid-induced polycystic ovaries. Reprod Biol Endocrinol. 2005;3:21
303. Stener-Victorin E, Baghaei F, Holm G, Janson PO, Olivecrona G, Lonn M, Manneras-Holm L. Effects of acupuncture and exercise on insulin sensitivity, adipose tissue characteristics, and markers of coagulation and fibrinolysis in women with polycystic ovary syndrome: Secondary analyses of a randomized controlled trial. Fertil Steril. 2012;97:501-508
304. Stener-Victorin E, Jedel E, Janson PO, Sverrisdottir YB. Low-frequency electroacupuncture and physical exercise decrease high muscle sympathetic nerve activity in polycystic ovary syndrome. Am J Physiol Regul Integr Comp Physiol. 2009;297:R387-395
305. Stener-Victorin E, Lindholm C. Immunity and beta-endorphin concentrations in hypothalamus and plasma in rats with steroid-induced polycystic ovaries: Effect of low-frequency electroacupuncture. Biol Reprod. 2004;70:329-333
306. Stener-Victorin E, Lundeberg T, Waldenstrom U, Manni L, Aloe L, Gunnarsson S, Janson PO. Effects of electro-acupuncture on nerve growth factor and ovarian morphology in rats with experimentally induced polycystic ovaries. Biol Reprod. 2000;63:1497-1503
