hepatocellular carcinoma development and · hepatocellular carcinoma (hcc) is a highly aggressive...
TRANSCRIPT
Astrocyte elevated gene-1 regulateshepatocellular carcinoma development andprogression
Byoung Kwon Yoo, … , Paul B. Fisher, Devanand Sarkar
J Clin Invest. 2009;119(3):465-477. https://doi.org/10.1172/JCI36460.
Hepatocellular carcinoma (HCC) is a highly aggressive vascular cancer characterized bydiverse etiology, activation of multiple signal transduction pathways, and various genemutations. Here, we have determined a specific role for astrocyte elevated gene-1 (AEG1)in HCC pathogenesis. Expression of AEG1 was extremely low in human hepatocytes, butits levels were significantly increased in human HCC. Stable overexpression of AEG1converted nontumorigenic human HCC cells into highly aggressive vascular tumors, andinhibition of AEG1 abrogated tumorigenesis by aggressive HCC cells in a xenograft modelof nude mice. In human HCC, AEG1 overexpression was associated with elevated copynumbers. Microarray analysis revealed that AEG1 modulated the expression of genesassociated with invasion, metastasis, chemoresistance, angiogenesis, and senescence.AEG1 also was found to activate Wnt/b-catenin signaling via ERK42/44 activation andupregulated lymphoid-enhancing factor 1/T cell factor 1 (LEF1/TCF1), the ultimate executorof the Wnt pathway, important for HCC progression. Inhibition studies further demonstratedthat activation of Wnt signaling played a key role in mediating AEG1 function. AEG1 alsoactivated the NF-kB pathway, which may play a role in the chronic inflammatory changespreceding HCC development. These data indicate that AEG1 plays a central role inregulating diverse aspects of HCC pathogenesis. Targeted inhibition of AEG1 might lead tothe shutdown of key elemental characteristics of HCC and could lead to an effective […]
Research Article Oncology
Find the latest version:
http://jci.me/36460/pdf

Research article
TheJournalofClinicalInvestigation http://www.jci.org Volume 119 Number 3 March 2009 465
Astrocyte elevated gene-1 regulates hepatocellular carcinoma development
and progressionByoung Kwon Yoo,1 Luni Emdad,1 Zao-zhong Su,1 Augusto Villanueva,2 Derek Y. Chiang,3,4
Nitai D. Mukhopadhyay,5 Alan Scott Mills,6 Samuel Waxman,7 Robert A. Fisher,8 Josep M. Llovet,2,7,9 Paul B. Fisher,1,10,11 and Devanand Sarkar1,10,11
1Department of Human and Molecular Genetics, Virginia Commonwealth University School of Medicine, Richmond, Virginia, USA. 2Barcelona Clinic Liver Cancer Group, Liver Unit, HCC Translational Research Lab, IDIBAPS, CIBERehd, Hospital Clinic, Barcelona, Spain. 3Department of Medical Oncology and Center for Cancer Genome Discovery, Dana-Farber Cancer Institute, Boston, Massachusetts, USA.
4Cancer Program, Broad Institute of MIT and Harvard, Cambridge, Massachusetts, USA. 5Department of Biostatistics and 6Department of Pathology, Virginia Commonwealth University School of Medicine, Richmond, Virginia, USA. 7Mount Sinai Liver Cancer Program, Mount Sinai School of Medicine,
New York, New York, USA. 8Division of Transplant Surgery, Department of Surgery, Virginia Commonwealth University School of Medicine, Richmond, Virginia, USA. 9Institució Catalana de Recerca i Estudis Avançats, Barcelona, Spain. 10Institute of Molecular Medicine and
11Massey Cancer Center, Virginia Commonwealth University School of Medicine, Richmond, Virginia, USA.
Hepatocellularcarcinoma(HCC)isahighlyaggressivevascularcancercharacterizedbydiverseetiology,acti-vationofmultiplesignaltransductionpathways,andvariousgenemutations.Here,wehavedeterminedaspe-cificroleforastrocyteelevatedgene-1(AEG1)inHCCpathogenesis.ExpressionofAEG1wasextremelylowinhumanhepatocytes,butitslevelsweresignificantlyincreasedinhumanHCC.StableoverexpressionofAEG1convertednontumorigenichumanHCCcellsintohighlyaggressivevasculartumors,andinhibitionofAEG1abrogatedtumorigenesisbyaggressiveHCCcellsinaxenograftmodelofnudemice.InhumanHCC,AEG1overexpressionwasassociatedwithelevatedcopynumbers.MicroarrayanalysisrevealedthatAEG1modulatedtheexpressionofgenesassociatedwithinvasion,metastasis,chemoresistance,angiogenesis,andsenescence.AEG1alsowasfoundtoactivateWnt/β-cateninsignalingviaERK42/44activationandupregulatedlymphoid-enhancingfactor1/Tcellfactor1(LEF1/TCF1),theultimateexecutoroftheWntpathway,importantforHCCprogression.InhibitionstudiesfurtherdemonstratedthatactivationofWntsignalingplayedakeyroleinmediatingAEG1function.AEG1alsoactivatedtheNF-κBpathway,whichmayplayaroleinthechronicinflammatorychangesprecedingHCCdevelopment.ThesedataindicatethatAEG1playsacentralroleinregulatingdiverseaspectsofHCCpathogenesis.TargetedinhibitionofAEG1mightleadtotheshutdownofkeyelementalcharacteristicsofHCCandcouldleadtoaneffectivetherapeuticstrategyforHCC.
IntroductionHepatocellular carcinoma (HCC) is one of the 5 most common can-cers worldwide (1). HCC has a high prevalence in Asian countries because of endemic HBV infection, and the incidence of HCC has been rising in Western countries over the past 20 years owing to increasing HCV infection and chronic alcoholism (2). In the US, it was estimated that the number of new cases of HCC in 2008 would total 21,370, with 18,410 of these expected to die (3). HCC is a tumor with rapid growth and early vascular invasion (4). It is also highly resistant to standard chemotherapy (5–7). The treat-ment options for HCC depend upon the stages and grades of the disease (8). With localized disease, surgical resection, liver trans-plantation, radiofrequency ablation, and chemoembolization are
the treatments of choice (9, 10). However, most HCC patients pres-ent with advanced symptomatic tumors with underlying cirrhotic changes that are not amenable to surgical resection or transplanta-tion. Systemic therapy with doxorubicin alone or a combination of cisplatin, interferon, doxorubicin, and 5-fluorouracil (PIAF) has not demonstrated any survival benefits in well-designed random-ized controlled trials (7, 10–14). Recently, sorafenib, an inhibitor of c-Raf and B-Raf kinases as well as of VEGFR family and PDGFR, has been introduced as the standard of care for the treatment of patients with advanced HCC based on a recently published phase III clinical trial (15–17). While the median survival for placebo-treated patients was approximately 7.9 months, sorafenib-treated patients survived 10.7 months (16, 17). The VEGF pathway inhibitor beva-cizumab, either alone or in combination with chemotherapy, has demonstrated limited response (9, 18). Other targeted therapies, such as erlotinib, everolimus, brivanib, and sunitinib are currently being tested in advanced clinical research investigations (19). In view of this dismal scenario, understanding the molecular patho-genesis of HCC and developing targeted and effective treatments are mandatory for significantly increasing the survival interval and ameliorating the suffering of patients.
Multiple etiologies have been linked to HCC, and therefore no consistent genetic abnormalities have been attributed to this dis-
Conflictofinterest: The authors have declared that no conflict of interest exists.
Nonstandardabbreviationsused: AEG1, astrocyte elevated gene-1; APC, adenoma-tous polyposis coli; CBP, CREB-binding protein; CTBP2, C-terminal–binding protein 2; DPYD, dihydropyrimidine dehydrogenase; 5-FU, 5-fluorouracil; Fzd, Frizzled; GSK3β, glycogen synthase kinase 3β; HCC, hepatocellular carcinoma; IGFBP7, IGF-binding protein 7; LEF1, lymphoid-enhancing factor 1; LRP5/6, LDL receptor–related proteins 5 and 6; MTT, 3-(4,5-dimethylthiazol-2-yl)-2,5-diphenyltetrazolium bromide; PHFA, primary human fetal astrocytes; PIGF, placental growth factor; TCF1, T cell factor 1; TFCP2, transcription factor CP2.
Citationforthisarticle: J. Clin. Invest. 119:465–477 (2009). doi:10.1172/JCI36460.

research article
466 TheJournalofClinicalInvestigation http://www.jci.org Volume 119 Number 3 March 2009
ease. Chronic HBV infection results in HCC by integration of HBV DNA into the genome, leading to chromosomal instability, and by HBV x protein (HBx), which activates a plethora of protooncogenes and signaling pathways associated with HCC (20, 21). Chronic HCV infection causes HCC via core HCV proteins NS3 and NS5A, which inhibit the cyclin-dependent kinase inhibitor p21 and inter-act with p53 (22, 23). Mutations in numerous protooncogenes and tumor suppressor genes, such as p53, p73, Rb, adenomatous pol-yposis coli (APC), DLC-1, DLC-2, PTEN, SOCS1, GSTP1, HCCS1, Smad2/4, AXIN1, IGF-2, β-catenin, c-myc, and cyclin D1, have been detected in HCC (24–26). The major signaling pathways activated in HCC are (a) MAPK, which includes cascades of phosphorylation of ras, raf, MEK, and ERK (activation of this pathway has been well documented in HCC cell lines, in vivo HCC models, and human HCC specimens; refs. 27, 28); (b) PI3K/Akt/mTOR pathway (29, 30); (c) NF-κB pathway, which might be activated by viral infection (persistent activation of NF-κB in the premalignant stage confers a survival advantage to hepatocytes that have acquired oncogenic mutations, thus favoring malignant transformation; ref. 31); and (d) Wnt/β-catenin–signaling pathway (32, 33). The activation of multiple signaling pathways in different HCCs makes it difficult to develop effective alternative therapies using small molecules. Iden-tification of a key molecule that contributes to the simultaneous activation of some of these pathways would provide an important target for therapeutic intervention for HCC.
Wnts are secreted glycoproteins that play a pivotal role in a vari-ety of cellular processes, embryogenesis, body-axis formation, neu-rogenesis, and carcinogenesis (33). There are 19 members of human Wnt family proteins that have been identified so far (34). Wnts bind to 7-transmembrane–type cell surface Frizzled (Fzd) receptors, which have cytoplasmic Dishevelled-binding motif (35). Currently, there are 10 identified members of the Fzd family. Canonical Wnt signaling is transduced to Fzd family and LDL receptor–related proteins 5 and 6 (LRP5/6) coreceptors, which are LDL family pro-teins with extracellular Wnt-binding domains and cytoplasmic Axin-binding motif (36, 37). β-Catenin is the chief downstream effector of the canonical Wnt signaling pathway. In the normal steady state, β-catenin is targeted for degradation by phosphoryla-tion at serine and threonine residues through the action of casein kinase Iα and glycogen synthase kinase 3β (GSK3β) (38). These pro-teins form a larger degradation complex with axin, APC, and diver-sin, all of which play a role in successful posttranslational modi-fication of β-catenin, which leads to recognition and subsequent ubiquitination by the β-transducin repeat–containing protein (39). An activated state is brought about when Wnt binds to Fzd, inducing the assembly of Fzd-Dishevelled complex and LRP5/6-Axin complex, ultimately leading to the inactivation of GSK3β by Dishevelled. This leads to hypophosphorylation of β-catenin and its release from the complex with APC and axin, with ensuing nuclear translocation of β-catenin, where it binds to high-mobility group (HMG) box that contains the DNA-binding protein T cell factor/lymphoid-enhancing factor (TCF/LEF) family member; this complex controls transcription of various target genes (40). Legless family docking proteins (Bcl9 and Bcl9L) link β-catenin to pygopus (PYGO) family coactivators, and the TCF/LEF–β-catenin–Legless–PYGO nuclear complex is the effector of the canonical Wnt signal-ing pathway (41). In the absence of Wnt signaling, TCF/LEF binds to corepressors such as Groucho and C-terminal–binding protein 2 (CTBP2) to inhibit transcription of target genes (42, 43). The TCF/LEF target genes include those that encode the cell-cycle–related
proteins c-myc and cyclin D1; adhesion molecules E-cadherin, CD44, and claudin 1 (CLDN1); transcription factors PPARδ and c-jun; and mediators of Wnt signaling itself, including TCF1, LEF1, Axin-2, Dickkoph, and Fzd-7 (see full list at http://www.stanford.edu/%7ernusse/pathways/targets.html).
The Wnt/β-catenin pathway plays an important role in progres-sion of HCC, and dysregulation of this pathway characterizes a genomic subclass of HCC (44). Around one-third of HCCs display β-catenin activation because of diverse mechanisms that include mutations in genes encoding β-catenin (CTNNB1), Axin1, and Axin 2 as well as Fzd-7 upregulation and GSK3β inactivation (45–49). In mice, liver-specific deletion of APC induces β-catenin stabilization and increased HCC (50). Simultaneous mutation of β-catenin and Ha-ras leads to 100% incidence of HCC in mice (51). Transgenic mouse models overexpressing c-myc or TGF-β show mutation and/or nuclear translocation of β-catenin in liver tumors (52). β-catenin activation provides additional growth and invasive advantages in a model of liver cancer promotion with phe-nobarbital in c-myc/TGF-α transgenic mice. These findings dem-onstrate that activation of the Wnt/β-catenin pathway is extremely important for HCC development and progression.
Astrocyte elevated gene-1 (AEG1) was first cloned as an HIV- and TNF-α–inducible gene in primary human fetal astrocytes (PHFAs) (53, 54). In vivo phage screening allowed the cloning of mouse AEG1 as a protein mediating metastasis of breast cancer cells to lung and was named metadherin (55). Mouse/rat AEG1 was also cloned by gene-trapping techniques and was named 3D3/lyric (56). AEG1 mRNA encodes a single-pass transmembrane protein of pre-dicted molecular mass of approximately 64-kDa and pI 9.3. Expres-sion analysis revealed that AEG1 expression is significantly higher in melanoma, breast and prostate cancers, and malignant glioma cell lines compared with their normal counterparts (54). Overex-pression of AEG1 augments the anchorage-independent growth of HeLa cells and human glioma cell lines and increases their migra-tion and invasion properties (57, 58). Conversely, inhibition of AEG1 by siRNA significantly inhibits migration and invasion of malignant glioma cells and prostate cancer cells as well as in vivo lung metastasis of breast cancer cells (55, 59, 60). AEG1 synergizes with Ha-ras to augment the transformed phenotype in immortal SV40 T antigen–expressing human melanocytes (FM516-SV) as well as in PHFAs (54). Interestingly, AEG1 itself is a downstream target of Ha-ras and plays an important role in mediating the growth-pro-moting effects of Ha-ras (61). In PHFAs, FM516-SV, and rat embry-onic fibroblasts, AEG1 protects from serum starvation–induced apoptosis by activating PI3K/Akt signaling, indicating that AEG1 might function as a potential oncogene (62). By activating Akt, AEG1 downregulates proapoptotic Bad and p21 and upregulates MDM2, nullifying p53 function, thus exerting its antiapoptotic effect (62). Inhibition of AEG1 in prostate cancer cells downregu-lates Akt activation and leads to upregulation of forkhead box 03A (FOXO3A) activity, resulting in apoptosis (60).
One molecular mechanism by which AEG1 increases migration and invasion of malignant glioma cells is activation of the NF-κB pathway (57, 58). Inhibition of NF-κB nullified AEG1-induced aug-mentation of anchorage-independent growth, invasion, and migra-tion (57). AEG1 is a transmembrane protein located predominantly in the perinuclear region (56, 57). However, upon treatment with TNF-α or when overexpressed, AEG1 translocates into the nucleus, where it interacts with the p65 subunit of NF-κB as well as with CREB-binding protein (CBP) (57, 58). AEG1 itself does not have a

research article
TheJournalofClinicalInvestigation http://www.jci.org Volume 119 Number 3 March 2009 467
DNA-binding domain, and it resides in the NF-κB complex bound to IL-8 promoter, indicating that AEG1 might function as a bridg-ing factor among NF-κB, CBP, and basal transcription machinery (58). Thus AEG1 might function as a transcriptional coactivator.
The present manuscript focuses on elucidating the role of AEG1 in HCC pathogenesis. We demonstrate that AEG1 is overexpressed in HCC compared with normal human liver and that overexpression of AEG1 converts nontumorigenic HCC cells into highly aggres-sive and vascular tumors. More importantly, we also unravel what we believe are novel aspects of the molecular mechanism by which AEG1 augments HCC progression as compared with other tumor models. AEG1 activates multiple signal transduction pathways, known to be involved in HCC progression, and augments angiogen-esis- and chemoresistance-associated genes, 2 key elements of HCC. Our studies establish AEG1 as a key regulator of HCC progression.
ResultsAEG1 is overexpressed in HCC. Expression of AEG1 was analyzed by Western blotting in primary rat hepatocytes and human HCC cell lines HepG3, QGY-7703, SNU-423, Hep3B, HuH7, Sk-Hep-1,
and Focus. Of these cells, HepG3 cells do not form tumors in nude mice, while QGY-7703 HCC cells form aggressive tumors (63). A very low level of AEG1 expression is detected in primary rat hepatocytes compared with all the human HCC cells (Figure 1A). Interestingly, AEG1 expression was higher in QGY-7703 cells com-pared with HepG3 cells (Figure 1A). These findings were extended by 2 tissue microarrays: one containing 40 primary HCC, 10 metastatic HCC, and 9 normal adjacent liver samples (IMH-360; Imgenex); the other containing 46 primary HCC and 13 meta-static HCC (IMH-318; Imgenex) that were immunostained using anti-AEG1 antibody. Very little to no AEG1 immunostaining was detected in the 9 normal liver samples (Figure 1B and Table 1), while significant AEG1 staining was observed in HCC samples (Figure 1, C–I, and Table 1). AEG1 expression was detected pre-dominantly in the perinuclear region. Among the 109 HCC samples, only 7 scored negative for AEG1 and the remaining 102 (93.58%) showed variable levels of AEG1 that could be correlated with the stages of the disease based on the Barcelona Clinic Liver Cancer (BCLC) staging system (Table 1) (8). Expression of AEG1 gradually increased in stages I–IV (Figure 1, D, F, H, and C) as well
Figure 1AEG1 is overexpressed in HCC cells and HCC tumor samples, and AEG1 inhibition blocks HCC tumorigenesis. (A) Expression of AEG1 was analyzed in the indicated cell lines. Hepatocytes represent primary rat hepatocytes. Expression of β-tubulin was used as loading control. (B–I) Analysis of AEG1 expression in tissue microarray: (B) normal human liver; (C) stage IV, poorly differentiated; (D) stage I, well differentiated; (E) stage I, poorly differentiated; (F) stage II, well differentiated; (G) stage II, poorly differentiated; (H) stage III, well differentiated; and (I) stage III, poorly differentiated. Original magnification, ×400. (J) Analysis of AEG1 expression in HCC samples by gene expression microarray (Human Affymetrix 133 plus 2.0). Fold changes in gene expression in different stages of human HCC. LGDN, low-grade dysplastic nodule; HGDN, high-grade dysplastic nodule. Asterisk indicates significant difference. (K) Analysis of correlation between AEG1 copy number and AEG1 expres-sion. (L) Inhibition of growth of QGY-7703 xenografts in athymic nude mice by AEG1 siRNA. Treatment protocol is described in Methods. Data represent mean ± SEM with 15 animals in each group.

research article
468 TheJournalofClinicalInvestigation http://www.jci.org Volume 119 Number 3 March 2009
as with the grades of differentiation from well differentiated to poorly differentiated (Figure 1, D–I). These findings indicate that AEG1 expression is gradually increased with the stages of the dis-ease as well as with loss of differentiation. To assess the strength of association between AEG1 expression and stages of HCC, we conducted an ordinal logistic regression, with the stage of HCC as the ordinal response and AEG1 expression as the independent variable in the proportional odds model. The hypothesis of associ-ation was highly significant (P value < 0.0001) according to Wald’s χ2 test (Table 1). Cytogeneticists were blinded to each sample’s pathology. In addition to the tissue microarray, we analyzed AEG1 expression in 5 individual samples ranging from low-grade dys-plastic nodule to different grades of HCC archived in the tissue bank of the Department of Pathology (Virginia Commonwealth University School of Medicine) with similar results (Supplemental Figure 1; supplemental material available online with this article; doi:10.1172/JCI36460DS1).
We further analyzed AEG1 mRNA expression using a gene expres-sion microarray (Affymetrix U133 plus 2.0) across 132 human samples in various stages of human HCC: normal liver (n = 10), cirrhotic tissue (n = 13), low-grade dysplastic nodules (n = 10), high-grade dysplastic nodules (n = 8), and HCC (n = 91). Expres-sion of AEG1 in HCV-related HCC was significantly increased in comparison with normal liver and cirrhotic tissue. Mean upregulation in comparison with normal liver and cirrhosis were 1.7-fold (Student’s t test; P = 0.04) and 1.65-fold (Student’s t test; P < 0.001) increases, respectively. Figure 1J shows the box plots of the expression values of AEG1 for each stage normalized to gene expression in normal liver.
Next, we examined how many tumor samples had DNA copy gains at the AEG1 locus located on chromosome 8q. To do so, we calculated the average copy number for the 52 SNP array probes within 250 kb on either side of AEG1. For a copy number cutoff of more than 3, 27 of 103 tumors showed gains of chromosome 8q (26%). Nine of these same tumors had a copy number cutoff of more than 4 (8.7%). We also looked at the pair-wise correlation between copy number at the AEG1 locus and the log base 2 expres-sion of every transcript on the U133 Plus 2.0 array, regardless of its position in the genome. There is a significant statistical correlation between AEG1 copy number and expression level (r = 0.723, permu-tation P < 0.004; Figure 1K). AEG1 was the 19th most significant
gene on this candidate gene list on chromosome 8 (Supplemental Table 1). Finally, we queried the list of significantly overexpressed or underexpressed genes associated with AEG1 copy number using the Significance Analysis of Microarrays package (http://www-stat.stanford.edu/~tibs/SAM/). Among the 91 tumors with expression data, 24 had copy gains of more than 3 and 8 had copy gains of more than 4. AEG1 was among the list of significantly overexpressed genes using copy number cutoffs of more than 3 or more than 4 (false discovery rate [FDR] Q value < 0.002). In summa-ry, AEG1 is significantly overexpressed in HCV-related HCC when compared with normal liver. This overexpression is associated with elevated copy numbers of AEG1, predominantly due to gains of large regions of chromosome 8q.
Inhibition of AEG1 prohibits growth of QGY-7703 cells in vivo. Sub-cutaneous xenografts were established in the flanks of athymic nude mice using 1 × 10⁶ QGY-7703 cells. After the tumors reached a size of approximately 100 mm3, intratumoral injection of an adenovirus expressing AEG1 siRNA (Ad.AEG1si) was administered at a dose of 109 viral particle/injection. The injection was given 3 times during the first week and then twice in the second week. In a 4-week assay, Ad.AEG1si significantly inhibited the growth of QGY-7703 cells compared with PBS or an adenovirus expressing scrambled siRNA (Figure 1L). Altogether these studies demon-strate that AEG1 plays a key role in the pathogenesis of HCC.
Characterization of stable HepG3 clones overexpressing AEG1. HepG3 cells were transfected with AEG1 expression construct contain-ing a C-terminal HA-tag in pcDNA3.1/Hygro(+) and selected with hygromycin to establish stable AEG1-expressing clones to eluci-date the consequence of AEG1 overexpression in these cells. Clones 14 and 8 (Hep-AEG1-14 and Hep-AEG1-8) overexpressed AEG1 at a level similar to that of QGY-7703 cells (Figure 2A). HepG3 clones stably transfected with empty pcDNA3.1/Hygro(+) (Hep-pc-4) was used as a control. All these clones were maintained in low doses of hygromycin. Immunofluorescence studies revealed that AEG1 is localized in the perinuclear region in these clones (Figure 2B). Analysis of cell viability by standard 3-(4,5-dimethylthiazol-2-yl)-2,5-diphenyltetrazolium bromide (MTT) assay revealed that, com-pared with Hep-pc-4, Hep-AEG1-14 and Hep-AEG1-8 clones had a higher proliferation rate, although the difference was not pro-found (Figure 2C). These clones also showed increased anchorage-independent growth in soft agar (Figure 2D). In matrigel invasion assay, Hep-AEG1-14 and Hep-AEG1-8 showed markedly higher invasive ability compared with Hep-pc-4, with 15- and 10-fold increase, respectively (Figure 2E).
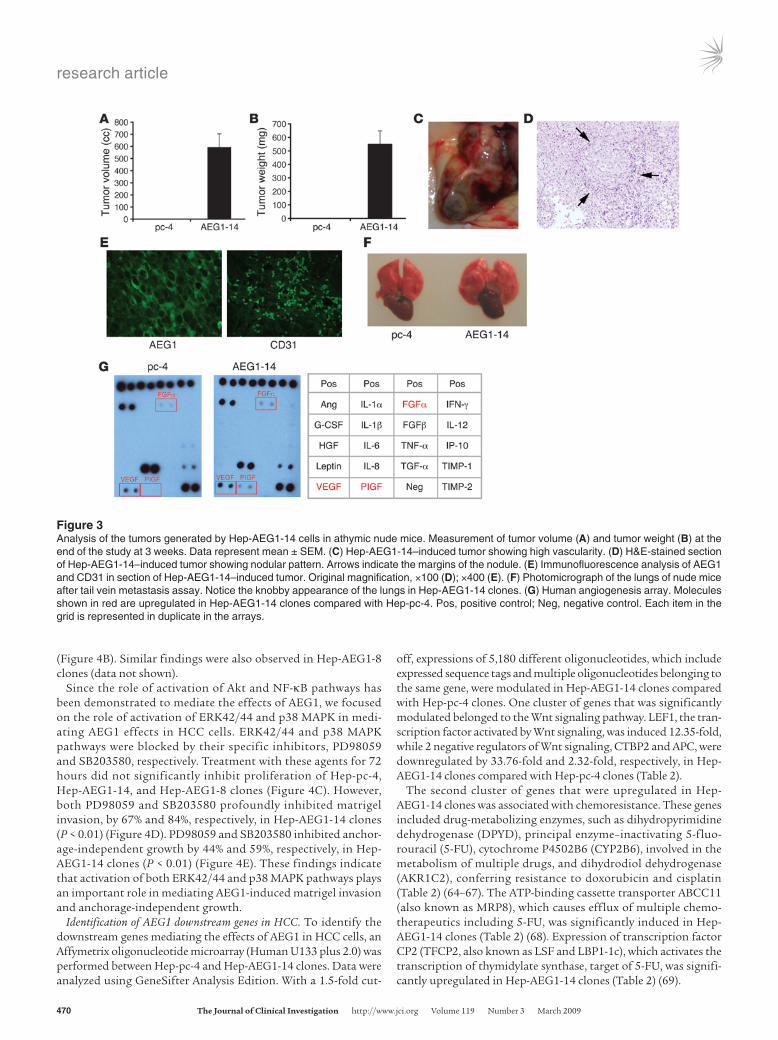
Establishment of subcutaneous xenograft in flanks of nude mice revealed that while Hep-pc-4 cells did not form any tumors in a 3-week assay, Hep-AEG1-14 generated large and aggressive tumors that were highly vascular (Figure 3, A–E). These tumors were iso-lated, and formalin-fixed paraffin-embedded sections were made. H&E staining revealed nodular architecture in these tumors remi-niscent of HCC (Figure 3D). Staining for AEG1 revealed perinuclear localization of the protein, while staining for CD31 demonstrated the presence of microvessels, indicating increased angiogenesis (Figure 3E). The intravenous injection through tail vain revealed presence of metastatic foci in the lungs in Hep-AEG1-14 but not in Hep-pc-4, as shown by the knobby appearance of the lungs (Figure 3F). Similar findings were observed with Hep-AEG1-8 clones (data not shown).
Since the tumors were highly vascular, production of angio-genic factors by Hep-AEG1-14 clones were analyzed using a
Table 1Immunoperoxidase staining of normal liver and different stages of HCC by tissue microarray using anti-AEG1 antibody
IntensityofAEG1staining Totalno. 0 + ++ +++ ofcasesNormal liver 9 9Stage I HCC 2 21 23Stage II HCC 1 16 8 25Stage III HCC 3 4 29 2 38Stage IV HCC 1 2 12 8 23
To assess the strength of association between AEG1 expression and stages of HCC, an ordinal logistic regression was conducted with the stage of HCC as the ordinal response and AEG1 expression as the independent variable in the proportional odds model. The hypothesis of association is highly significant: P value < 0.0001 by Wald χ2 test. A total of 109 HCC cases were analyzed.

research article
TheJournalofClinicalInvestigation http://www.jci.org Volume 119 Number 3 March 2009 469
human angiogenesis array. Hep-AEG1-14 cells produced higher levels of VEGF, placental growth factor (PIGF), and FGFα com-pared with Hep-pc-4 cells (Figure 3G). While no PIGF produc-tion was detected in Hep-pc-4 cells, significantly higher levels of PIGF were produced by Hep-AEG1-14 cells, indicating that PIGF might play an important role in generation of highly vascular tumors by Hep-AEG1-14 clones.
Downstream signaling activated by AEG1. Signaling pathways activated by AEG1 were analyzed by expression analysis of
phosphorylated forms of ERK, p38 MAPK, JNK, and AKT by West-ern blot analysis. Significantly higher phospho-ERK42/44 levels were detected in AEG1-overexpressing clones compared with Hep-pc-4 (Figure 4A). Higher levels of phospho–p38 MAPK and phos-pho-AKT were also observed in these clones, while no change in phospho-JNK was observed (data not shown). An NF-κB luciferase reporter assay revealed an approximately 3-fold increase in basal activity and an approximately 5-fold increase in TNF-α–induced activity in Hep-AEG1-14 clones compared with Hep-pc-4 (P < 0.01)
Figure 2Characterization of HepG3 cells stably overexpressing AEG1. (A) The expression of the indicated proteins was analyzed by Western blot in Hep-pc-4 (pc-4) and 5 clones selected for AEG1 overexpression. (B) Localization of AEG1 protein in Hep-pc-4 and Hep-AEG1-14 (AEG1-14) clones. Immunofluorescence studies were performed as described in Methods. Hep-AEG1-8, AEG1-8. (C) Cell viability studies performed in the cell lines at the indicated time points by standard MTT assay. (D) Anchorage-independent growth in soft agar using the indicated clones. Colonies were scored after 2 weeks. (E) Matrigel invasion assay using the indicated clones. All experiments were performed at least 3 times. Left panel represents graphical representation of results. Data represent mean ± SEM. Right panel shows photomicrography of invading cells. Original magnification, ×400 (B); ×100 (E).
research article
470 TheJournalofClinicalInvestigation http://www.jci.org Volume 119 Number 3 March 2009
(Figure 4B). Similar findings were also observed in Hep-AEG1-8 clones (data not shown).
Since the role of activation of Akt and NF-κB pathways has been demonstrated to mediate the effects of AEG1, we focused on the role of activation of ERK42/44 and p38 MAPK in medi-ating AEG1 effects in HCC cells. ERK42/44 and p38 MAPK pathways were blocked by their specific inhibitors, PD98059 and SB203580, respectively. Treatment with these agents for 72 hours did not significantly inhibit proliferation of Hep-pc-4, Hep-AEG1-14, and Hep-AEG1-8 clones (Figure 4C). However, both PD98059 and SB203580 profoundly inhibited matrigel invasion, by 67% and 84%, respectively, in Hep-AEG1-14 clones (P < 0.01) (Figure 4D). PD98059 and SB203580 inhibited anchor-age-independent growth by 44% and 59%, respectively, in Hep-AEG1-14 clones (P < 0.01) (Figure 4E). These findings indicate that activation of both ERK42/44 and p38 MAPK pathways plays an important role in mediating AEG1-induced matrigel invasion and anchorage-independent growth.
Identification of AEG1 downstream genes in HCC. To identify the downstream genes mediating the effects of AEG1 in HCC cells, an Affymetrix oligonucleotide microarray (Human U133 plus 2.0) was performed between Hep-pc-4 and Hep-AEG1-14 clones. Data were analyzed using GeneSifter Analysis Edition. With a 1.5-fold cut-
off, expressions of 5,180 different oligonucleotides, which include expressed sequence tags and multiple oligonucleotides belonging to the same gene, were modulated in Hep-AEG1-14 clones compared with Hep-pc-4 clones. One cluster of genes that was significantly modulated belonged to the Wnt signaling pathway. LEF1, the tran-scription factor activated by Wnt signaling, was induced 12.35-fold, while 2 negative regulators of Wnt signaling, CTBP2 and APC, were downregulated by 33.76-fold and 2.32-fold, respectively, in Hep-AEG1-14 clones compared with Hep-pc-4 clones (Table 2).
The second cluster of genes that were upregulated in Hep-AEG1-14 clones was associated with chemoresistance. These genes included drug-metabolizing enzymes, such as dihydropyrimidine dehydrogenase (DPYD), principal enzyme–inactivating 5-fluo-rouracil (5-FU), cytochrome P4502B6 (CYP2B6), involved in the metabolism of multiple drugs, and dihydrodiol dehydrogenase (AKR1C2), conferring resistance to doxorubicin and cisplatin (Table 2) (64–67). The ATP-binding cassette transporter ABCC11 (also known as MRP8), which causes efflux of multiple chemo-therapeutics including 5-FU, was significantly induced in Hep-AEG1-14 clones (Table 2) (68). Expression of transcription factor CP2 (TFCP2, also known as LSF and LBP1-1c), which activates the transcription of thymidylate synthase, target of 5-FU, was signifi-cantly upregulated in Hep-AEG1-14 clones (Table 2) (69).
Figure 3Analysis of the tumors generated by Hep-AEG1-14 cells in athymic nude mice. Measurement of tumor volume (A) and tumor weight (B) at the end of the study at 3 weeks. Data represent mean ± SEM. (C) Hep-AEG1-14–induced tumor showing high vascularity. (D) H&E-stained section of Hep-AEG1-14–induced tumor showing nodular pattern. Arrows indicate the margins of the nodule. (E) Immunofluorescence analysis of AEG1 and CD31 in section of Hep-AEG1-14–induced tumor. Original magnification, ×100 (D); ×400 (E). (F) Photomicrograph of the lungs of nude mice after tail vein metastasis assay. Notice the knobby appearance of the lungs in Hep-AEG1-14 clones. (G) Human angiogenesis array. Molecules shown in red are upregulated in Hep-AEG1-14 clones compared with Hep-pc-4. Pos, positive control; Neg, negative control. Each item in the grid is represented in duplicate in the arrays.

research article
TheJournalofClinicalInvestigation http://www.jci.org Volume 119 Number 3 March 2009 471
Genes associated with invasion, such as claudin 4 (CLDN4) and tetraspanin 8 (TSPAN8), were upregulated, and transgelin (TAGLN, a suppressor of MMP-9) was downregulated significant-ly in Hep-AEG1-14 clones (Table 2) (70–72). IGF-binding protein 7 (IGFBP7), a secreted protein involved in senescence induction, was markedly downregulated in Hep-AEG1-14 clones (Table 2) (73). Pyruvate kinase, a key enzyme of the glycolytic pathway, was also upregulated in Hep-AEG1-14 clones (Table 2) (74).
The up- or downregulation of the majority of these genes by AEG1 was confirmed by TaqMan quantitative PCR and correlated well with the findings of microarray analysis (Table 2).
Since activation of the Wnt pathway plays an important role in HCC pathogenesis, we focused on characterization of activa-tion of the Wnt pathway by AEG1. The rationale of these studies was prompted by significant upregulation of LEF1 and profound downregulation of CTBP2 in both Hep-AEG1-14 and Hep-AEG1-8 clones by quantitative real-time PCR (Table 2). LEF1 mRNA was upregulated 25.28- and 8.84-fold in Hep-AEG1-14 and Hep-AEG1-8 clones (Figure 5A; Table 2). A similar level of upregulation was detected in LEF1 protein levels by Western blot (Figure 5B) and by immunofluorescence (Figure 5C), demonstrating nuclear localization of the protein. The LEF1 downstream gene c-Myc was increased in Hep-AEG1-14 and Hep-AEG1-8 clones compared with Hep-pc-4 cells (Figure 5B).
These findings were further corroborated in matched normal liver and HCC samples from the same patient. Sections of matched normal liver and HCC samples from 18 patients were immunohis-tochemically stained for AEG1 and LEF1. While very low to unde-
tectable levels of AEG1 and LEF1 expression were observed in normal livers of all 18 individuals, significantly high levels of expression of AEG1 and LEF1 were detected in 13 out of the 18 HCC samples (Figure 5D). No changes in AEG1 or LEF1 expression were detected in the remaining 5 patients. These samples were further analyzed to check the expression of 3 additional AEG1 downstream genes, TFCP2, DPYD, and IGFBP7. TFCP2 and DPYD expression was upregulated in those HCC samples that displayed overexpression of AEG1 and LEF1 with a corresponding marked decrease in IGFBP7 expression (Figure 5D). These findings in human samples confirm the microarray find-ings obtained using cell lines, further confirming the valid-ity of these gene products as AEG1 downstream genes.
As a consequence of LEF1 overexpression, a LEF1-responsive luciferase reporter (TOPflash) was significantly
upregulated in Hep-AEG1-14 clones compared with Hep-pc-4 clones (Figure 5E). Luciferase reporters containing mutated LEF1-binding sites (FOPflash) did not show any increased activity, thus confirming the authenticity of the results (Figure 5E). To confirm the role of LEF1 in mediating AEG1 function, we employed LEF1 siRNA–mediated inhibition studies. LEF1 siRNA could signifi-cantly downregulate LEF1 protein levels but not AEG1 protein levels, while AEG1 siRNA downregulated both AEG1 and LEF1 protein levels, indicating LEF1 is downstream of AEG1 (Fig-ure 5F). Both AEG1 siRNA and LEF1 siRNA could significantly inhibit matrigel invasion by Hep-AEG1-14 clones (80% and 49%, respectively) (Figure 5G). Similarly, both AEG1 siRNA and LEF1 siRNA also resulted in profound inhibition of matrigel invasion by QGY-7703 cells (Figure 5H).
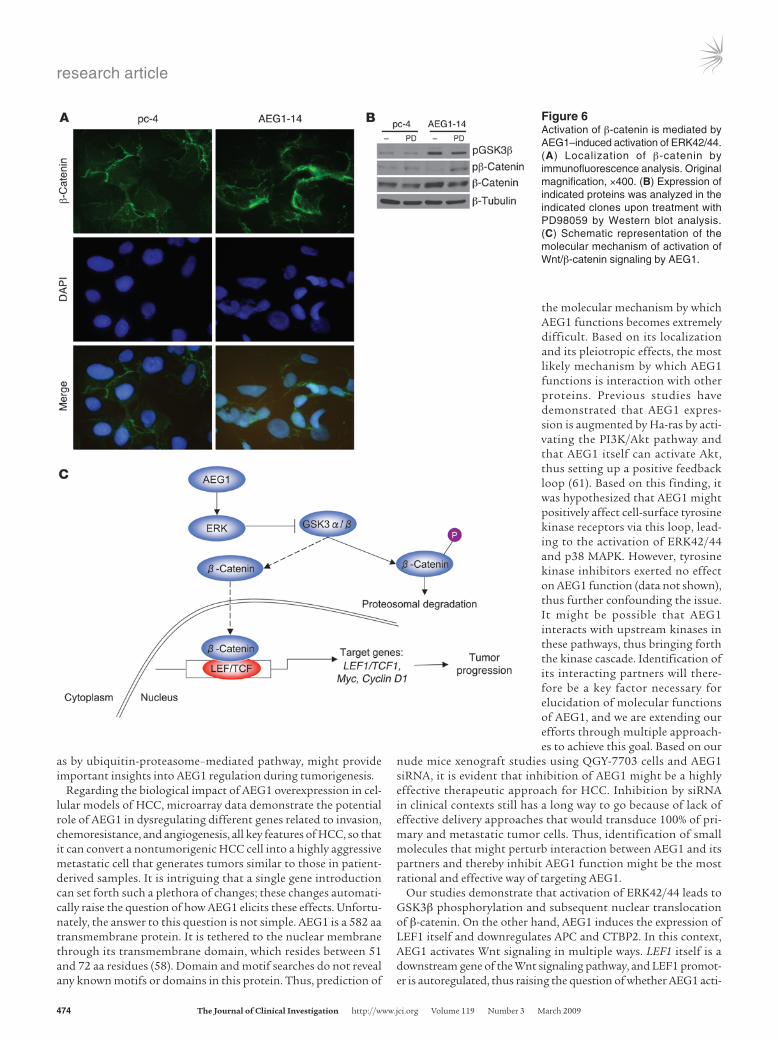
The transcriptional activity of LEF1 requires its heterodimer-ization with β-catenin. The localization of β-catenin, therefore, was checked by immunofluorescence analysis. In Hep-pc-4 cells, β-catenin was localized predominantly in the cell membrane, while in Hep-AEG1-14 clones, β-catenin was translocated in the nucleus (Figure 6A). β-Catenin was phosphorylated by GSK3β and underwent proteasomal degradation, while phosphoryla-tion of GSK3β inactivated it and allowed nuclear translocation of β-catenin. It should be noted that HepG3 cells contain wild-type β-catenin, while a common HCC cell line, HepG2, has a trun-cated mutation in β-catenin so that it cannot be phosphorylated by GSK3β and hence becomes constitutively active (46). Since AEG1 activates ERK42/44, it was hypothesized that ERK42/44 might phosphorylate GSK3β. The level of phosphorylated GSK3β
Figure 4AEG1 activates multiple signal transduction pathways. (A) Expression of the indicated proteins was analyzed by Western blot in Hep-pc-4 and Hep-AEG14 (AEG1-14) clones. (B) Analy-sis of NF-κB–luciferase activity in Hep-pc-4 and Hep-AEG1-14 clones. Cells were treated with TNF-α for 12 hours at a dose of 10 ng/ml. (C) Analysis of viability of Hep-pc-4 and Hep-AEG14 clones upon treatment with PD98059 and SB203580 by stan-dard MTT assay. Data represent mean ± SEM. (D) Matrigel invasion assay using the indicated clones upon treatment with PD98059 and SB203580. (E) Anchorage-independent growth in soft agar using the indicated clones upon treatment with PD98059 and SB203580. Colonies were scored after 2 weeks. All experiments were performed at least 3 times. Data represent mean ± SEM.

research article
472 TheJournalofClinicalInvestigation http://www.jci.org Volume 119 Number 3 March 2009
was significantly higher in Hep-AEG1-14 clones compared with Hep-pc-4 clones (Figure 6B). As a consequence, the level of phosphorylated β-catenin was downregulated, resulting in an increase in total β-catenin. Treatment with PD98059 decreased levels of phosphorylated GSK3β, thus activating it, resulting in an increase in phosphorylated β-catenin levels and a decrease in total β-catenin levels. These findings indicate that AEG1 activates the Wnt signaling pathway directly by inducing LEF1 levels and indirectly by activating ERK42/44, thus facilitating nuclear trans-location of β-catenin (Figure 6C).
DiscussionThe present manuscript describes findings that are highly sig-nificant and relevant in the context of HCC. While AEG1 expres-sion occurs at very low to almost undetectable levels in primary rat hepatocytes and in normal human liver sections, it gradually increases with the stages and grades of the disease in more than 90% of the HCC samples analyzed. Additionally, we observed a significant overexpression of AEG1 in HCV-related HCC when compared with normal liver. This overexpression is associated with an elevated copy number of AEG1, predominantly due to gains of large regions of chromosome 8q. In these contexts, AEG1 might be assessed as a new diagnostic tissue marker for HCC, and studies are currently being pursued using a large number of archi-val HCC samples to validate this hypothesis. The fact that com-mercially available anti-AEG1 antibody can be effectively used for immunohistochemistry in human tissue sections facilitates easy and rapid application of this marker for biopsy samples evaluated in pathological diagnostic laboratories.
Previous studies have demonstrated that AEG1 can protect PHFAs, rat embryo fibroblasts, and immortal melanocytes from serum starvation–induced apoptosis (62). AEG1 alone moderately increases soft agar growth of PHFAs but cooperates with Ha-ras to augment anchorage-independent growth significantly (54). Our gene expression studies demonstrate that elevated AEG1 expres-sion is associated with increased expression of LEF1, a key tran-scription factor that controls the expression of several oncogenes, such as c-myc and cyclin D1. We also document that siRNA inhibi-
tion of AEG1 significantly decreases LEF1 levels, indicating that LEF1 might be a direct downstream target of AEG1. Also, based on the analysis of 18 paired normal liver and HCC samples, we detected an association between LEF1 and AEG1 expression at the protein level. Additionally, AEG1 overexpression is correlated with increased activation of several proliferation and prosurvival pathways, such as MEK/ERK MAPK, Akt, Wnt/β-catenin, and NF-κB pathways as well as prosurvival transcription factors, such as TFCP2. AEG1 overexpression is associated with marked downregu-lation of IGFBP7, a senescence inducer. Recent findings indicate that downregulation of Wnt signaling is a trigger for senescence of primary human cells, and the observation that AEG1 augments the Wnt signaling cascade indicates that it might protect primary cells from senescence (75). Thus AEG1 alone might be an immortalizing factor for hepatocytes and might function as a potential oncogene. Studies are ongoing to address the immortalization/transforma-tion properties of AEG1 in primary human hepatocytes.
We have demonstrated that in 13 out of 18 patients, AEG1, LEF1, TFCP2, and DPYD expression were increased and IGFBP7 expression was decreased in matched HCC samples compared with normal liver. However, it should be noted that there was no signifi-cant correlation between the expression of AEG1 and its identified downstream genes (shown in Table 2), as determined by Affyme-trix gene expression data in 132 HCC patients (analysis shown in Figure 1J). One possible reason might be that there are probably multiple dysregulated signaling pathways in primary HCC that may influence the expression of target genes. Thus, the analysis of primary HCC might be more complicated than a cell-line model system involving insertion of a single gene. Another important observation is that the expression levels of AEG1 protein in HCC samples compared with that in normal liver were much higher than those of AEG1 mRNA in HCC samples compared with nor-mal liver, as determined by microarray analysis. This raises the pos-sibility that in HCC samples, AEG1 expression might be regulated at both transcriptional and posttranscriptional levels. AEG1 pro-tein has a long half-life (~20 hours) that might explain the discor-dance between AEG1 mRNA and protein levels in HCC samples (56). In these contexts, analysis of AEG1 protein turnover, such
Table 2Differentially regulated genes by AEG1 identified by microarray
Gene Direction Function Foldchangein Ratio:Hep-AEG1-14vs. Ratio:Hep-AEG1-8vs.
Hep-AEG1-14(microarray) Hep-pc-4(TaqManQPCR) Hep-pc-4(TaqManQPCR)LEF1 Up Wnt signaling 12.35 25.28 8.84CTBP2 Down Wnt signaling 33.76 0.001 0.008APC Down Wnt signaling 2.32DPYD Up 5-FU metabolism 24.7 6.02 5.02CYP2B6 Up Drug metabolism 37.66 15.16 2.08AKR1C2 Up Drug metabolism 18.48ABCC11 Up Drug transport 12.51TFCP2 Up Transcription factor 22.73 15.72 15.43TSPAN8 Up Invasion and metastasis 25.9 12.64 10.44CLDN4 Up Invasion and metastasis 25.32 3.85 2.08TAGLN Down Invasion and metastasis 24.78 0.054 0.177IGFBP7 Down Senescence 26.38 0.12 0.001PK Up Glycolysis 26.96
CYP2B6, cytochrome P4502B6; AKR1C2, dihydrodiol dehydrogenase; ABCC11, ATP-binding cassette transporter (also known as MRP8); TSPAN8, tetraspanin 8; CLDN4, claudin 4; TAGLN, transgelin; QPCR, quantitative PCR.

research article
TheJournalofClinicalInvestigation http://www.jci.org Volume 119 Number 3 March 2009 473
Figure 5LEF1 plays a role in mediating AEG1 function. (A) Analysis of LEF1 mRNA expression by TaqMan Real-Time PCR. (B) Analysis of LEF1 and Myc proteins by Western blot analysis in Hep-pc-4, Hep-AEG14 (AEG1-14), and Hep-AEG1-8 (AEG1-8) clones. (C) LEF1 expression analy-sis by immunofluorescence. (D) Immunohistochemical analysis of AEG1, LEF1, TFCP2, DPYD, and IGFBP7 expression in normal liver and matched HCC from the same patient. Figure represents data from 1 patient. Similar findings were observed in 13 out of 18 HCC patients. (E) LEF1-responsive luciferase reporter (TOPflash) assay. Transfection procedure of the indicated plasmid is described in Methods. Firefly lucifer-ase activity was normalized by renilla luciferase activity, and the activity of the empty pGL3-basic vector was considered as 1. Data represent mean ± SEM. (F) Effect of LEF1 siRNA (siLEF1) and AEG1 siRNA (siAEG1) on downregulation of LEF1 and AEG1 proteins, respectively, was analyzed by Western blot analysis. siCon, control scrambled siRNA. (G) Matrigel invasion assay using Hep-AEG1-14 clones upon treatment with the indicated siRNA. Data represent mean ± SEM. (H) Matrigel invasion assay in QGY-7703 cells upon treatment with indicated siRNA. Graphical representation of the results is shown in the upper panel. Data represent mean ± SEM. Lower panel shows photomicrograph of the invading cells. Original magnification, ×400 (C); ×100 (D and H).
research article
474 TheJournalofClinicalInvestigation http://www.jci.org Volume 119 Number 3 March 2009
as by ubiquitin-proteasome–mediated pathway, might provide important insights into AEG1 regulation during tumorigenesis.
Regarding the biological impact of AEG1 overexpression in cel-lular models of HCC, microarray data demonstrate the potential role of AEG1 in dysregulating different genes related to invasion, chemoresistance, and angiogenesis, all key features of HCC, so that it can convert a nontumorigenic HCC cell into a highly aggressive metastatic cell that generates tumors similar to those in patient-derived samples. It is intriguing that a single gene introduction can set forth such a plethora of changes; these changes automati-cally raise the question of how AEG1 elicits these effects. Unfortu-nately, the answer to this question is not simple. AEG1 is a 582 aa transmembrane protein. It is tethered to the nuclear membrane through its transmembrane domain, which resides between 51 and 72 aa residues (58). Domain and motif searches do not reveal any known motifs or domains in this protein. Thus, prediction of
the molecular mechanism by which AEG1 functions becomes extremely difficult. Based on its localization and its pleiotropic effects, the most likely mechanism by which AEG1 functions is interaction with other proteins. Previous studies have demonstrated that AEG1 expres-sion is augmented by Ha-ras by acti-vating the PI3K/Akt pathway and that AEG1 itself can activate Akt, thus setting up a positive feedback loop (61). Based on this finding, it was hypothesized that AEG1 might positively affect cell-surface tyrosine kinase receptors via this loop, lead-ing to the activation of ERK42/44 and p38 MAPK. However, tyrosine kinase inhibitors exerted no effect on AEG1 function (data not shown), thus further confounding the issue. It might be possible that AEG1 interacts with upstream kinases in these pathways, thus bringing forth the kinase cascade. Identification of its interacting partners will there-fore be a key factor necessary for elucidation of molecular functions of AEG1, and we are extending our efforts through multiple approach-es to achieve this goal. Based on our
nude mice xenograft studies using QGY-7703 cells and AEG1 siRNA, it is evident that inhibition of AEG1 might be a highly effective therapeutic approach for HCC. Inhibition by siRNA in clinical contexts still has a long way to go because of lack of effective delivery approaches that would transduce 100% of pri-mary and metastatic tumor cells. Thus, identification of small molecules that might perturb interaction between AEG1 and its partners and thereby inhibit AEG1 function might be the most rational and effective way of targeting AEG1.
Our studies demonstrate that activation of ERK42/44 leads to GSK3β phosphorylation and subsequent nuclear translocation of β-catenin. On the other hand, AEG1 induces the expression of LEF1 itself and downregulates APC and CTBP2. In this context, AEG1 activates Wnt signaling in multiple ways. LEF1 itself is a downstream gene of the Wnt signaling pathway, and LEF1 promot-er is autoregulated, thus raising the question of whether AEG1 acti-
Figure 6Activation of β-catenin is mediated by AEG1–induced activation of ERK42/44. (A) Localization of β-catenin by immunofluorescence analysis. Original magnification, ×400. (B) Expression of indicated proteins was analyzed in the indicated clones upon treatment with PD98059 by Western blot analysis. (C) Schematic representation of the molecular mechanism of activation of Wnt/β-catenin signaling by AEG1.
research article
TheJournalofClinicalInvestigation http://www.jci.org Volume 119 Number 3 March 2009 475
vates the canonical Wnt signaling pathway (76). Microarray stud-ies performed in cellular models of AEG1 overexpression showed that a variety of Wnts and Fzd family members were upregulated by 1.5- to 3-fold by AEG1, although owing to variability among rep-licates, the induction was not considered statistically significant. Inhibition of upstream molecules in Wnt signaling, such as LRP5/6 and/or Dishevelled, might answer this question. Additionally, anal-ysis of the LEF1 promoter itself might provide clues to the molecu-lar mechanism of transcriptional regulation by AEG1.
In malignant glioma cells, overexpressed AEG1 is located pre-dominantly in the nucleus, where it interacts with the p65 sub-unit of NF-κB and CBP, thus activating NF-κB signaling (57, 58). In HCC cells as well as in human HCC samples, overexpressed AEG1 is located primarily in the perinuclear region, although a small amount of AEG1 is also detected in the nucleus. This small amount of nuclear AEG1 might be sufficient to activate basal NF-κB activity, which is significantly augmented upon treatment with TNF-α. This finding is extremely significant in the context of HCC, which develops in response to chronic inflammatory changes brought forth by HBV or HCV infection. The inflamma-tory cytokines might induce AEG1, which might play a role in immortalization of hepatocytes and subsequent transformation by activation of diverse signaling pathways. Strategies to block AEG1 might therefore be used as a preventative for HCC develop-ment in HBV- and HCV-infected patients.
In summary, we have identified AEG1 as a key regulator control-ling multiple facets critical for HCC development. HCC is a tumor of diverse etiology, and it will be intriguing to determine whether AEG1 expression is augmented during HCC development irrespec-tive of the initiating event. Also, identification of a common altera-tion occurring in all HCC that might induce AEG1 expression will help develop a generalized therapeutic strategy for HCC patients regardless of the underlying liver diseases. Our efforts are focused on developing an in-depth understanding of the regulation and functions of AEG1 in HCC, which could have a profound impact on both defining and treating this disease.
MethodsCell lines, culture conditions, and viability assays. Primary rat hepatocytes were isolated and cultured as described (77). SNU-423 cells were obtained from ATCC and cultured as instructed. HepG3, QGY-7703, Hep3B, HuH7, Sk-Hep-1, Focus, and HEK-293 cells were cultured as described (63, 78). Cell via-bility was determined by standard MTT assays, as described (78). PD98059 and SB203580 were used at doses of 10 μM and 5 μM, respectively.
Patient samples. Patient samples were obtained from the Liver Tissue Cell Distribution System (LTCDS), an NIH service that provides human liver and isolated hepatocytes from regional centers for distribution to scientific investigators throughout the United States (NIH contract N01-DK-7-0004/HHSN267200700004C), and from the Virginia Commonwealth University Department of Pathology tissue bank. The 18 matched normal liver and HCC samples included the following: LTCDS nos. 1100, 1107, 1135, 1143, 1153, 1154, 1164, 1169, 1172, 1174, 1194, 1216, 1237, 1246, 1260, 1264, 1276, and 1282. The 5 HCC samples obtained from the Department of Pathology tissue bank included the following: LTCDS nos. D697, D704, D711, D718, and D728. DNA copy number changes and gene expression microarray data were collected from a total of 132 human samples from the HCC Genomic Consortium. A thorough description of patients’ character-istics has been previously reported (44, 79). All experiments were performed under the approval of the Institutional Review Board, Virginia Common-wealth University. Patients gave informed consent.
Construction of stable cell lines. The C-terminal HA-tagged AEG1 expression plasmid in the backbone of pcDNA3.1/Hygro(+) has been described pre-viously (58). This plasmid was used to transfect HepG3 cells using Lipo-fectamine 2000 (Invitrogen) according to the manufacturer’s protocol. Cells were then selected for 2 weeks in 250 μg/ml hygromycin, and individual colonies were isolated, expanded, and maintained in 50 μg/ml hygromy-cin. The overexpression of AEG1 in these clones was confirmed by Western blot analysis using anti-AEG1 and anti-HA antibodies. Empty pcDNA3.1/Hygro(+) plasmid was used similarly to establish Hep-pc-4 cells.
Transient transfection and luciferase assay. Transfection was carried out using Lipofectamine 2000 (Invitrogen) according to the manufacturer’s protocol. For luciferase assay, cells were plated into 24-well plates and the next day transfected with 3κB-luc (luciferase reporter plasmid containing 3 tandem repeats of NF-κB–binding site) and renilla luciferase expression plasmid for transfection control. Cells were incubated in the absence or presence of TNF-α (10 ng/ml). In a separate experiment, cells were trans-fected with pGL3-basic, TOPflash (luciferase reporter plasmid containing LEF1-responsive elements; Upstate) or FOPflash (luciferase reporter plas-mid containing LEF1-responsive elements; Upstate), and renilla luciferase expression plasmid. Luciferase assays were measured using Dual-Luciferase Reporter Assay Kit (Promega) according to the manufacturer’s protocol, and firefly luciferase activity was normalized by renilla luciferase activity. To knock down AEG1 and LEF1, cells were cultured for 2 days after trans-fection of 0.8 μg or 20 pmol of siRNA for AEG1 or LEF1, respectively.
Invasion assay. Invasion was measured by using 24-well BioCoat cell cul-ture inserts (BD) with an 8-μ–porosity polyethylene terephthalate mem-brane coated with Matrigel Basement Membrane Matrix (100 μg/cm2; BD). In brief, the Matrigel was allowed to rehydrate for 2 hours at room tem-perature by addition of warm, serum-free DMEM. The wells of the lower chamber were filled with medium containing 5% FBS. Cells (5 × 10⁴) were seeded in the upper compartment (6.25-mm membrane size) in serum-free medium. The invasion assay was performed at 37°C in a 5% CO2 humidi-fied incubator for 22 hours. At the end of the invasion assay, filters were removed, fixed, and stained with the Diff-Quick Staining Kit (IMEB). Cells on the upper surface of the filters were removed by wiping with a cotton swab, and invasion was determined by counting the cells that migrated to the lower side of the filter using a microscope at ×100 magnification.
Anchorage-independent growth assay in soft agar. Anchorage-independent growth assays were performed by seeding 1 × 10⁵ cells in 0.4% Noble agar on a 0.8% agar base layer, both of which contained growth medium. Colo-nies were counted 2 weeks after seeding, and the data from triplicate deter-minations were expressed as mean ± SEM.
Immunostaining. Tumors were harvested from the animals, fixed in for-malin, and embedded in paraffin. The sections were deparaffinized and were permeabilized with 0.1% Triton X-100 in PBS for 30 minutes. Sec-tions were then blocked for 1 hour at room temperature with 2% goat serum and 1% BSA in PBS and incubated with anti-AEG1 and anti-CD31 antibodies overnight at 4°C. Sections were then rinsed in PBS and incu-bated with Alexa Fluor 488–conjugated anti-mouse or anti-rabbit IgG (Molecular Probes; Invitrogen), respectively, for 1 hour at room tempera-ture. The sections were mounted in VECTASHIELD Fluorescence Mount-ing Medium containing DAPI (Vector Laboratories). Images were analyzed using an Olympus immunofluorescence microscope. For tissue microarray (IMH-360 and IMH-318, Imgenex) and for sections of normal liver and matched HCC, the slides were prepared as described previously except that the signals were developed by avidin-biotin-peroxidase complexes with DAB substrate solution (Vector Laboratories). For immunostaining of in vitro–cultured cells, cells were plated on 4-well chambers (BD Biosci-ences), fixed in formaldehyde, and then processed as described previously. The primary antibodies used were anti-AEG1 (1:500, chicken polyclonal),

research article
476 TheJournalofClinicalInvestigation http://www.jci.org Volume 119 Number 3 March 2009
anti-LEF1 (1:200, rabbit polyclonal; Cell Signaling Technology), anti– β-catenin (1:200, rabbit polyclonal; Cell Signaling Technology), anti-TFCP2 (1:100, mouse monoclonal; BD Biosciences), anti-DPYD (1:100, mouse monoclonal; Abcam), and anti-IGFBP7 (1:100, mouse monoclonal; Santa Cruz Biotechnology Inc.).
Preparation of whole-cell lysates and Western blot analyses. Preparation of whole-cell lysates and Western blot analyses were performed as described (58). The primary antibodies used were anti-AEG1 (1:500; chicken polyclonal), HA (1:2000; chicken polyclonal; Sigma-Aldrich), anti-pERK (1:2,000; rabbit polyclonal; Cell Signaling Technology), anti-ERK (1:2,000; rabbit polyclonal; Cell Signaling Technology), anti-pp38MAPK (1:1,000; rabbit polyclonal; Cell Signaling Technology), anti-p38MAPK (1:1,000; rabbit polyclonal; Cell Signaling Technology), anti-pAKT (1:1,000; rabbit polyclonal; Cell Signaling Technology), anti-AKT (1:1,000; rabbit polyclonal; Cell Signaling Technology), anti-LEF1 (1:1,000; rabbit polyclonal; Cell Signaling Technol-ogy), anti–c-Myc (1:1,000; rabbit polyclonal; Cell Signaling Technology), anti-pGSK3α/β (1:2,000; rabbit polyclonal; Cell Signaling Technology), anti-GSK3α/β (1:2,000; rabbit polyclonal; Cell Signaling Technology), anti–β-catenin (1:2,000; rabbit polyclonal; Cell Signaling Technology), and anti–pβ-catenin (1:2,000; rabbit polyclonal; Cell Signaling Technol-ogy). Blots were stripped and normalized by reprobing with anti–β-tubulin (1:1,000; mouse monoclonal; Sigma-Aldrich).
Nude mice xenograft studies. Subcutaneous xenografts were established in the flanks of athymic nude mice using 1 × 10⁶ QGY-7703 cells. After the tumors reached a size of approximately 100 mm3, intratumoral injection of an adenovirus expressing AEG1 siRNA (Ad.AEG1si) was administered at a dose of 109 viral particle/injection. The injection was given 3 times dur-ing the first week and then twice in the second week. Tumor volume was measured twice weekly with a caliper and calculated using the following for-mula: π/6 × larger diameter × (smaller diameter)2. In a separate experiment, 1 × 10⁶ Hep-pc-4, Hep-AEG1-14, and Hep-AEG1-8 cells were subcutane-ously xenotransplanted in the flanks of nude mice and followed for 3 weeks. For metastasis assays, 1 × 10⁶ Hep-pc-4 and Hep-AEG1-14 cells were intrave-nously injected through the tail vein in nude mice. The lungs were isolated and analyzed after 4 weeks. All experiments were performed with at least 5 mice in each group, and all of the experiments were repeated 3 times.
Human angiogenesis array. The expression levels of 18 angiogenesis associ-ated molecules were analyzed in supernatants of cells cultured in serum-free medium using the TranSignal Human Angiogenesis Antibody Array (Panomics) according to the manufacturer’s protocol.
Total RNA extraction and microarray assay. Total RNA was extracted using QIAGEN miRNeasy Mini Kit (QIAGEN). Total RNA was used to perform
Affymetrix Oligonucleotide Microarray (Human U133 plus 2.0) between Hep-pc-4 and Hep-AEG1-14 clones according to the manufacturer’s instructions. Data were analyzed using GeneSifter Analysis Edition soft-ware (Geospiza). DNA and RNA extraction from human tissue, SNP-array technology (Sty Chip of the 500K Human Mapping Array Set; Affymetrix), and gene expression microarray methodology (Human U133 plus 2.0; Affymetrix) were performed as previously described (44, 79).
Real time PCR. Real-time PCR was performed using ABI 7900 Fast Real-Time PCR System and TaqMan Gene Expression Assays for individual mRNAs according to the manufacturer’s protocol (Applied Biosystems).
Statistics. Data are represented as the mean ± SEM and were analyzed for statistical significance using 1-way ANOVA followed by Neuman-Keuls test as a post hoc test. P < 0.05 was considered significant. Data analy-sis for copy number changes and microarray data in human samples was conducted using SPSS Package (version 16) and R software (http://www.R-project.org), as previously described (44, 79). To assess the strength of association between AEG1 expression and stages of HCC, an ordinal logis-tic regression was conducted with the stage of HCC as the ordinal response and AEG1 expression as the independent variable in the proportional odds model using the Wald χ2 test.
AcknowledgmentsThe authors would like to thank Nicollaq Vozhilla and Eun Sook Park for excellent technical assistance. The present study was sup-ported in part by a Goldhirsh Foundation grant (to D. Sarkar); NIH grants (P01 NS31492 and R01 CA035675 to P.B. Fisher; R01 DK076986 to J.M. Llovet), a Spanish National Health Institute grant (SAF-2007-61898 to J.M. Llovet), the Samuel Waxman Can-cer Research Foundation (to J.M. Llovet), and a grant from the Liver Tissue Cell Distribution System (LTCDS) (N01DK92310 to R.A. Fisher). D. Sarkar is the Harrison Endowed Scholar in Cancer Research. P.B. Fisher holds the Thelma Newmeyer Corman Chair in Cancer Research and is a Samuel Waxman Cancer Research Foundation investigator.
Received for publication June 11, 2008, and accepted in revised form December 22, 2008.
Address correspondence to: Devanand Sarkar, Virginia Common-wealth University School of Medicine, 401 College St., PO Box 980035, Richmond, Virginia 23298, USA. Phone: (804) 827-2339; Fax: (804) 628-1176; E-mail: [email protected].
1. El-Serag, H.B., and Rudolph, K.L. 2007. Hepatocel-lular carcinoma: epidemiology and molecular car-cinogenesis. Gastroenterology. 132:2557–2576.
2. El-Serag, H.B., Davila, J.A., Petersen, N.J., and McGlynn, K.A. 2003. The continuing increase in the incidence of hepatocellular carcinoma in the United States: an update. Ann. Intern. Med. 139:817–823.
3. Jemal, A., et al. 2008. Cancer statistics, 2008. CA Cancer J. Clin. 58:71–96.
4. Pang, R.W., et al. 2008. Biology of hepatocellular carcinoma. Ann. Surg. Oncol. 15:962–971.
5. Fuchs, C.S., et al. 2002. A phase II trial of gem-citabine in patients with advanced hepatocellular carcinoma. Cancer. 94:3186–3191.
6. Lopez, P.M., Villanueva, A., and Llovet, J.M. 2006. Systematic review: evidence-based management of hepatocellular carcinoma — an updated analysis of randomized controlled trials. Aliment Pharmacol. Ther. 23:1535–1547.
7. Yeo, W., et al. 2005. A randomized phase III study of doxorubicin versus cisplatin/interferon alpha-2b/doxorubicin/fluorouracil (PIAF) combination
chemotherapy for unresectable hepatocellular car-cinoma. J. Natl. Cancer Inst. 97:1532–1538.
8. Llovet, J.M., Bru, C., and Bruix, J. 1999. Prognosis of hepatocellular carcinoma: the BCLC staging clas-sification. Semin. Liver Dis. 19:329–338.
9. O’Neil, B.H., and Venook, A.P. 2007. Hepatocel-lular carcinoma: the role of the North American GI Steering Committee Hepatobiliary Task Force and the advent of effective drug therapy. Oncologist. 12:1425–1432.
10. Georgiades, C.S., Hong, K., and Geschwind, J.F. 2008. Radiofrequency ablation and chemoembo-lization for hepatocellular carcinoma. Cancer J. 14:117–122.
11. Llovet, J.M., and Bruix, J. 2003. Systematic review of randomized trials for unresectable hepatocellular carcinoma: Chemoembolization improves survival. Hepatology. 37:429–442.
12. Nerenstone, S., and Friedman, M. 1987. Medical treatment of hepatocellular carcinoma. Gastroen-terol. Clin. North Am. 16:603–612.
13. Leung, T.W., et al. 1999. Complete pathological
remission is possible with systemic combination chemotherapy for inoperable hepatocellular carci-noma. Clin. Cancer Res. 5:1676–1681.
14. Patt, Y.Z., et al. 1999. Durable clinical and patho-logic response of hepatocellular carcinoma to sys-temic and hepatic arterial administration of plati-nol, recombinant interferon alpha 2B, doxorubicin, and 5-fluorouracil: a communication. Am. J. Clin. Oncol. 22:209–213.
15. Abou-Alfa, G.K., et al. 2006. Phase II study of sorafenib in patients with advanced hepatocellular carcinoma. J. Clin. Oncol. 24:4293–4300.
16. Simpson, D., and Keating, G.M. 2008. Sorafenib: in hepatocellular carcinoma. Drugs. 68:251–258.
17. Llovet, J.M., et al. 2008. Sorafenib in advanced hepa-tocellular carcinoma. N. Engl. J. Med. 359:378–390.
18. Zhu, A.X., et al. 2006. Phase II study of gemcitabine and oxaliplatin in combination with bevacizumab in patients with advanced hepatocellular carcino-ma. J. Clin. Oncol. 24:1898–1903.
19. Llovet, J.M., and Bruix, J. 2008. Molecular targeted therapies in hepatocellular carcinoma. Hepatology.

research article
TheJournalofClinicalInvestigation http://www.jci.org Volume 119 Number 3 March 2009 477
48:1312–1327. 20. Brechot, C., Pourcel, C., Louise, A., Rain, B., and
Tiollais, P. 1980. Presence of integrated hepatitis B virus DNA sequences in cellular DNA of human hepatocellular carcinoma. Nature. 286:533–535.
21. Feitelson, M.A., and Duan, L.X. 1997. Hepatitis B virus X antigen in the pathogenesis of chronic infections and the development of hepatocellular carcinoma. Am. J. Pathol. 150:1141–1157.
22. Kwun, H.J., Jung, E.Y., Ahn, J.Y., Lee, M.N., and Jang, K.L. 2001. p53-dependent transcriptional repression of p21(waf1) by hepatitis C virus NS3. J. Gen. Virol. 82:2235–2241.
23. Lee, M.N., et al. 2002. Hepatitis C virus core protein represses the p21 promoter through inhibition of a TGF-beta pathway. J. Gen. Virol. 83:2145–2151.
24. Boyault, S., et al. 2007. Transcriptome classifica-tion of HCC is related to gene alterations and to new therapeutic targets. Hepatology. 45:42–52.
25. Mann, C.D., et al. 2007. Prognostic molecular markers in hepatocellular carcinoma: a systematic review. Eur. J. Cancer. 43:979–992.
26. Teufel, A., et al. 2007. Genetics of hepatocellular carcinoma. World J. Gastroenterol. 13:2271–2282.
27. Schmidt, C.M., McKillop, I.H., Cahill, P.A., and Sitzmann, J.V. 1997. Increased MAPK expression and activity in primary human hepatocellular car-cinoma. Biochem. Biophys. Res. Commun. 236:54–58.
28. McKillop, I.H., Schmidt, C.M., Cahill, P.A., and Sitzmann, J.V. 1997. Altered expression of mito-gen-activated protein kinases in a rat model of experimental hepatocellular carcinoma. Hepatology. 26:1484–1491.
29. Coutant, A., et al. 2002. PI3K-FRAP/mTOR path-way is critical for hepatocyte proliferation whereas MEK/ERK supports both proliferation and sur-vival. Hepatology. 36:1079–1088.
30. Villanueva, A., et al. 2008. Pivotal role of mTOR signaling in hepatocellular carcinoma. Gastroenter-ology. 135:1972–1983.e1–e11.
31. Pikarsky, E., et al. 2004. NF-kappaB functions as a tumour promoter in inflammation-associated cancer. Nature. 431:461–466.
32. Thompson, M.D., and Monga, S.P. 2007. WNT/beta-catenin signaling in liver health and disease. Hepatology. 45:1298–1305.
33. Clevers, H. 2006. Wnt/beta-catenin signaling in development and disease. Cell. 127:469–480.
34. Katoh, M., and Katoh, M. 2006. Cross-talk of WNT and FGF signaling pathways at GSK3beta to regu-late beta-catenin and SNAIL signaling cascades. Cancer Biol. Ther. 5:1059–1064.
35. Bhanot, P., et al. 1996. A new member of the friz-zled family from Drosophila functions as a Wing-less receptor. Nature. 382:225–230.
36. Pinson, K.I., Brennan, J., Monkley, S., Avery, B.J., and Skarnes, W.C. 2000. An LDL-receptor-related protein mediates Wnt signalling in mice. Nature. 407:535–538.
37. Tamai, K., et al. 2000. LDL-receptor-related proteins in Wnt signal transduction. Nature. 407:530–535.
38. Nelson, W.J., and Nusse, R. 2004. Convergence of Wnt, beta-catenin, and cadherin pathways. Science. 303:1483–1487.
39. Aberle, H., Bauer, A., Stappert, J., Kispert, A., and Kemler, R. 1997. beta-catenin is a target for the ubiq-uitin-proteasome pathway. EMBO J. 16:3797–3804.
40. Behrens, J., et al. 1996. Functional interaction of beta-catenin with the transcription factor LEF-1. Nature. 382:638–642.
41. Townsley, F.M., Cliffe, A., and Bienz, M. 2004. Pygo-pus and Legless target Armadillo/beta-catenin to the nucleus to enable its transcriptional co-activa-
tor function. Nat. Cell Biol. 6:626–633. 42. Cavallo, R.A., et al. 1998. Drosophila Tcf and
Groucho interact to repress Wingless signalling activity. Nature. 395:604–608.
43. Fang, M., et al. 2006. C-terminal-binding protein directly activates and represses Wnt transcriptional targets in Drosophila. EMBO J. 25:2735–2745.
44. Chiang, D.Y., et al. 2008. Focal gains of VEGFA and molecular classification of hepatocellular carci-noma. Cancer Res. 68:6779–6788.
45. Taniguchi, K., et al. 2002. Mutational spectrum of beta-catenin, AXIN1, and AXIN2 in hepatocel-lular carcinomas and hepatoblastomas. Oncogene. 21:4863–4871.
46. de La Coste, A., et al. 1998. Somatic mutations of the beta-catenin gene are frequent in mouse and human hepatocellular carcinomas. Proc. Natl. Acad. Sci. U. S. A. 95:8847–8851.
47. Merle, P., et al. 2004. Functional consequences of frizzled-7 receptor overexpression in human hepato-cellular carcinoma. Gastroenterology. 127:1110–1122.
48. Miyoshi, Y., et al. 1998. Activation of the beta-catenin gene in primary hepatocellular carcinomas by somatic alterations involving exon 3. Cancer Res. 58:2524–2527.
49. Satoh, S., et al. 2000. AXIN1 mutations in hepa-tocellular carcinomas, and growth suppression in cancer cells by virus-mediated transfer of AXIN1. Nat. Genet. 24:245–250.
50. Colnot, S., et al. 2004. Liver-targeted disruption of Apc in mice activates beta-catenin signaling and leads to hepatocellular carcinomas. Proc. Natl. Acad. Sci. U. S. A. 101:17216–17221.
51. Harada, N., et al. 2004. Hepatocarcinogenesis in mice with beta-catenin and Ha-ras gene mutations. Cancer Res. 64:48–54.
52. Calvisi, D.F., Factor, V.M., Loi, R., and Thorgeirs-son, S.S. 2001. Activation of beta-catenin during hepatocarcinogenesis in transgenic mouse models: relationship to phenotype and tumor grade. Cancer Res. 61:2085–2091.
53. Su, Z.Z., et al. 2002. Identification and cloning of human astrocyte genes displaying elevated expres-sion after infection with HIV-1 or exposure to HIV-1 envelope glycoprotein by rapid subtraction hybridization, RaSH. Oncogene. 21:3592–3602.
54. Kang, D.C., et al. 2005. Cloning and characteriza-tion of HIV-1-inducible astrocyte elevated gene-1, AEG-1. Gene. 353:8–15.
55. Brown, D.M., and Ruoslahti, E. 2004. Metadherin, a cell surface protein in breast tumors that medi-ates lung metastasis. Cancer Cell. 5:365–374.
56. Sutherland, H.G., Lam, Y.W., Briers, S., Lamond, A.I., and Bickmore, W.A. 2004. 3D3/lyric: a novel transmembrane protein of the endoplasmic reticu-lum and nuclear envelope, which is also present in the nucleolus. Exp. Cell Res. 294:94–105.
57. Emdad, L., et al. 2006. Activation of the nuclear fac-tor kappaB pathway by astrocyte elevated gene-1: implications for tumor progression and metasta-sis. Cancer Res. 66:1509–1516.
58. Sarkar, D., et al. 2008. Molecular basis of nuclear factor-kappaB activation by astrocyte elevated gene-1. Cancer Res. 68:1478–1484.
59. Emdad, L., et al. 2007. Astrocyte elevated gene-1: recent insights into a novel gene involved in tumor progression, metastasis and neurodegeneration. Pharmacol. Ther. 114:155–170.
60. Kikuno, N., et al. 2007. Knockdown of astrocyte-elevated gene-1 inhibits prostate cancer progres-sion through upregulation of FOXO3a activity. Oncogene. 26:7647–7655.
61. Lee, S.G., Su, Z.Z., Emdad, L., Sarkar, D., and Fisher,
P.B. 2006. Astrocyte elevated gene-1 (AEG-1) is a target gene of oncogenic Ha-ras requiring phos-phatidylinositol 3-kinase and c-Myc. Proc. Natl. Acad. Sci. U. S. A. 103:17390–17395.
62. Lee, S.G., et al. 2008. Astrocyte elevated gene-1 activates cell survival pathways through PI3K-Akt signaling. Oncogene. 27:1114–1121.
63. Su, Z.Z., Luo, Z.Y., Guo, L.P., Li, J.Z., and Liu, Y.L. 1988. Inhibitory effect of parvovirus H-1 on cul-tured human tumour cells or transformed cells. Sci. Sin. [B]. 31:69–80.
64. Longley, D.B., Harkin, D.P., and Johnston, P.G. 2003. 5-fluorouracil: mechanisms of action and clinical strategies. Nat. Rev. Cancer. 3:330–338.
65. Hodgson, E., and Rose, R.L. 2007. The importance of cytochrome P450 2B6 in the human metabo-lism of environmental chemicals. Pharmacol. Ther. 113:420–428.
66. Yoshinare, K., et al. 2003. Gene expression in colorectal cancer and in vitro chemosensitivity to 5-fluorouracil: a study of 88 surgical specimens. Cancer Sci. 94:633–638.
67. Oguri, T., et al. 2005. The role of thymidylate syn-thase and dihydropyrimidine dehydrogenase in resistance to 5-fluorouracil in human lung cancer cells. Lung Cancer. 49:345–351.
68. Oguri, T., et al. 2007. MRP8/ABCC11 directly con-fers resistance to 5-fluorouracil. Mol. Cancer Ther. 6:122–127.
69. Powell, C.M., Rudge, T.L., Zhu, Q., Johnson, L.F., and Hansen, U. 2000. Inhibition of the mammalian transcription factor LSF induces S-phase-depen-dent apoptosis by downregulating thymidylate synthase expression. EMBO J. 19:4665–4675.
70. Agarwal, R., D’Souza, T., and Morin, P.J. 2005. Claudin-3 and claudin-4 expression in ovarian epithelial cells enhances invasion and is associated with increased matrix metalloproteinase-2 activity. Cancer Res. 65:7378–7385.
71. Gesierich, S., Berezovskiy, I., Ryschich, E., and Zoller, M. 2006. Systemic induction of the angio-genesis switch by the tetraspanin D6.1A/CO-029. Cancer Res. 66:7083–7094.
72. Nair, R.R., Solway, J., and Boyd, D.D. 2006. Expres-sion cloning identifies transgelin (SM22) as a novel repressor of 92-kDa type IV collagenase (MMP-9) expression. J. Biol. Chem. 281:26424–26436.
73. Wajapeyee, N., Serra, R.W., Zhu, X., Mahalingam, M., and Green, M.R. 2008. Oncogenic BRAF induces senescence and apoptosis through path-ways mediated by the secreted protein IGFBP7. Cell. 132:363–374.
74. Mazurek, S., Boschek, C.B., Hugo, F., and Eigen-brodt, E. 2005. Pyruvate kinase type M2 and its role in tumor growth and spreading. Semin. Cancer Biol. 15:300–308.
75. Ye, X., et al. 2007. Downregulation of Wnt signal-ing is a trigger for formation of facultative hetero-chromatin and onset of cell senescence in primary human cells. Mol. Cell. 27:183–196.
76. Filali, M., Cheng, N., Abbott, D., Leontiev, V., and Engelhardt, J.F. 2002. Wnt-3A/beta-catenin signal-ing induces transcription from the LEF-1 promoter. J. Biol. Chem. 277:33398–33410.
77. Bissell, D.M., and Guzelian, P.S. 1980. Pheno-typic stability of adult rat hepatocytes in primary monolayer culture. Ann. N. Y. Acad. Sci. 349:85–98.
78. Sarkar, D., et al. 2007. Eradication of therapy-resis-tant human prostate tumors using a cancer termi-nator virus. Cancer Res. 67:5434–5442.
79. Wurmbach, E., et al. 2007. Genome-wide molecular profiles of HCV-induced dysplasia and hepatocel-lular carcinoma. Hepatology. 45:938–947.