hepatocellular carcinoma thomas hargrave m.d. january 16, 2009
TRANSCRIPT
Hepatocellular Carcinoma
Hepatocellular Carcinoma
Thomas Hargrave M.D.
January 16, 2009
Thomas Hargrave M.D.
January 16, 2009
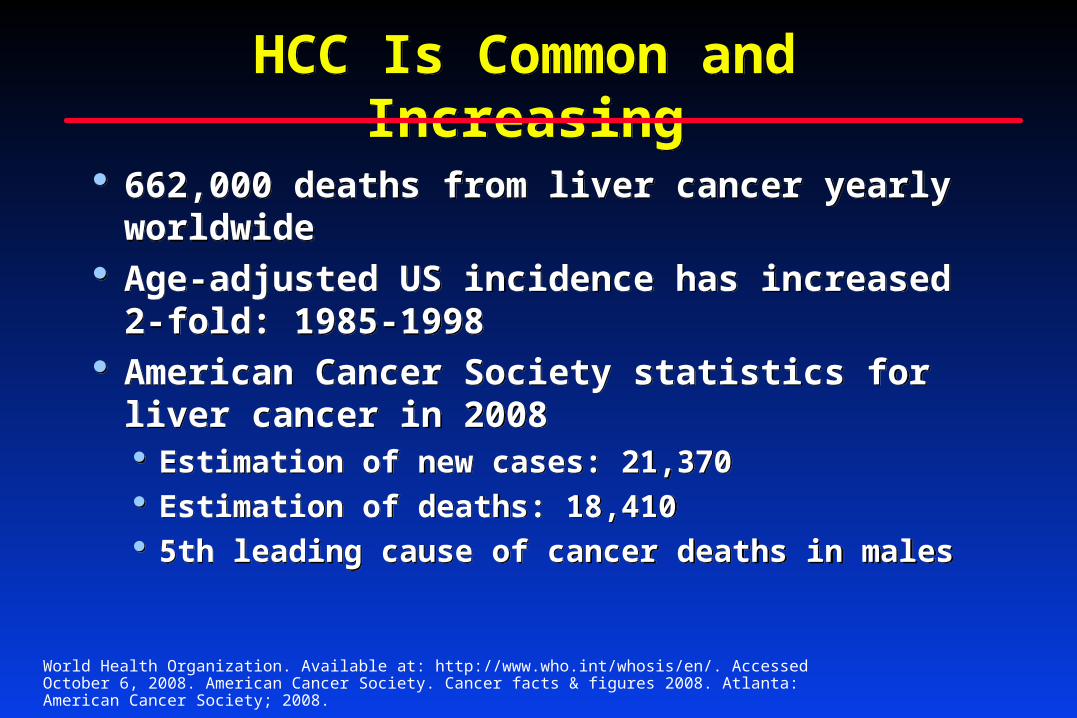
HCC Is Common and IncreasingHCC Is Common and Increasing
662,000 deaths from liver cancer yearly worldwide
Age-adjusted US incidence has increased 2-fold: 1985-1998
American Cancer Society statistics for liver cancer in 2008 Estimation of new cases: 21,370 Estimation of deaths: 18,410 5th leading cause of cancer deaths in males
662,000 deaths from liver cancer yearly worldwide
Age-adjusted US incidence has increased 2-fold: 1985-1998
American Cancer Society statistics for liver cancer in 2008 Estimation of new cases: 21,370 Estimation of deaths: 18,410 5th leading cause of cancer deaths in males
World Health Organization. Available at: http://www.who.int/whosis/en/. Accessed October 6, 2008. American Cancer Society. Cancer facts & figures 2008. Atlanta: American Cancer Society; 2008.
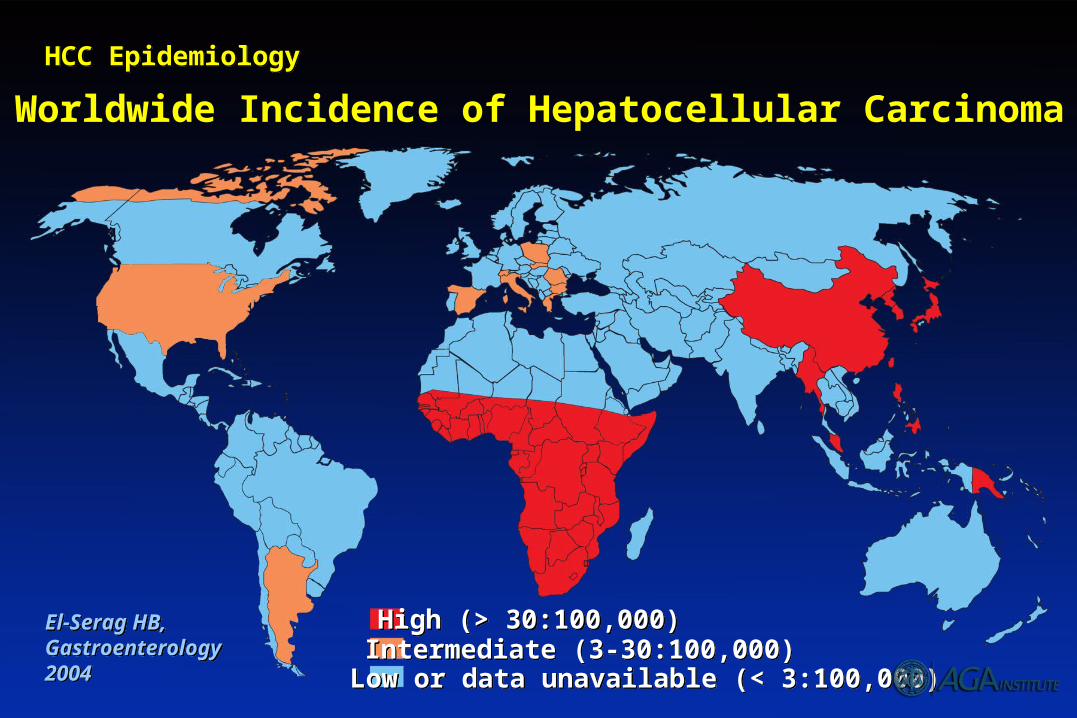
Worldwide Incidence of Hepatocellular Carcinoma
High (> 30:100,000)High (> 30:100,000)
Low or data unavailable (< 3:100,000)Low or data unavailable (< 3:100,000)Intermediate (3-30:100,000)Intermediate (3-30:100,000)
HCC EpidemiologyHCC Epidemiology
El-Serag HB, Gastroenterology 2004
El-Serag HB, Gastroenterology 2004
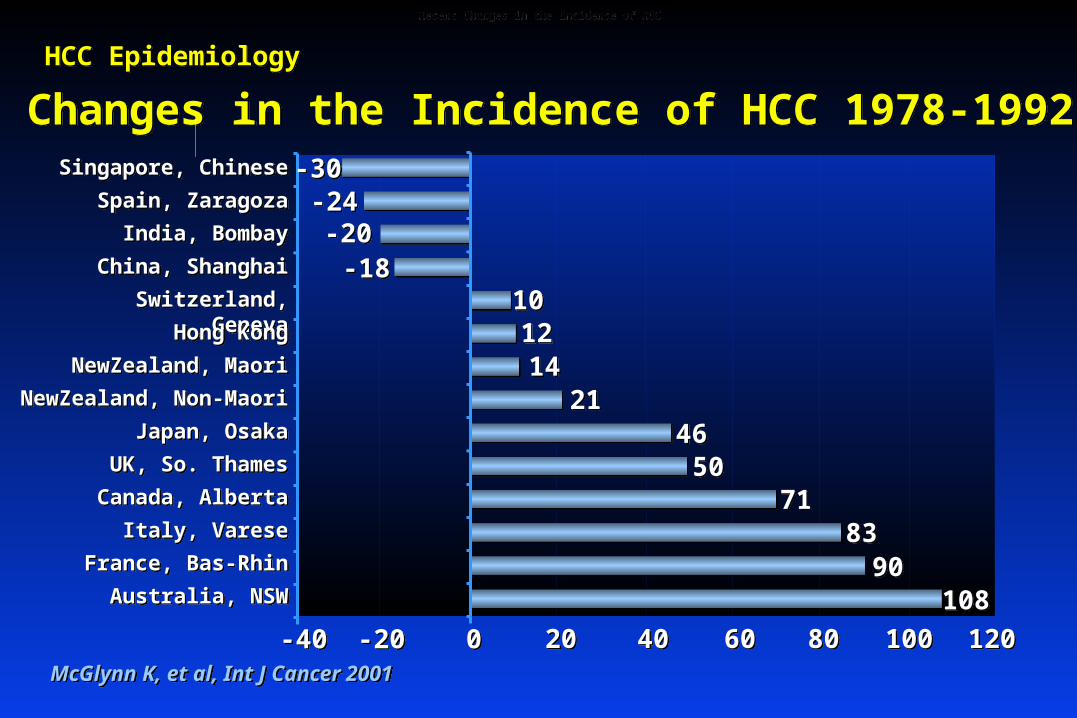
Changes in the Incidence of HCC 1978-1992 Changes in the Incidence of HCC 1978-1992
McGlynn K, et al, Int J Cancer 2001McGlynn K, et al, Int J Cancer 2001
-40-40 -20-20 00 2020 4040 6060 8080 100100 120120
-30-30-24-24-20-20
-18-18101012121414
21214646
50507171
83839090
108108
Singapore, ChineseSingapore, Chinese
Spain, ZaragozaSpain, Zaragoza
India, BombayIndia, Bombay
China, ShanghaiChina, Shanghai
Switzerland, GenevaSwitzerland, Geneva
Hong KongHong Kong
NewZealand, MaoriNewZealand, Maori
NewZealand, Non-MaoriNewZealand, Non-Maori
Japan, OsakaJapan, Osaka
UK, So. ThamesUK, So. Thames
Canada, AlbertaCanada, Alberta
Italy, VareseItaly, Varese
France, Bas-RhinFrance, Bas-Rhin
Australia, NSWAustralia, NSW
Recent Changes in the Incidence of HCCRecent Changes in the Incidence of HCC
HCC EpidemiologyHCC Epidemiology
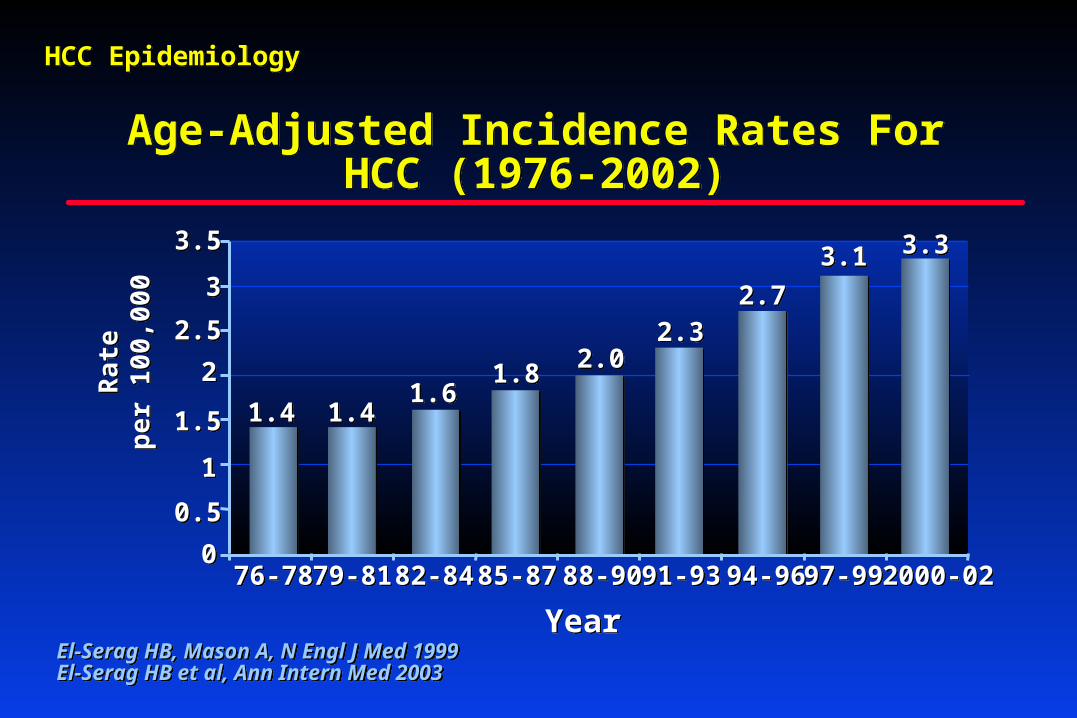
Age-Adjusted Incidence Rates For HCC (1976-2002)
Age-Adjusted Incidence Rates For HCC (1976-2002)
El-Serag HB, Mason A, N Engl J Med 1999El-Serag HB et al, Ann Intern Med 2003El-Serag HB, Mason A, N Engl J Med 1999El-Serag HB et al, Ann Intern Med 2003
YearYear
76-7876-78 79-8179-81 82-8482-84 85-8785-87 88-9088-90 91-9391-93 94-9694-96 97-9997-99 2000-022000-02
1.41.4 1.41.41.61.6
1.81.8 2.02.02.32.3
2.72.7
3.13.13.53.5
3 3
2.52.5
22
1.51.5
11
0.50.5
00
Ra
tep
er
10
0,0
00
Ra
tep
er
10
0,0
00
3.33.3
HCC EpidemiologyHCC Epidemiology
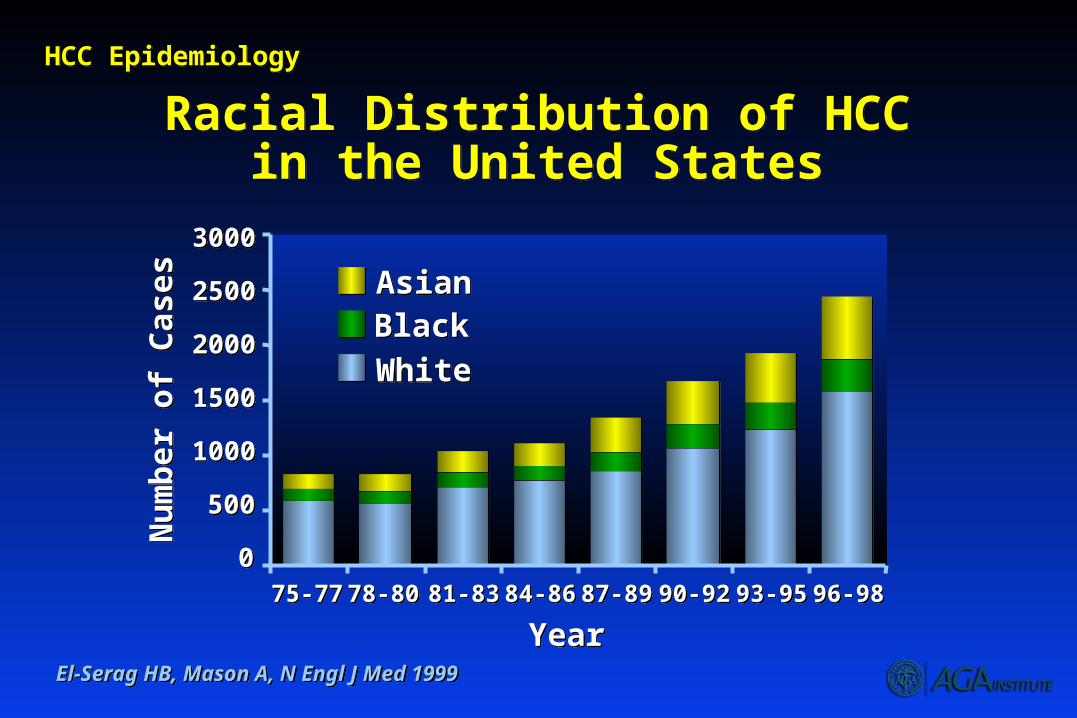
Racial Distribution of HCC in the United States
Racial Distribution of HCC in the United States
YearYear75-7775-77 81-8381-83 84-8684-86 87-8987-89 90-9290-92 93-9593-95 96-9896-98
WhiteWhiteBlackBlackAsianAsian
78-8078-80
Nu
mb
er o
f C
ases
Nu
mb
er o
f C
ases
30003000
25002500
20002000
15001500
10001000
500500
00
HCC EpidemiologyHCC Epidemiology
El-Serag HB, Mason A, N Engl J Med 1999El-Serag HB, Mason A, N Engl J Med 1999
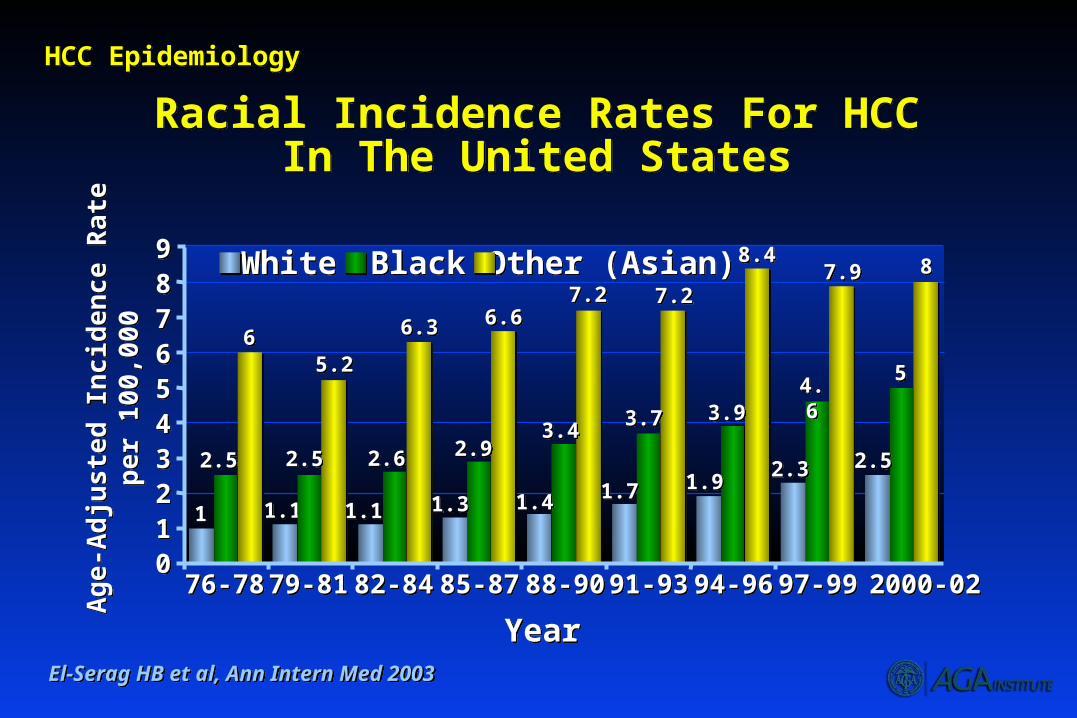
Racial Incidence Rates For HCCIn The United States
Racial Incidence Rates For HCCIn The United States
YearYear
76-7876-78 82-8482-84 85-8785-87 88-9088-90 91-9391-93 94-9694-96 97-9997-99 2000-022000-02Ag
e-A
dju
ste
d In
cid
en
ce R
ate
pe
r 1
00
,00
0A
ge
-Ad
jus
ted
Inc
ide
nce
Ra
tep
er
10
0,0
00
99887766554433221100
11
2.52.5
66
1.11.1
WhiteWhite BlackBlack Other (Asian)Other (Asian)
79-8179-81
2.52.5
55
88
2.52.5
5.25.2
1.11.1
2.62.6
6.36.3
1.31.3
2.92.9
6.66.6
1.41.4
3.43.4
7.27.2
1.71.7
3.73.7
7.27.2
1.91.9
3.93.9
8.48.4
2.32.3
4.64.6
7.97.9
HCC EpidemiologyHCC Epidemiology
El-Serag HB et al, Ann Intern Med 2003El-Serag HB et al, Ann Intern Med 2003
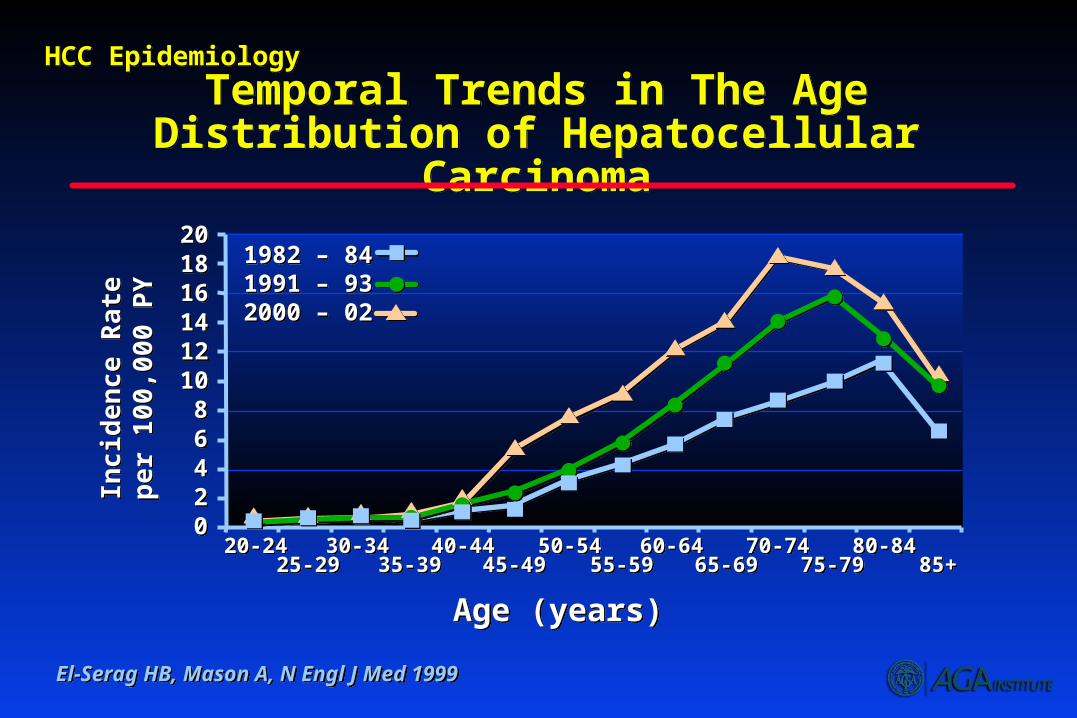
Temporal Trends in The Age Distribution of Hepatocellular Carcinoma
Temporal Trends in The Age Distribution of Hepatocellular Carcinoma
Inci
den
ce
Rat
ep
er
10
0,0
00
PY
Inci
den
ce
Rat
ep
er
10
0,0
00
PY
Age (years)Age (years)
20-2420-24 30-3430-3435-3935-39
40-4440-4445-4945-49
50-5450-5455-5955-5925-2925-29
0022446688
101012121414161618182020
1982 – 841991 – 932000 – 02
1982 – 841991 – 932000 – 02
60-6460-6465-6965-69
70-7470-7475-7975-79
80-8480-8485+85+
HCC EpidemiologyHCC Epidemiology
El-Serag HB, Mason A, N Engl J Med 1999El-Serag HB, Mason A, N Engl J Med 1999
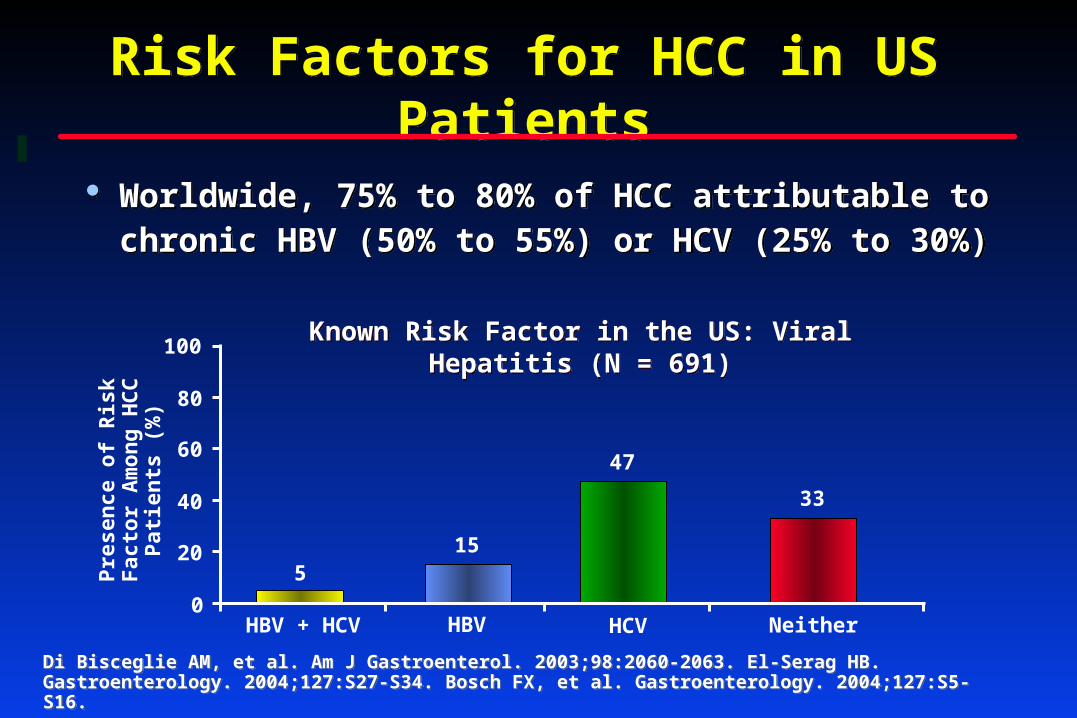
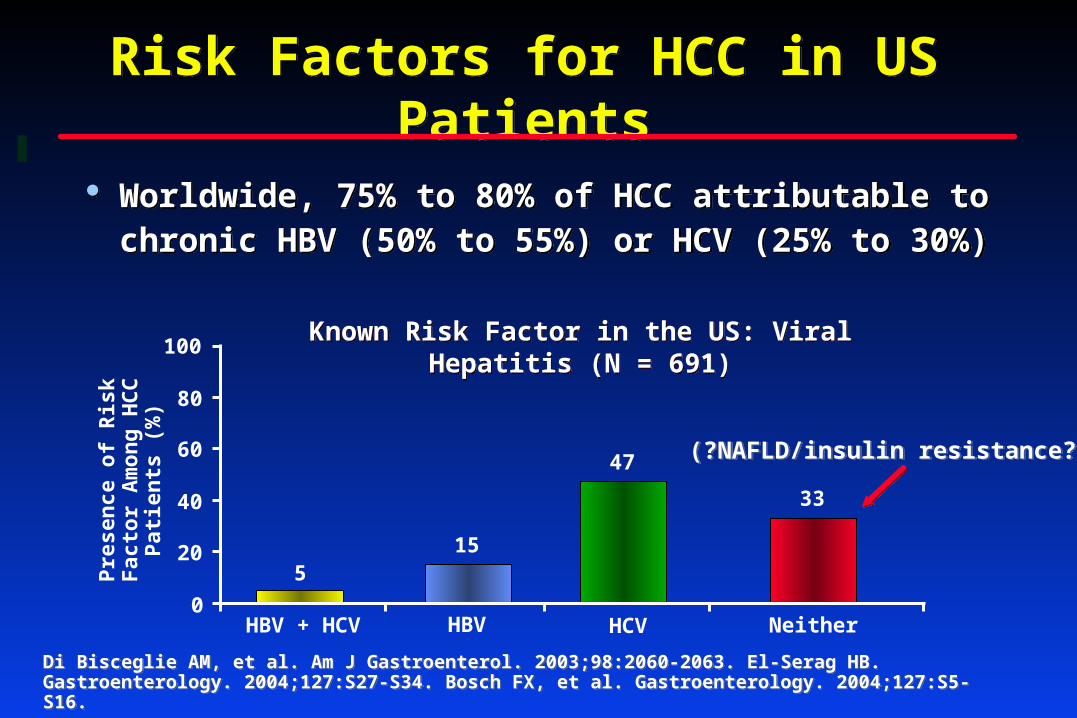
Risk Factors for HCC in US PatientsRisk Factors for HCC in US Patients
Worldwide, 75% to 80% of HCC attributable to chronic HBV (50% to 55%) or HCV (25% to 30%)
Worldwide, 75% to 80% of HCC attributable to chronic HBV (50% to 55%) or HCV (25% to 30%)
Di Bisceglie AM, et al. Am J Gastroenterol. 2003;98:2060-2063. El-Serag HB. Gastroenterology. 2004;127:S27-S34. Bosch FX, et al. Gastroenterology. 2004;127:S5-S16.Di Bisceglie AM, et al. Am J Gastroenterol. 2003;98:2060-2063. El-Serag HB. Gastroenterology. 2004;127:S27-S34. Bosch FX, et al. Gastroenterology. 2004;127:S5-S16.
Known Risk Factor in the US: Viral Hepatitis (N = 691)Known Risk Factor in the US: Viral Hepatitis (N = 691)
515
33
47
0
20
40
60
80
100
HBV + HCV HBV HCV Neither
Pre
sen
ce o
f R
isk
Fac
tor
Am
on
g H
CC
Pat
ien
ts (
%)
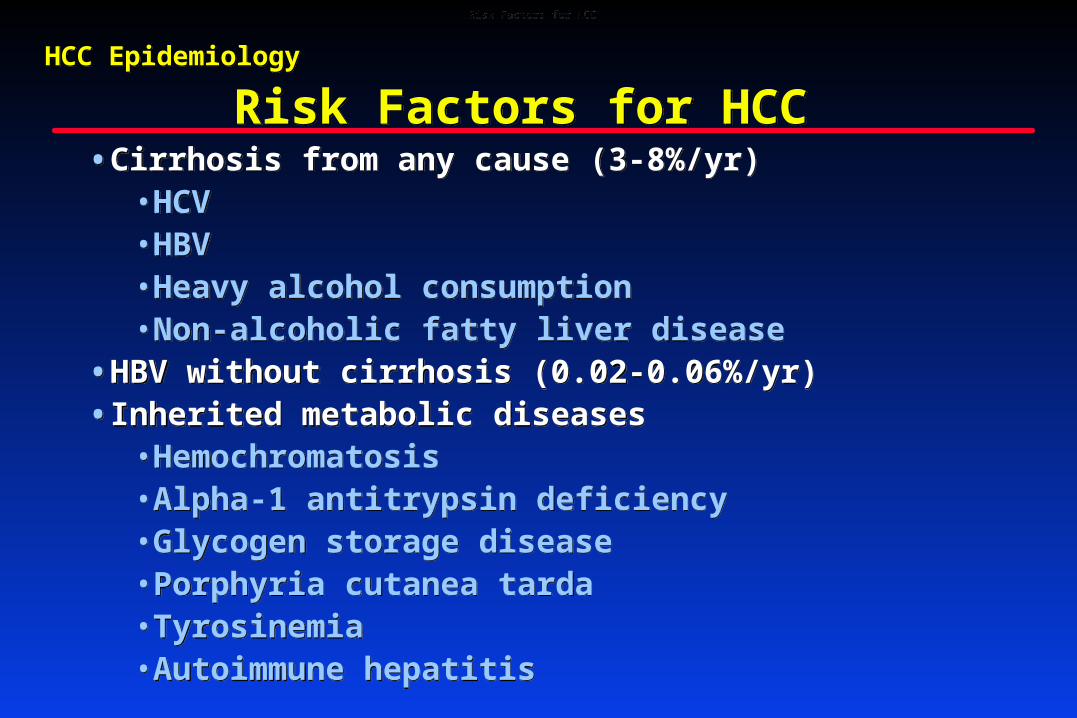
Risk Factors for HCC Risk Factors for HCC • Cirrhosis from any cause (3-8%/yr)
• HCV • HBV• Heavy alcohol consumption• Non-alcoholic fatty liver disease
• HBV without cirrhosis (0.02-0.06%/yr)• Inherited metabolic diseases
• Hemochromatosis • Alpha-1 antitrypsin deficiency • Glycogen storage disease• Porphyria cutanea tarda• Tyrosinemia • Autoimmune hepatitis
• Cirrhosis from any cause (3-8%/yr)• HCV • HBV• Heavy alcohol consumption• Non-alcoholic fatty liver disease
• HBV without cirrhosis (0.02-0.06%/yr)• Inherited metabolic diseases
• Hemochromatosis • Alpha-1 antitrypsin deficiency • Glycogen storage disease• Porphyria cutanea tarda• Tyrosinemia • Autoimmune hepatitis
Risk Factors for HCC Risk Factors for HCC
HCC EpidemiologyHCC Epidemiology
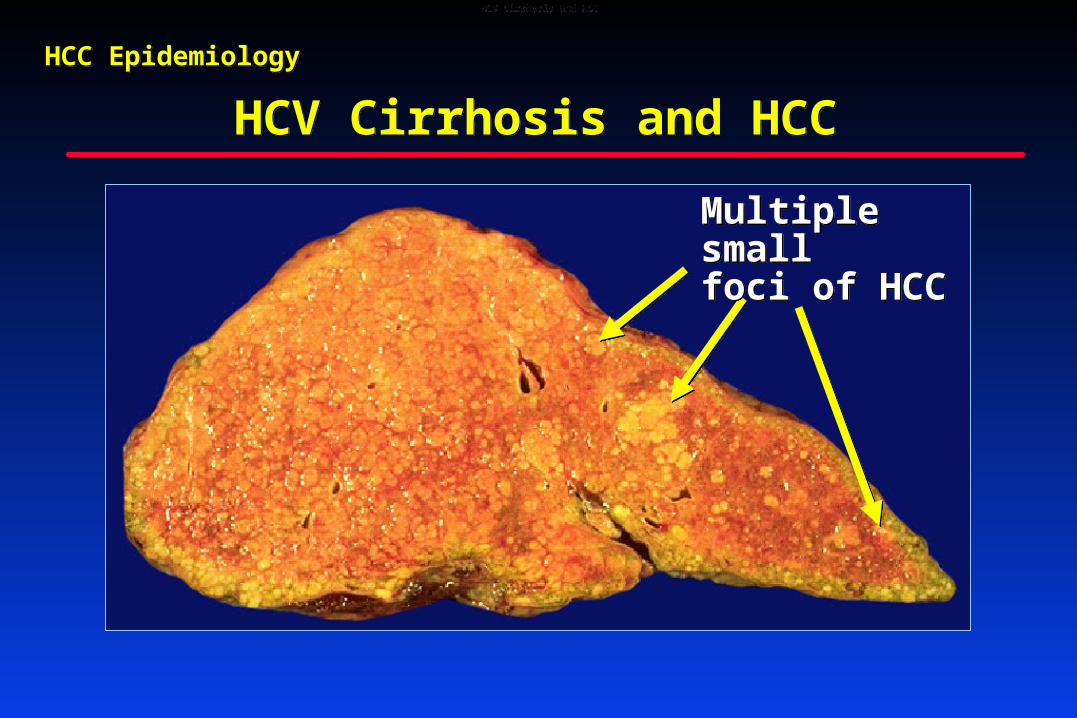
HCV Cirrhosis and HCCHCV Cirrhosis and HCC
Multiple smallfoci of HCCMultiple smallfoci of HCC
HCV Cirrhosis and HCCHCV Cirrhosis and HCC
HCC EpidemiologyHCC Epidemiology
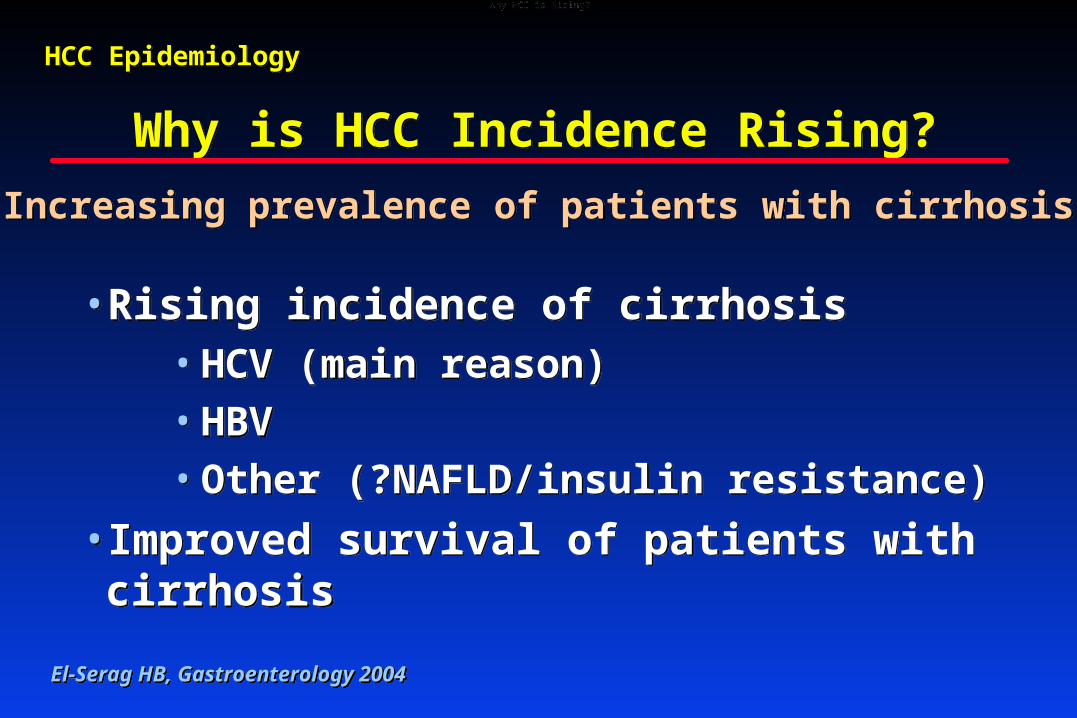
Why is HCC Incidence Rising?Why is HCC Incidence Rising?
• Rising incidence of cirrhosis• HCV (main reason)
• HBV
• Other (?NAFLD/insulin resistance)
• Improved survival of patients with cirrhosis
• Rising incidence of cirrhosis• HCV (main reason)
• HBV
• Other (?NAFLD/insulin resistance)
• Improved survival of patients with cirrhosis
Increasing prevalence of patients with cirrhosisIncreasing prevalence of patients with cirrhosis
Why HCC is Rising?Why HCC is Rising?
HCC EpidemiologyHCC Epidemiology
El-Serag HB, Gastroenterology 2004El-Serag HB, Gastroenterology 2004
Prevalence of HCV in United States Males:1999-2002
Prevalence of HCV in United States Males:1999-2002
0%
2%
4%
6%
8%
10%
12%
14%
16%
16-19 20-29 30-39 40-49 50-59 60-69
blackwhitehispanic
0%
2%
4%
6%
8%
10%
12%
14%
16%
16-19 20-29 30-39 40-49 50-59 60-69
blackwhitehispanic
Annals Internal Medicine 2006; 144:705
Projected Rates of HCV-Related Cirrhosis and HCC
Projected Rates of HCV-Related Cirrhosis and HCC
Cirrhosis
0
250000
500000
750000
1000000
2000 2010 2020 2030 2040
Calendar Year
Pre
vale
nce
(No)
Cirrhosis
0
250000
500000
750000
1000000
2000 2010 2020 2030 2040
Calendar Year
Pre
vale
nce
(No)
Davis GL, et al. Liver Transpl. 2003;9:331.
Hepatocellular Carcinoma
0
5000
10000
15000
2000 2010 2020 2030 2040
Calendar YearPr
eval
ence
(No)
Alcohol Intake and the Risk of HCCAlcohol Intake and the Risk of HCC
Donato F, et al, Am J Epidemiol 2002Donato F, et al, Am J Epidemiol 2002
00
55
1010
1515
2020
2020 4040 6060 8080 100100 120120 140140
Grams of Alcohol / DayGrams of Alcohol / Day
Od
ds
Rat
ios
Od
ds
Rat
ios No HCVNo HCV with HCVwith HCV
Alcohol Intake and the Risk of HCCAlcohol Intake and the Risk of HCC
HCC EpidemiologyHCC Epidemiology
HBV DNA Associated with Increased Risk of HCC in Non-Cirrhotics
HBV DNA Associated with Increased Risk of HCC in Non-Cirrhotics
•Likelihood of HCC in individuals with detectable HBV DNA is 3.9 times more than those with undetectable HBV DNA
•Risk associated with increasing HBV DNA levels
•These data support possibility of preventing long-term risk of HCC by inducing sustained suppression of HBV replication
•Likelihood of HCC in individuals with detectable HBV DNA is 3.9 times more than those with undetectable HBV DNA
•Risk associated with increasing HBV DNA levels
•These data support possibility of preventing long-term risk of HCC by inducing sustained suppression of HBV replication
Yang HI, et al, N Engl J Med 2002Yang HI, et al, N Engl J Med 2002
HBV DNA Associated with Increased Risk of HCC
HBV DNA Associated with Increased Risk of HCC
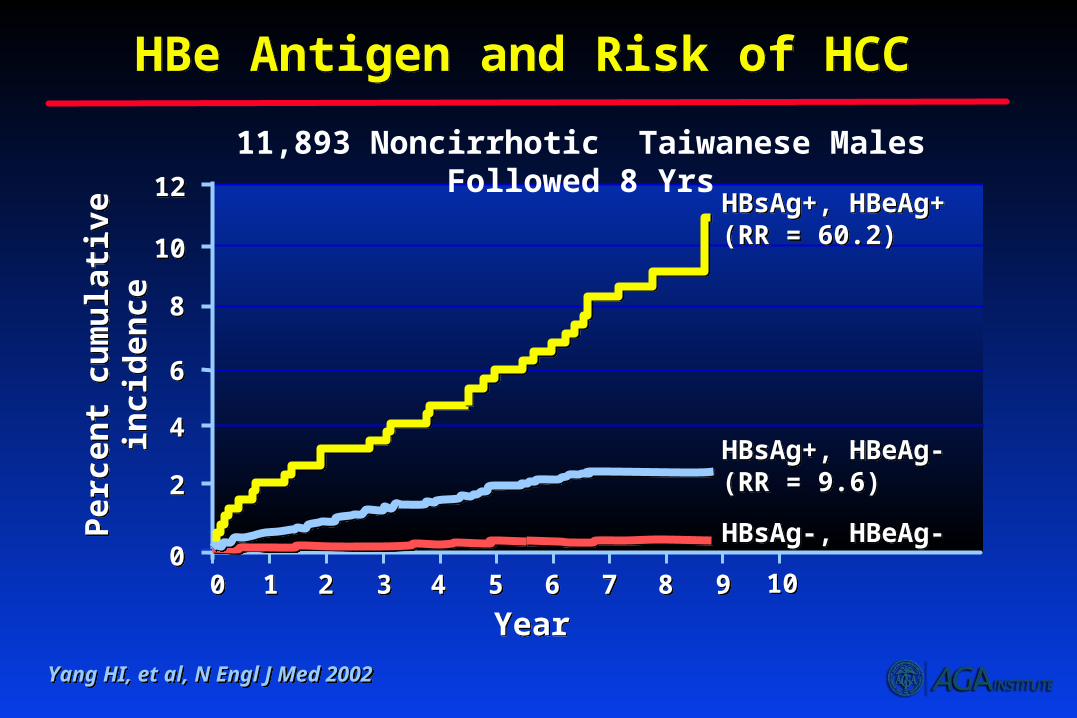
HBe Antigen and Risk of HCC HBe Antigen and Risk of HCC
Yang HI, et al, N Engl J Med 2002Yang HI, et al, N Engl J Med 2002
Per
cen
t cu
mu
lati
ve
inci
den
ceP
erce
nt
cum
ula
tive
in
cid
ence
00
YearYear
HBsAg+, HBeAg+(RR = 60.2)HBsAg+, HBeAg+(RR = 60.2)
HBsAg+, HBeAg-(RR = 9.6)HBsAg+, HBeAg-(RR = 9.6)
HBsAg-, HBeAg-HBsAg-, HBeAg-
22
44
66
88
1010
1212
0011 22 33 44 55 66 77 88 99 1010
11,893 Noncirrhotic Taiwanese Males Followed 8 Yrs
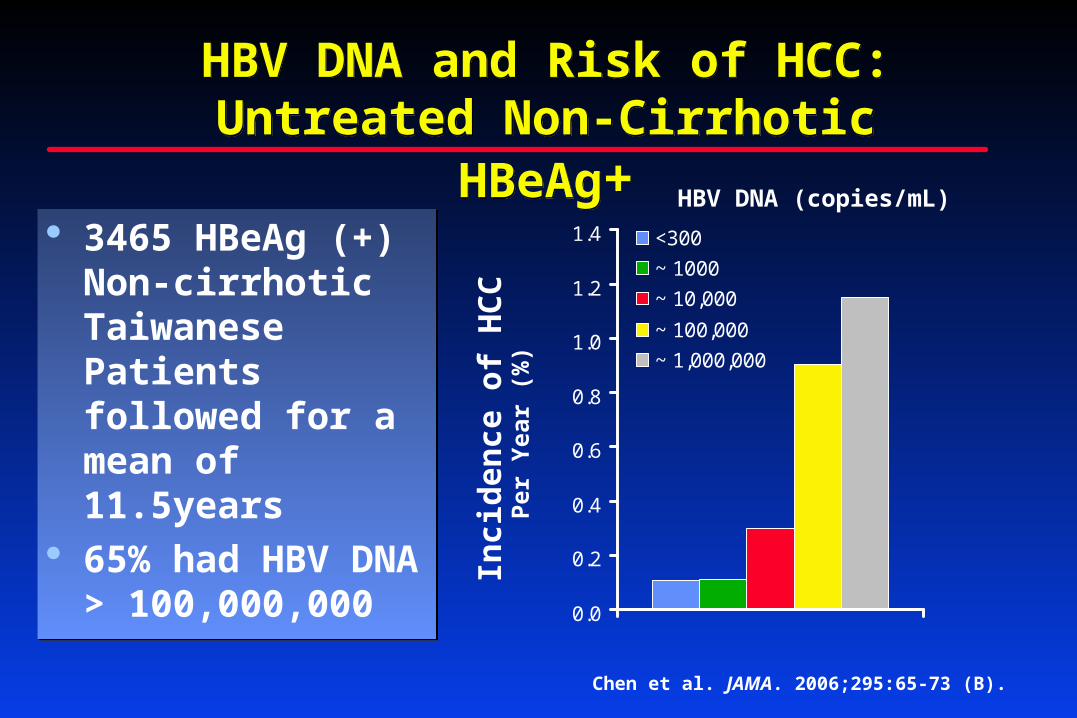
HBV DNA and Risk of HCC: Untreated Non-Cirrhotic HBeAg+
HBV DNA and Risk of HCC: Untreated Non-Cirrhotic HBeAg+
3465 HBeAg (+) Non-cirrhotic Taiwanese Patients followed for a mean of 11.5years
65% had HBV DNA > 100,000,000
3465 HBeAg (+) Non-cirrhotic Taiwanese Patients followed for a mean of 11.5years
65% had HBV DNA > 100,000,000
0.0
0.2
0.4
0.6
0.8
1.0
1.2
1.4 <300
~ 1000
~ 10,000
~ 100,000
~ 1,000,000
HBV DNA (copies/mL)
Inci
den
ce o
f H
CC
Per
Yea
r (%
)
Chen et al. JAMA. 2006;295:65-73 (B).
Risk Factors for HCC in US PatientsRisk Factors for HCC in US Patients
Worldwide, 75% to 80% of HCC attributable to chronic HBV (50% to 55%) or HCV (25% to 30%)
Worldwide, 75% to 80% of HCC attributable to chronic HBV (50% to 55%) or HCV (25% to 30%)
Di Bisceglie AM, et al. Am J Gastroenterol. 2003;98:2060-2063. El-Serag HB. Gastroenterology. 2004;127:S27-S34. Bosch FX, et al. Gastroenterology. 2004;127:S5-S16.Di Bisceglie AM, et al. Am J Gastroenterol. 2003;98:2060-2063. El-Serag HB. Gastroenterology. 2004;127:S27-S34. Bosch FX, et al. Gastroenterology. 2004;127:S5-S16.
Known Risk Factor in the US: Viral Hepatitis (N = 691)Known Risk Factor in the US: Viral Hepatitis (N = 691)
515
33
47
0
20
40
60
80
100
HBV + HCV HBV HCV Neither
Pre
sen
ce o
f R
isk
Fac
tor
Am
on
g H
CC
Pat
ien
ts (
%)
(?NAFLD/insulin resistance?)(?NAFLD/insulin resistance?)
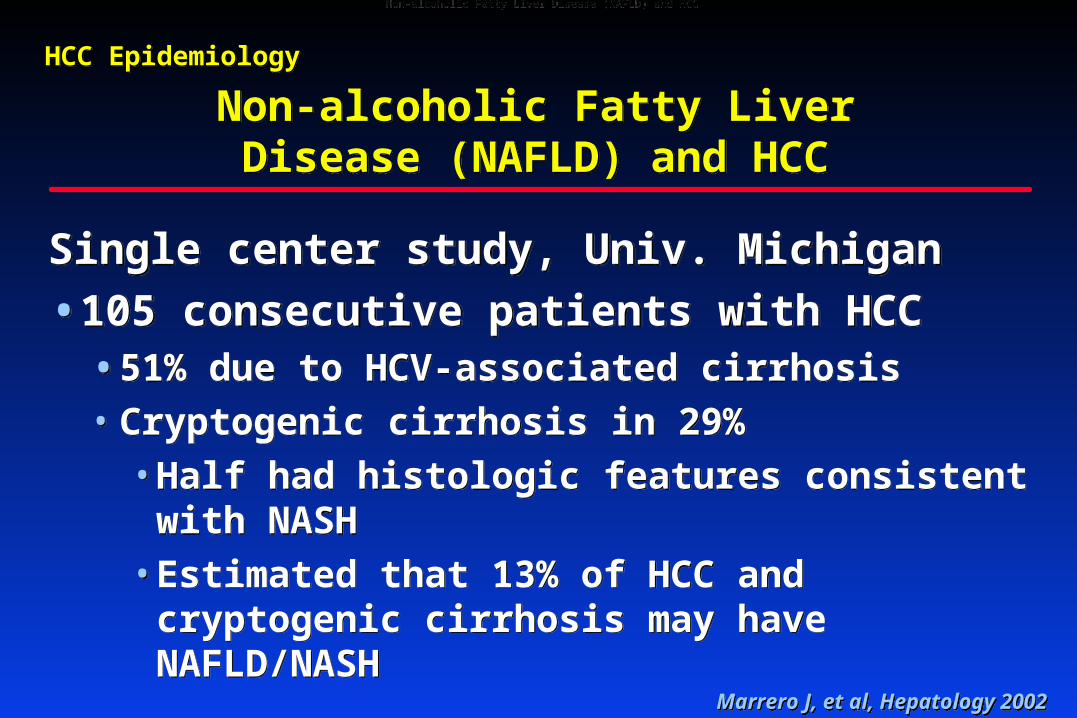
Non-alcoholic Fatty Liver Disease (NAFLD) and HCC
Non-alcoholic Fatty Liver Disease (NAFLD) and HCC
Single center study, Univ. Michigan
•105 consecutive patients with HCC• 51% due to HCV-associated cirrhosis• Cryptogenic cirrhosis in 29%
• Half had histologic features consistent with NASH
• Estimated that 13% of HCC and cryptogenic cirrhosis may have NAFLD/NASH
Single center study, Univ. Michigan
•105 consecutive patients with HCC• 51% due to HCV-associated cirrhosis• Cryptogenic cirrhosis in 29%
• Half had histologic features consistent with NASH
• Estimated that 13% of HCC and cryptogenic cirrhosis may have NAFLD/NASH
Marrero J, et al, Hepatology 2002Marrero J, et al, Hepatology 2002
Non-alcoholic Fatty Liver Disease (NAFLD) and HCCNon-alcoholic Fatty Liver Disease (NAFLD) and HCC
HCC EpidemiologyHCC Epidemiology
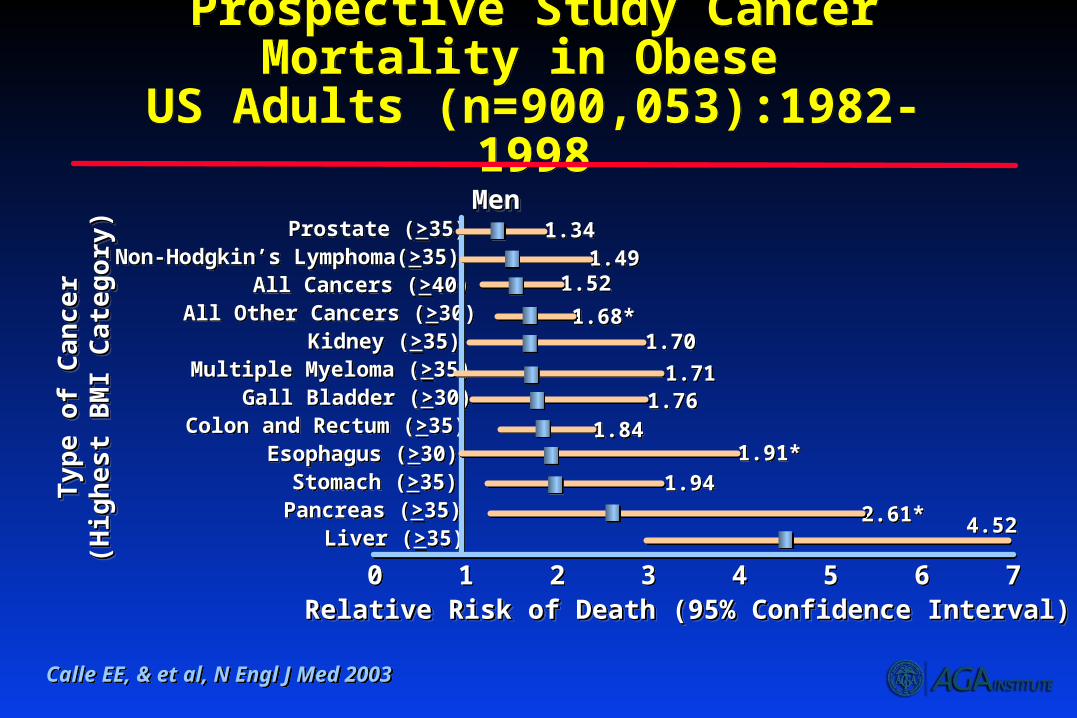
Prospective Study Cancer Mortality in Obese
US Adults (n=900,053):1982-1998
Prospective Study Cancer Mortality in Obese
US Adults (n=900,053):1982-1998
Calle EE, & et al, N Engl J Med 2003Calle EE, & et al, N Engl J Med 2003
00 11
Prostate (>35)Prostate (>35)
Relative Risk of Death (95% Confidence Interval)Relative Risk of Death (95% Confidence Interval)Relative Risk of Death (95% Confidence Interval)Relative Risk of Death (95% Confidence Interval)
1.341.341.491.49
1.521.52
1.68*1.68*1.701.70
1.711.711.761.76
1.841.841.91*1.91*
1.941.94
2.61*2.61*4.524.52
MenMenMenMen
Ty
pe
of
Can
cer
Ty
pe
of
Can
cer
(Hig
hes
t B
MI C
ate
go
ry)
(Hig
hes
t B
MI C
ate
go
ry)
Ty
pe
of
Can
cer
Ty
pe
of
Can
cer
(Hig
hes
t B
MI C
ate
go
ry)
(Hig
hes
t B
MI C
ate
go
ry)
22 33 44 55 66 77
Non-Hodgkin’s Lymphoma(>35)Non-Hodgkin’s Lymphoma(>35)All Cancers (>40)All Cancers (>40)
All Other Cancers (>30)All Other Cancers (>30)Kidney (>35)Kidney (>35)
Multiple Myeloma (>35)Multiple Myeloma (>35)Gall Bladder (>30)Gall Bladder (>30)
Colon and Rectum (>35)Colon and Rectum (>35)Esophagus (>30)Esophagus (>30)
Stomach (>35)Stomach (>35)Pancreas (>35)Pancreas (>35)
Liver (>35)Liver (>35)
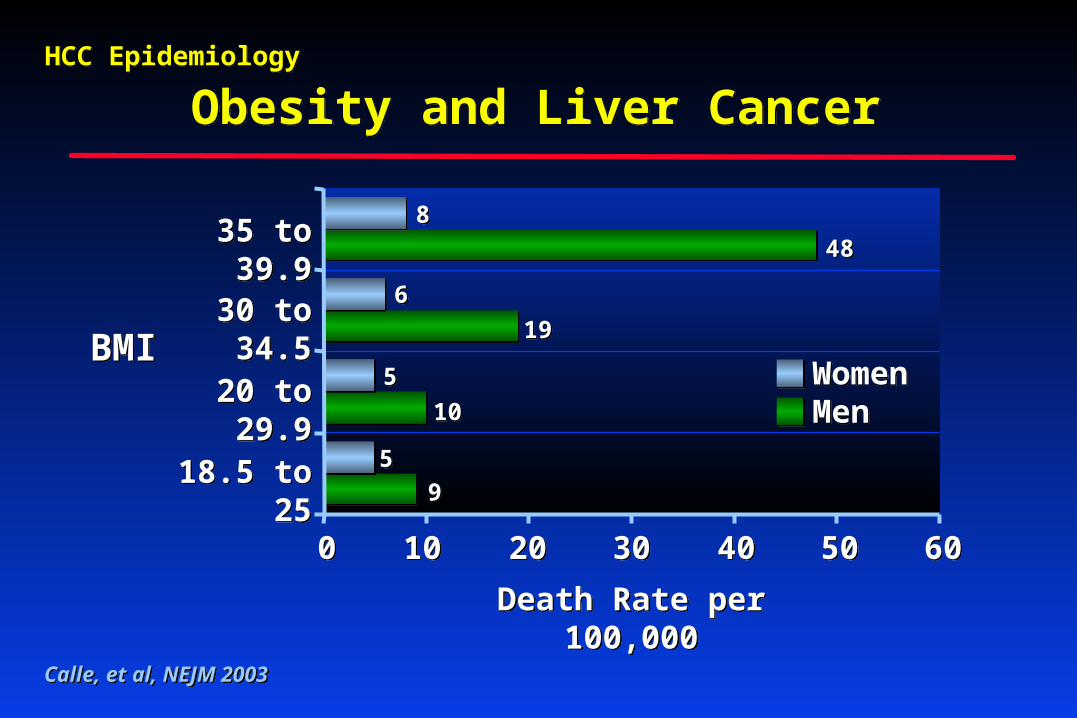
Obesity and Liver CancerObesity and Liver Cancer
Calle, et al, NEJM 2003Calle, et al, NEJM 2003
WomenMenWomenMen
55
88
Death Rate per 100,000Death Rate per 100,000
5050404030302020101000 6060
35 to 39.935 to 39.9
30 to 34.530 to 34.5
20 to 29.920 to 29.9
18.5 to 2518.5 to 25
4848
66
1919
1010
55
99
BMIBMI
HCC EpidemiologyHCC Epidemiology
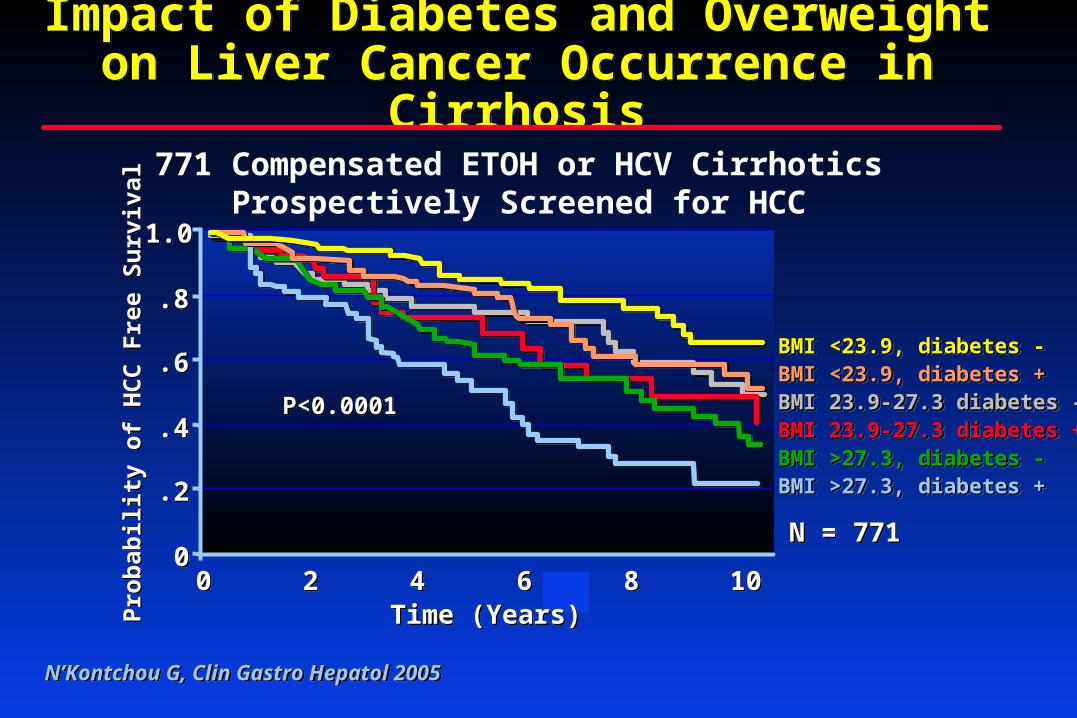
Impact of Diabetes and Overweighton Liver Cancer Occurrence in Cirrhosis
Impact of Diabetes and Overweighton Liver Cancer Occurrence in Cirrhosis
N’Kontchou G, Clin Gastro Hepatol 2005N’Kontchou G, Clin Gastro Hepatol 2005
BMI <23.9, diabetes -BMI <23.9, diabetes -BMI <23.9, diabetes +BMI <23.9, diabetes +BMI 23.9-27.3 diabetes -BMI 23.9-27.3 diabetes -BMI 23.9-27.3 diabetes +BMI 23.9-27.3 diabetes +BMI >27.3, diabetes -BMI >27.3, diabetes -BMI >27.3, diabetes +BMI >27.3, diabetes +
BMI <23.9, diabetes -BMI <23.9, diabetes -BMI <23.9, diabetes +BMI <23.9, diabetes +BMI 23.9-27.3 diabetes -BMI 23.9-27.3 diabetes -BMI 23.9-27.3 diabetes +BMI 23.9-27.3 diabetes +BMI >27.3, diabetes -BMI >27.3, diabetes -BMI >27.3, diabetes +BMI >27.3, diabetes +
P<0.0001P<0.0001
00
.2.2
.4.4
.6.6
.8.8
1.01.0
N = 771N = 771
Time (Years)Time (Years)00 22 44 66 88 1010P
rob
abil
ity
of
HC
C F
ree
Su
rviv
alP
rob
abil
ity
of
HC
C F
ree
Su
rviv
al
771 Compensated ETOH or HCV Cirrhotics Prospectively Screened for HCC
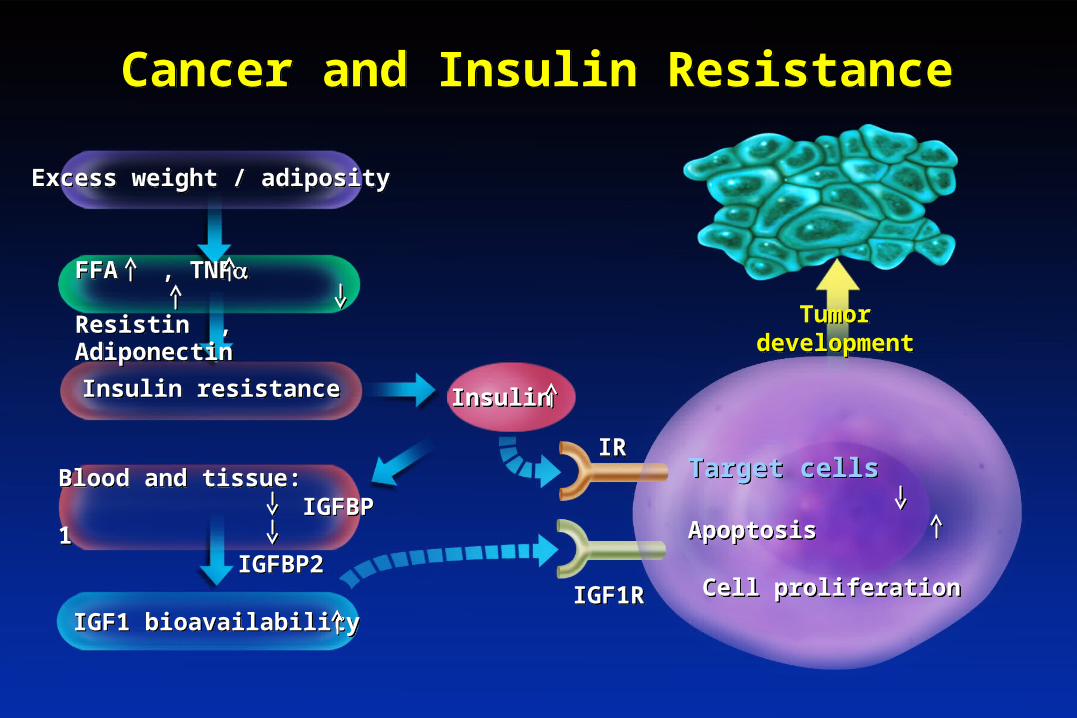
Cancer and Insulin ResistanceCancer and Insulin Resistance
Excess weight / adiposityExcess weight / adiposity
FFA , TNF Resistin , Adiponectin
FFA , TNF Resistin , Adiponectin
Insulin resistanceInsulin resistance
Blood and tissue: IGFBP 1
IGFBP2
Blood and tissue: IGFBP 1
IGFBP2
IGF1 bioavailabilityIGF1 bioavailability
InsulinInsulin
IRIR
IGF1RIGF1R
Tumor development
Tumor development
Target cells Apoptosis
Cell proliferation
Target cells Apoptosis
Cell proliferation
Screening / Surveillance for Hepatocellular Carcinoma
Screening / Surveillance for Hepatocellular Carcinoma
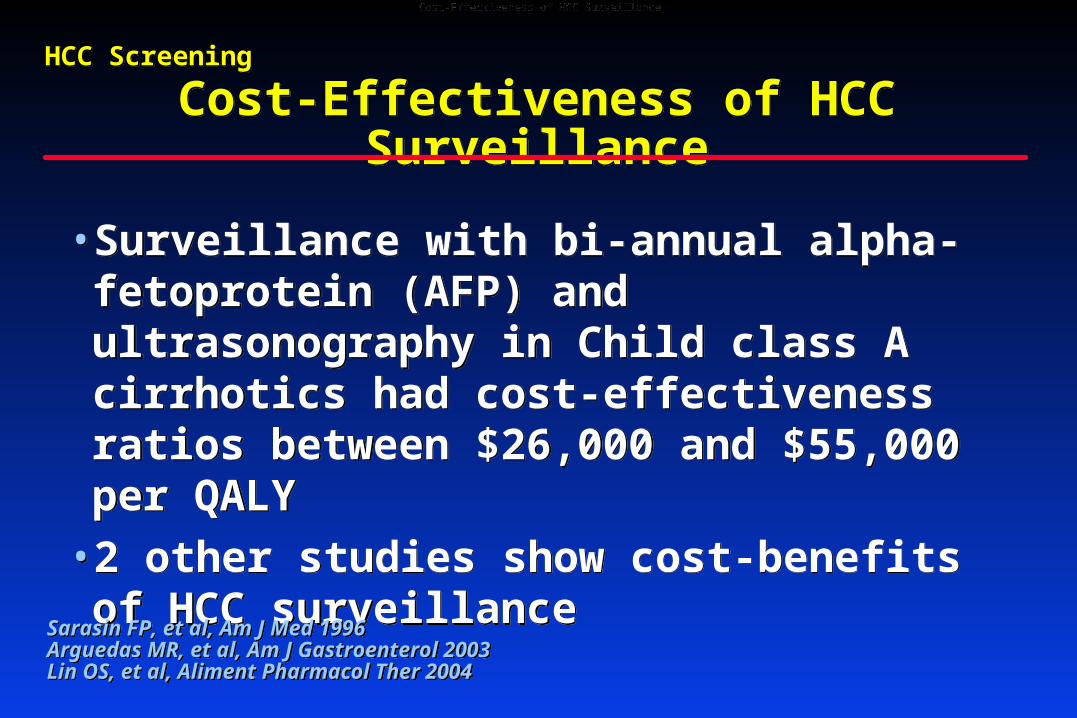
Cost-Effectiveness of HCC SurveillanceCost-Effectiveness of HCC Surveillance
• Surveillance with bi-annual alpha-fetoprotein (AFP) and ultrasonography in Child class A cirrhotics had cost-effectiveness ratios between $26,000 and $55,000 per QALY
• 2 other studies show cost-benefits of HCC surveillance
• Surveillance with bi-annual alpha-fetoprotein (AFP) and ultrasonography in Child class A cirrhotics had cost-effectiveness ratios between $26,000 and $55,000 per QALY
• 2 other studies show cost-benefits of HCC surveillance
Sarasin FP, et al, Am J Med 1996 Arguedas MR, et al, Am J Gastroenterol 2003 Lin OS, et al, Aliment Pharmacol Ther 2004
Sarasin FP, et al, Am J Med 1996 Arguedas MR, et al, Am J Gastroenterol 2003 Lin OS, et al, Aliment Pharmacol Ther 2004
Cost-Effectiveness of HCC SurveillanceCost-Effectiveness of HCC Surveillance
HCC ScreeningHCC Screening
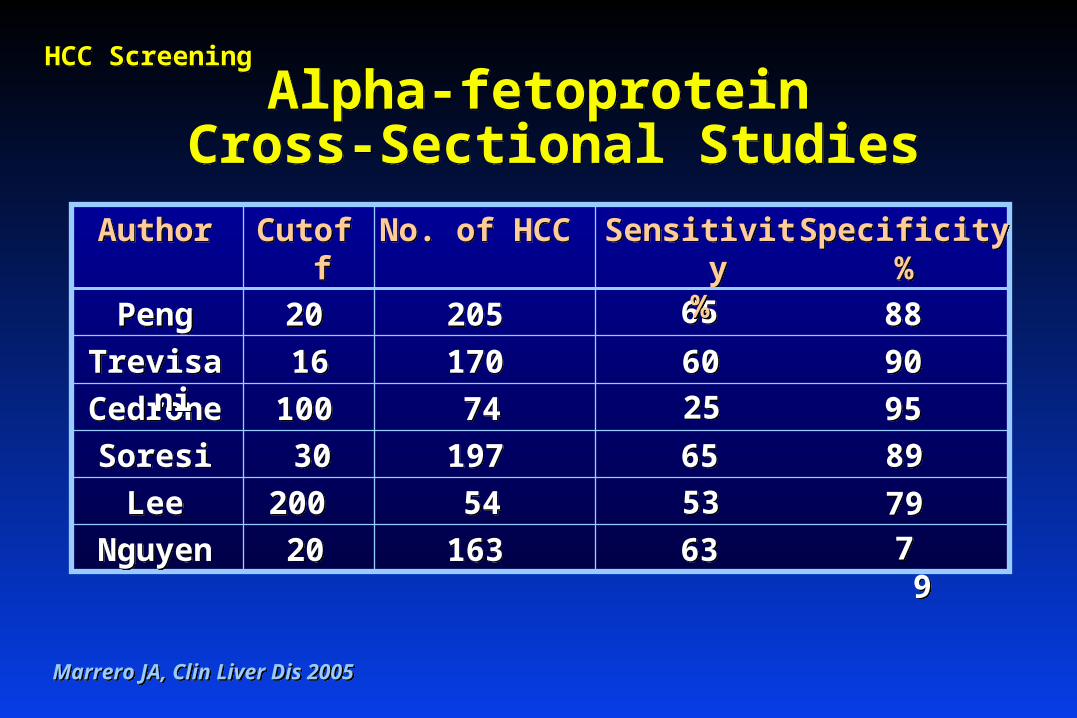
Alpha-fetoprotein Cross-Sectional Studies
Alpha-fetoprotein Cross-Sectional Studies
Marrero JA, Clin Liver Dis 2005Marrero JA, Clin Liver Dis 2005
63631631632020NguyenNguyen
53535454200200LeeLee
65651971973030SoresiSoresi
25257474100100CedroneCedrone
60601701701616TrevisaniTrevisani
65652052052020PengPeng
Sensitivity%
Sensitivity%
No. of HCCNo. of HCCCutoffCutoffAuthorAuthor
79797979
8989
9595
9090
8888
Specificity%
Specificity%
HCC ScreeningHCC Screening
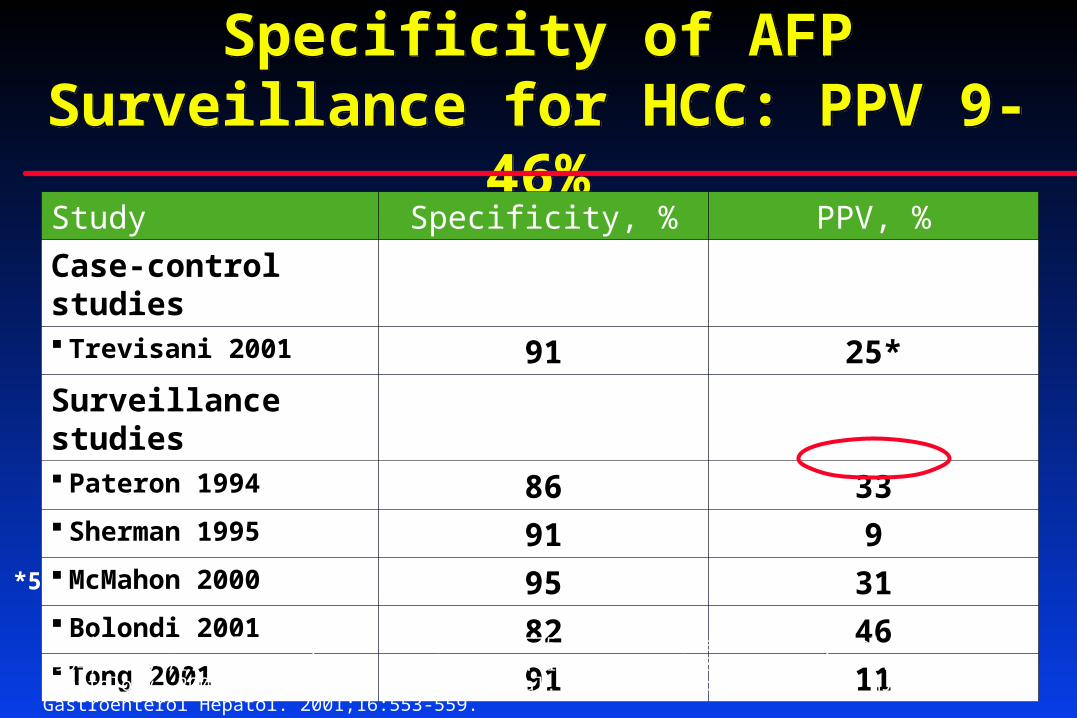
Specificity of AFP Surveillance for HCC: PPV 9- 46%
Specificity of AFP Surveillance for HCC: PPV 9- 46%
*5% prevalence of HCC.
Study Specificity, % PPV, %
Case-control studies Trevisani 2001 91 25*
Surveillance studies Pateron 1994 86 33 Sherman 1995 91 9 McMahon 2000 95 31 Bolondi 2001 82 46 Tong 2001 91 11
Trevisani F, et al. J Hepatol. 2001;34:570-575. Pateron D, et al. J Hepatol. 1994;20:65-71. Sherman M, et al. Hepatology. 1995;22:432-438. McMahon BJ, et al. Hepatology. 2000;32:842-846. Bolondi L, et al. Gut. 2001;48:251-259. Tong MJ, et al. J Gastroenterol Hepatol. 2001;16:553-559.
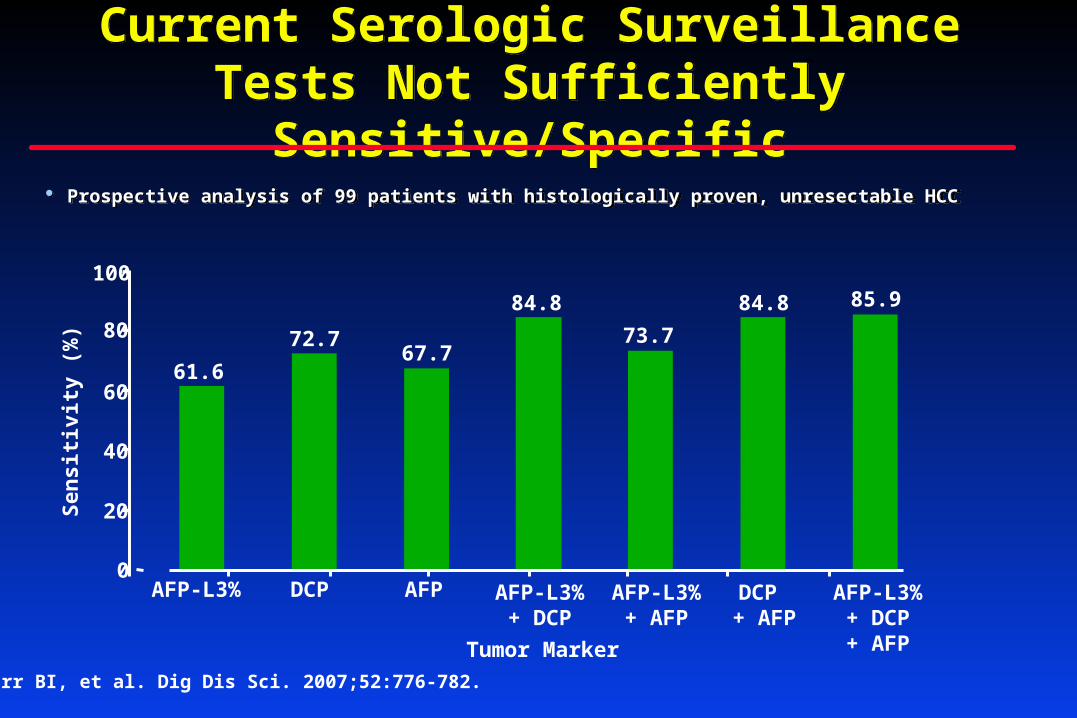
Current Serologic Surveillance Tests Not Sufficiently Sensitive/Specific
Current Serologic Surveillance Tests Not Sufficiently Sensitive/Specific
Prospective analysis of 99 patients with histologically proven, unresectable HCC Prospective analysis of 99 patients with histologically proven, unresectable HCC
Carr BI, et al. Dig Dis Sci. 2007;52:776-782.
61.6
72.767.7
84.8
73.7
84.8 85.9
0
20
40
60
80
100
AFP-L3% DCP AFP AFP-L3%+ DCP
AFP-L3%+ AFP
DCP + AFP
AFP-L3%+ DCP+ AFP
Sen
siti
vity
(%
)
Tumor Marker
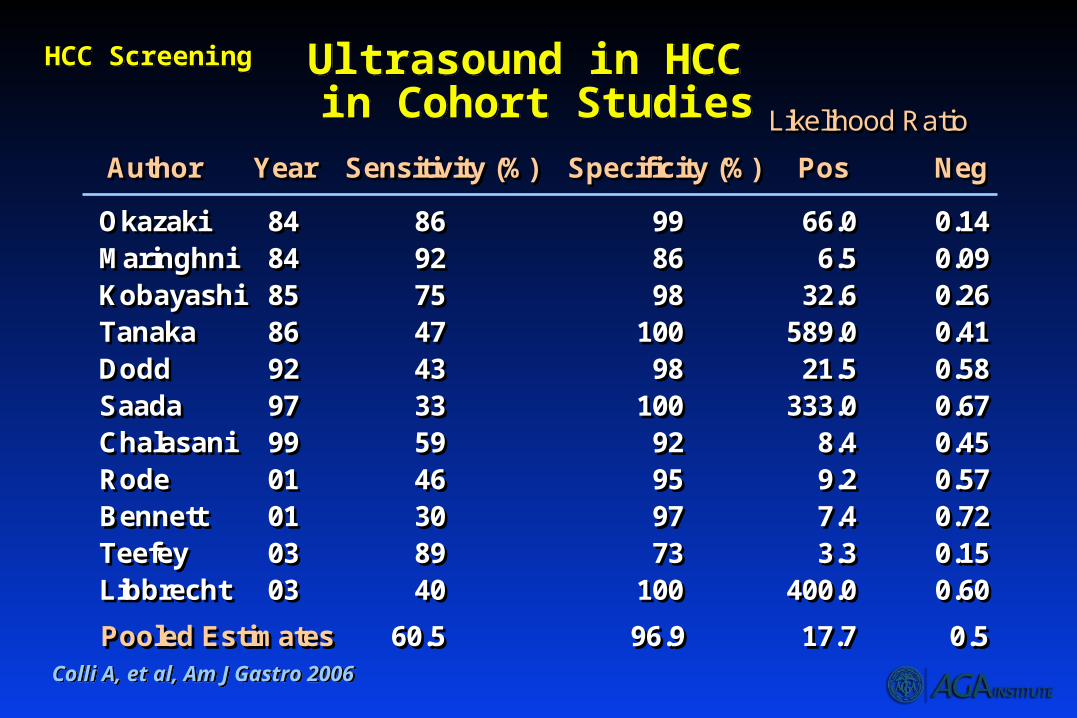
Ultrasound in HCC in Cohort Studies
Ultrasound in HCC in Cohort Studies
HCC ScreeningHCC Screening
Author Year Sensitivity (%) Specificity (%) Pos Neg
Okazaki 84 86 99 66.0 0.14Maringhni 84 92 86 6.5 0.09Kobayashi 85 75 98 32.6 0.26Tanaka 86 47 100 589.0 0.41Dodd 92 43 98 21.5 0.58Saada 97 33 100 333.0 0.67Chalasani 99 59 92 8.4 0.45Rode 01 46 95 9.2 0.57Bennett 01 30 97 7.4 0.72Teefey 03 89 73 3.3 0.15Libbrecht 03 40 100 400.0 0.60
Likelihood RatioLikelihood Ratio
Pooled Estimates 60.5 96.9 17.7 0.5Pooled Estimates 60.5 96.9 17.7 0.5Colli A, et al, Am J Gastro 2006Colli A, et al, Am J Gastro 2006
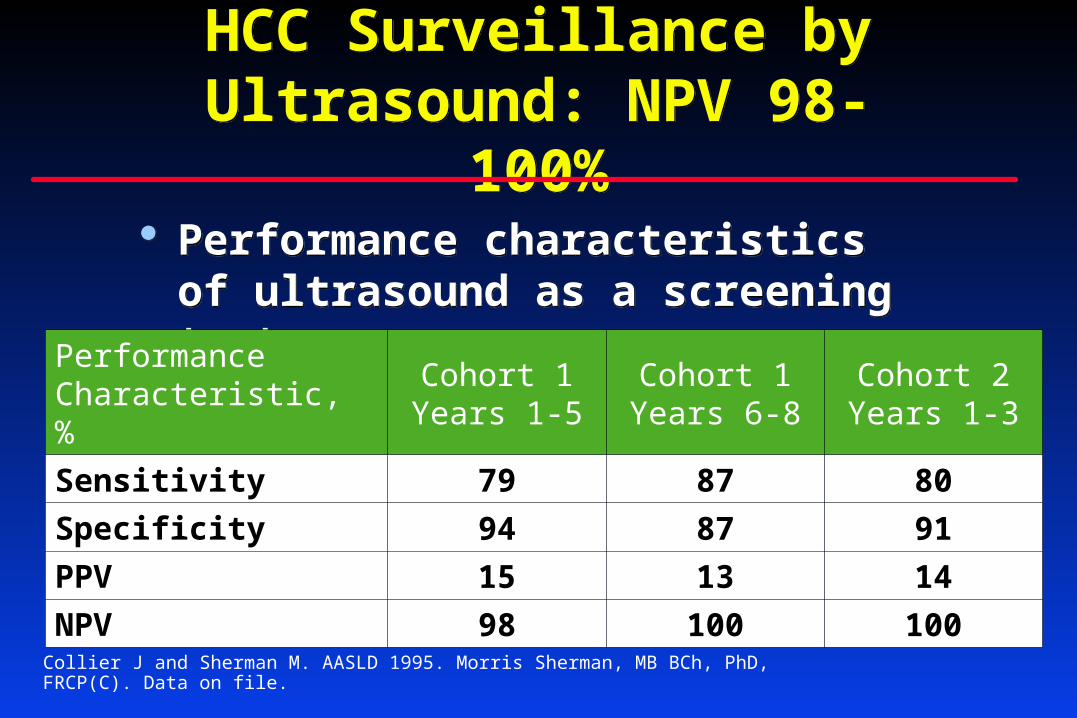
HCC Surveillance by Ultrasound: NPV 98-100%
HCC Surveillance by Ultrasound: NPV 98-100%
Performance characteristics of ultrasound as a screening test
Performance characteristics of ultrasound as a screening test
Performance Characteristic, %
Cohort 1Years 1-5
Cohort 1Years 6-8
Cohort 2Years 1-3
Sensitivity 79 87 80
Specificity 94 87 91
PPV 15 13 14
NPV 98 100 100
Collier J and Sherman M. AASLD 1995. Morris Sherman, MB BCh, PhD, FRCP(C). Data on file.
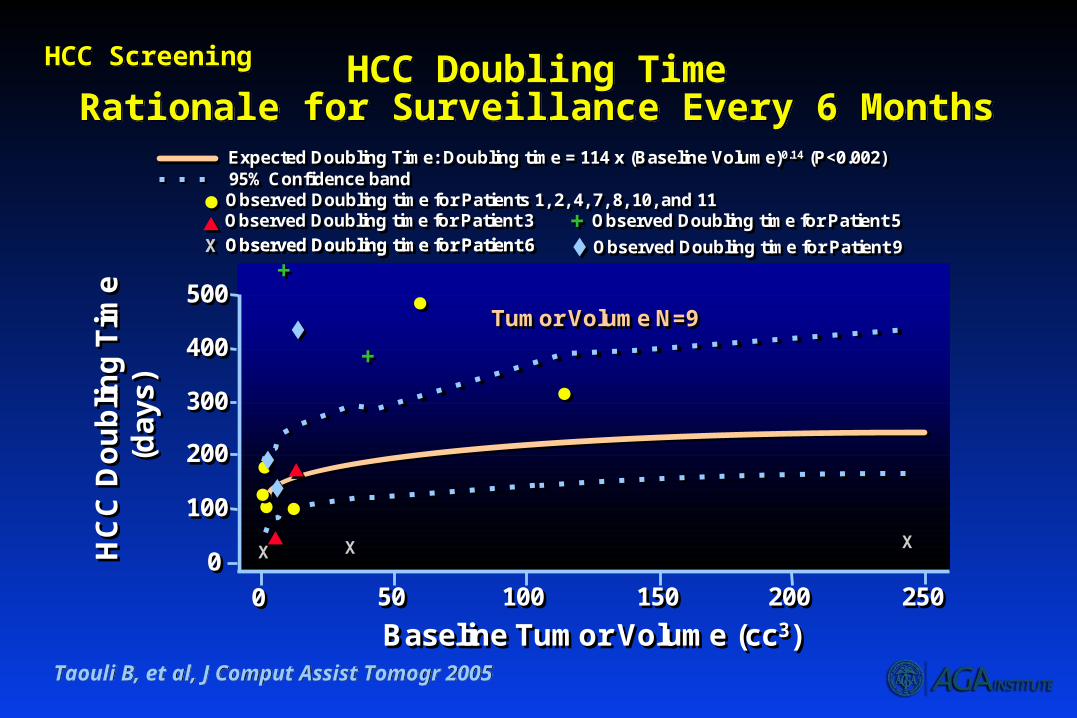
HCC Doubling TimeRationale for Surveillance Every 6 Months
HCC Doubling TimeRationale for Surveillance Every 6 Months
Taouli B, et al, J Comput Assist Tomogr 2005Taouli B, et al, J Comput Assist Tomogr 2005
HCC ScreeningHCC Screening
150150100100 200200 25025000
200200
300300
400400
100100
505000
500500
HC
C D
ou
blin
g T
ime
(da
ys)
HC
C D
ou
blin
g T
ime
(da
ys)
Baseline Tumor Volume (cc3)Baseline Tumor Volume (cc3)
XX XX
++
++
XX
Expected Doubling Time: Doubling time = 114 x (Baseline Volume)0.14 (P<0.002)Expected Doubling Time: Doubling time = 114 x (Baseline Volume)0.14 (P<0.002)95% Confidence band95% Confidence bandObserved Doubling time for Patients 1, 2, 4, 7, 8, 10, and 11Observed Doubling time for Patients 1, 2, 4, 7, 8, 10, and 11Observed Doubling time for Patient 3Observed Doubling time for Patient 3 ++ Observed Doubling time for Patient 5Observed Doubling time for Patient 5
XX Observed Doubling time for Patient 6Observed Doubling time for Patient 6XX Observed Doubling time for Patient 6Observed Doubling time for Patient 6 Observed Doubling time for Patient 9Observed Doubling time for Patient 9
Tumor Volume N=9Tumor Volume N=9
Surveillance Interval: 6 vs 12 MonthsSurveillance Interval: 6 vs 12 Months Trevisani et al[1]
Survival similar with 6-month vs 12-month surveillance
Santagostino et al[2]
Rate of detection of single nodules (vs multinodular HCC) similar with 6-month vs 12-month surveillance
Kim et al[3]
Survival improved with 6-month vs 12-month surveillance
Trevisani et al[1]
Survival similar with 6-month vs 12-month surveillance
Santagostino et al[2]
Rate of detection of single nodules (vs multinodular HCC) similar with 6-month vs 12-month surveillance
Kim et al[3]
Survival improved with 6-month vs 12-month surveillance
1. Trevisani F, et al. Am J Gastroenterol. 2002;97:734-744. 2. Santagostino E, et al. Blood. 2003;102:78-82. 3. Kim DY, et al. AASLD 2007. Abstract 368.
AASLD and NCCN Surveillance Guidelines
AASLD and NCCN Surveillance Guidelines
AASLD Guidelines Surveillance recommended in
at-risk groups
Specific hepatitis B carriers
Nonhepatitis B cirrhosis
US preferred surveillance tool
AFP alone should not be used unless US unavailable
Patients should be screened at - 6 to 12-month intervals
AASLD Guidelines Surveillance recommended in
at-risk groups
Specific hepatitis B carriers
Nonhepatitis B cirrhosis
US preferred surveillance tool
AFP alone should not be used unless US unavailable
Patients should be screened at - 6 to 12-month intervals
NCCN Guidelines US and AFP, AP, and albumin
for surveillance in high-risk patients
Every 3-6 months
Continue screening every 3 months in those with high AFP but no evidence on imaging
NCCN Guidelines US and AFP, AP, and albumin
for surveillance in high-risk patients
Every 3-6 months
Continue screening every 3 months in those with high AFP but no evidence on imaging
NCCN, National Comprehensive Cancer
Surveillance for HCC Improves MortalityA Randomized Controlled Trial
Surveillance for HCC Improves MortalityA Randomized Controlled Trial
Screened group Control group
Person-years in study 38,444 41,077HCC occurrence
Cases 86 67Total incidence (per 100,000) 223.7 163.1Rate ratio (95% CI) 1.37 (0.99, 1.89)
Deaths from HCCDeaths 32 54Total mortality (per 100,000) 83.2 131.5Rate ratio (95% CI) 0.63 (0.41, 0.98)
Screened group Control group
Person-years in study 38,444 41,077HCC occurrence
Cases 86 67Total incidence (per 100,000) 223.7 163.1Rate ratio (95% CI) 1.37 (0.99, 1.89)
Deaths from HCCDeaths 32 54Total mortality (per 100,000) 83.2 131.5Rate ratio (95% CI) 0.63 (0.41, 0.98)
HCC ScreeningHCC Screening
Diagnosis of Hepatocellular Carcinoma
Diagnosis of Hepatocellular Carcinoma
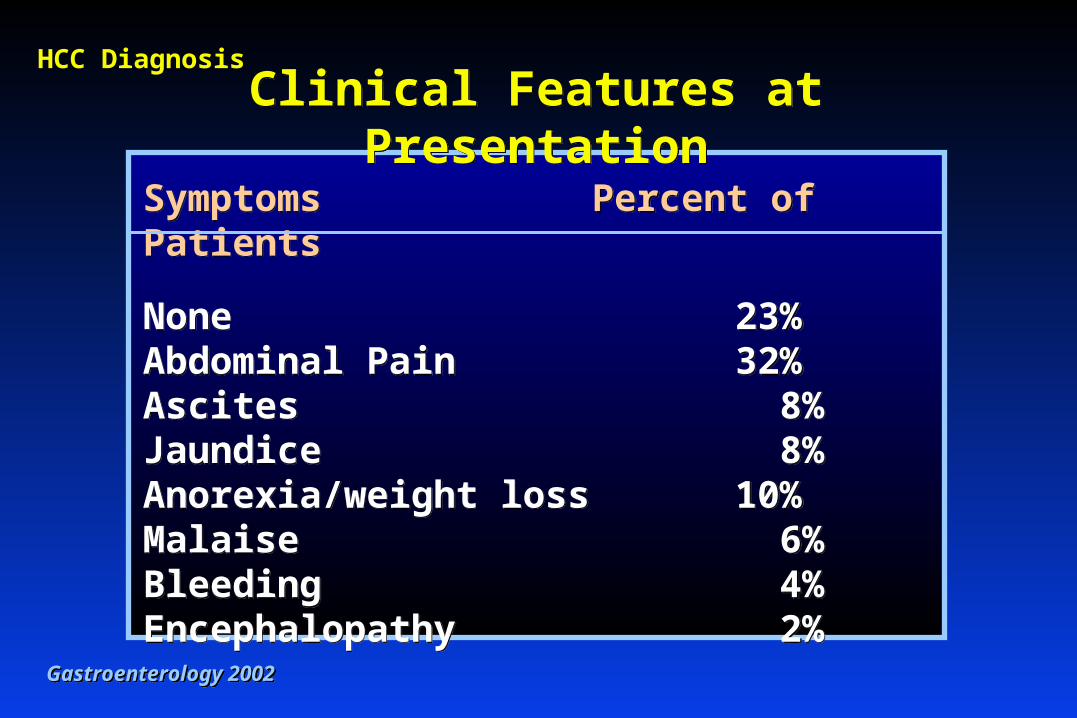
Clinical Features at PresentationClinical Features at Presentation
Symptoms Percent of Patients
None 23%Abdominal Pain 32%Ascites 8%Jaundice 8%Anorexia/weight loss 10%Malaise 6%Bleeding 4%Encephalopathy 2%
Symptoms Percent of Patients
None 23%Abdominal Pain 32%Ascites 8%Jaundice 8%Anorexia/weight loss 10%Malaise 6%Bleeding 4%Encephalopathy 2%
Gastroenterology 2002Gastroenterology 2002
HCC Diagnosis
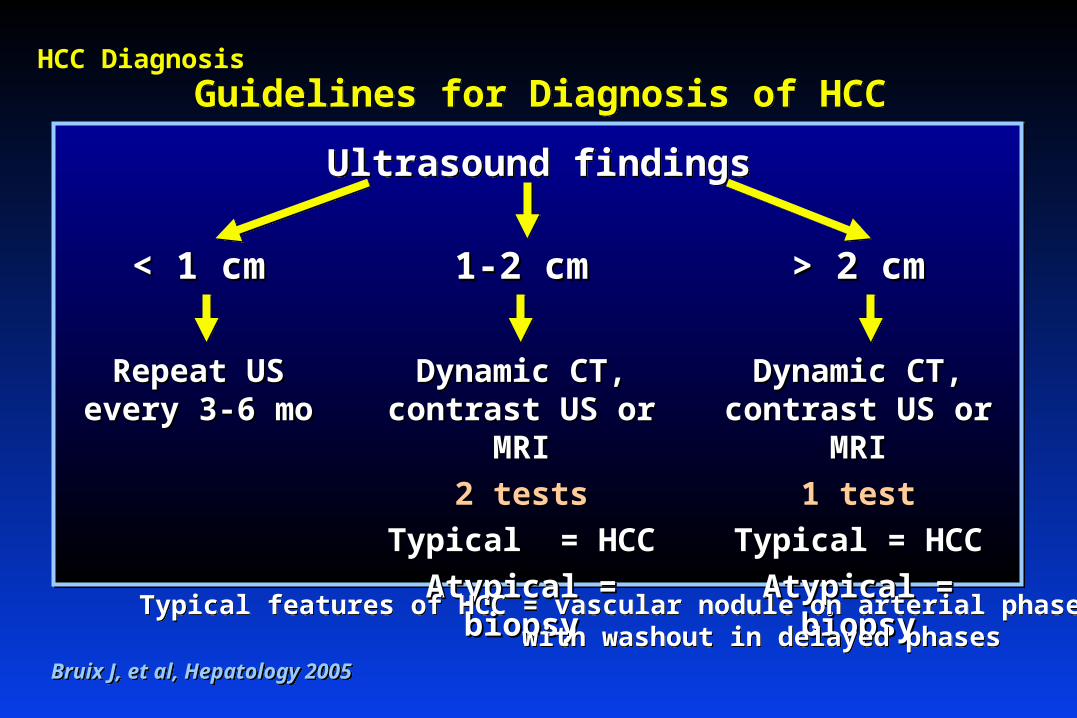
Guidelines for Diagnosis of HCCGuidelines for Diagnosis of HCC
< 1 cm< 1 cm 1-2 cm1-2 cm > 2 cm> 2 cm
Repeat US every Repeat US every 3-6 mo3-6 mo
Dynamic CT, Dynamic CT, contrast US or MRIcontrast US or MRI
2 tests2 tests
Typical = HCCTypical = HCC
Atypical = biopsyAtypical = biopsy
Dynamic CT, Dynamic CT, contrast US or MRIcontrast US or MRI
1 test1 test
Typical = HCCTypical = HCC
Atypical = biopsyAtypical = biopsy
Typical features of HCC = vascular nodule on arterial phase with washout in delayed phases
Typical features of HCC = vascular nodule on arterial phase with washout in delayed phases
Ultrasound findingsUltrasound findings
Bruix J, et al, Hepatology 2005Bruix J, et al, Hepatology 2005
HCC Diagnosis
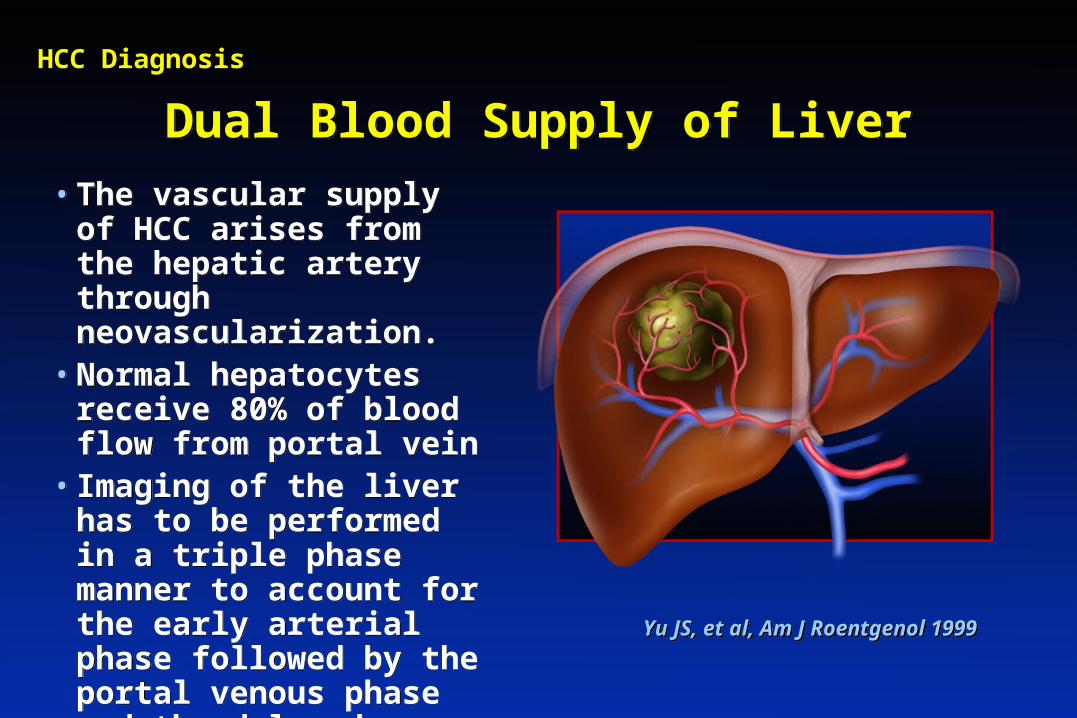
Dual Blood Supply of LiverDual Blood Supply of Liver
• The vascular supply of HCC arises from the hepatic artery through neovascularization.
• Normal hepatocytes receive 80% of blood flow from portal vein
• Imaging of the liver has to be performed in a triple phase manner to account for the early arterial phase followed by the portal venous phase and the delayed phases
Yu JS, et al, Am J Roentgenol 1999Yu JS, et al, Am J Roentgenol 1999
HCC Diagnosis
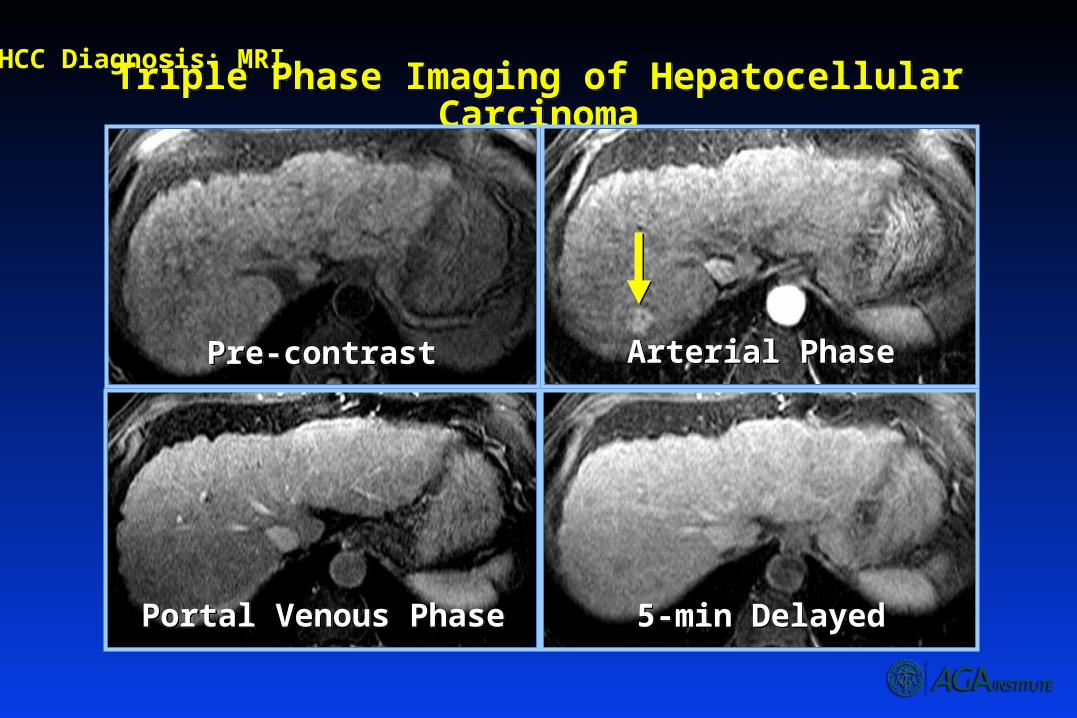
Triple Phase Imaging of Hepatocellular CarcinomaTriple Phase Imaging of Hepatocellular Carcinoma
Pre-contrastPre-contrast
Portal Venous PhasePortal Venous Phase
Arterial PhaseArterial Phase
5-min Delayed5-min Delayed
HCC Diagnosis: MRI
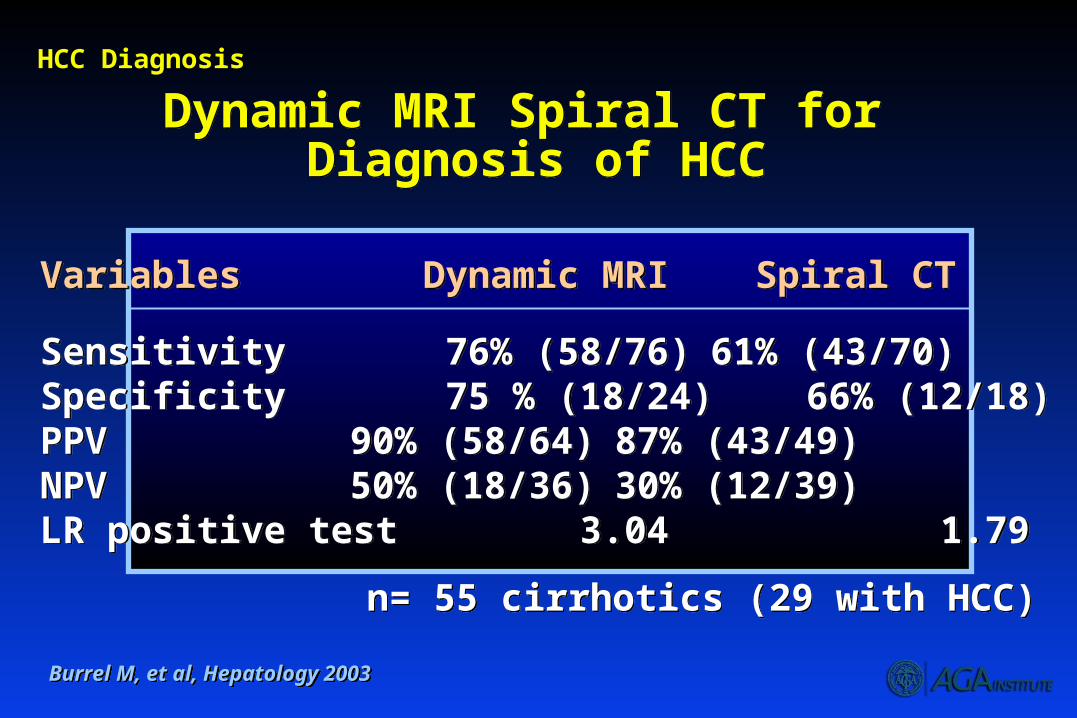
Dynamic MRI Spiral CT for Diagnosis of HCC
Dynamic MRI Spiral CT for Diagnosis of HCC
Variables Dynamic MRI Spiral CT
Sensitivity 76% (58/76) 61% (43/70)Specificity 75 % (18/24) 66% (12/18)PPV 90% (58/64) 87% (43/49)NPV 50% (18/36) 30% (12/39)LR positive test 3.04 1.79
Variables Dynamic MRI Spiral CT
Sensitivity 76% (58/76) 61% (43/70)Specificity 75 % (18/24) 66% (12/18)PPV 90% (58/64) 87% (43/49)NPV 50% (18/36) 30% (12/39)LR positive test 3.04 1.79
Burrel M, et al, Hepatology 2003Burrel M, et al, Hepatology 2003
n= 55 cirrhotics (29 with HCC)n= 55 cirrhotics (29 with HCC)
HCC Diagnosis
Treatment of Hepatocellular Carcinoma
Treatment of Hepatocellular Carcinoma
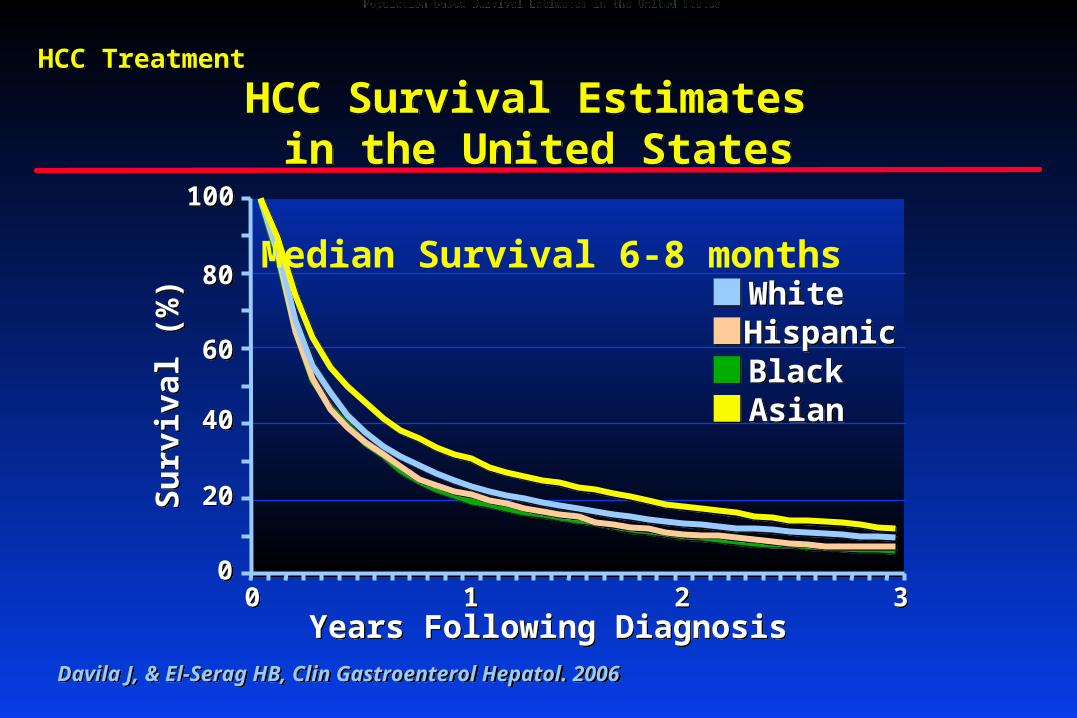
HCC Survival Estimates in the United States
HCC Survival Estimates in the United States
WhiteWhite
BlackBlackAsianAsian
HispanicHispanic
00
Years Following DiagnosisYears Following Diagnosis
Su
rviv
al (
%)
Su
rviv
al (
%)
2020
4040
6060
8080
100100
00 11 22 33
Davila J, & El-Serag HB, Clin Gastroenterol Hepatol. 2006 Davila J, & El-Serag HB, Clin Gastroenterol Hepatol. 2006
Population-based Survival Estimates in the United StatesPopulation-based Survival Estimates in the United States
HCC TreatmentHCC Treatment
Median Survival 6-8 months
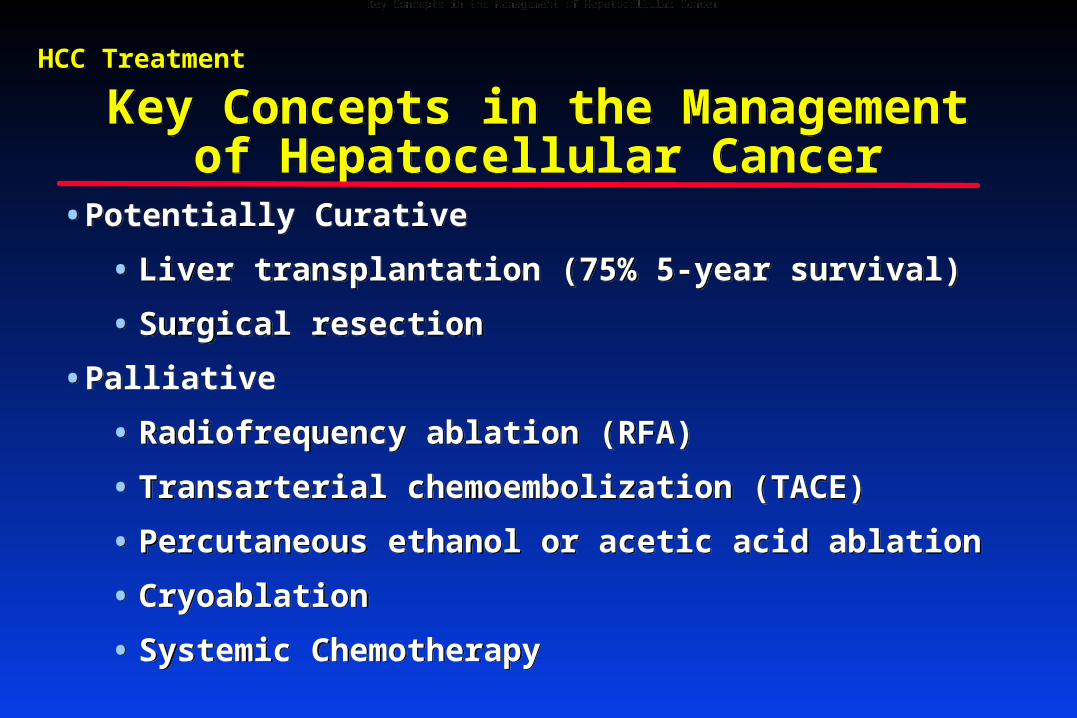
Key Concepts in the Management of Hepatocellular Cancer
Key Concepts in the Management of Hepatocellular Cancer
• Potentially Curative
• Liver transplantation (75% 5-year survival)
• Surgical resection
• Palliative
• Radiofrequency ablation (RFA)
• Transarterial chemoembolization (TACE)
• Percutaneous ethanol or acetic acid ablation
• Cryoablation
• Systemic Chemotherapy
• Potentially Curative
• Liver transplantation (75% 5-year survival)
• Surgical resection
• Palliative
• Radiofrequency ablation (RFA)
• Transarterial chemoembolization (TACE)
• Percutaneous ethanol or acetic acid ablation
• Cryoablation
• Systemic Chemotherapy
Key Concepts in the Management of Hepatocellular CancerKey Concepts in the Management of Hepatocellular Cancer
HCC TreatmentHCC Treatment
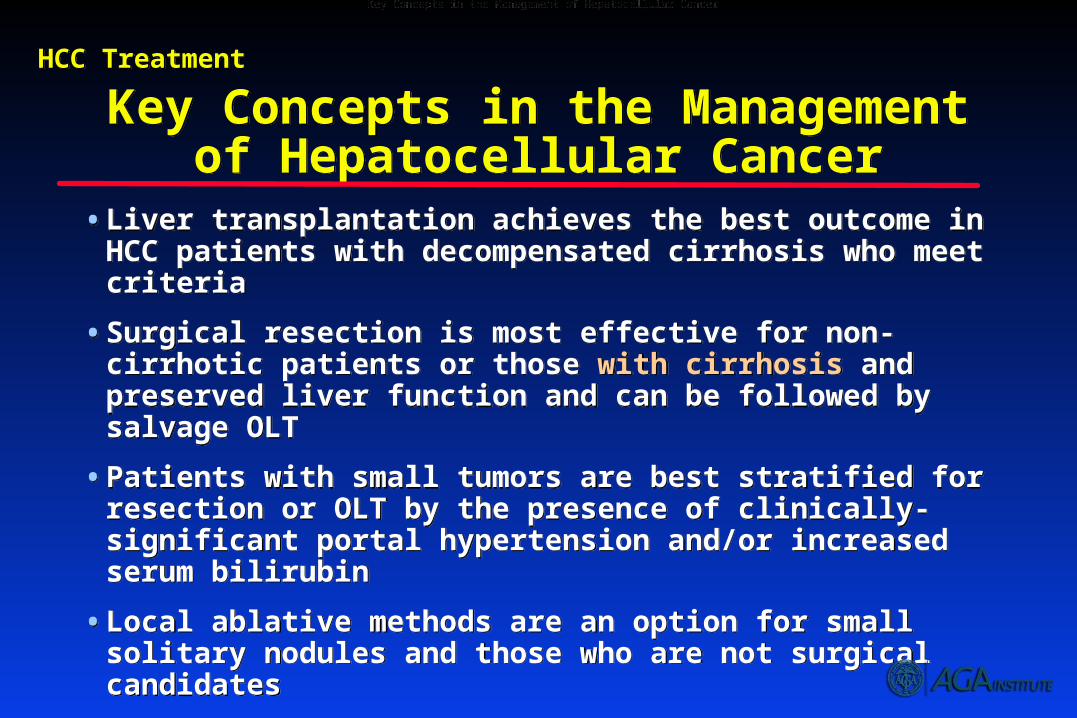
Key Concepts in the Management of Hepatocellular Cancer
Key Concepts in the Management of Hepatocellular Cancer
• Liver transplantation achieves the best outcome in HCC patients with decompensated cirrhosis who meet criteria
• Surgical resection is most effective for non-cirrhotic patients or those with cirrhosis and preserved liver function and can be followed by salvage OLT
• Patients with small tumors are best stratified for resection or OLT by the presence of clinically-significant portal hypertension and/or increased serum bilirubin
• Local ablative methods are an option for small solitary nodules and those who are not surgical candidates
• Transarterial chemoembolization improves survival in intermediate-advanced HCC
Key Concepts in the Management of Hepatocellular CancerKey Concepts in the Management of Hepatocellular Cancer
HCC TreatmentHCC Treatment
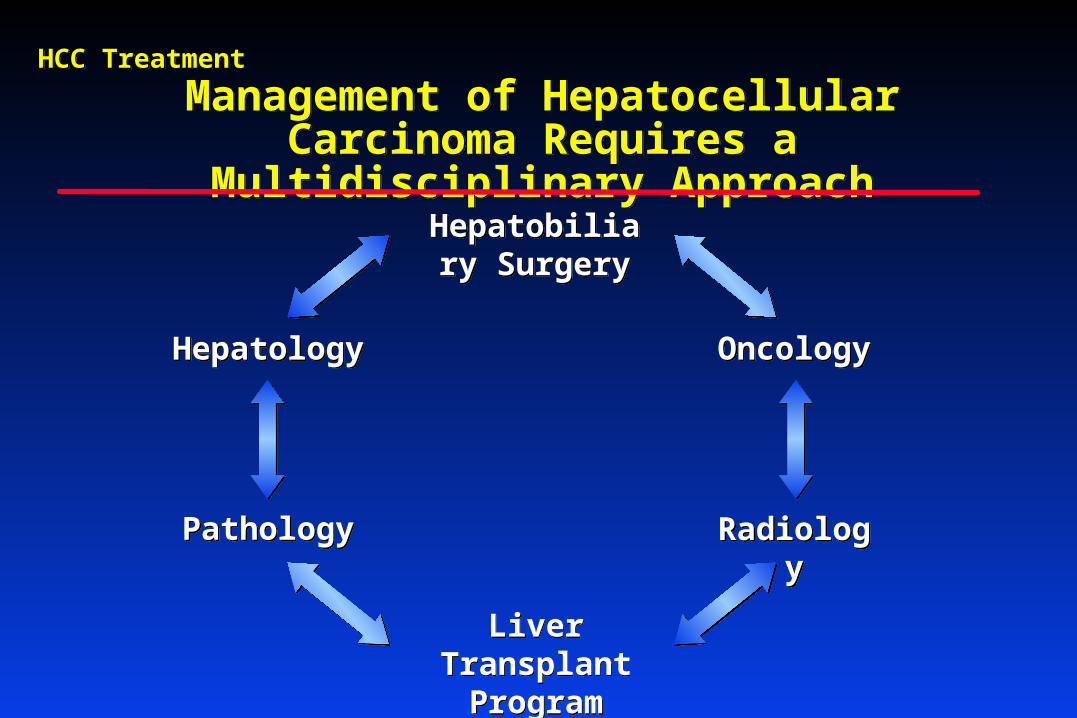
Management of Hepatocellular Carcinoma Requires a Multidisciplinary Approach
Management of Hepatocellular Carcinoma Requires a Multidisciplinary Approach
Liver Transplant Program
Liver Transplant Program
PathologyPathology
OncologyOncology
RadiologyRadiology
Hepatobiliary Surgery
Hepatobiliary Surgery
HepatologyHepatology
HCC TreatmentHCC Treatment
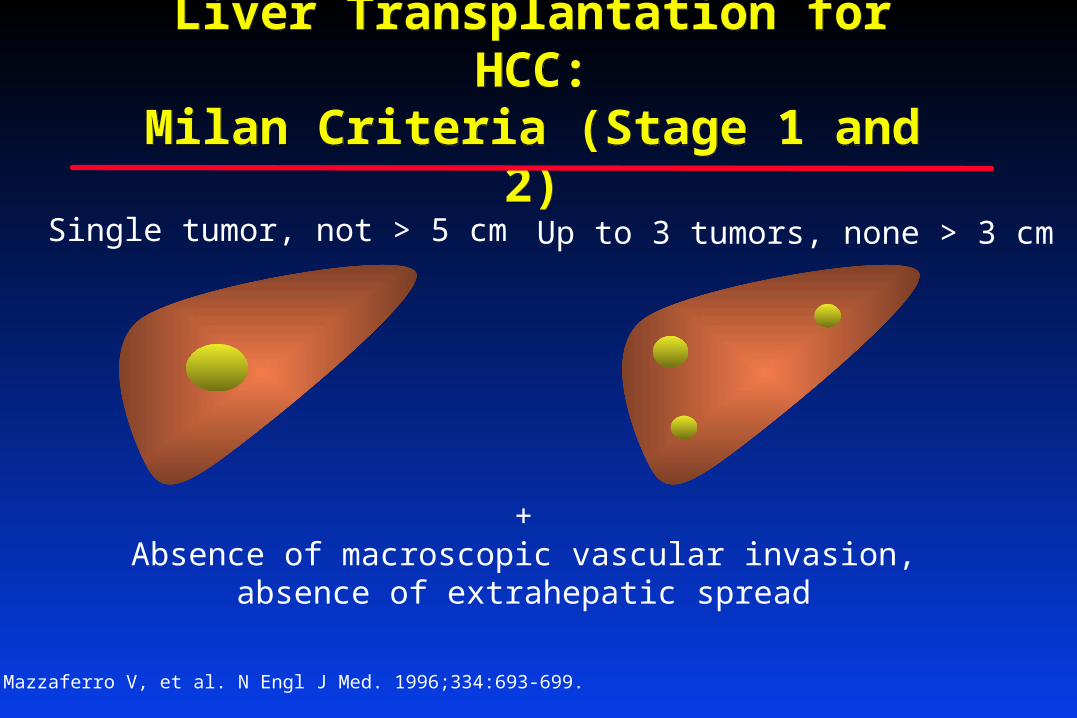
Liver Transplantation for HCC:Milan Criteria (Stage 1 and 2)
Liver Transplantation for HCC:Milan Criteria (Stage 1 and 2)
+Absence of macroscopic vascular invasion,
absence of extrahepatic spread
Single tumor, not > 5 cm Up to 3 tumors, none > 3 cm
Mazzaferro V, et al. N Engl J Med. 1996;334:693-699.
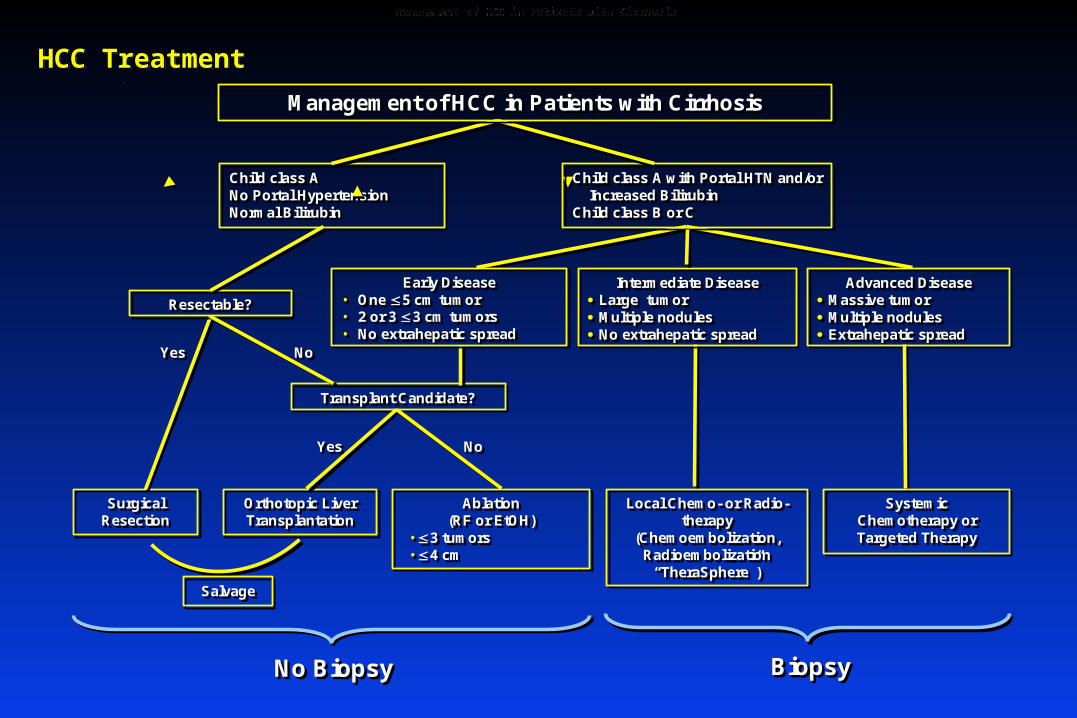
Management of HCC in Patients with CirrhosisManagement of HCC in Patients with Cirrhosis
Child class ANo Portal HypertensionNormal Bilirubin
Child class ANo Portal HypertensionNormal Bilirubin
Surgical ResectionSurgical
ResectionOrthotopic Liver Transplantation
Orthotopic Liver Transplantation
Advanced Disease Massive tumor Multiple nodules Extrahepatic spread
Advanced Disease Massive tumor Multiple nodules Extrahepatic spread
Child class A with Portal HTN and/or Increased Bilirubin
Child class B or C
Child class A with Portal HTN and/or Increased Bilirubin
Child class B or C
Transplant Candidate?Transplant Candidate?
YesYes NoNo
SalvageSalvage
Management of HCC in Patients with CirrhosisManagement of HCC in Patients with Cirrhosis
Early Disease• One 5 cm tumor• 2 or 3 3 cm tumors• No extrahepatic spread
Early Disease• One 5 cm tumor• 2 or 3 3 cm tumors• No extrahepatic spread
Systemic Chemotherapy or Targeted Therapy
Systemic Chemotherapy or Targeted Therapy
Local Chemo- or Radio-therapy
(Chemoembolization, Radioembolization
“TheraSphere”)
Local Chemo- or Radio-therapy
(Chemoembolization, Radioembolization
“TheraSphere”)
Ablation(RF or EtOH)
• 3 tumors• 4 cm
Ablation(RF or EtOH)
• 3 tumors• 4 cm
Resectable?Resectable?
YesYes NoNo
Intermediate Disease Large tumor Multiple nodules No extrahepatic spread
Intermediate Disease Large tumor Multiple nodules No extrahepatic spread
No BiopsyNo Biopsy BiopsyBiopsy
HCC TreatmentHCC Treatment
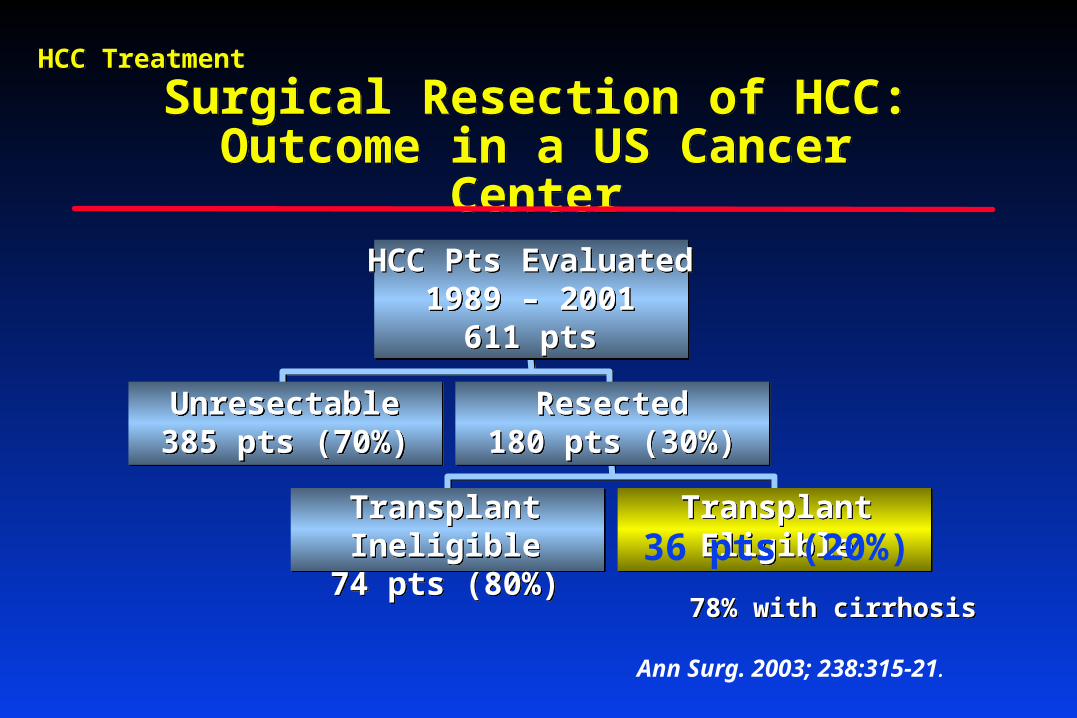
Surgical Resection of HCC:Outcome in a US Cancer Center
Surgical Resection of HCC:Outcome in a US Cancer Center
78% with cirrhosis78% with cirrhosis
Transplant EligibleTransplant EligibleTransplant Ineligible74 pts (80%)
Transplant Ineligible74 pts (80%)
Unresectable385 pts (70%)Unresectable385 pts (70%)
Resected180 pts (30%)
Resected180 pts (30%)
HCC Pts Evaluated1989 – 2001
611 pts
HCC Pts Evaluated1989 – 2001
611 pts
36 pts (20%)
HCC TreatmentHCC Treatment
Ann Surg. 2003; 238:315-21.
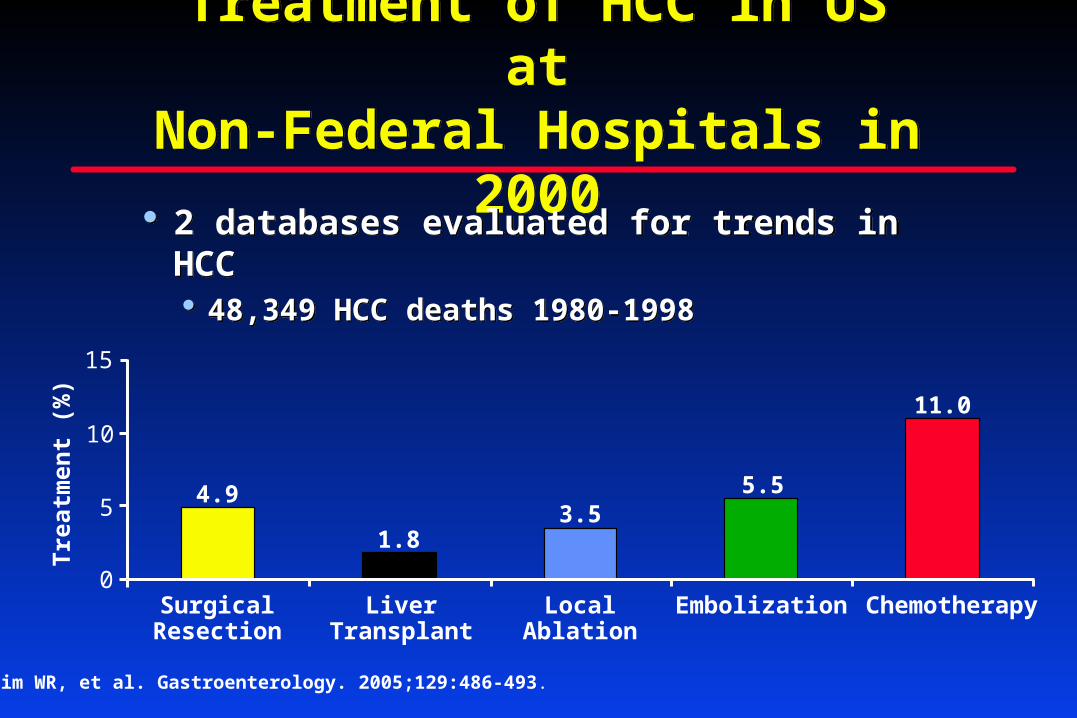
Treatment of HCC in US atNon-Federal Hospitals in 2000
Treatment of HCC in US atNon-Federal Hospitals in 2000
2 databases evaluated for trends in HCC 48,349 HCC deaths 1980-1998
2 databases evaluated for trends in HCC 48,349 HCC deaths 1980-1998
Kim WR, et al. Gastroenterology. 2005;129:486-493.
0
5
10
15
4.9
1.83.5
5.5
11.0
SurgicalResection
LiverTransplant
LocalAblation
Embolization Chemotherapy
Tre
atm
ent
(%)
Treatment for HCC Often Suboptimal
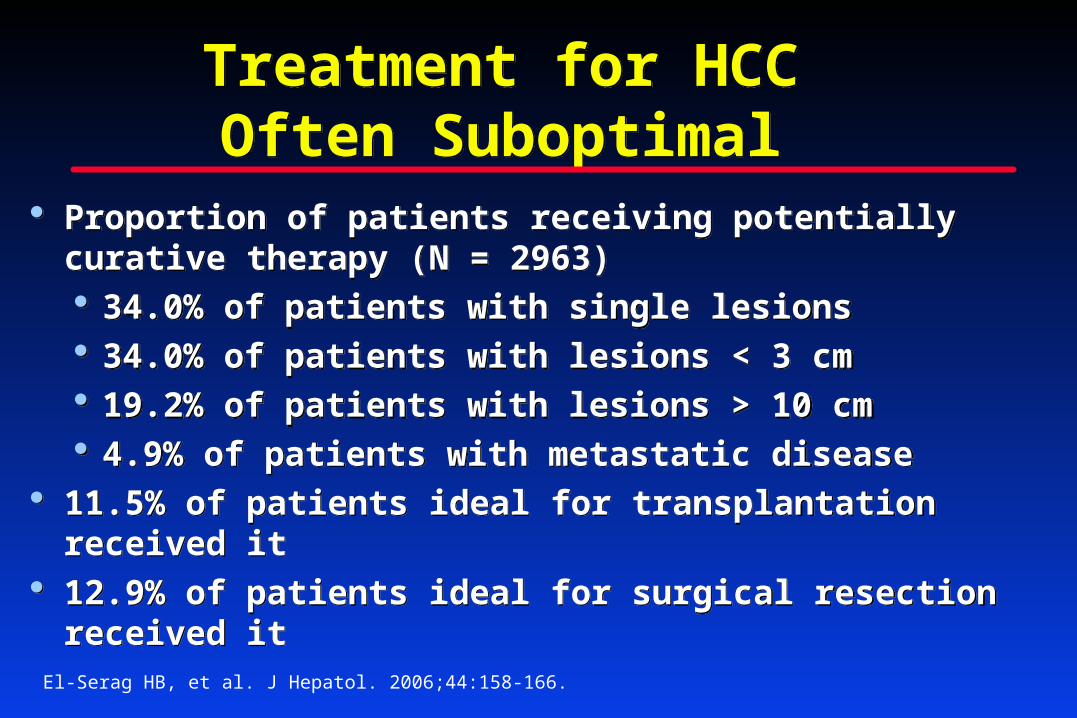
Treatment for HCC Often Suboptimal
Proportion of patients receiving potentially curative therapy (N = 2963) 34.0% of patients with single lesions 34.0% of patients with lesions < 3 cm 19.2% of patients with lesions > 10 cm 4.9% of patients with metastatic disease
11.5% of patients ideal for transplantation received it 12.9% of patients ideal for surgical resection
received it
Proportion of patients receiving potentially curative therapy (N = 2963) 34.0% of patients with single lesions 34.0% of patients with lesions < 3 cm 19.2% of patients with lesions > 10 cm 4.9% of patients with metastatic disease
11.5% of patients ideal for transplantation received it 12.9% of patients ideal for surgical resection
received itEl-Serag HB, et al. J Hepatol. 2006;44:158-166.
Su
rviv
al(K
apla
n M
eier
Est
imat
e)S
urv
ival
(Kap
lan
Mei
er E
stim
ate)
00 0.50.5 11 1.51.5 22 2.52.5 33 3.53.5 44 4.54.5 55
Follow up Duration (Years) Follow up Duration (Years)
TransplantTransplant
ResectionResection
AblationAblationTACETACE
11
0.80.8
0.60.6
0.40.4
0.20.2
00
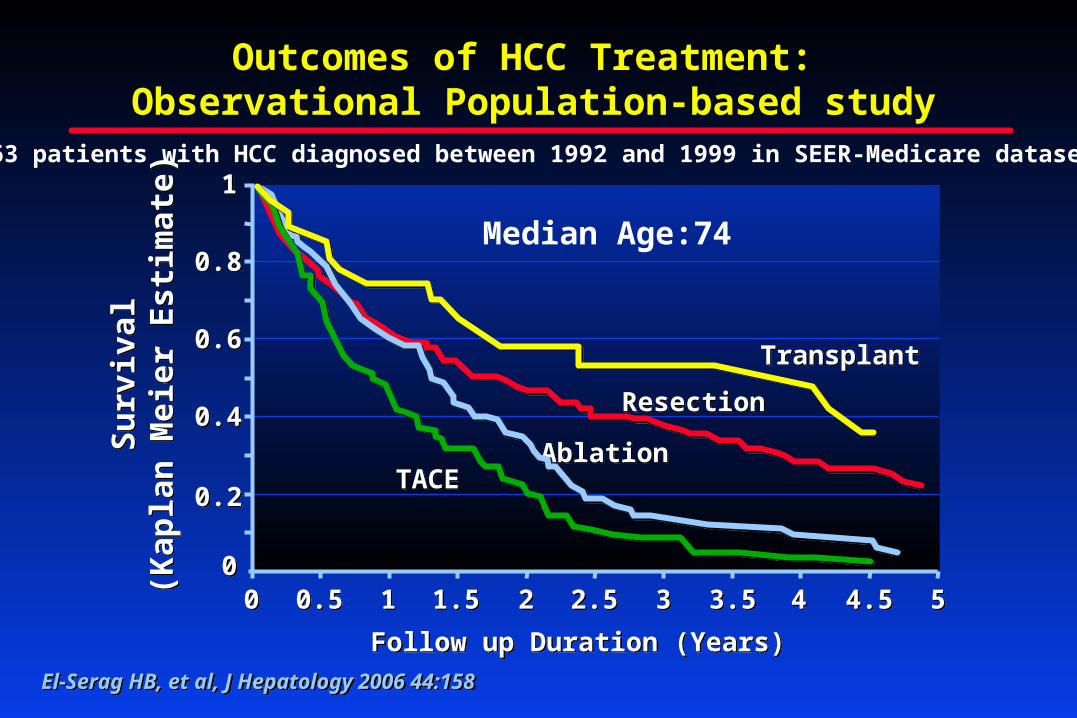
Outcomes of HCC Treatment: Observational Population-based study
El-Serag HB, et al, J Hepatology 2006 44:158El-Serag HB, et al, J Hepatology 2006 44:158
2,963 patients with HCC diagnosed between 1992 and 1999 in SEER-Medicare datasets
Median Age:74
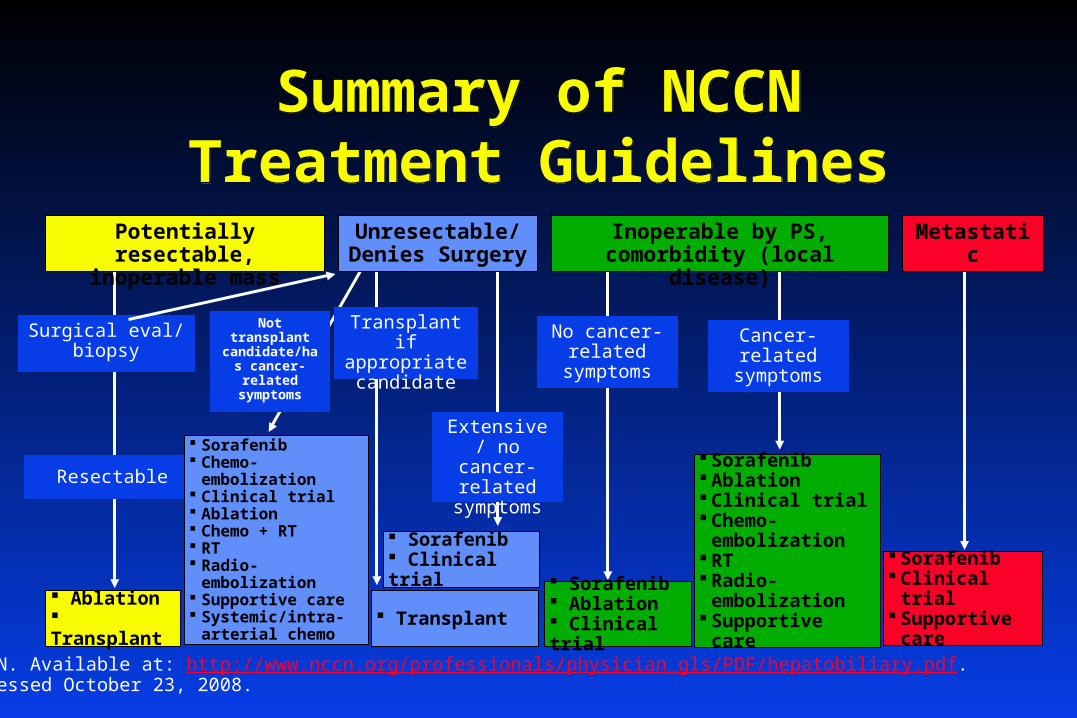
Not transplant candidate/has cancer-related
symptoms
Summary of NCCN Treatment Guidelines
Summary of NCCN Treatment Guidelines
Surgical eval/ biopsy
Resectable
Ablation Transplant
Transplant
Sorafenib Chemo-embolization Clinical trial Ablation Chemo + RT RT Radio-embolization Supportive care Systemic/intra-
arterial chemo
Transplant if appropriate candidate
Sorafenib Clinical trial
No cancer-related
symptoms
Sorafenib Ablation Clinical trial
Sorafenib Ablation Clinical trial Chemo-
embolization RT Radio-
embolization Supportive care
Sorafenib Clinical trial Supportive
care
Cancer-related
symptoms
NCCN. Available at: http://www.nccn.org/professionals/physician_gls/PDF/hepatobiliary.pdf. Accessed October 23, 2008.
Potentially resectable, inoperable mass
Unresectable/ Denies Surgery
Inoperable by PS, comorbidity (local disease) Metastatic
Extensive/ no cancer-
related symptoms
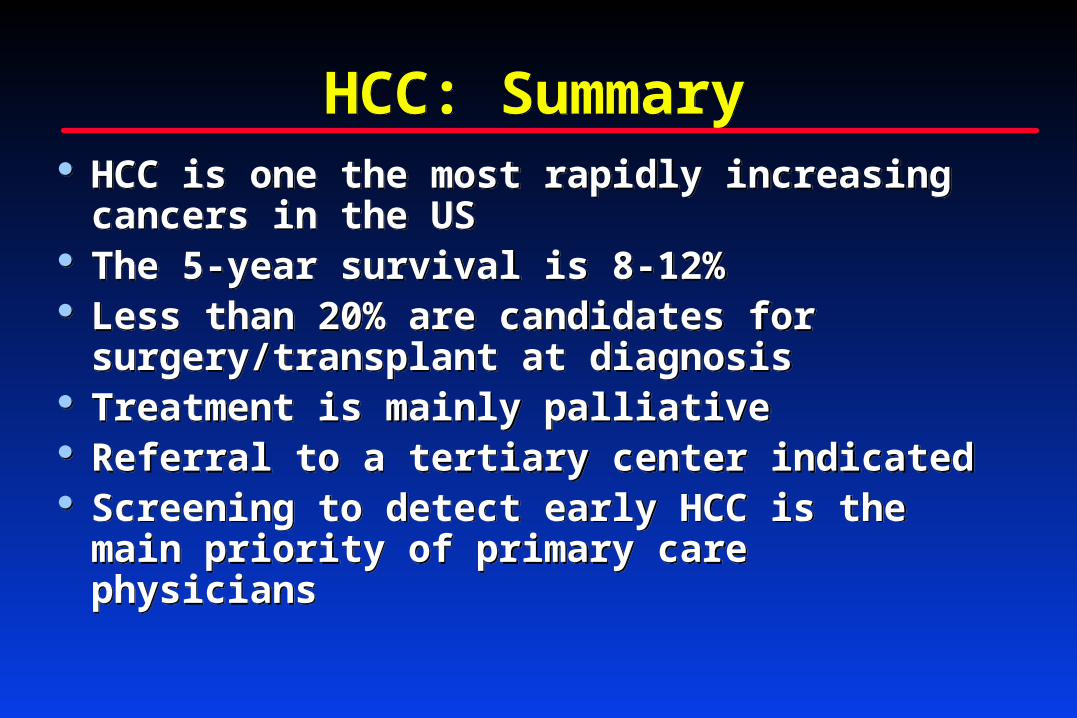
HCC: SummaryHCC: Summary HCC is one the most rapidly increasing
cancers in the US The 5-year survival is 8-12% Less than 20% are candidates for
surgery/transplant at diagnosis Treatment is mainly palliative Referral to a tertiary center indicated Screening to detect early HCC is the main
priority of primary care physicians
HCC is one the most rapidly increasing cancers in the US
The 5-year survival is 8-12% Less than 20% are candidates for
surgery/transplant at diagnosis Treatment is mainly palliative Referral to a tertiary center indicated Screening to detect early HCC is the main
priority of primary care physicians
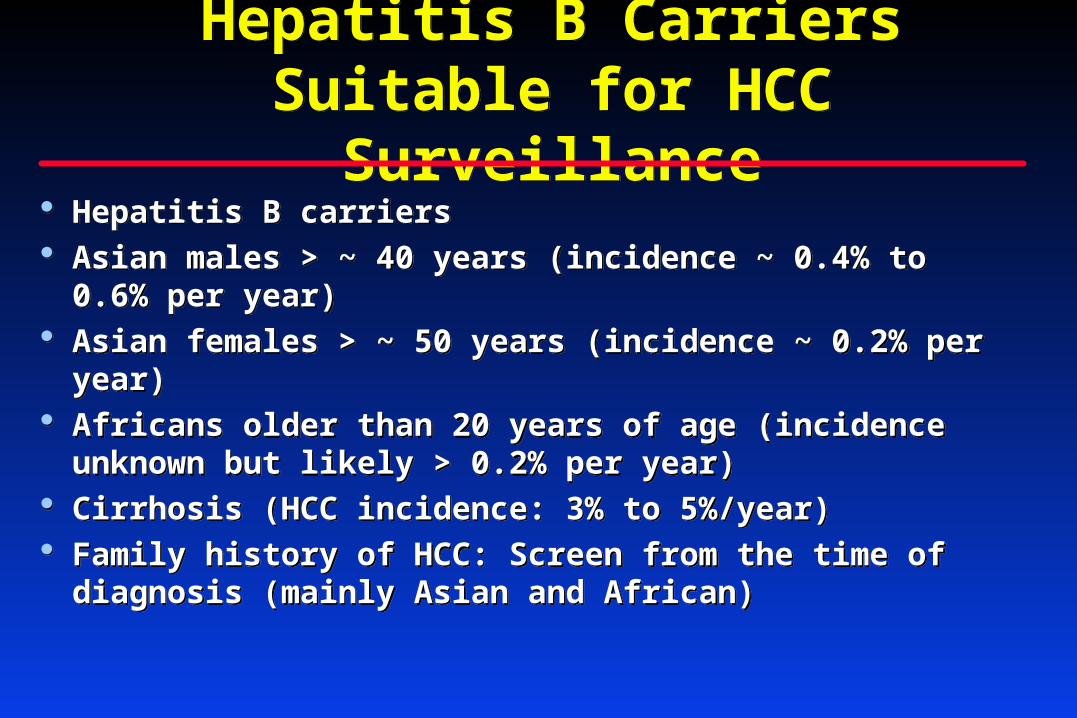
Hepatitis B Carriers Suitable for HCC Surveillance
Hepatitis B Carriers Suitable for HCC Surveillance
Hepatitis B carriers Asian males > ~ 40 years (incidence ~ 0.4% to 0.6% per
year) Asian females > ~ 50 years (incidence ~ 0.2% per year) Africans older than 20 years of age (incidence unknown
but likely > 0.2% per year) Cirrhosis (HCC incidence: 3% to 5%/year) Family history of HCC: Screen from the time of
diagnosis (mainly Asian and African)

AASLD and NCCN Surveillance Guidelines
AASLD and NCCN Surveillance Guidelines
AASLD Guidelines Surveillance recommended in
at-risk groups
Specific hepatitis B carriers
Nonhepatitis B cirrhosis
US preferred surveillance tool
AFP alone should not be used unless US unavailable
Patients should be screened at - 6 to 12-month intervals
AASLD Guidelines Surveillance recommended in
at-risk groups
Specific hepatitis B carriers
Nonhepatitis B cirrhosis
US preferred surveillance tool
AFP alone should not be used unless US unavailable
Patients should be screened at - 6 to 12-month intervals
NCCN Guidelines US and AFP, AP, and albumin
for surveillance in high-risk patients
Every 3-6 months
Continue screening every 3 months in those with high AFP but no evidence on imaging
NCCN Guidelines US and AFP, AP, and albumin
for surveillance in high-risk patients
Every 3-6 months
Continue screening every 3 months in those with high AFP but no evidence on imaging
NCCN, National Comprehensive Cancer
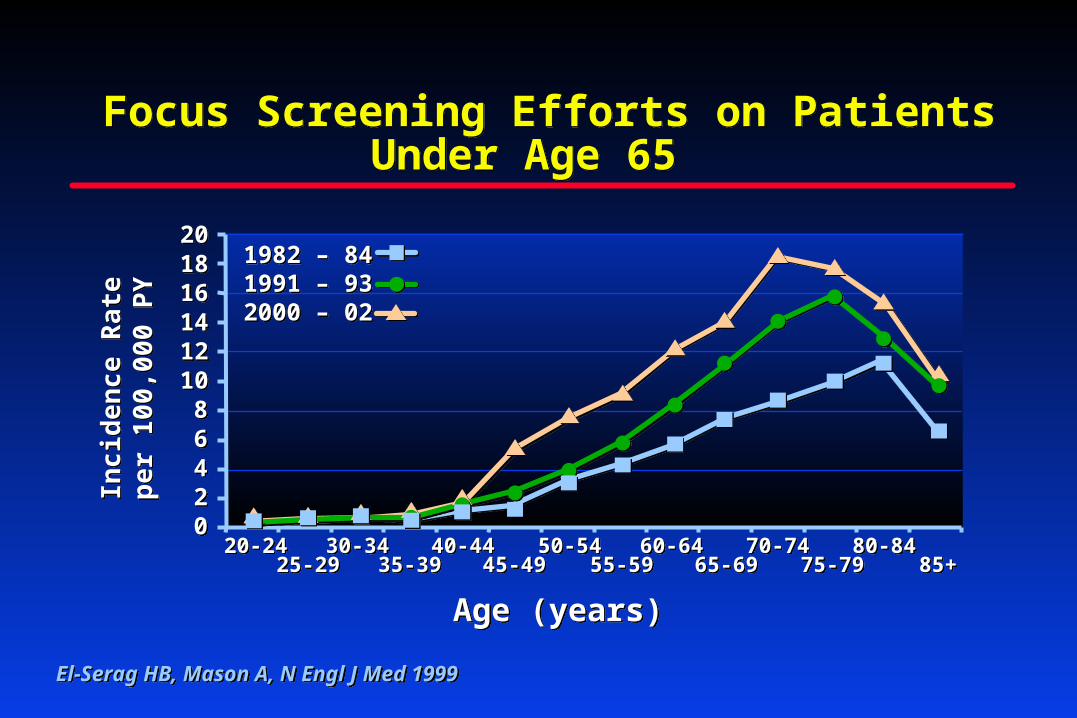
Focus Screening Efforts on Patients Under Age 65
Focus Screening Efforts on Patients Under Age 65
Inci
den
ce
Rat
ep
er
10
0,0
00
PY
Inci
den
ce
Rat
ep
er
10
0,0
00
PY
Age (years)Age (years)
20-2420-24 30-3430-3435-3935-39
40-4440-4445-4945-49
50-5450-5455-5955-5925-2925-29
0022446688
101012121414161618182020
1982 – 841991 – 932000 – 02
1982 – 841991 – 932000 – 02
60-6460-6465-6965-69
70-7470-7475-7975-79
80-8480-8485+85+
El-Serag HB, Mason A, N Engl J Med 1999El-Serag HB, Mason A, N Engl J Med 1999
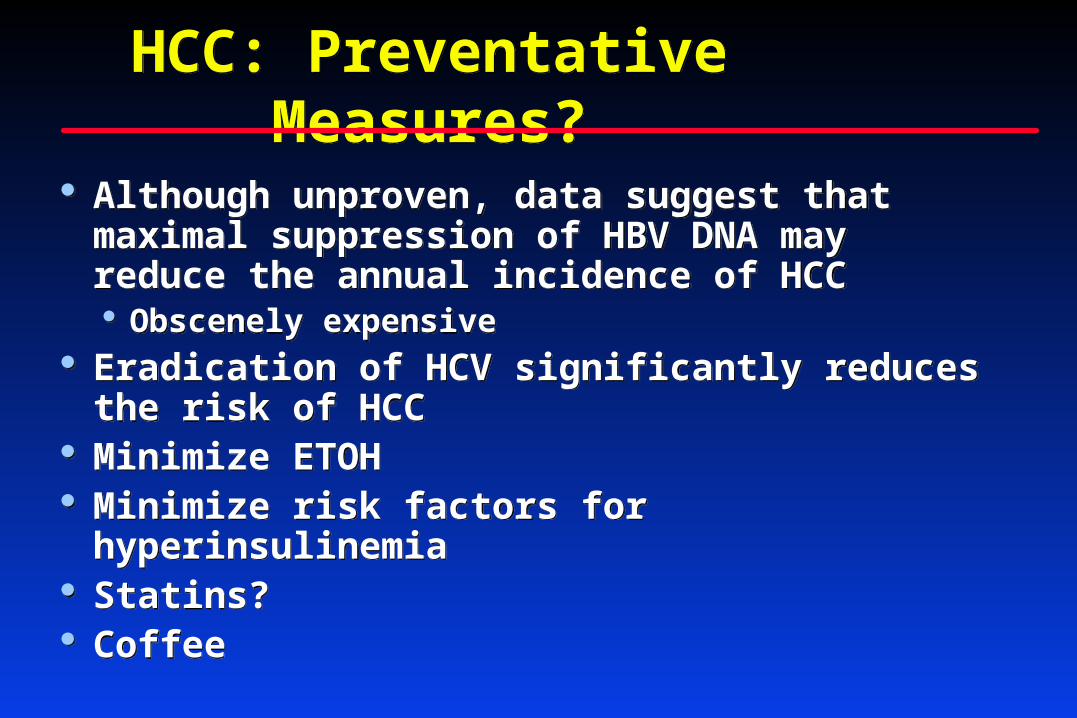
HCC: Preventative Measures?HCC: Preventative Measures?
Although unproven, data suggest that maximal suppression of HBV DNA may reduce the annual incidence of HCC Obscenely expensive
Eradication of HCV significantly reduces the risk of HCC
Minimize ETOH Minimize risk factors for hyperinsulinemia Statins? Coffee
Although unproven, data suggest that maximal suppression of HBV DNA may reduce the annual incidence of HCC Obscenely expensive
Eradication of HCV significantly reduces the risk of HCC
Minimize ETOH Minimize risk factors for hyperinsulinemia Statins? Coffee
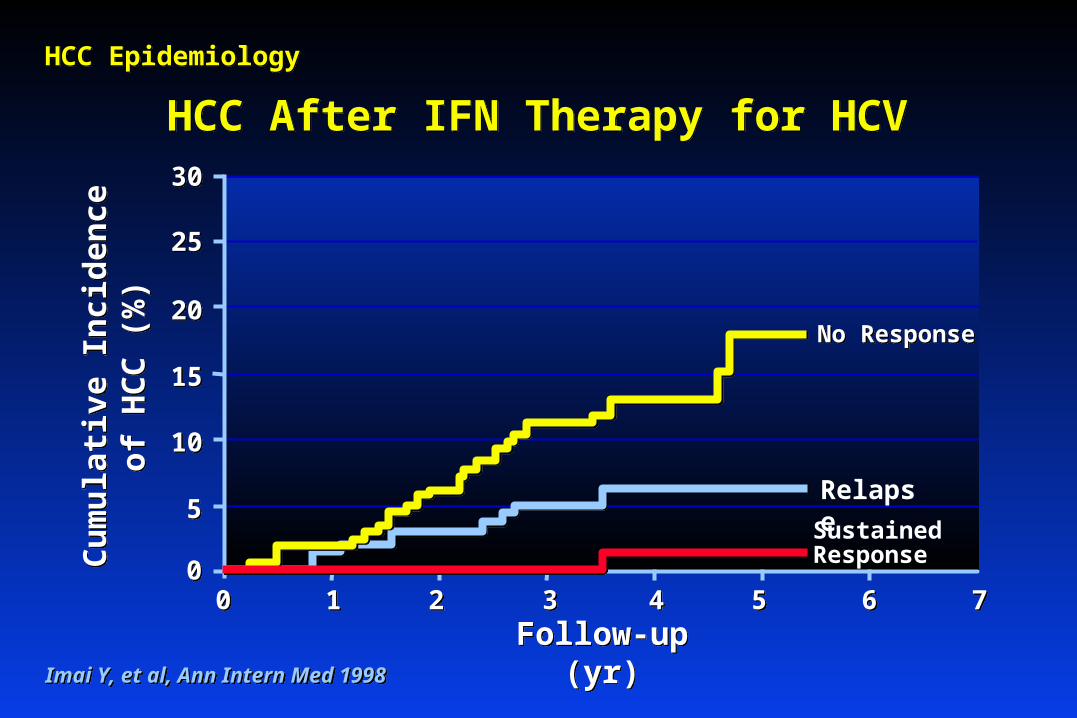
HCC After IFN Therapy for HCVHCC After IFN Therapy for HCV
Follow-up (yr)Follow-up (yr)
Cu
mu
lati
ve I
nci
den
ceo
f H
CC
(%
)C
um
ula
tive
In
cid
ence
of
HC
C (
%)
Imai Y, et al, Ann Intern Med 1998Imai Y, et al, Ann Intern Med 1998
00 11 22 33 44 55 66 77
No ResponseNo Response
Relapse55
1010
1515
2020
2525
3030
00
SustainedResponse
HCC EpidemiologyHCC Epidemiology
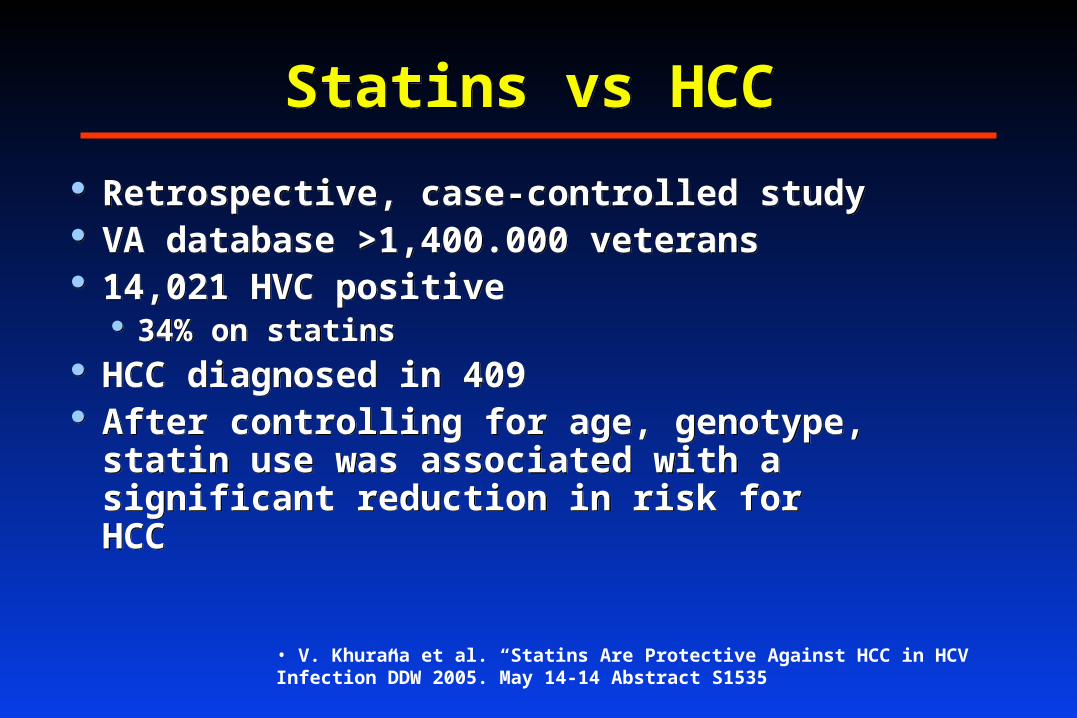
Statins vs HCCStatins vs HCC
Retrospective, case-controlled study VA database >1,400.000 veterans 14,021 HVC positive
34% on statins HCC diagnosed in 409 After controlling for age, genotype,
statin use was associated with a significant reduction in risk for HCC
Retrospective, case-controlled study VA database >1,400.000 veterans 14,021 HVC positive
34% on statins HCC diagnosed in 409 After controlling for age, genotype,
statin use was associated with a significant reduction in risk for HCC
• V. Khurana et al. “Statins Are Protective Against HCC in HCV Infection”DDW 2005. May 14-14 Abstract S1535
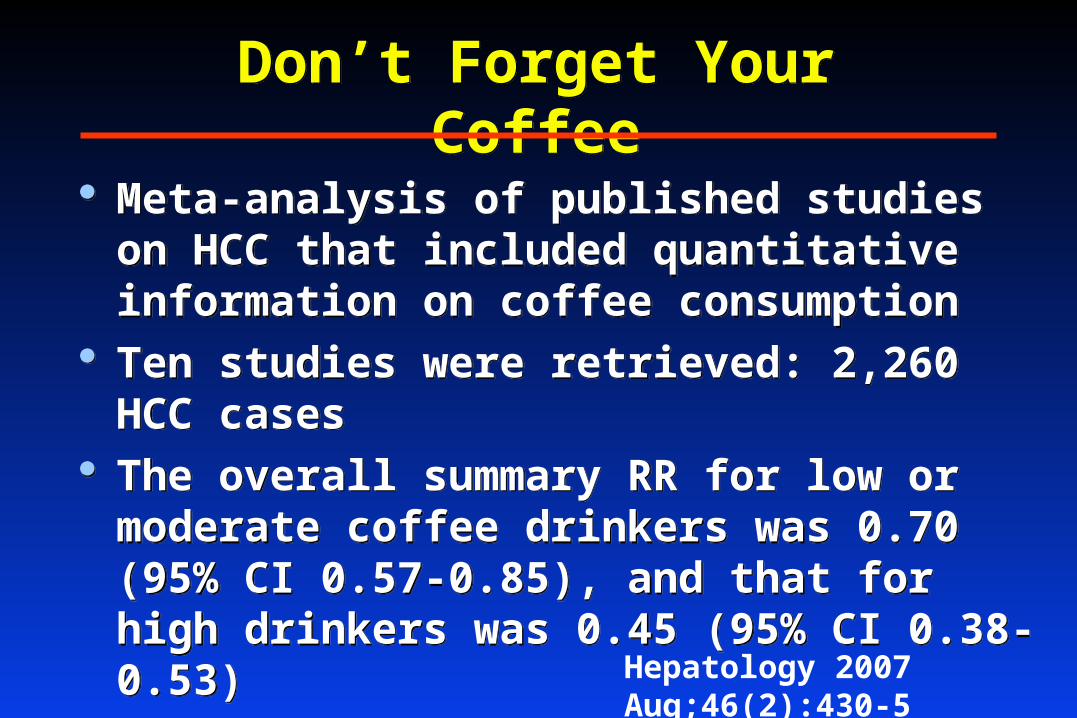
Don’t Forget Your CoffeeDon’t Forget Your Coffee
Meta-analysis of published studies on HCC that included quantitative information on coffee consumption
Ten studies were retrieved: 2,260 HCC cases The overall summary RR for low or moderate
coffee drinkers was 0.70 (95% CI 0.57-0.85), and that for high drinkers was 0.45 (95% CI 0.38-0.53)
Meta-analysis of published studies on HCC that included quantitative information on coffee consumption
Ten studies were retrieved: 2,260 HCC cases The overall summary RR for low or moderate
coffee drinkers was 0.70 (95% CI 0.57-0.85), and that for high drinkers was 0.45 (95% CI 0.38-0.53)
Hepatology 2007 Aug;46(2):430-5