heritage high school 2012-2013 annual education · pdf filewe are pleased to present you with...
TRANSCRIPT
August 14, 2013
Dear Parents and Community Members:
We are pleased to present you with the Annual Education Report (AER) which provides key information on the 2012-2013 educational progress for Heritage High School. The AER addresses the complex reporting information required by federal and state laws. The school’s report contains information about student assessment, Adequate Yearly Progress (AYP) and teacher quality. If you have any questions about the AER, please contact Michael Newman (Principal) for assistance.
The AER is available for you to review electronically by visiting the following web site www.stcs.org/annual-report or you may review a copy at the school’s main office.
The state has identified some schools with the status of Reward, Focus or Priority. A Reward school is one that is outperforming other schools in achievement, growth, or is performing better than other schools with a similar student population. A Focus school is one that has a large achievement gap between the top and bottom 30% of its students. A Priority school is one whose achievement and growth is in the lowest 5% of all schools in the state. Our school has not been given any of these labels. The challenges Heritage High School faces is to continue to provide the rich course offerings while addressing the academic needs of all of the students. We have implemented a Response to Intervention (RTI) and summer credit recovery programs to help students that need academic assistance. In addition, our International Baccalaureate Middle Years Program addresses a broad range of learning opportunities while providing students with a greater awareness of their own learning style through the learner profile.
State law requires that we also report the following additional information:
Process for assigning pupils
School attendance boundaries are set by the Board of Education. Out-of-district students apply through Schools of Choice.
Heritage High School
2012-2013
ANNUAL EDUCATION REPORT

Status of the 3-5 year school improvement plan
Heritage High School finished a five year cycle in the 2012-13 school year and our school improvement team has revised the plan for the next cycle. The new plan contains goals and strategies that align with the district’s goals and objectives. In addition we are placing an increased emphasis on our at-risk students and trying to close the achievement gap.
The school improvement team consists of staff, administration, a student group, and parent/s. There are monthly meetings and the team is always looking for ways to improve our instructional program.
Description of specialized school
Heritage High School is an International Baccalaureate High School. In addition we offer Advanced Placement courses and an extensive electives program that includes strings, band, choir, drama, art, industrial arts, business, world languages, physical education, and special services. We are a full International Baccalaureate World School with both the Diploma Program and the Middle Years Program.
Core Curriculum
A copy of the core curriculum may be obtained from the curriculum office at the Saginaw Township Community Schools Administration Center. The core curriculum is fully implemented. There are no variances from the state's model. Listed below are achievement results for the 9th grade MEAP and 11th grade MME tests taken annually by Heritage High School students.
MEAP Scores
9th Grade Social Studies Performance Levels
YEAR
No. of Students Assessed
4 – Not
Proficient
3 – Partially
Proficient
2 – Proficient
1 -Advanced
Levels 1 & 2
2013 456 36.4% 39% 21.3% 3.3% 24.6% 2011 459 24% 49% 24% <5% 27% 2010 406 19% 44.6% 34.5% <5% 36.5% 2009 471 27.4% 41.2% 27% <5% 31.4%
Michigan Merit Exam 11th Grade Reading Performance Levels
YEAR
No. of Students Assessed
4 – Not
Proficient
3 – Partially
Proficient
2 – Proficient
1 -Advanced
Levels 1 & 2
2013 304 11% 31% 39% 19% 58%

2012 384 9% 26% 51% 14% 65% 2011 381 7.6% 26.5% 52.8% 13.1% 65.9% 2010 365 7.4% 28.8% 48.5% 15.3% 63.8%
Michigan Merit Exam 11th Grade Writing Performance Levels
YEAR
No. of Students Assessed
4 – Not
Proficient
3 – Partially
Proficient
2 – Proficient
1 -Advanced
Levels 1 & 2
2013 301 5% 41% 48% 6% 54% 2012 385 5% 39% 49% 7% 56% 2011 381 <5% 43% 45.4% 7.6% 53% 2010 365 <5% 46.2% 43.4% 5.7% 49.2%
11th Grade Math Performance Levels
YEAR
No. of Students Assessed
4 – Not
Proficient
3 – Partially
Proficient
2 – Proficient
1 -Advanced
Levels 1 & 2
2013 302 23% 46% 22% 9% 31% 2012 383 31% 37% 26% 7% 33% 2011 380 29.7% 40.8% 22.6% 6.8% 29.5% 2010 365 35.3% 37% 20% 7.7% 27.7%
11th Grade Science Performance Levels
YEAR
No. of Students Assessed
4 – Not
Proficient
3 – Partially
Proficient
2 – Proficient
1 -Advanced
Levels 1 & 2
2013 302 35% 35% 18% 12% 29% 2012 383 37% 34% 21% 9% 29% 2011 381 34.4% 38.1% 17.5% 10% 27.6% 2010 366 39.6% 29.5% 22.1% 8.7% 30.9%
11th Grade Social Studies Performance Levels
YEAR
No. of Students Assessed
4 – Not
Proficient
3 – Partially
Proficient
2 – Proficient
1 -Advanced
Levels 1 & 2
2013 305 7% 54% 26% 13% 40% 2012 383 16% 36% 36% 12% 48% 2011 380 8.7% 39.7% 38.7% 12.9% 51.6% 2010 365 9.3% 45.2% 33.2% 12.3% 45.5%

Percentage of students represented by parents at conferences
Our fall conference attendance was 39% and 13% for the spring conferences. Skyward Family and Student Access allow parents to monitor their student’s academic progress, attendance, and other relevant information.
Postsecondary enrollments (dual enrollments)
26 Dual Enrollment Students
College equivalent courses offered
AP Calculus AB
AP Calculus BC
IB Math HL Year 2
IB World Literature Year 2
AP English Language
AP English Literature
AP Biology
IB Biology Year 2
AP Chemistry
AP Physics B
AP U.S. History
AP European History
AP US Government and Politics
IB History of Americas Year 2
AP French Language
AP Spanish Language
Students enrolled in college equivalent courses
College Equivalent Courses # Of Students Enrolled
% of Students
2012-2013 AP Calculus AB 27 1.7 %

AP Calculus BC 18 1.2 % IB World Literature Year 2 41 2.6 % AP English Language 59 3.8 % AP English Literature 22 1.4 % AP Biology 9 0.5 % IB Biology Year 2 6 0.3 % AP Chemistry 16 1.0 % AP Physics B 18 1.1 % AP U.S. History 41 2.6 % AP European History 36 2.3 % AP US Government and Politics 6 0.3 % IB History of Americas Year 2 9 0.5 % AP French Language 0 N/A AP Spanish Language 24 1.5 %
Students receiving college credit
Not Available at this time. Heritage High School offers a rigorous academic program as well as variety of extracurricular opportunities. We are an International Baccalaureate High School and also offer the International Baccalaureate Middle Years Program in conjunction with White Pine Middle School. We continue to encourage our students to take advantage of the many opportunities that exist at our outstanding high school and appreciate the support we receive from parents and the community. We look forward to another successful year at Heritage High School. Sincerely, Michael Newman, Principal Heritage High School

08/19/2013
Annual Education ReportHeritage High School
Michigan Educational Assessment Program (MEAP)
Subject Grade TestingGroup
School Year % StudentsTested
State %StudentsProficient
District %StudentsProficient
School %StudentsProficient
% Advanced(Level 1)
% Proficient(Level 2)
% PartiallyProficient(Level 3)
% NotProficient(Level 4)
No Data to Display
Page 1 of 28

08/19/2013
Annual Education ReportHeritage High School
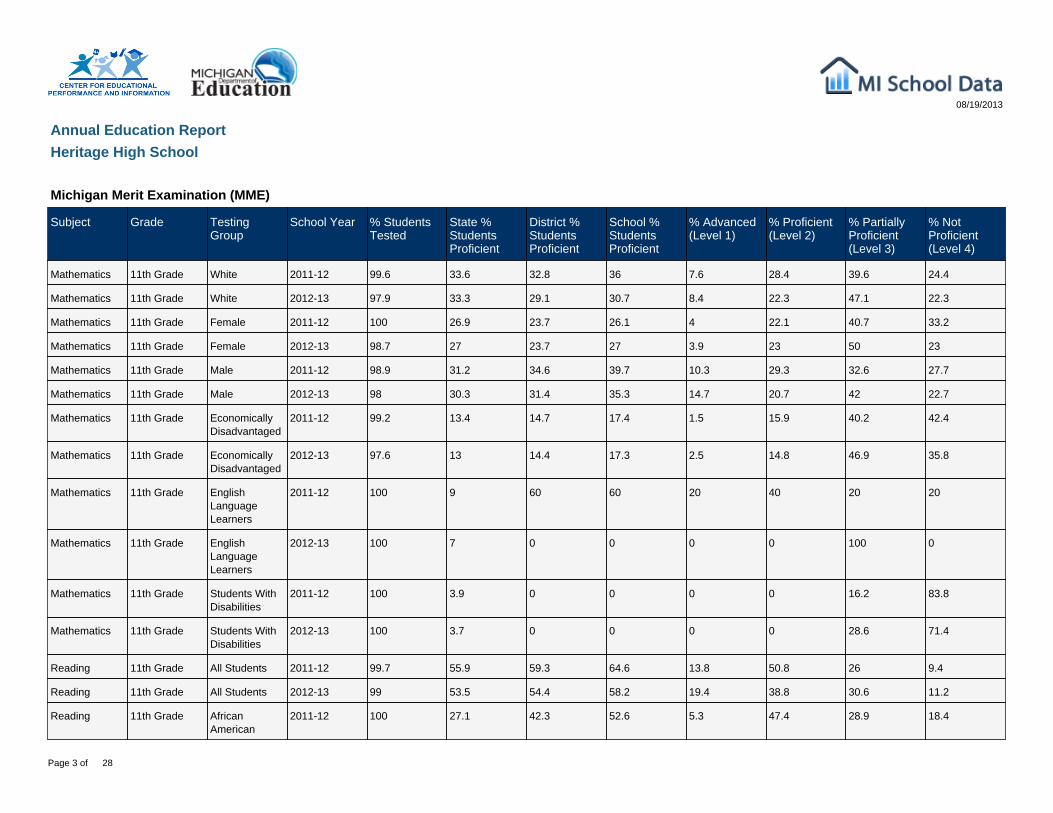
Michigan Merit Examination (MME)
Subject Grade TestingGroup
School Year % StudentsTested
State %StudentsProficient
District %StudentsProficient
School %StudentsProficient
% Advanced(Level 1)
% Proficient(Level 2)
% PartiallyProficient(Level 3)
% NotProficient(Level 4)
Mathematics 11th Grade All Students 2011-12 99.5 29.1 29 32.6 7 25.6 36.8 30.5
Mathematics 11th Grade All Students 2012-13 98.4 28.6 27.6 31.1 9.3 21.9 46 22.8
Mathematics 11th Grade AfricanAmerican
2011-12 97.4 6.1 11.8 16.2 0 16.2 32.4 51.4
Mathematics 11th Grade AfricanAmerican
2012-13 100 5.7 17.6 27.3 4.5 22.7 36.4 36.4
Mathematics 11th Grade AmericanIndian
2011-12 100 13.8 50 50 0 50 0 50
Mathematics 11th Grade Asian 2011-12 100 60.2 80 80 33.3 46.7 6.7 13.3
Mathematics 11th Grade Asian 2012-13 100 58.8 69.2 69.2 38.5 30.8 30.8 0
Mathematics 11th Grade Hispanic of AnyRace
2011-12 100 15.9 12.2 14.3 2.4 11.9 35.7 50
Mathematics 11th Grade Hispanic of AnyRace
2012-13 100 15.3 15.6 22.7 9.1 13.6 50 27.3
Mathematics 11th Grade NativeHawaiian orOther PacificIslander
2011-12 100 30.4 0 0 0 0 0 100
Mathematics 11th Grade NativeHawaiian orOther PacificIslander
2012-13 100 28.4 0 0 0 0 0 100
Mathematics 11th Grade Two or MoreRaces
2011-12 100 25.4 8.3 9.1 0 9.1 36.4 54.5
Mathematics 11th Grade Two or MoreRaces
2012-13 100 23.4 14.3 16.7 0 16.7 66.7 16.7
Page 2 of 28
08/19/2013
Annual Education ReportHeritage High School
Michigan Merit Examination (MME)
Subject Grade TestingGroup
School Year % StudentsTested
State %StudentsProficient
District %StudentsProficient
School %StudentsProficient
% Advanced(Level 1)
% Proficient(Level 2)
% PartiallyProficient(Level 3)
% NotProficient(Level 4)
Mathematics 11th Grade White 2011-12 99.6 33.6 32.8 36 7.6 28.4 39.6 24.4
Mathematics 11th Grade White 2012-13 97.9 33.3 29.1 30.7 8.4 22.3 47.1 22.3
Mathematics 11th Grade Female 2011-12 100 26.9 23.7 26.1 4 22.1 40.7 33.2
Mathematics 11th Grade Female 2012-13 98.7 27 23.7 27 3.9 23 50 23
Mathematics 11th Grade Male 2011-12 98.9 31.2 34.6 39.7 10.3 29.3 32.6 27.7
Mathematics 11th Grade Male 2012-13 98 30.3 31.4 35.3 14.7 20.7 42 22.7
Mathematics 11th Grade EconomicallyDisadvantaged
2011-12 99.2 13.4 14.7 17.4 1.5 15.9 40.2 42.4
Mathematics 11th Grade EconomicallyDisadvantaged
2012-13 97.6 13 14.4 17.3 2.5 14.8 46.9 35.8
Mathematics 11th Grade EnglishLanguageLearners
2011-12 100 9 60 60 20 40 20 20
Mathematics 11th Grade EnglishLanguageLearners
2012-13 100 7 0 0 0 0 100 0
Mathematics 11th Grade Students WithDisabilities
2011-12 100 3.9 0 0 0 0 16.2 83.8
Mathematics 11th Grade Students WithDisabilities
2012-13 100 3.7 0 0 0 0 28.6 71.4
Reading 11th Grade All Students 2011-12 99.7 55.9 59.3 64.6 13.8 50.8 26 9.4
Reading 11th Grade All Students 2012-13 99 53.5 54.4 58.2 19.4 38.8 30.6 11.2
Reading 11th Grade AfricanAmerican
2011-12 100 27.1 42.3 52.6 5.3 47.4 28.9 18.4
Page 3 of 28

08/19/2013
Annual Education ReportHeritage High School
Michigan Merit Examination (MME)
Subject Grade TestingGroup
School Year % StudentsTested
State %StudentsProficient
District %StudentsProficient
School %StudentsProficient
% Advanced(Level 1)
% Proficient(Level 2)
% PartiallyProficient(Level 3)
% NotProficient(Level 4)
Reading 11th Grade AfricanAmerican
2012-13 100 28.9 35.3 45.5 9.1 36.4 40.9 13.6
Reading 11th Grade AmericanIndian
2011-12 100 48.7 50 50 0 50 50 0
Reading 11th Grade Asian 2011-12 100 65.5 86.7 86.7 20 66.7 6.7 6.7
Reading 11th Grade Asian 2012-13 100 64.9 76.9 76.9 38.5 38.5 7.7 15.4
Reading 11th Grade Hispanic of AnyRace
2011-12 100 41.6 40 47.6 7.1 40.5 35.7 16.7
Reading 11th Grade Hispanic of AnyRace
2012-13 100 39.9 43.8 54.5 18.2 36.4 36.4 9.1
Reading 11th Grade NativeHawaiian orOther PacificIslander
2011-12 100 63.3 0 0 0 0 100 0
Reading 11th Grade NativeHawaiian orOther PacificIslander
2012-13 100 56.5 0 0 0 0 0 100
Reading 11th Grade Two or MoreRaces
2011-12 100 55.1 41.7 45.5 9.1 36.4 36.4 18.2
Reading 11th Grade Two or MoreRaces
2012-13 100 52.8 28.6 16.7 0 16.7 66.7 16.7
Reading 11th Grade White 2011-12 99.6 62.4 64.9 68.7 16 52.7 24.4 6.9
Reading 11th Grade White 2012-13 98.8 59.1 58.6 60 20 40 29.6 10.4
Reading 11th Grade Female 2011-12 100 60.4 66.7 70.9 12.1 58.8 20.6 8.5
Reading 11th Grade Female 2012-13 100 56 56 61 16.9 44.2 33.1 5.8Page 4 of 28

08/19/2013
Annual Education ReportHeritage High School
Michigan Merit Examination (MME)
Subject Grade TestingGroup
School Year % StudentsTested
State %StudentsProficient
District %StudentsProficient
School %StudentsProficient
% Advanced(Level 1)
% Proficient(Level 2)
% PartiallyProficient(Level 3)
% NotProficient(Level 4)
Reading 11th Grade Male 2011-12 99.5 51.4 51.4 57.8 15.7 42.2 31.9 10.3
Reading 11th Grade Male 2012-13 98 51 52.8 55.3 22 33.3 28 16.7
Reading 11th Grade EconomicallyDisadvantaged
2011-12 100 39.9 45.5 51.9 4.5 47.4 31.6 16.5
Reading 11th Grade EconomicallyDisadvantaged
2012-13 100 37.9 38.9 42.2 9.6 32.5 41 16.9
Reading 11th Grade EnglishLanguageLearners
2011-12 100 12.9 60 60 0 60 0 40
Reading 11th Grade EnglishLanguageLearners
2012-13 100 13.2 0 0 0 0 0 100
Reading 11th Grade Students WithDisabilities
2011-12 100 19.4 14.3 13.5 2.7 10.8 37.8 48.6
Reading 11th Grade Students WithDisabilities
2012-13 100 19 12.8 14.3 3.6 10.7 42.9 42.9
Science 11th Grade All Students 2011-12 99.5 25.8 26.4 29.2 8.6 20.6 34.2 36.6
Science 11th Grade All Students 2012-13 98.4 25.7 26.1 29.1 11.6 17.5 35.4 35.4
Science 11th Grade AfricanAmerican
2011-12 97.4 4.4 9.8 13.5 2.7 10.8 24.3 62.2
Science 11th Grade AfricanAmerican
2012-13 100 3.9 17.6 27.3 4.5 22.7 27.3 45.5
Science 11th Grade AmericanIndian
2011-12 100 14 50 50 0 50 0 50
Science 11th Grade Asian 2011-12 100 44.7 66.7 66.7 20 46.7 20 13.3
Science 11th Grade Asian 2012-13 100 44.7 53.8 53.8 30.8 23.1 7.7 38.5Page 5 of 28

08/19/2013
Annual Education ReportHeritage High School
Michigan Merit Examination (MME)
Subject Grade TestingGroup
School Year % StudentsTested
State %StudentsProficient
District %StudentsProficient
School %StudentsProficient
% Advanced(Level 1)
% Proficient(Level 2)
% PartiallyProficient(Level 3)
% NotProficient(Level 4)
Science 11th Grade Hispanic of AnyRace
2011-12 100 12.8 10.2 11.9 0 11.9 31 57.1
Science 11th Grade Hispanic of AnyRace
2012-13 100 12.2 18.8 22.7 13.6 9.1 31.8 45.5
Science 11th Grade NativeHawaiian orOther PacificIslander
2011-12 100 23.5 0 0 0 0 0 100
Science 11th Grade NativeHawaiian orOther PacificIslander
2012-13 100 25.9 0 0 0 0 0 100
Science 11th Grade Two or MoreRaces
2011-12 100 23.3 8.3 9.1 9.1 0 27.3 63.6
Science 11th Grade Two or MoreRaces
2012-13 100 21.1 0 0 0 0 33.3 66.7
Science 11th Grade White 2011-12 99.6 30.4 30.5 32.7 10.2 22.5 37.5 29.8
Science 11th Grade White 2012-13 97.9 30.4 27.9 29.4 11.3 18.1 38.2 32.4
Science 11th Grade Female 2011-12 100 22.8 21 22.6 6 16.6 38.7 38.7
Science 11th Grade Female 2012-13 98.7 22.5 22.5 25.7 6.6 19.1 37.5 36.8
Science 11th Grade Male 2011-12 98.9 28.7 32.2 36.4 11.4 25 29.3 34.2
Science 11th Grade Male 2012-13 98 28.9 29.7 32.7 16.7 16 33.3 34
Science 11th Grade EconomicallyDisadvantaged
2011-12 99.2 12 18.4 21.2 4.5 16.7 29.5 49.2
Science 11th Grade EconomicallyDisadvantaged
2012-13 97.6 11.5 15.3 18.5 6.2 12.3 29.6 51.9
Page 6 of 28

08/19/2013
Annual Education ReportHeritage High School
Michigan Merit Examination (MME)
Subject Grade TestingGroup
School Year % StudentsTested
State %StudentsProficient
District %StudentsProficient
School %StudentsProficient
% Advanced(Level 1)
% Proficient(Level 2)
% PartiallyProficient(Level 3)
% NotProficient(Level 4)
Science 11th Grade EnglishLanguageLearners
2011-12 100 2.5 40 40 0 40 20 40
Science 11th Grade EnglishLanguageLearners
2012-13 100 2.6 0 0 0 0 0 100
Science 11th Grade Students WithDisabilities
2011-12 100 5.5 4.8 2.7 0 2.7 5.4 91.9
Science 11th Grade Students WithDisabilities
2012-13 100 5.1 0 0 0 0 21.4 78.6
Page 7 of 28
08/19/2013
Annual Education ReportHeritage High School
Michigan Educational Assessment Program Access (MEAP - Access)
Subject Grade Testing Group School Year % StudentsTested
State %StudentsProficient
District %StudentsProficient
School %StudentsProficient
% Exceeded % Met %wProgressing
No Data to Display
Page 8 of 28
08/19/2013
Annual Education ReportHeritage High School
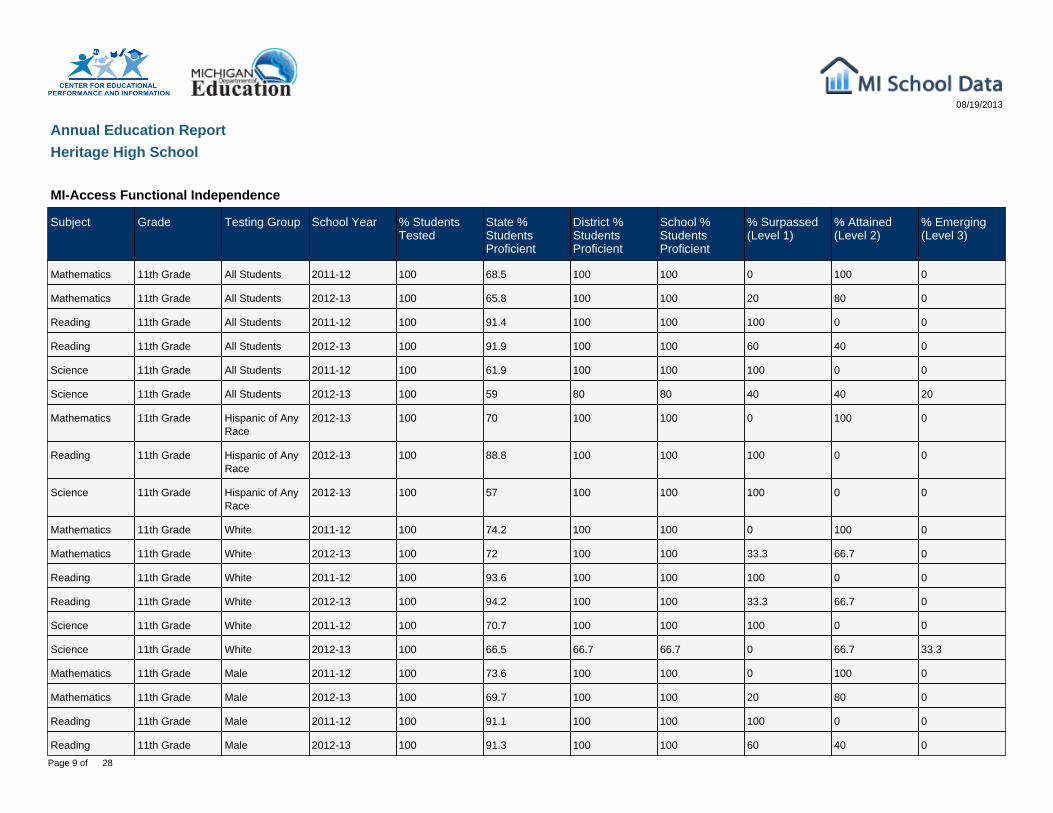
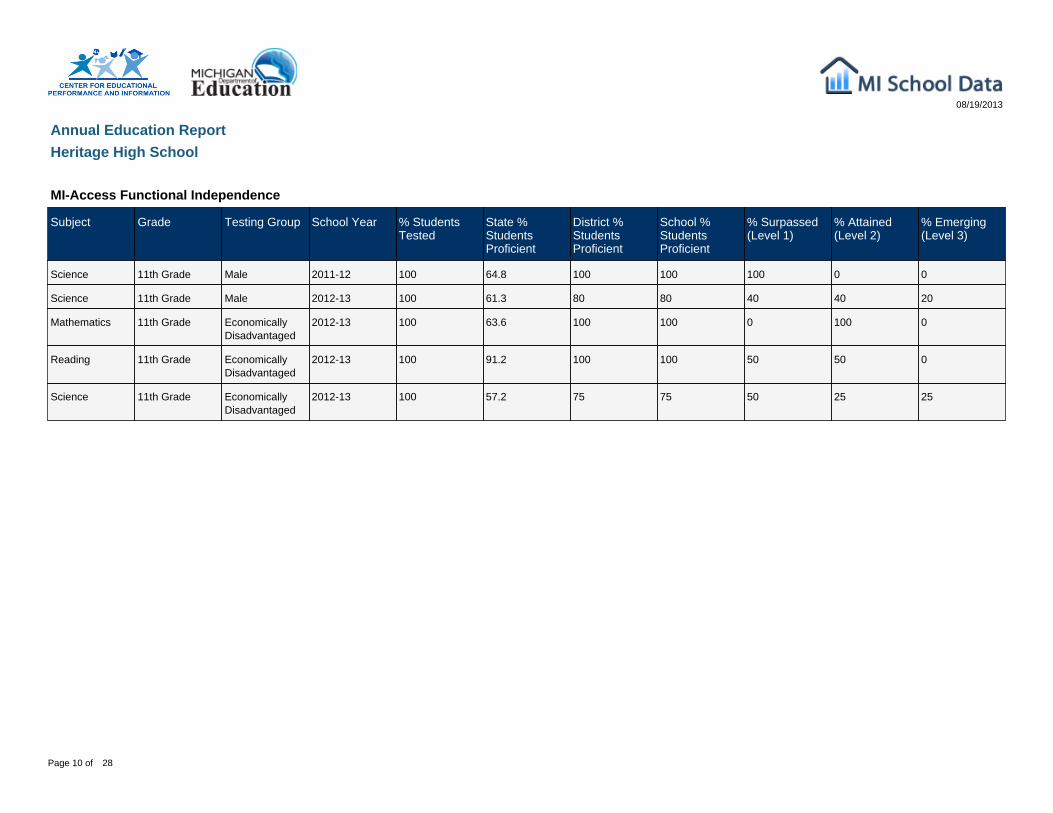
MI-Access Functional Independence
Subject Grade Testing Group School Year % StudentsTested
State %StudentsProficient
District %StudentsProficient
School %StudentsProficient
% Surpassed(Level 1)
% Attained(Level 2)
% Emerging(Level 3)
Mathematics 11th Grade All Students 2011-12 100 68.5 100 100 0 100 0
Mathematics 11th Grade All Students 2012-13 100 65.8 100 100 20 80 0
Reading 11th Grade All Students 2011-12 100 91.4 100 100 100 0 0
Reading 11th Grade All Students 2012-13 100 91.9 100 100 60 40 0
Science 11th Grade All Students 2011-12 100 61.9 100 100 100 0 0
Science 11th Grade All Students 2012-13 100 59 80 80 40 40 20
Mathematics 11th Grade Hispanic of AnyRace
2012-13 100 70 100 100 0 100 0
Reading 11th Grade Hispanic of AnyRace
2012-13 100 88.8 100 100 100 0 0
Science 11th Grade Hispanic of AnyRace
2012-13 100 57 100 100 100 0 0
Mathematics 11th Grade White 2011-12 100 74.2 100 100 0 100 0
Mathematics 11th Grade White 2012-13 100 72 100 100 33.3 66.7 0
Reading 11th Grade White 2011-12 100 93.6 100 100 100 0 0
Reading 11th Grade White 2012-13 100 94.2 100 100 33.3 66.7 0
Science 11th Grade White 2011-12 100 70.7 100 100 100 0 0
Science 11th Grade White 2012-13 100 66.5 66.7 66.7 0 66.7 33.3
Mathematics 11th Grade Male 2011-12 100 73.6 100 100 0 100 0
Mathematics 11th Grade Male 2012-13 100 69.7 100 100 20 80 0
Reading 11th Grade Male 2011-12 100 91.1 100 100 100 0 0
Reading 11th Grade Male 2012-13 100 91.3 100 100 60 40 0Page 9 of 28
08/19/2013
Annual Education ReportHeritage High School
MI-Access Functional Independence
Subject Grade Testing Group School Year % StudentsTested
State %StudentsProficient
District %StudentsProficient
School %StudentsProficient
% Surpassed(Level 1)
% Attained(Level 2)
% Emerging(Level 3)
Science 11th Grade Male 2011-12 100 64.8 100 100 100 0 0
Science 11th Grade Male 2012-13 100 61.3 80 80 40 40 20
Mathematics 11th Grade EconomicallyDisadvantaged
2012-13 100 63.6 100 100 0 100 0
Reading 11th Grade EconomicallyDisadvantaged
2012-13 100 91.2 100 100 50 50 0
Science 11th Grade EconomicallyDisadvantaged
2012-13 100 57.2 75 75 50 25 25
Page 10 of 28

08/19/2013
Annual Education ReportHeritage High School
MI-Access Supported Independence
Subject Grade Testing Group School Year % StudentsTested
State %StudentsProficient
District %StudentsProficient
School %StudentsProficient
% Surpassed(Level 1)
% Attained(Level 2)
% Emerging(Level 3)
Mathematics 11th Grade All Students 2011-12 100 89.9 100 100 100 0 0
Mathematics 11th Grade All Students 2012-13 100 88.1 100 100 0 100 0
Science 11th Grade All Students 2011-12 100 83.2 100 100 66.7 33.3 0
Science 11th Grade All Students 2012-13 100 83.1 100 100 0 100 0
Mathematics 11th Grade White 2011-12 100 88.6 100 100 100 0 0
Mathematics 11th Grade White 2012-13 100 86.7 100 100 0 100 0
Science 11th Grade White 2011-12 100 81.6 100 100 66.7 33.3 0
Science 11th Grade White 2012-13 100 83.1 100 100 0 100 0
Mathematics 11th Grade Female 2011-12 100 91.8 100 100 100 0 0
Mathematics 11th Grade Female 2012-13 100 87.4 100 100 0 100 0
Science 11th Grade Female 2011-12 100 85.4 100 100 0 100 0
Science 11th Grade Female 2012-13 100 81.2 100 100 0 100 0
Mathematics 11th Grade Male 2011-12 100 88.8 100 100 100 0 0
Science 11th Grade Male 2011-12 100 82 100 100 100 0 0
Page 11 of 28

08/19/2013
Annual Education ReportHeritage High School
MI-Access Participation
Subject Grade Testing Group School Year % StudentsTested
State %StudentsProficient
District %StudentsProficient
School %StudentsProficient
% Surpassed(Level 1)
% Attained(Level 2)
% Emerging(Level 3)
No Data to Display
Page 12 of 28

08/19/2013
Annual Education ReportHeritage High School
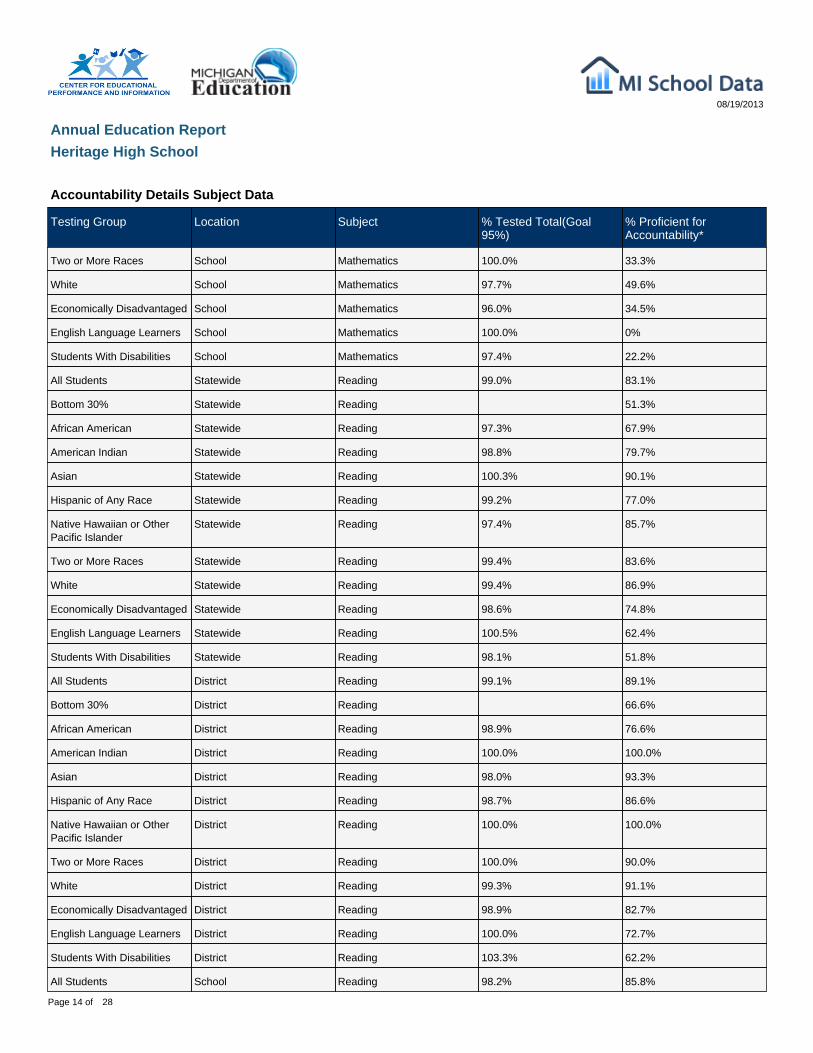
Accountability Details Subject Data
Testing Group Location Subject % Tested Total(Goal95%)
% Proficient forAccountability*
All Students Statewide Mathematics 98.7% 58.2%
Bottom 30% Statewide Mathematics 11.2%
African American Statewide Mathematics 96.9% 32.7%
American Indian Statewide Mathematics 98.5% 48.4%
Asian Statewide Mathematics 99.4% 81.5%
Hispanic of Any Race Statewide Mathematics 98.6% 45.9%
Native Hawaiian or OtherPacific Islander
Statewide Mathematics 97.4% 64.9%
Two or More Races Statewide Mathematics 99.2% 55.9%
White Statewide Mathematics 99.2% 64.4%
Economically Disadvantaged Statewide Mathematics 98.2% 43.7%
English Language Learners Statewide Mathematics 98.9% 36.9%
Students With Disabilities Statewide Mathematics 97.8% 32.5%
All Students District Mathematics 99.1% 63.5%
Bottom 30% District Mathematics 10.0%
African American District Mathematics 98.9% 43.6%
American Indian District Mathematics 100.0% 54.6%
Asian District Mathematics 100.0% 82.2%
Hispanic of Any Race District Mathematics 98.7% 49.8%
Native Hawaiian or OtherPacific Islander
District Mathematics 100.0% 33.3%
Two or More Races District Mathematics 100.0% 53.3%
White District Mathematics 99.1% 67.6%
Economically Disadvantaged District Mathematics 98.7% 50.7%
English Language Learners District Mathematics 100.0% 45.5%
Students With Disabilities District Mathematics 103.0% 42.6%
All Students School Mathematics 97.6% 49.2%
Bottom 30% School Mathematics 5.4%
African American School Mathematics 93.6% 40.7%
Asian School Mathematics 100.0% 76.9%
Hispanic of Any Race School Mathematics 100.0% 45.8%
Native Hawaiian or OtherPacific Islander
School Mathematics 100.0% 0%
Page 13 of 28
08/19/2013
Annual Education ReportHeritage High School
Accountability Details Subject Data
Testing Group Location Subject % Tested Total(Goal95%)
% Proficient forAccountability*
Two or More Races School Mathematics 100.0% 33.3%
White School Mathematics 97.7% 49.6%
Economically Disadvantaged School Mathematics 96.0% 34.5%
English Language Learners School Mathematics 100.0% 0%
Students With Disabilities School Mathematics 97.4% 22.2%
All Students Statewide Reading 99.0% 83.1%
Bottom 30% Statewide Reading 51.3%
African American Statewide Reading 97.3% 67.9%
American Indian Statewide Reading 98.8% 79.7%
Asian Statewide Reading 100.3% 90.1%
Hispanic of Any Race Statewide Reading 99.2% 77.0%
Native Hawaiian or OtherPacific Islander
Statewide Reading 97.4% 85.7%
Two or More Races Statewide Reading 99.4% 83.6%
White Statewide Reading 99.4% 86.9%
Economically Disadvantaged Statewide Reading 98.6% 74.8%
English Language Learners Statewide Reading 100.5% 62.4%
Students With Disabilities Statewide Reading 98.1% 51.8%
All Students District Reading 99.1% 89.1%
Bottom 30% District Reading 66.6%
African American District Reading 98.9% 76.6%
American Indian District Reading 100.0% 100.0%
Asian District Reading 98.0% 93.3%
Hispanic of Any Race District Reading 98.7% 86.6%
Native Hawaiian or OtherPacific Islander
District Reading 100.0% 100.0%
Two or More Races District Reading 100.0% 90.0%
White District Reading 99.3% 91.1%
Economically Disadvantaged District Reading 98.9% 82.7%
English Language Learners District Reading 100.0% 72.7%
Students With Disabilities District Reading 103.3% 62.2%
All Students School Reading 98.2% 85.8%
Page 14 of 28
08/19/2013
Annual Education ReportHeritage High School
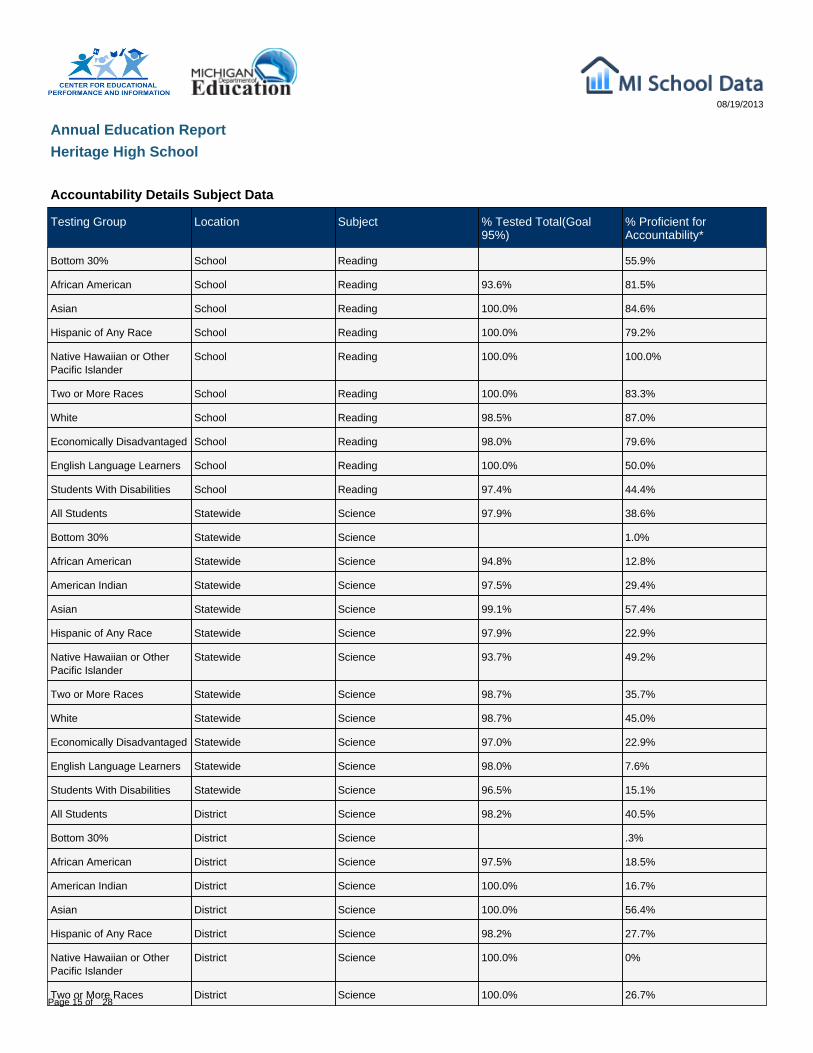
Accountability Details Subject Data
Testing Group Location Subject % Tested Total(Goal95%)
% Proficient forAccountability*
Bottom 30% School Reading 55.9%
African American School Reading 93.6% 81.5%
Asian School Reading 100.0% 84.6%
Hispanic of Any Race School Reading 100.0% 79.2%
Native Hawaiian or OtherPacific Islander
School Reading 100.0% 100.0%
Two or More Races School Reading 100.0% 83.3%
White School Reading 98.5% 87.0%
Economically Disadvantaged School Reading 98.0% 79.6%
English Language Learners School Reading 100.0% 50.0%
Students With Disabilities School Reading 97.4% 44.4%
All Students Statewide Science 97.9% 38.6%
Bottom 30% Statewide Science 1.0%
African American Statewide Science 94.8% 12.8%
American Indian Statewide Science 97.5% 29.4%
Asian Statewide Science 99.1% 57.4%
Hispanic of Any Race Statewide Science 97.9% 22.9%
Native Hawaiian or OtherPacific Islander
Statewide Science 93.7% 49.2%
Two or More Races Statewide Science 98.7% 35.7%
White Statewide Science 98.7% 45.0%
Economically Disadvantaged Statewide Science 97.0% 22.9%
English Language Learners Statewide Science 98.0% 7.6%
Students With Disabilities Statewide Science 96.5% 15.1%
All Students District Science 98.2% 40.5%
Bottom 30% District Science .3%
African American District Science 97.5% 18.5%
American Indian District Science 100.0% 16.7%
Asian District Science 100.0% 56.4%
Hispanic of Any Race District Science 98.2% 27.7%
Native Hawaiian or OtherPacific Islander
District Science 100.0% 0%
Two or More Races District Science 100.0% 26.7%Page 15 of 28

08/19/2013
Annual Education ReportHeritage High School
Accountability Details Subject Data
Testing Group Location Subject % Tested Total(Goal95%)
% Proficient forAccountability*
White District Science 98.2% 45.2%
Economically Disadvantaged District Science 97.4% 25.1%
English Language Learners District Science 100.0% 20.0%
Students With Disabilities District Science 99.3% 17.7%
All Students School Science 97.6% 51.8%
Bottom 30% School Science 1.1%
African American School Science 93.6% 37.0%
Asian School Science 100.0% 53.9%
Hispanic of Any Race School Science 100.0% 37.5%
Native Hawaiian or OtherPacific Islander
School Science 100.0% 0%
Two or More Races School Science 100.0% 16.7%
White School Science 97.7% 55.9%
Economically Disadvantaged School Science 96.0% 37.9%
English Language Learners School Science 100.0% 0%
Students With Disabilities School Science 97.4% 19.4%
All Students Statewide Social Studies 96.7% 57.5%
Bottom 30% Statewide Social Studies 8.8%
African American Statewide Social Studies 92.4% 27.9%
American Indian Statewide Social Studies 95.9% 52.3%
Asian Statewide Social Studies 99.0% 73.6%
Hispanic of Any Race Statewide Social Studies 96.1% 43.0%
Native Hawaiian or OtherPacific Islander
Statewide Social Studies 93.2% 59.7%
Two or More Races Statewide Social Studies 97.6% 53.5%
White Statewide Social Studies 98.0% 64.7%
Economically Disadvantaged Statewide Social Studies 95.1% 40.3%
English Language Learners Statewide Social Studies 96.4% 19.6%
Students With Disabilities Statewide Social Studies 91.9% 22.3%
All Students District Social Studies 97.5% 54.4%
Bottom 30% District Social Studies 0%
African American District Social Studies 96.4% 27.5%
Page 16 of 28
08/19/2013
Annual Education ReportHeritage High School
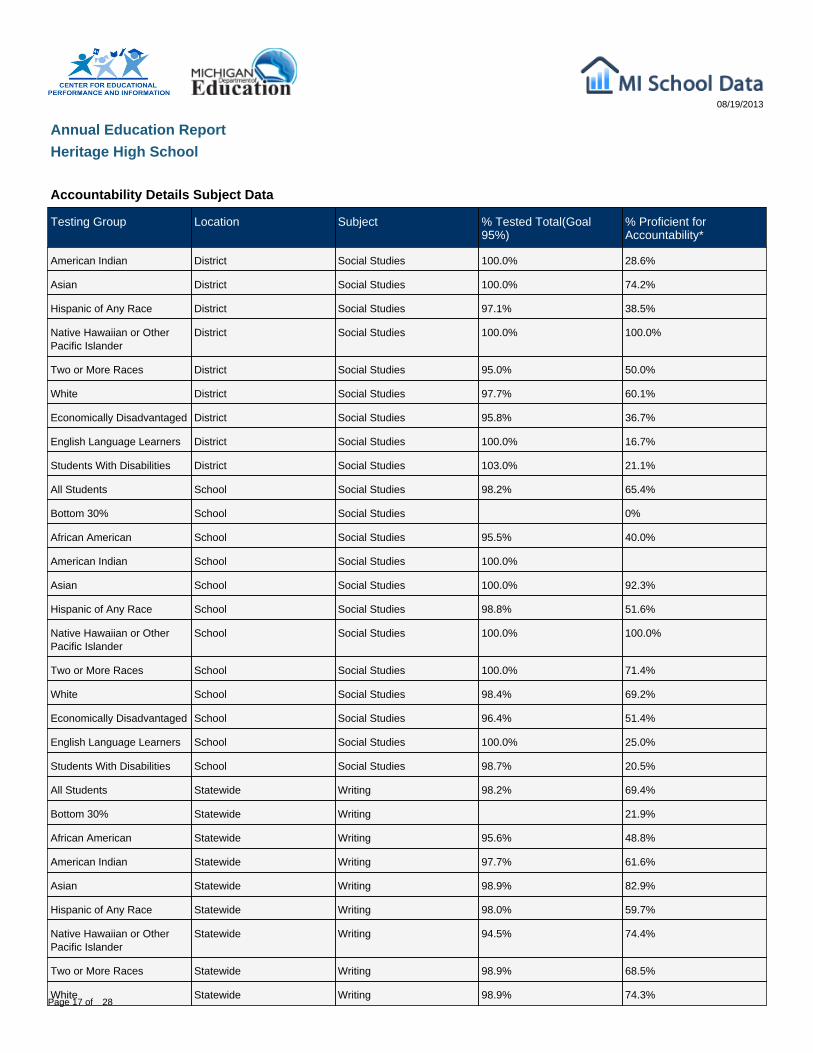
Accountability Details Subject Data
Testing Group Location Subject % Tested Total(Goal95%)
% Proficient forAccountability*
American Indian District Social Studies 100.0% 28.6%
Asian District Social Studies 100.0% 74.2%
Hispanic of Any Race District Social Studies 97.1% 38.5%
Native Hawaiian or OtherPacific Islander
District Social Studies 100.0% 100.0%
Two or More Races District Social Studies 95.0% 50.0%
White District Social Studies 97.7% 60.1%
Economically Disadvantaged District Social Studies 95.8% 36.7%
English Language Learners District Social Studies 100.0% 16.7%
Students With Disabilities District Social Studies 103.0% 21.1%
All Students School Social Studies 98.2% 65.4%
Bottom 30% School Social Studies 0%
African American School Social Studies 95.5% 40.0%
American Indian School Social Studies 100.0%
Asian School Social Studies 100.0% 92.3%
Hispanic of Any Race School Social Studies 98.8% 51.6%
Native Hawaiian or OtherPacific Islander
School Social Studies 100.0% 100.0%
Two or More Races School Social Studies 100.0% 71.4%
White School Social Studies 98.4% 69.2%
Economically Disadvantaged School Social Studies 96.4% 51.4%
English Language Learners School Social Studies 100.0% 25.0%
Students With Disabilities School Social Studies 98.7% 20.5%
All Students Statewide Writing 98.2% 69.4%
Bottom 30% Statewide Writing 21.9%
African American Statewide Writing 95.6% 48.8%
American Indian Statewide Writing 97.7% 61.6%
Asian Statewide Writing 98.9% 82.9%
Hispanic of Any Race Statewide Writing 98.0% 59.7%
Native Hawaiian or OtherPacific Islander
Statewide Writing 94.5% 74.4%
Two or More Races Statewide Writing 98.9% 68.5%
White Statewide Writing 98.9% 74.3%Page 17 of 28

08/19/2013
Annual Education ReportHeritage High School
Accountability Details Subject Data
Testing Group Location Subject % Tested Total(Goal95%)
% Proficient forAccountability*
Economically Disadvantaged Statewide Writing 97.3% 55.7%
English Language Learners Statewide Writing 97.3% 42.1%
Students With Disabilities Statewide Writing 96.6% 27.9%
All Students District Writing 98.0% 76.7%
Bottom 30% District Writing 27.2%
African American District Writing 97.3% 62.6%
American Indian District Writing 100.0% 20.0%
Asian District Writing 97.8% 82.9%
Hispanic of Any Race District Writing 97.2% 68.1%
Native Hawaiian or OtherPacific Islander
District Writing 100.0% 100.0%
Two or More Races District Writing 100.0% 58.8%
White District Writing 98.2% 80.4%
Economically Disadvantaged District Writing 97.4% 62.2%
English Language Learners District Writing 100.0% 50.0%
Students With Disabilities District Writing 98.6% 29.0%
All Students School Writing 97.3% 76.5%
Bottom 30% School Writing 25.6%
African American School Writing 93.6% 66.7%
Asian School Writing 92.9% 91.7%
Hispanic of Any Race School Writing 100.0% 70.8%
Native Hawaiian or OtherPacific Islander
School Writing 100.0% 100.0%
Two or More Races School Writing 100.0% 83.3%
White School Writing 97.7% 77.1%
Economically Disadvantaged School Writing 98.0% 62.5%
English Language Learners School Writing 100.0% 50.0%
Students With Disabilities School Writing 94.7% 14.7%
Page 18 of 28

* All data based on students enrolled for a full academic year.
08/19/2013
Annual Education ReportHeritage High School
Accountability Details Graduation Data
Testing Group Location Accountability Scorecard Completion Rate(High Schools only) (Goal 80%)
All Students Statewide 76.2%
African American Statewide 59.9%
American Indian Statewide 66.4%
Asian Statewide 87.4%
Hispanic of Any Race Statewide 64.3%
Migrant Statewide 68.3%
Native Hawaiian or Other Pacific Islander Statewide 73.2%
Two or More Races Statewide 73.5%
White Statewide 81.5%
Female Statewide 80.8%
Male Statewide 72.0%
Economically Disadvantaged Statewide 64.0%
English Language Learners Statewide 63.1%
Students With Disabilities Statewide 53.5%
Homeless Statewide 53.8%
All Students District 86.2%
African American District 75.0%
Hispanic of Any Race District 83.0%
White District 88.6%
Economically Disadvantaged District 85.0%
Students With Disabilities District 72.2%
All Students School 86.3%
African American School 74.4%
Hispanic of Any Race School 84.6%
White School 88.5%
Economically Disadvantaged School 84.9%
Students With Disabilities School 72.2%
Page 19 of 28

* All data based on students enrolled for a full academic year.
08/19/2013
Annual Education ReportHeritage High School
Accountability Details Attendance Data
Testing Group Location Attendance Rate (Goal 90%)
All Students Statewide 94.0%
All Students District 94.0%
All Students School 95.0%
Page 20 of 28
08/19/2013
Annual Education ReportHeritage High School
Accountability Status District Data
DistrictName
ReadingStatus
ReadingScore
WritingStatus
WritingScore
Math Status Math Score ScienceStatus
ScienceScore
SocialStudiesStatus
SocialStudiesScore
OverallStatus
OverallScore
No Data to Display
Page 21 of 28
08/19/2013
Annual Education ReportHeritage High School
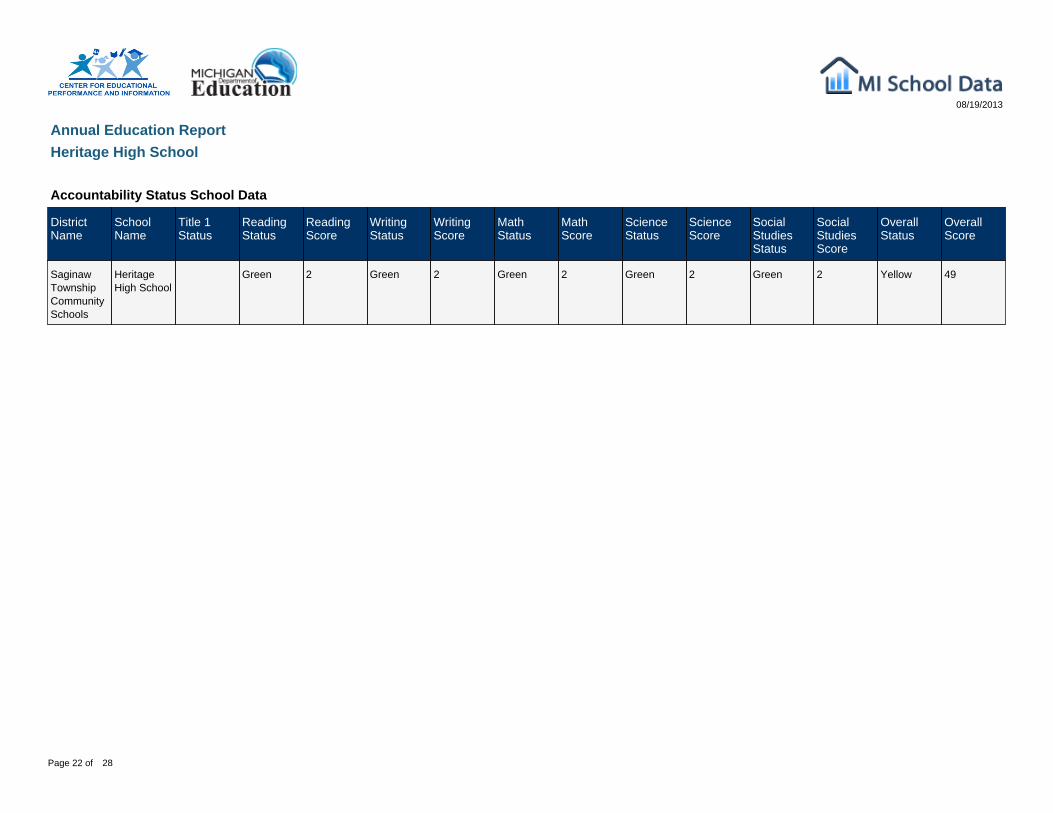
Accountability Status School Data
DistrictName
SchoolName
Title 1Status
ReadingStatus
ReadingScore
WritingStatus
WritingScore
MathStatus
MathScore
ScienceStatus
ScienceScore
SocialStudiesStatus
SocialStudiesScore
OverallStatus
OverallScore
SaginawTownshipCommunitySchools
HeritageHigh School
Green 2 Green 2 Green 2 Green 2 Green 2 Yellow 49
Page 22 of 28
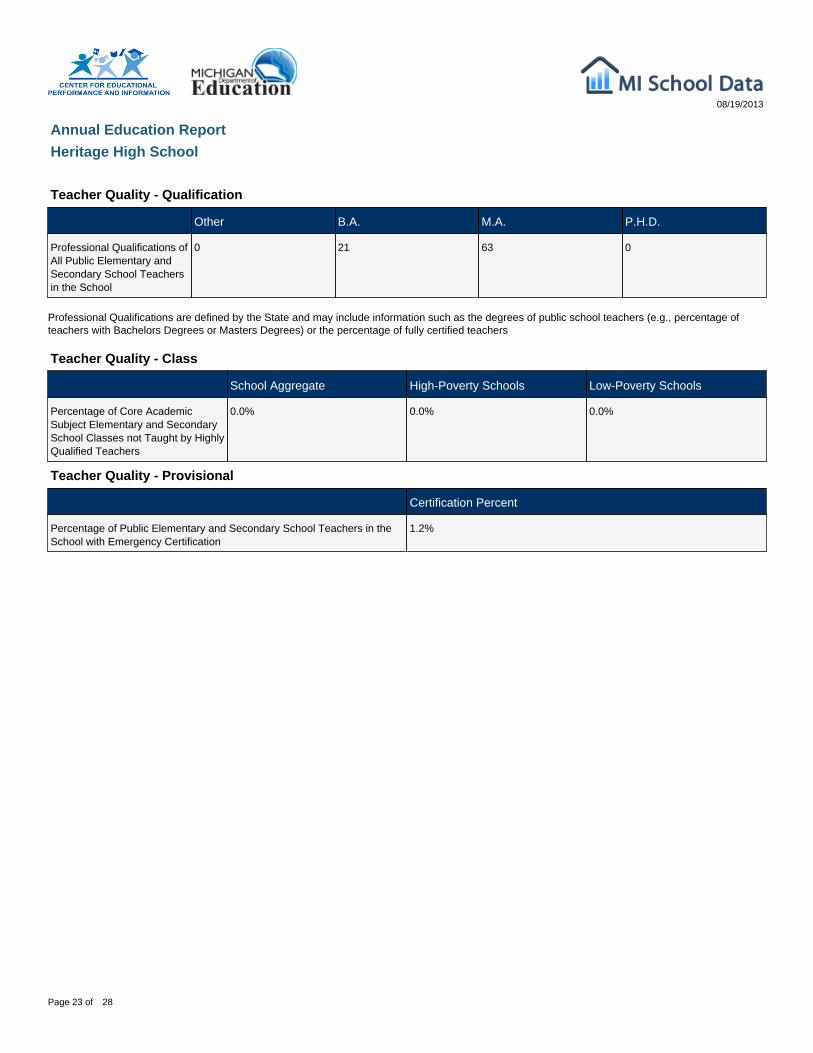
Professional Qualifications are defined by the State and may include information such as the degrees of public school teachers (e.g., percentage ofteachers with Bachelors Degrees or Masters Degrees) or the percentage of fully certified teachers
08/19/2013
Annual Education ReportHeritage High School
Teacher Quality - Qualification
Other B.A. M.A. P.H.D.
Professional Qualifications ofAll Public Elementary andSecondary School Teachersin the School
0 21 63 0
Teacher Quality - Class
School Aggregate High-Poverty Schools Low-Poverty Schools
Percentage of Core AcademicSubject Elementary and SecondarySchool Classes not Taught by HighlyQualified Teachers
0.0% 0.0% 0.0%
Teacher Quality - Provisional
Certification Percent
Percentage of Public Elementary and Secondary School Teachers in theSchool with Emergency Certification
1.2%
Page 23 of 28
‡ Reporting Standards not met. Note: Observed differences are not necessarily statistically significant. Detail may not sum to total because of rounding.SOURCE: U.S. Department of Education. Institute for Education Sciences. National Center for Education Statistics. National Assessment Program(NAEP) 2011 Mathematics Achievement.
08/19/2013
Annual Education ReportHeritage High School
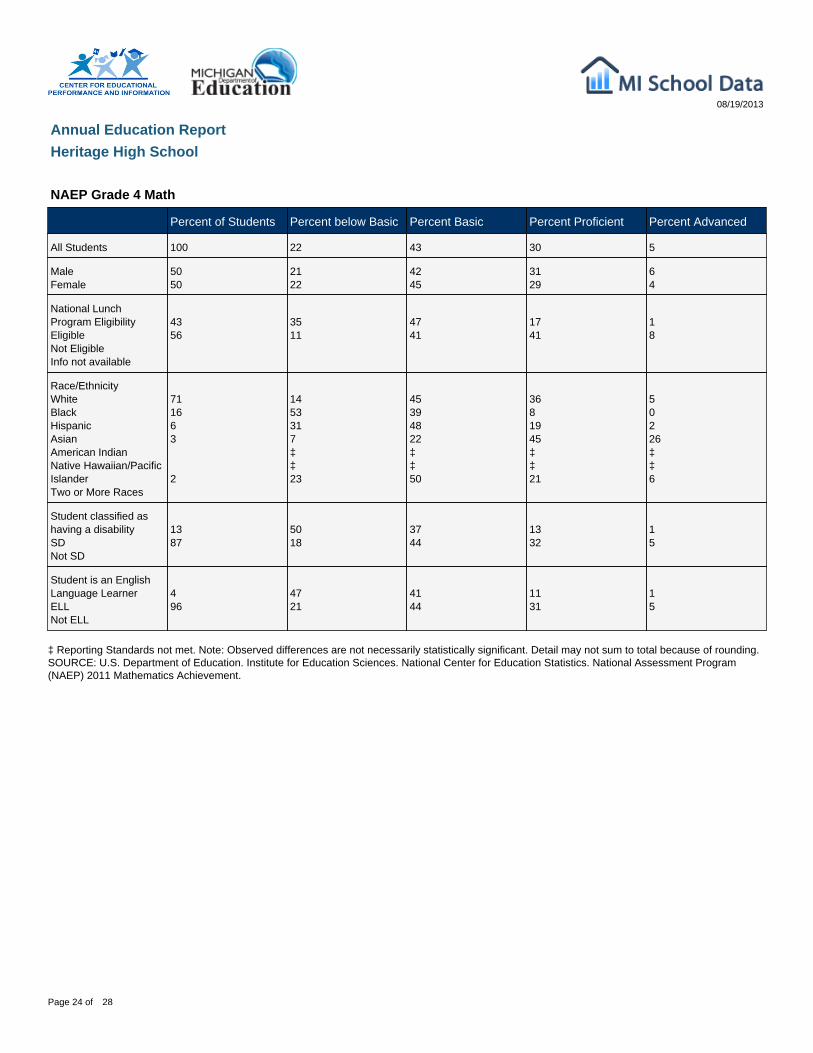
NAEP Grade 4 Math
Percent of Students Percent below Basic Percent Basic Percent Proficient Percent Advanced
All Students 100 22 43 30 5
MaleFemale
5050
2122
4245
3129
64
National LunchProgram EligibilityEligibleNot EligibleInfo not available
4356
3511
4741
1741
18
Race/EthnicityWhiteBlackHispanicAsianAmerican IndianNative Hawaiian/PacificIslanderTwo or More Races
711663
2
1453317‡‡23
45394822‡‡50
3681945‡‡21
50226‡‡6
Student classified ashaving a disabilitySDNot SD
1387
5018
3744
1332
15
Student is an EnglishLanguage LearnerELLNot ELL
496
4721
4144
1131
15
Page 24 of 28

‡ Reporting Standards not met. NOTE: Detail may not sum to totals because of rounding. Some apparent differences between estimates may not bestatistically significant. SOURCE: U.S. Department of Education. Institute for Education Sciences. National Center for Education Statistics. NationalAssessment Program (NAEP) 2011 Mathematics Achievement.
08/19/2013
Annual Education ReportHeritage High School
NAEP Grade 8 Math
Percent of Students Percent below Basic Percent Basic Percent Proficient Percent Advanced
All Students 100 29 40 25 6
MaleFemale
5149
2830
3941
2624
75
National LunchProgram EligibilityEligibleNot EligibleInfo not available
4258
4518
3941
1532
29
Race/EthnicityWhiteBlackHispanicAsianAmerican IndianNative Hawaiian/PacificIslanderTwo or More Races
7416431
2
22662613‡‡‡
43264125‡‡‡
2971831‡‡‡
60532‡‡‡
Student classified ashaving a disabilitySDNot SD
1288
7025
2341
527
16
Student is an EnglishLanguage LearnerELLNot ELL
298
5729
2740
725
106
Page 25 of 28

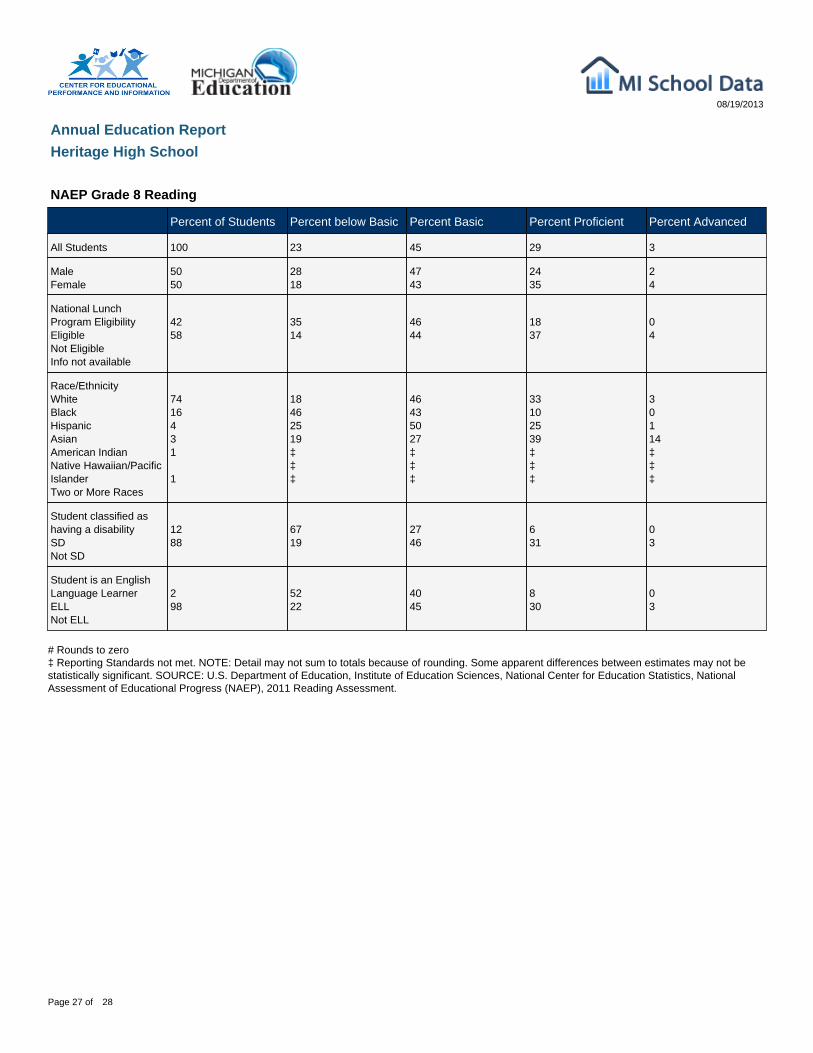
# Rounds to zero ‡ Reporting Standards not met. NOTE: Detail may not sum to totals because of rounding. Some apparent differences between estimates may not bestatistically significant. SOURCE: U.S. Department of Education, Institute of Education Sciences, National Center for Education Statistics, NationalAssessment of Educational Progress (NAEP), 2011 Reading Assessment.
08/19/2013
Annual Education ReportHeritage High School
NAEP Grade 4 Reading
Percent of Students Percent below Basic Percent Basic Percent Proficient Percent Advanced
All Students 100 34 34 25 6
MaleFemale
5050
3831
3336
2426
67
National LunchProgram EligibilityEligibleNot EligibleInfo not available
4555 51
21
3236
1533
210
Race/EthnicityWhiteBlackHispanicAsianAmerican IndianNative Hawaiian/PacificIslanderTwo or More Races
7017630
2
26675119‡‡36
37242933‡‡31
3071733‡‡19
71315‡‡14
Student classified ashaving a disabilitySDNot SD
1387
7330
1736
827
27
Student is an EnglishLanguage LearnerELLNot ELL
397
6733
2635
725
07
Page 26 of 28
# Rounds to zero ‡ Reporting Standards not met. NOTE: Detail may not sum to totals because of rounding. Some apparent differences between estimates may not bestatistically significant. SOURCE: U.S. Department of Education, Institute of Education Sciences, National Center for Education Statistics, NationalAssessment of Educational Progress (NAEP), 2011 Reading Assessment.
08/19/2013
Annual Education ReportHeritage High School
NAEP Grade 8 Reading
Percent of Students Percent below Basic Percent Basic Percent Proficient Percent Advanced
All Students 100 23 45 29 3
MaleFemale
5050
2818
4743
2435
24
National LunchProgram EligibilityEligibleNot EligibleInfo not available
4258
3514
4644
1837
04
Race/EthnicityWhiteBlackHispanicAsianAmerican IndianNative Hawaiian/PacificIslanderTwo or More Races
7416431
1
18462519‡‡‡
46435027‡‡‡
33102539‡‡‡
30114‡‡‡
Student classified ashaving a disabilitySDNot SD
1288
6719
2746
631
03
Student is an EnglishLanguage LearnerELLNot ELL
298
5222
4045
830
03
Page 27 of 28

08/19/2013
Annual Education ReportHeritage High School
NAEP Participation Data
Grade Subject Participation Rate forStudents withDisabilities
Standard Error Participation Rate forLimited EnglishProficient Students
Standard Error
4 MathReading
8575
2.03.1
7393
3.32.4
8 MathReading
7363
2.53.3
8379
4.74.5
Page 28 of 28