heritage recording and 3d modeling with photogrammetry and 3d
TRANSCRIPT

Remote Sens. 2011, 3, 1104-1138; doi:10.3390/rs3061104
Remote Sensing ISSN 2072-4292
www.mdpi.com/journal/remotesensing
Article
Heritage Recording and 3D Modeling with Photogrammetry
and 3D Scanning
Fabio Remondino
3D Optical Metrology (3DOM) Research Unit, Bruno Kessler Foundation (FBK), 38122 Trento, Italy;
E-Mail: [email protected]
Received: 7 April 2011; in revised form: 16 May 2011 / Accepted: 17 May 2011 /
Published: 30 May 2011
Abstract: The importance of landscape and heritage recording and documentation with
optical remote sensing sensors is well recognized at international level. The continuous
development of new sensors, data capture methodologies and multi-resolution 3D
representations, contributes significantly to the digital 3D documentation, mapping,
conservation and representation of landscapes and heritages and to the growth of research
in this field. This article reviews the actual optical 3D measurement sensors and 3D
modeling techniques, with their limitations and potentialities, requirements and
specifications. Examples of 3D surveying and modeling of heritage sites and objects are
also shown throughout the paper.
Keywords: surveying; sensors; 3D modeling; photogrammetry; remote sensing; laser
scanning; Cultural Heritage
1. Introduction
The creation of 3D models of heritage and archaeological objects and sites in their current state
requires a powerful methodology able to capture and digitally model the fine geometric and
appearance details of such sites. Digital recording, documentation and preservation are demanded as
our heritages (natural, cultural or mixed) suffer from on-going attritions and wars, natural disasters,
climate changes and human negligence. In particular the built environment and natural heritage have
received a lot of attention and benefits from the recent advances of range sensors and imaging
devices [1,2]. Nowadays 3D data are a critical component to permanently record the form of important
objects and sites so that, in digital form at least, they might be passed down to future generations. This
has generated in the last decade a large number of projects, mainly led by research groups, which have
OPEN ACCESS

Remote Sens. 2011, 3
1105
realized very good quality and complete digital models [3-9]. Indeed remote sensing technologies and
methodologies for Cultural Heritage 3D documentation and modeling [10] allow the generation of very
realistic 3D results (in terms of geometric and radiometric accuracy) that can be used for many
purposes, such as historical documentation [11,12], digital preservation and conservation [13,14],
cross-comparisons, monitoring of shape and colors, simulation of aging and deterioration, virtual
reality/computer graphics applications [15,16], 3D repositories and catalogues [17], web-based
geographic systems, computer-aided restoration [18], multimedia museum exhibitions [19],
visualization and so on. However, despite all these potential applications and the constant pressure of
international heritage organizations, a systematic and targeted use of 3D surveying and modeling in the
Cultural Heritage field is still not yet employed as a default approach and when a 3D model is
generated, it is often subsampled or reduced to a 2D drawing due to a lack of software or knowledge in
properly handling 3D data by non-expert. However, the availability and use of 3D data opens a wide
spectrum of further applications and allows new analyses, studies, interpretations, conservation
policies or digital restoration. Thus 3D virtual heritages should be more frequently used due to the
great advantages that remote sensing technologies and the third dimension offer to the heritage world
and to recognize the digital documentation and preservation needs stated in numerous international
charters and resolutions. Unfortunately, there are still some difficulties of communications between the
geomatics people and the heritage community. New technologies and new hardware are increasing the
quality of 3D models with the purpose of attracting new people into the 3D world. Many companies
entered inside this market developing and employing software and survey systems with good
potentialities and often with very impressive results. Thus the number of 3D products is huge and if, on
one hand, the cost of these technologies is slowly reducing, on the other hand it is difficult, in
particular for non-specialists, to select the right product due to a lack of standard terminologies,
specifications and performance benchmarking. Furthermore, new technologies can be a powerful tool
to improve the classical standard of heritage recording and documentation and create a new
methodology. However caution must be used and the new recording technologies have to be further
studied and customized to be fully effective and useful, since even the standard bi-dimensional
representations are still not problem-free.
Although digitally recorded and modeled, our heritages require also more international
collaboration and information sharing to make them accessible in all the possible forms and to all the
possible users and clients. Nowadays, the digital documentation and 3D modeling of Cultural Heritage
should always consist of [20]:
– Recording and processing of a large amount of 3D (possibly 4D) multi-source, multi-resolution,
and multi-content information;
– Management and conservation of the achieved 3D (4D) models for further applications;
– Visualization and presentation of the results to distribute the information to other users allowing
data retrieval through the Internet or advanced online databases;
– Digital inventories and sharing for education, research, conservation, entertainment,
walkthrough, or tourism purposes.
In the following sections, optical sensors for reality-based recording and modeling of large sites and
complex objects are reported. The actual problems and open issues in the entire 3D modeling pipeline
Remote Sens. 2011, 3
1106
are also summarized. Since a large body of work on 3D recording and modeling with photogrammetry
and 3D scanning exists, the paper mainly focuses on the most accepted and practically tested sensors,
recording and 3D modeling approaches. Despite the fact that sensor’s technology is developing very
fast and that very few standards are available for the sensor specifications, some summarizing tables of
the existing active and passive sensors are also reported with their main performance parameters.
2. Recording Optical Sensors and Platforms
Today a large number of remote sensing sensors and data are available for mapping purposes and
digital recording of visual Cultural Heritage. Generally non-invasive optical recording sensors are
divided in passive and active systems. Passive sensors (e.g., digital cameras) deliver image data which
are then processed with some mathematical formulations to infer 3D information from the 2D image
measurements. On the other hand, active sensors (e.g., laser scanner or radar) can provide data directly
for 3D information or ranges. Terrestrial active and passive sensors employed to derive 3D shapes are
often referred to 3D imaging techniques [21].
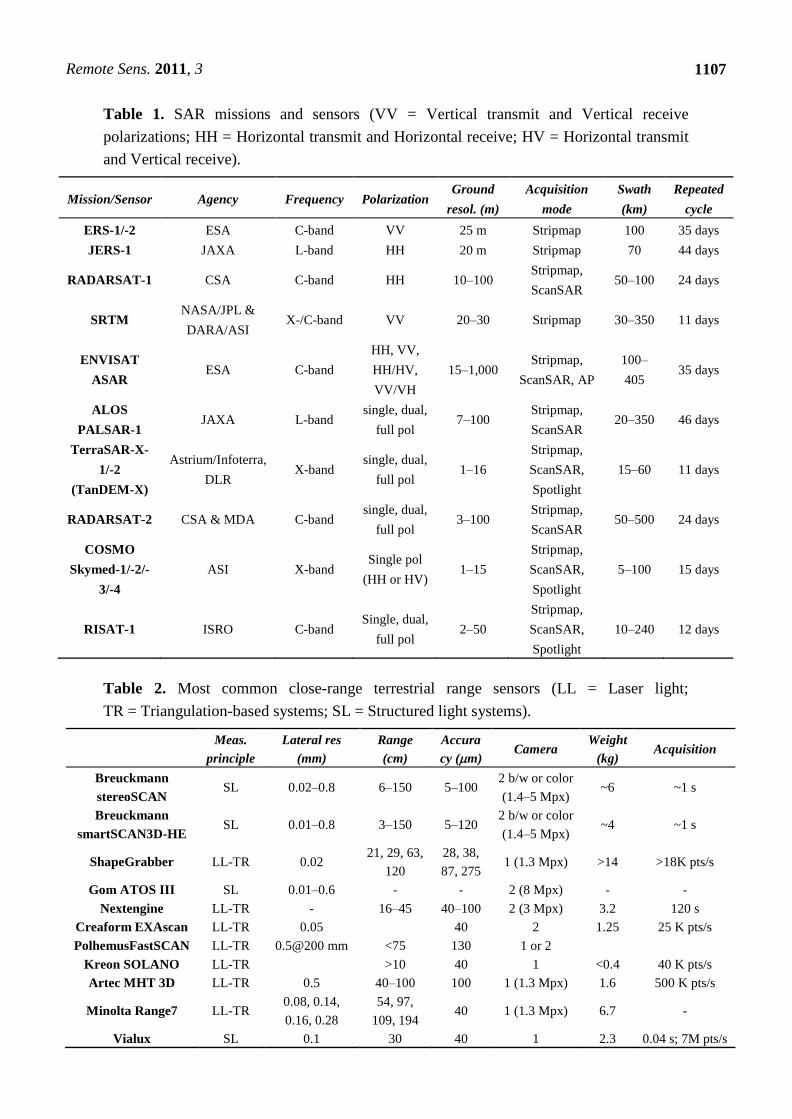
Synthetic Aperture Radar (SAR) systems (Table 1) are not considered as optical sensors, although
their use for mapping and monitoring purposes is increasing in recent years with really impressive and
interesting results [22-24]. Radar sensors are weather independent although the interpretation of radar
images is more complicated if compared to optical images.
Reality-based 3D surveying and modeling is meant as the digital recording and 3D reconstruction of
visual and existing scenes using active sensors and range data (Section 2.1), passive sensors and image
data (Section 2.2), classical surveying (e.g., total stations or GNSS), 2D maps [25] or an integration of
the aforementioned methods (Section 2.3). The choice or integration depends on the required accuracy,
object dimensions, location constraints, instrument’s portability and usability, surface characteristics,
working team experience, project budget, final goal of the survey, and so on. On the other hand,
non-real 3D modeling approaches are based on computer graphics software (e.g., 3D Studio Max,
Maya, Sketchup, Blender, etc.) or procedural modeling approaches [26-28] allowing the generation of
really remarkable 3D data without any particular survey or knowledge of a site and with generally no
metrical results.
2.1. Active Optical Sensors
Optical range sensors [29-31] like pulsed (Time-of-Flight), phase-shift and triangulation-based
(light sheet or pattern projection) instruments have received much attention in recent years, also from
non-experts, for 3D surveying and modeling purposes. Range sensors directly record the 3D geometry
of surfaces, producing quantitative 3D digital representations (point clouds or range maps) in a given
field of view with a defined measurement uncertainty. Range sensors are getting quite common in the
mapping community and heritage field, despite their high costs, weight and the usual lack of good
texture. Interferometry-based systems (not covered here) can also be used to capture accurate high
resolution 3D data of Cultural Heritage [32-34].
Terrestrial range sensors (Tables 2 and 3) work from very short ranges (few centimeters up to a few
kilometers) in accordance with surface proprieties and environment characteristics, delivering 3D data
with accuracy from some microns up to some millimeters.
Remote Sens. 2011, 3
1107
Table 1. SAR missions and sensors (VV = Vertical transmit and Vertical receive
polarizations; HH = Horizontal transmit and Horizontal receive; HV = Horizontal transmit
and Vertical receive).
Mission/Sensor Agency Frequency Polarization Ground
resol. (m)
Acquisition
mode
Swath
(km)
Repeated
cycle
ERS-1/-2 ESA C-band VV 25 m Stripmap 100 35 days
JERS-1 JAXA L-band HH 20 m Stripmap 70 44 days
RADARSAT-1 CSA C-band HH 10–100 Stripmap,
ScanSAR 50–100 24 days
SRTM NASA/JPL &
DARA/ASI X-/C-band VV 20–30 Stripmap 30–350 11 days
ENVISAT
ASAR ESA C-band
HH, VV,
HH/HV,
VV/VH
15–1,000 Stripmap,
ScanSAR, AP
100–
405 35 days
ALOS
PALSAR-1 JAXA L-band
single, dual,
full pol 7–100
Stripmap,
ScanSAR 20–350 46 days
TerraSAR-X-
1/-2
(TanDEM-X)
Astrium/Infoterra,
DLR X-band
single, dual,
full pol 1–16
Stripmap,
ScanSAR,
Spotlight
15–60 11 days
RADARSAT-2 CSA & MDA C-band single, dual,
full pol 3–100
Stripmap,
ScanSAR 50–500 24 days
COSMO
Skymed-1/-2/-
3/-4
ASI X-band Single pol
(HH or HV) 1–15
Stripmap,
ScanSAR,
Spotlight
5–100 15 days
RISAT-1 ISRO C-band Single, dual,
full pol 2–50
Stripmap,
ScanSAR,
Spotlight
10–240 12 days
Table 2. Most common close-range terrestrial range sensors (LL = Laser light;
TR = Triangulation-based systems; SL = Structured light systems).
Meas.
principle
Lateral res
(mm)
Range
(cm)
Accura
cy (m) Camera
Weight
(kg) Acquisition
Breuckmann
stereoSCAN SL 0.02–0.8 6–150 5–100
2 b/w or color
(1.4–5 Mpx) ~6 ~1 s
Breuckmann
smartSCAN3D-HE SL 0.01–0.8 3–150 5–120
2 b/w or color
(1.4–5 Mpx) ~4 ~1 s
ShapeGrabber LL-TR 0.02 21, 29, 63,
120
28, 38,
87, 275 1 (1.3 Mpx) >14 >18K pts/s
Gom ATOS III SL 0.01–0.6 - - 2 (8 Mpx) - -
Nextengine LL-TR - 16–45 40–100 2 (3 Mpx) 3.2 120 s
Creaform EXAscan LL-TR 0.05 40 2 1.25 25 K pts/s
PolhemusFastSCAN LL-TR 0.5@200 mm <75 130 1 or 2
Kreon SOLANO LL-TR >10 40 1 <0.4 40 K pts/s
Artec MHT 3D LL-TR 0.5 40–100 100 1 (1.3 Mpx) 1.6 500 K pts/s
Minolta Range7 LL-TR 0.08, 0.14,
0.16, 0.28
54, 97,
109, 194 40 1 (1.3 Mpx) 6.7 -
Vialux SL 0.1 30 40 1 2.3 0.04 s; 7M pts/s
Remote Sens. 2011, 3
1108
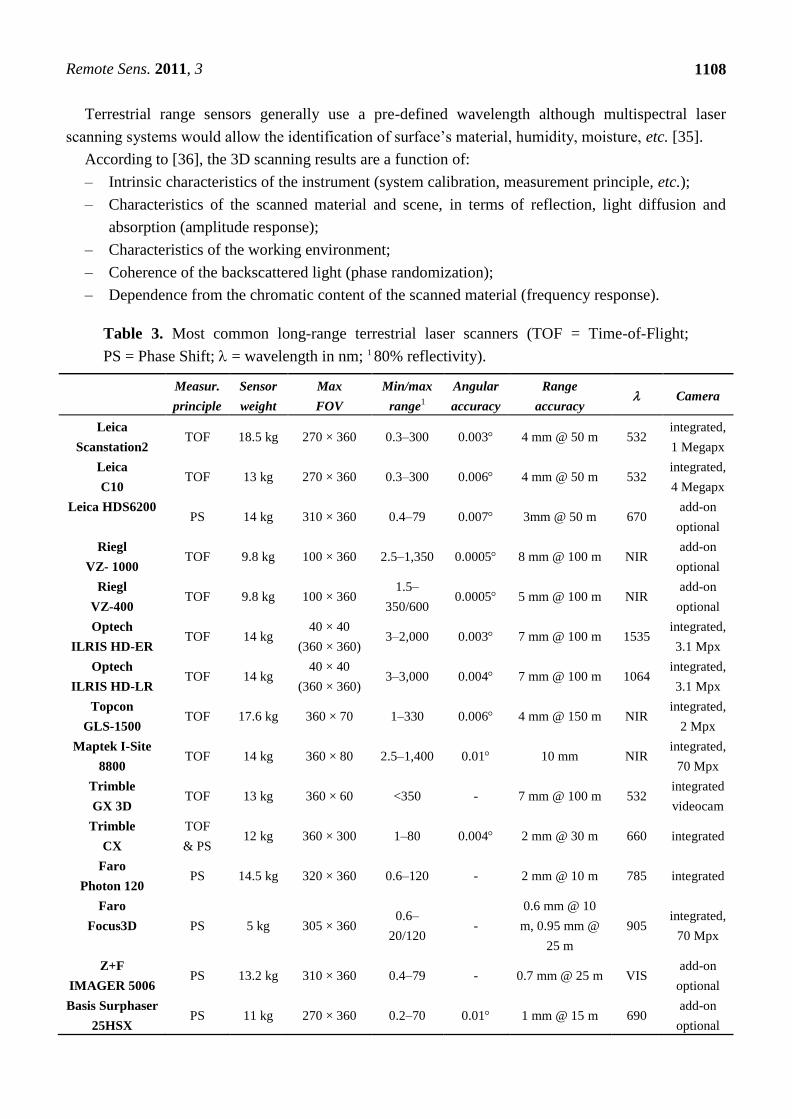
Terrestrial range sensors generally use a pre-defined wavelength although multispectral laser
scanning systems would allow the identification of surface’s material, humidity, moisture, etc. [35].
According to [36], the 3D scanning results are a function of:
– Intrinsic characteristics of the instrument (system calibration, measurement principle, etc.);
– Characteristics of the scanned material and scene, in terms of reflection, light diffusion and
absorption (amplitude response);
– Characteristics of the working environment;
– Coherence of the backscattered light (phase randomization);
– Dependence from the chromatic content of the scanned material (frequency response).
Table 3. Most common long-range terrestrial laser scanners (TOF = Time-of-Flight;
PS = Phase Shift; = wavelength in nm; 1 80% reflectivity).
Measur.
principle
Sensor
weight
Max
FOV
Min/max
range1
Angular
accuracy
Range
accuracy Camera
Leica
Scanstation2 TOF 18.5 kg 270 × 360 0.3–300 0.003 4 mm @ 50 m 532
integrated,
1 Megapx
Leica
C10 TOF 13 kg 270 × 360 0.3–300 0.006 4 mm @ 50 m 532
integrated,
4 Megapx
Leica HDS6200 PS 14 kg 310 × 360 0.4–79 0.007 3mm @ 50 m 670
add-on
optional
Riegl
VZ- 1000 TOF 9.8 kg 100 × 360 2.5–1,350 0.0005 8 mm @ 100 m NIR
add-on
optional
Riegl
VZ-400 TOF 9.8 kg 100 × 360
1.5–
350/600 0.0005 5 mm @ 100 m NIR
add-on
optional
Optech
ILRIS HD-ER TOF 14 kg
40 × 40
(360 × 360) 3–2,000 0.003 7 mm @ 100 m 1535
integrated,
3.1 Mpx
Optech
ILRIS HD-LR TOF 14 kg
40 × 40
(360 × 360) 3–3,000 0.004 7 mm @ 100 m 1064
integrated,
3.1 Mpx
Topcon
GLS-1500 TOF 17.6 kg 360 × 70 1–330 0.006 4 mm @ 150 m NIR
integrated,
2 Mpx
Maptek I-Site
8800 TOF 14 kg 360 × 80 2.5–1,400 0.01 10 mm NIR
integrated,
70 Mpx
Trimble
GX 3D TOF 13 kg 360 × 60 <350 - 7 mm @ 100 m 532
integrated
videocam
Trimble
CX
TOF
& PS 12 kg 360 × 300 1–80 0.004 2 mm @ 30 m 660 integrated
Faro
Photon 120 PS 14.5 kg 320 × 360 0.6–120 - 2 mm @ 10 m 785 integrated
Faro
Focus3D PS 5 kg 305 × 360 0.6–
20/120 -
0.6 mm @ 10
m, 0.95 mm @
25 m
905 integrated,
70 Mpx
Z+F
IMAGER 5006 PS 13.2 kg 310 × 360 0.4–79 - 0.7 mm @ 25 m VIS
add-on
optional
Basis Surphaser
25HSX PS 11 kg 270 × 360 0.2–70 0.01 1 mm @ 15 m 690
add-on
optional
Remote Sens. 2011, 3
1109
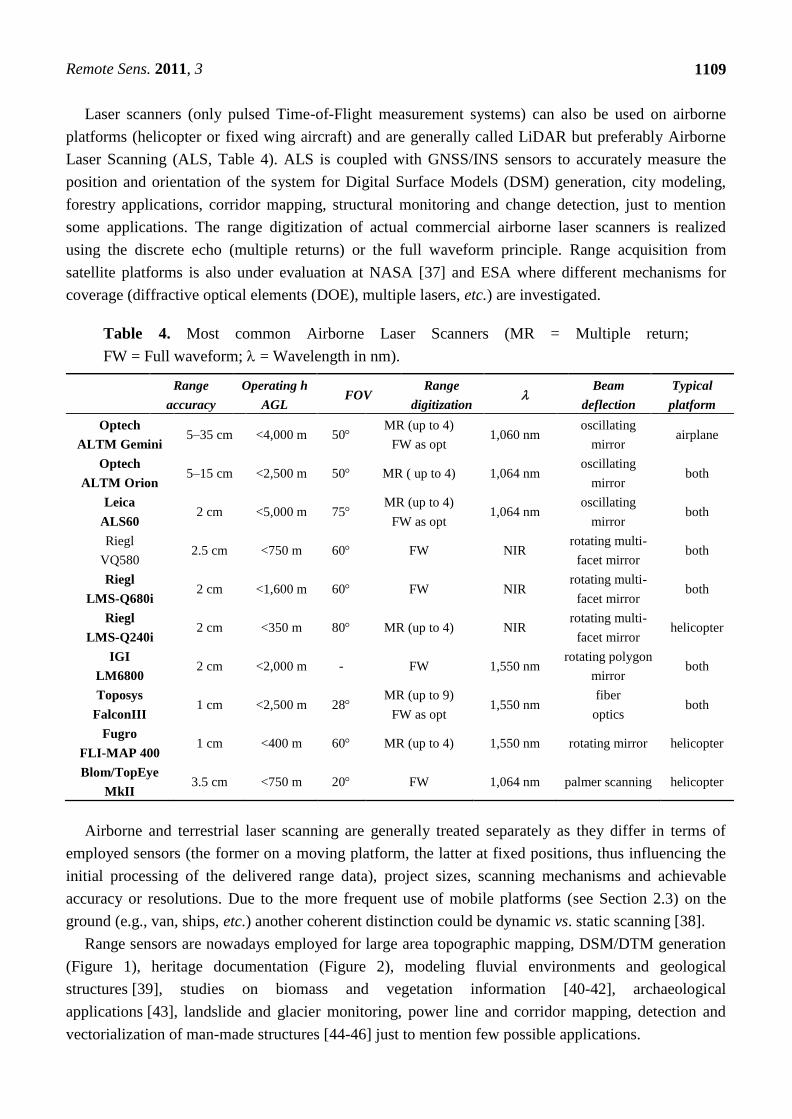
Laser scanners (only pulsed Time-of-Flight measurement systems) can also be used on airborne
platforms (helicopter or fixed wing aircraft) and are generally called LiDAR but preferably Airborne
Laser Scanning (ALS, Table 4). ALS is coupled with GNSS/INS sensors to accurately measure the
position and orientation of the system for Digital Surface Models (DSM) generation, city modeling,
forestry applications, corridor mapping, structural monitoring and change detection, just to mention
some applications. The range digitization of actual commercial airborne laser scanners is realized
using the discrete echo (multiple returns) or the full waveform principle. Range acquisition from
satellite platforms is also under evaluation at NASA [37] and ESA where different mechanisms for
coverage (diffractive optical elements (DOE), multiple lasers, etc.) are investigated.
Table 4. Most common Airborne Laser Scanners (MR = Multiple return;
FW = Full waveform; = Wavelength in nm).
Range
accuracy
Operating h
AGL FOV
Range
digitization
Beam
deflection
Typical
platform
Optech
ALTM Gemini 5–35 cm <4,000 m 50
MR (up to 4)
FW as opt 1,060 nm
oscillating
mirror airplane
Optech
ALTM Orion 5–15 cm <2,500 m 50 MR ( up to 4) 1,064 nm
oscillating
mirror both
Leica
ALS60 2 cm <5,000 m 75
MR (up to 4)
FW as opt 1,064 nm
oscillating
mirror both
Riegl
VQ580 2.5 cm <750 m 60 FW NIR
rotating multi-
facet mirror both
Riegl
LMS-Q680i 2 cm <1,600 m 60 FW NIR
rotating multi-
facet mirror both
Riegl
LMS-Q240i 2 cm <350 m 80 MR (up to 4) NIR
rotating multi-
facet mirror helicopter
IGI
LM6800 2 cm <2,000 m - FW 1,550 nm
rotating polygon
mirror both
Toposys
FalconIII 1 cm <2,500 m 28
MR (up to 9)
FW as opt 1,550 nm
fiber
optics both
Fugro
FLI-MAP 400 1 cm <400 m 60 MR (up to 4) 1,550 nm rotating mirror helicopter
Blom/TopEye
MkII 3.5 cm <750 m 20 FW 1,064 nm palmer scanning helicopter
Airborne and terrestrial laser scanning are generally treated separately as they differ in terms of
employed sensors (the former on a moving platform, the latter at fixed positions, thus influencing the
initial processing of the delivered range data), project sizes, scanning mechanisms and achievable
accuracy or resolutions. Due to the more frequent use of mobile platforms (see Section 2.3) on the
ground (e.g., van, ships, etc.) another coherent distinction could be dynamic vs. static scanning [38].
Range sensors are nowadays employed for large area topographic mapping, DSM/DTM generation
(Figure 1), heritage documentation (Figure 2), modeling fluvial environments and geological
structures [39], studies on biomass and vegetation information [40-42], archaeological
applications [43], landslide and glacier monitoring, power line and corridor mapping, detection and
vectorialization of man-made structures [44-46] just to mention few possible applications.
Remote Sens. 2011, 3
1110
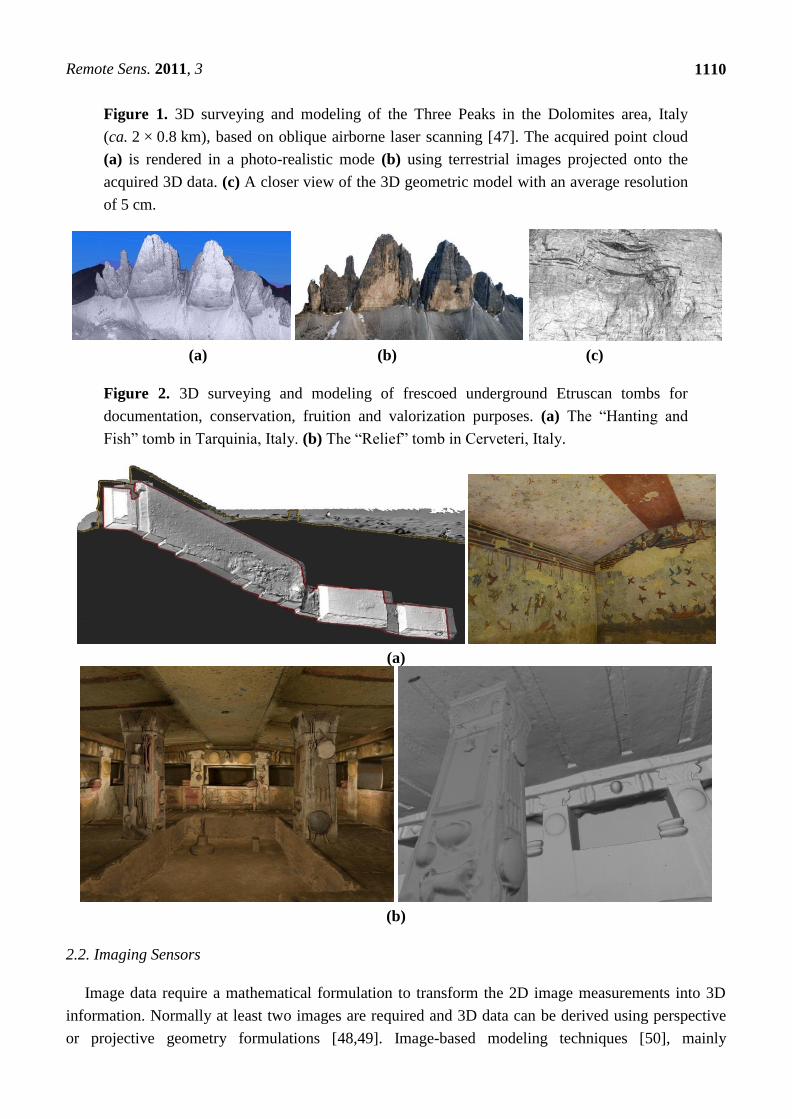
Figure 1. 3D surveying and modeling of the Three Peaks in the Dolomites area, Italy
(ca. 2 × 0.8 km), based on oblique airborne laser scanning [47]. The acquired point cloud
(a) is rendered in a photo-realistic mode (b) using terrestrial images projected onto the
acquired 3D data. (c) A closer view of the 3D geometric model with an average resolution
of 5 cm.
(a) (b) (c)
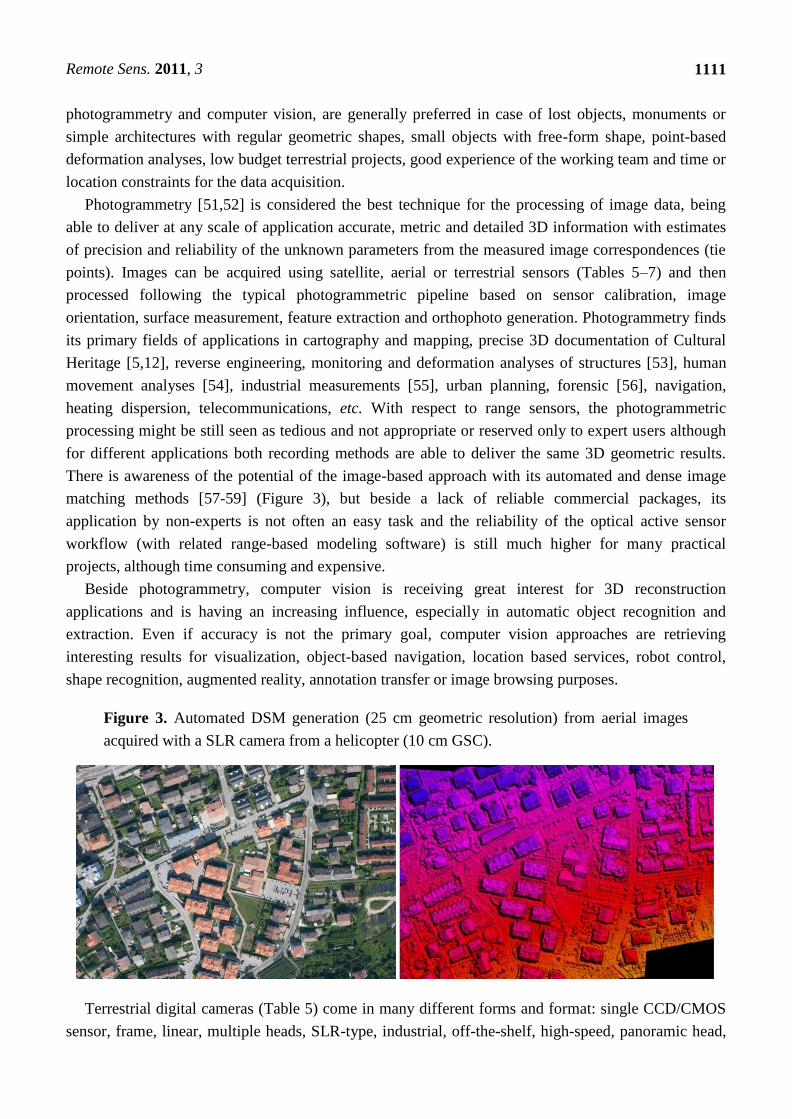
Figure 2. 3D surveying and modeling of frescoed underground Etruscan tombs for
documentation, conservation, fruition and valorization purposes. (a) The ―Hanting and
Fish‖ tomb in Tarquinia, Italy. (b) The ―Relief‖ tomb in Cerveteri, Italy.
(a)
(b)
2.2. Imaging Sensors
Image data require a mathematical formulation to transform the 2D image measurements into 3D
information. Normally at least two images are required and 3D data can be derived using perspective
or projective geometry formulations [48,49]. Image-based modeling techniques [50], mainly
Remote Sens. 2011, 3
1111
photogrammetry and computer vision, are generally preferred in case of lost objects, monuments or
simple architectures with regular geometric shapes, small objects with free-form shape, point-based
deformation analyses, low budget terrestrial projects, good experience of the working team and time or
location constraints for the data acquisition.
Photogrammetry [51,52] is considered the best technique for the processing of image data, being
able to deliver at any scale of application accurate, metric and detailed 3D information with estimates
of precision and reliability of the unknown parameters from the measured image correspondences (tie
points). Images can be acquired using satellite, aerial or terrestrial sensors (Tables 5–7) and then
processed following the typical photogrammetric pipeline based on sensor calibration, image
orientation, surface measurement, feature extraction and orthophoto generation. Photogrammetry finds
its primary fields of applications in cartography and mapping, precise 3D documentation of Cultural
Heritage [5,12], reverse engineering, monitoring and deformation analyses of structures [53], human
movement analyses [54], industrial measurements [55], urban planning, forensic [56], navigation,
heating dispersion, telecommunications, etc. With respect to range sensors, the photogrammetric
processing might be still seen as tedious and not appropriate or reserved only to expert users although
for different applications both recording methods are able to deliver the same 3D geometric results.
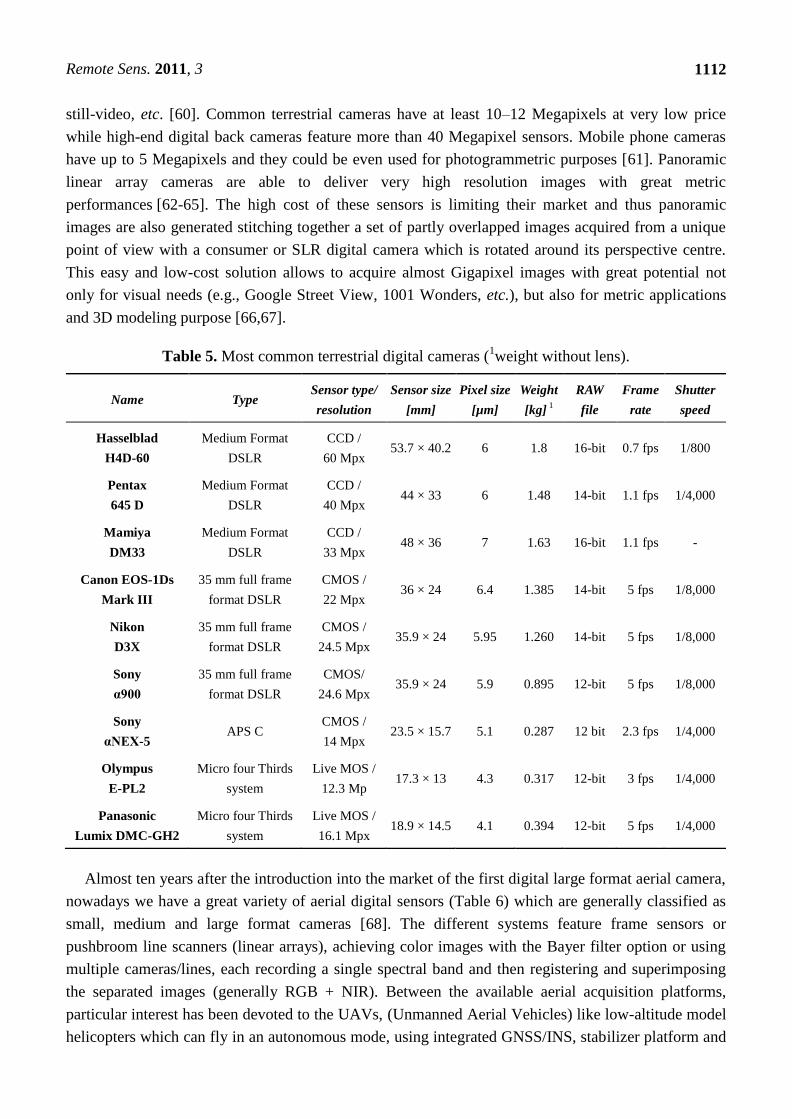
There is awareness of the potential of the image-based approach with its automated and dense image
matching methods [57-59] (Figure 3), but beside a lack of reliable commercial packages, its
application by non-experts is not often an easy task and the reliability of the optical active sensor
workflow (with related range-based modeling software) is still much higher for many practical
projects, although time consuming and expensive.
Beside photogrammetry, computer vision is receiving great interest for 3D reconstruction
applications and is having an increasing influence, especially in automatic object recognition and
extraction. Even if accuracy is not the primary goal, computer vision approaches are retrieving
interesting results for visualization, object-based navigation, location based services, robot control,
shape recognition, augmented reality, annotation transfer or image browsing purposes.
Figure 3. Automated DSM generation (25 cm geometric resolution) from aerial images
acquired with a SLR camera from a helicopter (10 cm GSC).
Terrestrial digital cameras (Table 5) come in many different forms and format: single CCD/CMOS
sensor, frame, linear, multiple heads, SLR-type, industrial, off-the-shelf, high-speed, panoramic head,
Remote Sens. 2011, 3
1112
still-video, etc. [60]. Common terrestrial cameras have at least 10–12 Megapixels at very low price
while high-end digital back cameras feature more than 40 Megapixel sensors. Mobile phone cameras
have up to 5 Megapixels and they could be even used for photogrammetric purposes [61]. Panoramic
linear array cameras are able to deliver very high resolution images with great metric
performances [62-65]. The high cost of these sensors is limiting their market and thus panoramic
images are also generated stitching together a set of partly overlapped images acquired from a unique
point of view with a consumer or SLR digital camera which is rotated around its perspective centre.
This easy and low-cost solution allows to acquire almost Gigapixel images with great potential not
only for visual needs (e.g., Google Street View, 1001 Wonders, etc.), but also for metric applications
and 3D modeling purpose [66,67].
Table 5. Most common terrestrial digital cameras (1weight without lens).
Name Type Sensor type/
resolution
Sensor size
[mm]
Pixel size
[µm]
Weight
[kg] 1
RAW
file
Frame
rate
Shutter
speed
Hasselblad
H4D-60
Medium Format
DSLR
CCD /
60 Mpx 53.7 × 40.2 6 1.8 16-bit 0.7 fps 1/800
Pentax
645 D
Medium Format
DSLR
CCD /
40 Mpx 44 × 33 6 1.48 14-bit 1.1 fps 1/4,000
Mamiya
DM33
Medium Format
DSLR
CCD /
33 Mpx 48 × 36 7 1.63 16-bit 1.1 fps -
Canon EOS-1Ds
Mark III
35 mm full frame
format DSLR
CMOS /
22 Mpx 36 × 24 6.4 1.385 14-bit 5 fps 1/8,000
Nikon
D3X
35 mm full frame
format DSLR
CMOS /
24.5 Mpx 35.9 × 24 5.95 1.260 14-bit 5 fps 1/8,000
Sony
α900
35 mm full frame
format DSLR
CMOS/
24.6 Mpx 35.9 × 24 5.9 0.895 12-bit 5 fps 1/8,000
Sony
αNEX-5 APS C
CMOS /
14 Mpx 23.5 × 15.7 5.1 0.287 12 bit 2.3 fps 1/4,000
Olympus
E-PL2
Micro four Thirds
system
Live MOS /
12.3 Mp 17.3 × 13 4.3 0.317 12-bit 3 fps 1/4,000
Panasonic
Lumix DMC-GH2
Micro four Thirds
system
Live MOS /
16.1 Mpx 18.9 × 14.5 4.1 0.394 12-bit 5 fps 1/4,000
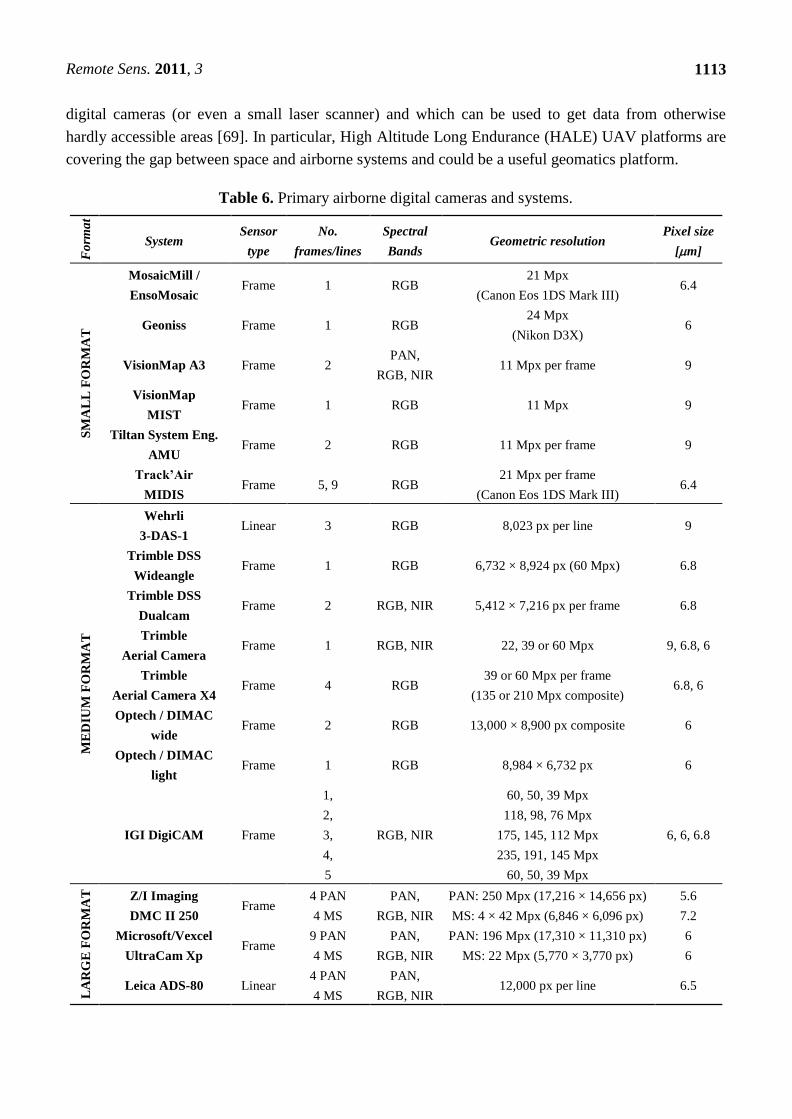
Almost ten years after the introduction into the market of the first digital large format aerial camera,
nowadays we have a great variety of aerial digital sensors (Table 6) which are generally classified as
small, medium and large format cameras [68]. The different systems feature frame sensors or
pushbroom line scanners (linear arrays), achieving color images with the Bayer filter option or using
multiple cameras/lines, each recording a single spectral band and then registering and superimposing
the separated images (generally RGB + NIR). Between the available aerial acquisition platforms,
particular interest has been devoted to the UAVs, (Unmanned Aerial Vehicles) like low-altitude model
helicopters which can fly in an autonomous mode, using integrated GNSS/INS, stabilizer platform and
Remote Sens. 2011, 3
1113
digital cameras (or even a small laser scanner) and which can be used to get data from otherwise
hardly accessible areas [69]. In particular, High Altitude Long Endurance (HALE) UAV platforms are
covering the gap between space and airborne systems and could be a useful geomatics platform.
Table 6. Primary airborne digital cameras and systems.
Fo
rma
t
System Sensor
type
No.
frames/lines
Spectral
Bands Geometric resolution
Pixel size
[m]
SM
AL
L F
OR
MA
T
MosaicMill /
EnsoMosaic Frame 1 RGB
21 Mpx
(Canon Eos 1DS Mark III) 6.4
Geoniss Frame 1 RGB 24 Mpx
(Nikon D3X) 6
VisionMap A3 Frame 2 PAN,
RGB, NIR 11 Mpx per frame 9
VisionMap
MIST Frame 1 RGB 11 Mpx 9
Tiltan System Eng.
AMU Frame 2 RGB 11 Mpx per frame 9
Track’Air
MIDIS Frame 5, 9 RGB
21 Mpx per frame
(Canon Eos 1DS Mark III) 6.4
ME
DIU
M F
OR
MA
T
Wehrli
3-DAS-1 Linear 3 RGB 8,023 px per line 9
Trimble DSS
Wideangle Frame 1 RGB 6,732 × 8,924 px (60 Mpx) 6.8
Trimble DSS
Dualcam Frame 2 RGB, NIR 5,412 × 7,216 px per frame 6.8
Trimble
Aerial Camera Frame 1 RGB, NIR 22, 39 or 60 Mpx 9, 6.8, 6
Trimble
Aerial Camera X4 Frame 4 RGB
39 or 60 Mpx per frame
(135 or 210 Mpx composite) 6.8, 6
Optech / DIMAC
wide Frame 2 RGB 13,000 × 8,900 px composite 6
Optech / DIMAC
light Frame 1 RGB 8,984 × 6,732 px 6
IGI DigiCAM Frame
1,
2,
3,
4,
5
RGB, NIR
60, 50, 39 Mpx
118, 98, 76 Mpx
175, 145, 112 Mpx
235, 191, 145 Mpx
60, 50, 39 Mpx
6, 6, 6.8
LA
RG
E F
OR
MA
T
Z/I Imaging
DMC II 250 Frame
4 PAN
4 MS
PAN,
RGB, NIR
PAN: 250 Mpx (17,216 × 14,656 px)
MS: 4 × 42 Mpx (6,846 × 6,096 px)
5.6
7.2
Microsoft/Vexcel
UltraCam Xp
Frame 9 PAN
4 MS
PAN,
RGB, NIR
PAN: 196 Mpx (17,310 × 11,310 px)
MS: 22 Mpx (5,770 × 3,770 px)
6
6
Leica ADS-80 Linear 4 PAN
4 MS
PAN,
RGB, NIR 12,000 px per line 6.5
Remote Sens. 2011, 3
1114
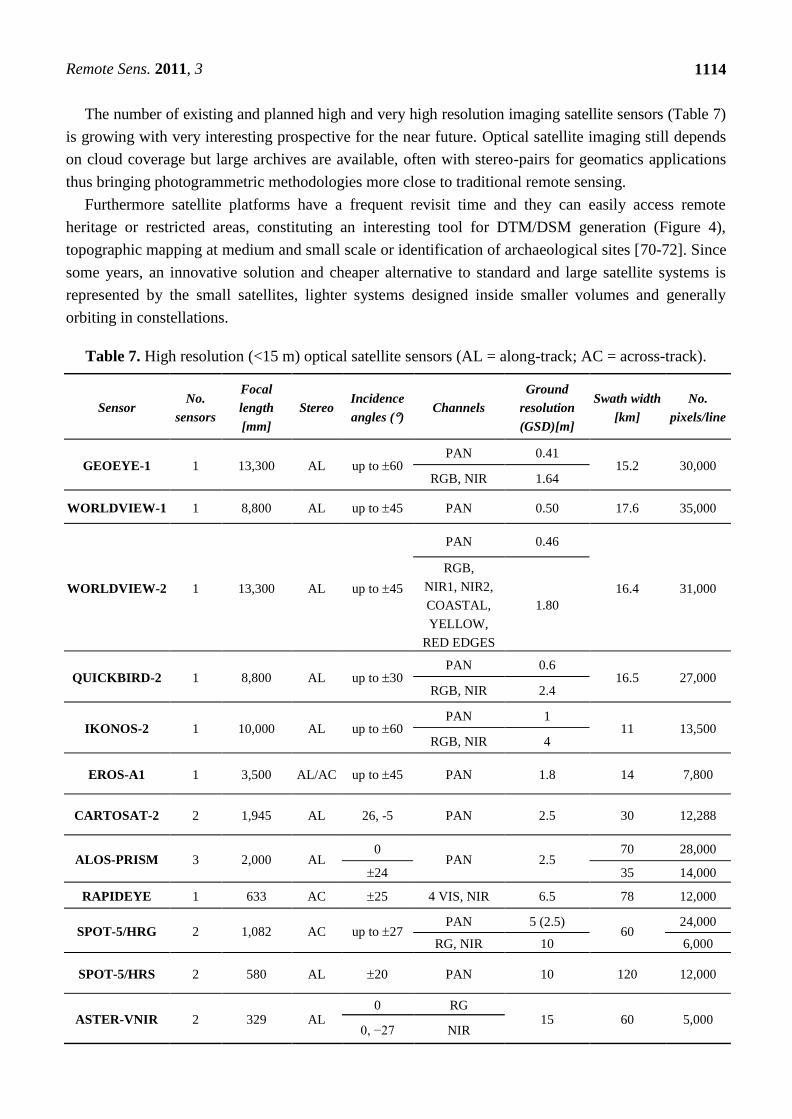
The number of existing and planned high and very high resolution imaging satellite sensors (Table 7)
is growing with very interesting prospective for the near future. Optical satellite imaging still depends
on cloud coverage but large archives are available, often with stereo-pairs for geomatics applications
thus bringing photogrammetric methodologies more close to traditional remote sensing.
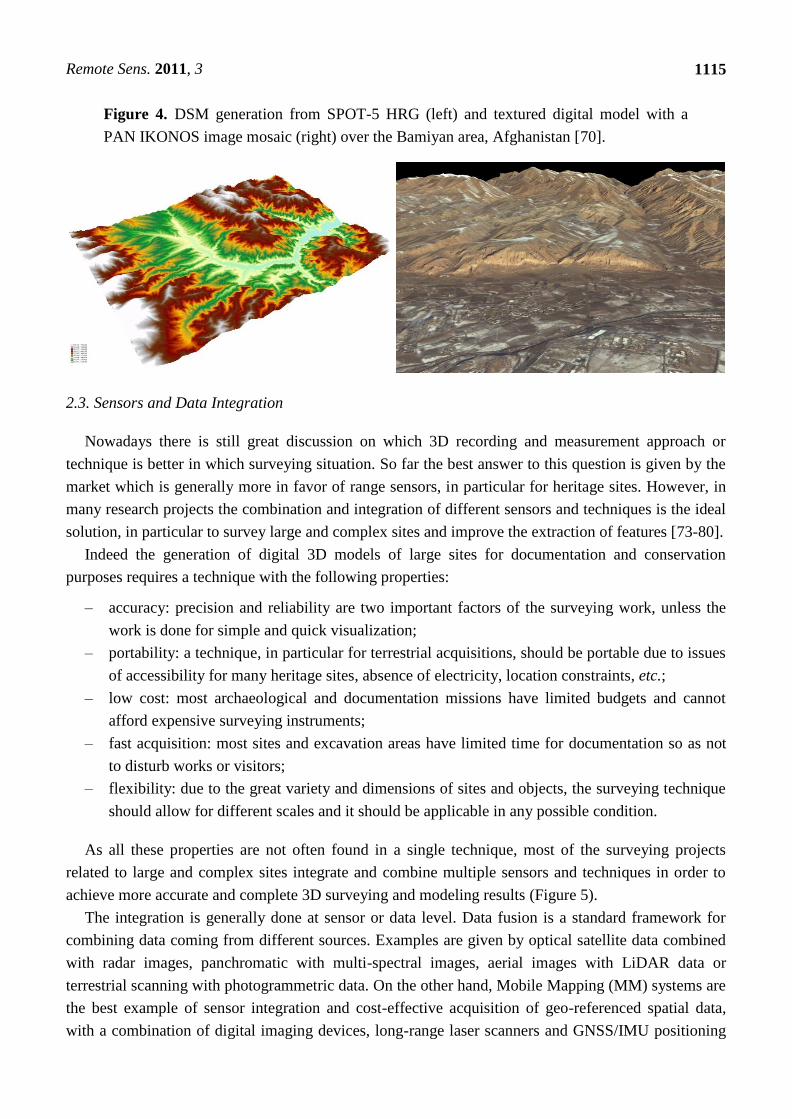
Furthermore satellite platforms have a frequent revisit time and they can easily access remote
heritage or restricted areas, constituting an interesting tool for DTM/DSM generation (Figure 4),
topographic mapping at medium and small scale or identification of archaeological sites [70-72]. Since
some years, an innovative solution and cheaper alternative to standard and large satellite systems is
represented by the small satellites, lighter systems designed inside smaller volumes and generally
orbiting in constellations.
Table 7. High resolution (<15 m) optical satellite sensors (AL = along-track; AC = across-track).
Sensor No.
sensors
Focal
length
[mm]
Stereo Incidence
angles () Channels
Ground
resolution
(GSD)[m]
Swath width
[km]
No.
pixels/line
GEOEYE-1 1 13,300 AL up to 60 PAN 0.41
15.2 30,000 RGB, NIR 1.64
WORLDVIEW-1 1 8,800 AL up to 45 PAN 0.50 17.6 35,000
WORLDVIEW-2 1 13,300 AL up to 45
PAN 0.46
16.4 31,000
RGB,
NIR1, NIR2,
COASTAL,
YELLOW,
RED EDGES
1.80
QUICKBIRD-2 1 8,800 AL up to 30 PAN 0.6
16.5 27,000 RGB, NIR 2.4
IKONOS-2 1 10,000 AL up to 60 PAN 1
11 13,500 RGB, NIR 4
EROS-A1 1 3,500 AL/AC up to 45 PAN 1.8 14 7,800
CARTOSAT-2 2 1,945 AL 26, -5 PAN 2.5 30 12,288
ALOS-PRISM 3 2,000 AL 0
PAN 2.5 70 28,000
24 35 14,000
RAPIDEYE 1 633 AC 25 4 VIS, NIR 6.5 78 12,000
SPOT-5/HRG 2 1,082 AC up to 27 PAN 5 (2.5)
60 24,000
RG, NIR 10 6,000
SPOT-5/HRS 2 580 AL 20 PAN 10 120 12,000
ASTER-VNIR 2 329 AL 0 RG
15 60 5,000 0, −27 NIR
Remote Sens. 2011, 3
1115
Figure 4. DSM generation from SPOT-5 HRG (left) and textured digital model with a
PAN IKONOS image mosaic (right) over the Bamiyan area, Afghanistan [70].
2.3. Sensors and Data Integration
Nowadays there is still great discussion on which 3D recording and measurement approach or
technique is better in which surveying situation. So far the best answer to this question is given by the
market which is generally more in favor of range sensors, in particular for heritage sites. However, in
many research projects the combination and integration of different sensors and techniques is the ideal
solution, in particular to survey large and complex sites and improve the extraction of features [73-80].
Indeed the generation of digital 3D models of large sites for documentation and conservation
purposes requires a technique with the following properties:
– accuracy: precision and reliability are two important factors of the surveying work, unless the
work is done for simple and quick visualization;
– portability: a technique, in particular for terrestrial acquisitions, should be portable due to issues
of accessibility for many heritage sites, absence of electricity, location constraints, etc.;
– low cost: most archaeological and documentation missions have limited budgets and cannot
afford expensive surveying instruments;
– fast acquisition: most sites and excavation areas have limited time for documentation so as not
to disturb works or visitors;
– flexibility: due to the great variety and dimensions of sites and objects, the surveying technique
should allow for different scales and it should be applicable in any possible condition.
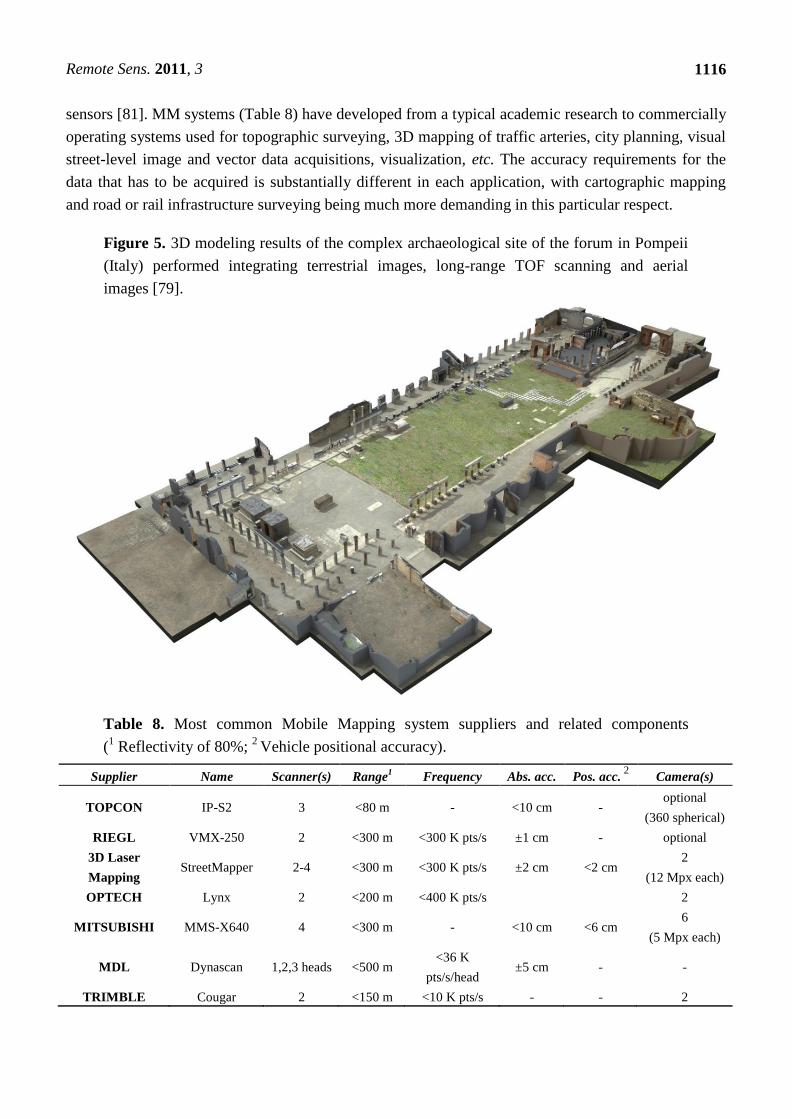
As all these properties are not often found in a single technique, most of the surveying projects
related to large and complex sites integrate and combine multiple sensors and techniques in order to
achieve more accurate and complete 3D surveying and modeling results (Figure 5).
The integration is generally done at sensor or data level. Data fusion is a standard framework for
combining data coming from different sources. Examples are given by optical satellite data combined
with radar images, panchromatic with multi-spectral images, aerial images with LiDAR data or
terrestrial scanning with photogrammetric data. On the other hand, Mobile Mapping (MM) systems are
the best example of sensor integration and cost-effective acquisition of geo-referenced spatial data,
with a combination of digital imaging devices, long-range laser scanners and GNSS/IMU positioning
Remote Sens. 2011, 3
1116
sensors [81]. MM systems (Table 8) have developed from a typical academic research to commercially
operating systems used for topographic surveying, 3D mapping of traffic arteries, city planning, visual
street-level image and vector data acquisitions, visualization, etc. The accuracy requirements for the
data that has to be acquired is substantially different in each application, with cartographic mapping
and road or rail infrastructure surveying being much more demanding in this particular respect.
Figure 5. 3D modeling results of the complex archaeological site of the forum in Pompeii
(Italy) performed integrating terrestrial images, long-range TOF scanning and aerial
images [79].
Table 8. Most common Mobile Mapping system suppliers and related components
(1 Reflectivity of 80%;
2 Vehicle positional accuracy).
Supplier Name Scanner(s) Range1 Frequency Abs. acc. Pos. acc.
2 Camera(s)
TOPCON IP-S2 3 <80 m - <10 cm - optional
(360 spherical)
RIEGL VMX-250 2 <300 m <300 K pts/s ±1 cm - optional
3D Laser
Mapping StreetMapper 2-4 <300 m <300 K pts/s ±2 cm <2 cm
2
(12 Mpx each)
OPTECH Lynx 2 <200 m <400 K pts/s 2
MITSUBISHI MMS-X640 4 <300 m - <10 cm <6 cm 6
(5 Mpx each)
MDL Dynascan 1,2,3 heads <500 m <36 K
pts/s/head ±5 cm - -
TRIMBLE Cougar 2 <150 m <10 K pts/s - - 2
Remote Sens. 2011, 3
1117
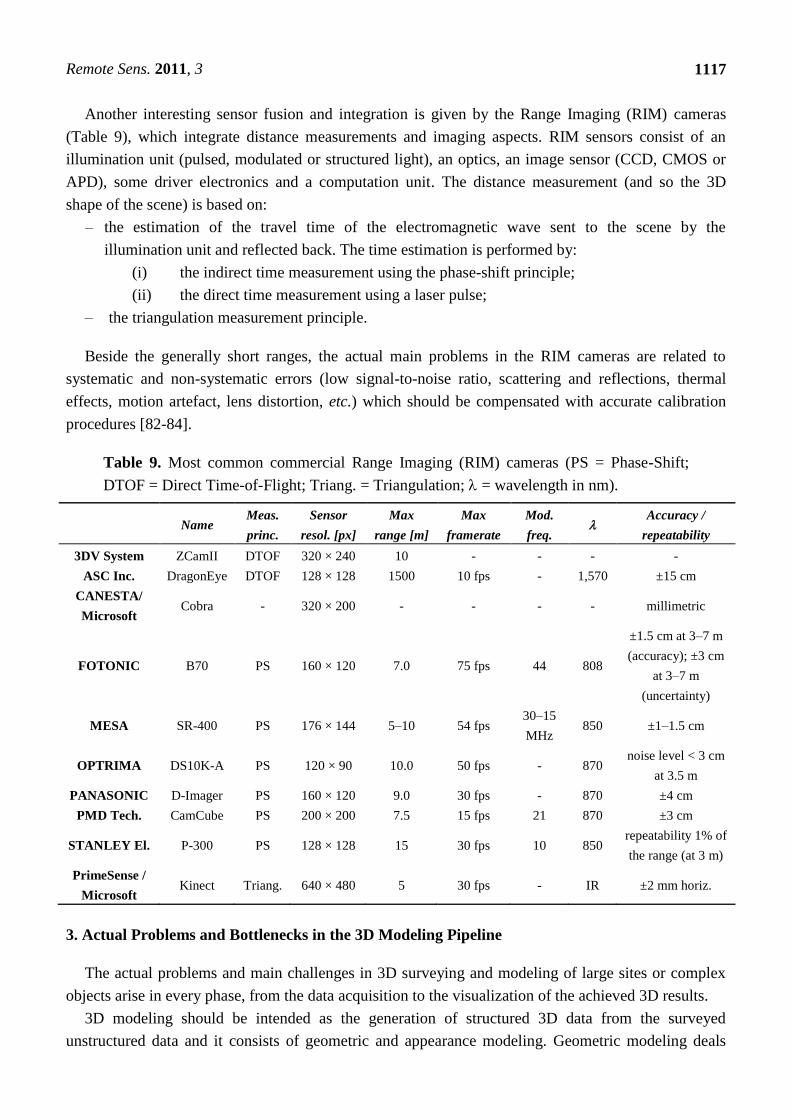
Another interesting sensor fusion and integration is given by the Range Imaging (RIM) cameras
(Table 9), which integrate distance measurements and imaging aspects. RIM sensors consist of an
illumination unit (pulsed, modulated or structured light), an optics, an image sensor (CCD, CMOS or
APD), some driver electronics and a computation unit. The distance measurement (and so the 3D
shape of the scene) is based on:
– the estimation of the travel time of the electromagnetic wave sent to the scene by the
illumination unit and reflected back. The time estimation is performed by:
(i) the indirect time measurement using the phase-shift principle;
(ii) the direct time measurement using a laser pulse;
– the triangulation measurement principle.
Beside the generally short ranges, the actual main problems in the RIM cameras are related to
systematic and non-systematic errors (low signal-to-noise ratio, scattering and reflections, thermal
effects, motion artefact, lens distortion, etc.) which should be compensated with accurate calibration
procedures [82-84].
Table 9. Most common commercial Range Imaging (RIM) cameras (PS = Phase-Shift;
DTOF = Direct Time-of-Flight; Triang. = Triangulation; = wavelength in nm).
Name Meas.
princ.
Sensor
resol. [px]
Max
range [m]
Max
framerate
Mod.
freq.
Accuracy /
repeatability
3DV System ZCamII DTOF 320 × 240 10 - - - -
ASC Inc. DragonEye DTOF 128 × 128 1500 10 fps - 1,570 ±15 cm
CANESTA/
Microsoft Cobra - 320 × 200 - - - - millimetric
FOTONIC B70 PS 160 × 120 7.0 75 fps 44 808
±1.5 cm at 3–7 m
(accuracy); ±3 cm
at 3–7 m
(uncertainty)
MESA SR-400 PS 176 × 144 5–10 54 fps 30–15
MHz 850 ±1–1.5 cm
OPTRIMA DS10K-A PS 120 × 90 10.0 50 fps - 870 noise level < 3 cm
at 3.5 m
PANASONIC D-Imager PS 160 × 120 9.0 30 fps - 870 ±4 cm
PMD Tech. CamCube PS 200 × 200 7.5 15 fps 21 870 ±3 cm
STANLEY El. P-300 PS 128 × 128 15 30 fps 10 850 repeatability 1% of
the range (at 3 m)
PrimeSense /
Microsoft Kinect Triang. 640 × 480 5 30 fps - IR ±2 mm horiz.
3. Actual Problems and Bottlenecks in the 3D Modeling Pipeline
The actual problems and main challenges in 3D surveying and modeling of large sites or complex
objects arise in every phase, from the data acquisition to the visualization of the achieved 3D results.
3D modeling should be intended as the generation of structured 3D data from the surveyed
unstructured data and it consists of geometric and appearance modeling. Geometric modeling deals
Remote Sens. 2011, 3
1118
with the data registration and processing (editing, cleaning, meshing), while appearance modeling
deals with texturing, blending, rendering simplification and LOD. The entire 3D modeling pipeline is
generally a chain of lossy procedures and data transformations performed to derive new products thus
the operator and employed algorithms must assure the lossy procedure is as late as possible in the
processing chain.
The term ―3D modeling‖ is more common in case of terrestrial applications while in the aerial
domain it is more frequently used the term ―mapping‖. As nowadays there is a clear convergence of
photogrammetric methodologies into the typical remote sensing domain and the new data processing
algorithms are delivering really remarkable 3D models, the ―3D mapping‖ concept should also stressed
in order to move from the traditional 2D and 2.5D mapping to fully 3D products even at topographic
and urban level. The BIM (Building Information Modeling) concept is going in this direction trying to
manage building data integrating geometries, spatial relationships, geographic information, quantities
and further geometric or semantic properties [85].
Despite all the available remote sensing technologies and potentialities, the 3D modeling pipeline
has still some problems and challenges in:
(i) selecting the appropriate methodology (sensor, hardware, software) and data processing
procedure;
(ii) designing the proper production workflow, guaranteeing that the final result is in accordance
with all the given technical specifications;
(iii) speeding up the data processing time with as much automation as possible but always with the
accuracy as primary goal;
(iv) being able to fluently display and interact with the achieved 3D model.
3.1. Data Acquisition
3.1.1. Digital Images
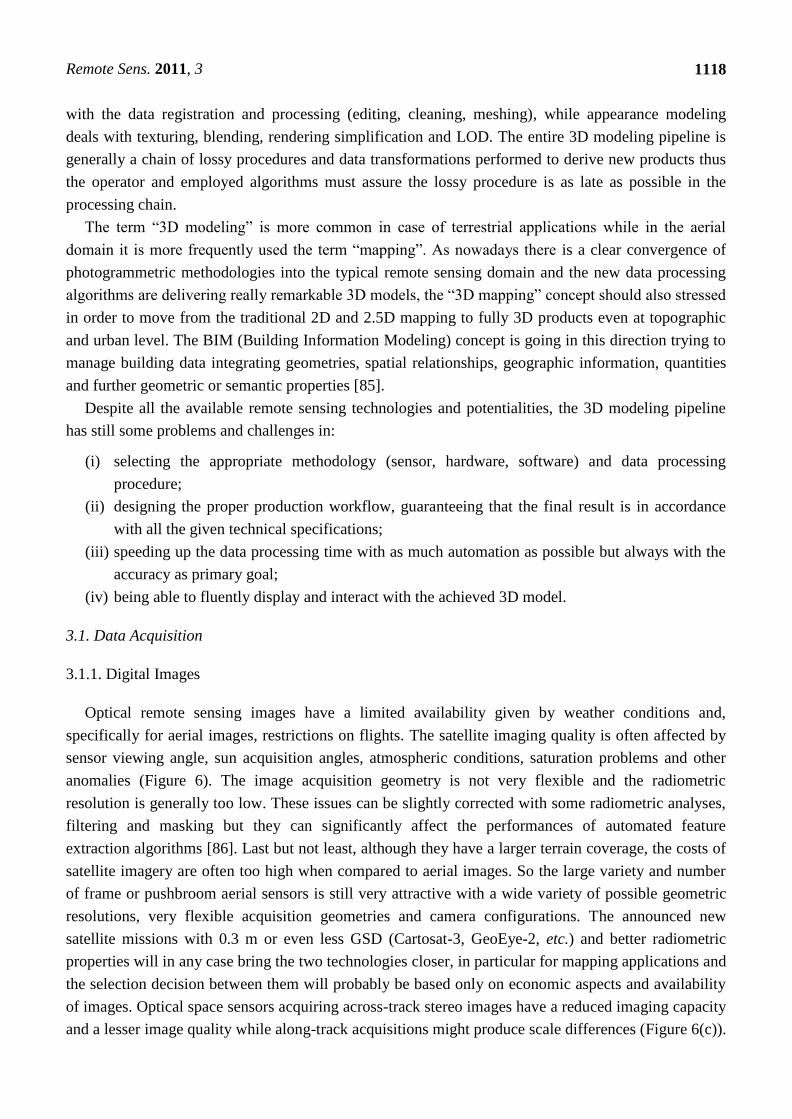
Optical remote sensing images have a limited availability given by weather conditions and,
specifically for aerial images, restrictions on flights. The satellite imaging quality is often affected by
sensor viewing angle, sun acquisition angles, atmospheric conditions, saturation problems and other
anomalies (Figure 6). The image acquisition geometry is not very flexible and the radiometric
resolution is generally too low. These issues can be slightly corrected with some radiometric analyses,
filtering and masking but they can significantly affect the performances of automated feature
extraction algorithms [86]. Last but not least, although they have a larger terrain coverage, the costs of
satellite imagery are often too high when compared to aerial images. So the large variety and number
of frame or pushbroom aerial sensors is still very attractive with a wide variety of possible geometric
resolutions, very flexible acquisition geometries and camera configurations. The announced new
satellite missions with 0.3 m or even less GSD (Cartosat-3, GeoEye-2, etc.) and better radiometric
properties will in any case bring the two technologies closer, in particular for mapping applications and
the selection decision between them will probably be based only on economic aspects and availability
of images. Optical space sensors acquiring across-track stereo images have a reduced imaging capacity
and a lesser image quality while along-track acquisitions might produce scale differences (Figure 6(c)).

Remote Sens. 2011, 3
1119
For all these reasons, only a limited number of high-resolution stereo images are available in provider
archives for fully automated and accurate DSM generation or feature extraction.
In terrestrial acquisitions, occlusions given by natural and man-made structures can cause a delay in
the data capturing or missing details and can force acquisitions with unfavorable baselines and network
geometry.
Figure 6. Typical artefacts and problems in satellite imagery (here a WorldView-2
stereo-pair): saturation (a), spilling (b) and scale (c).
(a) (b) (c)
3.1.2. Range Data
Airborne laser scanning (ALS) is composed of different components which contribute to the final
accuracy of the range data. All the components should be accurately calibrated and integrated. Discrete
echo laser scanners, using analogue detectors, record in real time a significant trigger signal for the
multiple echoes. On the other hand full-waveform scanners digitize the time-dependent variation of the
received echo for each emitted laser pulse. Thus they have both advantages and disadvantages and they
are suited for different applications. ALS acquisitions are partly weather-dependent (fog, wetness, etc.)
but they can also be done at night.
In terrestrial scanning, the size and location and the surface (geometry and material) of the surveyed
object can create several problems. Furthermore obstructions, rough or sloped surfaces, unfavorable
weather conditions, excessive ambient light, etc. can cause wrong measurements, acquisition delays or
enforce acquisitions from inadequate positions. The complexity of some parts can create
self-occlusions or holes in the surveying coverage, in addition to the occlusions from plants, trees,
restoration scaffolds or tourists. The absence of high platforms for a higher location of the data
acquisition might cause missing parts, e.g., for the roofs or upper parts of a monument. The object’s
material (e.g., marble) has often an important influence on the acquired range data since it can cause
penetration [87-89] or bad reflection effects. Moreover, transportability and usability problems arise in
certain field campaigns located in remote areas. Scene discontinuities and surface edges can also create
artefacts and blunders when surveyed with TOF laser scanners.
In order to compensate for any systematic errors, terrestrial range sensors need to be accurately
calibrated [90-92] following acceptance procedures for testing the accuracy and repeatability of the
measuring systems.
For both aerial and terrestrial acquisitions, the used sampled distance in scanning is rarely optimal
for the entire site or object, producing under sampled regions where edges and high curvature surfaces
are present and over-sampled regions where flat areas are. These problems affect the successive
modeling phase and the quality of the final 3D results.
Remote Sens. 2011, 3
1120
3.2. Data Processing, Feature Extraction and Point Cloud Generation
3.2.1. Digital Images
The sensor’s geometry of aerial and satellite imagery are generally recovered using the calibration
protocols, GNSS/INS observations or the Rational Polynomial Coefficients (RPCs). RPCs usually
provide for good relative orientation, while the absolute orientation has generally some systematic
errors represented by a shift in coordinates which need to be corrected. The collinearity model is valid
for frame cameras while for linear array sensors a different mathematical formulation should be
employed. Empirical models based on affine, projective or DLT transformation were proposed, finding
their main application in the processing of high resolution satellite imagery [93,94]. Using the RPCs or
precise GNSS/INS data, the sensor orientation and image triangulation can be done in a fully
automated way (direct geo-referencing). A bottleneck is the requirement and measurement of Ground
Control Points (GCPs) in order to increase the absolute geo-referencing accuracy.
As far as terrestrial images is concerning, digital cameras must be accurately calibrated, preferably
in a controlled lab environment, with a 3D testfield and a bundle adjustment solution with additional
parameters to fully compensate for systematic errors [95]. Generally a target-based approach is used,
in order to automatically identify and precisely measure the homologues points.
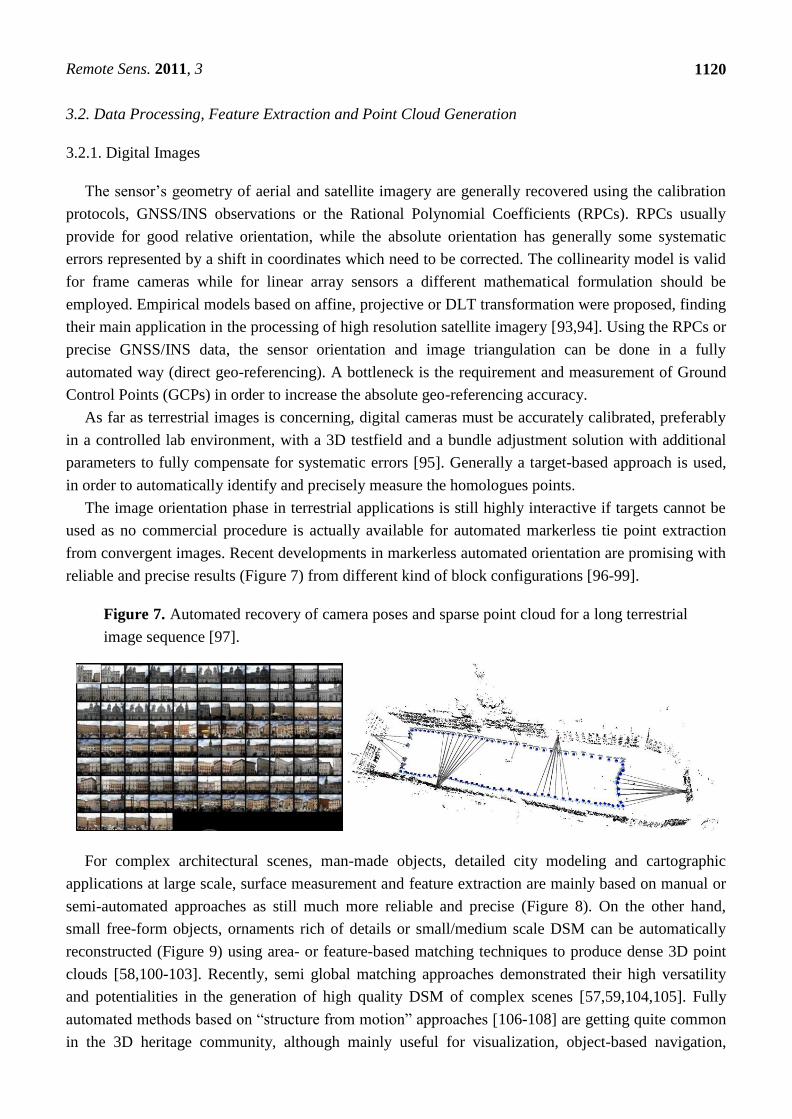
The image orientation phase in terrestrial applications is still highly interactive if targets cannot be
used as no commercial procedure is actually available for automated markerless tie point extraction
from convergent images. Recent developments in markerless automated orientation are promising with
reliable and precise results (Figure 7) from different kind of block configurations [96-99].
Figure 7. Automated recovery of camera poses and sparse point cloud for a long terrestrial
image sequence [97].
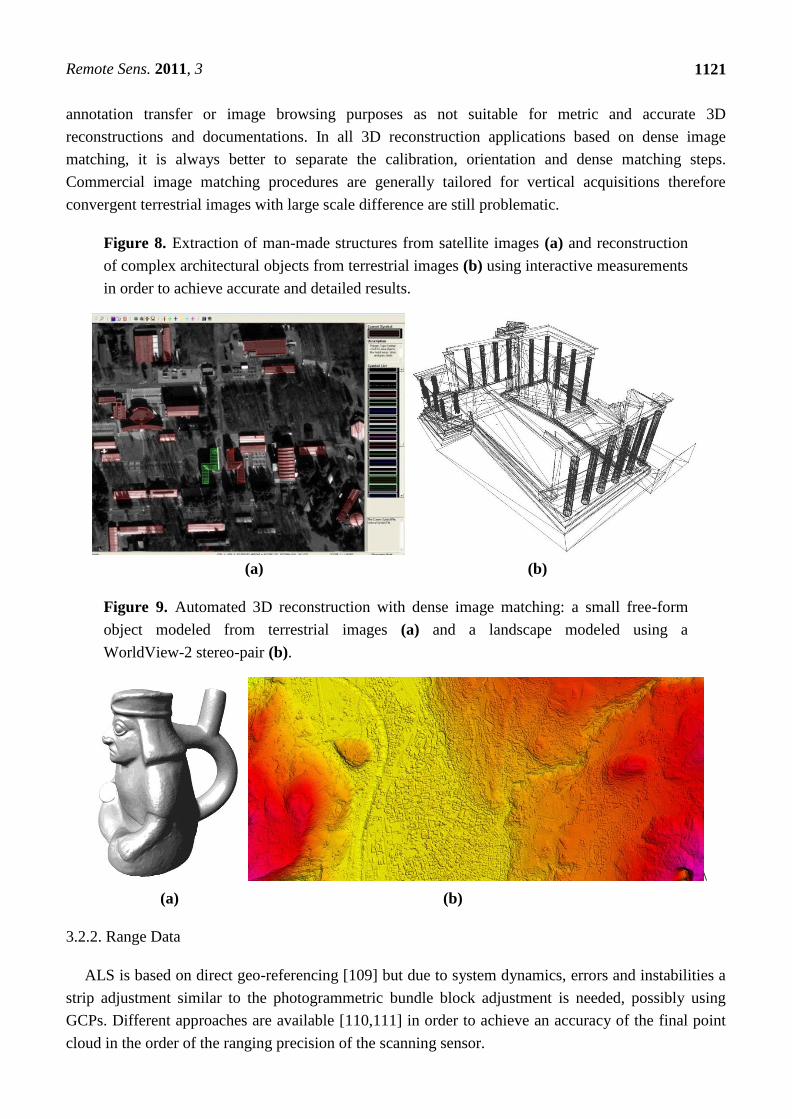
For complex architectural scenes, man-made objects, detailed city modeling and cartographic
applications at large scale, surface measurement and feature extraction are mainly based on manual or
semi-automated approaches as still much more reliable and precise (Figure 8). On the other hand,
small free-form objects, ornaments rich of details or small/medium scale DSM can be automatically
reconstructed (Figure 9) using area- or feature-based matching techniques to produce dense 3D point
clouds [58,100-103]. Recently, semi global matching approaches demonstrated their high versatility
and potentialities in the generation of high quality DSM of complex scenes [57,59,104,105]. Fully
automated methods based on ―structure from motion‖ approaches [106-108] are getting quite common
in the 3D heritage community, although mainly useful for visualization, object-based navigation,
Remote Sens. 2011, 3
1121
annotation transfer or image browsing purposes as not suitable for metric and accurate 3D
reconstructions and documentations. In all 3D reconstruction applications based on dense image
matching, it is always better to separate the calibration, orientation and dense matching steps.
Commercial image matching procedures are generally tailored for vertical acquisitions therefore
convergent terrestrial images with large scale difference are still problematic.
Figure 8. Extraction of man-made structures from satellite images (a) and reconstruction
of complex architectural objects from terrestrial images (b) using interactive measurements
in order to achieve accurate and detailed results.
(a) (b)
Figure 9. Automated 3D reconstruction with dense image matching: a small free-form
object modeled from terrestrial images (a) and a landscape modeled using a
WorldView-2 stereo-pair (b).
\
(a) (b)
3.2.2. Range Data
ALS is based on direct geo-referencing [109] but due to system dynamics, errors and instabilities a
strip adjustment similar to the photogrammetric bundle block adjustment is needed, possibly using
GCPs. Different approaches are available [110,111] in order to achieve an accuracy of the final point
cloud in the order of the ranging precision of the scanning sensor.
Remote Sens. 2011, 3
1122
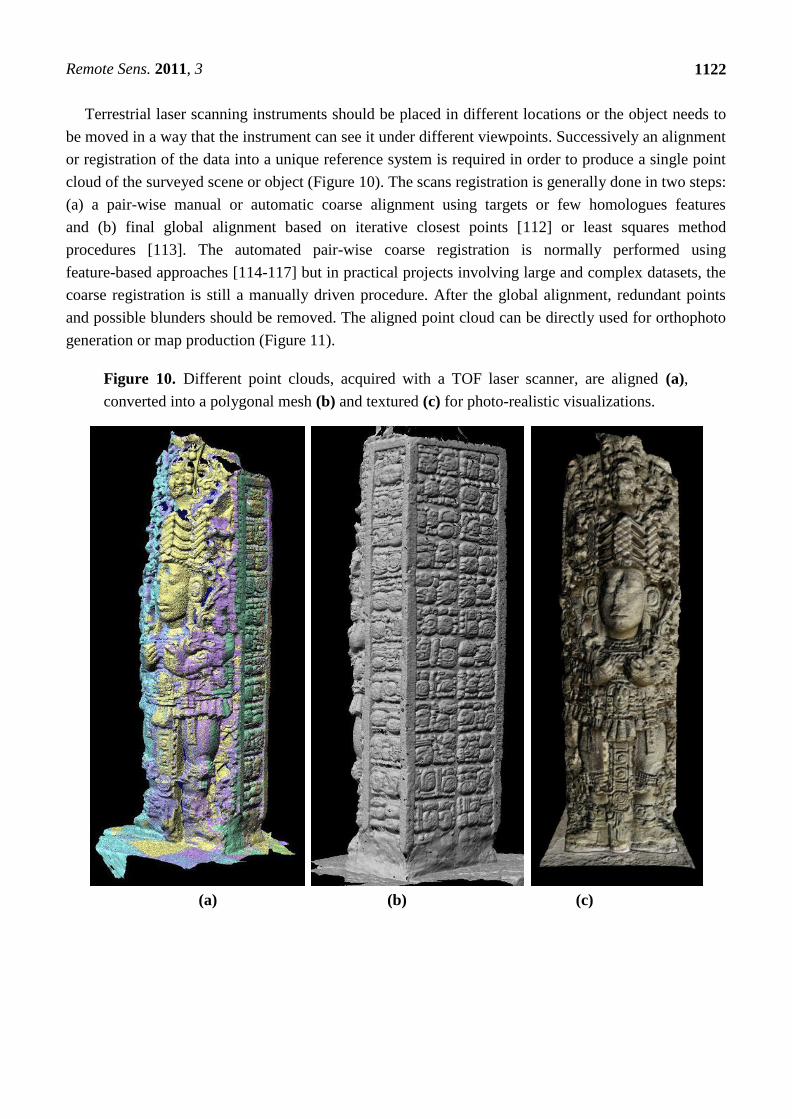
Terrestrial laser scanning instruments should be placed in different locations or the object needs to
be moved in a way that the instrument can see it under different viewpoints. Successively an alignment
or registration of the data into a unique reference system is required in order to produce a single point
cloud of the surveyed scene or object (Figure 10). The scans registration is generally done in two steps:
(a) a pair-wise manual or automatic coarse alignment using targets or few homologues features
and (b) final global alignment based on iterative closest points [112] or least squares method
procedures [113]. The automated pair-wise coarse registration is normally performed using
feature-based approaches [114-117] but in practical projects involving large and complex datasets, the
coarse registration is still a manually driven procedure. After the global alignment, redundant points
and possible blunders should be removed. The aligned point cloud can be directly used for orthophoto
generation or map production (Figure 11).
Figure 10. Different point clouds, acquired with a TOF laser scanner, are aligned (a),
converted into a polygonal mesh (b) and textured (c) for photo-realistic visualizations.
(a) (b) (c)
Remote Sens. 2011, 3
1123
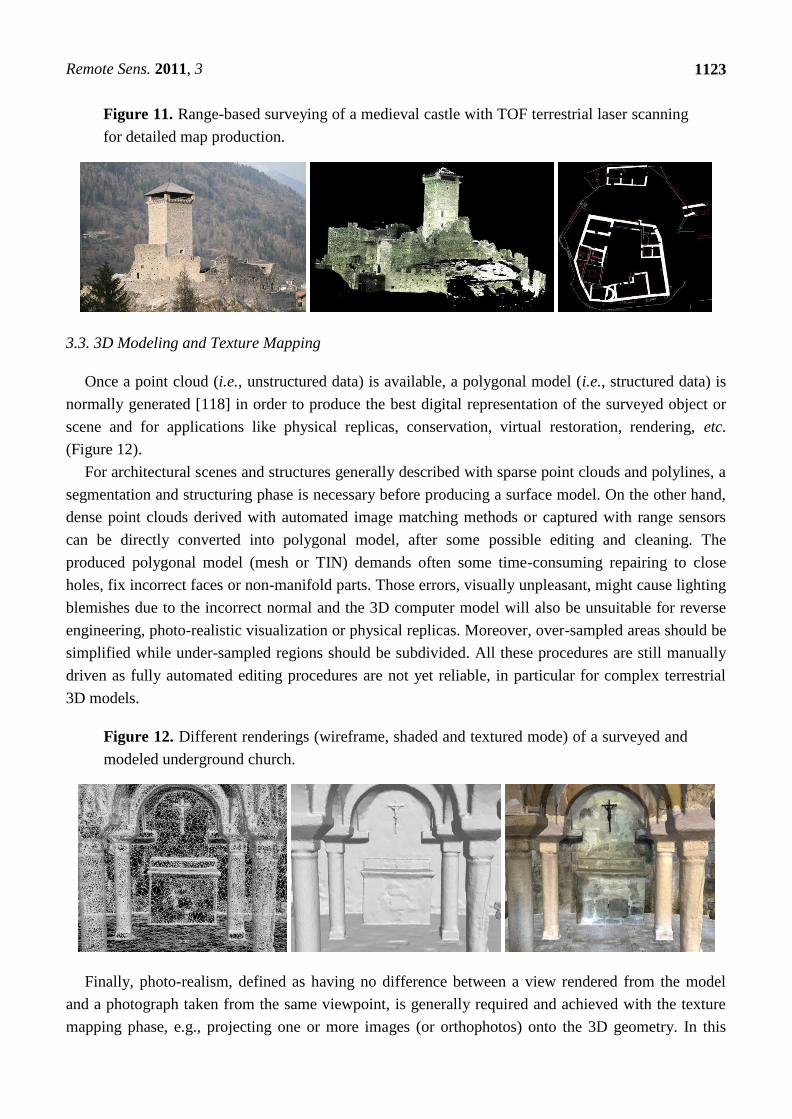
Figure 11. Range-based surveying of a medieval castle with TOF terrestrial laser scanning
for detailed map production.
3.3. 3D Modeling and Texture Mapping
Once a point cloud (i.e., unstructured data) is available, a polygonal model (i.e., structured data) is
normally generated [118] in order to produce the best digital representation of the surveyed object or
scene and for applications like physical replicas, conservation, virtual restoration, rendering, etc.
(Figure 12).
For architectural scenes and structures generally described with sparse point clouds and polylines, a
segmentation and structuring phase is necessary before producing a surface model. On the other hand,
dense point clouds derived with automated image matching methods or captured with range sensors
can be directly converted into polygonal model, after some possible editing and cleaning. The
produced polygonal model (mesh or TIN) demands often some time-consuming repairing to close
holes, fix incorrect faces or non-manifold parts. Those errors, visually unpleasant, might cause lighting
blemishes due to the incorrect normal and the 3D computer model will also be unsuitable for reverse
engineering, photo-realistic visualization or physical replicas. Moreover, over-sampled areas should be
simplified while under-sampled regions should be subdivided. All these procedures are still manually
driven as fully automated editing procedures are not yet reliable, in particular for complex terrestrial
3D models.
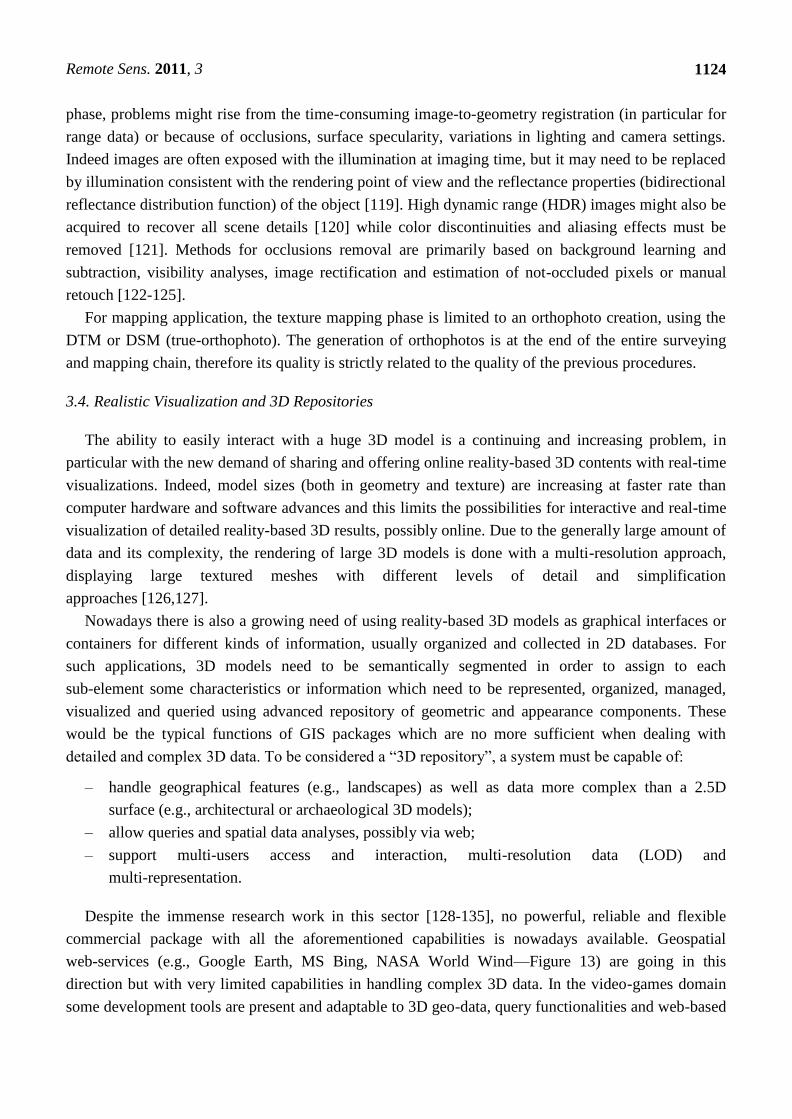
Figure 12. Different renderings (wireframe, shaded and textured mode) of a surveyed and
modeled underground church.
Finally, photo-realism, defined as having no difference between a view rendered from the model
and a photograph taken from the same viewpoint, is generally required and achieved with the texture
mapping phase, e.g., projecting one or more images (or orthophotos) onto the 3D geometry. In this
Remote Sens. 2011, 3
1124
phase, problems might rise from the time-consuming image-to-geometry registration (in particular for
range data) or because of occlusions, surface specularity, variations in lighting and camera settings.
Indeed images are often exposed with the illumination at imaging time, but it may need to be replaced
by illumination consistent with the rendering point of view and the reflectance properties (bidirectional
reflectance distribution function) of the object [119]. High dynamic range (HDR) images might also be
acquired to recover all scene details [120] while color discontinuities and aliasing effects must be
removed [121]. Methods for occlusions removal are primarily based on background learning and
subtraction, visibility analyses, image rectification and estimation of not-occluded pixels or manual
retouch [122-125].
For mapping application, the texture mapping phase is limited to an orthophoto creation, using the
DTM or DSM (true-orthophoto). The generation of orthophotos is at the end of the entire surveying
and mapping chain, therefore its quality is strictly related to the quality of the previous procedures.
3.4. Realistic Visualization and 3D Repositories
The ability to easily interact with a huge 3D model is a continuing and increasing problem, in
particular with the new demand of sharing and offering online reality-based 3D contents with real-time
visualizations. Indeed, model sizes (both in geometry and texture) are increasing at faster rate than
computer hardware and software advances and this limits the possibilities for interactive and real-time
visualization of detailed reality-based 3D results, possibly online. Due to the generally large amount of
data and its complexity, the rendering of large 3D models is done with a multi-resolution approach,
displaying large textured meshes with different levels of detail and simplification
approaches [126,127].
Nowadays there is also a growing need of using reality-based 3D models as graphical interfaces or
containers for different kinds of information, usually organized and collected in 2D databases. For
such applications, 3D models need to be semantically segmented in order to assign to each
sub-element some characteristics or information which need to be represented, organized, managed,
visualized and queried using advanced repository of geometric and appearance components. These
would be the typical functions of GIS packages which are no more sufficient when dealing with
detailed and complex 3D data. To be considered a ―3D repository‖, a system must be capable of:
– handle geographical features (e.g., landscapes) as well as data more complex than a 2.5D
surface (e.g., architectural or archaeological 3D models);
– allow queries and spatial data analyses, possibly via web;
– support multi-users access and interaction, multi-resolution data (LOD) and
multi-representation.
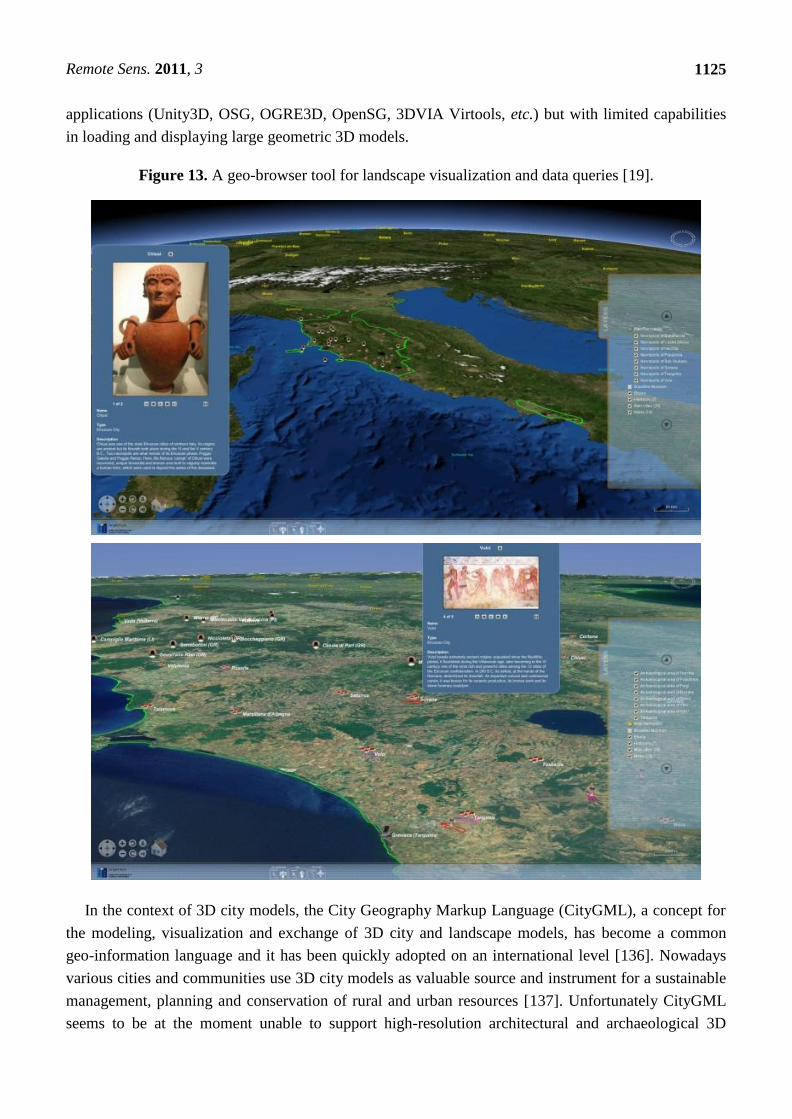
Despite the immense research work in this sector [128-135], no powerful, reliable and flexible
commercial package with all the aforementioned capabilities is nowadays available. Geospatial
web-services (e.g., Google Earth, MS Bing, NASA World Wind—Figure 13) are going in this
direction but with very limited capabilities in handling complex 3D data. In the video-games domain
some development tools are present and adaptable to 3D geo-data, query functionalities and web-based
Remote Sens. 2011, 3
1125
applications (Unity3D, OSG, OGRE3D, OpenSG, 3DVIA Virtools, etc.) but with limited capabilities
in loading and displaying large geometric 3D models.
Figure 13. A geo-browser tool for landscape visualization and data queries [19].
In the context of 3D city models, the City Geography Markup Language (CityGML), a concept for
the modeling, visualization and exchange of 3D city and landscape models, has become a common
geo-information language and it has been quickly adopted on an international level [136]. Nowadays
various cities and communities use 3D city models as valuable source and instrument for a sustainable
management, planning and conservation of rural and urban resources [137]. Unfortunately CityGML
seems to be at the moment unable to support high-resolution architectural and archaeological 3D
Remote Sens. 2011, 3
1126
models as the supported geometric entities are still limited to more simple and standard representations
but some Application Domain Extensions (ADE) are available or under development.
3.5. Standards
The tables reported in the previous sections with the sensor characteristics are probably incomplete
and soon out-of-date. However, the main problem when collecting and searching for this information
is the lack of standards and a common terminology, in particular in the range sensors community.
Many new users are approaching these methodologies while other not really familiar with them require
clear statements and information about an optical 3D measurement system before investing. Thus
technical standards, like those available for the traditional surveying or CMM field, must be created
and adopted, in particular by all vendors. Indeed most of the specifications of commercial sensors
contain parameters internally defined by the companies. Apart from standards, comparative data and
best practices are also needed, to show not only advantages but also limitations of systems and
software.
All the optical 3D measuring systems need to be independently certified using acceptance
procedures for testing the accuracy and repeatability of the acquisition and measuring systems.
Standard quality parameters like flatness measurement error, sphere diameter, spacing error,
traceability of data products, etc. should be used to verify whether or not a measuring system complies
with the required technical specifications.
The ISO/TC 211 ―Geographic information/Geomatics‖ has launched the project ISO 19159
―Calibration and Validation of remote sensing imagery sensors and data‖ [138].
The German VDI/VDE 2634 contains acceptance testing and monitoring procedures for evaluating
the accuracy of close-range optical 3D measuring systems. The American Society for Testing and
Materials (ASTM) with its E57 standards committee has also developed standards for 3D imaging
systems for applications like surveying, preservation, construction, etc.
4. Main Research Issues
Despite the great availability of active and passive remote sensing sensors and the large use in the
daily 3D documentation and mapping work, many key issues and challenges arise from:
– New sensors and platforms: new digital sensors and technologies are frequently coming on the
market but the software to process the acquired data is generally coming much later. Furthermore there
are very few packages able to simultaneously deal with different sensors (and data). The development
and use of new sensors requires the study and test of innovative sensor models and the investigation of
the related network structures and accuracy performance. UAV platforms need some improvements for
more reliable and fast acquisition procedures.
– Integration of sensors and data: there is an increasing use of hybrid sensors and platforms, in
order to collect as many different features as possible. The combination of different data sources
allows the creation of different geometric levels of detail (LoD) and the exploitation of the intrinsic
advantages of each sensor. The integration so far is mainly done at model-level (i.e., at the end of the
modeling pipeline) while it should be exploited also at data-level to overcome the weakness of each
data source.
Remote Sens. 2011, 3
1127
– Automated processing: automation in 3D data processing is one of the most important issues
when it comes to efficiency or costs at production level. At the moment, different research solution and
commercial packages have turned towards semi-automated approaches, where the human capacity in
data interpretation is paired with the speed and precision of computer algorithms. Indeed the success of
fully automation in image understanding or point clouds processing depends on many factors and is
still a hot topic of research. The progress is promising but the acceptance of fully automated
procedures, judged in terms of handled datasets and accuracy of the final 3D results, depends on the
quality specifications of the user and final use of the produced 3D model.
– On-line and real-time processing: in some applications there is a need for very fast processing
thus requiring new algorithmic implementation, sequential estimation, GPU and multi-core processing.
Internet is also helping a great deal in this sector and web-based processing tools for image analysis
and 3D model generation are available although limited to specific tasks and not ideal to collect CAD
data, metric information and accurate 3D models.
– Feature extraction: the extraction and derivation of geometric structures and semantic information
is a fundamental task in geomatics. The existing procedures require some improvements in order to
speed up the entire 3D restitution pipeline from images or range data. Images theoretically allow an
easier interpretation and extraction with respect to range data. An ideal solution should be able to
produce truly 3D geometries with attributes and topologies and it should have an internal quality
control procedure. A true sensor and data integration at an earlier point of the processing chain would
help the information extraction to be more reliable, precise and effective. However, it is not only
software that is missing, but also algorithms and methodologies.
– Improvement of geospatial data and content: users are more and more demanding data
completeness (in terms of coverage, quality, etc.) and a better accessibility (search, acquisition
information, metadata, etc.).
– Developments of new tools for non-expert users: although heritage 3D recording and
documentation should be an interdisciplinary task, clear protocols and user-friendly packages should
be released to facilitate the use of data processing techniques to non-technical users.
– Increase adoption of standard for data storage and exchange as well as sensor characterization.
5. Conclusions
This article affords an overview of the actual optical 3D measurements sensors and techniques used
for surveying, mapping, digital documentation and 3D modeling applications in the heritage field. The
actual problems in the reality-based 3D modeling pipeline as well as the main research issues in
photogrammetry and laser scanning were also reported. Examples, primarily from heritage sites and
objects, were also presented.
The continuous development of new sensors, data capture methodologies, multi-resolution 3D
representations and the improvement of existing 3D recording methods significantly contribute to the
documentation, conservation and presentation of heritage information and to the growth of research in
the heritage field. In case of heritage sites and objects, photogrammetry provides accurate 3D
reconstructions at different scales and for hybrid 3D models (e.g., terrain model plus archaeological or
building structures). 3D scanners have become a standard source for 3D data in many application areas

Remote Sens. 2011, 3
1128
and are often preferred, although not optimal. Originally developed as a major source of elevation data,
they are nowadays a very powerful source of 3D information and features. However, for large sites’
3D modeling, the best solution is the integration of image and range data.
Despite the fact that the 3D documentation is not yet the state-of-the-art in the heritage field, the
reported examples show the potentialities of the modern surveying technologies to digitally document
and preserve our landscape and heritage as well as share and manage them. Beside heritage
documentation, remote sensing technologies play a very important role for urban planning and 3D city
modeling, topographic mapping, natural hazard monitoring and analyses, geo-data visualization, car
navigation, virtual tourism, location-based services, industrial inspections, etc.
It is clear that the image-based 3D documentation approach, together with range sensors, geo-spatial
information systems, 3D modeling procedures, visualization and animation software are always in a
dynamic state of development, with even better application prospects for the near future. There is
certainly a geospatial convergence of technologies and needs with the availability and request of
geospatial contents in a large variety of formats and accessible through open development standards
and tools. The wider access to remote sensing and geospatial contents is creating a breed of non-expert
consumers who are using geospatial data in their daily life and for more effective decisions. The same
should apply for the entire heritage community who approach these technologies more frequently in
order to access a wider spectrum of applications and resources.
Conscious that new hardware and algorithm improvements are coming in the short period, the
impacts of all the reported developments and potentialities anyway pose some questions:
– How do we handle the increasing availability of images and range data? From a research point of
view this can only be seen as positive in photogrammetry and 3D scanning.
– How do we store and preserve geomatics data for the future? Existing data storage could be
unreadable in some years. Certainly some new technologies are being developed to accomplish higher
capacities per disk and higher data transfer rates.
– How do we share 3D information with non-expert communities demanding geomatics data? Lack
of appropriate software and education is often the source of misunderstandings and incorrect use of
sensors and 3D data thus the users’ needs (in particular archaeologists, conservators, heritage
managers, etc.) should always be taken into consideration.
– How do we store and share 3D models? The new development of web protocols, communication
systems and data sharing techniques are promising, but regulation and specifications are still missing.
– How do we critically compare optical 3D measurement techniques without a common
terminology for the sensors specifications?
– How do we cope with the competition from neighboring disciplines and communities which are
not really dealing with metrology and reality-based surveying? Hopefully our skills, flexibilities and
attitudes will help geomatics to survive and continue to be a beacon for many reality-based surveying
and 3D modeling issues.
Acknowledgements
The author would like to acknowledge the valuable support and feedbacks of Dario Conforti
(Optech Inc.), Gabriele Guidi (Politecnico of Milano, Italy), Armin Gruen (ETH Zurich, Switzerland),
Remote Sens. 2011, 3
1129
Francesco Holecz (Sarmap SA), Thomas Kersten (HCU Hamburg, Germany), Thomas Luhmann (Jade
Univ. of Applied Sciences, Germany), Dario Piatti (Politecnico of Torino, Italy), Daniela Poli (JRC
Ispra, Italy), Fulvio Rinaudo (Politecnico of Torino, Italy) and the entire 3DOM research unit of FBK
Trento, Italy.
References and Notes
1. Li, Z.; Chen, J.; Baltsavias, E. Advances in Photogrammetry, Remote Sensing and Spatial
Information Sciences; ISPRS Congress Book 2008; Taylor & Francis Group: London, UK, 2008;
p. 527.
2. Li, D.; Shan, J.; Gong, J. Geospatial Technology for Earth Observation; Springer: New York,
NY, USA, 2009; p. 558.
3. Levoy, M.; Pulli, K.; Curless, B.; Rusinkiewicz, S.; Koller, D.; Pereira, L.; Ginzton, M.;
Anderson, S.; Davis, J.; Ginsberg, J.; Shade, J.; Fulk, D. The Digital Michelangelo Project: 3D
Scanning of Large Statues. In Proceedings of SIGGRAPH ‟00, The 27th Internationl Conference
on Computer Graphics and Interactive Techniques Conference, New Orleans, LA, USA, 23–28
July 2000; pp. 131-144.
4. Bernardini, F.; Rushmeier, H.; Martin, I.M.; Mittleman, J.; Taubin, G. Building a digital model
of Michelangelo’s Florentine Pieta. IEEE Comput. Graph. Appl. 2002, 22, 59-67.
5. Gruen, A.; Remondino, F.; Zhang, L. Photogrammetric reconstruction of the Great Buddha of
Bamiyan. The Photogrammetric Record 2004, 19, 177-199.
6. Guidi. G.; Beraldin, J.A.; Atzeni, C. High accuracy 3D modelling of cultural heritage: The
digitizing of Donatello. IEEE Trans. Image Process. 2004, 13, 370-380.
7. El-Hakim, S.; Beraldin, J.; Remondino, F.; Picard, M.; Cournoyer, L.; Baltsavias, E. Using
Terrestrial Laser Scanning and Digital Images for the 3D Modelling of the Erechteion, Acropolis
of Athens. In Proceedings of DMACH Conference on Digital Media and its Applications in
Cultural Heritage, Amman, Jordan, 3–6 November 2008; pp. 3-16.
8. Remondino, F.; El-Hakim, S.; Girardi, S.; Rizzi, A.; Benedetti, S.; Gonzo, L. 3D Virtual
Reconstruction and Visualization of Complex Architectures—The 3D-ARCH Project. In
Proceedings of ISPRS International Workshop 3D-ARCH 2009 “3D Virtual Reconstruction and
Visualization of Complex Architectures”, Trento, Italy, 25–28 February 2009; Volume 38,
Part 5/W10.
9. Landrieu, J.; Père, C.; Rollier, J.; Castandet, S.; Schotte, G. Digital Rebirth of the Greatest
Church of Cluny maior Ecclesia: From Optronic Surveys to Real Time Use of the Digital Model.
In Proceedings of 4th ISPRS International Workshop 3D-ARCH 2011 “3D Virtual
Reconstruction and Visualization of Complex Architectures”, Trento, Italy, 2–4 March 2011;
Volume 38, Part 5/W16.
10. Cowley, D.C. Remote Sensing for Archaeological Heritage Management; EAC Occasional Paper
No. 5; Occasional Publication of the Aerial Archaeology Research Group No. 3; Europae
Archaeologiae Consilium: Budapest, Hungary, 2011; p. 307.
Remote Sens. 2011, 3
1130
11. Doneus, M.; Neubauer, W. 3D Laser Scanners on Archaeological Excavations. In Proceedings of
CIPA 2005 XX International Symposium, Torino, Italy, 26 September–1 October 2005; Volume
34(5/C34/1), pp. 226-231.
12. El-Hakim, S.; Gonzo, L.; Voltolini, F.; Girardi, S.; Rizzi, A.; Remondino, F.; Whiting, E.
Detailed 3D modelling of castles. Int. J. Architect. Comput. 2007, 5, 199-220.
13. Akca, D.; Remondino, F.; Novak, D.; Hanusch, T.; Schrotter, G.; Gruen, A. Recording and
Modelling of Cultural Heritage Objects with Coded Structured Light Projection Systems. In
Proceedings of 2nd International Conference on “Remote Sensing in Archaeology”, Rome,
Italy, 4–7 December 2006; pp. 375-382.
14. Remondino, F.; Rizzi, A.; Girardi, S.; Petti, F.; Avanzini, M. 3D ichnology—Recovering digital
3D models of dinosaur footprints. The Photogrammetric Record 2010, 25, 266-282.
15. Barcelo, A.; Forte, M.; Sanders, D.H. Virtual Reality in Archaeology; BAR International Series
843; Archeopress: Oxford, UK, 2000.
16. Bruno, F.; Bruno, S.; De Sensi, G.; Luchi, M.L.; Mancuso, S.; Muzzupappa, M. From 3D
reconstruction to virtual reality: A complete methodology for digital archaeological exhibition. J.
Cult. Herit. 2010, 11, 42-49.
17. Manferdini, A.M.; Remondino, F. Reality-Based 3D Modelling, Degmentation and Web-Based
Visualization. In Proceedings of EuroMed‟10 the Third International Conference on Digital
Heritage, Lemessos, Cyprus, 8–13 November 2010; pp. 110-124.
18. Fowles, P.S.; Larson, J.H.; Dean, C.; Solajic, M. The laser recording and virtual restoration of a
wooden sculpture of Buddha. J. Cult. Herit. 2003, 4, 367-371.
19. Remondino, F.; Rizzi, A.; Agugiaro, G.; Girardi, S.; De Amicis, R.; Magliocchetti, D.; Girardi,
G.; Baratti, G. Geomatics and Geoinformatics for Digital 3D Documentation, Fruition and
Valorization of Cultural Heritage. In Proceedings of EUROMED 2010 Workshop “Museum
Futures: Emerging Technological and Social Paradigms”, Lemessos, Cyprus, 8–13 November
2010.
20. Patias, P. Cultural heritage documentation. In Application of 3D Measurement from Images;
Fryer, J., Mitchell, H., Chandler, J., Eds.; Whittles: Dunbeath, UK, 2007; Volume 59, pp. 225-257.
21. Sansoni, G.; Trebeschi, M.; Docchio, F. State-of-the-art and applications of 3D imaging sensors
in industry, cultural heritage, medicine, and criminal investigation. Sensors 2009, 9, 568-601.
22. Rosen, P.A.; Hensley, S.; Joughin, I.R.; Li, F.K.; Madsen, S.N.; Rodriguez, E.; Goldstein, R.M.
Synthetic aperture radar interferometry. Proc. IEEE 2000, 88, 333-382.
23. Crosetto, M.; Crippa, B.; Biescas, E.; Monserrat, O.; Agudo, M.; Fernández, P. Land
deformation monitoring using SAR interferometry: State-of-the-art. Photogrammetrie,
Fernerkundung, Geoinformation 2005, 6, 497-510.
24. Crosetto, M.; Monserrat, O.; Herrera, G. Urban applications of persistent scatterer
interferometry. In Radar Remote Sensing on Urban Areas; Remote Sensing and Digital Image
Processing Series; Soergel, U., Ed.; Springer Science+Business Media B.V.: Berlin, Germany,
2010; Volume 15, pp. 233-246.
25. Yin, X.; Wonka, P.; Razdan, A. Generating 3D building models from architectural drawings.
IEEE Comput. Graph. Appl. 2009, 29, 20-30.
Remote Sens. 2011, 3
1131
26. Mueller, P.; Wonka, P.; Haegler, S.; Ulmer, A.; Van Gool, L. Procedural modelling of buildings.
ACM SIGGRAPH Trans. Graph. 2006, 25, 614-623.
27. Haegler, S.; Mueller, P.; Van Gool, L. Procedural modelling for digital Cultural Heritage.
EURASIP J. Image Video Process. 2009, doi:10.1155/2009/852392.
28. Vanegas, C.; Aliaga, D.; Benes, B. Building Reconstruction Using Manhattan-World Grammars.
In Proceedings of 23rd IEEE Conference on Computer Vision and Pattern Recognition 2010,
San Francisco, CA, USA, 13–18 June 2010; pp. 358-365.
29. Blais, F. A review of 20 years of range sensors development. J. Electron. Imag. 2004, 13, 231-240.
30. Shan, J.; Toth, C. Topographic Laser Ranging and Scanning: Principles and Processing; CRC:
Boca Raton, FL, USA, 2008; p. 590.
31. Vosselman, G.; Maas, H.-G. Airborne and Terrestrial Laser Scanning; CRC: Boca Raton, FL,
USA, 2010; p. 318.
32. Asmus, J.F. Holograph Interferometry of Painted Surface. In Proceedings of International
Congress on „Conservation of Wood, in Painting and the Decorative Arts‟, Oxford, UK, 17–23
September 1978; Volume IIC, pp. 141-144.
33. Boone, P.M. Diagnostic of Cultural Heritage by Holographic Interferometry. In Proceeings of
7th European Conference on Non-Destructive Testing, Copenhagen, Denmark, 26–29 May 1998.
34. Fontana, R.; Gambino, M.C.; Greco, M.; Marras, L.; Materazzi, M.; Pampaloni, E.; Pelagotti, A.;
Pezzati, L.; Poggi, P. 2D imaging and 3D sensing data acquisition and mutual registration for
painting conservation. Proc. SPIE 2005, 5665, 51-58.
35. Wehr, A.; Hemmleb, M.; Thomas, M.; Maierhofer, C. Moisture Detection on Building Surfaces
by Multi-Spectral Laser Scanning. In Proceedings of 8th Conference Optical 3-D Measurements
Techniques, Zurich, Switzerland, 9–12 July 2007.
36. Beraldin, A.; Rioux, M.; Cournoyer, L.; Blais, F.; Picard, M.; Pekelsky, J. Traceable 3D imaging
metrology. Proc. SPIE 2007, 6491, B.1–B–11.
37. Yu, A.W.; Krainak, M.A.; Harding, D.J.; Abshire, J.B.; Sun, X. A spaceborne lidar for
high-resolution topographic mapping of the earth’s surface. SPIE Newsroom 2010,
doi:10.1117/2.1201002.002655.
38. Pfeifer, N.; Briese, C. Geometric Aspect of Airborne Laser Scanning and Terrestrial Laser
Scanning. In Proceedings of ISPRS Workshop on Laser Scanning 2007 and SilviLaser 2007,
Espoo, Finland, 12–14 September 2007; Volume 36, Part 3/W52.
39. Mason, D.C.; Scott, T.R.; Wang, H.J. Extraction of tidal channel networks from airborne
scanning laser altimetry. ISPRS J. Photogramm. Remote Sens. 2006, 61, 67-83.
40. Dubayah, R.O.; Drake, J.B. Lidar remote sensing for forestry. J. Forest. 2000, 98, 44-46.
41. Nelson, R.; Parker, G.; Hom, M. A portable airborne laser system for forest inventory.
Photogramm. Eng. Remote Sensing 2003, 69, 267-273.
42. Chauve, A.; Vega, C.; Bretar, F.; Durrieu, S.; Allouis, T.; Pierrot-Deseilligny, M.; Puech, W.
Processing full-waveform LiDAR data in an alpine coniferous forest: Assessing terrain and tree
height quality. Int. J. Remote Sens. 2009, 30, 5211-5228.
43. Doneus, M.; Briese, C. Airborne laser scanning in forested areas—Potential and limitations of an
archaeological prospection technique. In EAC Remote Sensing for Archaeological Heritage
Management; Cowley, D., Ed.; EAC: Budapest, Hungary, 2011; pp. 59-76.
Remote Sens. 2011, 3
1132
44. Brenner, C. Building reconstruction from images and laser scanning. Int. J. Appl. Earth Obs.
Geoinf. 2005, 6, 187-198.
45. Clode, S.; Rottensteiner, F. Detection and vectorization of roads from LiDAR data.
Photogramm. Eng. Remote Sensing 2007, 73, 517-536.
46. Dorninger, P.; Pfeifer, N. A Comprehensive automated 3D approach for building extraction,
reconstruction and regularization from airborne laser scanning point clouds. Sensors 2008, 8,
7323-7343.
47. Remondino, F.; Zucca, F.; Agugiaro, G.; Rizzi, A.; Plos, D.; Sgrenzaroli, M. Mapping Vertical
Cliffs—Experiences from the Dolomites Mountains. In Proceedings of European Lidar Mapping
Forum, The Hague, The Netherlands, 30 November–1 December 2010.
48. Gruen, A.; Huang, T.S. Calibration and Orientation of Cameras in Computer Vision; Springer:
Berlin/Heidelberg, Germany, 2001; p. 239.
49. Sturm, P.; Ramalingam, S.; Tardif, J.-P.; Gasparini, S.; Barreto, J. Camera models and
fundamental concepts used in geometric Computer Vision. Found. Trend. Comput. Graph. Vis.
2011, 6, 1-183.
50. Remondino, F.; El-Hakim, S. Image-based 3D modelling: A review. The Photogrammetric
Record 2006, 21, 269-291.
51. Mikhail, E.; Bethel, J.; McGlone, J.C. Introduction to Modern Photogrammetry; Wiley: New
York, NY, USA, 2001; p. 496.
52. Luhmann, T.; Robson, S.; Kyle, S.; Hartley, I. Close Range Photogrammetry: Principles,
Techniques and Applications; Whittles: Dunbeath, UK, 2007; p. 528.
53. Hampel, U.; Maas, H.-G. Application of Digital Photogrammetry for Measuring Deformation
and Cracks during Load Tests in Civil Engineering Material Testing. In Proceedings of 6th
Conference on Optical 3D Measurement Techniques, Zurich, Switzerland, 22–25 September
2003; Volume II, pp. 80-88.
54. D’Apuzzo, N. Surface Measurement and Tracking of Human Body Parts from Multi Station
Video Sequences. Ph.D. Thesis, Institute of Geodesy and Photogrammetry, ETH Zurich, Zurich,
Switzerland, 2003.
55. Luhmann, Th. Close range photogrammetry for industrial applications. ISPRS J. Photogramm.
Remote Sens. 2010, 65, 558-569.
56. Gonzalez-Aguilera, D.; Gomez-Lahoz, J. Forensic terrestrial photogrammetry from a single
image. J. Forensic Sci. 2009, 54, 1376-1387
57. Hirschmuller, H. Stereo processing by semi-global matching and mutual information. IEEE
Trans. Patt. Anal. Mach. Intell. 2008, 30, 328-341.
58. Remondino, F.; El-Hakim, S.; Gruen, A.; Zhang, L. Turning images into 3D
models—Development and performance analysis of image matching for detailed surface
reconstruction of heritage objects. IEEE Sig. Process. Mag. 2008, 25, 55-65.
59. Vu, H.H.; Keriven, R.; Labatut, P.; Pons, J.-P. Towards High-Resolution Large-Scale
Multi-View Stereo. In Proceedings of Computer Vision & Pattern Recognition 2009, Miami
Beach, FL, USA, 20–25 June 2009.
Remote Sens. 2011, 3
1133
60. Maas, H.-G. Close-range photogrammetry sensors. In Advances in Photogrammetry, Remote
Sensing and Spatial Information Science: 2008 ISPRS Congress Book; CRC Press: Boca Raton,
FL, USA, 2008; pp. 63-72.
61. Akca, D.; Gruen, A. Comparative geometric and radiometric evaluation of mobile phone and still
video cameras. The Photogrammetric Record 2009, 24, 217-245.
62. Luhmann, T. A Historical Review on Panorama Imagery. In Proceedings of ISPRS Workshop on
Panorama Photogrammetry, Dresden, Germany, 19–22 February 2004; Volume 34, Part 5/W16.
63. Luhmann, T.; Tecklenburg, W. 3-D Object Reconstruction from Multiple-Station Panorama
Imagery. In Proceedings of ISPRS Workshop on Panorama Photogrammetry, Dresden,
Germany, 19–22 February 2004; Volume 34, Part 5/W16.
64. Parian, J.A.; Gruen, A. An Advanced Sensor Model for Panoramic Cameras. In Proceedings of
XXth ISPRS Congress, Istanbul, Turkey, 12–23 July 2004; Volume 35, Part 5, pp. 24-29.
65. Schneider, D.; Maas, H.-G. Application and Accuracy Potential of a Strict Geometrical Model
for Rotating Line Cameras. In Proceedings of ISPRS Workshop on Panorama Photogrammetry,
Dresden, Germany, 19–22 February 2004; Volume 34, Part 5/W16.
66. Fangi, G. The Multi-Image Spherical Panoramas as a Tool for Architectural Survey. In
Proceedings of the XXI International CIPA Symposium, Athens, Greece, 1–6 October 2007;
Volume 36, Part 5/C53.
67. Barazzetti, L.; Fangi, G.; Remondino, F.; Scaioni, M. Automation in Multi-Image Spherical
Photogrammetry for 3D Architectural Reconstructions. In Proceedings of the 11th International
Symposium on Virtual Reality, Archaeology and Cultural Heritage (VAST), Paris, France,
21–24 September 2010.
68. Sandau, R. Digital Airborne Camera: Introduction and Technology; Springer: Berlin/Heidelberg,
Germany, 2009; p. 338.
69. Eisenbeiss, H. UAV Photogrammetry. Ph.D. Thesis, Institute of Geodesy and Photogrammetry,
ETH Zurich, Zurich, Switzerland, 2009; p. 235.
70. Gruen, A.; Remondino, F.; Zhang, L. The Bamiyan project: Multi-resolution image-based
modeling. In Recording, Modeling and Visualization of Cultural Heritage; Baltsavias, M.,
Gruen, A., van Gool, L., Pateraki, M., Eds.; Taylor & Francis: London, UK, 2005; pp. 45-54.
71. Lasaponara, R.; Masini, N. On the potential of QuickBird data for archaeological prospection.
Int. J. Remote Sens. 2006, 27, 3607-3614.
72. Galiatsatos, N.; Donoghue, D.N.M.; Philip, G. High resolution elevation data derived from
stereoscopic CORONA imagery with minimal ground control: An approach using IKONOS and
SRTM data. Photogramm. Eng. Remote Sensing 2008, 74, 1093-1106.
73. Gamba, P.; Dell’Acqua, F.; Houshmand, B. Comparison and fusion of LIDAR and InSAR
Digital Elevation Models over urban areas. Int. J. Remote Sens. 2003, 24, 4289-4300.
74. Stumpfel, J.; Tchou, C.; Yun, N.; Martinez, P.; Hawkins, T.; Jones, A.; Emerson, B.; Debevec, P.
Digital reunification of the Parthenon and its sculptures. In Proceedings of the 4th International
Symposium on Virtual Reality, Archaeology and Intelligent Cultural Heritage (VAST), Brighton,
UK, November 2003; pp. 41-50.
75. Lisini, G.; Tison, C.; Tupin, F.; Gamba, P. Feature fusion to improve road network extraction in
high-resolution SAR images. IEEE Geosci. Remote Sens. Lett. 2006, 3, 217-221.
Remote Sens. 2011, 3
1134
76. Teo, T.-A.; Rau, J.-Y.; Chen, L.-C.; Liu, J.-K.; Hsu, W.-C. Reconstruction of complex buildings
using LIDAR and 2D maps. In Innovations in 3D Geo Information Systems; Lecture Notes in
Geoinformation and Cartography; Springer: Berlin/Heidelberg, Germany, 2006; Part 5,
pp. 345-354.
77. Roenholm, P.; Honkavaara, E.; Litkey, P.; Hyyppä, H.; Hyyppä, J. Integration of Laser Scanning
and Photogrammetry. In Proceedings of ISPRS Workshop on Laser Scanning 2007 and
SilviLaser 2007, Espoo, Finland, 12–14 September 2007; Volume 36, pp. 355-362.
78. Stamos, I.; Liu, L.; Chen, C.; Wolberg, G.; Yu, G.; Zokai, S. Integrating automated range
registration with multiview geometry for the photorealistic modelling of large-scale scenes.
Int. J. Comput. Vis. 2008, 78, 237-260.
79. Guidi, G.; Remondino, F.; Russo, M.; Menna, F.; Rizzi, A.; Ercoli, S. A multi-resolution
methodology for the 3D modelling of large and complex archaeological areas. Int. J. Architect.
Comput. 2009, 7, 40-55.
80. Gonzalez-Aguilera, D.; Muñoz-Nieto, A.; Rodriguez-Gonzalvez, P.; Menéndez, M. New tools
for rock art modelling: automated sensor integration in Pindal Cave. J. Archaeol. Sci. 2011, 38,
120-128.
81. Tao, V.; Li, J. Advances in Mobile Mapping Technology; ISPRS Book Series No. 4; Taylor &
Francis: London, UK, 2007.
82. Kahlmann, T.; Remondino, F.; Ingensand, H. Calibration for Increased Accuracy of the Range
Imaging Camera SwissRanger. In Proceedings of ISPRS Commission V Symposium „Image
Engineering and Vision Metrology‟, Dresden, Germany, 25–27 September 2006; Volume 36,
pp. 136-141.
83. Lichti, D. Self Calibration of 3D Range Camera. In Proceedings of ISPRS Congress 2008,
Beijing, China, 3–11 July 2008; Volume 37, pp. 927-932.
84. Chiabrando, F.; Filiberto, R.; Piatti, D.; Rinaudo, F. Sensors for 3D imaging-metric evaluation
and calibration of a CCD/CMOS time-of-flight camera. Sensors 2009, 9, 80-96.
85. Smith, D.; Tardif, M. Building Information Modelling: A Strategic Implementation Guide for
Architects, Engineers, Constructors, and Real Estate Asset Managers; Wiley: New York, NY,
USA, 2009.
86. Poli, D.; Angiuli, E.; Remondino, F. Radiometric and Geometric Analysis of Worldview-2
Stereo Scenes. In Proceedings of ISPRS Commission I Mid-Term Symposium „Image Data
Acquisition—Sensors & Platforms‟, Calgary, Canada, 15–18 June 2010; Volume 38.
87. Godin, G.; Rioux, M.; Beraldin, J.; Levoy, M.; Cournoyer, L. An Assessment of Laser Range
Measurement of Marble Surfaces. In Proceedings of The 5th Conference on Optical 3-D
Measurement Techniques, Vienna, Austria, 1–4 October 2001; pp. 49-56.
88. Lichti, D.D.; Harvey, B.R. The Effects of Reflecting Surface Material Properties on Time-Of-
Flight Laser Scanner Measurements. In Proceedings of ISPRS Commission IV Symposium 2002
on Geospatial Theory, Processing and Applications, Ottawa, Canada, 9–12 July 2002; Volume 34.
89. Guidi, G.; Remondino, F.; Russo, M.; Spinetti, A. Range sensors on marble surfaces:
Quantitative evaluation of artefacts. Proc. SPIE 2009, 7447, doi: 10.1117/12.827251.
90. Lichti, D. Error modelling, calibration and analysis of an AM-CW terrestrial laser scanner
system. ISPRS J. Photogramm. Remote Sens. 2007, 61, 307-324.
Remote Sens. 2011, 3
1135
91. Kersten, T.; Mechelke, K.; Lindstaedt, M.; Sternberg, H. Methods for geometric accuracy
investigations of terrestrial laser scanning systems. Photogrammetrie-Fernerkundung-
Geoinformation 2009, 2009, 301-315.
92. González-Aguilera, D.; Rodríguez-Gonzálvez, P.; Armesto, J.; Arias, P. Trimble GX200 and
Riegl LMS-Z390i sensor self-calibration. Opt. Express 2011, 19, 2676-2693.
93. Toutin, T. Geometric processing of remote sensing images: Models, algorithms and methods.
Int. J. Remote Sens. 2004, 25, 1893-1924
94. Poli, P. Modelling of Spaceborne Linear Array Sensors. Ph.D. Thesis, Institute of Geodesy and
Photogrammetry, ETH Zurich, Zurich, Switzerland, 2005.
95. Remondino, F.; Fraser, C. Digital Camera Calibration Methods: Considerations and
Comparisons. In ISPRS Commission V Symposium „Image Engineering and Vision Metrology‟,
Dresden, Germany, 25–27 September 2006; Volume 36, pp. 266-272.
96. Barazzetti, L.; Scaioni, M.; Remondino, F. Orientation and 3D modelling from markerless
terrestrial images: Combining accuracy with automation. The Photogrammetric Record 2010,
25, 356-381.
97. Barazzetti, L.; Remondino, F.; Scaioni, M. Automated and Accurate Orientation of Complex
Image Sequences. In Proceedings of the 4th ISPRS International Workshop 3D-ARCH 2011:
“3D Virtual Reconstruction and Visualization of Complex Architectures”, Trento, Italy, 2–4
March 2011; Volume 38, Part 5/W16.
98. Del Pizzo, S.; Troisi, S. Automatic Orientation of Image Sequences in Cultural Heritage. In
Proceedings of the 4th ISPRS International Workshop 3D-ARCH 2011: “3D Virtual
Reconstruction and Visualization of Complex Architectures”, Trento, Italy, 2–4 March 2011;
Volume 38, Part 5/W16.
99. Roncella, R.; Re, C.; Forlani, G. Performance Evaluation of a Structure and Motion Strategy in
Architecture and Cultural Heritage. In Proceedings of the 4th ISPRS International Workshop 3D-
ARCH 2011: “3D Virtual Reconstruction and Visualization of Complex Architectures”, Trento,
Italy, 2–4 March 2011; Volume 38, Part 5/W16.
100. Pierrot-Deseilligny, M.; Clery, I. APERO, An Open Source Bundle Adjustment Software for
Automatic Calibration and Orientation of Set of Images. In Proceedings of the 4th ISPRS
International Workshop 3D-ARCH 2011: “3D Virtual Reconstruction and Visualization of
Complex Architectures”, Trento, Italy, 2–4 March 2011; Volume 38, Part 5/W16.
101. Zhang, L. Automatic Digital Surface Model (DSM) Generation from Linear Array Images.
Ph.D. Thesis, Institute of Geodesy and Photogrammetry, ETH Zurich, Zurich, Switzerland, 2005.
102. Pierrot-Deseilligny, M.; Paparoditis, N. A Multiresolution and Optimization-Based Image
Matching Approach: An Application to Surface Reconstruction from SPOT5-HRS Stereo
Imagery. In Proceedings of ISPRS Ankara Workshop 2006 “Topographic Mapping from Space”,
Ankara, Turkey, 14–16 February 2006; Volume 36, Part 1/W41.
103. Furukawa, Y.; Ponce, J. Accurate, dense and robust multiview stereopsis. IEEE Trans. Patt.
Anal. Mach. Intell. 2010, 32, 1362-1376.
104. Kraus, T.; Lehner, M.; Reinartz, P. Generation of Coarse 3D Model of Urban Areas from High
Resolution Stereo Satellite Images. In Proceedings of ISPRS Congress 2008, Beijing, China,
3–11 July 2008; Volume 37, pp. 1091-1098.
Remote Sens. 2011, 3
1136
105. Gehrke, S.; Morin, K.; Downey, M.; Boehrer, N.; Fuchs, T. Semi-Global Matching: An
Alternative to LiDAR for DSM generation? In Proceedings of ISPRS Congress 2008, Beijing,
China, 3–11 July 2008.
106. Vergauwen, M.; Van Gool, L. Web-based 3D reconstruction service. J. Mach. Vis. Appl. 2006,
17, 411-426.
107. Snavely, N.; Seitz, S.; Szeliski, R. Modelling the world from internet photo collections. Int. J.
Comput. Vis. 2008, 80, 189-210.
108. Agarwal, S.; Snavely, N.; Simon, I.; Seitz, S.; Szelinski, R. Building Rome in a Day. In
Proceedings of the IEEE 12th International. Conference on Computer Vision (ICCV 2009),
Kyoto, Japan, 27 September–4 October 2009.
109. Skaloud, J. Reliability of direct georeferencing-beyond the Achilles’ heel of modern airborne
mapping. In Photogrammetric Week; Fritsch, D., Ed.; Stuttgart, Germary, 2007; pp. 227-241.
110. Filin, S. Recovery of systematic biases in laser altimetry data using natural surfaces.
Photogramm. Eng. Remote Sensing 2003, 69, 1235-1242.
111. Skaloud, J.; Lichti, D. Rigorous approach to bore-sight self-calibration in airborne laser
scanning. ISPRS J. Photogramm. Remote Sens. 2006, 61, 47-59.
112. Salvi, J.; Matabosch, C.; Fofi, D.; Forest, J. A review of recent range image registration methods
with accuracy evaluation. J. Image Vis. Comput. 2007, 25, 578-596.
113. Gruen, A.; Akca, D. Least squares 3D surface and curve matching. ISPRS J. Photogramm.
Remote Sens. 2005, 59, 151-174.
114. Bendels, G.H.; Degener, P.; Wahl, R.; Körtgen, M.; Klein, R. Image-Based Registration of
3D-Range Data Using Feature Surface Elements. In Proceedings of the 5th International
Symposium on Virtual Reality, Archaeology and Cultural Heritage (VAST), Brussels, Belgium,
7–10 December 2004; pp. 115-124.
115. Makadia, A.; Patterson, A.; Daniilidis, K. Fully Automatic Registration of 3D Point Clouds. In
Proceedings of the 2006 IEEE Computer Society Conference on Computer Vision and Pattern
Recognition (CVPR'06), New York, NY, USA, 17–22 June 2006; Volume 1, pp. 1297-1304.
116. Boehm, J.; Becker, S. Automatic Marker-free Registration of Terrestrial Laser Scans using
Reflectance Features. In Proceedings of the 8th Conference Optical 3-D Measurement
Techniques, ETH Zurich, Switzerland, 9–12 July 2007; Volume I, pp. 338-343.
117. Barnea, S.; Filin, S. Keypoint based autonomous registration of terrestrial laser point-clouds.
ISPRS J. Photogramm. Remote Sens. 2008, 63, 19-35.
118. Remondino, F. From Point Cloud to Surface: The Modelling and Visualization Problem. In
International Workshop on Visualization and Animation of Reality-based 3D Models, Tarasp-
Vulpera, Switzerland, 24–28 February 2003; Volume 34, Part 5/W10.
119. Lensch, H.P.A.; Kautz, J.; Goesele, M.; Heidrich, W.; Seidel, H.P. Image-based reconstruction
of spatial appearance and geometric detail. ACM Trans. Graph. 2003, 22, 234-257.
120. Reinhard, E.; Ward, G.; Pattanaik, S.; Debevec, P. High Dynamic Range Imaging: Acquisition,
Display and Image-Based Lighting; Morgan Kaufmann: San Francisco, CA, USA, 2005.
121. Callieri, M.; Cignoni, P.; Corsini, M.; Scopigno, R. Masked photo blending: Mapping dense
photographic dataset on high-resolution sampled 3D models. J. Comput. Graph. 2008, 32,
464-473.
Remote Sens. 2011, 3
1137
122. Boehm, J. Multi-image Fusion for Occlusion-Free Façade Texturing. In Proceedings of XXth
ISPRS Congress, Istanbul, Turkey, 12–23 July 2004; Volume 35, pp. 867-872.
123. Ortin, D.; Remondino, F. Occlusion-Free Image Generation for Realistic Texture Mapping. In
Proceedings of the ISPRS Working Group V/4 Workshop 3D-ARCH 2005: “Virtual
Reconstruction and Visualization of Complex Architectures”, Mestre-Venice, Italy, 22–24
August 2005; Volume 36, Part 5/W17.
124. Herley, C. Automatic Occlusion Removal from Minimum Number of Images. In Proceedings of
the IEEE International Conference on Image Processing (ICIP 2005), Genoa, Italy, 11–14
September 2005; pp. 1046-1049.
125. Hanusch, T. A New Texture Mapping Algorithm for Photorealistic Reconstruction of 3D
Objects. In Proceedings of XXIth ISPRS Congress, Beijing, China, 7–11 July 2008; Volume 37.
126. Luebke, D.; Reddy, M.; Cohne, J.; Varshney, A.; Watson, B.; Huebner, R. Level of Detail for 3D
Graphics; Morgan Kaufmann: San Francisco, CA, USA, 2002.
127. Dietrich, A.; Gobbetti, E.; Yoon, S.E. Massive-model rendering techniques: A tutorial.
J. Comput. Graph. Appl. 2007, 27, 20-34.
128. Shi, W.Z.; Yang, B.S.; Li, Q.Q. An object-oriented data model for complex objects in three-
dimensional Geographic Information Systems. Int. J. Geograph. Inform. Sci. 2003, 17, 411-430.
129. Khuan, T.C.; Abdul-Rahman, A.; Zlatanova, S. 3D Spatial Operations in Geo DBMS
Environment for 3D GIS. In Computational Science and Its Applications-ICCSA 2007;
Gervasi, O., Gavrilova, M., Eds.; LNCS 4705, Part I, Springer: Berlin/Heidelberg, Germany,
2007; pp. 151-163.
130. Manferdini, A.M.; Remondino, F.; Baldissini, S.; Gaiani, M.; Benedetti, B. 3D Modelling and
Semantic Classification of Archaeological Finds for Management and Visualization in 3D
Archaeological Databases. In Proceedings of the 14th VSMM: International Conference on
Virtual Systems and MultiMedia, Limassol, Cyprus, 20–25 October 2008; pp. 221-228.
131. Kibria, M.S.; Zlatanova, S.; Itard, L.; Van Dorst, M. GeoVEs as tools to communicate in urban
projects: Requirements for functionality and visualisation. In 3D Geo-Information Sciences;
Springer-Verlag: New York, NY, USA, 2009; pp. 379-395.
132. Apollonio, F.I.; Corsi, C.; Gaiani, M.; Baldissini, S. An integrated 3D geodatabase for Palladio’s
work. Int. J. Architect. Comput. 2010, 8, 111-133.
133. Agugiaro, G.; Remondino, F.; Girardi, G.; Von Schwerin, J.; Richards-Rissetto, H.; De Amicis, R.
A Web-Based Interactive Tool for Multi-Resolution 3D Models of a Maya Archaeological Site.
In 4th International Workshop “3D-ARCH 2011: Virtual Reconstruction and Visualization of
Complex Architectures”, Trento, Italy, 2–5 March 2011; Volume 38, Part 5/W16.
134. De Amicis, R.; Conti, G.; Girardi, G.; Andreolli, M. 3D WebGIS and Visualization Issues for
Architectures and Large Sites. In 4th International Workshop “3D-ARCH 2011: Virtual
Reconstruction and Visualization of Complex Architectures”, Trento, Italy, 2–5 March 2011;
Volume 38, Part 5/W16.
135. De Luca, L.; Bussayarat, C.; Stefani, C.; Véron, P.; Florenzano, M. A semantic-based platform
for the digital analysis of architectural heritage. J. Comput. Graph. 2011, 35, 227-241.
136. Kolbe, T.H. Representing and exchanging 3D city models with CityGML. In 3D
Geo-Information Sciences; Springer-Verlag: New York, NY, USA, 2009.

Remote Sens. 2011, 3
1138
137. Kolbe, T.; Koenig, G.; Nagel, C. Advances in 3D Geo-Information Sciences; Springer-Verlag:
New York, NY, USA, 2011; p. 294.
138. Kresse, W. Development of an international standard for calibration and validation of remote
sensing imagery sensors and data. Int. Arch. Photogram. Rem. Sens. Spatial Inf. Sci. 2008, 38,
part 1/03/.
© 2011 by the authors; licensee MDPI, Basel, Switzerland. This article is an open access article
distributed under the terms and conditions of the Creative Commons Attribution license
(http://creativecommons.org/licenses/by/3.0/).