herpetological review © 2020 by society for the study of
TRANSCRIPT
Herpetological Review 51(4), 2020
TECHNIQUES 709
Herpetological Review, 2020, 51(4), 709–715.© 2020 by Society for the Study of Amphibians and Reptiles
Creating 3D Models of Several Sea Turtle Species as Digital Voucher Specimens
Sea turtles are important residents in marine ecosystems and have been extensively studied by ecologists, conservation biologists, and others in terms of their life-history, ecology, behavior, anatomy, and conservation status (Carr and Ogren 1960; Lutz and Musick 1996; Wyneken 2001; Hays et al. 2010a, b; Mansfield et al. 2014). Over the past few decades, attention towards conservation of all sea turtle species has increased, especially given that climate change, fisheries, the wildlife trade, and habitat degradation have all negatively affected populations, with several species (e.g., Hawksbill, Eastern Pacific Leatherback, and Kemp’s Ridley) becoming critically endangered (Frazer 1992; Seney and Landry 2008; Hays et al. 2010a; Fuentes and Porter 2013; Lutcavage 2017, TLO Network 2020). However, there remains a great deal that we don’t know
about the ecology, life-history, and locomotor patterns of various sea turtle species, despite over 50+ years of intensive studies, and there is a continuous need for novel tools and technologies that will inform us about these species (Lutz and Musick 1996; Wyneken 2001; Mansfield et al. 2014).
Their size, protected status, and the challenges associated with preservation have resulted in few high-quality preserved specimens of sea turtles (particularly of subadults or adults) present in museums or other natural history collections. This limitation has prevented construction of usable 3D models of sea turtles. 3D modelling from live animals can result in more realistic models that are more useful to scientists to investigate a wide range of questions regarding locomotion, body shape, bioenergetics, and others (e.g., Brody 1968; Gillooly et al. 2001; Alexander 2005; Brose 2010; Miller et al. 2012; Dudley et al. 2014; Evin et al. 2016; Dawson et al. 2017; Christiansen et al. 2019) and for educational tools. Prior authors (e.g., Miller et al. 2012; Fish and Lauder 2017) have shown how 3D modelling, flow-tank research, and computational fluid dynamics have been instrumental in understanding the (possible) adaptive value of form of various body parts of marine species. For example, Miklosovic et al. (2004) used wind-tunnel experiments to investigate the role of the tubercles of Humpback Whales (Megaptera novaeangliae) for swimming behavior and energetics. Thus, creation of 3D models of different sea turtle species may open the door towards similar uses.
Our goal in this paper was to create 3D models for several sea turtle species through using a novel and portable 3D multicamera rig that allowed us to create photogrammetric models, both in the field, and in captivity. We combined these 3D photogrammetry models with 3D modelling techniques (outlined in Bot and Irschick 2019) to create 3D meshes for scientific applications. As a secondary goal, we also created colored, animated 3D models for educational purposes.
Methods
Specimens.—Given the rarity of live sea turtle specimens for some species (e.g., Hawksbill), our sampling was opportunistic, and depended in large part on availability through key partners, either in rehabilitation centers (Green, Kemp’s Ridley, and Hawksbill sea turtles), or in the field (Loggerhead and Flatback sea turtles). Hence, we were not always able to access adults, and our sample included a single individual for each of the five species: Hawksbill Sea Turtle (Eretmochelys imbricata, hatchling, sex unknown), Kemp’s Ridley Sea Turtle (Lepidochelys kempii, subadult, sex unknown), Green Sea Turtle (Chelonia mydas, subadult, sex unknown), Flatback Sea Turtle (Natator depressus, adult female), Loggerhead Sea Turtle (Caretta caretta, adult female). Table 1 provides information on the five sea turtles, localities where they were collected, and other information. Dates for sampling were: Eretmochelys imbricata (March 2018), Chelonia mydas (June 2017), Lepidochelys kempii (April 2018), Natator depressus (November 2017), and Caretta caretta (June 2017). The Green Sea Turtle had a missing flipper and scarring
DUNCAN J. IRSCHICK* Department of Biology, 221 Morrill Science Center, University of Massachusetts at Amherst, Amherst, Massachusetts 01003, USAJEREMY BOThttp://verbal007.com/ANNABELLE BROOKS Cape Eleuthera Institute, PO Box EL-26029, Rock Sound, Eleuthera, The BahamasMICHAEL BRESETTEInwater Research Group Inc., 4160 NE Hyline Drive, Jensen Beach, Florida 34957, USASABRINA FOSSETTE Biodiversity and Conservation Science, Department of Biodiversity, Conservation and Attractions, 17 Dick Perry Avenue, Kensington, WA 6151, AustraliaADRIAN GLEISSCentre for Sustainable Aquatic Ecosystems, Harry Butler Institute, Murdoch University, 90 South Street, Murdoch, WA 6150, Australia;College of Science, Health, Engineering and Education, Murdoch University, 90 South St. Murdoch, WA 6150, AustraliaROBERT GUTIERREZ8
https://www.artstation.com/bgut CHARLES MANIRELoggerhead Marinelife Center, 14200 U.S. Highway One, Juno Beach, Florida 33408, USACONNIE MERIGO New England Aquarium, Central Wharf, Boston, Massachusetts, 02110, USAJOHNSON MARTIN 111 High Street, Wilmore, Kentucky 30390, USAMICHAEL PEREIRA 62D Shrewsbury Green Dr., Shrewsbury, Massachusetts 01545, USASCOTT WHITING
Biodiversity and Conservation Science, Department of Biodiversity, Conservation and Attractions, 17 Dick Perry Avenue, Kensington, WA 6151, AustraliaJEANETTE WYNEKENDepartment of Biological Sciences, Florida Atlantic University, 777 Glades Rd., Boca Raton, Florida 33431-0991, USA
*Corresponding author; e-mail: [email protected]

Herpetological Review 51(4), 2020
710 TECHNIQUES
on the carapace, most likely from a shark bite, as this animal was originally found injured in the wild (see https://marinelife.org/turtles/scallywag/).
Morphometrics.—As per Wyneken (2001), our measures in-cluded: CCLmin (minimum curved carapace length), CCLmax (maximum curved carapace length), SCLmin (Minimum straightline carapace length), SCLn-t (maximum straightline car-apace length), CCW (curved carapace width), SCW (straightline carapace width), HW (head width), SPL (plastron length), Tail length (length of tail). Straight-line (SCL) measurements were taken with large tree calipers (Haglof Aluminum Calipers, Haglof
Inc., Madison, Mississippi, USA) to the nearest 0.1 cm, and curved-line (CCL) measurements with a flexible, nonstretching tape measure to the nearest 0.1 cm. Several morphometric mea-sures were taken on each of the sea turtles, which are (per spe-cies): Caretta caretta (Head width, SCLmax, CCLmin, CCW, SCW, SPL, Tail length); Chelonia mydas (SCLmin, SCW, CCLmax, CCL-min, CCW); Eretmochelys imbricata (SCW, HW, SPL, CCLmax, CCLmin, CCW), Lepidochelys kempii (SCLmin, SCLmax, SCW, CCLmax, CCLmin, CCW), Natator depressus (CCLmin, CCW).
3D photogrammetry methods.—We used a multi-camera system to create 3D photogrammetry models which we used as
Fig. 1. A) A multi-camera setup for 3D photogrammetry of a live sea turtle. Note that this system allows photog-raphy of the sea turtle without touching the animal (B). A scale bar can be included in the scene, which allows for calibration of the 3D model.

Herpetological Review 51(4), 2020
TECHNIQUES 711
the foundation for our modelling process. This system allows a non-invasive method of 3D photocapture of sea turtles, and can be done, for example, when research staff are actively working on the turtle for other reasons. We used variants of the system shown in Fig. 1, which consists of a series of poles with a
metal base attached at the bottom. Custom 3D-printed plastic mounting pieces placed over the poles provided standardized attachment points for cameras. This system enables several cameras to be placed on a single pole. Each pole was 61.3 cm tall. The added arm resulted in an overall height of 119.4 cm, and on some poles, we added an additional attachment and camera to provide additional coverage above the turtle. The spacing of the tripod system and the orientation of the cameras were adjusted as needed based on the size of the turtle. This system was effective for holding 20–30 cameras per photo shoot, so that many simultaneous images were collected per turtle model. We captured dorsal views and ventral views of each turtle which allowed us to create separate 3D models for dorsal and ventral sides for each specimen. We used 12 MP Canon G16 cameras (focal lengths 28–140 mm) with this system, which had wireless triggers (RF-603C II Remote Flash Trigger Kit from Yongnuo) set to the same channel so that the photographer could automatically trigger all cameras simultaneously. Based on the size of the turtle, we varied the focal lengths of the cameras, which were adjustable. In general, we used an aperture setting of F8 (the maximum setting for this camera) to promote an adequate depth of field, and used an ISO between 250 and 400, depending on lighting conditions. Shutter speeds varied between 1/60 s and 1/125 s, again based on lighting conditions. We used ambient lighting for Chelona mydas, Eretmochelys imbricata, and Caretta caretta), and LED lighting for the other two species (Natator depressus, Lepidochelys kempii).
We worked with a team of Computer Graphics (CG) artists who each individually reconstructed the sea turtle meshes and ultimately also the textures, colors, and motions using methods outlined in Bot and Irschick (2019). The team members are part of the Digital Life Project (www.digitallife3d.org) and share a set of techniques that provide a level of consistency among the sea turtle models (see Bot and Irschick 2019).
We discuss the concepts of “resolution” and “accuracy” in more detail in another paper (Irschick et al. 2020a), but in brief, without certain scientific tools, it is challenging to quantify accuracy at a small scale (e.g., < 1 mm). Instead, we focus on measuring accuracy on a broader scale (e.g., comparing the length of a digital shell to an actual shell). Prior studies have shown that 3D photogrammetry is relatively accurate given basic parameters (e.g., avoidance of extreme wide-angle lenses, Aldridge et al. 2005; Chiari et al. 2008; Falkingham 2012; Postma et al. 2015; Evin et al. 2016; Ferreira et al. 2019; Bot and Irschick 2019; Amado et al. 2019). Our results are consistent with these studies (see Results). Of course, we note that there is no method that is “100% accurate,” as accuracy is somewhat of a relative term. Based on other studies (Tucci et al. 2001; González-Vera et al. 2020), the likely level of resolution in our study is about 1 mm, which is typical of higher-quality 3D photogrammetry studies that employ good practices such as reasonably higher-megapixel cameras, tripods, and good lighting.
3D model reconstruction.—More exact details on our 3D reconstruction method are provided in Bot and Irschick (2019), and we provide a brief overview of our methods here. In general, our system allowed the photographers to act as passive observers as approved researchers or veterinary staff (Merigo, Manire, Fossette, Whiting, Gleiss, and Bresette, see also Acknowledgments) who worked with the sea turtle. Our system allowed us to capture photographs of the sea turtle from multiple points of view without the primary photographers (Irschick, Brooks, Christine Shepard) touching the turtle. Further, the
Fig. 2. Different depictions of one of our typical 3D models (Chelonia mydas), including the UV map (A), normal map (B), vertex normal (C), and the final render (D).

Herpetological Review 51(4), 2020
712 TECHNIQUES
researchers and veterinary staff could work with the sea turtle when our system surrounded them. We opportunistically captured 3D photosets of the sea turtles from different points of view, but the dorsal view as shown in Fig. 1 was the foundation for our models, with additional photosets taken to reconstruct the underside as needed. We used a known distance on the ground, such as a ruler, as our method of calibration. We also gathered additional photos of all body parts (carapace, plastron, limbs, head) using either a handheld CANON T6i camera with a 50mm lens, or a Canon G16 camera. For each turtle, we were able to reconstruct at least one, typically two to three 3D photogrammetry models and we were able to reconstruct the dorsal and ventral sides by using landmarks on the body.
The 3D photogrammetry models were created using Capturing Reality Software, Meshroom, or Colmap, and we then created single 3D models of each turtle using Blender. Using lattices and armatures (see https://docs.blender.org/manual/en/latest/animation/armatures/index.html for a more detailed explanation) in Blender, we morphed and straightened the scans together to match (Fig. 2A). This method resulted in a roughly complete body shape, which we overlaid onto the base mesh 3D model (Fig. 2B). The base mesh was created by retopologizing the 3D photogrammetry scans and joining and editing them until they formed a complete 3D mesh. We then overlaid morphometric measurements of the sea turtles, and the 3D model was scaled to fit. After creation of the meshes for each individual, we created a textured and animated version of each live sea turtle in Blender for use in educational outreach (Fig. 2C, D). We based the coloration on photographic data and texture
data captured in the photogrammetry scan, and in individual photographs. We based the animation on video reference of sea turtles swimming and feedback from project contributors. We confirmed the accuracy of the 3D models by comparing digital measurements of the 3D models taken in the Blender software to known morphometric distances (see list above for morphometric variables). We did this through calculating a linear least-squares regression between the actual measurements (taken on the live individuals) and the digital measurements (taken on the digital 3D models). If the two sets of measures were perfectly correlated, then the regression should have a slope of 1.0, and we compared the actual slope to this expected slope using a t-test.
Results
The dimensions of the five models are summarized in Table 2, and links to the 3D meshes (Fig. 3) are: Natator depressus (https://skfb.ly/6R7JK); Lepidochelys kempii (https://skfb.ly/6R7JM); Chelonia mydas (https://skfb.ly/6R7JJ); Eretmochelys imbricata (https://skfb.ly/6R7JN); Caretta caretta (https://skfb.ly/6QStY). The calculated volumes for each sea turtle were: Natator depressus (0.1030 m3), Lepidochelys kempii (0.0654 m3); Chelonia mydas (0.0177 m3); Eretmochelys imbricata (0.0002 m3); Caretta caretta (0.0410 m3). The “live” and “digital” measures were strongly correlated (Fig. 4, F1,24 = 4305.2; R2 = 0.99, Y-intercept = -0.52 ± 0.691, Slope = 1.03 ± 0.015, P < 0.001). The estimated slope of 1.03 was not significantly different from an expected slope of 1.0 (t-value = 2, df = 1, P > 0.25). The estimated volumes and body masses were also strongly correlated among species (F1,2 = 440.5;
table 1. Basic information on the five sea turtle species/individuals measured in this study.
Common name Species Locality Mass (g) ID
Hawksbill Sea Turtle Eretmochelys imbricata Loggerhead MarineLife Center, Florida, USA 220 Ei1801
Green Sea Turtle Chelonia mydas Loggerhead MarineLife Center, Florida, USA 14,240 CM1648
Loggerhead Sea Turtle Caretta caretta Florida, USA 37,000 982.000406129037
Kemp’s Ridley Sea Turtle Lepidochelys kempii New England Aquarium, Boston, USA 2,850 132
Flatback Sea Turtle Natator depressus Thevenard Island, Australia N/A 900119000520197
Fig. 3. 3D meshes of the five species of sea turtle, namely (A) Lepidochelys kempii, (B) Chelonia mydas, (C) Eretmochelys imbricata, (D) Natator depressus , and (E) Caretta caretta.

Herpetological Review 51(4), 2020
TECHNIQUES 713
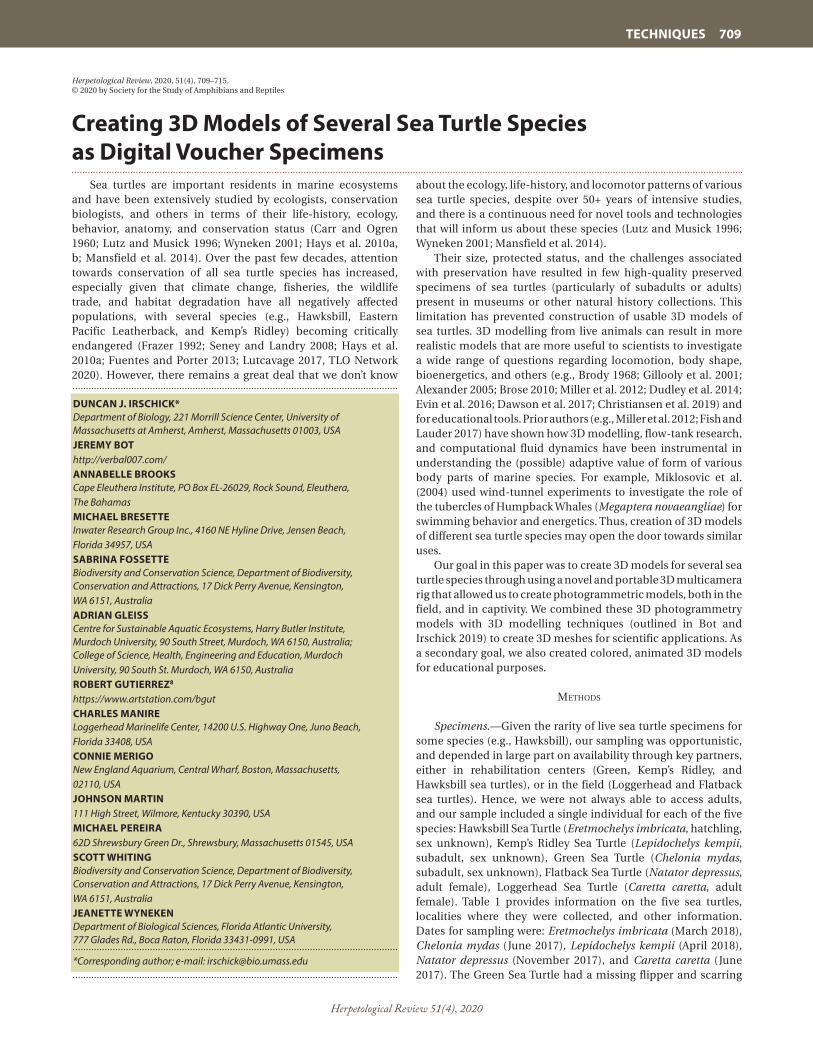
R2 = 0.99, Y-intercept = 691.7 ± 1203.3, slope = 1.10 ± 0.05, P < 0.05). The slope of 1.10 was also not significantly different from the expected slope of 1.0 (t-value = 2, P > 0.25), which is another indication of the overall accuracy of the models, although the low sample size (N = 5) suggests that this regression should be viewed with caution. The colored, animated 3D models (Fig. 5) for the educational/outreach audiences are: Natator depressus (https://skfb.ly/6UuBT); Lepidochelys kempii (https://skfb.ly/6AsYZ); Chelonia mydas (https://skfb.ly/6QXQY); Eretmochelys imbricata (https://skfb.ly/6QTKp); Caretta caretta (https://skfb.ly/6QStY). As noted above, these models are designed for educational outreach more than for scientific applications. Of these five 3D models, only Natator depressus was not animated, due to lack of funding for the CG artists.
discussion
In this paper, we described our methods for creating 3D models of sea turtles of five different species (Eretmochelys imbricata, Caretta caretta, Lepidochelys kempii, Chelonia mydas, and Natator depressus). We confirmed the accuracy of the 3D meshes by comparing measurements on our digital models to those taken on live individuals, although we note that we did not include measurements on the limbs. However, given that our 3D modelling process relied on 3D photogrammetry reconstruction of the limbs in a similar manner as the carapace and the head, we believe the accuracy would extend to the limbs as well. In addition to creating 3D meshes, we also created colored, animated versions of the models for outreach and education. While we make no scientific claim about the accuracy of these colored, animated models, given that they are based on the 3D meshes, they represent an important step forward in more scientific educational representation for sea turtles.
As with many animals, sea turtle species are known for notable variation within species, such as morphological changes across ontogeny, sexes, and across different geographical areas (Wyneken 2001; Salmon et al. 2015). There exist known geographical differences among populations in aspects such as shell color and diet (Hirth 1971; Balazs 1986), although more data are needed to quantify these differences, among others. Indeed, changes in shell morphology are likely to be complex and not easily quantified using standard linear morphometrics. In this vein, our 3D modelling approach offers an opportunity
to investigate these questions, as the models can be examined using a range of shape techniques, such as 3D elliptical fourier analysis, volumetrics, or other measures (e.g., Shen et al. 2009; Fu et al. 2016). Clearly, gathering a wider range of 3D models of sea turtles across sexes, age groups and geographic areas would be desirable.
A central axiom of ecomorphology is that form follows function, which in turn is often linked to variation in habitat use among species (Miles and Ricklefs 1984; Wainwright 1994; Irschick et al. 1997; Irschick and Higham 2016). While studying function in live adult sea turtles is challenging, these 3D models offer an opportunity to quantify some aspects of function using computational fluid dynamics, or flow-tank studies to examine swimming energetics and performance (e.g., Miklosovic et al. 2004; Miller et al. 2012; Fish and Lauder 2017). As an example, the sea turtles sampled here vary in their habitat use and locomotor habits. For example, Green Sea Turtles are open-ocean travelers during major parts of their lives, whereas Hawksbill Sea Turtles move to, and stay, on coral reefs beginning at relatively young ages. One would therefore expect correlated differences in body form and function that would be consistent with such differences in locomotor habits, and our 3D models offer one avenue to study that. Similarly, sea turtles vary in habitat use and locomotor behavior across ontogeny, which may also impact body shape. For example, whereas hatchling Chelonia mydas from the Northwestern Atlantic are thought to be dispersed by powerful currents such as the Gulf Stream, or perhaps become resident in more low flow areas like the Sargasso Sea, juvenile and subadult Green Sea Turtles typically occupy tidal creeks or shallow bays along the US and Central American coastline and in areas such as The Bahamas (e.g., Eguchi et al. 2012). When individuals develop into mature adults, they may migrate from feeding grounds to distant rookeries, across open oceanic waters (Carr and Ogren 1960; Pritchard 1973; Mortimer and Carr 1987; Arthur et al. 2008). These ontogenetic shape transformations could be reflected in the shape of the shell, limbs, and head, all of which could be quantified using 3D models such as we have created here, although our sample does not include a variety of age classes.
For long-term demographic studies with rare animals that are seldom recaptured, such as sea turtles, sharks, or other marine megafauna, one of the primary challenges is keeping track of individuals by using photos, video, or other similar methods. While the methods outlined here are not yet ready for processing large numbers of individuals, they offer the potential for scientists to possess digital specimens of known animals in studies where individuals are followed across long periods of
Fig. 4. Basic relationship between measurements taken on live animals (X-axis) and those taken on the digital models for the same variables (see text for list of variables).
table 2. Basic metrics of 3D model composition for each of the five sea turtle individuals. The Quads refers to the resolution in terms of the total number of squares in the 3D mesh, whereas the Total Tri-angles refers to the total number of vertices in the 3D model.
Species Quads Total Triangles File size (k) (k) (mb)
Eretmochelys imbricata 3.8 7.9 86
Chelonia mydas 3.4 7.6 7
Caretta caretta 25.5 50.3 46
Lepidochelys kempii 13.8 27.8 40
Natator depressus 17.3 34.7 27
Herpetological Review 51(4), 2020
714 TECHNIQUES
time. The value of this approach would be to enable scientists to track changes in body condition, shape, and scarring, for example. However, more research and data collection are needed before both 3D collection methods in the field, as well as 3D reconstruction methods, thereafter, can be applied en masse. While 3D photogrammetry models can be relatively quickly and cheaply constructed (Chiari et al. 2008; Amado et al. 2019) for simple shapes (e.g., bird eggs), creating complete models that have key parameters of completeness, consistency, and having a small (e.g., less than 100 MB) file size, can be time-consuming (Bot and Irschick 2019). For more complex species such as sea turtles, the time commitment towards creating complete digital specimens is not insubstantial, and ideally with more research in machine learning and 3D reconstruction techniques, it will be possible to lower this barrier.
Conservation of threatened species is driven in part by the exchange of knowledge and communication coupled with engaging and creative methods of transferring information. The creation of, colored, animated models has opened countless opportunities for stakeholders and end-users to use and modify these products to enhance conservation and educational messaging opportunities. Some examples include the creation of realistic physical models in museums and zoos, and digital models on webpages, information sheets, school curriculum, and in growing areas such as virtual and augmented reality (Pantelidis 2010).
Acknowledgments.—We thank the Inwater Research Group,
Loggerhead MarineLife Center, New England Aquarium, and the North West Shelf Flatback Turtle Conservation Program (NWSFTCP), for allowing us access to sea turtle specimens for our research. We thank the reviewers and editors of Herpetological Review for con-structive comments on a previous version of this paper. Christine Shepard kindly assisted with photography. This research was sup-ported by private donations to the UMASS Minutefund. The work at Loggerhead Marinelife Center was conducted under permit MTP-18-086 from the Florida Fish and Wildlife Conservation Com-mission, and permit number TE-01150C-2 to the New England
Aquarium. The work through the WA Department of Biodiversity, Conservation and Attractions’ NWSFTCP was conducted under per-mits 01-000068-2, SC001430, SC001447 and AEC project 2016-18. An Institutional Animal Care and Use Committee (IACUC) protocol from the University of Massachusetts at Amherst (2018-0008) sup-ported sea turtle 3D photography research.
liteRatuRe cited
aldRidge, K., s. a. boyadJieV, g. t. caPone, V. b. deleon, and J. t. Richts-MeieR. 2005. Precision and error of three-dimensional phenotypic measures acquired from 3dMD photogrammetric images. Am. J. Med. Gen.138:247–253.
aleXandeR, R. M. 2005. Models and the scaling of energy costs for lo-comotion. J. Exp. Biol. 208:1645–1652.
amaDO, T., m. PiNTO, aND m. Olalla-Tárraga. 2019. Anuran 3D models reveal the relationship between surface area-to-volume ratio and climate. J. Biogeogr. 46:1429–1437.
aRthuR, K. e., M. c. boyle, and c. J. liMPus. 2008. Ontogenetic changes in diet and habitat use in green sea turtle (Chelonia mydas) life history. Mar. Ecol. Prog. Series. 362:303–311.
balazs, g. h. 1986. Ontogenetic changes in the plastron pigmenta-tion of hatchling Hawaiian green turtles. J. Herpetol. 20:280-282
bot, J., and d. J. iRschicK. 2019. Using 3D photogrammetry to create open-access models of live animals using open source 2D and 3D software solutions open source 2D & 3D software solutions. In J. Grayburn, Z. Lischer-Katz, K. Golubiewski-Davis, and V. Ikeshoji-Orlati (eds.), 3D/VR in the Academic Library: Emerging Practices and Trends, pp. 54–72. CLIR Reports, CLIR Publication No. 176.
bRody, s. 1968. Bioenergetics and Growth. Hafner Company, New York, New York. 1023 pp.
bRose, u. 2010. Body-mass constraints on foraging behaviour deter-mine population and food-web dynamics. Funct. Ecol. 24:28–34.
caRR, a. F., and l. h. ogRen. 1960. The ecology and migrations of sea turtles. 4, The green turtle in the Caribbean Sea. Bull. Am. Mus. Nat. Hist. 121:1–48.
chiaRi, y., b. Wang, h. RushMeieR, and a. caccone. 2008. Using digital images to reconstruct three-dimensional biological forms: A new tool for morphological studies. Biol. J. Linn. Soc. 95:425–436.
chRistiansen, F., M. siRoni, M. J. MooRe, M. di MaRtino, M. RicciaRdi, h.
Fig. 5. Final 3D renders of the five species of sea turtle, namely (A) Lepidochelys kempii, (B) Chelonia mydas, (C) Eretmochelys imbricata, (D) Natator depressus, and (E) Caretta caretta.

Herpetological Review 51(4), 2020
TECHNIQUES 715
WaRicK, d. J. iRschicK, R. gutieRRez, and M. M. uhaRt. 2019. Estimat-ing body mass of free-living whales using aerial photogrammetry and 3D volumetrics. Meth. Ecol. Evol. 10:2034–2044.
daWson, s. M., M. h. boWMan, e. leunissen, and P. siRguey. 2017. In-expensive aerial photogrammetry for studies of whales and large marine animals. Front. Mar. Sci. 4:366.
dudley, P. n., R. bonazza, t. Jones, J. WyneKen, and W. P. PoRteR. 2014. Leatherbacks swimming in silico: Modeling and verifying their momentum and heat balance using computational fluid dynam-ics. PLoS ONE 9: e110701.
eguchi, t., J. a. seMinoFF, R. a. leRouX, d. PRosPeRi, d. l. dutton, and P. h. dutton. 2012. Morphology and growth rates of the green sea turtle (Chelonia mydas) in a northern-most temperate foraging ground. Herpetologica 68:76–87.
FalKinghaM, P. l. 2012. Acquisition of high resolution 3D models using free, open-source, photogrammetric software. Palaeontol. Elec-tron. 15:1T:15p
Fish, F., and g. V. laudeR. 2017. Control surfaces of aquatic vertebrates: active and passive design and function. J. Exp. Biol. 220:4351–4363.
FRazeR, n. b. 1992. Sea turtle conservation and halfway technology. Conserv. Biol. 6:179–184.
Fu, a., g. laudeR, c. Wilga, n. haMMeRschlag, and d. J. iRschicK. 2016. Ontogeny of head and caudal fin shape of an apex marine preda-tor: the tiger shark (Galeocerdo cuvier). J. Morphol. 277:556–564.
Fuentes, M. M. P. b., and W. P. PoRteR. 2013. Using a microclimate model to evaluate impacts of climate change on sea turtles. Ecol. Model. 251:150–157.
gillooly, J. F., J. h. bRoWn, g. b. West, V. M. saVage, and e. l. chaRnoV. 2001. Effects of size and temperature on metabolic rate. Science 293:2248–2251.
gONzález-Vera, a. S., T. J. S. wilTiNg, a. P. C. hOlTeN, g. J. f. VaN heiJST, and M. duRan-Matute. 2020. High-resolution single-camera pho-togrammetry: Incorporation of refraction at a fluid interface. Exp. Fluids 61. https://doi.org/10.1007/s00348-019-2826-y
hays, g. c., s. Fossettte, K. a. Katselidis, g. schoField, and M. b. gRaVe-noR. 2010. Breeding periodicity for male sea turtles, operational sex ratios, and implications in the face of climate change. Conserv. Biol. 24:1636–1643.
———, ———, ———, P. MaRiani, and g. schoField. 2010. Ontogenetic development of migration: Lagrangian drift trajectories suggest a new paradigm for sea turtles. J. Royal Soc. Interface 7:1319–1327.
hiRth, h. F. 1997. Synopsis of the Biological Data on the Green Turtle Chelonia mydas (Linnaeus 1758). USDI Fish and Wildlife Service Biol. Rep. 97. 120 pp.
iRschicK, d. J., and t. highaM. 2016. Animal Athletes: An Ecological and Evolutionary Approach. Oxford University Press, Oxford, UK. 272 pp.
———, l. J. Vitt, P. zani, and J. b. losos. 1997. A comparison of evo-lutionary radiations in mainland and West Indian Anolis lizards. Ecology 78:2191–2203.
iRschicK, d. J., z. coRRiVeau, t. Mayhan, c. sileR, M. Mandica, t. gaMble, J. MaRtin, J. bot, and s. zotos. 2020. Devices and methods for rapid 3D photo-capture and photogrammetry of small reptiles and am-phibians in the laboratory and the field. Herpetol. Rev. 51:716–725.
lutcaVage, M. e. 2017. Human impacts on sea turtle survival. In P. L. Lutz and J. A. Musik (eds.), The Biology of Sea Turtles. Vol. 1, pp.
387–409. CRC Press, Boca Raton, Florida. lutz, P. l., and J. a. MusicK. 1996. The Biology of Sea Turtles, Volume I.
CRC Press, Boca Raton, Florida. 446 pp.MansField, K. l., J. WyneKen, W. P. PoRteR, and J. luo. 2014. First satellite
tracks of neonate sea turtles redefine the ‘lost years’ oceanic niche. Proc. Royal. Soc. Lond. 281: 20133039.
MilleR, l. a., d. i. goldMan, t. l. hedRicK, e. d. tytell, z. J. Wang, J. yen, and s. alben. 2012. Using computational models to study animal locomotion. Integr. Comp. Biol. 52:553–575.
MiKlosoVic, d. s., M. M. MuRRay, l. e. hoWle, and F. e. Fish. 2004. Lead-ing-edge tubercles delay stall on humpback whale (Megaptera no-vaeangliae) flippers. Phys. Fluids 16:L39–L42.
Miles, d. b., and R. e. RicKleFs. 1984. The correlation between ecol-ogy and morphology in deciduous forest passerine birds. Ecology 65:1629–1640.
MoRtiMeR, J. a., and a. caRR. 1987. Reproduction and migrations of the Ascension Island green turtle (Chelonia mydas). Copeia 1987:103–113.
netWoRK, t. l. o. 2020. Enhanced, coordinated conservation efforts required to avoid extinction of critically endangered Eastern Pa-cific leatherback turtles. Sci. Rep. 10: 4772.
Pantelidis, V. s. 2010. Reasons to use virtual reality in education and training courses and a model to determine when to use virtual re-ality. Themes in Science and Technology Education Special Issue, Klidarithmos Computer Books, pp. 59–70.
PostMa, M., a. s. W. toRdiFFe, M. s. hoFMeyR, R. R. ReisingeR, l. c. besteR, P. e. buss, and P. J. n. de bRuyn. 2015. Terrestrial mammal three-dimensional photogrammetry: Multispecies mass estimation. Ecosphere 6:1–16.
PRitchaRd, P. c. h. 1973. International migrations of South Ameri-can sea turtles (Cheloniidae and Dermochelidae). Anim. Behav. 21:18–27.
salMon, M., b. higgins, J. steWaRt, and J. WyneKen. 2015. The ontogeny of morphological defenses in Kemp’s ridley (Lepidochelys kempii) and loggerhead (Caretta caretta) sea turtles. J. Morphol. 276:929–940.
seney, e. e., and a. M. landRy JR. 2008. Movements of Kemp’s ridley sea turtles nesting on the upper Texas coast: implications for manage-ment. Endanger. Species Res. 4:73–84.
shen, l., h. FaRid, and M. McPeeK. 2009. Modeling three-dimensional morphological structures using spherical harmonics. Evolution 63:1003–1016.
tucci, g., g. guidi, d. ostuni, F. costantino, M. PieRaccini, and J.-a. beRaldin. 2001. Photogrammetry and 3D scanning: Assessment of metric accuracy for the digital model of Danatello’s Maddalena. In Proceedings of the 2001 Workshop of Italy-Canada on 3D Digital Imaging and Modeling Application of: Heritage, Industry, Medi-cine, and Land, Padova, Italy. April 3–4, 2001. National Research Council of Canada 44879.
WainWRight, P. c. 1994. Functional morphology as a tool in ecologi-cal research. In P. C. Wainwright and S. M. Reilly (eds.), Ecological Morphology: Integrative Organismal Biology, pp. 42–59. Univer-sity of Chicago Press, Chicago, Illinois.
WyneKen, J. 2001. The Anatomy of Sea Turtles. U.S. Department of Commerce NOAA Technical Memorandum NMFS-SEFSC-470. 172 pp.