heterodyne non-demolition measurements on cold atomic ... · we report on a novel experiment to...
TRANSCRIPT

Heterodyne non-demolition measurements on cold
atomic samples: towards the preparation of non-classical
states for atom interferometry.
Simon Bernon, Thomas Vanderbruggen, Ralf Kohlhaas, Andrea Bertoldi,
Arnaud Landragin, Philippe Bouyer
To cite this version:
Simon Bernon, Thomas Vanderbruggen, Ralf Kohlhaas, Andrea Bertoldi, Arnaud Landragin, etal.. Heterodyne non-demolition measurements on cold atomic samples: towards the preparationof non-classical states for atom interferometry.. New Journal of Physics, Institute of Physics:Open Access Journals, 2011, 13 (065021), 24 p.,. <10.1088/1367-2630/13/6/065021>. <hal-00574298v5>
HAL Id: hal-00574298
https://hal.archives-ouvertes.fr/hal-00574298v5
Submitted on 29 Jun 2011
HAL is a multi-disciplinary open accessarchive for the deposit and dissemination of sci-entific research documents, whether they are pub-lished or not. The documents may come fromteaching and research institutions in France orabroad, or from public or private research centers.
L’archive ouverte pluridisciplinaire HAL, estdestinee au depot et a la diffusion de documentsscientifiques de niveau recherche, publies ou non,emanant des etablissements d’enseignement et derecherche francais ou etrangers, des laboratoirespublics ou prives.

Heterodyne non-demolition measurements on cold atomicsamples: towards the preparation of non-classical states for
atom interferometry.
S. Bernon1, T. Vanderbruggen1, R. Kohlhaas1, A. Bertoldi1, A. Landragin2 and P. Bouyer1,3.
1 Laboratoire Charles Fabry de l’Institut d’Optique, CNRS and Univ. Paris-SudCampus Polytechnique, RD 128, F-91127 Palaiseau cedex, France
2 LNE-SYRTE, Observatoire de Paris, CNRS and UPMC61 avenue de l’Observatoire, F-75014 Paris, France
3 Laboratoire Photonique, Numerique et Nanosciences - LP2NUniversite Bordeaux - IOGS - CNRS : UMR 5298Bat A30, 351 cours de la liberation, Talence, France
Abstract
We report on a novel experiment to generate non-classical atomic states via quantumnon-demolition (QND) measurements on cold atomic samples prepared in a high finessering cavity. The heterodyne technique developed for the QND detection exhibits an opticalshot-noise limited behavior for local oscillator optical power of a few hundred µW, and adetection bandwidth of several GHz. This detection tool is used in single pass to follownon destructively the internal state evolution of an atomic sample when subjected to Rabioscillations or a spin-echo interferometric sequence.
PACS: 07.05.Fb, 37.10.Gh, 42.50.Dv, 07.60.Ly, 32.60.+i
Published in New J. Phys. 13 065021 (2011)
1

1 Introduction
Quantum metrology [1] is the field of quantum information that studies the ultimate amountof information obtainable when measuring a given observable of a system. Quantum stateengineering techniques are thus developed to maximize the sensitivity of measurement devices.
In quantum optics, after the first observation of squeezed states [2], squeezing enhancing tech-niques have been strongly investigated, leading to very highly squeezed states [3] and NOONstates [4]. The benchtest to study the practical application of quantum technology is gravita-tional wave detection: the instruments used nowadays are reaching classical limit due to theoptical radiation pressure on the mirrors. Hence, further sensitivity improvements require quan-tum engineering techniques. Recently, squeezing enhancement has been proven in a gravitationalwave detector prototype [5].
State-of-the-art atomic detectors such as clocks [6], inertial sensors [7], and magnetometers[8] have also reached the standard quantum limit given by the atomic shot-noise. To go further,the sensitivity can be enhanced either increasing the number of atoms, or reducing the effectof quantum noise. In this context, atomic spin-squeezed states [9] have been recently achieved[10, 11, 13, 14, 15], and they allowed sensitivity enhancement in atomic clocks [11, 16].
In this paper we present an apparatus designed to generate cold atomic samples in anoptical cavity and to perform heterodyne non-demolition measurement in the perspective ofspin-squeezed states preparation. At first an overview of the experimental apparatus and acharacterization of the high-finesse optical cavity are presented. The second part is dedicated tothe heterodyne nondestructive measurement of an atomic population. After a presentation ofthe experimental set-up, we demonstrate the non-demolition measurement of Rabi oscillationsand characterize the influence of the probe on the oscillations. We finally show the real-timemeasurement of the internal atomic state evolution in a Ramsey interferometer.
2 The experimental apparatus
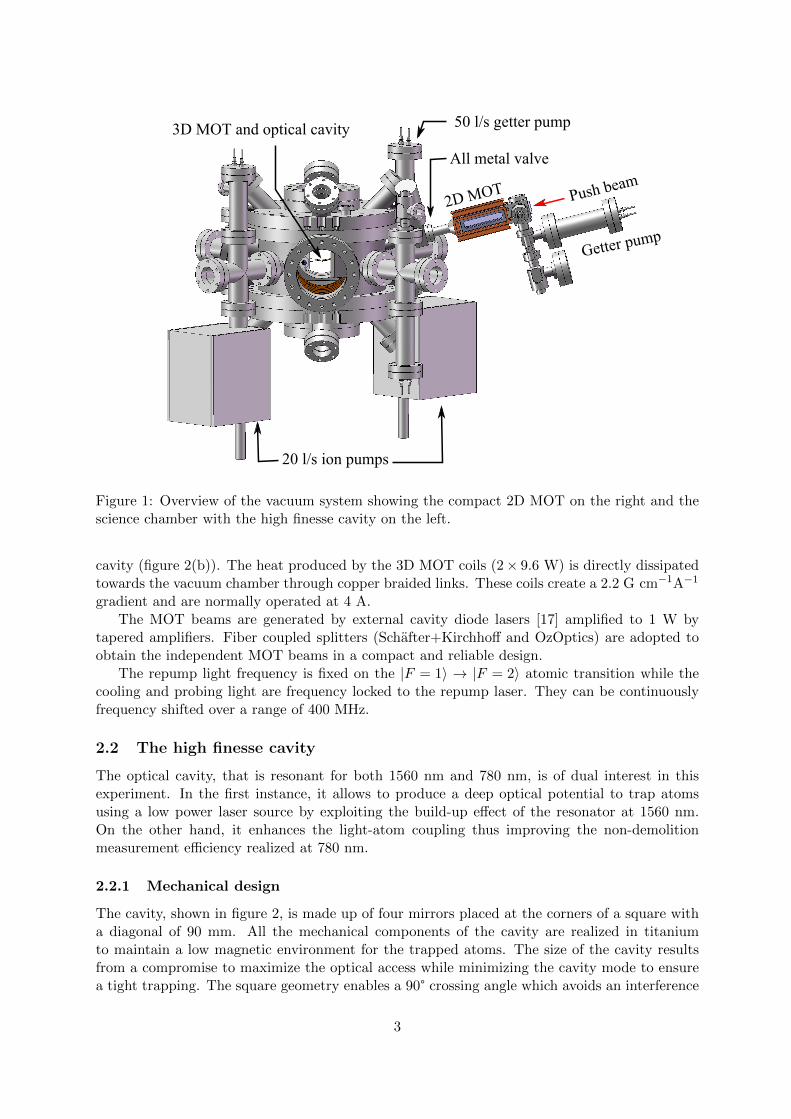
The apparatus is composed of two chambers: in the first a 2D MOT is operated, and usedas a source of cold atoms; the second one is the science chamber where the 3D MOT and theexperiments are performed in the center of a crossed optical cavity (figure 1).
2.1 2D and 3D MOTs
The 2D MOT vacuum chamber is a titanium machined piece with glue sealed windows, whichare antireflection coated at 780 nm on both sides. The science chamber is made of non magneticstainless steel (AISI type 316LN) and titanium; its viewports are antireflection coated at 780nm. To operate the resonator enhanced optical trap, the viewports on the horizontal plane areadditionally antireflection coated at 1560 nm.
The pressure in the 2D MOT chamber is below 7×10⁻⁸ mbar, whereas in the science chamberit is below 10−9 mbar. The differential vacuum operation relies on a reduced conductivitybetween the two chambers.
The 2D MOT produces a bright source of pre-cooled atoms used to load the 3D MOT. Therubidium background pressure is obtained from the vapor pressure of a 1 g rubidium sample.The loading rate of the 3D MOT by the 2D MOT is about 5× 10⁸ at.s−1 at room temperature.The MOT lifetime is ∼ 20 s. The center of the 3D MOT is placed 3 mm above the 2D MOTjet to avoid direct collisions with thermal atoms, and is centered on the cavity crossing regionwhere the atoms can be optically trapped in the resonator. The 3D MOT coils are mounted invacuum and are mechanically tightened using ceramic supports to the titanium plate holding the
2
50 l/s getter pump
20 l/s ion pumps
2D MOT Push beam
Getter pump
All metal valve
3D MOT and optical cavity
Figure 1: Overview of the vacuum system showing the compact 2D MOT on the right and thescience chamber with the high finesse cavity on the left.
cavity (figure 2(b)). The heat produced by the 3D MOT coils (2× 9.6 W) is directly dissipatedtowards the vacuum chamber through copper braided links. These coils create a 2.2 G cm−1A−1
gradient and are normally operated at 4 A.The MOT beams are generated by external cavity diode lasers [17] amplified to 1 W by
tapered amplifiers. Fiber coupled splitters (Schafter+Kirchhoff and OzOptics) are adopted toobtain the independent MOT beams in a compact and reliable design.
The repump light frequency is fixed on the |F = 1〉 → |F = 2〉 atomic transition while thecooling and probing light are frequency locked to the repump laser. They can be continuouslyfrequency shifted over a range of 400 MHz.
2.2 The high finesse cavity
The optical cavity, that is resonant for both 1560 nm and 780 nm, is of dual interest in thisexperiment. In the first instance, it allows to produce a deep optical potential to trap atomsusing a low power laser source by exploiting the build-up effect of the resonator at 1560 nm.On the other hand, it enhances the light-atom coupling thus improving the non-demolitionmeasurement efficiency realized at 780 nm.
2.2.1 Mechanical design
The cavity, shown in figure 2, is made up of four mirrors placed at the corners of a square witha diagonal of 90 mm. All the mechanical components of the cavity are realized in titaniumto maintain a low magnetic environment for the trapped atoms. The size of the cavity resultsfrom a compromise to maximize the optical access while minimizing the cavity mode to ensurea tight trapping. The square geometry enables a 90° crossing angle which avoids an interference
3

(a)
(b)
Figure 2: The folded optical cavity. (a) Schematic of the cavity geometry and (b) the innervacuum set-up with the suspended cavity and the coils generating the MOT magnetic field.
pattern in the crossing region once the polarization is set to be in the cavity plane. The mirrorsare all identical and are plane-concave with a radius of curvature of R = 100 mm. They have adiameter of 1/2 inch. All the parts are tightly mounted on a 15 mm thick titanium plate, whichgives its mechanical stability to the set-up. Two mirror mounts are completely fixed. One mountis actuated under vacuum by piezoelectric actuators (Newfocus Picomotors) which allow for acoarse alignment of the cavity. The last mount is a piezo-actuated three-axis nano-positioningsystem (Madcitylabs M3Z) with maximal angular displacement of 2 mrad and translation of50 µm. It is used to finely adjust the cavity crossing angle and dynamically control the cavitylength.
2.2.2 Spectral properties
The four mirrors of the cavity are highly reflecting at both 1560 nm and 780 nm. The free spectralrange (FSR) of the cavity is 976.2 MHz and the cavity FWHM linewidth is γ = 546 kHz at 1560nm. The FSR is measured by simultaneously injecting the carrier and a sideband created byan electro-optic modulator (EOM) in two adjacent longitudinal modes. γ is obtained from theLorentzian profile of the transmission when the sideband is scanned across the resonance. Thefinesse is then F1560 = FSR/γ = 1788. The corresponding mirror amplitude reflectivity obtainedfrom the formula F = πr2/(1 − r4), is r = 99.956% at 1560 nm. At 780 nm, the reflectivitymeasured by the manufacturer is r = 99.99923%, i.e. an expected finesse F780 = 102000.
2.2.3 Geometrical characterization
To estimate the mode parameters, the resonator has been analyzed with the ABCD matrixformalism [18]. In more detail, the cavity is converted into an equivalent sequence of lenses andself consistency is postulated. In the adopted geometry, an astigmatism arises from the nonzeroangle of incidence θ on the curved mirrors. The effective radii of curvature are then R‖ = R cos θin the plane defined by the cavity (horizontal plane) and R⊥ = R/ cos θ in the orthogonal plane.
4

0 0.2 0.4 0.6 0.8 1 1.2 1.4 1.6
0
0.2
0.4
0.6
0.8
1
Frequency (GHz)
Tra
nsm
issio
n s
ign
al (a
.u.)
FSR00 00
01 02
0304
05
20
30
40
10
00 1 2 3 40
100
200
300
400
500
600
Fre
qu
en
cy s
plit
tin
g fro
m the
clo
sest fu
nda
men
tal m
od
e (
MH
z)
Transverse mode number
TEMm0
TEM0n
Figure 3: Frequency splitting of the transverse mode relatively to the closest fundamental mode.The red dashed lines represent equation (1) for the two orthogonal directions when only the offaxis incidence on the mirrors is taken into account. For the horizontal direction, the blackdashed-dotted line includes also the corrections on the effective radius of curvature. In inset,the cavity transmission signal when the cavity length is scanned for a horizontal (black, TEMm0)and a vertical (blue, TEM0n) misalignment of the injection beam.
We measured the geometrical properties of the cavity by analyzing the transverse modespectrum at 1560 nm. Since the cavity is astigmatic, the transverse modes have Hermite-Gaussprofiles. The horizontal mode inter-spacing is 78.9 MHz and the vertical one is 164.6 MHz.The mode eigenfrequencies are related to the Gouy phase [19] acquired by the photons whiletraversing the beam waist and are thus linked to the cavity geometry. The absolute modefrequencies are given by [20]:
νp,m,n =c
2πL
[2pπ +
(m+
1
2
)Arg
(Am +
Bmqm
)+
(n+
1
2
)Arg
(An +
Bnqn
)], (1)
where p is the longitudinal mode order, m and n are the horizontal (TEMm0) and vertical(TEM0n) transverse mode numbers, Am and Bm factors refer to the ABCD matrix element inthe m direction, and qm is the complex radius of curvature of the beam. The parameters A, Band q contain the geometrical information of the cavity (length, angle and radius of curvatureof the mirrors).
Figure 3 compares the experimental measurement of the transverse mode inter-spacing andits a priori calculation in red dashed line. The discrepancy of the horizontal splitting is correctedby a phenomenological factor α‖ that, for example, accounts for aberrations. This factor isapplied on the horizontal effective radius of curvature R‖ = α‖R cos θ, and is adjusted on theslope of the data giving α‖ = 1.020(5) (black curve in figure 3). In the adopted quasi-concentricconfiguration, the parallel direction is the closest one to the instability regime. A 2% deviationof α‖ induces a noticeable frequency shift as it can be seen in figure 3. Including this correctionfor the astigmatism, we infer a horizontal waist ω‖ = 93.1 µm to be compared with 98(1) µmfound using a tomographic measurement [21, 22] and reported in section 2.2.5. The vertical
5

-200 0 200
OD
(u.a
.)
x (µm)
-200 0 200
OD
(u.a
.)
x (µm)-200 0 200
OD
(u.a
.)
x (µm)-200 0 200
OD
(u.a
.)
x (µm)-200 0 200
OD
(u.a
.)
x (µm)
∆ = 1 Γ ∆= 5 Γ ∆= 10 Γ ∆= 15 Γ ∆= 20 Γ
Figure 4: (Top) Tomographic images of the optical potential setting the probe frequency todifferent detuning with respect to the D2 line. (Bottom) Integral optical density obtained byprojecting the upper images on the 45° dashed line crossing one arm of the cavity.
waist is calculated to be ω⊥ = 129.8 µm. The corresponding Rayleigh ranges are z‖r = 17.46 mm
and z⊥r = 33.9 mm.
2.2.4 Frequency lock of the 1560 nm laser to the cavity
The optical cavity is pumped with the radiation produced by a single longitudinal mode dis-tributed feedback erbium doped fiber laser (DF-EDFL) near 1560 nm (Koheras laser from NKTPhotonics), amplified with a 5 W erbium doped fibered amplifier (EDFA, from Keopsys). Thetypical laser linewidth is of the order of a few kHz, its output power is 100 mW single mode andis linearly polarized. The radiation is coupled to the resonator through a beam expander and atilted doublet, whose angle allows us to mode-match the astigmatism. The laser is locked to atransversal cavity mode using the Pound-Drever-Hall technique [23]. A low frequency feedbackis applied on the piezoelectric element controlling the laser cavity length. The fast frequencycorrection is realized with an acousto-optic modulator in double-pass configuration with a band-width of 250 kHz. More details about the implemented lock scheme and its noise performancecan be found in [22].
2.2.5 Light-shift tomography of the cavity optical potential
The atoms released from the MOT, operated in the crossing region of the two cavity arms,are used to characterize in-situ the resonator geometry. The light at 1560 nm that pumps thecavity is close to the rubidium transitions 5P3/2–4D3/2,5/2 at 1529 nm. This causes a strongdifferential light shift on the two levels of the D2 transition. More precisely, at 1560 nm thescalar polarizability of the 5P3/2 level is 47.7 times that of the 5S1/2 level. As a consequence,by changing the detuning of the probe beam with regard to the D2 transition it is possible tobring into resonance atoms placed at different positions in the optical potential [21].
This method provides the isopotential lines of the crossed dipole trap, as shown in fig-ure 4, where the 1560 nm laser is locked to the fundamental transversal mode (TEM00). Ineach shot, the probe detuned by δ is absorbed by the atoms with potential energy U(r) =−ε0cRe(α)I(r)/2 = hδ/(47.7− 1) in the ground level; for this atomic class the probe is shiftedinto resonance because of the local differential light shift. The optical density was projected onan axis parallel to one cavity arm (lower row in figure 4), and the profile was fitted to obtain thedistance between the couples of isopotential lines. Plotting the position of these isolines versus
6
-10
-8
-6
-4
-2
0
0 50 100
E/h
(Γ
)
r (µm)
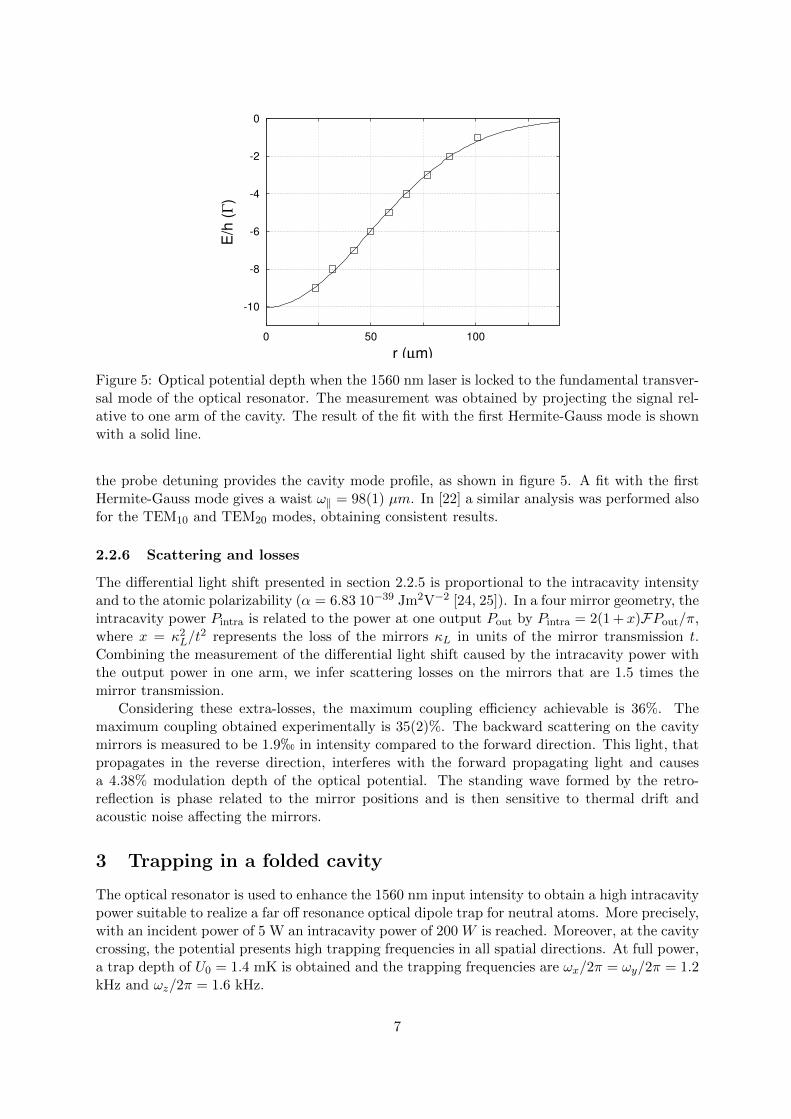
Figure 5: Optical potential depth when the 1560 nm laser is locked to the fundamental transver-sal mode of the optical resonator. The measurement was obtained by projecting the signal rel-ative to one arm of the cavity. The result of the fit with the first Hermite-Gauss mode is shownwith a solid line.
the probe detuning provides the cavity mode profile, as shown in figure 5. A fit with the firstHermite-Gauss mode gives a waist ω‖ = 98(1) µm. In [22] a similar analysis was performed alsofor the TEM10 and TEM20 modes, obtaining consistent results.
2.2.6 Scattering and losses
The differential light shift presented in section 2.2.5 is proportional to the intracavity intensityand to the atomic polarizability (α = 6.83 10−39 Jm2V−2 [24, 25]). In a four mirror geometry, theintracavity power Pintra is related to the power at one output Pout by Pintra = 2(1 + x)FPout/π,where x = κ2
L/t2 represents the loss of the mirrors κL in units of the mirror transmission t.
Combining the measurement of the differential light shift caused by the intracavity power withthe output power in one arm, we infer scattering losses on the mirrors that are 1.5 times themirror transmission.
Considering these extra-losses, the maximum coupling efficiency achievable is 36%. Themaximum coupling obtained experimentally is 35(2)%. The backward scattering on the cavitymirrors is measured to be 1.9h in intensity compared to the forward direction. This light, thatpropagates in the reverse direction, interferes with the forward propagating light and causesa 4.38% modulation depth of the optical potential. The standing wave formed by the retro-reflection is phase related to the mirror positions and is then sensitive to thermal drift andacoustic noise affecting the mirrors.
3 Trapping in a folded cavity
The optical resonator is used to enhance the 1560 nm input intensity to obtain a high intracavitypower suitable to realize a far off resonance optical dipole trap for neutral atoms. More precisely,with an incident power of 5 W an intracavity power of 200 W is reached. Moreover, at the cavitycrossing, the potential presents high trapping frequencies in all spatial directions. At full power,a trap depth of U0 = 1.4 mK is obtained and the trapping frequencies are ωx/2π = ωy/2π = 1.2kHz and ωz/2π = 1.6 kHz.
7

The dipole trap is loaded from a MOT in a similar way as described in [26]. For the loading,the depth of the FORT starts at ∼ 100 µK. A compressed MOT phase is operated by detuningthe MOT beams to 5 Γ from the atomic resonance for 50 ms. The cloud is compressed andthe atomic density increases in the FORT region. The cooling beams are then further detunedto 40 Γ for 100 ms. The high detuning has been chosen to red-detune the light with respectto the atomic transition even in the presence of the strong light-shift. Moreover, in the FORTregion the repump light is out of resonance and the atoms are accumulated in the F=1 hyperfinestate, realizing in this way a dark MOT induced by the atomic light-shift. Finally, the coolingradiation is turned off and the power in the FORT is ramped up to full power in 10 ms.
At the end of the loading sequence about 20 million atoms are loaded at the crossing regionof the dipole trap. After thermalization, the sample temperature is 230 µK, leading to a tem-perature to trap depth ratio kBT/U0 ∼ 6. The trapping time is limited to 6.6 s by one bodylosses.
4
5
6
78
1
2
3
4
5
6
78
10
Num
ber of ato
ms (m
illio
n)
25201510
Time (s)5
Figure 6: Number of atoms in the trap versus trapping time. The solid line is an exponentialfit for one body losses. The inset shows an image of the trapped atomic sample after 500 ms.
4 Heterodyne non-demolition measurement
4.1 Collective measurement
An ideal quantum non-demolition measurement can be seen as the textbook quantum projectivemeasurement realized on an operator that commutes with the hamiltonian. In the case ofmulti-particles measurement, the result of the measurement collectively constrains the sampleand not individual atoms. Correlations between atoms have been created in what is calledthe measurement back-action. The back-action collapses the wavefunction and can be used toprepare spin-squeezed states [27].
In the following, we consider an ensemble of Nat two levels atoms |ai〉 , |bi〉. We introduce
8

Energy
+-
++
- -
Figure 7: Schematic view of a population sensitive heterodyne measurement. The circles areinstantaneous phase representations of the optical frequency components in the frame rotatingat the carrier frequency. The positive sideband (+, in red) starts in phase with carrier and turnswith angular frequency Ω while the negative sideband (-, in blue) starts in opposite phase andturns with angular frequency −Ω. The positive sideband is close to the atomic transition ω0, itaccumulates an additional phase φat that is extracted after demodulation.
the collective-spin operators:
Jx =1
2
∑i
(|bi〉 〈ai|+ |ai〉 〈bi|) , (2)
Jy =i
2
∑i
(|ai〉 〈bi| − |bi〉 〈ai|) , (3)
Jz =1
2
∑i
(|bi〉 〈bi| − |ai〉 〈ai|) , (4)
which obey the commutation relations[Ji, Jj
]= iεijkJk. The observable of the measurement is
Jz = ∆N/2, which is one half of the population difference between the two internal atomic states.For a coherent spin state (CSS) polarized along Jx, one has (〈Jx〉, 〈Jy〉, 〈Jz〉) = (Nat/2, 0, 0), and
(∆J2x ,∆J
2y ,∆J
2z ) = (0, Nat, Nat) /4.
A non-demolition measurement based on optical techniques requires to reach a high signal-to-noise detection together with a low light level to limit the decoherence induced by spontaneousemission. Spontaneous emission can be reduced using off-resonance probing, which is a dis-persive measurement [28]. In that case, the off-resonance modification of the refractive indexis measured by the phase shift induced on the probe optical field. Several techniques can beimplemented to measure this phase shift, including Mach-Zehnder interferometry [11], mappingphase fluctuations into intensity fluctuations using a cavity tuned on the side of its resonance[10], or comparing the probe dephasing to a far from resonance local oscillator [29, 27]. Thelatter technique, called heterodyne detection, is adopted in the following.
The detection scheme considered is based on frequency modulation spectroscopy [23, 30, 31].A laser beam is phase modulated to produce frequency sidebands; one sideband is placed close toan atomic transition and experiences a phase shift φat passing through the atomic sample. Thedetection of the beat note at the modulation frequency then allows us to estimate the atomicpopulation of the probed state.
This scheme highly benefits from the almost noninteracting carrier used as a local oscillator.For a laser, limited by its quantum fluctuations (section 4.4), the signal-to-noise ratio (SNR) of
9

the detection is
SNR ∝√NsNc√
(√Ns)2 + (
√Nc)2 + (
√Ne)2
sinφat, (5)
where Ns represents the total number of photon detected in the sideband and Nc the photonnumber in the carrier. The contribution of technical noises in units of photon number is Ne.We underline that the two first terms of the denominator in equation (5) are the quantumphase noise of the laser expressed in terms of photon number. For a high power in the localoscillator, the shot noise overcomes the detection noise Nc Ne, and equation (5) simplifies toSNR ≈
√Ns sinφat, which corresponds to a sideband shot noise limited detection, independently
of the sideband power. The probe sensitivity to the fluctuations of the optical path is consideredin the next section.
4.2 A low sensitivity to common mode noise
In homodyne detections, such as Mach-Zehnder interferometry, the sensitivity to path lengthfluctuations is determined by the optical wavelength λ. In a heterodyne detection scheme forwhich frequency components are spatially overlapped, the relevant length is the modulationwavelength λmod = Ω/(2πc). For a modulation in the microwave range, λmod is of the order ofa few centimeters, whereas λ is of the order of a micrometer. As a consequence, the sensitivityto length fluctuations is greatly reduced.
In the following, we focus on the sensitivity of a phase modulated detection with respectto optical path length fluctuations, and consider the effect of residual amplitude modulation(RAM) [32]. An optical field E, phase modulated at Ω, can be written as:
E = E0
∞∑n=−∞
Jn(β) cos (ωct+ nΩt) , (6)
where Jn are Bessel functions of the first kind and β is the modulation depth.For a small modulation depth (β 1) the expansion can be limited to the first orders
(J0(β), J1(β), J−1(β)) ≈ (1, β, −β). Let φ0, φ1, and φ−1 be the different atomic phase shiftexperienced by each frequency component of the optical field. The photocurrent idet at theoutput of the photodetector is
idet = ηPopt
(1 + β cos
(Ωt− ΩL
c
)∆Φ+ + β sin
(Ωt− ΩL
c
)∆Φ−
), (7)
where L is the distance between the modulator and the detector, Popt the optical power in thelocal oscillator, η the detection sensitivity of the photodiode, and
∆Φ+ = cos (φ1 − φ0)− cos (φ0 − φ−1) , (8)
∆Φ− = sin (φ1 − φ0)− sin (φ0 − φ−1) . (9)
After the demodulation of idet by sin(Ωt + Φdem) with Φdem = ΩL/c, and for length noisefluctuations δL of the optical path integrated in the detection bandwidth ∆f , the dispersivesignal obtained is S = S0 + δSL, where:
S0 = ηβPopt∆Φ−, (10)
δSL = 2πηβPoptδL
λmod∆Φ+. (11)
10

δSL is the component of the noise that is due to fluctuations of the optical path length.Since the atomic contributions to the phase shift are small φ−1, φ0, φ1 1, we have at secondorder:
∆Φ+ =1
2(φ1 − φ−1) (2φ0 − φ1 − φ−1) , (12)
∆Φ− = φ1 + φ−1 − 2φ0. (13)
Considering the case depicted in figure 7, we have φ1 = φat 1 and φ−1 = φ0 = 0. Fromequations (11), (12) and (13), the detection noise δSL is ηβPoptφ
2atδL/λmod. Hence, for a pure
phase modulation, a small atomic phase shift φat makes the signal even less sensitive to lengthfluctuations than δL/λmod.
A major noise source in this heterodyne scheme arises from the residual amplitude mod-ulation due to phase modulation imperfections. The residual amplitude modulation unbal-ances the field amplitude in the sidebands and the optical electric field can be written asE = E0e
iωct(1 + β(1 + ε)eiΩt − β(1− ε)e−iΩt
). The signal after demodulation is:
S = ηβPopt
[(∆Φ− + ε∆Φ−,AM) + 2π
δL
λmod(∆Φ+ + ε∆Φ+,AM)
], (14)
where ∆Φ+,AM and ∆Φ−,AM are the atomic phase contributions for a pure amplitude modula-tion:
∆Φ+,AM = 2 +1
2
[(φ1 − φ0)2 + (φ−1 − φ0)2
], (15)
∆Φ−,AM = φ1 − φ−1. (16)
In the case of figure 7, the overall noise contribution of optical path length fluctuations is:
δSL = ηβPopt(φ2at + ε)
δL
λmod. (17)
As a consequence, in a phase modulated detection, the length fluctuations are rejected bya factor (φ2
at + ε)λ/λmod with respect to a Mach-Zehnder interferometer (equation (17)). Forour experimental parameters, ε = 10−2, λmod=10 cm, λ = 1 µm, and for φat < 100 mrad, itrepresents 7 orders of magnitude of rejection on δSL. In addition, δSL/δSshot scales as
√Popt.
As a result, if the photodetector is shot noise limited for a low optical power in the local oscillator(section 4.4), there is no need of a dynamical control of the optical path length.
4.3 Optical set-up
The optical set-up is presented in figure 8. The detection beam is generated by an extendedcavity diode laser, frequency locked to the reference laser [33]. The detuning of the carrier, andthus of the sideband from the atomic resonance, is electronically controlled by a Phase LockedLoop (PLL). An acousto-optic modulator (AOM) is used as a switch for the detection beamand generates pulses with 300 ns rise time. A polarization maintaining fibered electro-opticmodulator (EOM) produces frequency sidebands that probe the atomic sample. The beatingsignal of the carrier with the sidebands is detected on a fast photodiode (see section. 4.4), andthe demodulated signal is acquired with a digital oscilloscope. The internal atomic state ismanipulated with a microwave signal at about 6.834 GHz generated by a home-made frequencychain. This chain relies on a low noise quartz oscillator (Wenzel Associates, mod. Blue Top UltraLow Noise Oscillator) which has -113dBc/Hz phase noise at 1 Hz. After a suitable amplification,the microwave is shined on the atoms with an antenna placed at about 20 cm from the sample.
11

Frequency lock
Reference laser
(repumper)
Local
oscillator
(2 - 3 GHz)
6.8 GHz
Microwave
antenna
Data
acquisitionAtoms
EOM
AOM
ECDL
Figure 8: Set-up of the single-pass non-destructive measurement. The probe light is generatedby an extended cavity diode laser and offset locked to the atomic transition via a phase lockedloop (PLL) and a proportional integrator feedback loop. The absolute frequency of the lightis controlled by changing the reference frequency of the PLL. The atoms are probed with theoptical pulses generated by the AOM. The sidebands for the heterodyne detection are insertedby a phase modulator.
HFD 3180-203
Figure 9: Scheme of the optical detector. It is composed of a fast photodiode followed by atransimpedance amplifier of gain RF and a buffer with gain g.
4.4 The optical detector
The beat-note signal is detected on a fast GaAs PIN photodiode with integrated transimpedanceamplifier designed for high-speed optical communications at 850 nm (Finisar, model. HFD3180-203). The electronic scheme for the photodiode and the amplifier is presented in figure 9. Theintegration of the photodiode and amplifier in the same package greatly reduces parasitic capaci-tances and allows a high detection bandwidth of a few GHz together with a high transimpedancegain of the order of one kΩ. The detector is mounted on a home-made high frequency printedcircuit board. The output of the amplifier is connected to a 50 Ω matched coplanar waveguideand AC-coupled to a SMA connector.
The noise at the output of the photodiode has been measured with a spectrum analyzer.The output of the transimpedance amplifier was amplified by 36 dB to overcome the noise levelof the spectrum analyzer. The noise power spectral density of the illuminated detector wasmeasured at 1 GHz and 2 GHz, as reported in figure 10.
The measurement shows a very good linearity of the noise power spectral density versus
12

spectrum
analyzer
2 x ZX-60-53LN-S+
HFD 3180-203 1 GHz
2 GHz
Figure 10: Noise power spectral density versus the incident optical power for two differentdetection frequencies, 1 GHz (circles) and 2 GHz (triangles). The inset presents the set-up usedfor the noise measurement.
the incident power, which means that both the laser and the detector are shot-noise limitedat the adopted frequencies. The figure of merit κ considered is the electronic noise equivalentlight shot-noise, that is the optical power required to generate the same noise as the detectionelectronics [34]. We measured κ = 165 µW at 1 GHz, and κ = 469 µW at 2 GHz.
Moreover, the slope provides a direct measurement of the photodiode gainGPD = Vout/Popt =gRF η where η ∼ 0.5 A/W is the sensitivity of the photodiode (see figure 9 for notations). At theoutput of the transimpedance amplifier, voltage fluctuations induced by the light shot noise arevn = gRF
√2eηPopt∆f , where e is the charge of the electron and ∆f the detection bandwidth.
Hence the noise power spectral density on a resistance load RL of 50 Ω is:
PSDn =v2n
RL∆f= 2e
G2PD
RLηPopt, (18)
From the slopes of figure 10, one gets GPD = 1466 V/W at 1 GHz and GPD = 880 V/W at 2GHz, values in good agreement with the nominal value of 1250 V/W.
5 Non-demolition measurement of an evolving atomic state.
We now switch to the application of our heterodyne scheme to the measurement of a cold atomiccloud in free fall during the measurement. The spontaneous emission rate induced by the probe isfirst measured. Then, a real-time measurement of atoms undergoing Rabi oscillations is realized.Finally, the detection tool is used to follow continuously the evolution of an atomic state duringan interferometric sequence.
13

6.834 GHz
F=1
F=2
F'=0
1
2
3
δ
Δ
Δ = 2.808 GHz
Probe detuning ( x Γ)
De
ca
y r
ate
(kH
z)
c
0 42 6 8 100
0.5
1
1.5
(a)
(b)
Figure 11: Destructivity as a function of probe detuning. (a) Frequency position of the opticaltriplet with respect to the D2 atomic line. (b) Probe induced scattering rate. The gray shadedarea, with red dashed borders represents the theoretical decay rate. The only adjustable param-eter is the expansion rate of the cloud (γexpansion). In inset is shown the demodulated atomicsignal at δ = 4.81Γ, with the relative exponential fit.
5.1 Effective scattering rate
In experiments that concern measurement induced squeezing, the probe induced spontaneousemission is among the limiting factors to reach highly entangled states [35]. To quantify the de-structivity induced by the probe in our set-up, the atoms prepared in the |F = 1〉 hyperfine stateare released from the dipole trap and continuously probed. The cloud contains 4.7(3) millionatoms in an initial rms size of σat = 41 µm, and expands with a temperature of 55(5) µK. Theoptical frequency detunings with respect to the atomic transitions are presented in figure 11(a).The modulation frequency is fixed to 2.808 GHz. The detuning (δ) of the probing sideband withrespect to the atomic transition is changed by moving the absolute frequency of the carrier. Asa consequence, the quadrature set by the demodulation phase is independent of the detuning δ.
Spontaneous emission induced by the probe optically pumps the atoms to |F = 2〉 where theybecome transparent for the probe. The measured exponential decay time τ of the signal (insetof figure 11(b)) expressed as a decay rate γ = 1/(πτ) is then closely linked to the spontaneousemission rate of the probe.
The predicted decay rate γ, shown in figure 11(b) as a gray zone, is calculated from the beamwaist (245 µm), the carrier power (Pc = 120 µW), and the power in each sideband (Ps = 76 nW)of the linearly polarized probe, and is expressed as:
γ = γs + γc + γexp = b2ΓIs/(2Isat,2)
1 + 4(δΓ
)2+ Is/Isat,2
+2∑i=0
biΓIc/(2Isat,i)
1 + 4(
∆iΓ
)2+ Ic/Isat,i
+ γexp, (19)
14

where Isat,i is the saturation intensity for the π transition from |F = 1〉 to |F ′ = i〉, and theZeeman sub-levels are considered equally populated. We have Isat,0 = 16.67 W/m2, Isat,1 =26.7 W/m2, and Isat,2 = 61.23 W/m2. The branching probabilities bi to spontaneously scatterfrom |F ′ = i〉 to |F = 2〉 are b0 = 0, b1 = 1/5, and b2 = 1/2. Is = 2Ps/(πw
2) is the sidebandintensity while Ic is the carrier intensity, ∆i = 2.808 + ∆2i GHz is the carrier detuning fromthe transition and ∆2i is the angular frequency difference between |F ′ = 2〉 and |F ′ = i〉. γexp =120 Hz is a constant to take into account the signal loss due to the combination of fall andexpansion of the cloud; it is the only adjusted parameter in figure 11(b). A simulation of theloss of signal with the expansion gives a decay rate of 159 Hz, showing good qualitative agreementwith the experimental value.
The gray zone in figure 11(b) represents the expected region for the decay rate versus theprobe detuning when uncertainties in the experimental parameters are considered. It shows agood agreement with the experimental data. Although the probe is very weak compared tothe carrier, it dominates the spontaneous emission rate for δ < 5Γ in this specific experimentalrealization (figure 11(b)).
5.2 Rabi oscillations
Microwave driven Rabi oscillation is a well understood physical phenomenon and a typicaldemonstration of coherent manipulation. It is therefore very convenient to precisely characterizehow a non-destructive probe affects the oscillating system [36, 37, 38].
The atomic system is released from the MOT and optically pumped in the hyperfine groundstate |F = 1,mF = 0〉. At t = 0, a microwave driven Rabi oscillation is induced between|F = 1,mF = 0〉 and |F = 2,mF = 0〉 levels. A magnetic bias field of 0.5 G is applied alongthe vertical axis so that other Zeeman transitions are off-resonance. The cloud contains ∼ 107
atoms and expands with a temperature of 80 µK. The probe used in this experiment has a waistof w0 = 800 µm and delivers pulses of 1.25 µs with a repetition rate of 100 kHz or 50 kHz. Thecarrier power is 70 µW and the sideband power is 90 nW. As described in figure 12(a), one side-band is blue detuned by δ from the |F = 2〉 → |F ′ = 3〉 transition whereas the carrier is 2.5 GHzaway from the resonance. Hence, the configuration is probing the population in the |F = 2〉 state.
Figure 12 shows two examples of real time measurements of the atomic evolution obtained ina single shot. Figure 12(b) was taken with a probe detuning of 7.9 Γ and shows a trace of Rabioscillation undergoing decoherence. Figure 12(c), which was taken with a detuning of 0.8 Γ,presents an up-lift of the average oscillation. This effect is qualitatively explained by taking intoaccount the probe induced spontaneous emission which transfers atoms from |F = 2,mF = 0〉to |F = 2,mF 6= 0〉. There, the atoms still contribute to the detected signal while being off-resonance for the microwave excitation.
Figure 13(a) presents the difference of Rabi oscillation frequency δΩR for two different repe-tition rates of 100 kHz and 50 kHz as a function of the detuning (δΩR = ΩR,100kHz−ΩR,50kHz,).The Rabi frequency is obtained by fitting the first 800 µs of the oscillation where the expansionhas little effect. It clearly shows that the probe light modifies the Rabi frequency around itsunperturbed value of (ΩR ∼ 6.6 kHz). For the experimental parameters given above, the carrierinduces a light shift ∆Ec/h ∼ 2 kHz for a 100 kHz repetition rate whereas the sideband light-shift is below 380 Hz for the smallest detuning considered. The difference in Rabi frequencycalculated from the carrier light shift is δΩR = 227 Hz, in reasonable agreement with the 197Hz average of figure 13(a). In addition, from the fitting procedure, we extract that a SNR=1 isobtained for a destructivity of 2.6× 10⁻⁶ scattering event per atoms.
15

F=1
F=2
F'=0
1
2
3
-2 -1 0 1 2
Δ = 2.5 GHz
Δ
mF
δ
ΩR
0 0.5 1 1.5 2 2.5 3 3.5 4 4.5 5
0
0.2
0.4
0.6
0.8
1
Time (ms)
No
rma
lize
d p
op
ula
tio
n in
F=
2
0 0.5 1 1.5 2 2.5 3 3.5 4 4.5 5
0
0.2
0.4
0.6
0.8
1
Time (ms)
Norm
aliz
ed p
opula
tio
n in F
=2
(b)
(c)
(a)
Figure 12: Non-demolition measurement of the atomic population in |F = 2〉 when Rabi oscil-lations are driven in the atomic sample. The probing sequence is realized with a 1.25 µs longpulse repeated every 10 µs. Each graph is realized in a single experimental cycle. The detuningof the probe to the transition is set to 7.9Γ (a) and 0.8Γ (b). The red curve is a fit to the dataand the dashed black line helps as a guide to the eyes.
16
0 2 4 6 80
50
100
150
200
250
300
350
average
expectation
Detuning (x Γ)
Fre
qu
en
cy s
hift (H
z)
(a)
0 2 4 6 80
50
100
150
200
250
300
350
βshiftβ
else+
β
Detuning (x Γ)
Da
mpin
g r
ate
(H
z)
(b)
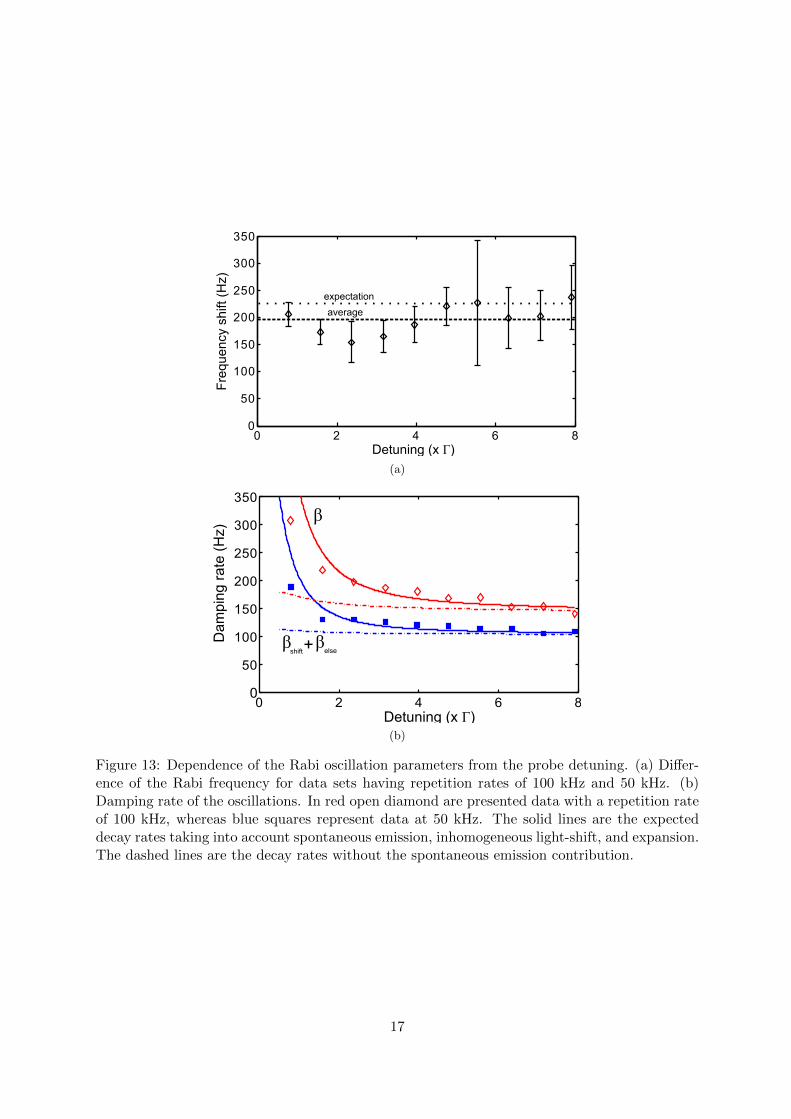
Figure 13: Dependence of the Rabi oscillation parameters from the probe detuning. (a) Differ-ence of the Rabi frequency for data sets having repetition rates of 100 kHz and 50 kHz. (b)Damping rate of the oscillations. In red open diamond are presented data with a repetition rateof 100 kHz, whereas blue squares represent data at 50 kHz. The solid lines are the expecteddecay rates taking into account spontaneous emission, inhomogeneous light-shift, and expansion.The dashed lines are the decay rates without the spontaneous emission contribution.
17
The exponential damping of the Rabi oscillations is described by its damping rate β whichis the sum of three independent terms:
β = βspont + βshift + βelse. (20)
βspont represents the damping of the oscillation by the spontaneous emission process of boththe carrier and the sideband, βshift results from the light shift inhomogeneity induced by theGaussian light profile [36], which is essentially limited to the carrier effect, and βelse represents theprobe independent decoherence effects such as the microwave inhomogeneity and the expansionof the cloud expansion. The behavior of β versus the probe detuning is presented in figure13(b). The spatial inhomogeneity of the carrier light-shift contributes to damp the oscillationin a characteristic time that is proportional to the inverse of the Rabi frequency dispersion
∆ΩR =√⟨
Ω2R
⟩− 〈ΩR〉2, where the averages are taken over the cloud profile. It results in a
damping rate βshift = α∆E2c/(2h2ΩR
)where α characterizes the inhomogeneity over the cloud
size, and depends on the atomic and probe sizes. The theoretical curves plotted in figure 13(b)are given for βelse = 90 Hz and α = 0.162.
The sum of the three damping coefficients reproduces well the observed behavior. Close toresonance, the damping of the oscillation is dominated by spontaneous emission events. Tuningthe probe further from resonance greatly reduces the effect of spontaneous emission from thesideband, and the damping becomes limited by the inhomogeneous light shift induced by thecarrier.
5.3 Interferometric phase in a spin-echo sequence
We present here the non-demolition measurement of the atomic state during an interferometricsequence. We are particularly interested in the evolution of the atomic pseudo-spin in theequatorial plane of the Bloch representation, since it is directly associated to the evolution ofthe interferometric phase.
The atoms are initially prepared in the |F = 1,mF = 0〉 state and probed in the configurationof figure 12(a). The interferometer is a π
2 − π −π2 spin-echo sequence. The whole sequence was
run in less than 500 µs to avoid loss of signal due to the atomic cloud expansion and free fall.The π pulse has a duration of 74.5 µs. The intermediate π pulse maps the interferometric phaseon the measured observable Jz + N/2, which is the projection of the atomic spin vector onthe z-axis in the Bloch representation of figure 14(c). To modify the interferometric phase, thefrequency of the microwave driving field is scanned with respect to the ground state hyperfinetransition.
Figure 14(a) shows the traces of the atomic state interferometer acquired in real time fordifferent microwave detunings. The result is well understood in terms of rotations of the pseudo-spin vector on the Bloch sphere (figure 14(b)-14(c)). The amplitudes of the signal oscillationduring the intermediate π pulse were extracted from the traces and compare well with thepredicted ones (figure 14(d)). The characterization shows that the superposition state of aninterferometer can be measured without necessarily blurring the fringes. This indicates thatthe measurement was realized in the weak measurement regime, where the atomic state is notstrongly projected. Moreover, in a usual interferometric sequence, the atoms are lost after thedestructive measurement. With such a non-demolition measurement at the end of the sequence,the atoms can be reused so as to increase the duty cycle of atomic interferometers [39].
18

(a) (b)
(c)
1000 500 0 500 1000 1500 20000
0.2
0.4
0.6
0.8
1
Frequency detuning (Hz)
Oscill
ation
am
plit
ud
e (
a.u
.)
(d)
Figure 14: Spin-echo sequence. (a) Non-demolition measurement of the number of atoms in|F = 2〉 during the interferometric sequence. Each curve is the average of three repetitions. Themeasurement uses 1.25 µs long detection pulses with a repetition rate of 100 kHz. The differentcurves are obtained by scanning the microwave frequency. The microwave detuning from theatomic transition is 0 Hz (red curve), 1 kHz (blue curve), 1.2 kHz (green curve) and 1.8 kHz(black curve). The colors in (b) and (c) refer to the same microwave detuning. (b) Simulationof the expected signal during the evolution of the atomic sample. (c) Trajectories of the atomicstate on the Bloch sphere. (d) Amplitude of the oscillation of the signal during the intermediateπ pulse. The red dots are experimental data and the black dashed line is the expected amplitude.
19

5.4 Cavity-enhanced measurements
As shown in [27, 40] the optimal level of squeezing ξ2 = 1/(1 + κ2) is related to the signal tonoise ratio κ of the measurement:
κ2 =φ2NatNs
2∝ ρ0η, (21)
where φ is the single atom induced phase shift, ρ0 is the resonant optical density, and η is thesingle atom spontaneous emission probability for a pulse of Ns photons. The coherence loss dueto spontaneous emission cannot be avoided since η enters in the equation of κ. Nevertheless,using a cavity to strengthen the atom-light interaction increases the coupling φ by the cavityfinesse F . This results in a SNR enhancement proportional to
√F [41] for a given spontaneous
emission rate (η ∝ Ns).To prevent for the light-shift effect of the carrier, the measurement can be realized in re-
flection [29]. In the scheme presented in figure 15, to measure the population difference, thedetection realized with the two sidebands is shot noise limited because of the strong local oscil-lator. In addition, the effective interaction between atoms and photons can take advantage ofthe trapping and probing that exploits the same cavity mode.
2000 1000 0 1000 2000 3000 4000 5000 6000 7000 80000.2
0.15
0.1
0.05
0
0.05
0.1
0.15
0.2
Frequency (MHz)
Phase (
rad)
0 1-1
F=1F=2
Figure 15: Scheme of the Pound-Drever-Hall like measurement method. The carrier is locked atthe center of two cavity resonances to suppress cavity noise. Each sideband probes one of thehyperfine states.
6 Conclusions
We have presented an apparatus designed for the production of spin-squeezed cold atomic sam-ples in a dual-frequency high-finesse cavity. We have shown that, thanks to the intra-cavitypower enhancement, the chosen configuration is suitable for all-optical trapping of atoms usingstandard optical telecommunication technologies.
We described a new non-demolition heterodyne detection scheme. This scheme is limitedby the optical shot noise of the probe and presents a high rejection of optical path lengthfluctuations. We demonstrated the method by performing nondestructive measurements of thecoherent evolution of internal atomic states. From the nondestructive measurement of Rabioscillations, we have shown that the decoherence induced by the probe can be limited by theinhomogeneous light shift from the carrier and not by the spontaneous emission induced by the
20

sideband. We also presented a real-time measurement of the atomic state evolution in a Ramseyinterferometer with low decoherence.
Our experiment is particularly suited for metrology with a high squeezing level of largeparticles numbers. Because of the power build-up at 1560 nm, we will achieve large degeneratesamples with low intensity and heterodyne detection can be enhanced by using the cavity at 780nm. Moreover, using the cavity enhanced atom-light coupling combined with the intrinsic atomicand optical mode overlap should allow us to reach the ultimate sensitivity of the heterodynemeasurement device while avoiding inhomogeneous light-shift from the carrier.
7 Acknowledgment
We thank David Holleville, Thierry Botter and Remi Geiger for their participation in the earlystage of the experiment. This work was supported by IFRAF, DGA, European Union (withSTREP program FINAQS), and ESF (EUROQUASAR program). A. B. acknowledges supportfrom EU under an IEF Grant. S.B. acknowledges the Fulbright foundation for support.
References
[1] H. Lee, P. Kok, and J. P. Dowling. A quantum Rosetta stone for interferometry. J. Mod.Opt., 49:2325, 2002.
[2] R. E. Slusher, L. W. Hollberg, B. Yurke, J. C. Mertz, and J. F. Valley. Observationof squeezed states generated by four-wave mixing in an optical cavity. Phys. Rev. Lett.,55:2409, 1985.
[3] H. Vahlbruch, M. Mehmet, S. Chelkowski, B. Hage, A. Franzen, N. Lastzka, Stefan Gossler,K. Danzmann, and R. Schnabel. Observation of squeezed light with 10-dB quantum-noisereduction. Phys. Rev. Lett., 100:033602, 2008.
[4] I. Afek, O. Ambar, and Y. Silberberg. High-NOON states by mixing quantum and classicallight. Science, 328:879, 2010.
[5] K. Goda, O. Miyakawa, E. E. Mikhailov, S. Saraf, R. Adhikari, K. McKenzie, R. Ward,S. Vass, A. J. Weinstein, and N. Mavalvala. A quantum-enhanced prototype gravitational-wave detector. Nat. Physics, 4:472, 2008.
[6] G. Santarelli, Ph. Laurent, P. Lemonde, A. Clairon, A. G. Mann, S. Chang, A. N. Luiten,and C. Salomon. Quantum projection noise in an atomic fountain: a high stability cesiumfrequency standard. Phys. Rev. Lett., 82:4619, 1999.
[7] A. Gauguet, B. Canuel, T. Leveque, W. Chaibi, and A. Landragin. Characterization andlimits of a cold-atom Sagnac interferometer. Phys. Rev. A, 80:063604, 2009.
[8] W. Wasilewski, K. Jensen, H. Krauter, J. J. Renema, M. V. Balabas, and E. S. Polzik. Quan-tum noise limited and entanglement-assisted magnetometry. Phys. Rev. Lett., 104:133601,2010.
[9] M. Kitagawa and M. Ueda. Squeezed spin states. Phys. Rev. A, 47:5138–5143, 1993.
[10] M. H. Schleier-Smith, I. D. Leroux, and V. Vuletic. States of an ensemble of two-level atomswith reduced quantum uncertainty. Phys. Rev. Lett., 104:073604, 2010.
21

[11] A. Louchet-Chauvet, J Appel, J. J. Renema, D. Oblak, N. Kjærgaard, and E. S. Polzik.Entanglement-assisted atomic clock beyond the projection noise limit. New J. Phys.,12:065032, 2010.
[12] J Appel, P J Windpassinger, D Oblak, U B Hoff, N. Kjærgaard, and E. S. Polzik. Mesoscopicatomic entanglement for precision measurements beyond the standard quantum limit. Proc.Natl. Acad. Sci. U. S. A., 106:10960, 2009.
[13] J. Esteve, C. Gross, A. Weller, S. Giovanazzi, and M. K. Oberthaler. Squeezing and entan-glement in a bose-einstein condensate. Nature, 455:1216–1219, 2008.
[14] C. Gross, T. Zibold, E. Nicklas, J. Esteve, and M. K. Oberthaler. Nonlinear atom interfer-ometer surpasses classical precision limit. Nature, 464:1165–1169, 2010.
[15] M. F. Riedel, P. Bohi, Y. Li, T. W. Hansch, A. Sinatra, and P. Treutlein. Atom-chip-basedgeneration of entanglement for quantum metrology. Nature, 464:1170–1173, 2010.
[16] D. J. Wineland, J. J. Bollinger, W. M. Itano, F. L. Moore, and D. J. Heinzen. Spin squeezingand reduced quantum noise in spectroscopy. Phys. Rev. A, 46:R6797–R6800, 1992.
[17] X. Baillard, A. Gauguet, S. Bize, P. Lemonde, Ph. Laurent, A. Clairon, and P. Rosenbusch.Interference-filter-stabilized external-cavity diode lasers. Opt. Com., 266:609 – 613, 2006.
[18] H. Kogelnik and T. Li. Laser beams and resonators. Appl. Opt., 5:1550, 1966.
[19] L.G. Gouy. Sur une propriete nouvelle des ondes lumineuses. Acad. Sci. Paris, 110:1251,1890.
[20] A. E. Siegman. Lasers. University Science Books, 1986.
[21] J. P. Brantut, J. F. Clement, M. Robert de Saint Vincent, G. Varoquaux, R. A. Nyman,A. Aspect, T. Bourdel, and P. Bouyer. Light-shift tomography in an optical-dipole trap forneutral atoms. Phys. Rev. A, 78:031401R, 2008.
[22] A. Bertoldi, S. Bernon, T. Vanderbruggen, A. Landragin, and P. Bouyer. In situ charac-terization of an optical cavity using atomic light shift. Opt. Lett., 35:3769, 2010.
[23] R. W. P. Drever, J. L. Hall, F. V. Kowalski, J. Hough, G. M. Ford, A. J. Munley, andH. Ward. Laser phase and frequency stabilization using an optical resonator. Appl. Phys.B, 31:97, 1983.
[24] B. Arora, M. S. Safronova, and C. W. Clark. Magic wavelengths for the np-ns transitionsin alkali-metal atoms. Phys. Rev. A, 76:052509, 2007.
[25] M. S. Safronova, B. Arora, and C. W. Clark. Frequency-dependent polarizabilities of alkali-metal atoms from ultraviolet through infrared spectral regions. Phys. Rev. A, 73:022505,2006.
[26] J.-F. Clement, J.P. Brantut, M. Robert de Saint-Vincent, R. A. Nyman, A. Aspect, T. Bour-del, and P. Bouyer. All-optical runaway evaporation to Bose-Einstein condensation. Phys.Rev. A, 79:061406(R), 2009.
[27] T. Vanderbruggen, S. Bernon, A. Bertoldi, A. Landragin, and P. Bouyer. Spin-squeezingand Dicke-state preparation by heterodyne measurement. Phys. Rev. A, 83:013821, 2011.
22

[28] A. Kuzmich, N. P. Bigelow, and L. Mandel. Atomic quantum non-demolition measurementsand squeezing. Europhys. Lett., 42:481–486, 1998.
[29] I. Teper, G. Vrijsen, J. Lee, and M. A. Kasevich. Backaction noise produced via cavity-aided nondemolition measurement of an atomic clock state. Phys. Rev. A, 78:051813(R),2008.
[30] E. D. Black. An introduction to Pound Drever Hall laser frequency stabilization. Am. J.Phys., 69:79, 2001.
[31] G. C. Bjorklund, M. D. Levenson, W. Lenth, and C. Ortiz. Frequency Modulation Spec-troscopy. Appl. Phys. B, 32:145–152, 1983.
[32] M. Gehrtz, G. C. Bjorklund, and E. A. Whittaker. Quantum-limited laser frequency-modulation spectroscopy. J. Opt. Soc. Am. B, 2:1510–1526, 1985.
[33] J. Appel, A. MacRae, and A. I. Lvovsky. Versatile digital GHz phase lock for externalcavity diode lasers. Meas. Sci. Technol., 20:055302, 2009.
[34] P. J. Windpassinger, M. Kubasik, M. Koschorreck, A. Boisen, E. S. Polzik N. Kjærgaard,and J. H. Muller. Ultra-low noise differential AC-coupled photodetector for sensitive pulsedetection applications. Meas. Sci. Technol., 20:055301, 2009.
[35] S. R. De Echaniz, M. W. Mitchell, M. Kubasik, M. Koschorreck, H. Crepaz, J. Eschner,and E S Polzik. Conditions for spin squeezing in a cold 87Rb ensemble. J. Opt. B: QuantumSemiclassical Opt., 7:S548–S552, 2005.
[36] P. J. Windpassinger, D. Oblak, U. Busk Hoff, J. Appel, N. Kjærgaard, and E. S. Polzik.Inhomogeneous light shift effects on atomic quantum state evolution in non-destructivemeasurements. New J. Phys., 10:053032, 2008.
[37] S. Chaudhury, G. A. Smith, K. Schulz, and P. S. Jessen. Continuous nondemolition mea-surement of the Cs clock transition pseudospin. Phys. Rev. Lett., 96:043001, 2006.
[38] G. Smith, S. Chaudhury, A. Silberfarb, I. Deutsch, and P. Jessen. Continuous Weak Mea-surement and Nonlinear Dynamics in a Cold Spin Ensemble. Phys. Rev. Lett., 93:163602,2004.
[39] J. Lodewyck, P. G. Westergaard, and P. Lemonde. Nondestructive measurement of thetransition probability in a Sr optical lattice clock. Phys. Rev. A, 79:061401, 2009.
[40] D. Oblak, P. G. Petrov, C. L. Garrido Alzar, W. Tittel, A. K. Vershovski, J. K. Mikkelsen,J. L. Sørensen, and E. S. Polzik. Quantum-noise-limited interferometric measurement ofatomic noise: Towards spin squeezing on the cs clock transition. Phys. Rev. A, 71:043807,2005.
[41] J. E. Lye, J. J. Hope, and J. D. Close. Nondestructive dynamic detectors for Bose-Einsteincondensates. Phys. Rev. A, 67:043609, 2003.
23