heterozygositysuggestsmultiple genetic alterations...
TRANSCRIPT

Loss of Heterozygosity Suggests Multiple Genetic Alterationsin Pheochromocytomas and Medullary Thyroid CarcinomasS. Khosla,* V. M. Patel,* 1. D. Hay,* D. J. Schaid,' C. S. Grant,' J. A. van Heerden,' and S. N. ThibodeaullDepartments of *Endocrinology and Internal Medicine, tOncology, Surgery, and 1Laboratory Medicine,Mayo Clinic and Mayo Foundation, Rochester, Minnesota 55905
Abstract
Loss of heterozygosity (LOH) at specific loci may help localizetumor suppressor genes involved in the formation of variousfamilial and sporadic tumors. In addition, the genetic loci for anumber of familial tumor syndromes have been mapped by link-age analysis. To explore the possible role of tumor suppressorgenes in endocrine tumors, we tested 41 pheochromocytomas(34 sporadic and 7 familial) and 11 medullary thyroid cancers(MTC) (10 sporadic and 1 familial) for LOHnear a variety ofpotentially important genetic loci: (a) the multiple endocrineneoplasia type 2A (MEN2A) locus on chromosome 10; (b) thevon Hippel-Lindau locus on 3p; and (c) the p53 and neurofibro-matosis 1 loci on 17. Wealso examined chromosomes ip and22q because previous studies in a small number of pheochromo-cytomas and MTCs suggested LOHin these regions. Back-ground rates for LOHwere assessed using several "random"probes. Finally, we examined a number of clinical and histo-logic characteristics of these tumors for possible correlationswith specific genetic alterations. LOHin the region of theMEN2A locus was uncommon (0% for MTCs, 5% forpheochromocytomas). However, we found significant alleliclosses in pheochromocytomas on chromosomes ip (42%), 3p(16%), 17p (24%), and 22q (31%). Wealso noted a correlationbetween LOHon ip and urinary excretion of metanephrine bythese patients (P = 0.02). LOHon ip, 3p, and 17p also ap-peared to be associated with increased tumor volume. Analysisof the smaller number of MTCsdemonstrated allelic losses onchromosomes lp and 22q. Our results suggest that tumor for-mation and/or progression in pheochromocytomas and MTCsinvolves multiple genes, analogous with the model proposed forcolon carcinoma. (J. Clin. Invest. 1991. 87:1691-1699.) Keywords: allelic losses * tumor suppressor genes * multiple endo-crine neoplasia * familial tumors - tumorigenesis
Introduction
The inactivation of tumor suppressor genes is thought to beimportant in the pathogenesis of many human cancers (1). Theprototypic model for tumor suppressor genes is the retinoblas-
Presented in part at the 31 October 1990 Midwestern Section Session ofthe American Federation for Clinical Research.
Address reprint requests to Dr. Sundeep Khosla, Endocrinologyand Internal Medicine, Mayo Clinic, Rochester, MN55905.
Received for publication 27 September 1990 and in revised form28 November 1990.
toma (RB 1)' gene, which has been cloned and sequenced (2).Retinoblastoma can occur either in a hereditary or a sporadicform. In the hereditary form of the disease, one RB1 allele isabnormal in the germ line and the second allele is inactivatedas a somatic event. In the sporadic form, both RB1 alleles areinactivated in somatic cells, leading to tumor formation (3).Thus, similar genetic mechanisms are involved in both formsof the disease, with tumors occurring at a far higher frequencyin the familial form since fewer somatic mutations are requiredfor tumor formation (3).
In contrast to the RB1 gene, the sequences of other tumorsuppressor genes are unknown. The chromosomal locations ofcandidate tumor suppressor genes are inferred, however, basedon the detection of somatic allelic losses in various tumors.Combined with linkage analysis, such an approach has led tothe localization of several cancer-predisposing genes, such asthe genes for multiple endocrine neoplasia type 1 (MEN 1) (4),MEN2A (5, 6), neurofibromatosis 2 (NF 2) (7), von Hippel-Lindau disease (VHL) (8), and familial adenomatous polyposis(FAP) of the colon (9, 10).
Like retinoblastoma, pheochromocytoma and medullarythyroid carcinoma (MTC) can occur in both familial and spo-radic forms. Both are components of the MEN2A syndrome,which has been mapped to the centromeric region on chromo-some 10 (5, 6). In contrast to retinoblastoma, however, allelicloss on chromosome 10 near the MEN2A locus has been anuncommon event in these tumors (11, 12). This has led tospeculation that the MEN2A gene may not be entirely analo-gous to the RBl gene (12). In retinoblastoma, the inheritedmutation in familial cases is typically a small deletion or, pre-sumably, a point mutation. The loss of the second allele in atumor cell, in contrast, often involves loss of a large piece ofDNA, detectable by a loss of heterozygosity (LOH) analysis. Inthis model, it appears that both copies of the RB1 gene need tobe inactivated for phenotypic effects (1, 3). In contrast to retino-blastoma, in other familial cancer syndromes phenotypic ef-fects could result from the loss or inactivation of only one copyof the putative tumor suppressor gene (1). Indeed, this appearsto be the case for FAP, which has been mapped to chromosomeSq (9, 10). In that syndrome, generalized colonic epithelial hy-perplasia occurs without loss of the wild-type allele, presum-ably reflecting a gene dosage effect of the FAP gene (13). InFAP, genetic changes at other loci involving chromosomes12p, 18q, and 17p, and possibly others, are then thought tocontribute to the transition to malignancy (13). Because LOHnear the MEN2A locus has not been found in familialpheochromocytomas and MTCs, a model similar to that for
1. Abbreviations used in this paper: FAP, familial adenomatous poly-posis; LOH, loss of heterozygosity; MEN, multiple endocrine neopla-sia; MTC, medullary thyroid cancer; NF, neurofibromatosis; RB1, reti-noblastoma; VHL, von Hippel-Landau.
Genetic Alterations in Pheochromocytomas and Medullary Thyroid Cancers 1691
J. Clin. Invest.© The American Society for Clinical Investigation, Inc.0021-9738/91/05/1691/09 $2.00Volume 87, May 1991, 1691-1699
FAPhas been proposed for MEN2A-associated tumors (12). Aprediction of this model would be the presence of genetic alter-nations in pheochromocytomas and MTCsat several loci otherthan the MEN2A locus, in close analogy with FAP and coloncarcinoma.
In these studies, we tested the above prediction by examin-ing a large number of pheochromocytomas and MTCsfor alle-lic losses at several potentially important genetic loci. In addi-tion to the MEN2A locus on chromosome 10, we also exam-ined chromosomes lp and 22q because previous studies in asmall number of tumors had suggested LOH for variousmarkers in these regions (14-16). Since pheochromocytomasare also found in VHL disease and NF 1, we also tested thepheochromocytomas for LOH on chromosomes 3p and 17,where the genes for these syndromes have been ntapped or, inthe case of NF 1, recently cloned (8, 17, 18). Our results sup-port the hypothesis that multiple genetic alterations on chro-mosomes lp, 22q, 17p, and 3p may be involved in the develop-ment of pheochromocytomas. Based on a clinical analysis ofthe pheochromocytomas, our studies further suggest a relation-ship between specific genetic changes and certain clinical char-acteristics of the tumors.
Methods
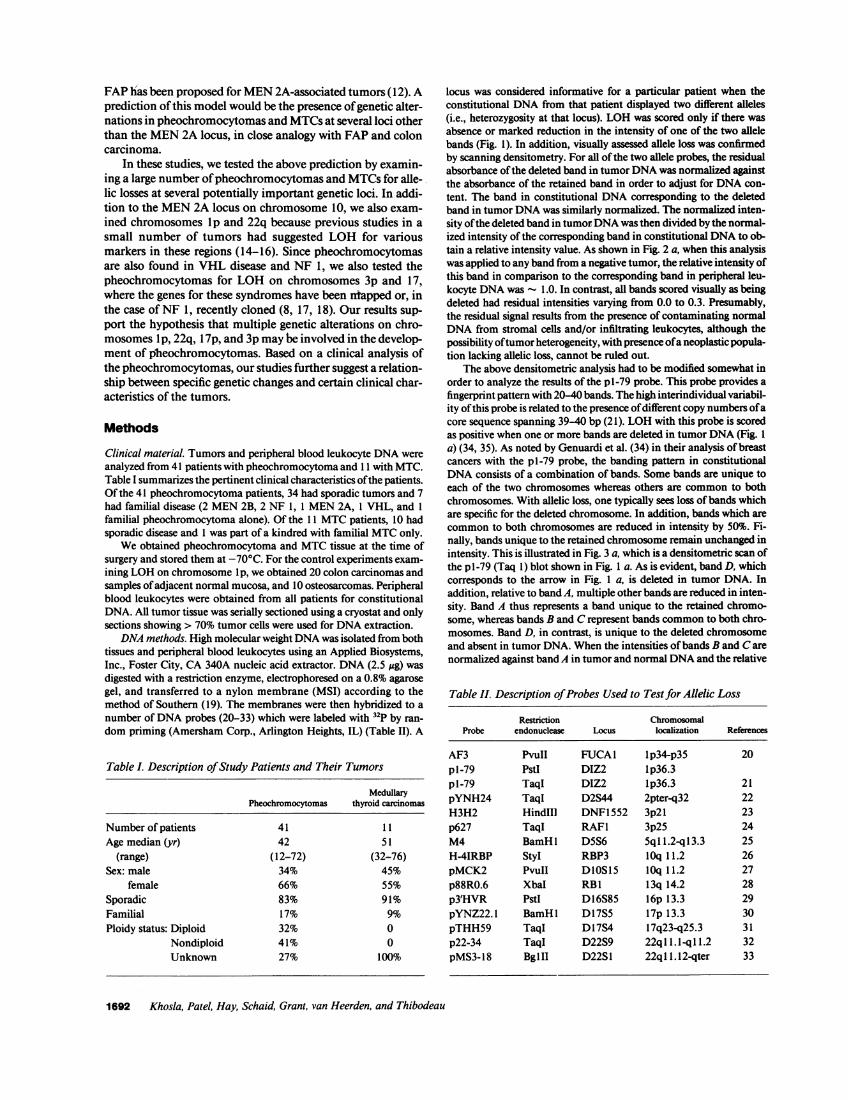
Clinical material. Tumors and peripheral blood leukocyte DNAwereanalyzed from 41 patients with pheochromocytoma and I I with MTC.Table I summarizes the pertinent clinical characteristics ofthe patients.Of the 41 pheochromocytoma patients, 34 had sporadic tumors and 7had familial disease (2 MEN2B, 2 NF 1, I MEN2A, I VHL, and Ifamilial pheochromocytoma alone). Of the 11 MTCpatients, 10 hadsporadic disease and 1 was part of a kindred with familial MTConly.
Weobtained pheochromocytoma and MTCtissue at the time ofsurgery and stored them at -70'C. For the control experiments exam-ining LOHon chromosome lp, we obtained 20 colon carcinomas andsamples of adjacent normal mucosa, and 10 osteosarcomas. Peripheralblood leukocytes were obtained from all patients for constitutionalDNA. All tumor tissue was serially sectioned using a cryostat and onlysections showing > 70% tumor cells were used for DNAextraction.
DNAmethods. High molecular weight DNAwas isolated from bothtissues and peripheral blood leukocytes using an Applied Biosystems,Inc., Foster City, CA 340A nucleic acid extractor. DNA(2.5 jug) wasdigested with a restriction enzyme, electrophoresed on a 0.8% agarosegel, and transferred to a nylon membrane (MSI) according to themethod of Southern (19). The membranes were then hybridized to anumber of DNAprobes (20-33) which were labeled with 32P by ran-dom priming (Amersham Corp., Arlington Heights, IL) (Table II). A
Table I. Description of Study Patients and Their Tumors
MedullaryPheochromocytomas thyroid carcinomas
Number of patients 41 1 1Age median (yr) 42 51
(range) (12-72) (32-76)Sex: male 34% 45%
female 66% 55%Sporadic 83% 91%Familial 17% 9%Ploidy status: Diploid 32% 0
Nondiploid 41% 0Unknown 27% 100%
locus was considered informative for a particular patient when theconstitutional DNAfrom that patient displayed two different alleles(i.e., heterozygosity at that locus). LOHwas scored only if there wasabsence or marked reduction in the intensity of one of the two allelebands (Fig. 1). In addition, visually assessed allele loss was confirmedby scanning densitometry. For all of the two allele probes, the residualabsorbance of the deleted band in tumor DNAwas normalized againstthe absorbance of the retained band in order to adjust for DNAcon-tent. The band in constitutional DNAcorresponding to the deletedband in tumor DNAwas similarly normalized. The normalized inten-sity of the deleted band in tumor DNAwas then divided by the normal-ized intensity of the corresponding band in constitutional DNAto ob-tain a relative intensity value. As shown in Fig. 2 a, when this analysiswas applied to any band from a negative tumor, the relative intensity ofthis band in comparison to the corresponding band in peripheral leu-kocyte DNAwas - 1.0. In contrast, all bands scored visually as beingdeleted had residual intensities varying from 0.0 to 0.3. Presumably,the residual signal results from the presence of contaminating normalDNAfrom stromal cells and/or infiltrating leukocytes, although thepossibility oftumor heterogeneity, with presence ofa neoplastic popula-tion lacking allelic loss, cannot be ruled out.
The above densitometric analysis had to be modified somewhat inorder to analyze the results of the pl-79 probe. This probe provides afingerprint pattern with 20-40 bands. The high interindividual variabil-ity of this probe is related to the presence of different copy numbers of acore sequence spanning 39-40 bp (21). LOHwith this probe is scoredas positive when one or more bands are deleted in tumor DNA(Fig. 1a) (34, 35). As noted by Genuardi et al. (34) in their analysis of breastcancers with the p1-79 probe, the banding pattern in constitutionalDNAconsists of a combination of bands. Somebands are unique toeach of the two chromosomes whereas others are common to bothchromosomes. With allelic loss, one typically sees loss of bands whichare specific for the deleted chromosome. In addition, bands which arecommon to both chromosomes are reduced in intensity by 50%. Fi-nally, bands unique to the retained chromosome remain unchanged inintensity. This is illustrated in Fig. 3 a, which is a densitometric scan ofthe p1 -79 (Taq 1) blot shown in Fig. 1 a. As is evident, band D, whichcorresponds to the arrow in Fig. 1 a, is deleted in tumor DNA. Inaddition, relative to band A, multiple other bands are reduced in inten-sity. Band A thus represents a band unique to the retained chromo-some, whereas bands B and C represent bands commonto both chro-mosomes. Band D, in contrast, is unique to the deleted chromosomeand absent in tumor DNA. Whenthe intensities of bands B and Carenormalized against band A in tumor and normal DNAand the relative
Table II. Description of Probes Used to Test for Allelic Loss
Restriction ChromosomalProbe endonuclease Locus localization References
AF3 PvuII FUCAl lp34-p35 20p1-79 PstI DIZ2 lp36.3p1-79 TaqI DIZ2 lp36.3 21pYNH24 TaqI D2S44 2pter-q32 22H3H2 HindlIl DNF1552 3p21 23p627 TaqI RAF1 3p25 24M4 BamHl D5S6 5ql 1.2-q13.3 25H-4IRBP Styl RBP3 lOq 11.2 26pMCK2 PvuII DlOS15 lOq 11.2 27p88RO.6 XbaI RB1 13q 14.2 28p3'HVR PstI D16S85 16p 13.3 29pYNZ22.1 BamHl D17S5 17p 13.3 30pTHH59 TaqI D17S4 17q23-q25.3 31p22-34 TaqI D22S9 22q1.-q 1.2 32pMS3-18 BglII D22S1 22q 11.12-qter 33
1692 Khosla, Patel, Hay, Schaid, Grant, van Heerden, and Thibodeau

a) T
Aw -7.0-_ftl -6.0
AF3
-23.1
0*
-2.0
pl-79(Pst 1)
T N
vf- -23 .1
-0__
Is
4..
Ii-U
b) T N- -2.3
-2-22 0H3H2
"W U-6.8'6.3
p627
d)-- .
.. .s.:-I. i-5.8.
p.3p22-34
-2.0p1-79(Taq 1)
C) T N
pYNZ22.1
Figure 1. Examples of allele losses inpheochromocytomas. (a) Chromo-some Ip probes AF3 and pl-79; (b)
U -9.5 chromosome 3p probes H3H2 andp627; (c) chromosome 17p probe
40w-6.5 pYNZ22. 1; and (d) chromosome 22qprobes P22-34 and PMS3-18. Tand
pMS3- 18 N refer to tumor and normal DNA(from peripheral leukocytes), respec-tively. Numbers on the right of figuresrefer to band sizes in kilobases.Arrows on the left of figures refer tobands missing in tumor DNA.
intensity values calculated, it is clear that bands Band Care reduced inintensity by - 50%. Fig. 3 b shows the corresponding densitometricplots from a tumor scored visually as negative. In this scan, every peakin normal DNAhas a corresponding peak in tumor DNAwith therelative intensities of all peaks remaining the same. Wetherefore con-firmed allelic loss in all our positive tumors by performing densitomet-ric scans on the autoradiograms and demonstrating each of the follow-ing: (a) the presence of retained bands relative to which numerousother bands were reduced in intensity; (b) the presence of unequivo-cally deleted bands with residual relative intensity values of < 30%; and(c) the presence of common bands which were reduced in relative in-tensity by 50%. This is summarized in Fig. 2 b which also indicates thatsuch an analysis on a sample of tumors scored visually as negative gaverelative intensity values of any given band in tumor DNAof - 1.0.
N-myc gene amplification. Weperformed analysis for possible N-myc gene amplification with the N-myc probe pNB-l, using the restric-tion endonuclease EcoRI (36). The membranes were concomitantlyhybridized with a known single copy marker, KM. 19 (locus D7S23,7q3 I -q32) (37). The signal for pNB-l was normalized against that for
1.21.1
1.0
42: 0.9'US 0.8
ID 0.70.6
. > 0.50
0.4c 0.3
0.20.1
0
KM. 19 and N-myc amplification scored only if there was 2 2-fold in-crease in the above ratio.
Nuclear DNAploidy status. The study material consisted of paraf-fin-embedded tissue blocks of the pheochromocytomas. Hematoxylinand eosin stained slides were made of 6-1sM thick sections from thefront and back of each pheochromocytoma block analyzed. Theseslides were all examined by a pathologist to ensure the presence oftumor tissue in the 40-,sM thick sections used for analysis of DNAcontent. Nuclear suspensions were prepared for the paraffin-embeddedtissue blocks and the isolated nuclei stained with propidium iodide bystandard methods (38). Nuclear DNAcontent was measured on aFACS" IV flow cytometer (Becton Dickinson & Co., Mountain View,CA), connected with a computer programmed to perform cell cycleanalysis according to the method of Dean and Jett (39). The DNAhistogram patterns were then analyzed and classified as either DNAnormal (diploid) or DNAnondiploid.
Clinical analysis. The clinical histories for all the MTCandpheochromocytoma patients were reviewed and the following informa-tion was extracted: sex, age, benignancy versus malignancy of the tu-
.0
3
AI
_0 0
-
-F
Negatives AF3 H3H2 p627 pYNZ22.1 p22-34
3
.1
pMS3-18 Negatives Reduced DeletedI pl-79
Figure 2. Densitometricanalysis of tumors. Hori-zontal lines represent themean values for relativeintensity. (a) Two alleleprobes; and (b) the finger-print probe p1-79.
Genetic Alterations in Pheochromocytomas and Medullary Thyroid Cancers 1693
(b)(a)
0 --T-
0
.

1.0
0.8
0.6
0.4
a)cJ
~o-0a,D00
0.2
0
1.0
0.8
0.6
0.4f
00.2 *f t0 8 16 24 32 40 48 56 64
mm
Figure 3. (a) Densitometric scan of the autoradiogram shown in Fig. 1a for the p 1 -79 (Taq 1) blot. This tumor was scored visually as posi-tive. Solid line represents the normal DNAautoradiogram and thedashed line represents the tumor DNAautoradiogram. Numbers inparentheses next to bands A, B, C, and D are the calculated relativeintensities of the bands in tumor DNAversus constitutional DNA,based on a normalization against the preserved band A; and (b) den-sitometric scan of an autoradiogram from a tumor scored visually asnegative for allelic loss.
mor, familial versus sporadic tumor, tumor volume, nuclear ploidystatus, preoperative plasma calcitonin level (MTC), or preoperativeurine metanephrine (pheochromocytomas).
Statistical methods. The incidence of allelic loss was calculated bydividing the number of tumors demonstrating loss by the total numberof tumors informative with a particular probe. Where more than oneprobe was used in a given chromosomal region, an aggregate percent-age was calculated. For this, the number of tumors demonstrating losswith either probe was divided by the total number informative witheither probe. For our data, we judged an incidence of 3% to be thehighest anticipated incidence of background loss (see below and TableIII). For each probe/enzyme combination, we report P values, com-puted by the binomial distribution, testing whether the observed inci-dence was significantly greater than a background loss of 3%. Wealsoreport 95%confidence intervals to demonstrate the range of percentageallelic loss which is consistent with our data.
The association of allelic loss on chromosomes Ip, 3p, 22q, and 17pwith patient demographic and clinical characteristics was assessed byuse of Fisher's exact test for contingency tables when patient character-istics were dichotomous (sex, sporadic versus familial, diploid versusnondiploid). The distributions of continuous characteristics (age, tu-mor volume, urinary metanephrine excretion) were compared betweenpatients with and without allelic loss by the Wilcoxon rank sumstatistic.
Results
Chromosome 10 losses. As noted in earlier studies (1 1, 12),LOH in the region of the MEN2A locus was found to be anuncommon event both in the pheochromocytomas and theMTCs(Tables III and IV). Only 1 of 22 informative pheochro-mocytomas (5%) demonstrated allelic loss in that region. Noneof the 7 informative MTCs were positive. None of the 3pheochromocytoma patients with MEN2 were informativewith either chromosome 10 marker. Thus, our results include
Table III. Allelic Loss in Pheochromocytomas
Number Number with Percentage AggregateChromosome Probe/Locus informative allele loss LOH LOH
lOq 11.2 H4-IRBP/RBP3 17 0 0%(0-20)
lOq 11.2 pMCK2/DlOSl5 9 1 I1 %* (1/22) 5%(0.3-48) (0.1-23)
1 p34-p35 AF3/FUCA1 15 5 33%*(12-62)
1 p 36.3 p1-79/D1Z2 25 12 48%* (13/31) 42%*(28-69) (25-61)
3p 21 H3H2/DNF1552 24 4 17%*(5-37)
3p25 p627/RAFI 18 2 Il%* (5/31) 16%*(1-35) (5-34)
17p 13.3 pYNZ22l/D17S5 29 7 24%* (7/29) 24%*(10-44) (10-44)
22ql 1.1-ql l.2 p22-34/D22S9 18 5 28%*(10-53)
22qI 1.2-qter pMS3-18/D22S1 16 5 31%* (9/29) 31%*(11-59) (15-31)
2p pYNH24/D2S44 34 1 3% (1/34) 3%5q1 1.2-q13.3 M4/D5S6 10 0 0% (0/10) 0%13q 14.2 p88RO.6/RBI 12 0 0% (0/12) 0%16p 13.3 p3'HVR.64/D16S85 34 0 0% (0/34)0%
Number in parentheses indicate 95% confidence intervals. * P < 0.05; * P < 0.001.
1694 Khosla, Patel, Hay, Schaid, Grant, van Heerden, and Thibodeau

Table IV. Allelic Loss in Medullary Thyroid Carcinomas
Number Number with Percentage AggregateChromosome Probe/Locus informative allele loss LOH LOH
lOq 11.2 H4-IRBP/RBP3 5 0 0%(0-52)
lOq 11.2 pMCK2/D1OS15 4 0 0% (0/7) 0%(0-60) (0-41)
1p35-p34 AF3/FUCA1 4 1 25%*(0.6-81)
lp 36.3 pl-79/D1Z2 11 1 9%* (1/11) 9%*(0.2-41) (0.2-41)
3p21 H3H2/DNF1552 6 0 0%(0-46)
3p25 p627/RAFI 4 0 0% (0/7) 0%(0-60) (0-41)
17p 13.3 YNZ22.1/D17S5 11 0 0% (0/11)0%(0-28) (0-28)
22q1 1. I-q1.2 p22-34/D22S9 6 1 17%*(0.4-64)
22q1 1.2-qter pMS3-18/D22S1 7 1 14%* (2/10) 20%*(0.4-58) (3-57)
2p YNH24/D2S44 8 0 0% (0/8) 0%5qI 1.2-q 13.3 M4/D5S6 7 0 0% (0/7) 0%13q 14.2 p88R0.6/RBI 4 0 0% (0/4) 0%16p13.3 3'HVR/Dl6S85 9 0 0% (0/9) 0%
Numbers in parentheses indicate 95% confidence intervals. * P < 0.05.
only patients with sporadic pheochromocytomas. The patientwith familial MTCwas also uninformative with both probes.
Other allelic losses: pheochromocytomas. The region ofmost dramatic allelic loss in the pheochromocytomas was onchromosome 1 p (Table III). Overall, 13 of 31 informativepheochromocytomas (42%) demonstrated LOHon the distalportion of I p. For comparative purposes, the RBI locus on 1 3qas well as several random probes on 2p, 5q, and 16p were usedto provide a "background" rate of allelic losses in pheochromo-cytomas. Pheochromocytomas tended to be chromosomallystable, with our highest background rate being 3%on 2p. Whencompared with this background rate of 3%, the 42% loss notedon lp was highly statistically significant (P < 0.001).
Fig. 1 a shows representative blots demonstrating alleliclosses with the lp probes AF3 and p 1-79. As noted earlier,probe p 1-79 provided a fingerprint pattern with 20-40 bands.The high interindividual variability of this probe is related tothe presence of different copy numbers of a core sequencespanning 39-40 bp (21). LOHwith the probe is scored as posi-tive when one or more bands are deleted in tumor DNA(Fig. 1a and references [34 and 35]). Because the banding pattern maybe difficult to interpret, a tumor was scored as positive for LOHonly if it demonstrated LOHafter digestion with two restric-tion endonucleases, PstI and TaqI. In addition, since even asmall amount of DNAdegradation makes the banding patterndifficult to interpret, any tumor where this was noted wasscored as uninformative. As a control, and to eliminate thepossibility of technical artifact, 20 colon carcinomas and 10osteogenic sarcomas were concomitantly analyzed with p 1-79and none demonstrated LOH (data not shown). Finally, asnoted earlier, we performed a detailed densitometric analysis
on all tumors scored visually as positive and demonstrated thepresence of clearly deleted bands as well as other bands whichwere reduced in intensity by 50% (Figs. 2 b and 3). Of thetumors positive for LOHon 1 p, one tumor was positive withthe more distal pl-79 probe (1p36.3) but negative with themore proximal AF3 probe (lp34-35). In contrast to studieswith neuroblastomas demonstrating a correlation betweenLOHon lp and N-myc gene amplification (35), none of ourpheochromocytomas demonstrated amplification of N-myc(data not shown).
In addition to lp, pheochromocytomas also demonstratedsignificant LOHon 22q, 3p and 17p (Table III, Fig. 1). None ofthe 12 informative pheochromocytomas had LOHat the RB1locus, arguing against a role for the retinoblastoma gene inpheochromocytoma formation. Our patient with VHL andpheochromocytoma had no LOH at 3p. Both our NF 1 pa-tients were also negative for LOHon 17p. Weanalyzed thepheochromocytomas for LOHon 17p even though the NF 1gene lies on 1 7q 1 1.2 (17, 18), because LOHin NF 1 associatedtumors may occur principally on 1 7p (17). Furthermore, thep53 gene, which is involved in colorectal cancer and possiblyseveral other tumors (40), lies on 17p1 3.1. Wedid, however,examine the 7 sporadic pheochromocytomas that demon-strated LOHon 1 7p (Table III) for LOHon 1 7q with the probepTHH59 (17q23-q25.3). Of the 7 tumors, 3 were negative, 3were uninformative, and only 1 demonstrated LOHfor the 1 7qmarker.
In Table V, we compare rates of allelic losses in sporadicversus familial pheochromocytomas. As is evident, while thenumber of familial tumors was relatively small, there appearedto be no differences in the overall rates of allelic losses.
Genetic Alterations in Pheochromocytomas and Medullary Thyroid Cancers 1695
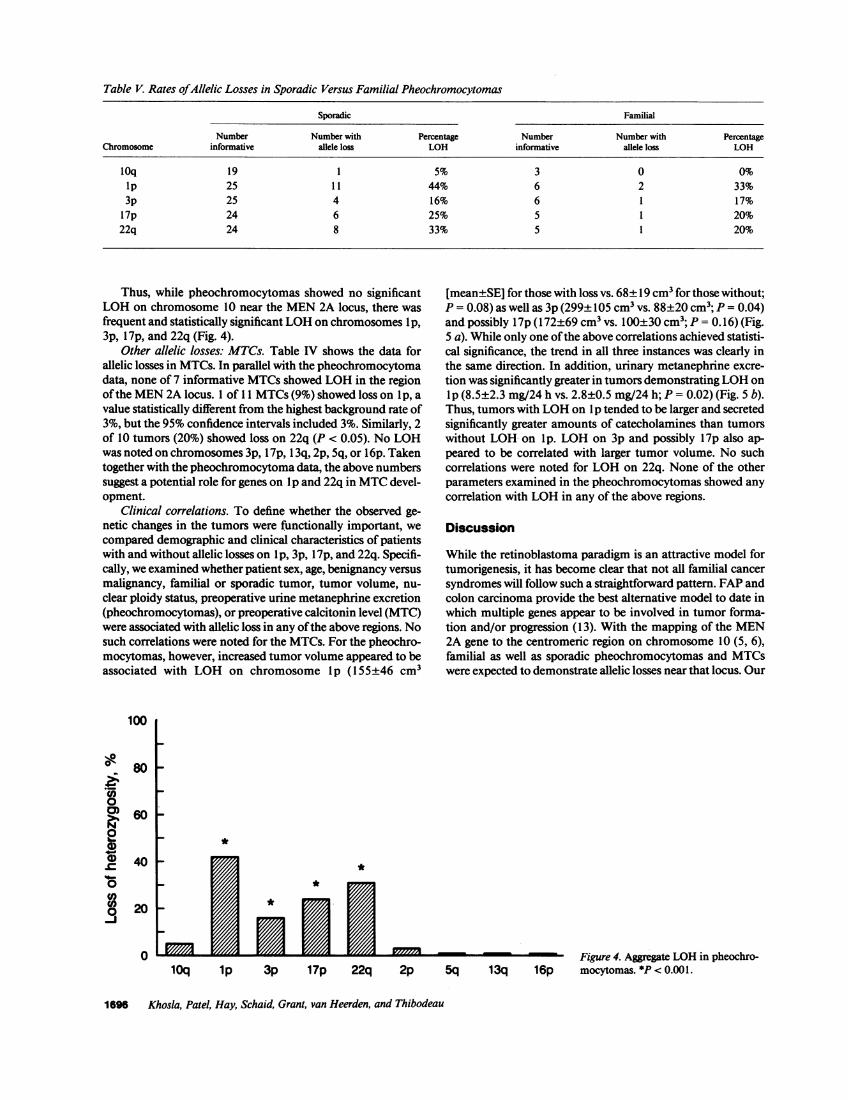
Table V. Rates ofAllelic Losses in Sporadic Versus Familial Pheochromocytomas
Sporadic Familial
Number Number with Percentage Number Number with PercentageChromosome informative allele loss LOH informative allele loss LOH
10q 19 1 5% 3 0 0%ip 25 1 1 44% 6 2 33%3p 25 4 16% 6 1 17%
17p 24 6 25% 5 1 20%22q 24 8 33% 5 1 20%
Thus, while pheochromocytomas showed no significantLOHon chromosome 10 near the MEN2A locus, there wasfrequent and statistically significant LOHon chromosomes lp,3p, 17p, and 22q (Fig. 4).
Other allelic losses: MTCs. Table IV shows the data forallelic losses in MTCs. In parallel with the pheochromocytomadata, none of 7 informative MTCsshowed LOHin the regionof the MEN2A locus. 1 of 11 MTCs(9%) showed loss on Ip, avalue statistically different from the highest background rate of3%, but the 95%confidence intervals included 3%. Similarly, 2of 10 tumors (20%) showed loss on 22q (P < 0.05). No LOHwas noted on chromosomes 3p, 17p, 13q, 2p, 5q, or 16p. Takentogether with the pheochromocytoma data, the above numberssuggest a potential role for genes on lp and 22q in MTCdevel-opment.
Clinical correlations. To define whether the observed ge-netic changes in the tumors were functionally important, wecompared demographic and clinical characteristics of patientswith and without allelic losses on lp, 3p, 17p, and 22q. Specifi-cally, we examined whether patient sex, age, benignancy versusmalignancy, familial or sporadic tumor, tumor volume, nu-clear ploidy status, preoperative urine metanephrine excretion(pheochromocytomas), or preoperative calcitonin level (MTC)were associated with allelic loss in any of the above regions. Nosuch correlations were noted for the MTCs. For the pheochro-mocytomas, however, increased tumor volume appeared to beassociated with LOH on chromosome lp (155±46 cm3
0A
0)Z.r20
0)
ilte0-J
100
80
60
40
20
0
[mean±SE] for those with loss vs. 68±19 cm3 for those without;P = 0.08) as well as 3p (299±105 cm3 vs. 88+20 cm3; P = 0.04)and possibly 17p (172±69 cm3 vs. 100±30 cm3; P = 0.16) (Fig.5 a). While only one of the above correlations achieved statisti-cal significance, the trend in all three instances was clearly inthe same direction. In addition, urinary metanephrine excre-tion was significantly greater in tumors demonstrating LOHonlp (8.5±2.3 mg/24 h vs. 2.8±0.5 mg/24 h; P = 0.02) (Fig. 5 b).Thus, tumors with LOHon lp tended to be larger and secretedsignificantly greater amounts of catecholamines than tumorswithout LOHon lp. LOHon 3p and possibly 17p also ap-peared to be correlated with larger tumor volume. No suchcorrelations were noted for LOHon 22q. None of the otherparameters examined in the pheochromocytomas showed anycorrelation with LOHin any of the above regions.
Discussion
While the retinoblastoma paradigm is an attractive model fortumorigenesis, it has become clear that not all familial cancersyndromes will follow such a straightforward pattern. FAPandcolon carcinoma provide the best alternative model to date inwhich multiple genes appear to be involved in tumor forma-tion and/or progression (13). With the mapping of the MEN2A gene to the centromeric region on chromosome 10 (5, 6),familial as well as sporadic pheochromocytomas and MTCswere expected to demonstrate allelic losses near that locus. Our
*
*
lOq 1p 3p 17p 22q 2pFigure 4. Aggregate LOHin pheochro-
5q 13q 16p mocytomas. *P < 0.001.
1696 Khosla, Patel, Hay, Schaid, Grant, van Heerden, and Thibodeau

500
C-)
6E
E
400
300
200
12
14, 10cm
CDE 6
a)C;
a)
CS 4
C2!.c 2100
1p 3p 17p 1p
Figure 5. (a) Tumor volume (cm3) in pheochromocytomas withoutloss and with loss on chromosomes I p, 3p, and 1 7p; and (b) urinarymetanephrine excretion (mg/24 h) in pheochromocytomas withoutIp loss and with Ip loss. *P < 0.05.
study and two previous ones show conclusively that this is notthe case (1 1, 12). In analogy with FAP, Nelkin et al. proposedthat in familial pheochromocytomas and MTCs, the inheritedabnormality on chromosome 10 maypredispose to hyperplasiawith subsequent changes on other chromosomes contributingto the transformation to pheochromocytoma or MTC(12). In-deed, C cell and adrenomedullary hyperplasia is a well estab-lished premalignant lesion in familial pheochromocytoma andMTC, and may represent the phenotypic consequence of thegerm line mutation in the MEN2A gene (41, 42).
If the above model is correct, then one would expect to findother genetic alterations in pheochromocytomas and MTCsthat may contribute to tumor formation and/or progression.Because of the scarcity of these tumors, it has been difficult toperform an allelic loss study on these tumors that would havestatistical validity. Mathew et al., for example, noted LOHonlp in four of six pheochromocytomas and three of eight MTCs(14). In a more recent study, Yang et al. published data on onepheochromocytoma and seven MTCs, with five of their eighttumors demonstrating allelic loss on lp (15). Mathew et al. didexamine background rates of allelic loss, but because of thesmall numbers, no formal statistical analysis was possible.
Wepresent here data on a large number of pheochromocy-tomas demonstrating statistically significant LOHon lp, 3p,1 7p, and 22q. These data thus provide support for the multi-step model oftumorigenesis proposed by Nelkin for MEN2-as-sociated tumors. Wefurther demonstrate that LOHon lp isassociated with a clinically important tumor marker, namelyurinary metanephrine excretion. In addition, LOHon lp, 3p,and 1 7p was associated with increased tumor volume, althoughthe relationship was statistically significant only for 3p. Theabove data suggests that the genetic changes are not randominconsequential events, but rather potentially involved in tu-mor formation and/or progression. The fact that chromosomelp and 3p changes were present predominantly in larger tu-mors suggests that these particular changes may in fact be moreimportant in tumor progression rather than formation. Theissue of the specific order in which the genetic changes de-scribed in these tumors might occur is beyond the scope ofthese studies.
Of note, each of the chromosomal regions where we notedLOHhas been shown in other studies to harbor a potential
tumor suppressor gene. In addition to pheochromocytomasand MTCs, LOHon I p has been noted in neuroblastomas (35),breast cancer (34), and familial melanoma (43). Takai et al.(16) have also shown LOHon 22q in one of nine MTCsandtwo of five pheochromocytomas tested. Chromosome 22qlosses have also been demonstrated in meningiomas andacoustic neuromas (44). Interestingly, the gene for NF2, whichleads to familial acoustic neuromas and meningiomas, hasbeen mapped by linkage analysis to the same region of chromo-some 22 that appears to be lost in the above tumors (6).
Chromosome 1 7p deletions have most commonly been as-sociated with colorectal cancer and there is strong evidence forinvolvement of the p53 gene on 17p 13-1 in the pathogenesis ofcolon carcinomas (13). Allelic loss and point mutations involv-ing the p53 gene have also been demonstrated for a variety oftumors including brain, breast, lung, and in a neurofibrosar-coma from a patient with NF 1 (40). In this study, 7 of 29pheochromocytomas (24%) demonstrated LOHon 17p. Fur-ther evidence for involvement ofthe p53 gene in the pathogene-sis of pheochromocytomas would come from direct sequenceanalysis of the p53 gene, particularly in the 7 tumors demon-strating allelic losses on 17p. These studies are currently inprogress.
Chromosome 3p deletions have been described in renal cellcarcinomas (45) as well as lung carcinomas (46). In addition,the gene for VHL, which leads to inherited retinal angiomas,cerebellar hemangioblastomas, renal carcinomas, andpheochromocytomas, has been mapped to the distal portion of3p by linkage analysis (8). Our studies suggest that some spo-radic pheochromocytomas do harbor allelic losses in the regionof this presumed tumor suppressor gene.
While the presence of allelic losses on chromosome 1 p, 22q,1 7p, and 3p suggest a mechanism involving loss of tumor sup-pressor genes, several alternative interpretations are also possi-ble. As Mathew et al. have suggested for chromosome 1 (14), itis possible that mutations in oncogenes on one of the abovechromosomes followed by loss of the corresponding wild-typealleles may then lead to cooperation between the mutant onco-genes and the MEN2 gene. While not providing mechanisticexplanations, our findings do suggest potential chromosomalregions that may harbor genes important in pheochromocy-toma development.
The statistical validity of our analysis depends to some de-gree on how accurately we succeeded in assessing backgroundrates of loss in these tumors. In assessing three essentially ran-dom loci (2p, Sql 1.2-q 13.3, 16p13.3) as well as the Rb locus(1 3q 14.2), the highest rate of loss we observed was 3%. Norandom losses were observed in the MTCs. These data arguethat these tumors tend to be chromosomally stable, thus per-mitting the type of statistical analysis used in this study. Fur-ther support for the chromosomal stability of these tumorscomes from the study of Landsvater et al. (1 1), where only 4loci of 241 informative comparisons (on chromosomes otherthan 10 or 1) in 14 pheochromocytomas and 28 MTCsshowedevidence for LOH. Expressing our data in analogous terms,only 1 of 118 informative comparisons in the backgroundprobes (2p, 5q, 1 3q, 1 6p) showed LOH(Tables III and IV).
In summary, these studies provide evidence for significantLOH in pheochromocytomas on chromosome lp, 22q, 17p,and 3p. Combined with the lack of allelic loss near the MEN2A locus, these data provide further support for the hypothesis
Genetic Alterations in Pheochromocytomas and Medullary Thyroid Cancers 1697

that tumongenesis in MEN2A-associated tumors may follow a
more complex pathway than the simple retinoblastoma para-
digm. Our data do not exclude the involvement of other, as yet
undefined, genetic alterations that may contribute to tumor
formation. These studies do, however, provide important cluesfor future studies aimed at a more precise elucidation of thegenetic changes in these tumors.
Acknowledgments
The authors thank Dr. B. N. White for the p22-34 probe, Dr. R. Whitefor the pMS3-18 and pTHH59 probes, Dr. X. Estivill for the KM. 19probe, and Dr. T. Dryja for the p88R0.6 probe. All other probes were
obtained from the American Type Culture Collection. The authorswould also like to thank Dr. Richard M. Weinshilboum for access to
the pheochromocytomas that had been frozen at the Mayo Clinic over
the past eight years.
The authors would also like to thank Dr. Hunter Heath III, and Dr.
Norman L. Eberhardt for their suggestions and critiques, as well as SueBeilke for secretarial assistance.
This work was supported by a grant from the Mayo Foundation.
References
1. Ponder, B. 1988. Gene losses in human tumours. Nature (Lond.). 335:400-402.
2. Lee, W. H., J. Shew, F. D. Hong, T. W. Sery, L. A. Donoso, L. Young, R.Bookstein, and E. Y. P. Lee. 1987. The retinoblastoma susceptibility gene en-
codes a nuclear phosphoprotein associated with DNAbinding activity. Nature(Lond.). 329:642-645.
3. Friend, S. H., T. P. Dryja, and R. A. Weinberg. 1988. Oncogenes andtumor-suppressing genes. N. Engl. J. Med. 318:618-622.
4. Larsson, C., B. Skogseid, K. Oberg, Y. Nakamura, and M. Nordenskjold.1988. Multiple endocrine neoplasia type 1 gene maps to chromosome 11 and islost in insulinoma. Nature (Lond.). 332:85-87.
5. Mathew, C. G. P., K. S. Chin, D. F. Easton, K. Thorpe, C. Carter, G. I.Liou, S. L. Fong, C. D. B. Bridges, H. Hank, A. C. Niewenhuijzen Kruseman, S.Schifter, H. H. Hansen, H. Telenins, M. Telenins-Berg, and B. A. J. Ponder.1987. A linked genetic marker for multiple endocrine neoplasia type 2A on chro-mosome 10. Nature (Lond.). 328:527-530.
6. Simpson, N. E., K. K. Kidd, P. J. Goodfellow, H. McDermid, S. Myers,J. R. Kidd, C. E. Jackson, A. M. V. Duncan, L. A. Farrer, K. Brasch, C. Castig-lione, M. Genel, J. Gertner, C. R. Greenberg, J. F. Gusella, J. J. A. Holden, and B.N. White. 1987. Assignment of multiple endocrine neoplasia type 2A to chromo-some 10 by linkage. Nature (Lond.). 328:528-530.
7. Wertelecki, W., G. A. Rouleau, D. W. Superneau, L. W. Forehand, J. P.Williams, J. L. Haines, and J. F. Gusella. 1988. Neurofibromatosis 2: Clinical andDNAlinkage studies of a large kindred. N. Engl. J. Med. 319:278-283.
8. Seizinger, B. R., G. A. Rouleau, L. J. Ozelius, A. H. Lane, G. E. Farmer,J. M. Lamiell, J. Haines, J. W. M. Yuen, D. Collins, D. Majoor-Krakaner, et al.1988. Von Hippel-Lindau disease maps to the region of chromosome 3 associatedwith renal cell carcinoma. Nature (Lond.). 332:268-269.
9. Bodmer, W. F., C. J. Bailey, J. Bodmer, H. J. R. Bussey, A. Ellis, P. Gor-man, F. C. Lucibello, V. A. Murday, S. H. Rider, P. Scrambler, D. Sheer, E.Solomon, and N. K. Spur. 1987. Localization of the gene for familial adenoma-tous polyposis on chromosome 5. Nature (Lond.). 328:614-616.
10. Leppert, M., M. Dobbs, P. Scrambler, P. O'Connell, Y. Nakamura, D.Stauffer, S. Woodward, R. Burt, J. Hughes, E. Gardner, M. Lathrop, J. Wasmuth,J. M. Lalouel, and R. White. 1987. The gene for familial polyposis coli maps tothe long arm of chromosome 5. Science (Wash. DC). 238:1411-1413.
11. Landsvater, R. M., C. G. P. Mathew, B. A. Smith, E. M. Marcus, G. T.Meerman, C. J. M. Lips, R. A. Geerdink, Y. Nakamura, B. A. J. Ponder, andC. H. C. M. Buys. 1989. Development of multiple endocrine neoplasia type 2Adoes not involve substantial deletions of chromosome 10. Genomics. 4:246-250.
12. Nelkin, B. D., Y. Nakamura, R. W. White, A. C. de Bustros, J. Herman,S. A. Wells, Jr., and S. B. Baylin. 1989. Low incidence of loss of chromosome 10in sporadic and hereditary human medullary thyroid carcinoma. Cancer Res.49:4114-4119.
13. Vogelstein, B., and E. R. Fearon. 1990. A genetic model for colorectaltumorigenesis. Cell. 61:759-767.
14. Mathew, C. G. P., B. A. Smith, K. Thorpe, Z. Wong, N. J. Royle, A. J.
Jeffreys, and B. A. J. Ponder. 1987. Deletion of genes on chromosome I inendocrine neoplasia. Nature (Lond.). 328:524-526.
15. Yang, K. P., C. V. Nguyen, S. C. Castillo, and N. A. Samaan. 1990.Deletion mapping on the distal third region of chromosome Ip in multiple endo-crine neoplasia type IIA. Anticancer Res. 10:527-534.
16. Takai, S. H., H. Tateishi, I. Nishisho, T. Miki, K. Motomura, A. Miuau-chi, M. Kato, T. Ikeuchi, K. Yamamoto, M. Okazuki, M. Yamamoto, T. Nunjo,Y. Kumahara, and T. Mori. 1987. Loss of genes on chromosome 22 in medullarythyroid carcinoma and pheochromocytoma. Jpn. J. Cancer Res. 78:894-898.
17. Cawthon, R. M., R. Weiss, G. Xu, D. Viskochil, M. Culver, J. Stevens, M.Robertson, D. Dunn, R. Gesteland, P. O'Connell, and R. White. 1990. A majorsegment of the neurofibromatosis type 1 gene: cDNAsequence, genomic struc-tures, and point mutations. Cell. 62:193-201.
18. Wallace, M. R., D. A. Marchuk, L. B. Anderson, R. Letcher, H. M. Odeh,A. M. Saulino, J. W. Fountain, A. Brereton, J. Nicholson, A. L. Mitchell, B. H.Brownstein, and F. S. Collins. 1990. Type 1 neurofibromatosis gene: identifica-tion of a large transcript disrupted in three NFI patients. Science (Wash. DC).249:181-186.
19. Southern, E. 1975. Detection of specific sequences among DNA frag-ments separated by gel electrophoresis. J. Mol. Biol. 98:503-517.
20. Fowler, M. L. H. Nakai, M. G. Byers, H. Fukushima, R. L. Eddy, W. M.Henry, L. L. Haley, S. O'Brien, and T. B. Shows. 1986. Chromosome 1 localiza-tion of the human alpha-L-fucosidase structural gene with a homologous site onchromosome 2. Cytogenet. Cell Genet. 43:103-108.
21. Buroker, N., R. Bestwick, G. Haight, R. E. Magenis, and M. Litt. 1987. Ahypervariable repeated sequence on chromosome lp 36. Hum. Genet. 77:175-181.
22. Nakamura, Y., S. Gillilan, P. O'Connell, M. Leppert, G. M. Lathrop,J. M. Lalouel, and R. White. 1987. Isolation and mapping ofa polymorphic DNAsequence pYNH24 on chromosome 2 (D2S44). Nucleic Acids Res. 15:10073.
23. Carriet, B., H. M. Welch, N. J. Parry-Jones. 1986. Sequences homologousto the human D1Sl locus present on human chromosome 3. Am. J. Hum. Genet.38:428-436.
24. Bonner, T., S. J. O'Brien, W. G. Nash, U. R. Rapp, C. C. Morton, and P.Leder. 1984. The human homologs of the raf (mil) oncogene are located onhuman chromosomes 3 and 4. Science (Wash. DC). 223:71-74.
25. Dietzsch, E., A. E. Retief, M. J. Lotze, L. Warnich, D. L. Nicholson, M. F.Fox, J. Fricke, L. De Plessiss, and C. J. J. Oosthuizen. 1986. An annonymoushuman single copy genomic clone, D5S6(M4) on chromosome 5 identifies a threeallele RFLP. Nucleic Acids Res. 14:1923.
26. Chin, K. S., C. G. P. Mathew, S. L. Fong, C. D. B. Bridges, and B. A. J.Ponder. 1988. Sty 1 RFLP recognised by a human IRBP cDNA localised tochromosome 10. Nucleic Acids Res. 16:1645.
27. Nakamura, Y., M. Carlson, K. Krapcho, J. Gill, P. O'Connell, M. Lep-pert, G. M. Lathrop, J. M. Lalouel, and R. White. 1988. Isolation and mapping ofa polymorphic DNAsequence pMCK2on chromosome 10. Nucleic Acids Res.16:374.
28. Wiggs, J., M. Nordenskjold, D. Yandell, J. Rapaport, V. Grondin, M.Janson, B. Werelins, R. Petersen, A. Craft, K. Reidel, R. Liberfarb, D. Walton,W. Wilson, and T. P. Dryja. 1988. Prediction of the risk of hereditary retinoblas-toma, using DNApolymorphisms within the retinoblastoma gene. N. Engl. J.Med. 318:151-157.
29. Higgs, D. R., J. S. Wainscoat, J. Flint, A. V. S. Hill, S. L. Thein, R. D.Nicholls, H. Teal, H. Ayynb, T. E. A. Peto, A. G. Falusi, A. P. Jarman, J. B. Clegg,and D. J. Weatherall. 1986. Analysis of human adult alpha-globin gene clusterreveals a highly informative genetic locus. Proc. Natl. Acad. Sci. USA. 83:5165-5169.
30. Lothe, R. A., Y. Nakamura, S. Woodward, T. Gedd-Dahl, Jr., and R.White. 1988. VNTR(variable number of tandem repeats) markers show loss ofchromosome 17p sequences in human colorectal carcinomas. Cytogenet. CellGenet. 48:167-169.
31. Nakamura, Y., T. Holm, S. Gillilan, M. Leppert, P. O'Connell, G. M.Lathrop, J. M. Lalouel, and R. White. 1988. Isolation and mapping of a polymor-phic DNAsequence (pTHH59) on chromosome 17q(D17S4). NucleicAcids Res.16:3598.
32. McDermid, H., A. M. V. Duncan, K. Brasch, J. Burn, J. J. A. Holden, N.Kardon, E. Magenis, B. Noel, A. Schinzel, I. Teshima, and B. N. White. 1985.Molecular analysis of the supernumerary chromosome in Cat Eye Syndrome.Cytogenet. Cell Genet. 40:695-696.
33. Barker, D., M. Schafer, and R. White. 1984. Restriction sites containingCpGshow a higher frequency of polymorphism in human DNA. Cell. 36:131-138.
34. Genuardi, M., H. Tsihira, D. E. Anderson, and G. F. Saunders. 1989.Distal deletion of chromosome Ip in ductal carcinoma of the breast. Am. J. Hum.Genet. 45:73-82.
35. Fong, C., N. C. Dracopoli, P. S. White, P. T. Merrill, R. C. Griffith, D. E.Honsman, and G. M. Brodeur. 1989. Loss of heterozygosity fo the short arm ofchromosome 1 in human neuroblastomas: Correlation with N-myc amplifica-tion. Proc. Natl. Acad. Sci. USA. 86:3753-3757.
1698 Khosla, Patel, Hay, Schaid, Grant, van Heerden, and Thibodeau

36. Stanton, L. W., M. Schwab, and J. M. Bishop. 1986. Nucleotide sequenceof the human N-myc gene. Proc. Natd. Acad. Sci. USA. 83:1772-1776.
37. Estivill, X., P. J. Scrambler, B. J. Wainwright, K. Hawley, P. Frederick, M.Schwartz, M. Baiget, J. Kere, R. Williamson, and M. Farral. 1987. Patterns ofpolymorphism and linkage disequilibrium for cystic fibrosis. Genomics. 1:257-263.
38. Ryan, J. J., I. D. Hay, C. S. Grant, L. M. Rainwater, G. M. Farrow, andJ. R. Goellner. 1988. Flow cytometric DNAmeasurements in benign and malig-nant Hurthle cell tumors of the thyroid. World J. Surg. 12:482-287.
39. Dean, P. J., and J. H. Jett. 1974. Mathematical analysis of DNAdistribu-tion derived from flow microfluorometry. J. Cell Biol. 60:523-528.
40. Nigro, J. M., S. J. Baker, A. C. Preisinger, J. M. Jessup, R. Hostetter, K.Cleary, S. H. Bigner, N. Davidson, S. Baylin, P. Devilee, T. Glover, F. S. Collins,A. Weston, R. Modali, C. C. Harris, and B. Vogelstein. 1989. Mutation in the p53gene occur in diverse human tumour types. Nature (Lond.). 342:705-708.
41. Wolfe, H. J., K. E. W. Melvin, S. J. Cervi-Skinner, A. A. A. Sandi, J. F.Juliar, C. E. Jackson, and A. H. Tashjian, Jr. 1973. C-cell hyperplasia precedingmedullary thyroid carcinoma. N. Engl. J. Med. 289:437-441.
42. DeLellis, R. A., H. J. Wolfe, R. F. Gagel, Z. T. Feldman, H. H. Miller,D. L. Gang, and S. Reichlin. 1976. Adrenal medullary hyperplasia: a morphomet-ric analysis in patients with familial medullary thyroid carcinoma. Am. J. Pathol.83:177-196.
43. Bale, S. J., N. C. Dracopoli, M. A. Tucker, W. H. Clark, M. C. Fraser, B. Z.Stanger, P. Green, H. Donis-Keller, D. E. Housman, and M. H. Greene. 1989.Mapping the gene for hereditary cutaneous malignant melanoma-dysplastic ne-vus to chromosome lp. N. Engl. J. Med. 320:1367-1372.
44. Okazaki, M., I. Nichisho, H. Tateishi, K. Motomura, M. Yamamoto, T.Miki, T. Hayakawa, S. Takai, T. Honjo, and T. Mori. 1988. Loss of genes on thelong arm of chromosome 22 in human meningiomas. Mol. Biol. Med. 5:15-22.
45. Kovacs, G., R. Erlandsson, F. Boldog, S. Ingvarsson, R. Mtlller-Brechlin,G. Klein, and J. Sumeg. 1988. Consistent chromosome 3p deletion and loss ofheterozygosity in renal cell carcinoma. Proc. NatL. Acad. Sci. USA. 85:1571-1575.
46. Sithanandam, G., M. Dean, V. Brennscheidt, T. Beck, A. Gazdar, J. D.Minna, H. Branch, B. Zbar, and V. R. Rapp. 1989. Loss of heterozygosity at thec-raf locus in small cell lung carcinoma. Oncogene. 4:451-455.
Genetic Alterations in Pheochromocytomas and Medullary Thyroid Cancers 1699