hewlett packard enterprise confidential information · hewlett packard enterprise confidential...
TRANSCRIPT
#SeizeTheData
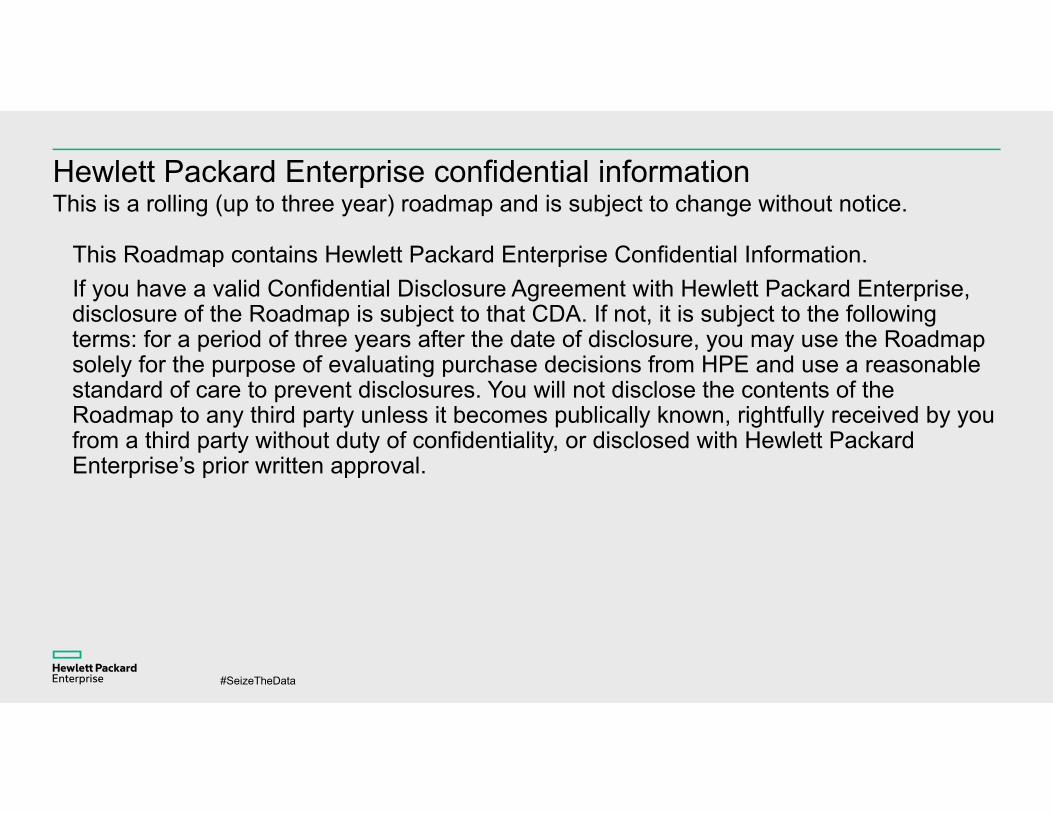
Hewlett Packard Enterprise confidential informationThis is a rolling (up to three year) roadmap and is subject to change without notice.
This Roadmap contains Hewlett Packard Enterprise Confidential Information. If you have a valid Confidential Disclosure Agreement with Hewlett Packard Enterprise, disclosure of the Roadmap is subject to that CDA. If not, it is subject to the following terms: for a period of three years after the date of disclosure, you may use the Roadmap solely for the purpose of evaluating purchase decisions from HPE and use a reasonable standard of care to prevent disclosures. You will not disclose the contents of the Roadmap to any third party unless it becomes publically known, rightfully received by you from a third party without duty of confidentiality, or disclosed with Hewlett Packard Enterprise’s prior written approval.

Internet of Things predictive analytics in HPE Vertica
Vincent Xu, Software Development Manager - VerticaEamon O Neill, Director of Product Management - Vertica

#SeizeTheData
Please give me your feedback
–Use the mobile app to complete a session survey 1. Access “My schedule”2. Click on the session detail page3. Scroll down to “Rate & review”
– If the session is not on your schedule, just find it via the Discover app’s “Session Schedule” menu, click on this session, and scroll down to “Rate & Review”
– If you have not downloaded our event app, please go to your phone’s app store and search on “Discover 2016 Las Vegas”
– Thank you for providing your feedback, which helps us enhance content for future events.
Session ID: B10680 Speaker: Vincent Xu, Eamon O Neill
#SeizeTheData
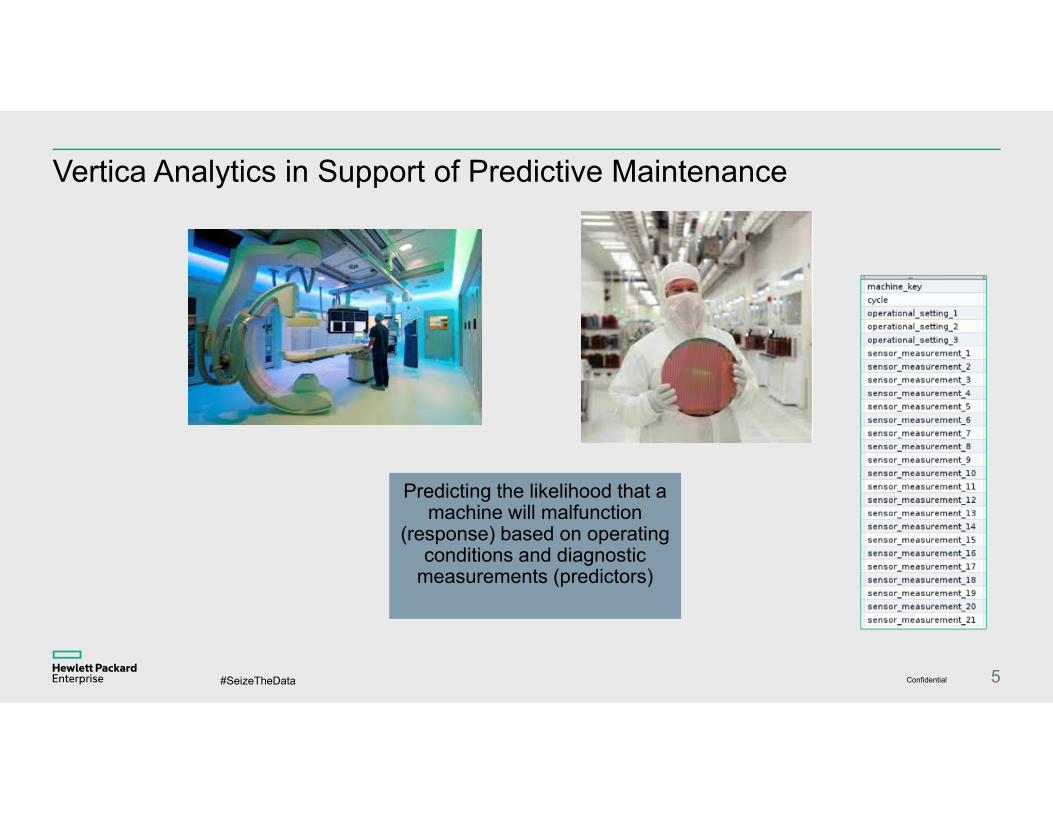
Vertica Analytics in Support of Predictive Maintenance
Predicting the likelihood that a machine will malfunction
(response) based on operating conditions and diagnostic
measurements (predictors)
5Confidential

#SeizeTheData
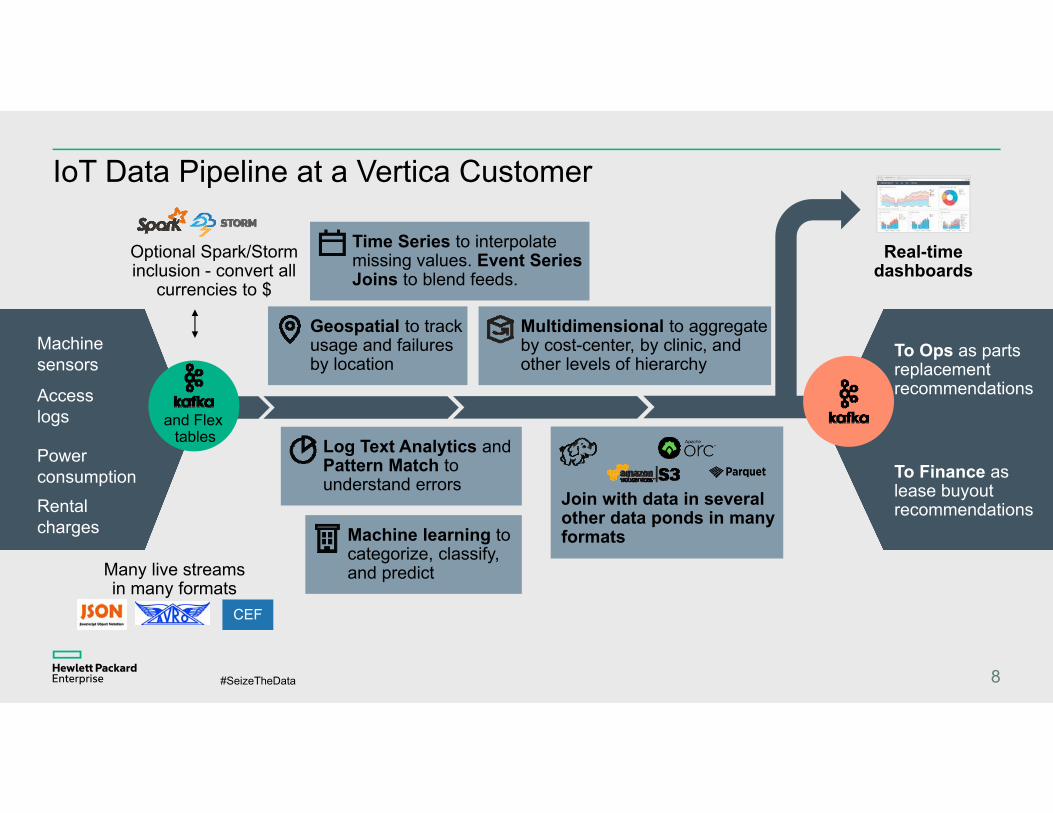
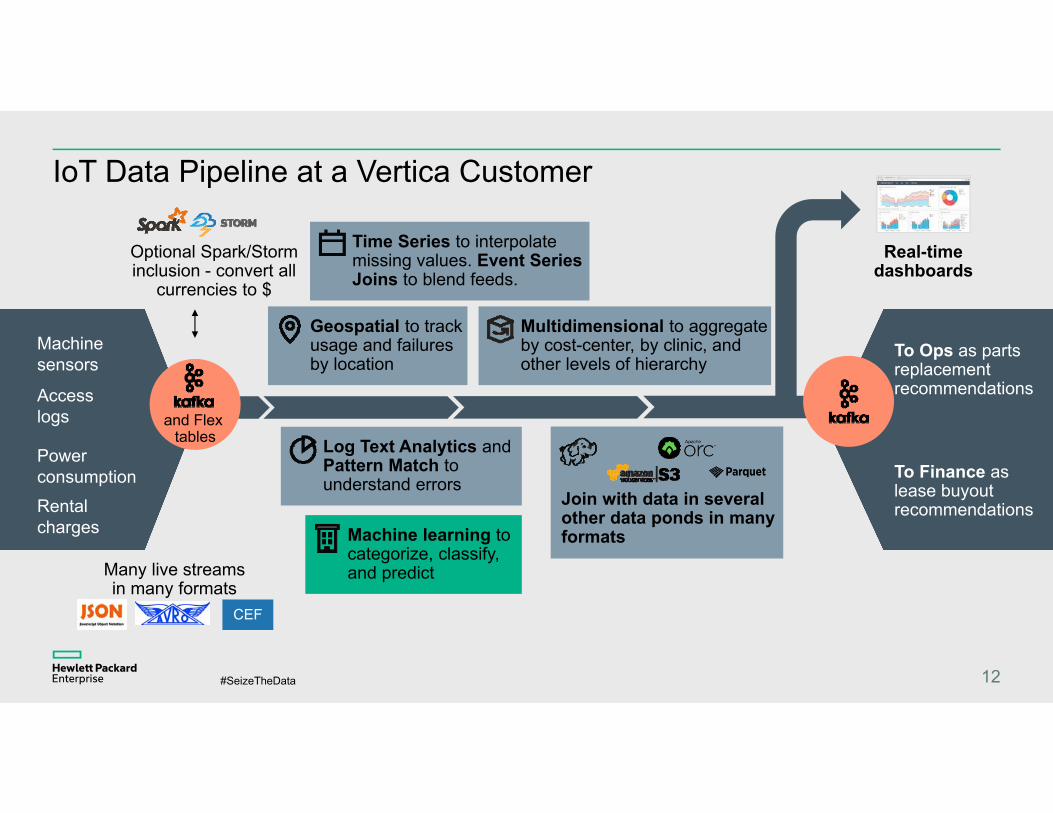
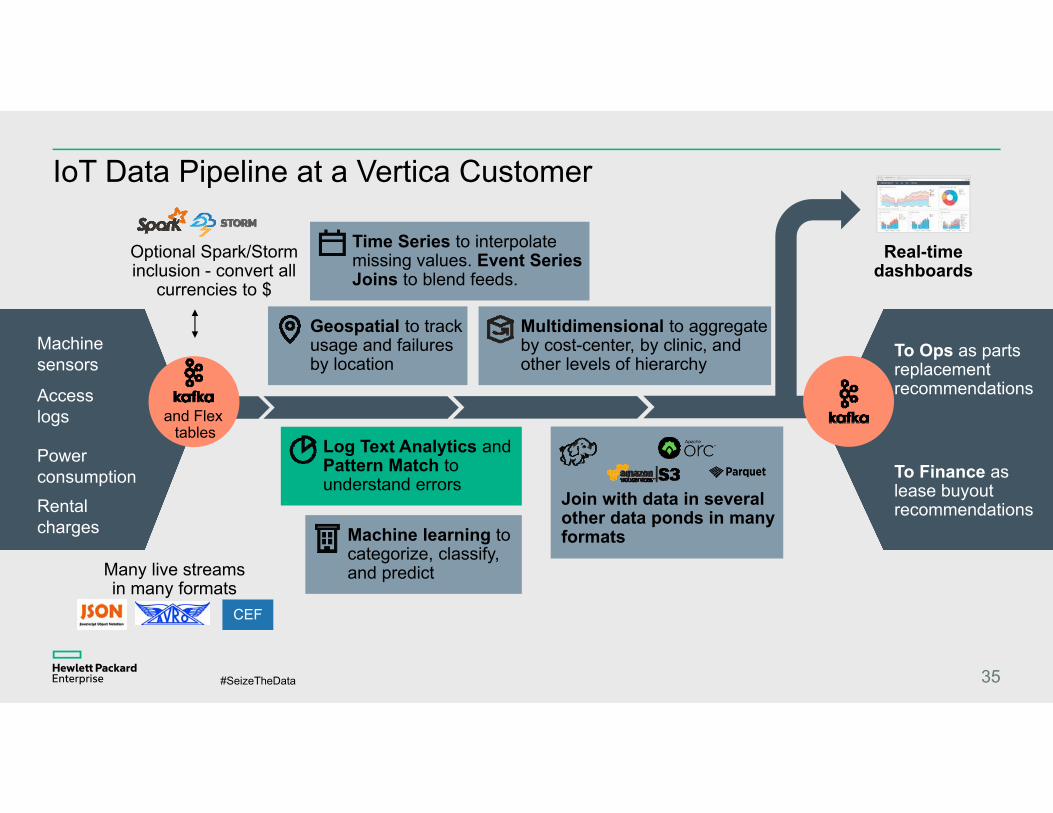
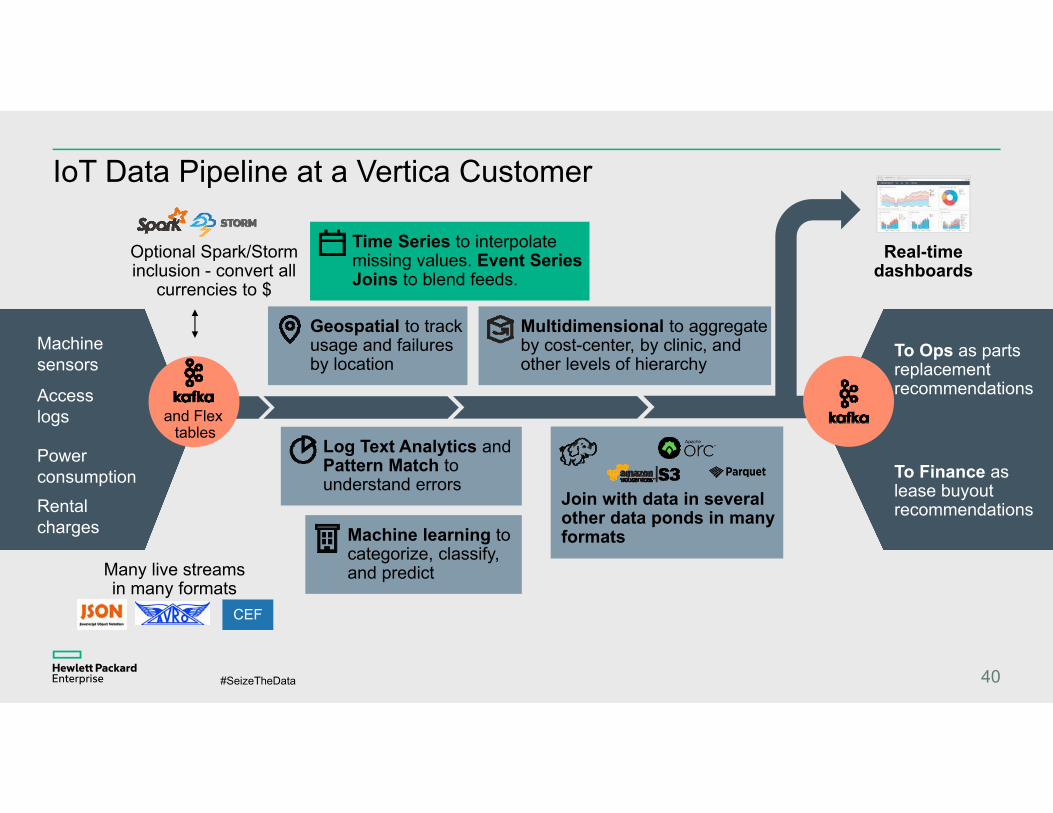
IoT Data Pipeline at a Vertica Customer
6
Rental charges
Power consumption
Machine sensors
Access logs
Optional Spark/Storm inclusion - convert all
currencies to $
Geospatial to track usage and failures by location
Machine learning to categorize, classify, and predict
Multidimensional to aggregate by cost-center, by clinic, and other levels of hierarchy
Real-time dashboards
To Ops as parts replacement recommendations
To Finance as lease buyout recommendations
Time Series to interpolate missing values. Event Series Joins to blend feeds.
Log Text Analytics and Pattern Match to understand errors
Join with data in several other data ponds in many formats
Many live streams in many formats
CEF
and Flex tables
#SeizeTheData
Demo
7
#SeizeTheData
IoT Data Pipeline at a Vertica Customer
8
Rental charges
Power consumption
Machine sensors
Access logs
Optional Spark/Storm inclusion - convert all
currencies to $
Geospatial to track usage and failures by location
Machine learning to categorize, classify, and predict
Multidimensional to aggregate by cost-center, by clinic, and other levels of hierarchy
Real-time dashboards
To Ops as parts replacement recommendations
To Finance as lease buyout recommendations
Time Series to interpolate missing values. Event Series Joins to blend feeds.
Log Text Analytics and Pattern Match to understand errors
Join with data in several other data ponds in many formats
Many live streams in many formats
CEF
and Flex tables
#SeizeTheData
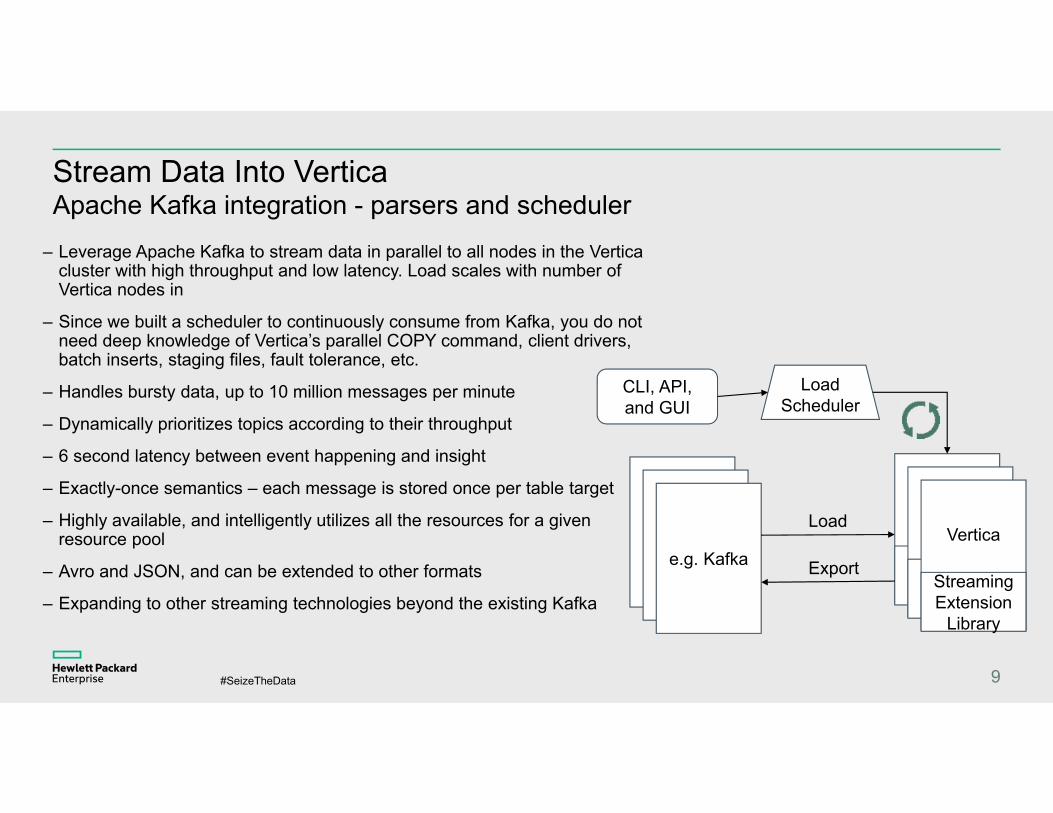
Stream Data Into VerticaApache Kafka integration - parsers and scheduler
9
LoadScheduler
KafkaKafkae.g. Kafka
Vertica
Kafka Plugin
Vertica
Kafka Plugin
Vertica
Streaming Extension
Library
CLI, API, and GUI
Load
Export
– Leverage Apache Kafka to stream data in parallel to all nodes in the Vertica cluster with high throughput and low latency. Load scales with number of Vertica nodes in
– Since we built a scheduler to continuously consume from Kafka, you do not need deep knowledge of Vertica’s parallel COPY command, client drivers, batch inserts, staging files, fault tolerance, etc.
– Handles bursty data, up to 10 million messages per minute
– Dynamically prioritizes topics according to their throughput
– 6 second latency between event happening and insight
– Exactly-once semantics – each message is stored once per table target
– Highly available, and intelligently utilizes all the resources for a given resource pool
– Avro and JSON, and can be extended to other formats
– Expanding to other streaming technologies beyond the existing Kafka
#SeizeTheData
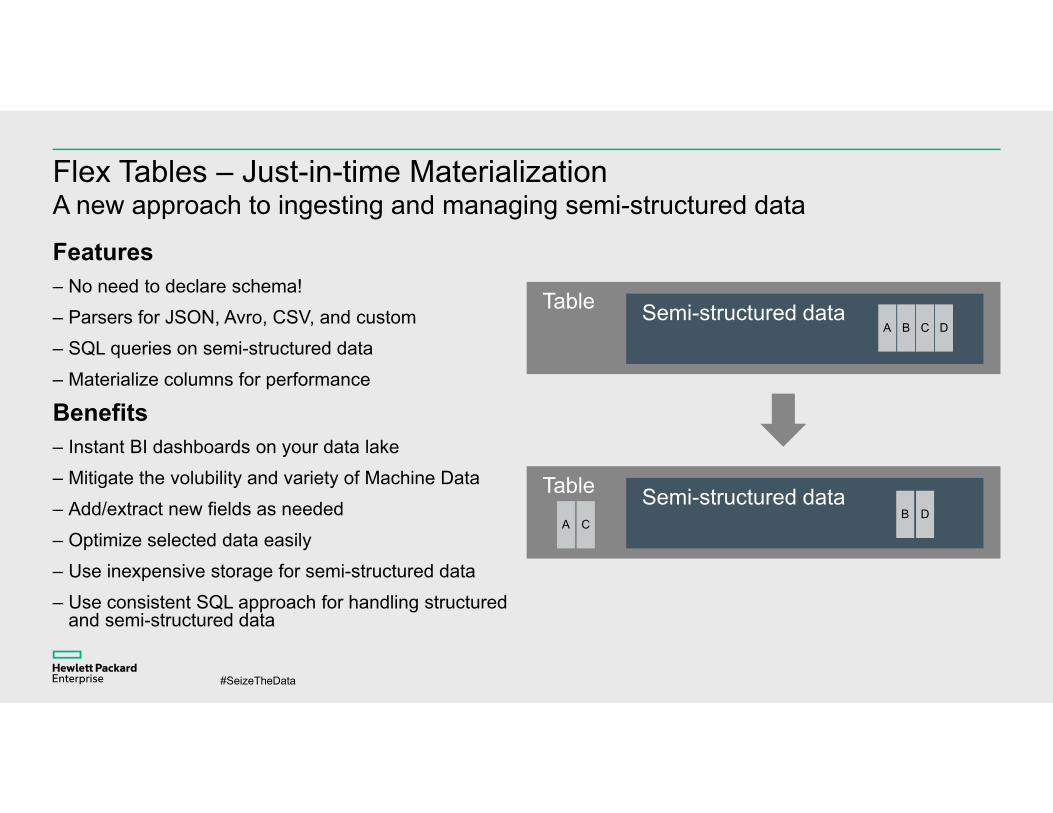
Flex Tables – Just-in-time MaterializationA new approach to ingesting and managing semi-structured data
Features– No need to declare schema!– Parsers for JSON, Avro, CSV, and custom– SQL queries on semi-structured data– Materialize columns for performance
Benefits– Instant BI dashboards on your data lake– Mitigate the volubility and variety of Machine Data– Add/extract new fields as needed– Optimize selected data easily– Use inexpensive storage for semi-structured data– Use consistent SQL approach for handling structured
and semi-structured data
Table Semi-structured dataA B C D
Table Semi-structured dataA
BC
D

#SeizeTheData 11
#SeizeTheData
IoT Data Pipeline at a Vertica Customer
12
Rental charges
Power consumption
Machine sensors
Access logs
Optional Spark/Storm inclusion - convert all
currencies to $
Geospatial to track usage and failures by location
Machine learning to categorize, classify, and predict
Multidimensional to aggregate by cost-center, by clinic, and other levels of hierarchy
Real-time dashboards
To Ops as parts replacement recommendations
To Finance as lease buyout recommendations
Time Series to interpolate missing values. Event Series Joins to blend feeds.
Log Text Analytics and Pattern Match to understand errors
Join with data in several other data ponds in many formats
Many live streams in many formats
CEF
and Flex tables
#SeizeTheData
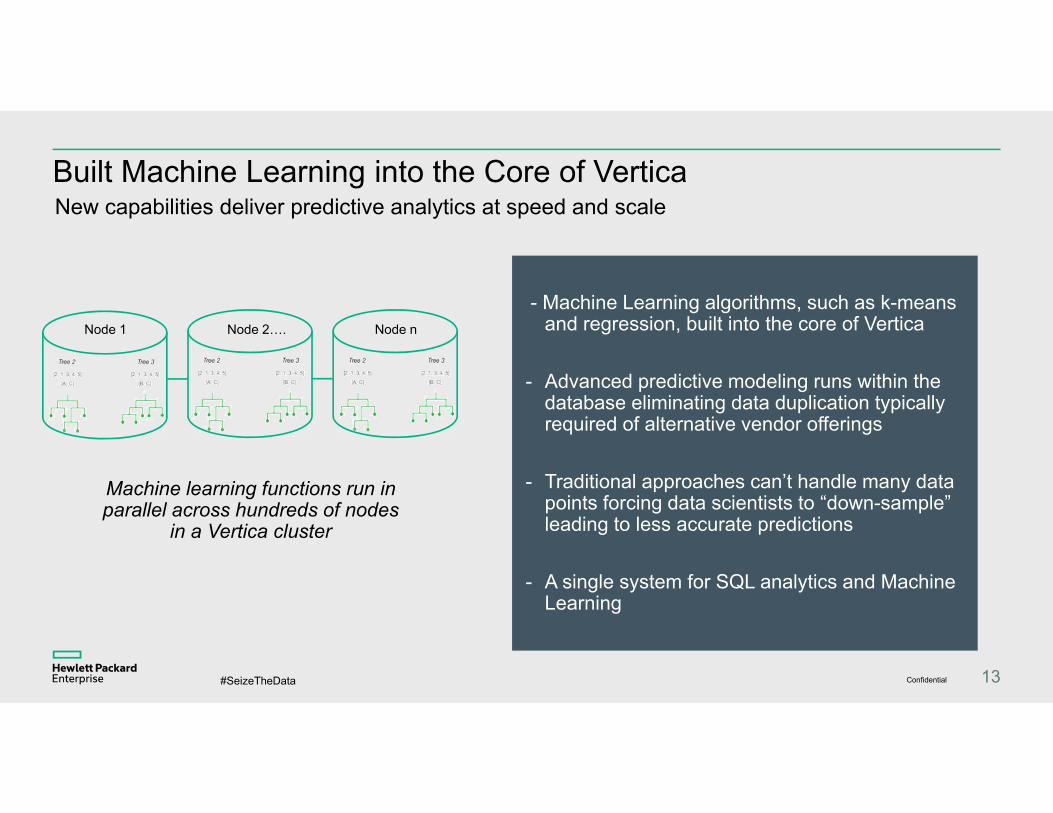
- Machine Learning algorithms, such as k-means and regression, built into the core of Vertica
- Advanced predictive modeling runs within the database eliminating data duplication typically required of alternative vendor offerings
- Traditional approaches can’t handle many data points forcing data scientists to “down-sample” leading to less accurate predictions
- A single system for SQL analytics and Machine Learning
13
Node 1 Node 2…. Node n
Machine learning functions run in parallel across hundreds of nodes
in a Vertica cluster
Built Machine Learning into the Core of VerticaNew capabilities deliver predictive analytics at speed and scale
Confidential
#SeizeTheData
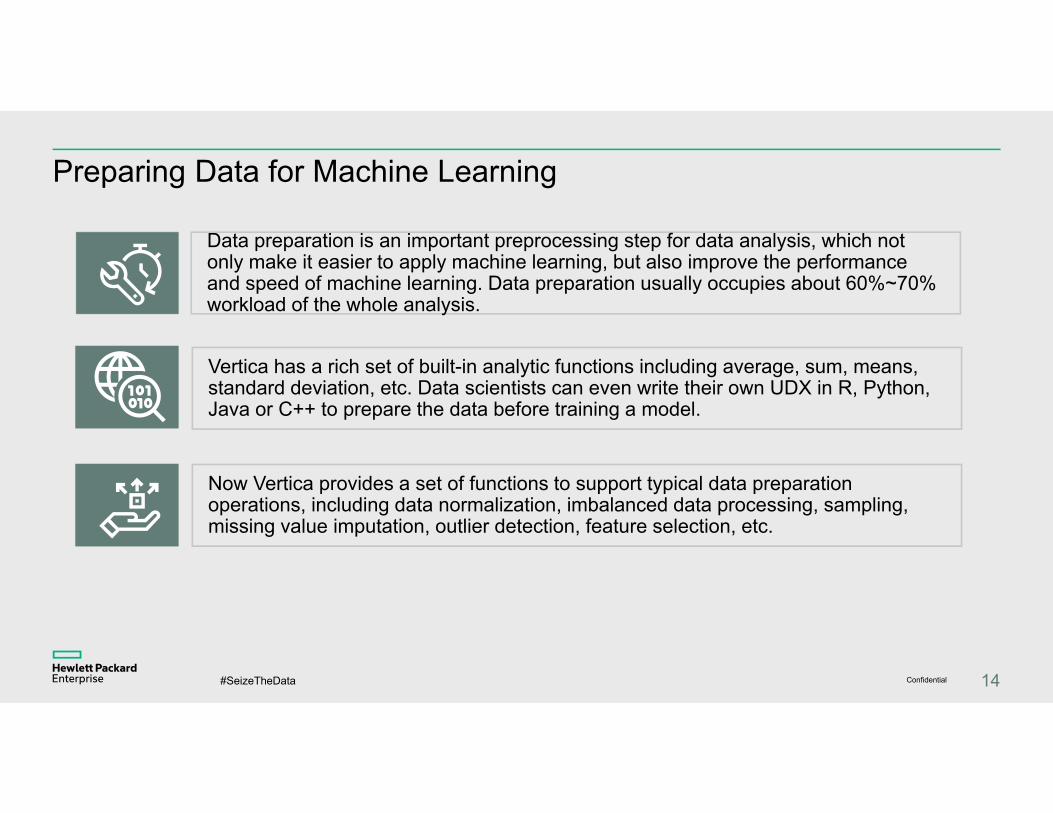
Preparing Data for Machine Learning
Data preparation is an important preprocessing step for data analysis, which not only make it easier to apply machine learning, but also improve the performance and speed of machine learning. Data preparation usually occupies about 60%~70% workload of the whole analysis.
Vertica has a rich set of built-in analytic functions including average, sum, means, standard deviation, etc. Data scientists can even write their own UDX in R, Python, Java or C++ to prepare the data before training a model.
Now Vertica provides a set of functions to support typical data preparation operations, including data normalization, imbalanced data processing, sampling, missing value imputation, outlier detection, feature selection, etc.
14Confidential
#SeizeTheData
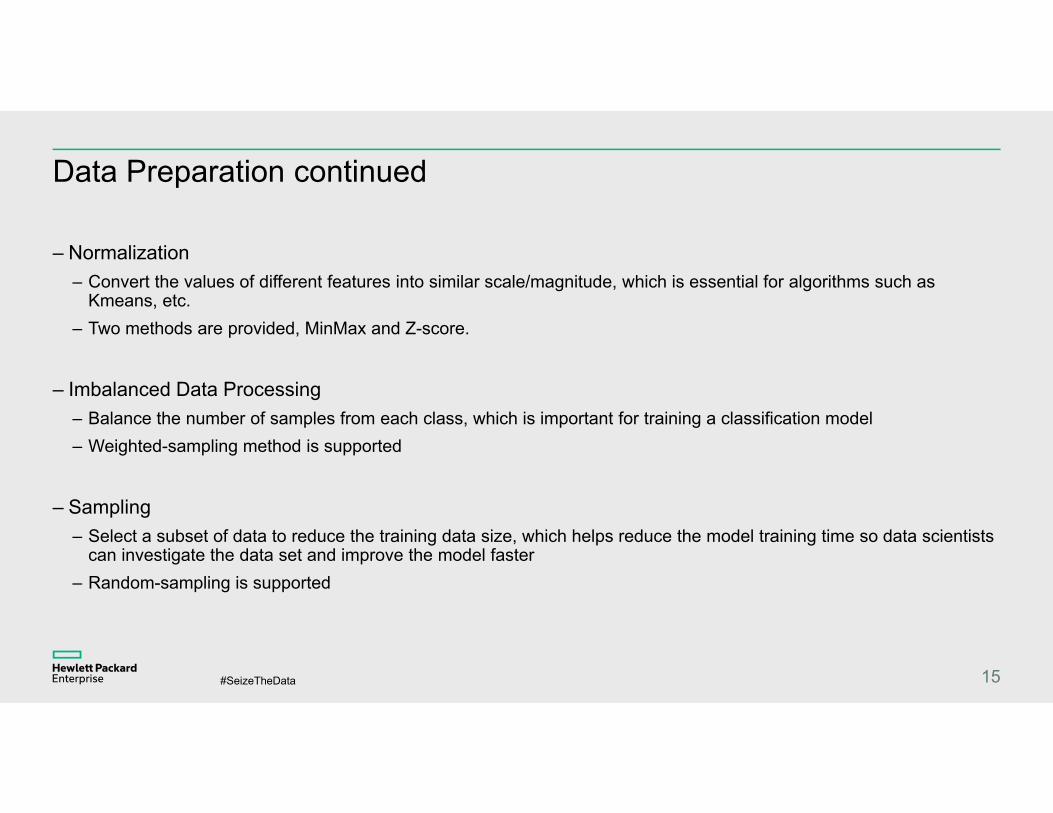
Data Preparation continued
– Normalization – Convert the values of different features into similar scale/magnitude, which is essential for algorithms such as
Kmeans, etc.– Two methods are provided, MinMax and Z-score.
– Imbalanced Data Processing– Balance the number of samples from each class, which is important for training a classification model– Weighted-sampling method is supported
– Sampling– Select a subset of data to reduce the training data size, which helps reduce the model training time so data scientists
can investigate the data set and improve the model faster– Random-sampling is supported
15
#SeizeTheData
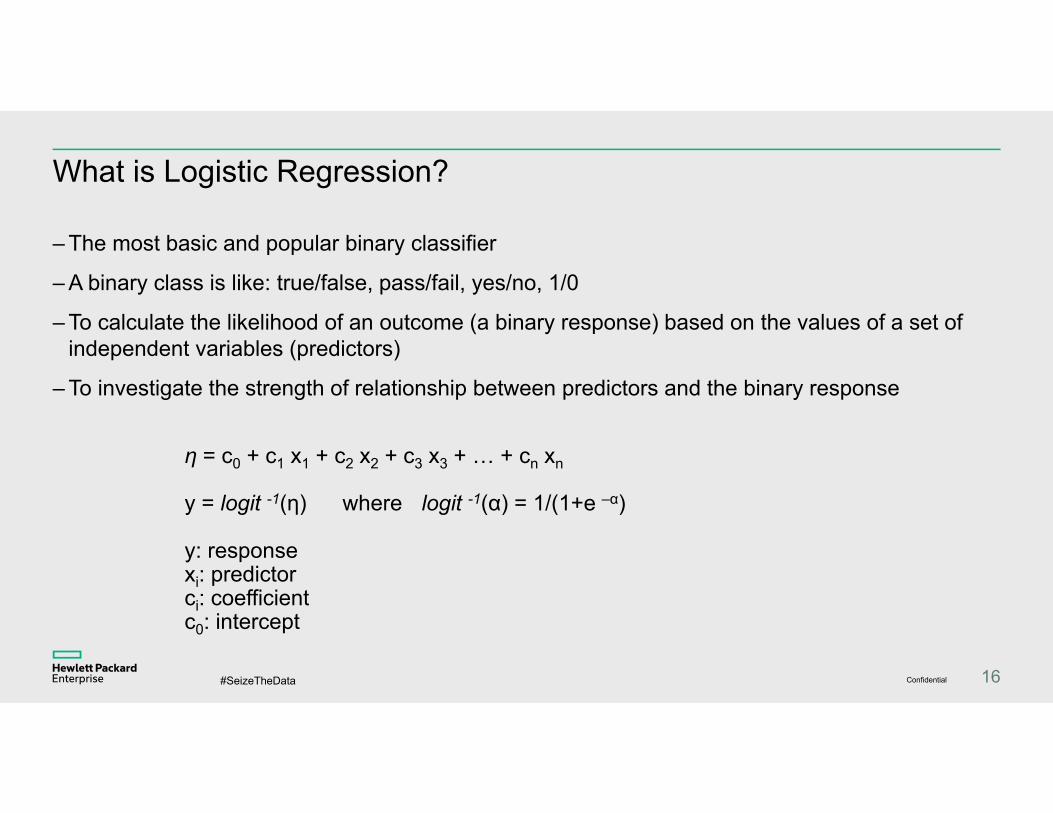
What is Logistic Regression?
– The most basic and popular binary classifier
– A binary class is like: true/false, pass/fail, yes/no, 1/0
– To calculate the likelihood of an outcome (a binary response) based on the values of a set of independent variables (predictors)
– To investigate the strength of relationship between predictors and the binary response
16
η = c0 + c1 x1 + c2 x2 + c3 x3 + … + cn xn
y = logit -1(η) where logit -1(α) = 1/(1+e –α)
y: responsexi: predictorci: coefficientc0: intercept
Confidential
#SeizeTheData
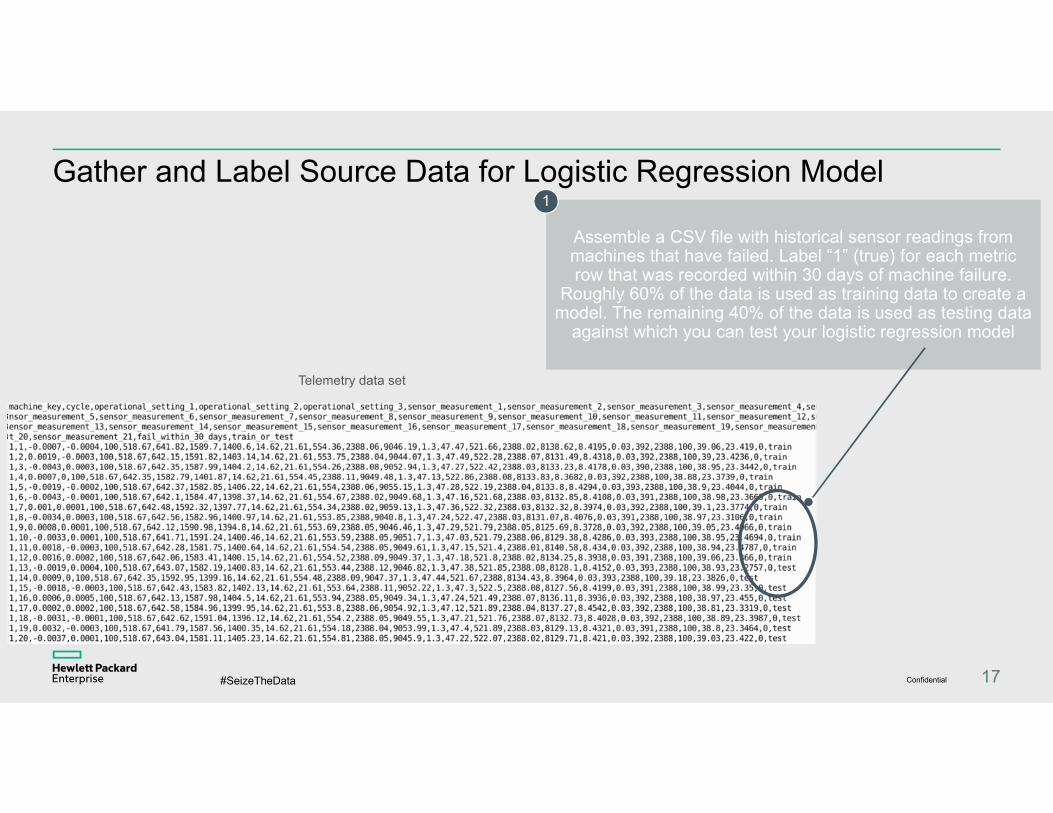
Gather and Label Source Data for Logistic Regression Model
17
Assemble a CSV file with historical sensor readings from machines that have failed. Label “1” (true) for each metric row that was recorded within 30 days of machine failure.
Roughly 60% of the data is used as training data to create a model. The remaining 40% of the data is used as testing data
against which you can test your logistic regression model
1
Telemetry data set
Confidential
#SeizeTheData
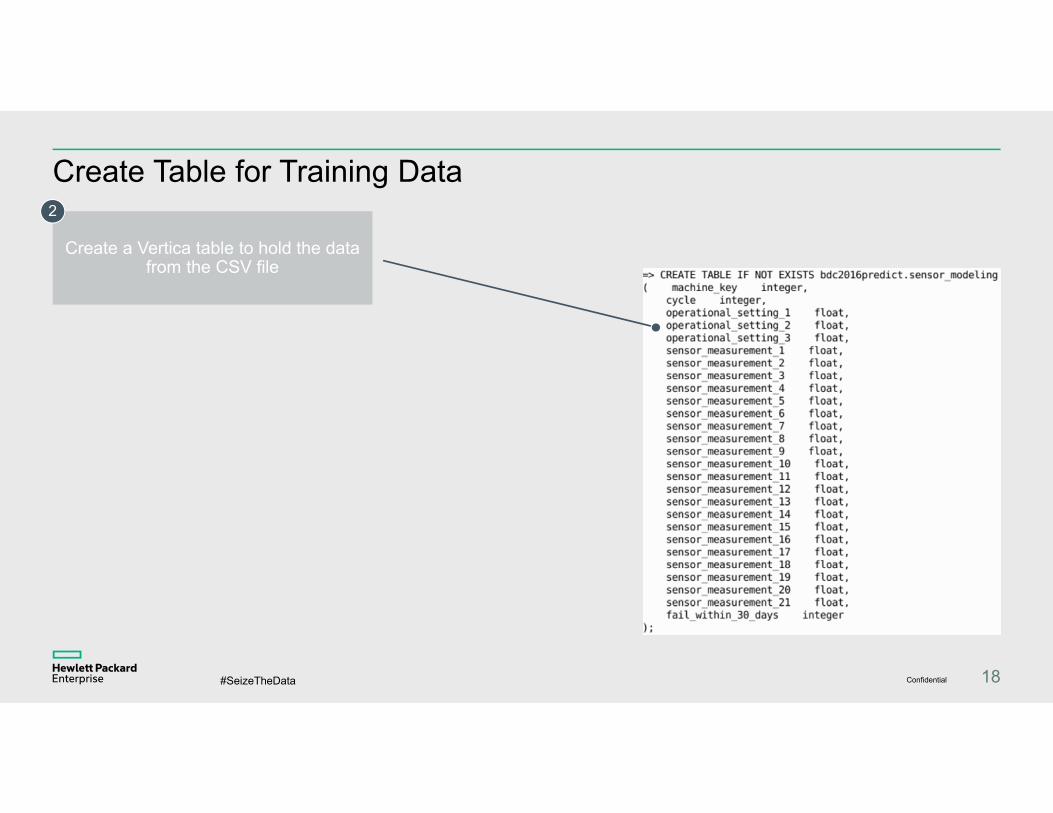
Create Table for Training Data
18
Create a Vertica table to hold the data from the CSV file
2
Confidential
#SeizeTheData
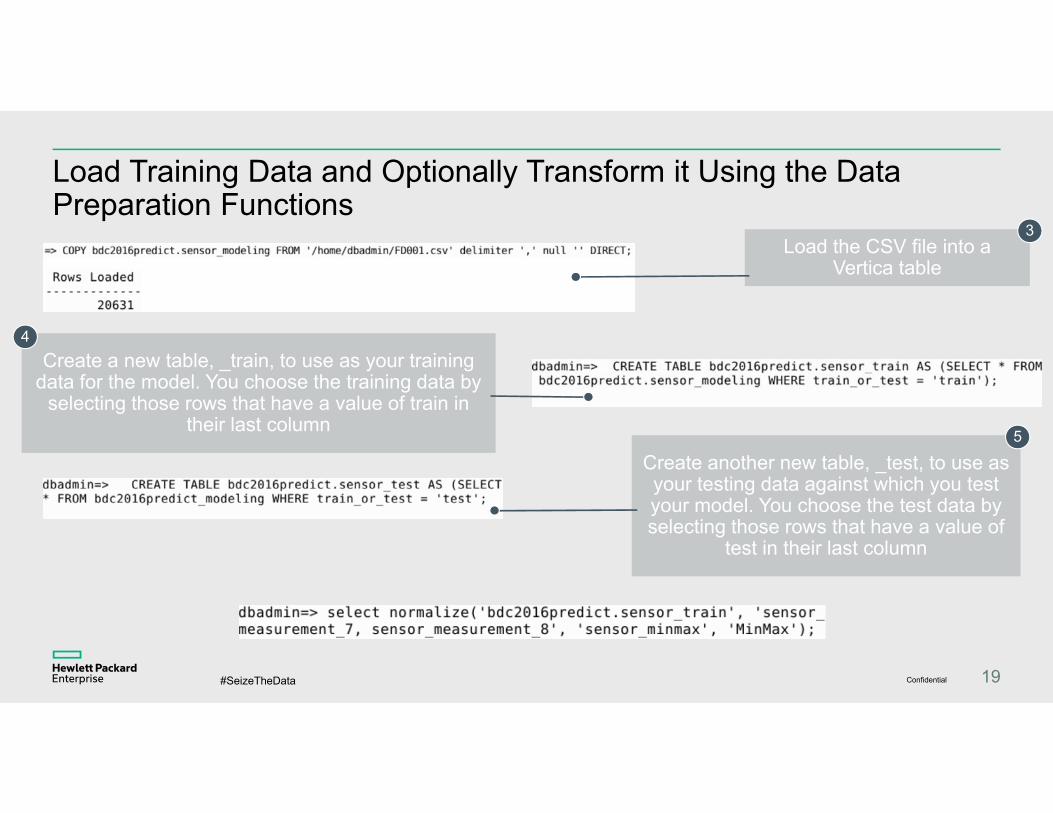
Create another new table, _test, to use as your testing data against which you test your model. You choose the test data by selecting those rows that have a value of
test in their last column
Create a new table, _train, to use as your training data for the model. You choose the training data by
selecting those rows that have a value of train in their last column
Load Training Data and Optionally Transform it Using the Data Preparation Functions
Load the CSV file into a Vertica table
3
5
Confidential 19
4
#SeizeTheData
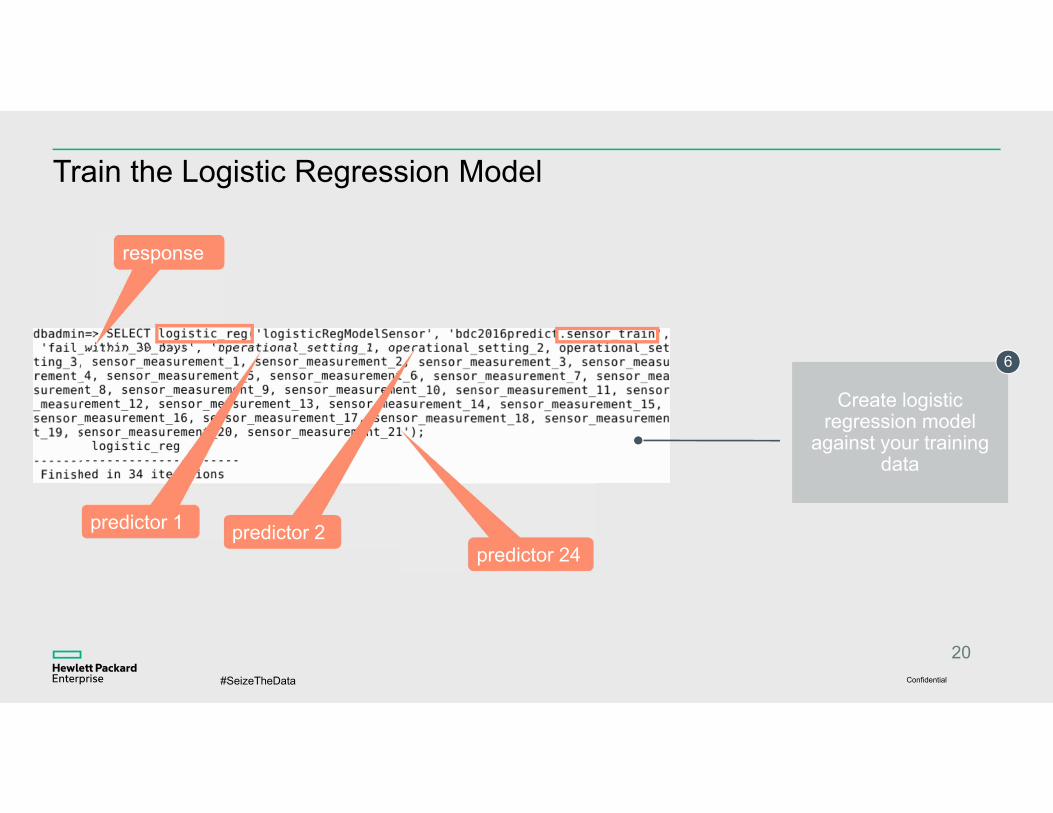
Train the Logistic Regression Model
20
Create logistic regression model
against your training data
6
Confidential
response
predictor 1 predictor 2predictor 24
#SeizeTheData
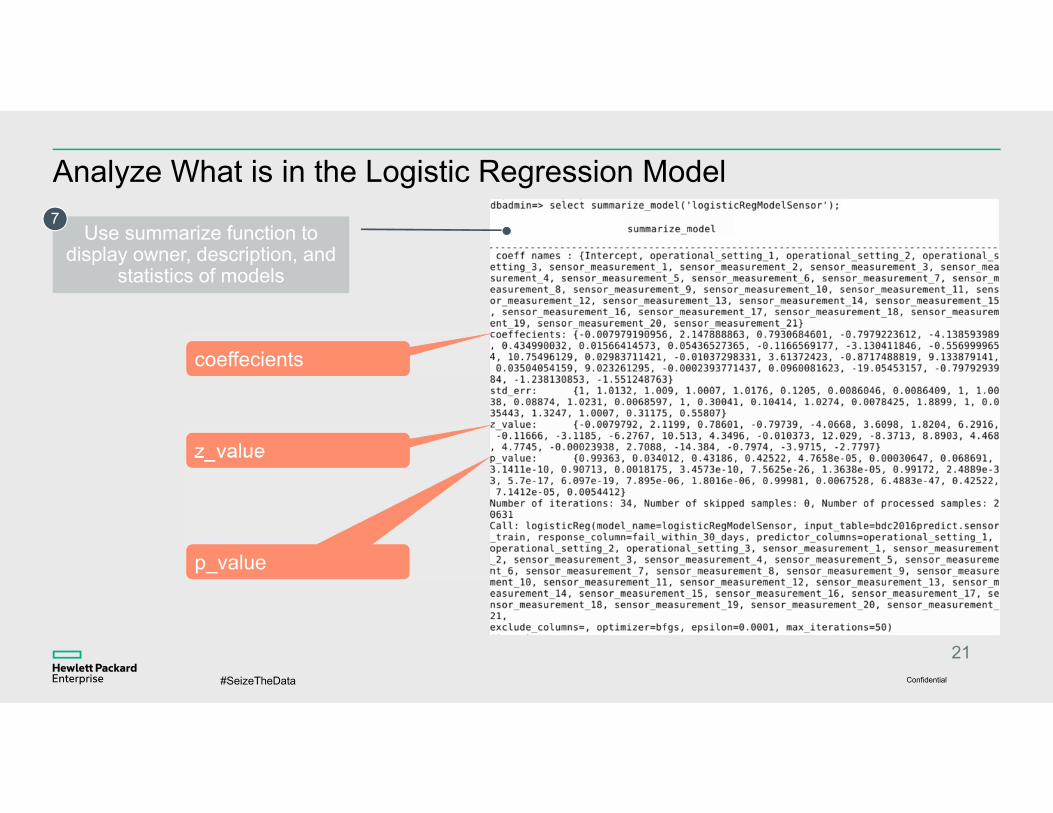
Analyze What is in the Logistic Regression Model
21
Use summarize function to display owner, description, and
statistics of models
7
Confidential
coeffecients
z_value
p_value
#SeizeTheData
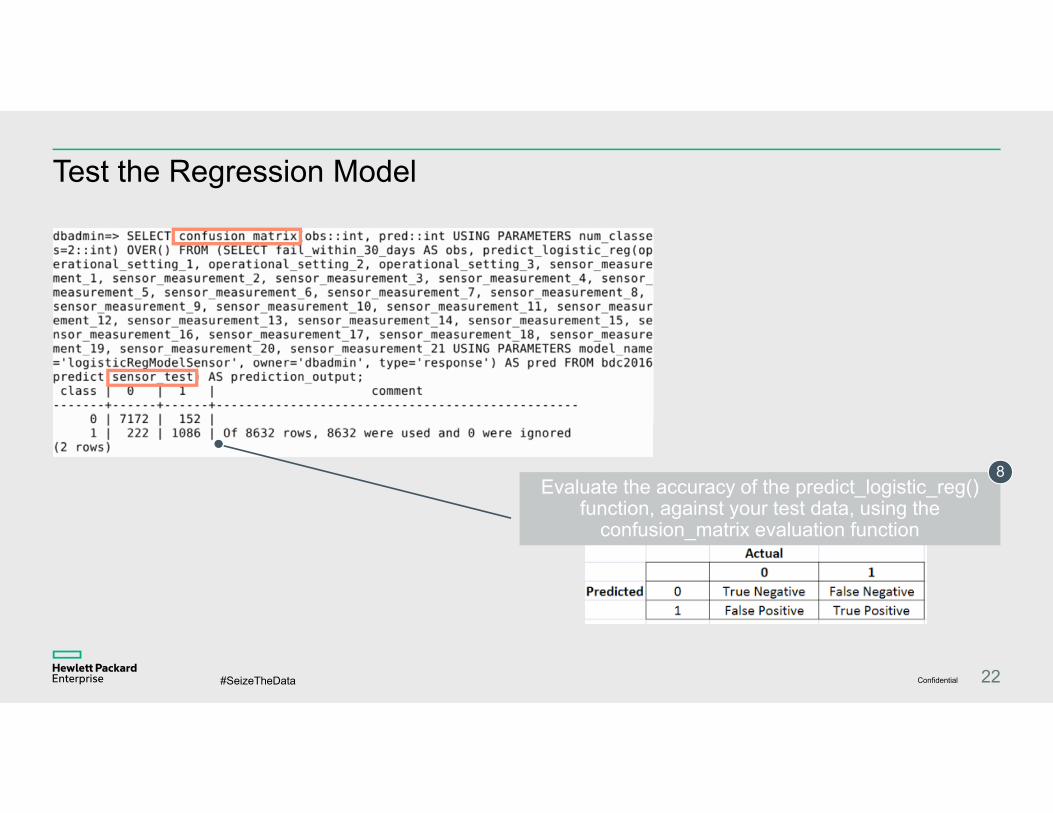
Test the Regression Model
22
Evaluate the accuracy of the predict_logistic_reg() function, against your test data, using the
confusion_matrix evaluation function
8
Confidential
#SeizeTheData
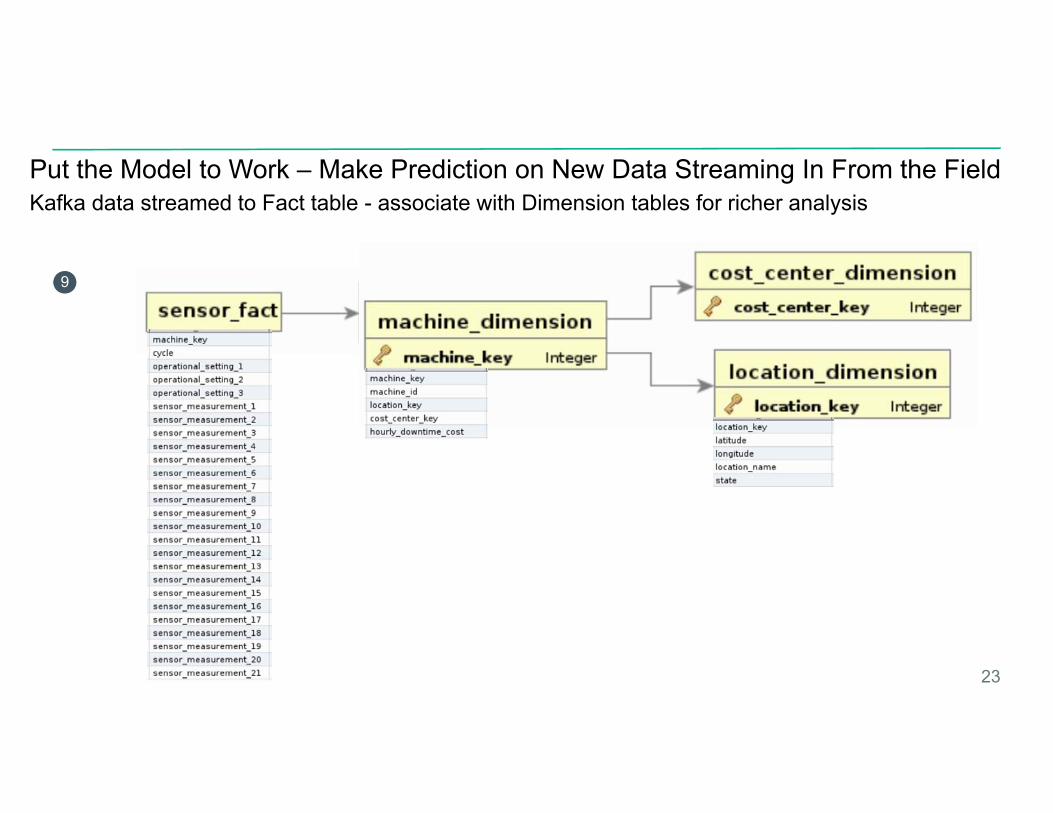
Put the Model to Work – Make Prediction on New Data Streaming In From the FieldKafka data streamed to Fact table - associate with Dimension tables for richer analysis
23
9
#SeizeTheData
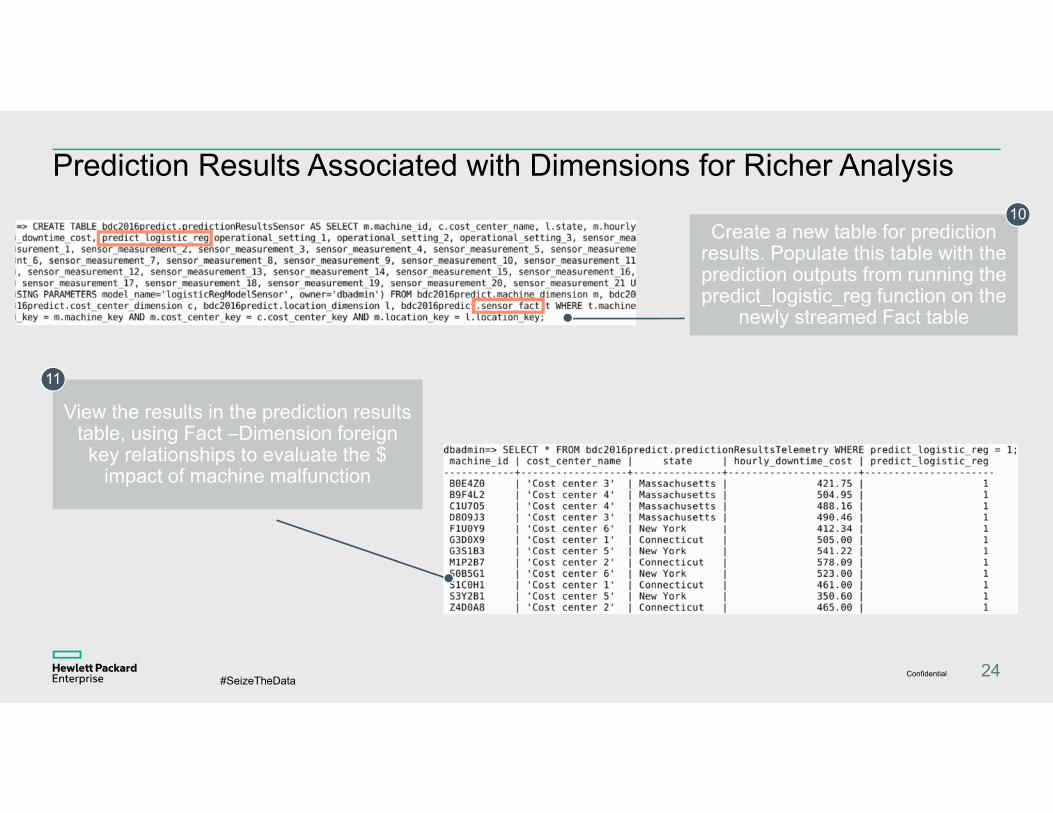
Prediction Results Associated with Dimensions for Richer Analysis
24Confidential
Create a new table for prediction results. Populate this table with the prediction outputs from running thepredict_logistic_reg function on the
newly streamed Fact table
10
View the results in the prediction results table, using Fact –Dimension foreign
key relationships to evaluate the $ impact of machine malfunction
11
#SeizeTheData
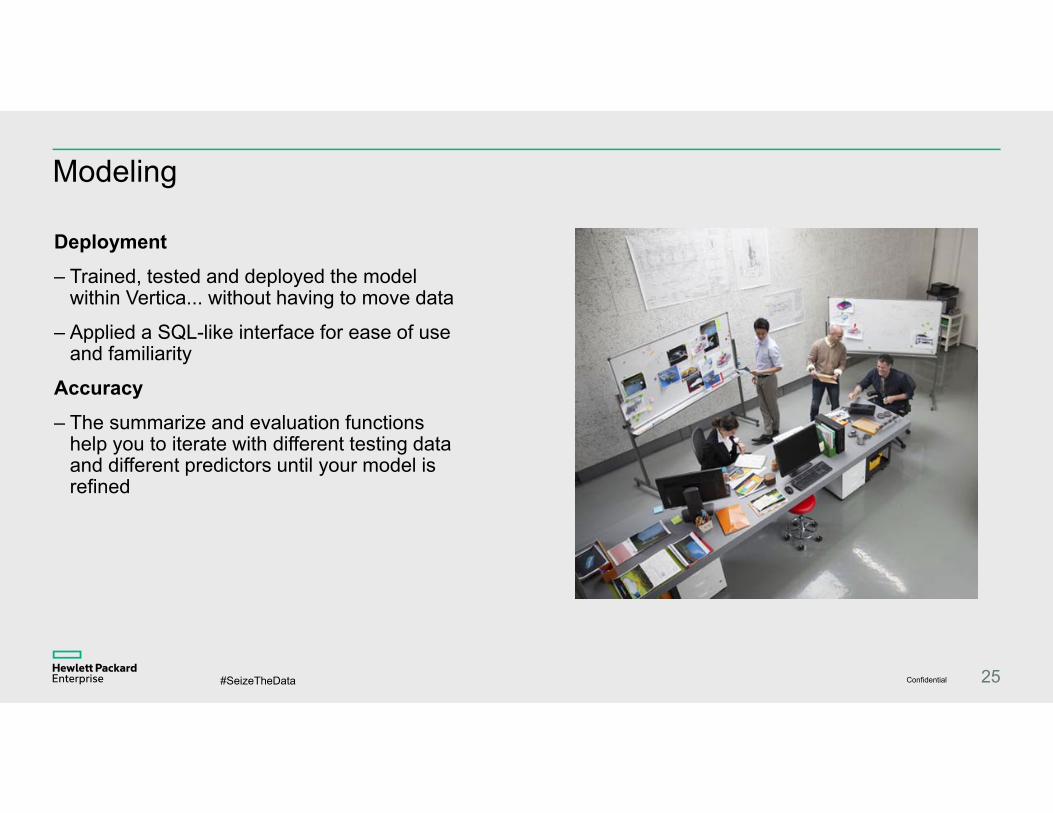
Modeling
Deployment– Trained, tested and deployed the model
within Vertica... without having to move data
– Applied a SQL-like interface for ease of use and familiarity
Accuracy– The summarize and evaluation functions
help you to iterate with different testing data and different predictors until your model is refined
Confidential 25

#SeizeTheData 26
#SeizeTheData
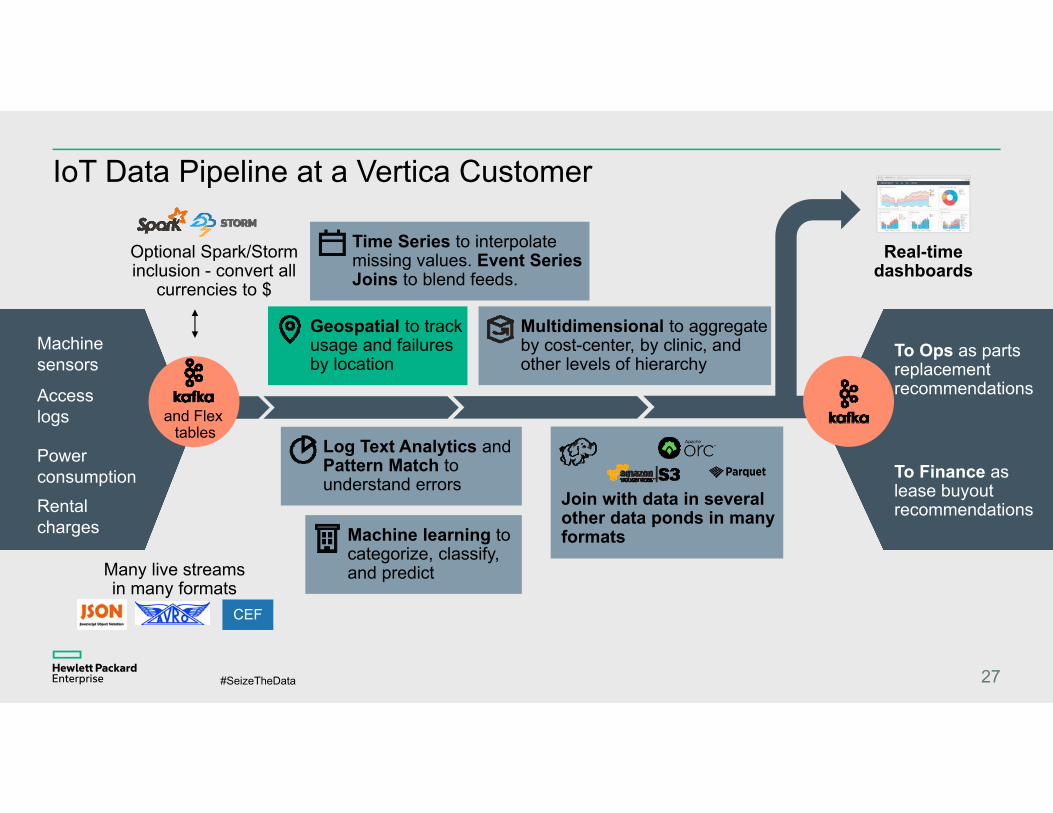
IoT Data Pipeline at a Vertica Customer
27
Rental charges
Power consumption
Machine sensors
Access logs
Optional Spark/Storm inclusion - convert all
currencies to $
Geospatial to track usage and failures by location
Machine learning to categorize, classify, and predict
Multidimensional to aggregate by cost-center, by clinic, and other levels of hierarchy
Real-time dashboards
To Ops as parts replacement recommendations
To Finance as lease buyout recommendations
Time Series to interpolate missing values. Event Series Joins to blend feeds.
Log Text Analytics and Pattern Match to understand errors
Join with data in several other data ponds in many formats
Many live streams in many formats
CEF
and Flex tables
#SeizeTheData
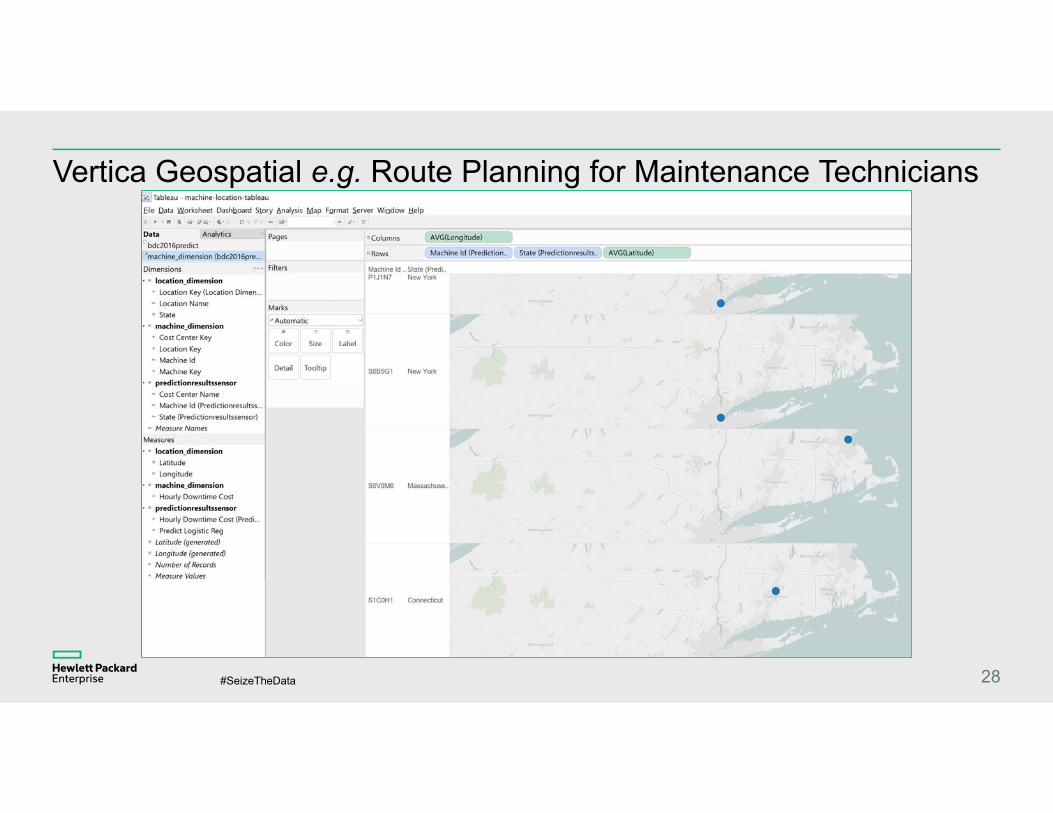
Vertica Geospatial e.g. Route Planning for Maintenance Technicians
28
#SeizeTheData
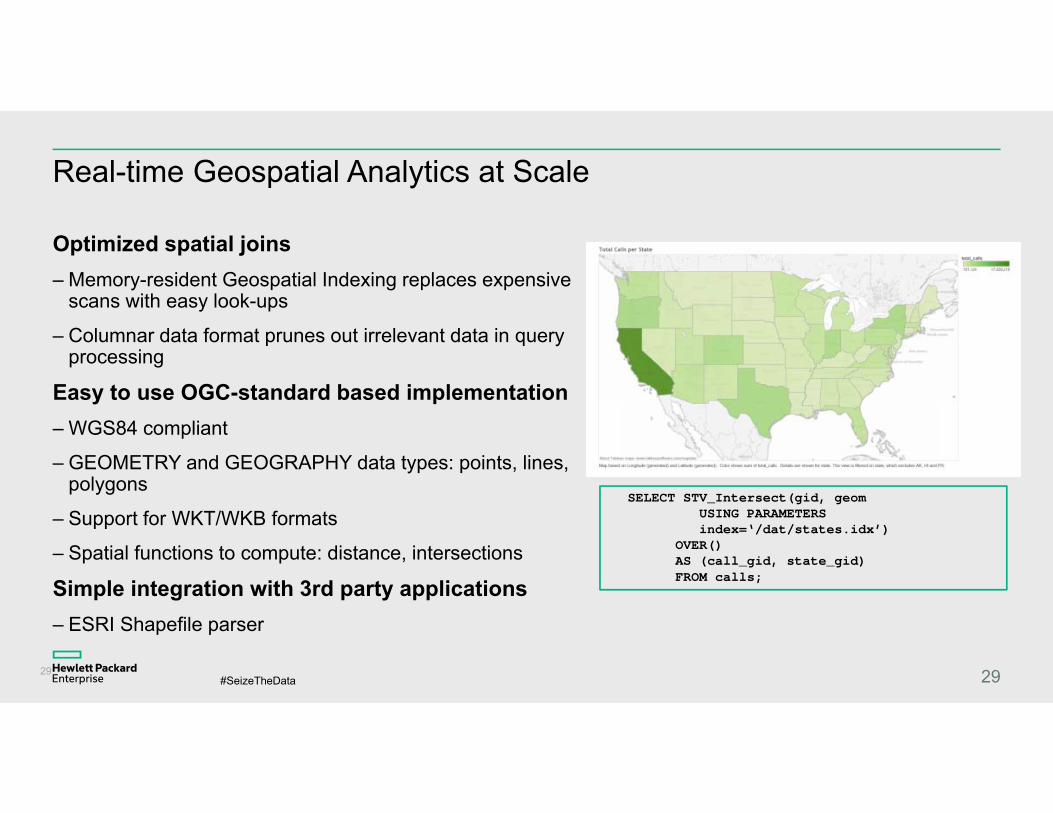
Real-time Geospatial Analytics at Scale
Optimized spatial joins– Memory-resident Geospatial Indexing replaces expensive
scans with easy look-ups
– Columnar data format prunes out irrelevant data in query processing
Easy to use OGC-standard based implementation– WGS84 compliant
– GEOMETRY and GEOGRAPHY data types: points, lines, polygons
– Support for WKT/WKB formats
– Spatial functions to compute: distance, intersections
Simple integration with 3rd party applications – ESRI Shapefile parser
29
SELECT STV_Intersect(gid, geom USING PARAMETERSindex=‘/dat/states.idx’)
OVER() AS (call_gid, state_gid) FROM calls;
29

#SeizeTheData 30
#SeizeTheData
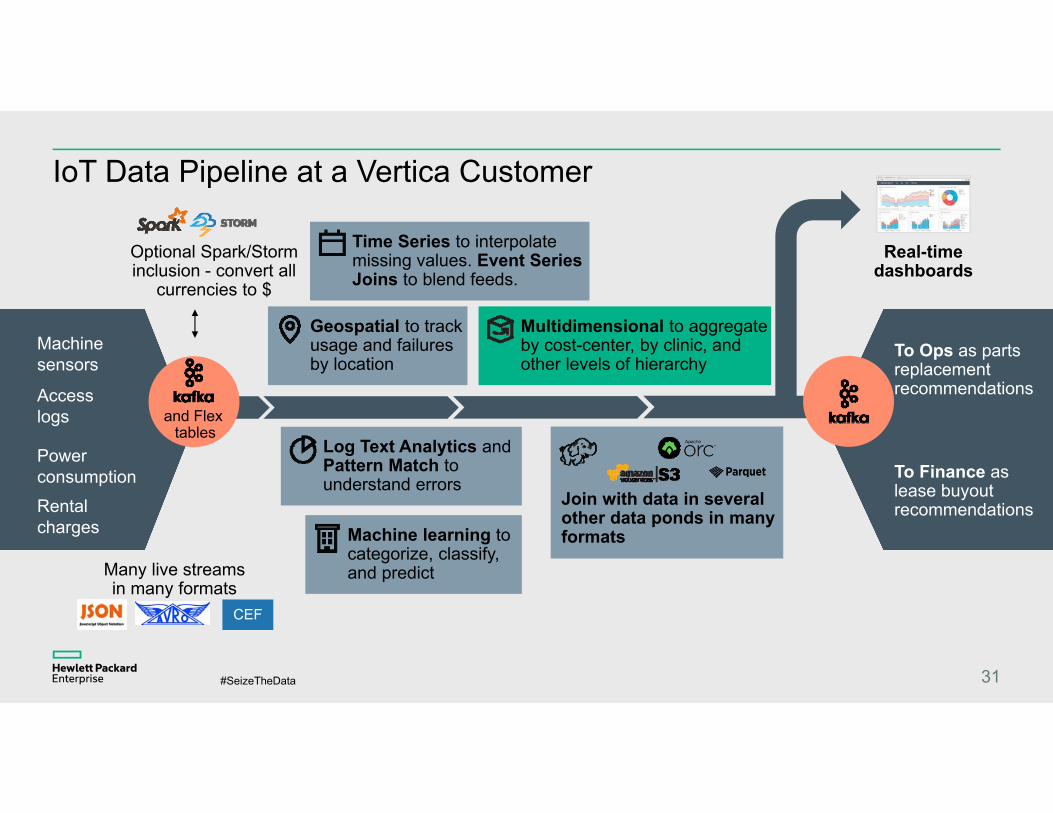
IoT Data Pipeline at a Vertica Customer
31
Rental charges
Power consumption
Machine sensors
Access logs
Optional Spark/Storm inclusion - convert all
currencies to $
Geospatial to track usage and failures by location
Machine learning to categorize, classify, and predict
Multidimensional to aggregate by cost-center, by clinic, and other levels of hierarchy
Real-time dashboards
To Ops as parts replacement recommendations
To Finance as lease buyout recommendations
Time Series to interpolate missing values. Event Series Joins to blend feeds.
Log Text Analytics and Pattern Match to understand errors
Join with data in several other data ponds in many formats
Many live streams in many formats
CEF
and Flex tables
#SeizeTheData
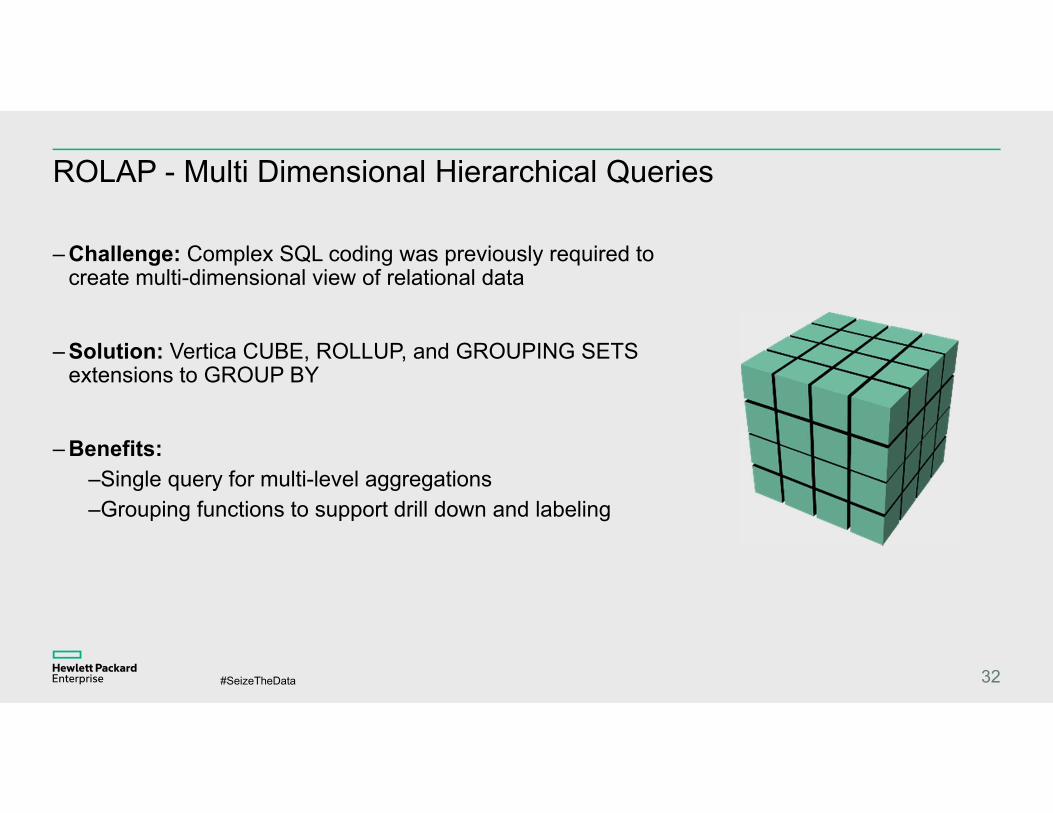
ROLAP - Multi Dimensional Hierarchical Queries
– Challenge: Complex SQL coding was previously required to create multi-dimensional view of relational data
– Solution: Vertica CUBE, ROLLUP, and GROUPING SETS extensions to GROUP BY
– Benefits: –Single query for multi-level aggregations–Grouping functions to support drill down and labeling
32
#SeizeTheData
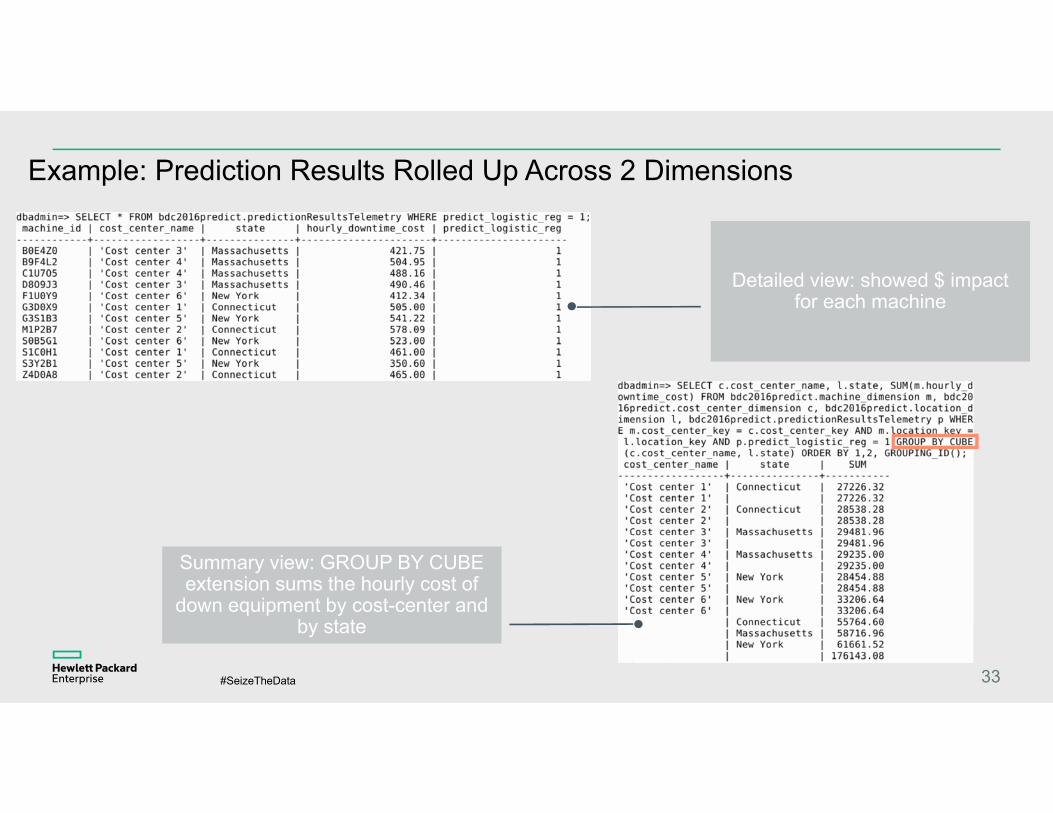
Example: Prediction Results Rolled Up Across 2 Dimensions
33
Detailed view: showed $ impact for each machine
Summary view: GROUP BY CUBE extension sums the hourly cost of
down equipment by cost-center and by state

#SeizeTheData 34
#SeizeTheData
IoT Data Pipeline at a Vertica Customer
35
Rental charges
Power consumption
Machine sensors
Access logs
Optional Spark/Storm inclusion - convert all
currencies to $
Geospatial to track usage and failures by location
Machine learning to categorize, classify, and predict
Multidimensional to aggregate by cost-center, by clinic, and other levels of hierarchy
Real-time dashboards
To Ops as parts replacement recommendations
To Finance as lease buyout recommendations
Time Series to interpolate missing values. Event Series Joins to blend feeds.
Log Text Analytics and Pattern Match to understand errors
Join with data in several other data ponds in many formats
Many live streams in many formats
CEF
and Flex tables
#SeizeTheData
Vertica’s Other Techniques for Predicting Engine Malfunction
–Pattern Matching on messages in error logs
–Textual analysis of messages in error logs
36
#SeizeTheData
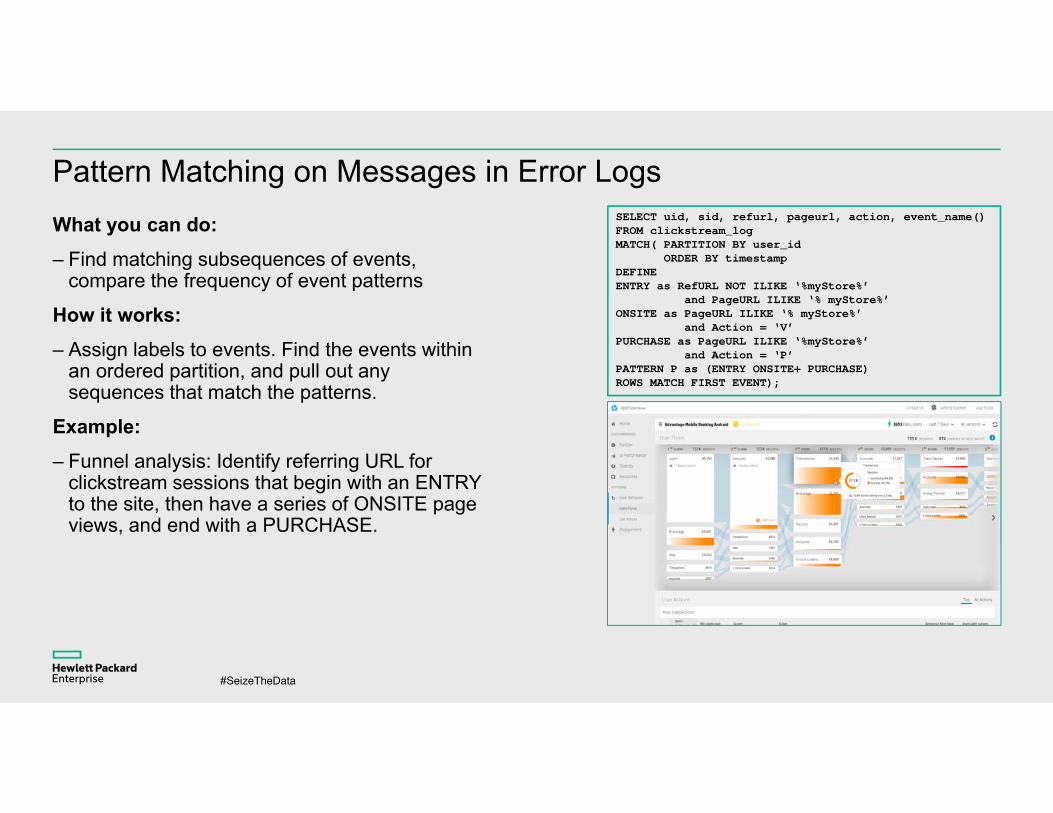
Pattern Matching on Messages in Error LogsWhat you can do:– Find matching subsequences of events,
compare the frequency of event patterns
How it works:– Assign labels to events. Find the events within
an ordered partition, and pull out any sequences that match the patterns.
Example:– Funnel analysis: Identify referring URL for
clickstream sessions that begin with an ENTRY to the site, then have a series of ONSITE page views, and end with a PURCHASE.
SELECT uid, sid, refurl, pageurl, action, event_name()FROM clickstream_logMATCH( PARTITION BY user_id
ORDER BY timestampDEFINEENTRY as RefURL NOT ILIKE ‘%myStore%’
and PageURL ILIKE ‘% myStore%’ONSITE as PageURL ILIKE ‘% myStore%’
and Action = ‘V’PURCHASE as PageURL ILIKE ‘%myStore%’
and Action = ‘P’PATTERN P as (ENTRY ONSITE+ PURCHASE)ROWS MATCH FIRST EVENT);
#SeizeTheData
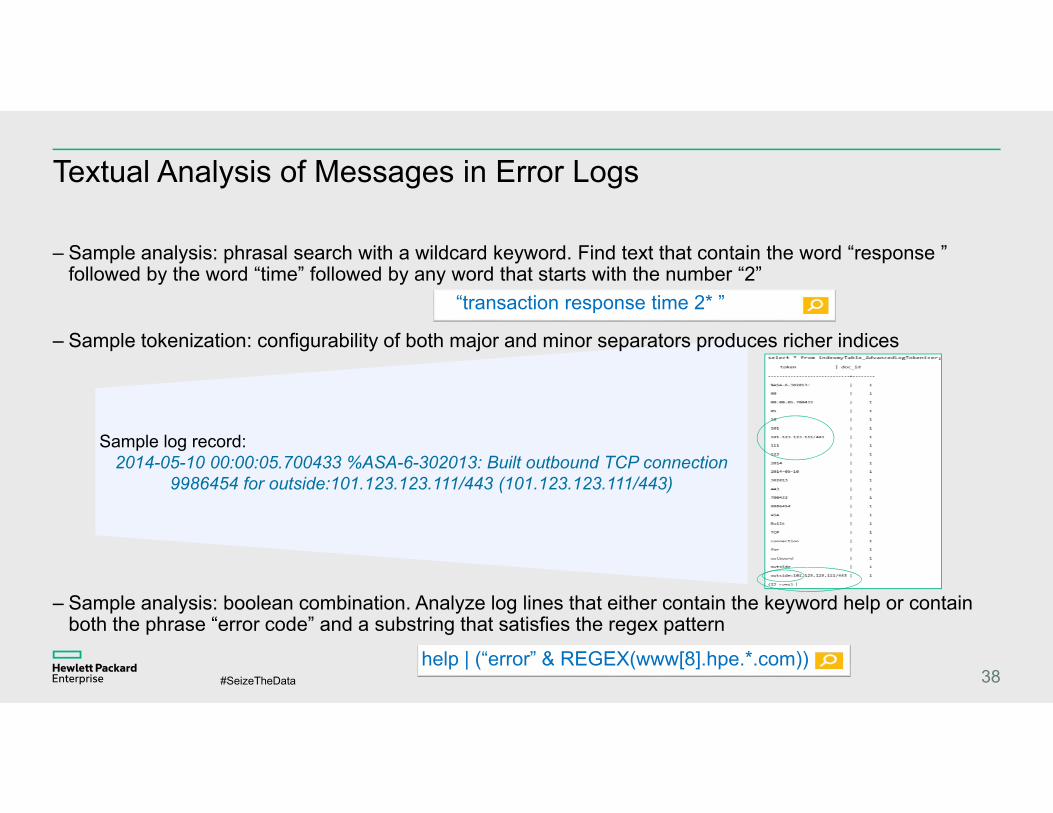
Textual Analysis of Messages in Error Logs
– Sample analysis: phrasal search with a wildcard keyword. Find text that contain the word “response ” followed by the word “time” followed by any word that starts with the number “2”
38
Sample log record:2014-05-10 00:00:05.700433 %ASA-6-302013: Built outbound TCP connection
9986454 for outside:101.123.123.111/443 (101.123.123.111/443)
help | (“error” & REGEX(www[8].hpe.*.com))
– Sample tokenization: configurability of both major and minor separators produces richer indices
– Sample analysis: boolean combination. Analyze log lines that either contain the keyword help or contain both the phrase “error code” and a substring that satisfies the regex pattern
“transaction response time 2* ”

#SeizeTheData 39
#SeizeTheData
IoT Data Pipeline at a Vertica Customer
40
Rental charges
Power consumption
Machine sensors
Access logs
Optional Spark/Storm inclusion - convert all
currencies to $
Geospatial to track usage and failures by location
Machine learning to categorize, classify, and predict
Multidimensional to aggregate by cost-center, by clinic, and other levels of hierarchy
Real-time dashboards
To Ops as parts replacement recommendations
To Finance as lease buyout recommendations
Time Series to interpolate missing values. Event Series Joins to blend feeds.
Log Text Analytics and Pattern Match to understand errors
Join with data in several other data ponds in many formats
Many live streams in many formats
CEF
and Flex tables
#SeizeTheData
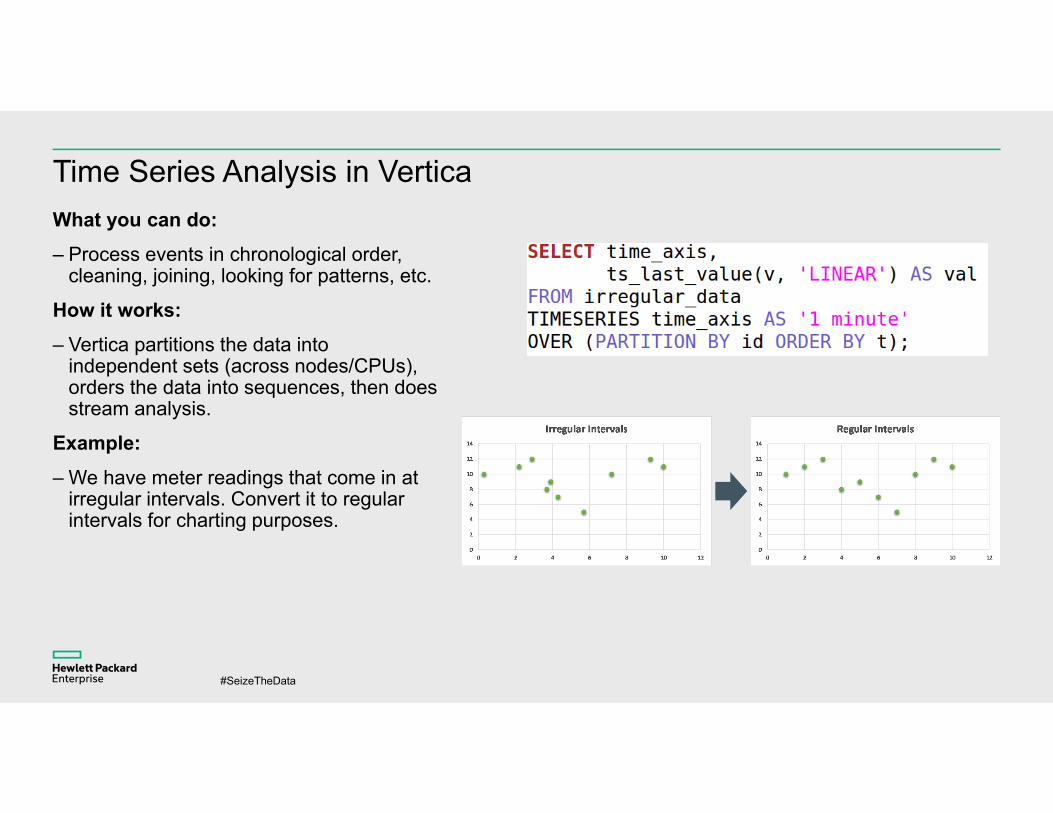
Time Series Analysis in VerticaWhat you can do:– Process events in chronological order,
cleaning, joining, looking for patterns, etc.
How it works:– Vertica partitions the data into
independent sets (across nodes/CPUs), orders the data into sequences, then does stream analysis.
Example:– We have meter readings that come in at
irregular intervals. Convert it to regular intervals for charting purposes.
#SeizeTheData
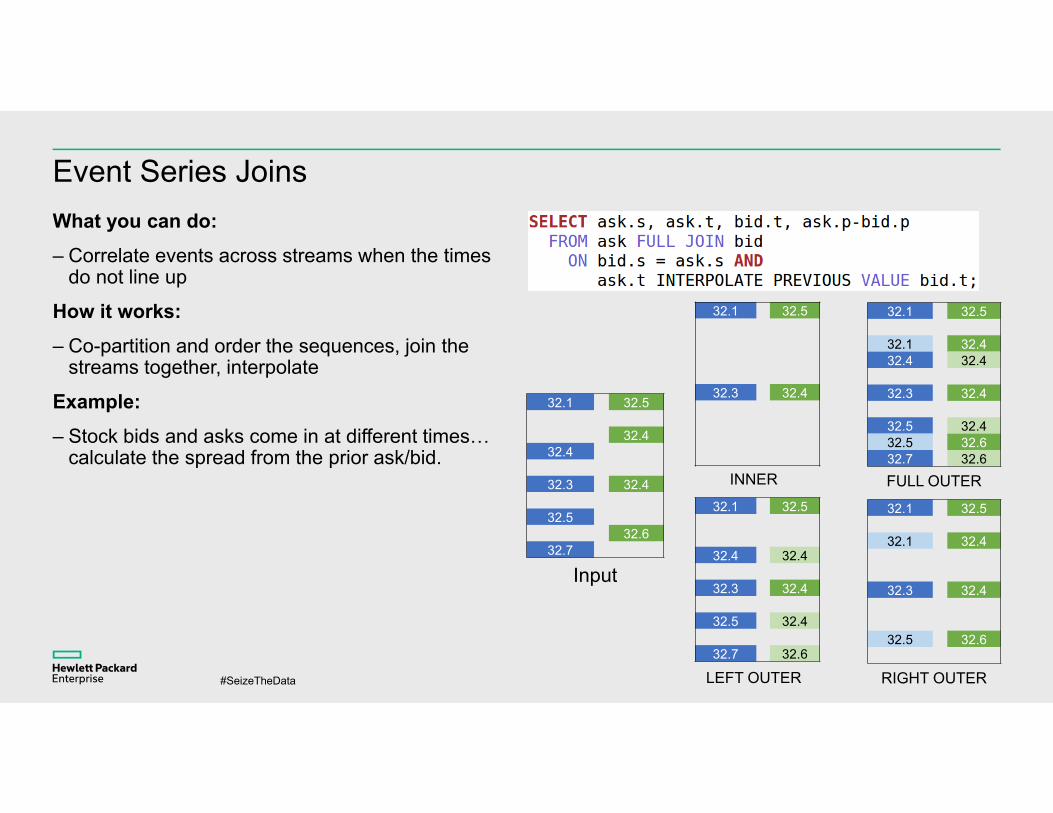
Event Series JoinsWhat you can do:– Correlate events across streams when the times
do not line up
How it works:– Co-partition and order the sequences, join the
streams together, interpolate
Example:– Stock bids and asks come in at different times…
calculate the spread from the prior ask/bid.
32.1 32.5
32.432.4
32.3 32.4
32.532.6
32.7
Input
32.1 32.5
32.1 32.432.4 32.4
32.3 32.4
32.5 32.432.5 32.632.7 32.6
FULL OUTER
32.1 32.5
32.3 32.4
INNER
LEFT OUTER
32.1 32.5
32.4 32.4
32.3 32.4
32.5 32.4
32.7 32.6
32.1 32.5
32.1 32.4
32.3 32.4
32.5 32.6
RIGHT OUTER
#SeizeTheData
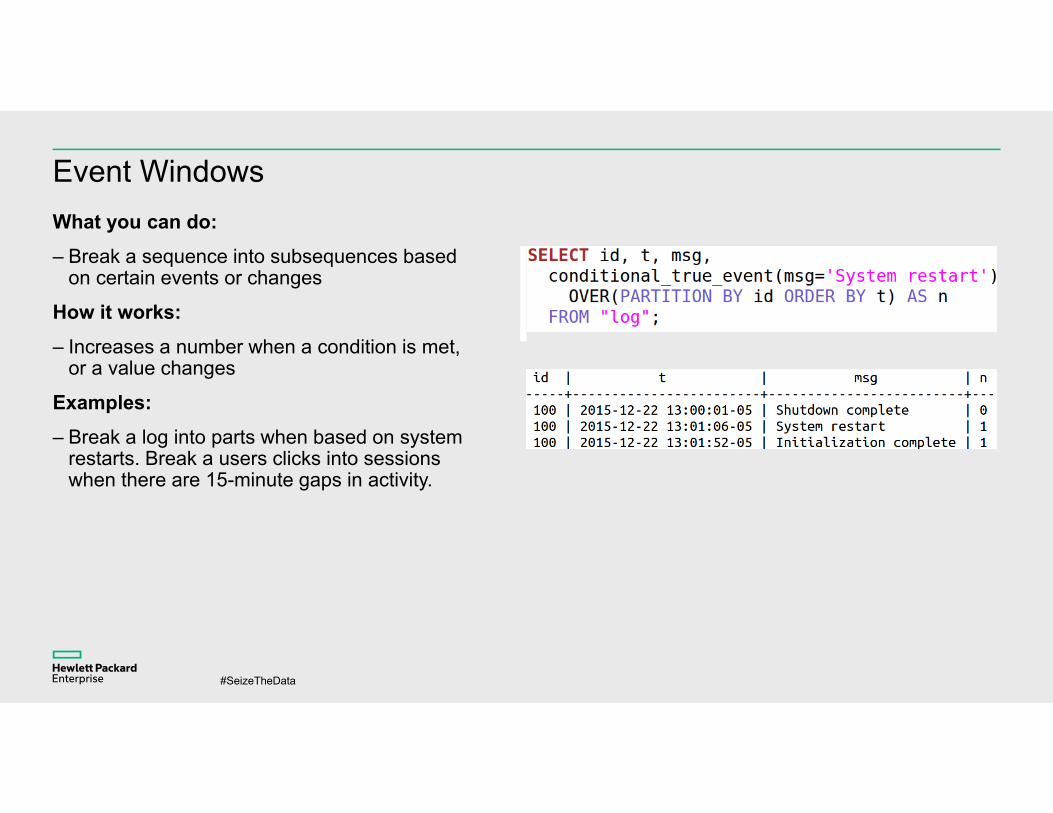
Event WindowsWhat you can do:– Break a sequence into subsequences based
on certain events or changes
How it works:– Increases a number when a condition is met,
or a value changes
Examples:– Break a log into parts when based on system
restarts. Break a users clicks into sessions when there are 15-minute gaps in activity.

#SeizeTheData 44
#SeizeTheData
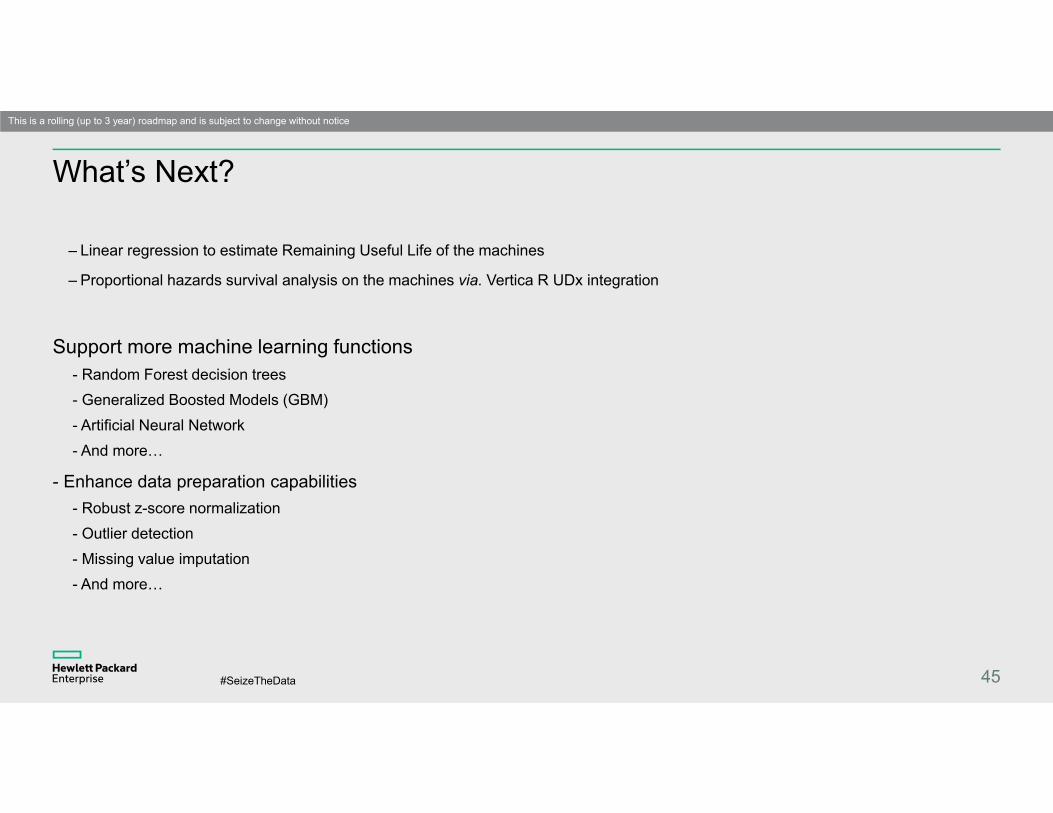
What’s Next?
– Linear regression to estimate Remaining Useful Life of the machines
– Proportional hazards survival analysis on the machines via. Vertica R UDx integration
Support more machine learning functions- Random Forest decision trees- Generalized Boosted Models (GBM)- Artificial Neural Network- And more…
- Enhance data preparation capabilities- Robust z-score normalization- Outlier detection- Missing value imputation- And more…
45
This is a rolling (up to 3 year) roadmap and is subject to change without notice
#SeizeTheData
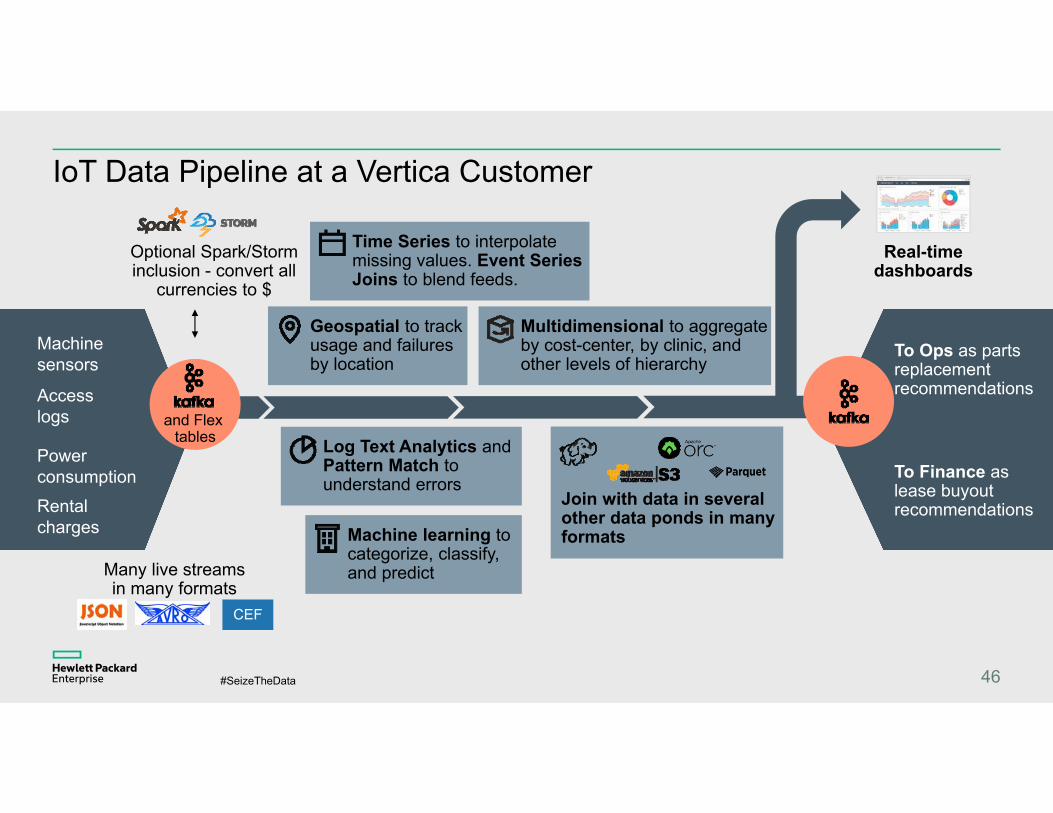
IoT Data Pipeline at a Vertica Customer
46
Rental charges
Power consumption
Machine sensors
Access logs
Optional Spark/Storm inclusion - convert all
currencies to $
Geospatial to track usage and failures by location
Machine learning to categorize, classify, and predict
Multidimensional to aggregate by cost-center, by clinic, and other levels of hierarchy
Real-time dashboards
To Ops as parts replacement recommendations
To Finance as lease buyout recommendations
Time Series to interpolate missing values. Event Series Joins to blend feeds.
Log Text Analytics and Pattern Match to understand errors
Join with data in several other data ponds in many formats
Many live streams in many formats
CEF
and Flex tables