hfma copyright 2012 kaufman, hall & associates, inc. all rights reserved. strategic options in a...
TRANSCRIPT

HFMA
Copyright 2012 Kaufman, Hall & Associates, Inc. All rights reserved.
Strategic Options in a Consolidating Market
Los Angeles, CA | Date August 16, 2012
Copyright 2012 Kaufman, Hall & Associates, Inc. All rights reserved.

HFMA
Copyright 2012 Kaufman, Hall & Associates, Inc. All rights reserved.
Proposed Topics for Discussion
• Establishing the Context
– National and Local Trends
– Industry Dynamics
• Strategic Options Assessment
– Phase I: Education on State of the Industry and Industry Trends
– Phase II: Market and Organization Assessment
– Phase III: Scenarios, Sensitivities and Assessment of Independent Plan
– Phase IV: Evaluation of Strategic Options
• Critical Questions in Partnership Evaluation
2

HFMA
Copyright 2012 Kaufman, Hall & Associates, Inc. All rights reserved.
National Trends With A Focus on California
3

HFMA
Copyright 2012 Kaufman, Hall & Associates, Inc. All rights reserved.
Source: The Health Care M&A Report, Irving Levin Associates, Inc., 2000-2011 and AHA Hospital Statistics*YTD as of 11/30/2011
Number of M&A transactions, 2000-2011
Drivers of hospital consolidation in the
past decade
• Financially distressed community hospitals • Community hospitals requiring significant capital
for investments, but unable to access the capital necessary to fund those projects
% of Hospital in Health Systems
Current Trends in Hospital Merger and Acquisition Activity:Hospital Consolidation Trends
0
10
20
30
40
50
60
70
80
90
2000 2001 2002 2003 2004 2005 2006 2007 2008 2009 2010 2011
85 84
61
38
5853
57 58 60
50
74
86
4
HFMA
Copyright 2012 Kaufman, Hall & Associates, Inc. All rights reserved.
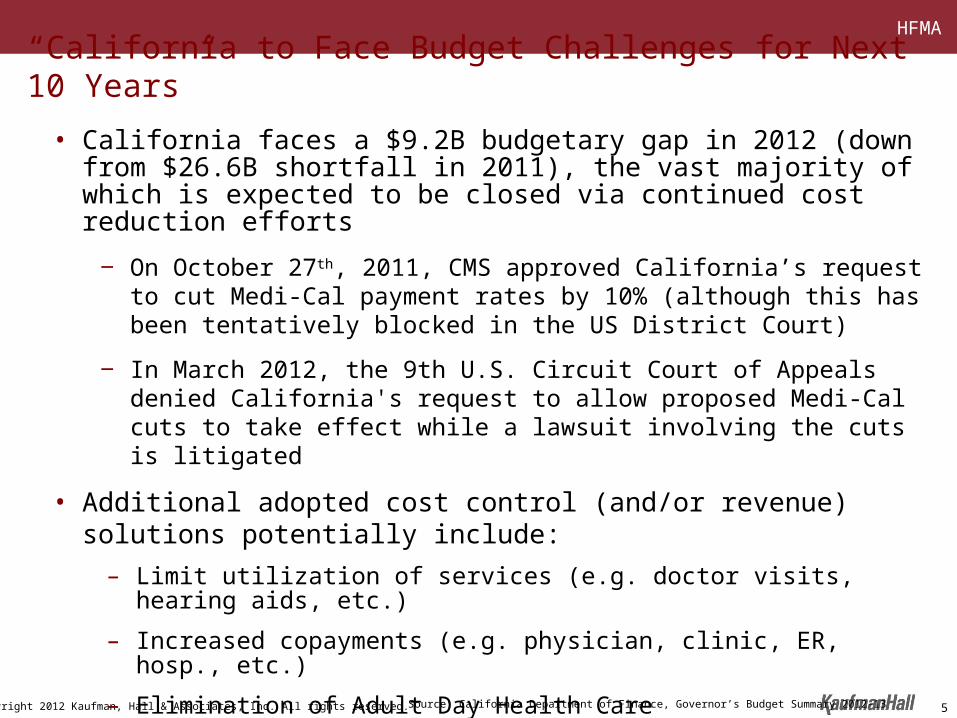
“California to Face Budget Challenges for Next 10 Years”
• California faces a $9.2B budgetary gap in 2012 (down from $26.6B shortfall in 2011), the vast majority of which is expected to be closed via continued cost reduction efforts
‒ On October 27th, 2011, CMS approved California’s request to cut Medi-Cal payment rates by 10% (although this has been tentatively blocked in the US District Court)
‒ In March 2012, the 9th U.S. Circuit Court of Appeals denied California's request to allow proposed Medi-Cal cuts to take effect while a lawsuit involving the cuts is litigated
• Additional adopted cost control (and/or revenue) solutions potentially include:
– Limit utilization of services (e.g. doctor visits, hearing aids, etc.)
– Increased copayments (e.g. physician, clinic, ER, hosp., etc.)
– Elimination of Adult Day Health Care
– Extension of existing Hospital Fees (i.e. 30 month ext. pending)
– Medi-Cal waiver renewal (between CA and federal government)Source: California Department of Finance, Governor’s Budget Summary 2012-13 5

HFMA
Copyright 2012 Kaufman, Hall & Associates, Inc. All rights reserved.
Hospital Expenses Starting to Outpace Revenue Growth in the State of California
1999 2000 2001 2002 2003 2004 2005 2006 2007 2008 2009 20102%
4%
6%
8%
10%
12%
Source: 2011 AHA Hospital Statistics (Excludes Separate Nursing Home Units)
Net Revenue
Expenses
Annual Change in CA Hospital Net Revenues and Expenses, 1998-2010
6
HFMA
Copyright 2012 Kaufman, Hall & Associates, Inc. All rights reserved. 7
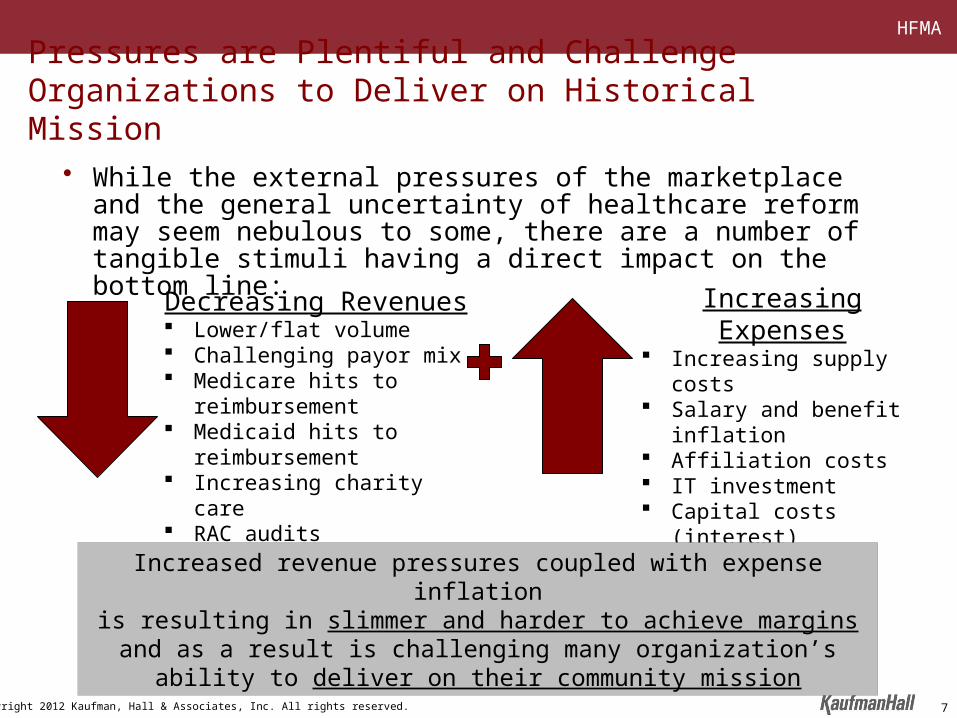
Pressures are Plentiful and Challenge Organizations to Deliver on Historical Mission
• While the external pressures of the marketplace and the general uncertainty of healthcare reform may seem nebulous to some, there are a number of tangible stimuli having a direct impact on the bottom line:
Decreasing Revenues Lower/flat volume Challenging payor mix Medicare hits to reimbursement Medicaid hits to reimbursement Increasing charity care RAC audits
Increasing Expenses Increasing supply costs Salary and benefit inflation Affiliation costs IT investment Capital costs (interest) Pension funding
Increased revenue pressures coupled with expense inflationis resulting in slimmer and harder to achieve margins and as a result is
challenging many organization’s ability to deliver on their community mission

HFMA
Copyright 2012 Kaufman, Hall & Associates, Inc. All rights reserved.
Source: California Healthcare Almanac: California Employer Health Benefits Survey 2009
-2.0%
0.0%
2.0%
4.0%
6.0%
8.0%
10.0%
12.0%
14.0%
16.0%
18.0%
2002 2003 2004 2005 2006 2007 2008 20090%
20%
40%
60%
80%
100%
120%
Annual Premium Increases vs. Inflation, CA 99-09 Cumulative Premium Increases vs. Inflation, CA 02-09
Healthcare Premium Increases Steadily Outpacing Inflation Measures
8
HFMA
Copyright 2012 Kaufman, Hall & Associates, Inc. All rights reserved.
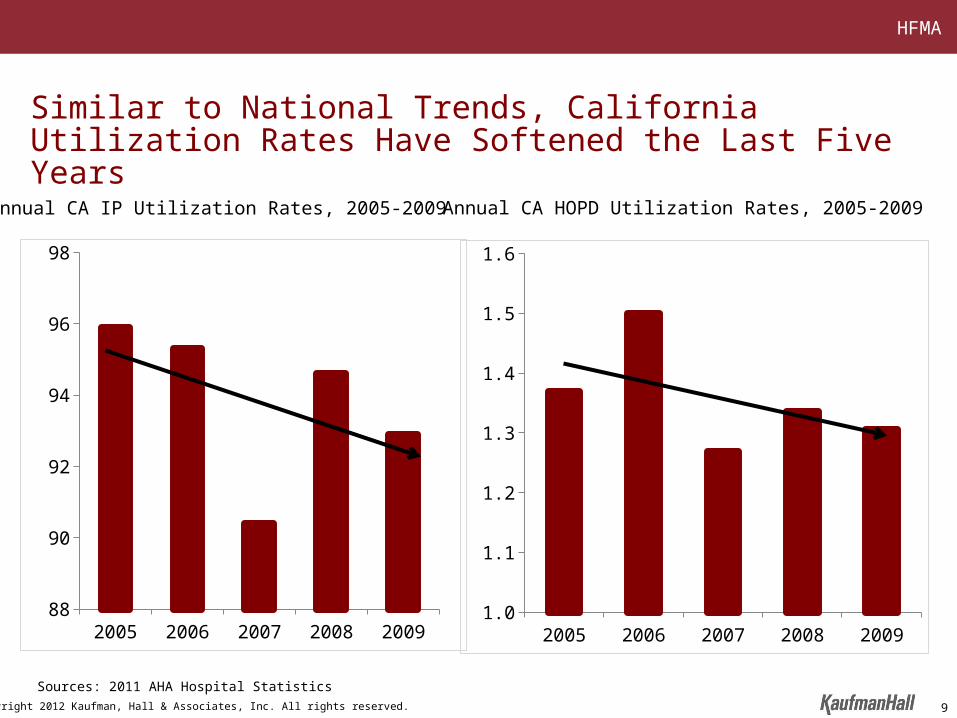
Sources: 2011 AHA Hospital Statistics
Similar to National Trends, California Utilization Rates Have Softened the Last Five Years
2005 2006 2007 2008 200988
90
92
94
96
98
2005 2006 2007 2008 20091.0
1.1
1.2
1.3
1.4
1.5
1.6
Annual CA IP Utilization Rates, 2005-2009 Annual CA HOPD Utilization Rates, 2005-2009
9
HFMA
Copyright 2012 Kaufman, Hall & Associates, Inc. All rights reserved.
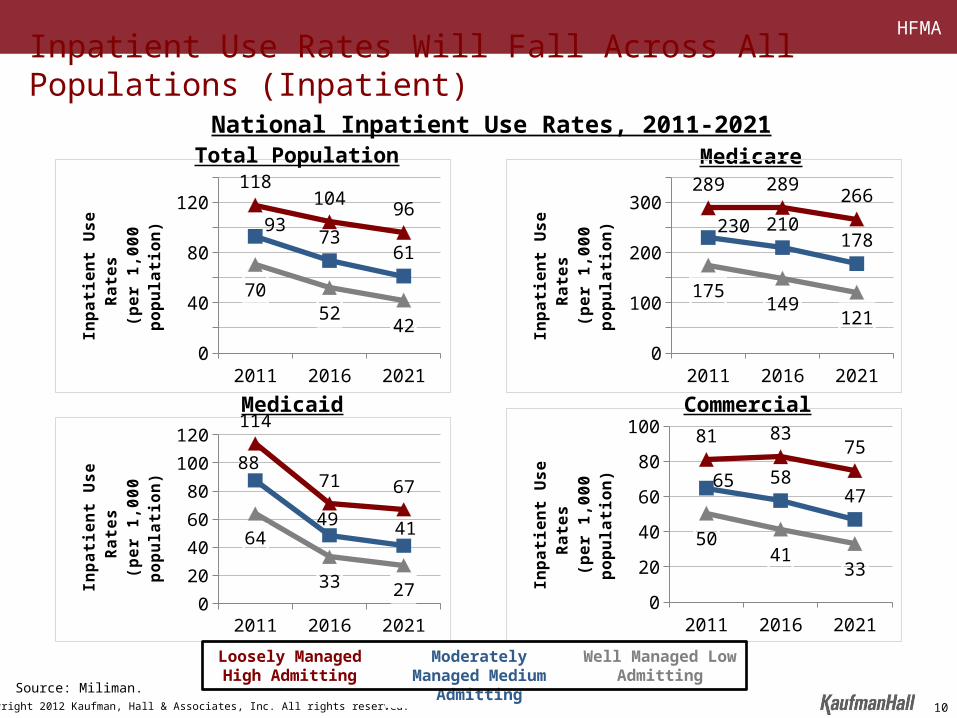
2011 2016 20210
20
40
60
80
100
120
140 118104
9693
7361
7052
42
Inp
ati
en
t U
se
Ra
tes
(p
er
1,0
00
po
pu
lati
on
)
Medicaid
Medicare
National Inpatient Use Rates, 2011-2021
2011 2016 20210
20
40
60
8081 83
75
65 5847
5041
33
Inp
ati
en
t U
se
Ra
tes
(p
er
1,0
00
po
pu
lati
on
)
Loosely Managed High Admitting
Moderately Managed Medium Admitting
Well Managed Low Admitting
2011 2016 20210
20
40
60
80
100
120114
71 67
88
49 4164
33 27Inp
ati
en
t U
se
Ra
tes
(p
er
1,0
00
po
pu
lati
on
)
2011 2016 20210
50
100
150
200
250
300
350289 289
266
230 210178
175149
121
Inp
ati
en
t U
se
Ra
tes
(p
er
1,0
00
po
pu
lati
on
)
Commercial
Total Population
Inpatient Use Rates Will Fall Across All Populations (Inpatient)
Source: Miliman.
10
HFMA
Copyright 2012 Kaufman, Hall & Associates, Inc. All rights reserved.
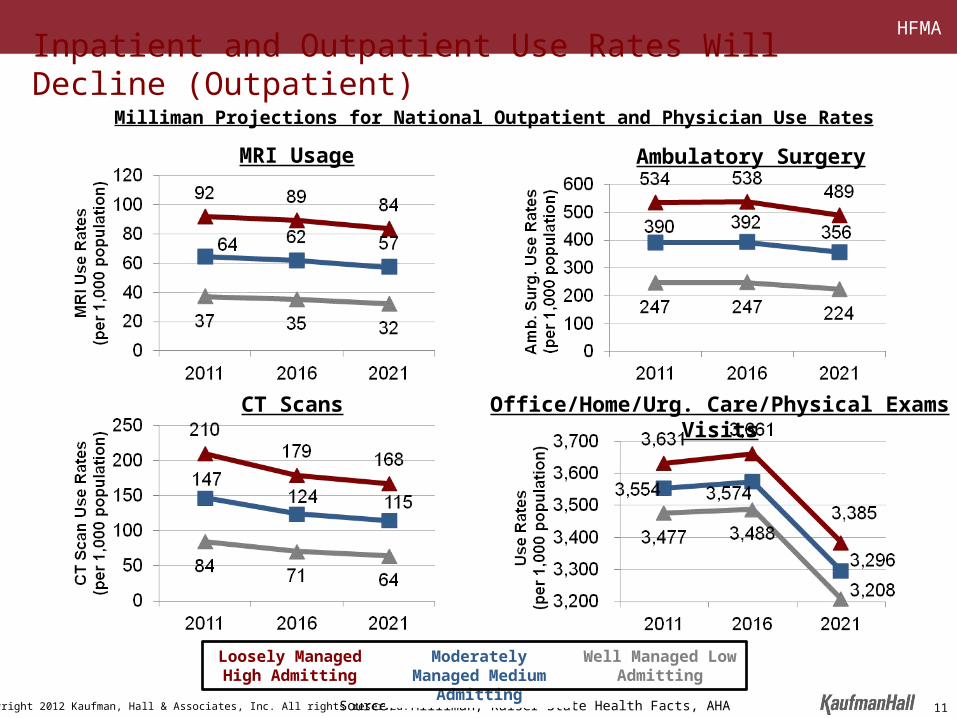
CT Scans
Ambulatory Surgery
Source: Milliman, Kaiser State Health Facts, AHA
Milliman Projections for National Outpatient and Physician Use Rates
Loosely Managed High Admitting
Moderately Managed Medium Admitting
Well Managed Low Admitting
Office/Home/Urg. Care/Physical Exams Visits
MRI Usage
Inpatient and Outpatient Use Rates Will Decline (Outpatient)
11

HFMA
Copyright 2012 Kaufman, Hall & Associates, Inc. All rights reserved. 12
Narrow Scope of Operations Broad
Class IContracted ProvidersSmaller, niche providers, some of which may be in rural communities, that will serve as necessary access points; important, but not critical, components.
Class IIMajor ParticipantsCommunity hospitals and systems that will work within a network managed by a larger Population Health Manager (PHM) to efficiently provide a broad portfolio of services. These organizations will be critical components of PHM networks.
Class IIIPopulation Health ManagersLarge, regional health systems that will be able to provide (either directly or through managed relationships) a full continuum of services, across all service lines and levels of acuity. These organizations will have significant alignment with their medical staffs and will be in a position to accept and manage risk.
The New Business Model Creates Three Classes of Providers

HFMA
Copyright 2012 Kaufman, Hall & Associates, Inc. All rights reserved. 13
The Benefits of Scale
To assess the benefits of scale, Kaufman Hall analyzed key financial performance measures between 2005 and 2010 based upon Moody’s Investors Service data. The results focus on the following areas:
• Profitability• Leverage• Investment• Credit rating
1 Academic Medical Center with multiple sites is included in System category.Source: Information supplied by Moody’s Investors Service based upon 2005-2010 published ratios.
Revenue Classes Based Upon Net Patient Service Revenue
$250M - $500M (N = 103)
$500M - $1B (N = 99)
$1B - $2B (N = 57)
$2B - $4B (N = 36)
$4B+ (N = 20)
(N = 315)
Type of Hospital < $500M $500-$1B $1B-$2B $2B-$4B $4B+ TotalStand Alone 79.6% 51.5% 15.8% 19.4% 5.0% 47.6%
Academic Med. Ctr.1 1.9% 11.1% 28.1% 8.3% 10.0% 36.5%Single State System 18.4% 37.4% 54.4% 58.3% 35.0% 10.8%Multi-State System 0.0% 0.0% 1.8% 13.9% 50.0% 5.1%
Total 100.0% 100.0% 100.0% 100.0% 100.0% 100.0%
Revenue Category
Distribution by Facility Type
HFMA
Copyright 2012 Kaufman, Hall & Associates, Inc. All rights reserved. 14
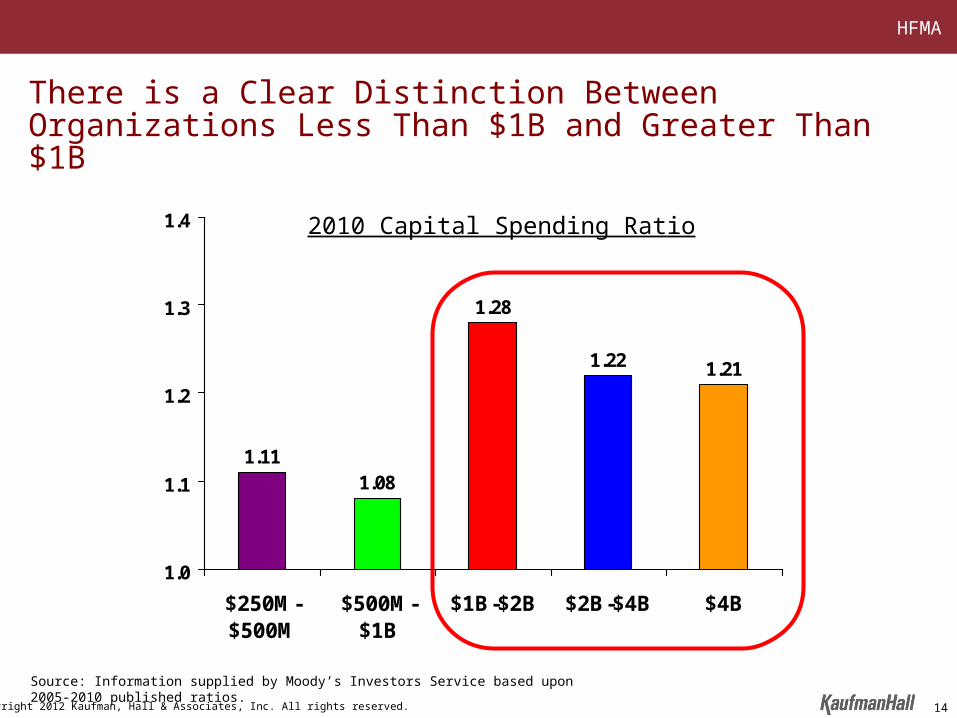
1.111.08
1.28
1.22 1.21
1.0
1.1
1.2
1.3
1.4
$250M-$500M
$500M-$1B
$1B-$2B $2B-$4B $4B
There is a Clear Distinction Between Organizations Less Than $1B and Greater Than $1B
2010 Capital Spending Ratio
Source: Information supplied by Moody’s Investors Service based upon 2005-2010 published ratios.
HFMA
Copyright 2012 Kaufman, Hall & Associates, Inc. All rights reserved. 15
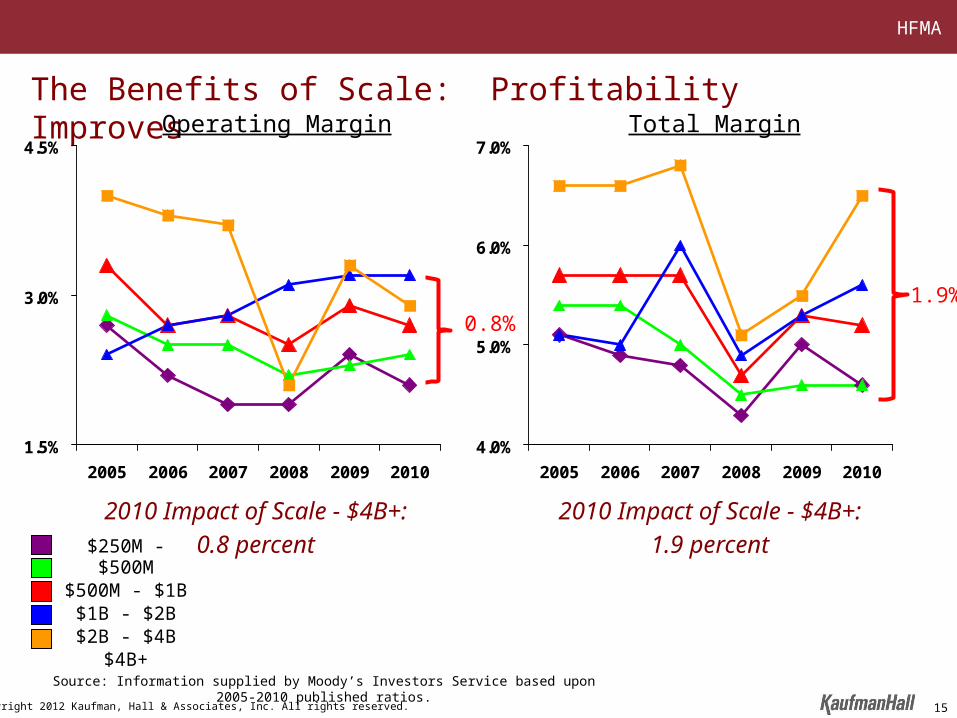
The Benefits of Scale: Profitability Improves
1.5%
3.0%
4.5%
2005 2006 2007 2008 2009 2010
Operating Margin
4.0%
5.0%
6.0%
7.0%
2005 2006 2007 2008 2009 2010
Total Margin
2010 Impact of Scale - $4B+:
0.8 percent
2010 Impact of Scale - $4B+:
1.9 percent
Source: Information supplied by Moody’s Investors Service based upon 2005-2010 published ratios.
$250M - $500M$500M - $1B
$1B - $2B$2B - $4B
$4B+
1.9%0.8%
HFMA
Copyright 2012 Kaufman, Hall & Associates, Inc. All rights reserved.
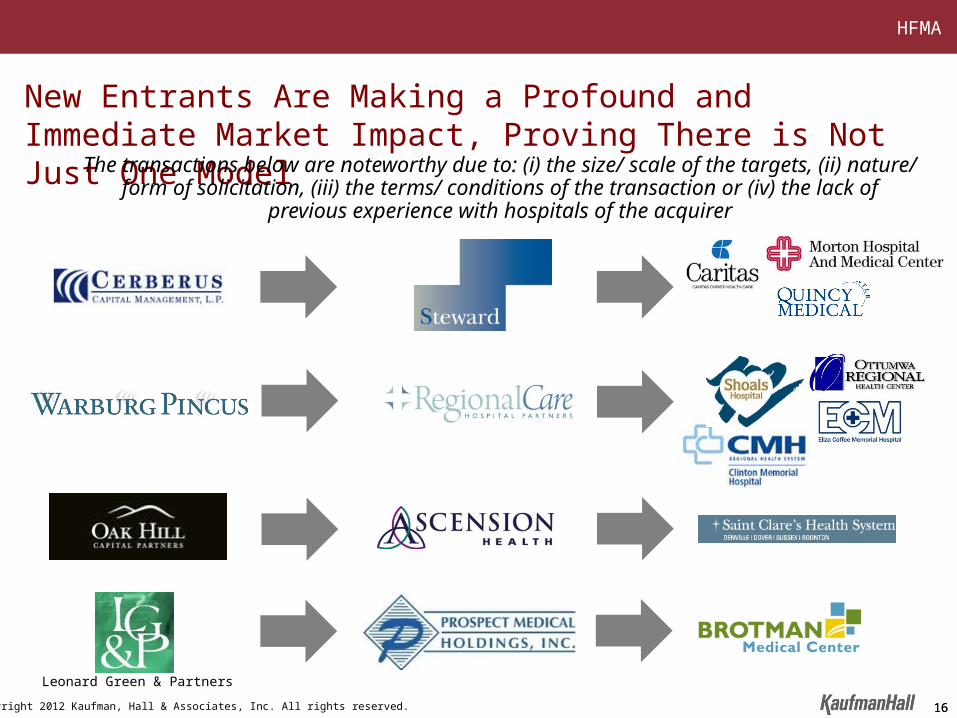
New Entrants Are Making a Profound and Immediate Market Impact, Proving There is Not Just One Model
The transactions below are noteworthy due to: (i) the size/ scale of the targets, (ii) nature/ form of solicitation, (iii) the terms/ conditions of the transaction or (iv) the lack of
previous experience with hospitals of the acquirer
161616
Leonard Green & Partners
HFMA
Copyright 2012 Kaufman, Hall & Associates, Inc. All rights reserved.
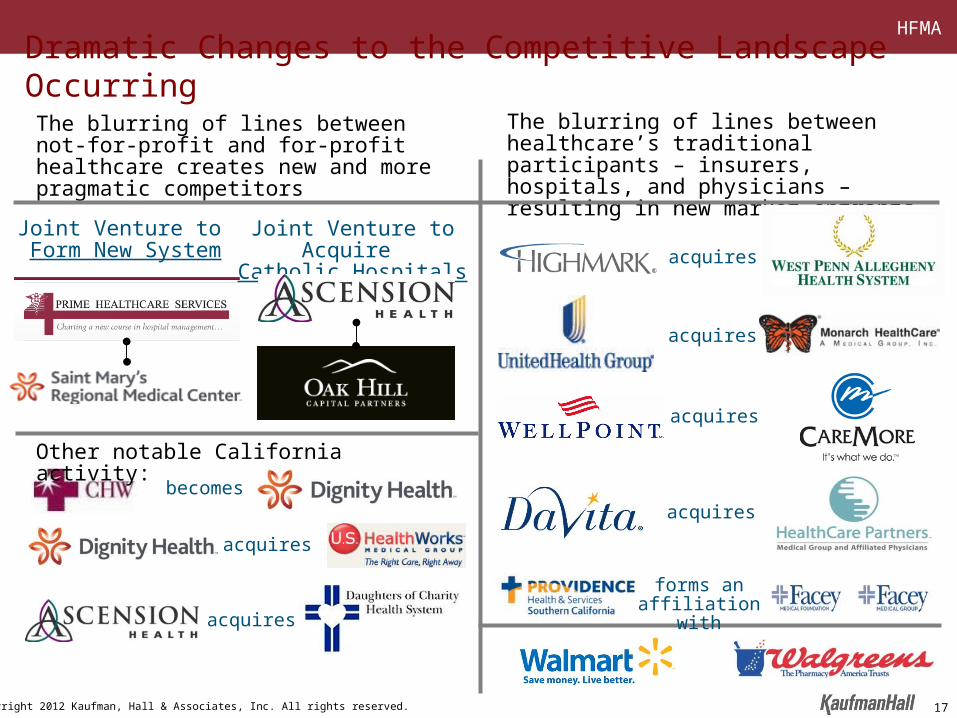
Dramatic Changes to the Competitive Landscape Occurring
17
The blurring of lines between not-for-profit and for-profit healthcare creates new and more pragmatic competitors
The blurring of lines between healthcare’s traditional participants – insurers, hospitals, and physicians – resulting in new market entrants
Joint Venture to Form New System
Joint Venture to Acquire Catholic Hospitals
acquires
acquires
acquires
becomes
acquires
Other notable California activity:
forms an affiliation with
acquires
acquires

HFMA
Copyright 2012 Kaufman, Hall & Associates, Inc. All rights reserved.
Establishing the Context: Industry Dynamics
18
HFMA
Copyright 2012 Kaufman, Hall & Associates, Inc. All rights reserved. 19
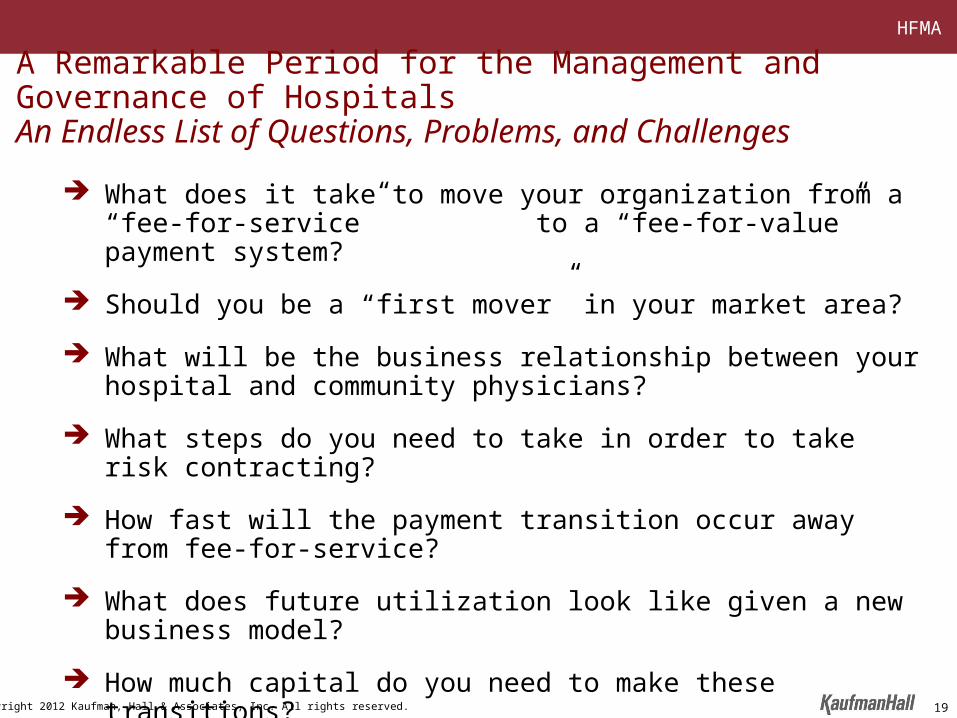
What does it take to move your organization from a “fee-for-service” to a “fee-for-value” payment system?
Should you be a “first mover” in your market area?
What will be the business relationship between your hospital and community physicians?
What steps do you need to take in order to take risk contracting?
How fast will the payment transition occur away from fee-for-service?
What does future utilization look like given a new business model?
How much capital do you need to make these transitions?
Do you need a partner or can you go it alone?
A Remarkable Period for the Management and Governance of HospitalsAn Endless List of Questions, Problems, and Challenges

HFMA
Copyright 2012 Kaufman, Hall & Associates, Inc. All rights reserved.
The Word of the Moment in Healthcare Is “Unsustainable”
The size of the federal budget deficit is unsustainable
The annual increase in the Medicare budget is unsustainable
The percentage of healthcare spending to GDP is unsustainable
State Medicaid programs are unsustainable
The continued transfer of costs to employers and consumers is unsustainable
20
In other words, the old business model is broken and will be replaced with new, yet to be defined business models
HFMA
Copyright 2012 Kaufman, Hall & Associates, Inc. All rights reserved. 21
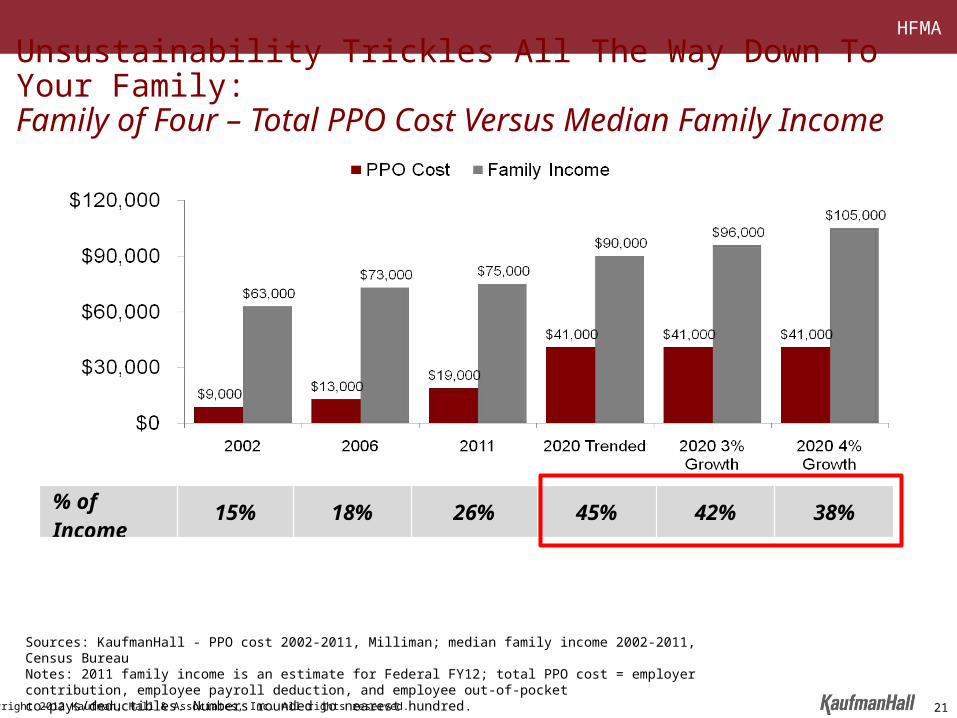
Unsustainability Trickles All The Way Down To Your Family:Family of Four – Total PPO Cost Versus Median Family Income
% of Income 15% 18% 26% 45% 42% 38%
Sources: KaufmanHall - PPO cost 2002-2011, Milliman; median family income 2002-2011, Census BureauNotes: 2011 family income is an estimate for Federal FY12; total PPO cost = employer contribution, employee payroll deduction, and employee out-of-pocket co-pays/deductibles. Numbers rounded to nearest hundred.

HFMA
Copyright 2012 Kaufman, Hall & Associates, Inc. All rights reserved.
Any executive or organization that wants to change things should be guided by “a point of view about what’s going on
in the world, and you invest around that point of view.”
Jeff ImmeltChair and CEO
General Electric
22
The Intensity and Velocity of Change in the Hospital Industry Mandates That Organizations Develop a Clear and Cohesive Point of View
“The world is a complicated place with oceans of new information sloshing around. To run… an organization it
helps if you have a rough idea of what is going on.”
The Economist Magazine
HFMA
Copyright 2012 Kaufman, Hall & Associates, Inc. All rights reserved.
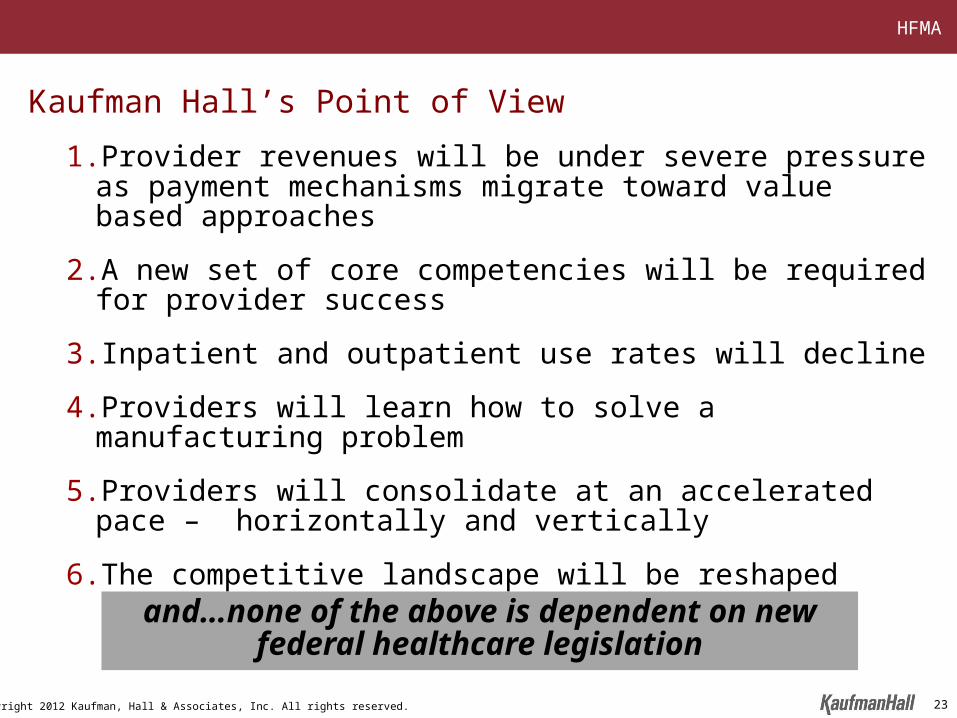
1. Provider revenues will be under severe pressure as payment mechanisms migrate toward value based approaches
2. A new set of core competencies will be required for provider success
3. Inpatient and outpatient use rates will decline
4. Providers will learn how to solve a manufacturing problem
5. Providers will consolidate at an accelerated pace – horizontally and vertically
6. The competitive landscape will be reshaped
Kaufman Hall’s Point of View
23
and…none of the above is dependent on new federal healthcare legislation

HFMA
Copyright 2012 Kaufman, Hall & Associates, Inc. All rights reserved.
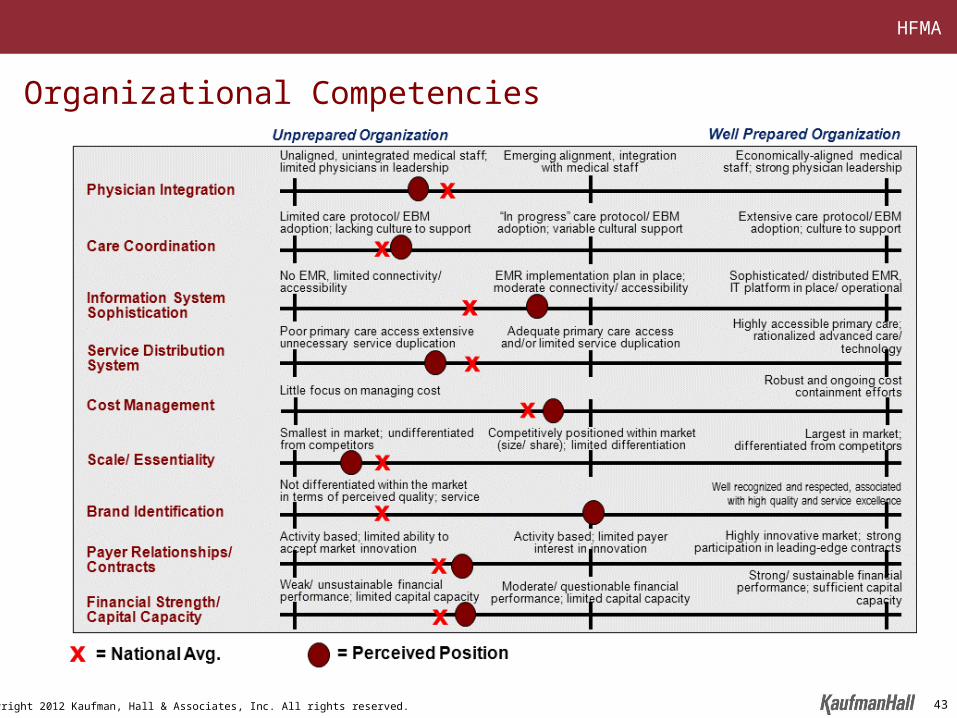
Integration Attributes Key Characteristics of the Best Prepared
Physician/ Hospital Integration
A highly aligned medical staff characterized by shared goals, outcomes-based contractual arrangements, significant planning input, and adequately represented in organizational governance
Care Coordination/ Management Capability
Use of care coordination tools and processes by an empowered and integrated workforce to meet performance goals that are regularly measured and reported
Information Systems Sophistication
An IT platform that supports clinical decision making, information management, facile communications, and access by all stakeholders (physicians, patients, administration) to proper treatment and strategic decision making
Service Distribution System Effectiveness
A rational service distribution system that has accessible primary care and easy access (both physically and through referrals) across the care continuum, delivered in contemporary facilities with contemporary equipment
Cost ManagementA right-sized organization-wide cost structure, highlighted by appropriate levels of staffing, capital spending, overhead support, and supply chain costs; constantly reviewed based on comparative peer group studies and benchmarks
Scale and Market Essentiality
Sufficient scale to attract competitive clinical and administrative talent, realize economies, drive marketplace innovation, and be an essential provider to health plans and patients
Brand Identification Well recognized and respected, associated with high quality and service excellence
Payer Relationships/ Contracts
Maintaining strong relationships with payers and the ability to negotiate support for “new era” business practices
Financial Strength/ Capital Capacity
Strong appeal to capital markets through sustained operations, revenue growth, and balance sheet strength
New Core Competencies Will Be Required of Hospitals and Health Systems for Success in the Future
24
HFMA
Copyright 2012 Kaufman, Hall & Associates, Inc. All rights reserved.
Healthcare Industry Fragmentation
25
0.0%
10.0%
20.0%
30.0%
40.0%
50.0%
60.0%
70.0%
80.0%
90.0%
100.0%
Hospitals SemiconductorSupplies
Airlines Retail Pharmacy
16.1%
34.9%
63.0%
70.5%
26.0%
58.8%
88.9% 91.0%
Top 5 Players Top 15 Players
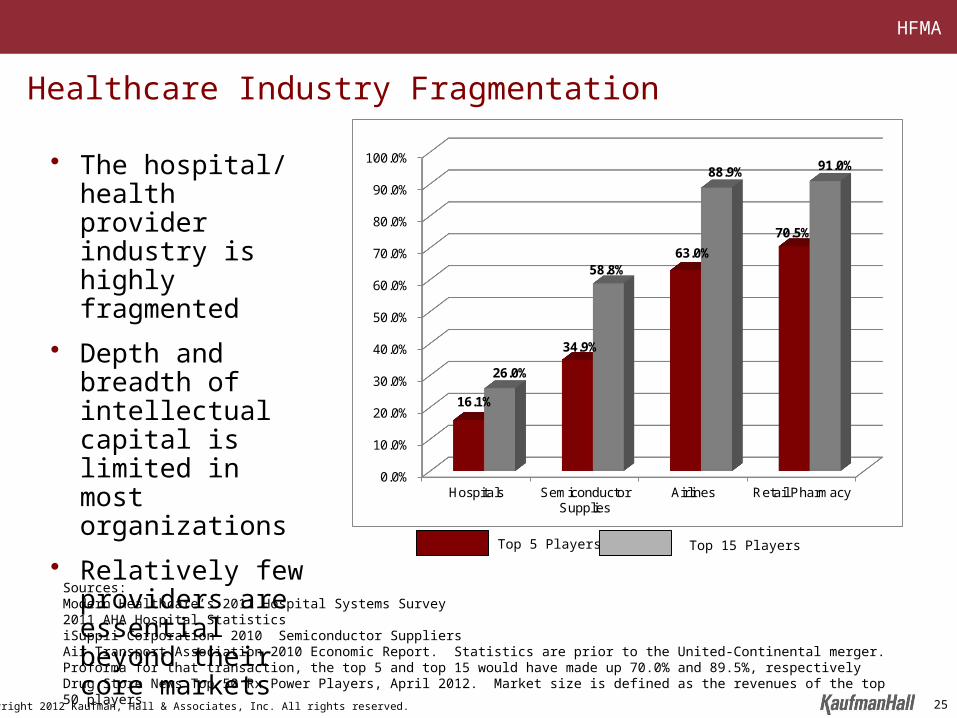
• The hospital/ health provider industry is highly fragmented
• Depth and breadth of intellectual capital is limited in most organizations
• Relatively few providers are essential beyond their core markets
Sources:Modern Healthcare’s 2011 Hospital Systems Survey2011 AHA Hospital StatisticsiSuppli Corporation 2010 Semiconductor SuppliersAir Transport Association 2010 Economic Report. Statistics are prior to the United-Continental merger. Proforma for that transaction, the top 5 and top 15 would have made up 70.0% and 89.5%, respectively Drug Store News Top 50 Rx Power Players, April 2012. Market size is defined as the revenues of the top 50 players
HFMA
Copyright 2012 Kaufman, Hall & Associates, Inc. All rights reserved.
Healthcare Industry Fragmentation
• The driver of consolidation in other industries was disruption of the prevailing business model
– Response to a change in the revenue model
– An imperative for IT sophistication
– Innovation/ evolution in the production/ service delivery process
– Change in the competitive dynamic/ new market entrants
– An aggregation “domino” effect
26

HFMA
Copyright 2012 Kaufman, Hall & Associates, Inc. All rights reserved.
Focus on Retail Pharmacy• The incorporation of a pharmacy benefit in
health insurance plans shifts payment responsibility from the consumer to the insurer
• Insurers use their leverage and negotiate lower drug prices with retail pharmacies for their enrollment base
• Broad geographic coverage (scale) and brand recognition become essential attributes for retail pharmacy success in order to negotiate sustainable rates
• Sophisticated IT becomes imperative for interface with commercial and governmental programs and now consumers
• Scale becomes imperative to drive operating costs to their lowest-possible level
• The independent retail pharmacy all but disappears
Source: “Pharmaceutical Marketplace Dynamics: Expenditures, Distribution, Coverage, Pricing.” National Association of Chain Drug Stores. May 2000. “History of the Digest.” National Community Pharmacists Association. 2001. “Consolidation of US Retail Pharmacy Industry. TATA Consultancy Services. August 2009. IMS Prescription Market Share; 1995,2010. Drug Stores Business and Industry Profile, Illinois/ US Department of Commerce & Southern Illinois University.
55%
Independent Drugstore Market Share
1995
2010
1976
22%
12%
27
HFMA
Copyright 2012 Kaufman, Hall & Associates, Inc. All rights reserved.
• The Hill Burton Act of 1946 supported capital access for individual communities, sparking investment in community hospitals
• Support for the local hospital became a source of pride for community leaders and prestige was attached to local hospital Board membership
• Independent physician staffs maintained a strong preference for locally controlled hospitals over which they could extend influence
• A relatively cooperative payer market resulted in less price and cost pressure than in other industries
• Access to capital has been available to both large and small, strong and weak providers during past decades
• Absence of a dominant player(s) in many markets allowed marginal providers to survive
Why Has the Hospital Industry Been Highly Fragmented?
28
HFMA
Copyright 2012 Kaufman, Hall & Associates, Inc. All rights reserved.
• Further health insurer consolidation
• Staggering “new era” intellectual and financial capital requirements
• Transition from an independent to an integrated physician community
• Need for a rationalized service distribution system
• Increasing transparency of quality and outcomes
• Increased visibility of regional and national healthcare brands
• Migration of payment mechanisms away from activity-based to quality-/ efficiency-based contracts
• Evidence of a correlation among size, performance, and capital reinvestment
What Has Changed?
29
HFMA
Copyright 2012 Kaufman, Hall & Associates, Inc. All rights reserved.
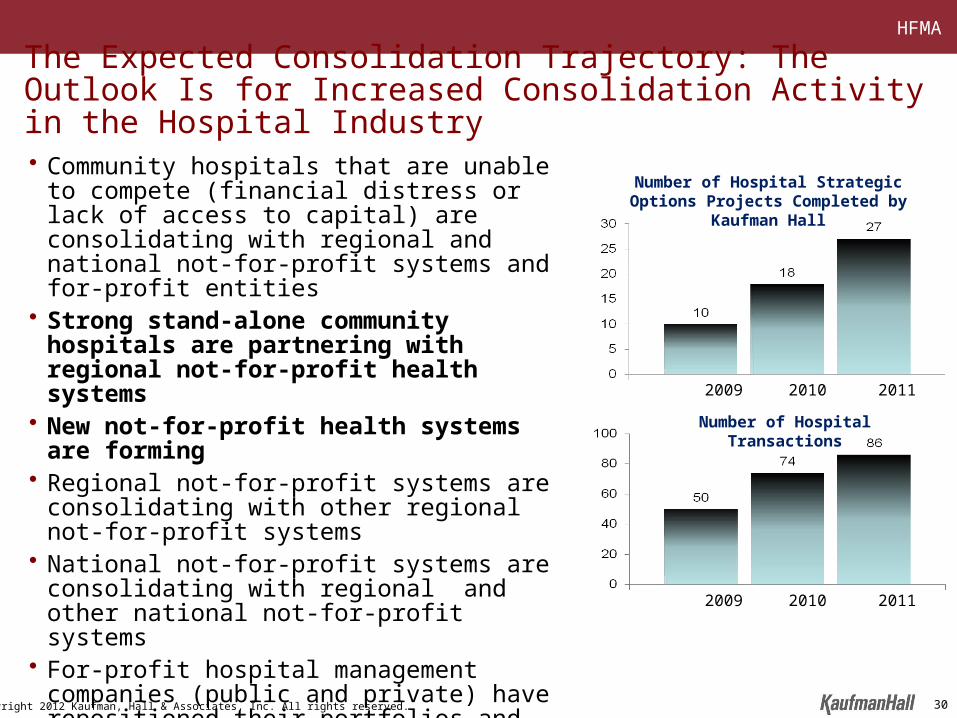
• Community hospitals that are unable to compete (financial distress or lack of access to capital) are consolidating with regional and national not-for-profit systems and for-profit entities
• Strong stand-alone community hospitals are partnering with regional not-for-profit health systems
• New not-for-profit health systems are forming
• Regional not-for-profit systems are consolidating with other regional not-for-profit systems
• National not-for-profit systems are consolidating with regional and other national not-for-profit systems
• For-profit hospital management companies (public and private) have repositioned their portfolios and are poised for further acquisitions
• New private equity financing continues to enter the market
The Expected Consolidation Trajectory: The Outlook Is for Increased Consolidation Activity in the Hospital Industry
Number of Hospital Transactions
Number of Hospital Strategic Options Projects Completed by Kaufman Hall
2009 2010 2011
2009 2010 2011
30

HFMA
Copyright 2012 Kaufman, Hall & Associates, Inc. All rights reserved.
Strategic Options Evaluation
31
HFMA
Copyright 2012 Kaufman, Hall & Associates, Inc. All rights reserved.
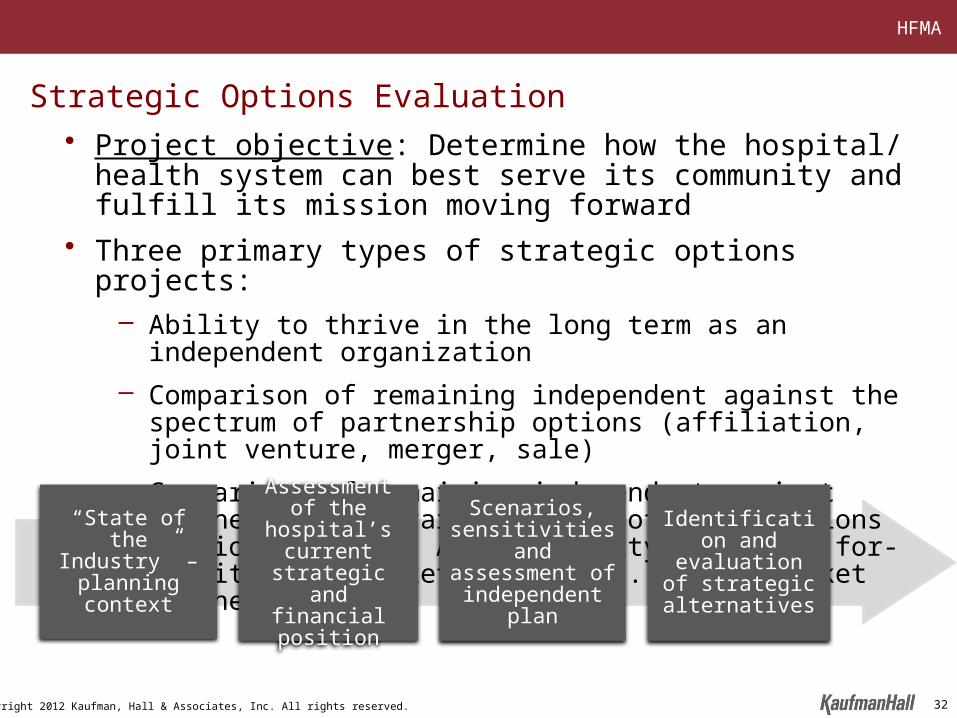
Strategic Options Evaluation• Project objective: Determine how the hospital/ health system can
best serve its community and fulfill its mission moving forward
• Three primary types of strategic options projects:– Ability to thrive in the long term as an independent organization
– Comparison of remaining independent against the spectrum of partnership options (affiliation, joint venture, merger, sale)
– Comparison of remaining independent against partnering with various types of organizations (regional system, AMC, community hospital, for-profit or in-market partner vs. out-of-market partner)
“State of the Industry” –
planning context
Assessment of the hospital’s
current strategic and financial
position
Identification and evaluation of
strategic alternatives
Scenarios, sensitivities and assessment of
independent plan
32

HFMA
Copyright 2012 Kaufman, Hall & Associates, Inc. All rights reserved.
Phase I: Education on the State of the Industry and Trends
Topic Description
Key Challenges and Opportunities for the Healthcare Industry Highlighting macro industry trends
Our assessment of the requirements necessary for hospitals to be successful under healthcare reform
Our assessment of the requirements necessary for hospitals to be successful under healthcare reform
The Business Case for Growth and Scale
Why we are seeing the rise of “super regional” healthcare systems
Current Status of the Tax Exempt Credit Markets Where we are today and the implications
Trends in Hospital and Health System Consolidation
For the past decade, the primary drivers of hospital consolidation have been financial factors; over the past 12 to 18 months, the rationale for consolidation has shifted toward strategic factors
Why Successful Community Hospitals Are Considering Partnerships
Our assessment of the underlying rationale along with two or three short vignettes
Affiliation Structure Alternatives Discussion of a variety of structures available to hospital providers and the business implications of each
33
HFMA
Copyright 2012 Kaufman, Hall & Associates, Inc. All rights reserved.
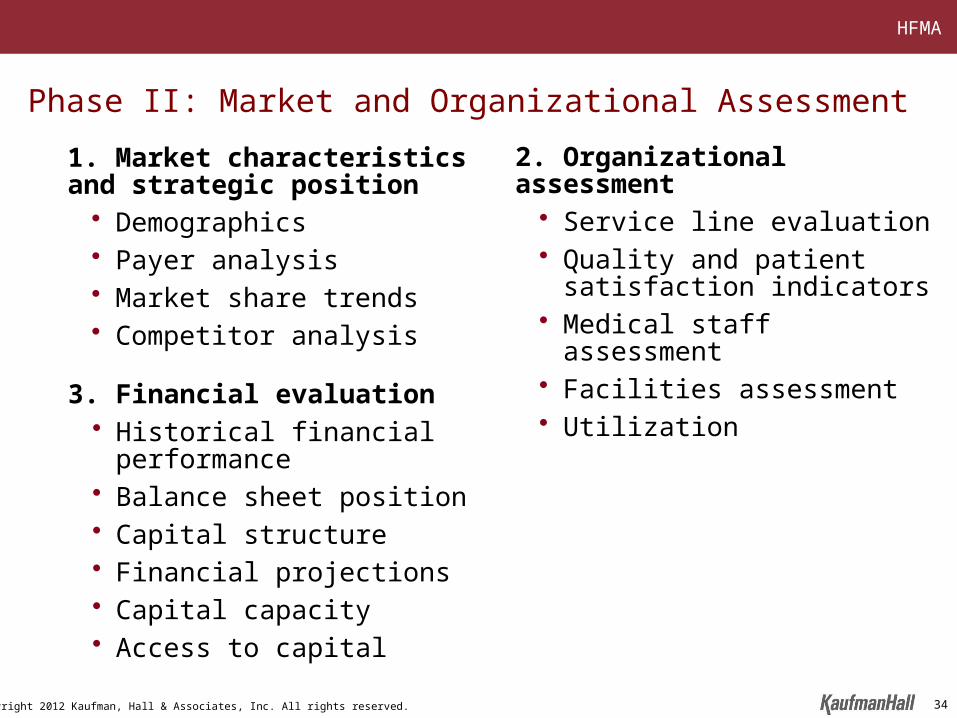
1. Market characteristicsand strategic position
• Demographics• Payer analysis• Market share trends• Competitor analysis
3. Financial evaluation• Historical financial performance• Balance sheet position• Capital structure• Financial projections• Capital capacity • Access to capital
Phase II: Market and Organizational Assessment
2. Organizational assessment• Service line evaluation• Quality and patient satisfaction
indicators• Medical staff assessment• Facilities assessment• Utilization
34

HFMA
Copyright 2012 Kaufman, Hall & Associates, Inc. All rights reserved.
Memorial’s Region Is Projected to See No Population Growth
2011 Population Concentration by ZIP Code
2011-2016 Population Change by ZIP Code
Source: Claritas
Hospital 1
Regional 2
Regional 1
AMC
Hospital 2
Hospital 3
Hospital 4
Hospital 5
H Memorial
Population 2011-2016 Change 65+ Population
2011-2016 Change
Service Area 2011 Absolute CAGR 2011 Absolute CAGR
Home County 100,000 -2,000 -2.00% 20,000 1,200 6.00%
Secondary County 1 39,000 -700 -1.79% 7,000 600 8.57%
Secondary County 2 20,000 100 0.50% 4,000 500 12.50%
Tertiary County 3 13,800 -200 -1.45% 2,000 300 15.00%
Total Service Area 172,800 -2,800 -1.62% 33,000 2,600 7.88%
Images intentionally blurred
35

HFMA
Copyright 2012 Kaufman, Hall & Associates, Inc. All rights reserved.
Just Over Half the County Population Is Government Pay and/or Uninsured
0%
20%
40%
60%
80%
100%
Total Employer HMO/PPO Medicaid Medicare Uninsured
County Market Lives Summary by Major Payer
45KEst.
5,000
172K
10,000
5,000
Note: Arrow reflects expected change in covered lives associated with reform legislation, population and market dynamics, etc.Source: HealthLeaders Interstudy.
Approx. County
Service Area Population
14,000
10,000
36
HFMA
Copyright 2012 Kaufman, Hall & Associates, Inc. All rights reserved.
55%
71% 72%
26%
55%48%
71%
34%
16% 21%
57%
13%
13% 6%
28%
23%28%
8%
14%
21% 14%
12%3%
3%3%
10%
4% 5%
26%
29%
6%16%
13%
5%3%
6%
9%15%
5%
6%
7% 7%
13%
8%12% 10% 8%
3%
5%
5% 3%14%
8% 5% 6% 4% 7% 9%
54%
11%
0%
25%
50%
75%
100%
CV Services Digestive Gen. Med. Gen. Surg. Hem/Onc Neurosciences OB/GYN Ortho. Spine/Back Other Total
Other Hospital 3 Hospital 2 AMC Regional 2 Hospital Regional Memorial
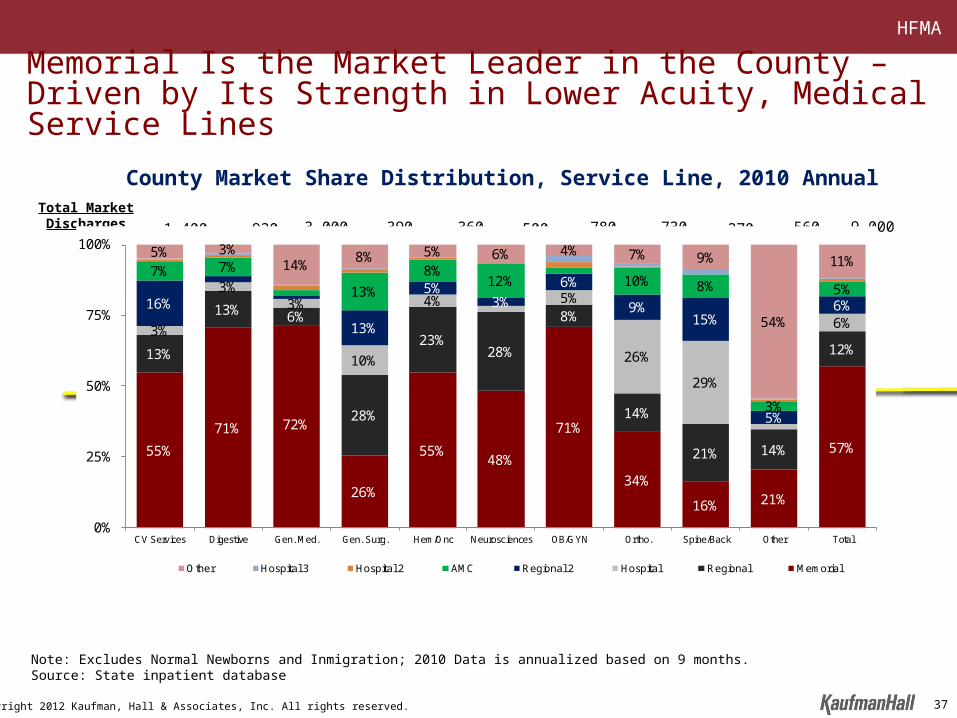
Memorial Is the Market Leader in the County – Driven by Its Strength in Lower Acuity, Medical Service Lines
Total Market Discharges 1,400
Note: Excludes Normal Newborns and Inmigration; 2010 Data is annualized based on 9 months.Source: State inpatient database
County Market Share Distribution, Service Line, 2010 Annual
930 3,000 390 360 500 780 730 270 560 9,000
37
HFMA
Copyright 2012 Kaufman, Hall & Associates, Inc. All rights reserved.
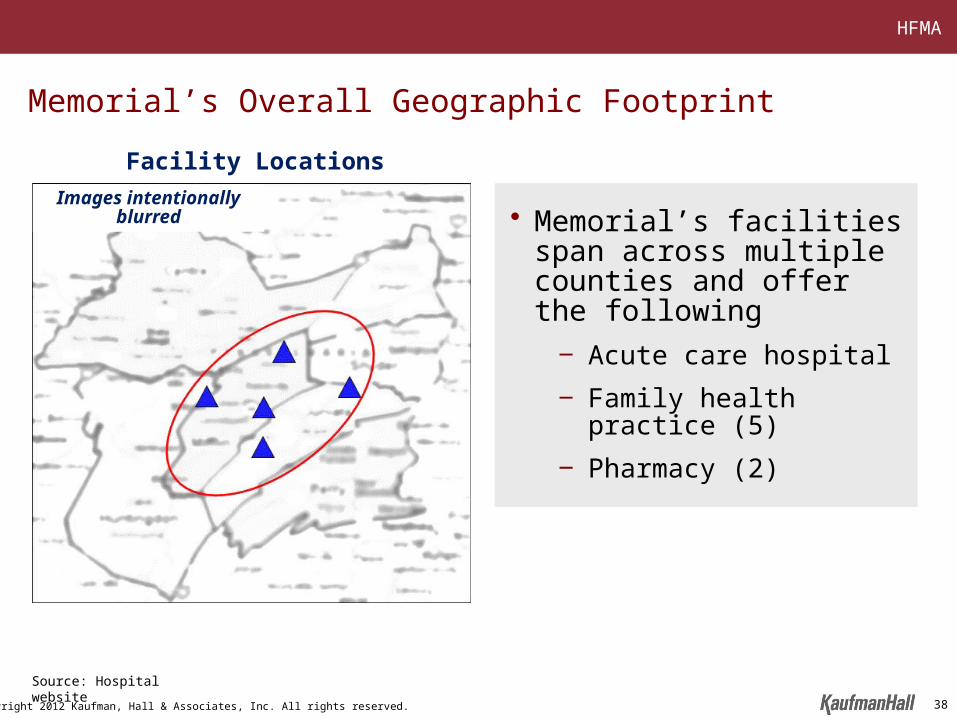
Source: Hospital website
• Memorial’s facilities span across multiple counties and offer the following
‒ Acute care hospital
‒ Family health practice (5)
‒ Pharmacy (2)
Facility Locations
Memorial’s Overall Geographic Footprint
Images intentionally blurred
38
HFMA
Copyright 2012 Kaufman, Hall & Associates, Inc. All rights reserved.
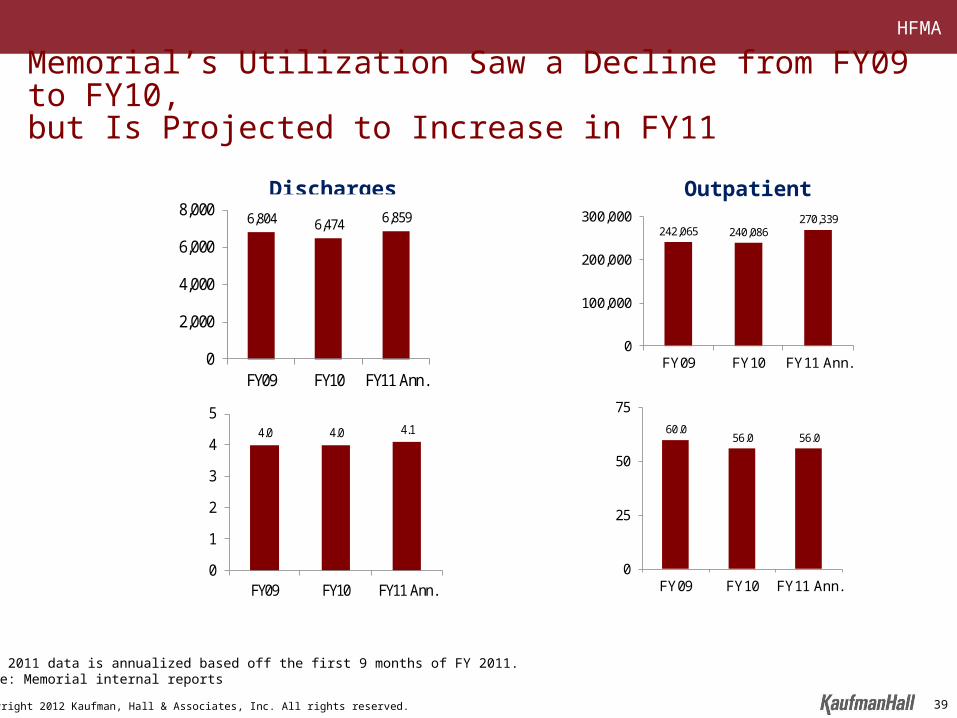
6,804 6,474 6,859
0
2,000
4,000
6,000
8,000
FY09 FY10 FY11 Ann.
Discharges
242,065 240,086270,339
0
100,000
200,000
300,000
FY09 FY10 FY11 Ann.
Outpatient Visits
4.0 4.0 4.1
0
1
2
3
4
5
FY09 FY10 FY11 Ann.
ALOS60.0
56.0 56.0
0
25
50
75
FY09 FY10 FY11 Ann.
ADC
Memorial’s Utilization Saw a Decline from FY09 to FY10, but Is Projected to Increase in FY11
Note: 2011 data is annualized based off the first 9 months of FY 2011.Source: Memorial internal reports
39
HFMA
Copyright 2012 Kaufman, Hall & Associates, Inc. All rights reserved.
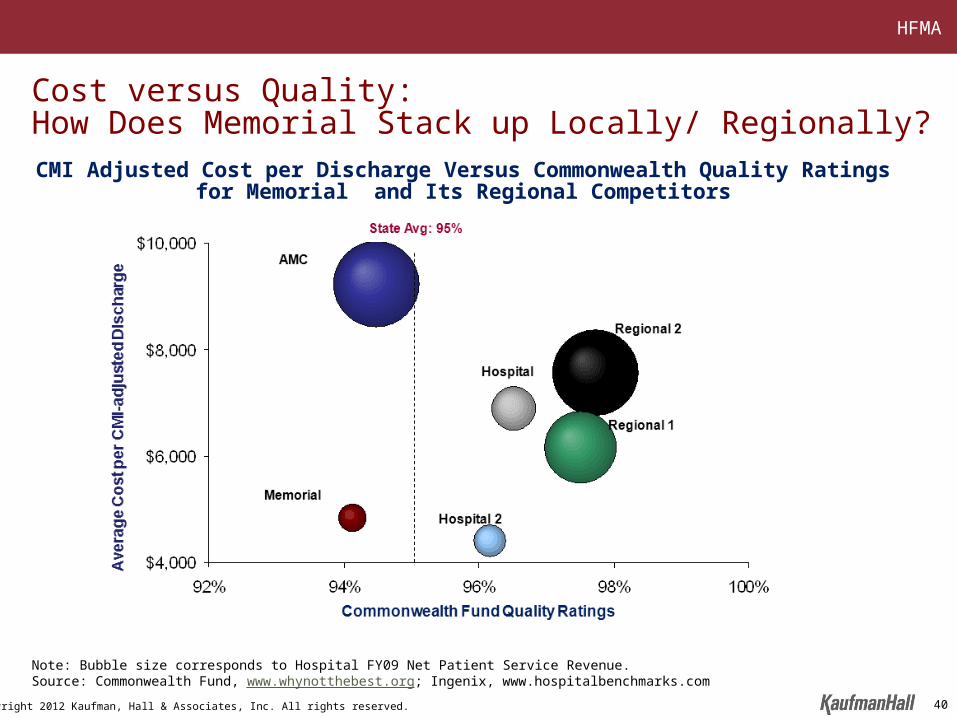
Cost versus Quality: How Does Memorial Stack up Locally/ Regionally?
Note: Bubble size corresponds to Hospital FY09 Net Patient Service Revenue. Source: Commonwealth Fund, www.whynotthebest.org; Ingenix, www.hospitalbenchmarks.com
CMI Adjusted Cost per Discharge Versus Commonwealth Quality Ratings for Memorial and Its Regional Competitors
40
HFMA
Copyright 2012 Kaufman, Hall & Associates, Inc. All rights reserved.
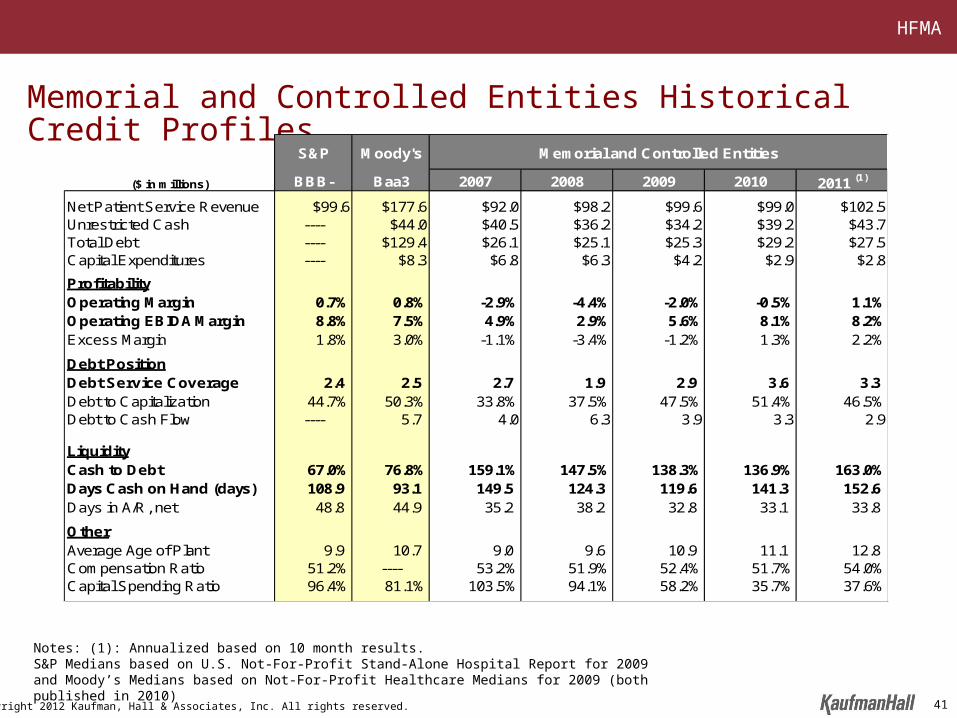
Memorial and Controlled Entities Historical Credit Profiles
S&P Moody's
($ in millions) BBB- Baa3 2007 2008 2009 2010 2011 (1)
Net Patient Service Revenue $99.6 $177.6 $92.0 $98.2 $99.6 $99.0 $102.5Unrestricted Cash ---- $44.0 $40.5 $36.2 $34.2 $39.2 $43.7Total Debt ---- $129.4 $26.1 $25.1 $25.3 $29.2 $27.5Capital Expenditures ---- $8.3 $6.8 $6.3 $4.2 $2.9 $2.8
ProfitabilityOperating Margin 0.7% 0.8% -2.9% -4.4% -2.0% -0.5% 1.1%Operating EBIDA Margin 8.8% 7.5% 4.9% 2.9% 5.6% 8.1% 8.2%Excess Margin 1.8% 3.0% -1.1% -3.4% -1.2% 1.3% 2.2%
Debt PositionDebt Service Coverage 2.4 2.5 2.7 1.9 2.9 3.6 3.3 Debt to Capitalization 44.7% 50.3% 33.8% 37.5% 47.5% 51.4% 46.5%Debt to Cash Flow ---- 5.7 4.0 6.3 3.9 3.3 2.9
LiquidityCash to Debt 67.0% 76.8% 159.1% 147.5% 138.3% 136.9% 163.0%Days Cash on Hand (days) 108.9 93.1 149.5 124.3 119.6 141.3 152.6 Days in A/R, net 48.8 44.9 35.2 38.2 32.8 33.1 33.8
OtherAverage Age of Plant 9.9 10.7 9.0 9.6 10.9 11.1 12.8Compensation Ratio 51.2% ---- 53.2% 51.9% 52.4% 51.7% 54.0%Capital Spending Ratio 96.4% 81.1% 103.5% 94.1% 58.2% 35.7% 37.6%
Memorial and Controlled Entities
Notes: (1): Annualized based on 10 month results.S&P Medians based on U.S. Not-For-Profit Stand-Alone Hospital Report for 2009 and Moody’s Medians based on Not-For-Profit Healthcare Medians for 2009 (both published in 2010)
41

HFMA
Copyright 2012 Kaufman, Hall & Associates, Inc. All rights reserved.
Phase III: Scenarios, Sensitivities, and Assessment of Independent Plan
42
HFMA
Copyright 2012 Kaufman, Hall & Associates, Inc. All rights reserved.
Organizational Competencies
43
HFMA
Copyright 2012 Kaufman, Hall & Associates, Inc. All rights reserved.
Facility Plan
• Memorial developed a master facility plan approximately four years ago
• The master facility plan contemplated a new state-of-the-art patient tower with all private rooms
• The estimated cost of the tower and other necessary renovation was approximately $100 million
• More recently, an alternative plan for renovating the current facilities, including the conversion to all private rooms, was developed with an overall cost of $34.5 million
44
HFMA
Copyright 2012 Kaufman, Hall & Associates, Inc. All rights reserved.
S& P BBB+
S& P BBB-
2013 2014 2015 2016 20172017 Change
from Baseline
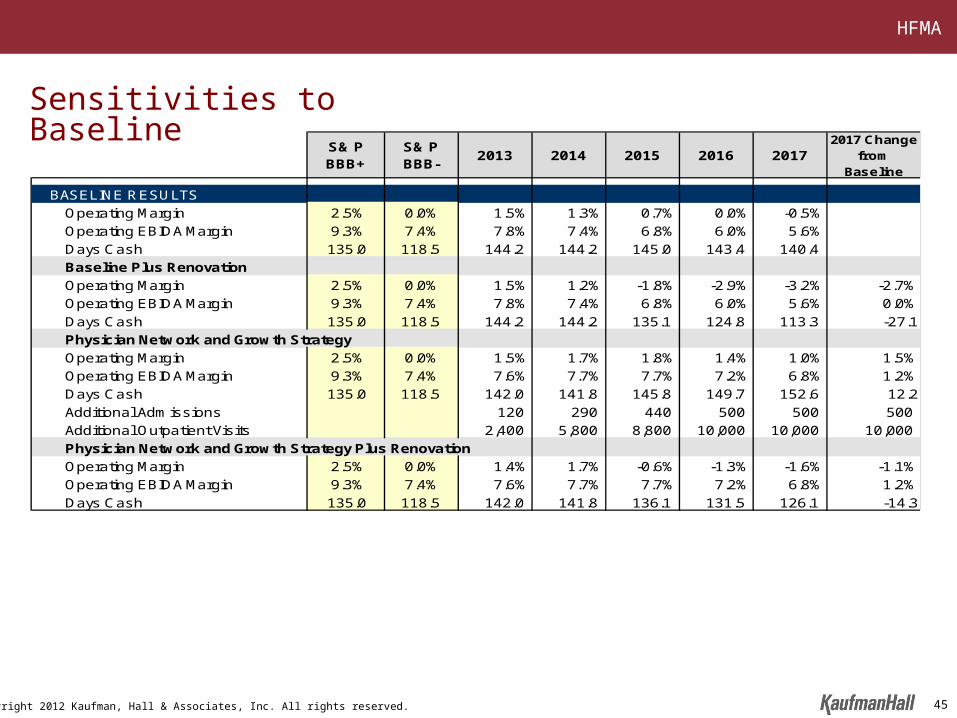
BASELINE RESULTS
Operating Margin 2.5% 0.0% 1.5% 1.3% 0.7% 0.0% -0.5%
Operating EBIDA Margin 9.3% 7.4% 7.8% 7.4% 6.8% 6.0% 5.6%
Days Cash 135.0 118.5 144.2 144.2 145.0 143.4 140.4
Baseline Plus Renovation
Operating Margin 2.5% 0.0% 1.5% 1.2% -1.8% -2.9% -3.2% -2.7%
Operating EBIDA Margin 9.3% 7.4% 7.8% 7.4% 6.8% 6.0% 5.6% 0.0%
Days Cash 135.0 118.5 144.2 144.2 135.1 124.8 113.3 -27.1
Physician Network and Growth Strategy
Operating Margin 2.5% 0.0% 1.5% 1.7% 1.8% 1.4% 1.0% 1.5%
Operating EBIDA Margin 9.3% 7.4% 7.6% 7.7% 7.7% 7.2% 6.8% 1.2%
Days Cash 135.0 118.5 142.0 141.8 145.8 149.7 152.6 12.2
Additional Admissions 120 290 440 500 500 500
Additional Outpatient Visits 2,400 5,800 8,800 10,000 10,000 10,000
Physician Network and Growth Strategy Plus Renovation
Operating Margin 2.5% 0.0% 1.4% 1.7% -0.6% -1.3% -1.6% -1.1%
Operating EBIDA Margin 9.3% 7.4% 7.6% 7.7% 7.7% 7.2% 6.8% 1.2%
Days Cash 135.0 118.5 142.0 141.8 136.1 131.5 126.1 -14.3
Sensitivities to Baseline
45
HFMA
Copyright 2012 Kaufman, Hall & Associates, Inc. All rights reserved.
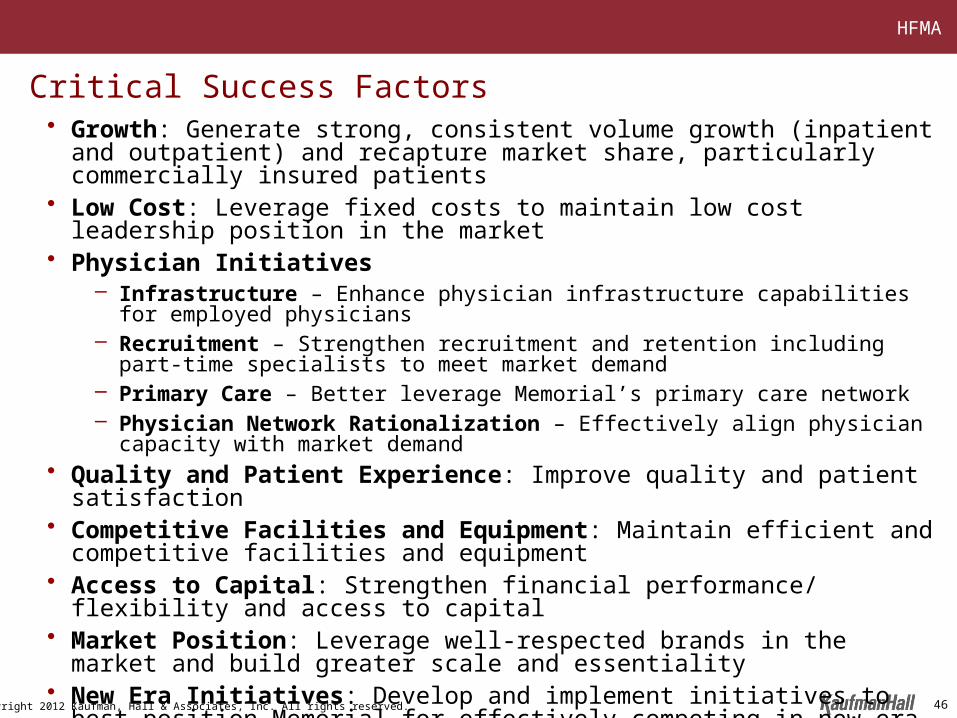
Critical Success Factors• Growth: Generate strong, consistent volume growth (inpatient and outpatient) and
recapture market share, particularly commercially insured patients• Low Cost: Leverage fixed costs to maintain low cost leadership position in the
market• Physician Initiatives
– Infrastructure – Enhance physician infrastructure capabilities for employed physicians– Recruitment – Strengthen recruitment and retention including part-time specialists to
meet market demand– Primary Care – Better leverage Memorial’s primary care network – Physician Network Rationalization – Effectively align physician capacity with market
demand • Quality and Patient Experience: Improve quality and patient satisfaction• Competitive Facilities and Equipment: Maintain efficient and competitive
facilities and equipment• Access to Capital: Strengthen financial performance/ flexibility and access to
capital• Market Position: Leverage well-respected brands in the market and build greater
scale and essentiality• New Era Initiatives: Develop and implement initiatives to best position Memorial
for effectively competing in new era (e.g., care management initiatives, IT, clinical integration)
46

HFMA
Copyright 2012 Kaufman, Hall & Associates, Inc. All rights reserved.
Phase IV: Evaluation of Strategic Options
47

HFMA
Copyright 2012 Kaufman, Hall & Associates, Inc. All rights reserved.
Partnership Structures
Merger Consolidation Sale/Acquisition
Change of Corporate Member
Sale of Controlling
Interest
Joint Operating Agreement
Sale of Minority Interest
Affiliation Management Services
Agreement
Joint Venture
Joint Venture
Low High
Degree of Integration
Fully IntegratedLess Than Fully Integrated
48
HFMA
Copyright 2012 Kaufman, Hall & Associates, Inc. All rights reserved.
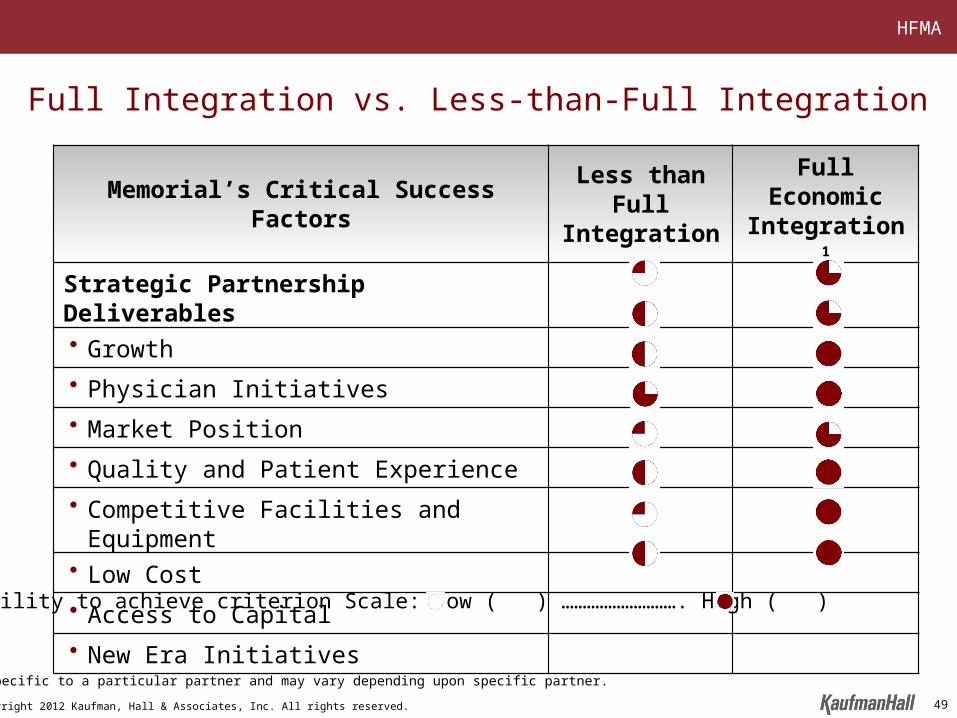
Ability to achieve criterion Scale: Low ( ) ………………………. High ( )
Memorial’s Critical Success Factors Less than Full Integration
Full Economic Integration 1
Strategic Partnership Deliverables
• Growth
• Physician Initiatives
• Market Position
• Quality and Patient Experience
• Competitive Facilities and Equipment
• Low Cost
• Access to Capital
• New Era Initiatives
Full Integration vs. Less-than-Full Integration
1 Not specific to a particular partner and may vary depending upon specific partner.
49
HFMA
Copyright 2012 Kaufman, Hall & Associates, Inc. All rights reserved.
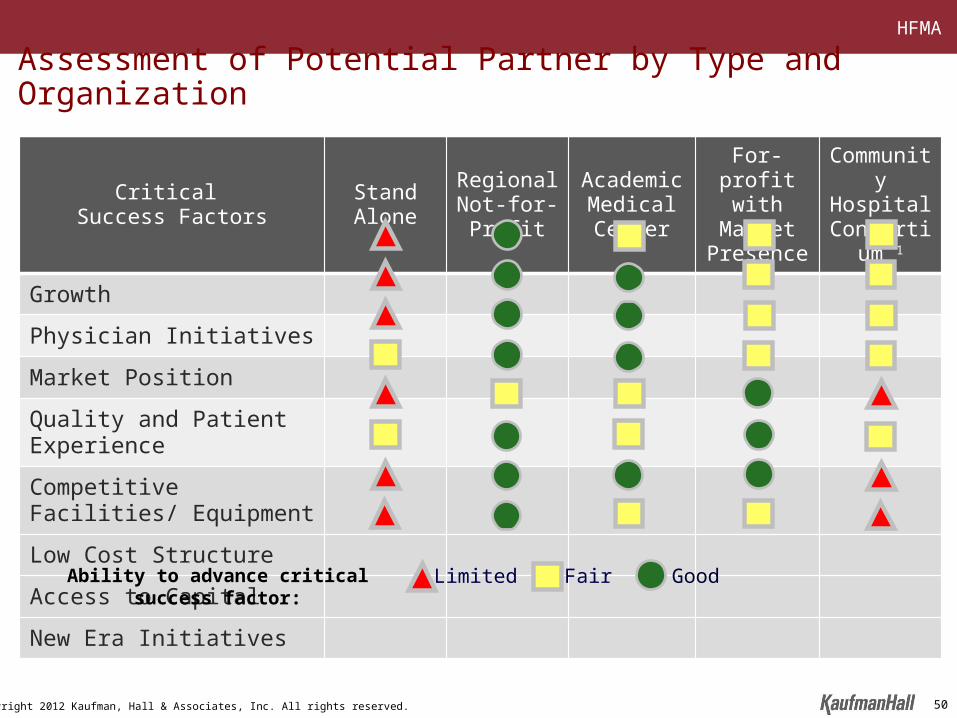
Assessment of Potential Partner by Type and Organization
Critical Success Factors Stand Alone Regional
Not-for-ProfitAcademic Medical Center
For-profit with Market Presence
Community Hospital
Consortium 1
Growth
Physician Initiatives
Market Position
Quality and Patient Experience
Competitive Facilities/ Equipment
Low Cost Structure
Access to Capital
New Era Initiatives
Limited Fair GoodAbility to advance critical success factor:
50

HFMA
Copyright 2012 Kaufman, Hall & Associates, Inc. All rights reserved.
Critical Questions in Partnership Evaluation
51

HFMA
Copyright 2012 Kaufman, Hall & Associates, Inc. All rights reserved.
Critical Questions in Partnership Evaluation• Who will be a strong partner?
– Service line strength– Physician infrastructure– Quality– Brand– Market position and presence– Corporate infrastructure– Financial capability– Information technology– Historical relationship– History of successful partnerships– Intellectual capital to support evolving healthcare environment
• What are the implications of operating as part of the System?– Cultural compatibility– Corporate and shared services – Charges for corporate services and overhead– Capital allocation process– Senior management and management reporting relationships– Impact on employees– Impact on physicians– Governance
• How does the proposal respond to the partnership goals and objectives?– Commitment to achieving the established goals and objectives– Valuation (if appropriate)– Transaction structure and implications
• Does a partnership enhance the likelihood of achieving the Organization’s long-term objectives relative to remaining independent?
52

HFMA
Copyright 2012 Kaufman, Hall & Associates, Inc. All rights reserved.
THANK YOU
Q&A
53