hhe report no. heta-2000-0401-2991, gilster-mary … · gilster-mary lee corporation jasper,...
TRANSCRIPT

NIOSH HEALTH HAZARD EVALUATION REPORT HETA # 2000-0401-2991 Gilster-Mary Lee Corporation Jasper, Missouri January 2006 DEPARTMENT OF HEALTH AND HUMAN SERVICES
Centers for Disease Control and Prevention National Institute for Occupational Safety and Health

ii
PREFACE The Respiratory Disease Hazard Evaluation and Technical Assistance Program (RDHETAP) of the National Institute for Occupational Safety and Health (NIOSH) conducts field investigations of possible health hazards in the workplace. These investigations are conducted under the authority of Section 20(a)(6) of the Occupational Safety and Health (OSH) Act of 1970, 29 U.S.C. 669(a)(6), or Section 501(a)(11) of the Federal Mine Safety and Health Act of 1977, 30 U.S.C. 951(a)(11), which authorizes the Secretary of Health and Human Services, following a written request from any employers or authorized representative of employees, to determine whether any substance normally found in the place of employment has potentially toxic effects in such concentrations as used or found. RDHETAP also provides, upon request, technical and consultative assistance to federal, state, and local agencies; labor; industry; and other groups or individuals to control occupational health hazards and to prevent related trauma and disease. Mention of company names or products does not constitute endorsement by NIOSH.
ACKNOWLEDGMENTS AND AVAILABILITY OF REPORT This report was prepared by Richard Kanwal, Greg Kullman, Kathleen Fedan, and Kathleen Kreiss of the RDHETAP, Division of Respiratory Disease Studies (DRDS). Field assistance was provided by Diana Freeland, Jim Taylor, David Spainhour, Kimberly Jo Stemple, Brian Tift, Amber Harton, Terry Rooney, Muge Akpinar-Elci, Omur Cinar Elci, Kenneth Hilsbos, Chris Piacitelli, Randy Boylstein, Thomas Jefferson, and Marty Pflock. Statistical programming was provided by Nicole Edwards and Denise Gaughan. Analytical support was provided by NIOSH Division of Applied Research and Technology and DataChem, Inc. Desktop publishing was performed by Terry Rooney and Amber Harton. Copies of this report have been sent to employee and management representatives at the Gilster-Mary Lee Corporation, the Missouri Department of Health and Senior Services, and the OSHA Regional Office. This report is not copyrighted and may be freely reproduced. The report may be viewed and printed from the following internet address: http://www.cdc.gov/niosh/hhe. Single copies of this report will be available for a period of three years from the date of this report. To expedite your request, include a self-addressed mailing label along with your written request to:
NIOSH Publications Office 4676 Columbia Parkway Cincinnati, Ohio 45226
800-356-4674 After this time, copies may be purchased from the National Technical Information Service (NTIS) at 5825 Port Royal Road, Springfield, Virginia 22161. Information regarding the NTIS stock number may be obtained from the NIOSH Publications Office at the Cincinnati address.
For the purpose of informing affected employees, copies of this report shall be posted by the employer in a prominent place accessible to the employees for a period of 30 calendar days.

iii
HIGHLIGHTS OF THE NIOSH HEALTH HAZARD EVALUATION AT GILSTER-MARY LEE CORPORATION, JASPER, MISSOURI, JANUARY 2006
In August 2000, the Missouri Department of Health and Senior Services requested technical assistance from the National Institute for Occupational Safety and Health (NIOSH) in an investigation of severe obstructive lung disease (bronchiolitis obliterans) in former workers of the Gilster-Mary Lee plant in Jasper, Missouri. A NIOSH medical and environmental survey at the plant in November 2000 revealed evidence of risk to current workers from inhalation exposure to butter flavoring chemicals in microwave popcorn production. NIOSH performed follow-up surveys every four to six months through August 2003 to see if workers were protected after exposures to butter flavoring chemicals were controlled. The following are key points from NIOSH’s close-out report for this investigation.
What NIOSH Did • Lung function tests and air sampling in
November 2000 and every four to six months through August 2003.
What NIOSH Found • In November 2000, the number of current
workers with airways obstruction was 3.3 times higher than expected.
• Airways obstruction was seen more often in workers who had greater past exposure to butter flavoring chemicals.
• The amounts of butter flavoring chemicals in the plant air were much lower in July 2003 compared to November 2000.
• Isolation of the oil and flavoring mixing process and all tanks that contain oil and flavoring has likely eliminated the risk to packaging-area workers.
• Quality control laboratory workers are also probably at low risk now due to improved ventilation.
• Mixing room workers could still be at risk for lung disease from open handling of butter flavorings or checking tank contents.
What Managers Can Do • Re-engineer the oil and butter flavoring
mixing process to a closed system so that workers do not handle open containers of butter flavoring or lift tank lids to add flavoring or check on tank contents.
• Maintain negative air pressure in the mezzanine and mixing room.
• Maintain proper operation of all ventilation systems.
• Educate workers on the hazards of exposure to butter flavoring chemicals and how to minimize exposures.
• Require appropriate respirators for all workers who enter the mixing room or the mezzanine.
• Perform spirometry tests every 4-6 months on all workers who work in the QC laboratory or who enter the mixing room or mezzanine. Workers should be tested before they are allowed to work in these areas.
• Provide eye and skin protection for all workers who enter the mixing room or mezzanine.
What Employees Can Do • Minimize your exposure to flavoring
chemicals at work. • Use your respirator at all times when you are
in the mixing room or mezzanine. • Participate in company-scheduled breathing
tests. Ask if your lung function is stable or declining.
• Take this report to your doctor if you develop persistent cough or trouble breathing. Also let your supervisor know.
What To Do For More Information: We encourage you to read the full report. If you would like a copy, either ask your health and safety representative to
make you a copy or call 1-513-841-4252 and ask for HETA Report #2000-0401-2991

iv
Health Hazard Evaluation Report 2000-0401-2991 Gilster-Mary Lee Corporation
Jasper, Missouri January 2006
Richard Kanwal, M.D., M.P.H. Greg Kullman, Ph.D., C.I.H.
Kathleen Fedan, B.S. Kathleen Kreiss, M.D.
SUMMARY In August 2000, the Missouri Department of Health and Senior Services requested technical assistance from the National Institute for Occupational Safety and Health (NIOSH) in an investigation of severe obstructive lung disease (bronchiolitis obliterans) in former workers of the Gilster-Mary Lee popcorn plant in Jasper, Missouri. Affected workers had worked in the room where butter flavoring was mixed into heated soybean oil (mixing room) and in the adjacent microwave popcorn packaging-area. A NIOSH medical and environmental survey at the plant in November 2000 showed that plant employees had 3.3 times the rate of obstruction on NIOSH spirometry tests compared to national rates; the prevalence of obstruction in never-smokers was 10.8 times the national rate. Nineteen of 21 workers with obstruction had fixed obstruction (unresponsive to bronchodilators), and most chest x-rays and diffusing capacity tests were normal. These findings are consistent with constrictive bronchiolitis obliterans. Five of six quality control (QC) workers who repeatedly popped bags of product in microwave ovens (approximately 100 bags per worker per work shift) in a poorly ventilated room were found to have obstruction on spirometry. A strong exposure-response relationship was demonstrated between quartiles of estimated cumulative exposure to diacetyl (a volatile butter flavoring chemical contaminating the air in the plant) and the frequency of airways obstruction on spirometry tests. NIOSH investigators provided air-purifying respirators that filtered both vapors and particulates for mixers and assisted with employee training in respiratory protection. In January 2001, NIOSH investigators conducted a detailed engineering control assessment and provided exposure control recommendations. NIOSH performed seven additional cross-sectional medical and environmental surveys from April 2001 through August 2003 to determine if controls were effective in reducing exposures and protecting workers. Follow-up Environmental Findings: As a result of the implementation of exposure controls from January 2001 through May 2003, average diacetyl air concentrations declined two orders of magnitude in the mixing room (from 38 ppm to 0.46 ppm) and the QC laboratory (from 0.54 to 0.002 ppm), and three orders of magnitude in the packaging area (from 1.69 ppm to 0.002 ppm for machine operators). Follow-up Medical Survey Findings: A total of 373 current workers participated in one or more NIOSH surveys. Participation by current workers at each survey ranged from 71% to 91%. One hundred eighty-six of the 373 total participants participated in more than one survey (50%). However, participation in more than one survey was much greater for workers hired prior to the first NIOSH survey (Cohort-1; 100 of 146 participants, 68%) than for workers hired after the first NIOSH survey (Cohort-2; 86 of 227 participants, 38%). From the first to last survey, there was a statistically significant decline in the prevalence of eye, nose, and throat irritation in Cohort-1 participants but no significant changes in the

v
prevalences of other symptoms or spirometry abnormalities, or in mean percent predicted FEV1. Cohort-2 participants had lower prevalences of symptoms and spirometry abnormalities, and a higher mean percent predicted FEV1, compared to Cohort-1 participants at their first survey. There were no statistically significant changes in these outcomes over time for Cohort-2 participants. Of the 88 Cohort-1 participants who participated in three or more NIOSH medical surveys, 19 (22%) had FEV1 declines of greater than 300 ml and/or 10% from their first to their last spirometry test, compared to 3 of 41 (7%) Cohort-2 participants who participated in three or more surveys. Four of nine participants who worked as mixers after the 1st NIOSH survey had FEV1 declines of greater than 300 ml and/or 10% of baseline, including one mixer who declined more than 1300 ml in nine months while working as a mixer. The total FEV1 decline in this mixer was 2800 ml over 2.75 years, which included a 1500 ml decline over two years after stopping work as a mixer.
The NIOSH investigation at the Gilster-Mary Lee microwave popcorn plant in Jasper, Missouri, determined that inhalation exposure to butter flavoring chemicals is a risk for occupational lung disease. With the exposure controls implemented to date, workers in the microwave popcorn packaging area should now be at minimal risk as long as isolation of the mixing room and mezzanine is maintained and all ventilation systems are operational. The exposure controls implemented in the QC laboratory have likely minimized the risk to workers in this area as well. However, QC laboratory workers should have regularly scheduled spirometry to assure that their lung function remains stable. Mixers are still at potential risk from open handling of butter flavorings and from tank emissions. Use of appropriate respiratory protection by mixers and other workers who enter the mixing room and mezzanine area is a short-term solution to this problem. Re-engineering the oil and butter flavoring mixing process to a closed system (so that mixers do not have to handle open containers of flavoring and no longer have to open tanks that contain heated oil and/or butter flavoring) is recommended to eliminate this risk. Until a closed process is implemented, all workers who enter the mixing room or mezzanine should use appropriate respiratory protection when in those locations and should have regularly scheduled spirometry to identify early declines in lung function that may be due to exposures to butter flavoring chemicals.
Keywords: NAICS Code 31199 (all other food manufacturing), airways obstruction, bronchiolitis obliterans, popcorn, butter flavoring, diacetyl

Table of Contents Preface..........................................................................................................................................................ii Acknowledgments and Availability of Report..........................................................................................ii Highlights of the NIOSH Health Hazard Evaluation .............................................................................iii Summary..................................................................................................................................................... iv Introduction................................................................................................................................................. 1 Background ................................................................................................................................................. 1 Methods........................................................................................................................................................ 2 Results .......................................................................................................................................................... 4 Discussion .................................................................................................................................................. 11 Conclusions................................................................................................................................................ 14 Recommendations ..................................................................................................................................... 15 References.................................................................................................................................................. 16
Tables and Figures ......................................................................................................................... 18 Appendices................................................................................................................................................. 37
Appendix A.................................................................................................................................... 37 Appendix B .................................................................................................................................... 39 Appendix C .................................................................................................................................... 57 Appendix D.................................................................................................................................. 101 Appendix E .................................................................................................................................. 105 Appendix F .................................................................................................................................. 107 Appendix G.................................................................................................................................. 111 Appendix H.................................................................................................................................. 117 Appendix I ................................................................................................................................... 121 Appendix J ................................................................................................................................... 131 Appendix K.................................................................................................................................. 141 Appendix L .................................................................................................................................. 153
Evaluation Criteria ................................................................................................................................. 166

Health Hazard Evaluation Report No. 2000-0401-2991 Page 1
INTRODUCTION In August 2000, the National Institute for Occupational Safety and Health (NIOSH) received a request for technical assistance from the Missouri Department of Health and Senior Services to investigate the occurrence of severe lung disease in workers of the Gilster-Mary Lee popcorn plant in Jasper, Missouri. This final report presents the findings and recommendations based on all medical and environmental surveys performed by NIOSH at this plant from August 2000 through August 2003 and will serve to closeout this evaluation.
BACKGROUND In May 2000, the Missouri Department of Health and Senior Services was informed by an occupational medicine physician that nine former workers of the Gilster-Mary Lee popcorn plant in Jasper, Missouri, had fixed obstructive lung disease consistent with bronchiolitis obliterans. Four of these individuals had been placed on lung transplant waiting lists by their physicians. The workers had developed progressive shortness of breath on exertion, chronic cough, and wheezing, with symptom onsets from 1993 through 2000, several months to several years after starting work at the plant. In bronchiolitis obliterans, inflammation and scarring occurs in the small airways of the lung and can lead to severe, permanent shortness of breath.1 The main respiratory symptoms are cough and shortness of breath on exertion that typically do not improve much when the worker goes home at the end of the workday or on weekends or vacations. Usually symptoms are gradual in onset and progressive, but severe symptoms can occur suddenly. Most cases do not respond to medical treatment. Lung function testing with spirometry generally reveals fixed airways obstruction, and some workers develop obstruction before they become symptomatic. The disease has many known causes such as inhalation of certain chemicals, certain bacterial and viral infections, organ transplantation, and reactions to certain medications.2 Known causes
of bronchiolitis obliterans due to occupational or other environmental exposures include gases such as nitrogen oxides (e.g., silo gas), sulfur dioxide, chlorine, ammonia, phosgene, and other irritant gases.1 After receiving a request for technical assistance from The Missouri Department of Health and Senior Services in August 2000, NIOSH began its investigation of the occurrence of this rare and severe form of lung disease in an occupational setting not previously associated with such risk. Production Process and Controls in August 2000: For the production of microwave popcorn, one worker per work shift (i.e., mixer) prepared the oil/flavoring mixture in the mixing room (approximately 350 square feet in size). This room contained one large heated mixing tank (approximate capacity 500 gallons) which the mixer filled with heated soybean oil from a larger tank located in an adjacent room. Also within the mixing room were two smaller heated tanks (approximate capacity 110 gallons) which contained liquid butter flavorings. The mixer dispensed the flavorings from the smaller tanks into open five-gallon buckets and then poured the flavorings into the heated soybean oil in the mixing tank. A powdered butter flavoring was sometimes used and was measured and poured into the mixing tank with open containers. Colorings were added to the oil mixture in the mixing tank, and micro-fine salt was added at a salt dump station which augered the salt into a slurry tank (containing heated soybean oil) and then into the mixing tank. The oil and flavoring mixture was then transferred via pipes to heated holding tanks located on a mezzanine in the packaging area. All tanks in the mixing room and the mezzanine had loose-fitting lids. The holding tanks supplied the oil and flavoring mixture to the packaging machines on the packaging lines where it was combined with kernel popcorn in microwaveable bags. Workers on the packaging lines operated the packaging machines and facilitated the placement of the finished product into cartons and boxes. Aside from local exhaust ventilation when the salt dump station was in operation, the mixing room had no other local exhaust or general dilution ventilation. The door between the mixing room and the packaging area was

Page 2 Health Hazard Evaluation Report No. 2000-0401-2991
usually kept open. Axial wall fans in the packaging area provided ventilation during warm weather but were not used during cold weather. The size of the workforce ranged from approximately 135 to 165 workers depending on production needs. Approximately three quarters of the workforce worked in the microwave popcorn production area of the plant. Other employees worked in the office, warehouse, outside receiving areas, and in plain kernel packaging (popcorn packaged in polyethylene bags without oil or flavorings). NIOSH investigators provided preliminary control recommendations to the Gilster-Mary Lee Corporation based on observations made during visits to the plant in August and September 2000 (Appendix A). NIOSH investigators then performed a detailed cross-sectional medical and environmental survey at the plant in November 2000 to identify potential risk factors for occupational lung disease. Based on the results of the November 2000 survey, NIOSH investigators provided additional recommendations and assistance to the company (see results section), and performed seven additional follow-up cross-sectional medical and environmental surveys between April 2001 and August 2003.
METHODS Environmental Surveys Industrial hygiene sampling was performed to measure contaminants generated by the production of popcorn and microwave popcorn. Samples were collected and process observations were made during eleven plant visits:
1. Preliminary walk-through survey (August 2000)
2. Qualitative environmental survey (September 2000)
3. Cross-sectional environmental survey (November 2000)
4. Engineering control technology survey (January 2001)
5. Follow-up surveys (April 2001, September 2001, November 2001, March 2002, August 2002, January 2003, and July 2003)
Air samples were collected for total and respirable dusts, particle size distributions, volatile organic compounds, total hydrocarbons, ketones (diacetyl, acetoin, and 2-nonanone), acetic and butyric acids, and acetaldehyde. 3,4,5,6,7 Full-shift, time-weighted average (TWA) area samples were collected; personal samples were also collected for the diacetyl, acetoin, and 2-nonanone and, on one survey, for respirable dusts. For some analytes, partial-shift, and grab samples were also taken to assess peak or other concentration intervals. This included short-term indicator tube air samples collected for ammonia, acetic acid, formaldehyde, hydrochloric acid, nitrogen dioxide, and oxides of nitrogen. The industrial hygiene sampling methods used during these surveys are listed in Table 1. Real-time diacetyl measurements were also taken using a fourier transform infrared (FTIR) gas analyzer [Gasmet DX-4010, Temet Instruments Oy, Helsinki, Finland]. Sampling results that were below detectable limits were assigned a value of one-half of the minimum detectable concentration in air for statistical analyses. Medical Surveys All current workers were invited to participate at each survey. After obtaining signed, informed consent from participants, NIOSH interviewers administered a standardized questionnaire to collect information on symptoms, medical diagnoses, smoking history, work history, and work-related exposures. This questionnaire included questions from the American Thoracic Society (ATS) standardized respiratory symptom questionnaire and the 3rd National Health and Nutrition Examination Survey (NHANES III),8,9 supplemented with questions about respiratory, mucous-membrane, and skin symptoms (Appendix B). At each survey, NIOSH technicians performed spirometry tests using a dry rolling-seal spirometer interfaced to a personal computer and

Health Hazard Evaluation Report No. 2000-0401-2991 Page 3
following ATS guidelines,10 with results compared to spirometry reference values generated from NHANES III.11 Each participating worker’s largest forced vital capacity (FVC) and forced expiratory volume in the first second of exhalation (FEV1) were selected for analysis. Obstruction was defined as an FEV1/FVC ratio and FEV1 below the lower limits of normal. Restriction was defined as an FVC below the lower limit of normal with a normal FEV1/FVC ratio. A mixed pattern (obstruction and restriction) was defined as an FEV1/FVC ratio, FEV1, and FVC below the lower limits of normal. Workers with evidence of airways obstruction or a mixed pattern were administered albuterol, a bronchodilator medication used to treat obstructive lung diseases such as asthma, and were then re-tested to see if the obstruction was reversible. Reversible obstruction was defined as an improvement in the FEV1 of at least 12% and at least 200 milliliters after administration of albuterol. During the November 2000 medical survey, carbon monoxide diffusing capacity of the lung (DLCO) was measured and posterior-anterior chest x-rays were obtained. (See Appendix C, August 2001 interim report) During the December 2001 medical survey, two additional non-invasive tests, induced sputum and exhaled nitric oxide (ENO), were performed in order to obtain information on the pathologic mechanisms involved in the development of fixed airways obstruction in affected workers. Protocols for both procedures were reviewed and approved by the NIOSH Human Subjects Review Board. NIOSH technicians conducted the induced sputum and ENO tests after obtaining written informed consent. Sputum was collected from 59 workers who had worked as mixers, in maintenance, on microwave popcorn packaging lines, or in the QC laboratory (the “microwave popcorn” group), as well as from 22 workers who worked in the office, warehouse, in the polyethylene packaging area, and the outside areas of the plant (the “non-microwave popcorn” group). To induce sputum for collection, participants breathed a nebulized three percent saline (saltwater) solution for 12
minutes. Sputum samples were analyzed for differential cell counts, interleukin-8 (IL-8) concentration, and eosinophil cationic protein (ECP) concentration.12 For measurement of ENO, participants exhaled into 10-liter Mylar® gas-collection balloons and the breath samples were analyzed within six hours with a rapid-response chemiluminescence analyzer (Sievers Instruments model 280; Boulder, CO).13 After each survey, letters providing individual test results and interpretations were mailed to each participant at their home address. For individuals with abnormal results and/or evidence of rapid declines in lung function, guidance and recommendations for additional medical follow-up, smoking cessation, and (if appropriate) cessation of exposure to butter flavorings in the plant were also provided. Starting with the August 2001 medical survey, an interim report that summarized the results of ongoing analyses of data from the medical and environmental surveys was provided to company management and workers after each survey. Data Analyses November 2000 survey: The worker population was divided into four groups based on anticipated TWA exposure levels: office and outdoor workers (the “control” or internal reference group with expected very low exposures); warehouse, polyethylene, maintenance, and quality control workers (with low exposures); microwave packaging workers (moderate exposures); and mixers (high exposures). In each of the work groups, the air sampling results for jobs sampled within that group were averaged as a representative measure of current exposure. Relations between current exposure group and health outcome were assessed. Cumulative exposures were estimated for each participant by summing the products of time worked in each of the four exposure groups and the mean exposure for that group. To assess exposure-response relations for respirable dust and for diacetyl, participants were ranked by estimated cumulative exposures and grouped into quartiles, and then the rates of health outcomes among quartiles of the cumulative exposure were compared. SAS software (SAS®

Page 4 Health Hazard Evaluation Report No. 2000-0401-2991
version 9.1, 2002-2003; SAS Institute, Inc., Cary, NC) was used for statistical analyses. Chi-square and Fisher’s exact test were used to test categorical data and Student’s t-test and Pearson’s correlation were used to evaluate continuous data. Probability (p) values less than 0.05 were considered to represent associations unlikely to be due to chance. Follow-up surveys: Participants were grouped according to the date they started work at the plant, with those who started work prior to November 4, 2000 (the last day of the first NIOSH survey) comprising “Cohort-1” and all others who started work on or after this date comprising “Cohort-2”. For Cohort-1 participants who participated in one of the last two surveys (February or August 2003) as well as in an earlier survey, data on symptom and abnormal spirometry prevalences, and mean percent predicted FEV1 from each participant’s first and last surveys were compared. For Cohort-2 participants who participated in more than one survey, the same health data from each participant’s first and last surveys were similarly compared. McNemar’s test was used to identify statistically significant differences, with probability values of 0.05 or less considered unlikely to be due to chance. From September 2001 through August 2003, NIOSH investigators chose to identify individuals with “excessive” declines as those whose FEV1 declined 150 milliliters (ml) or more from one survey to the next, or over one year. (Based on cross-sectional studies, the average FEV1 decline associated with normal aging is approximately 30 ml per year in non-smokers. A group of individuals (e.g., susceptible smokers) with sustained average declines of 60 ml per year would be expected to experience respiratory symptoms associated with simple activities of daily life by approximately 65 years of age.14) This 150-ml criterion was selected with a health-protective intent to prompt early intervention for individual workers felt to be more likely to be showing effects of a potentially serious and irreversible lung impairment like that experienced by the index cases from the same plant. For this report, an FEV1 decline of at least 300 ml (and/or at
least 10%) from first (baseline) spirometry test to last spirometry test was used as the criterion for excessive FEV1 declines. (This 300-milliliter criterion was based on a recently published study of longitudinal spirometry data.15) The percentage of workers with such declines in each cohort was compared by work area. Review of Company Spirometry Data In April 2003, NIOSH investigators provided management with guidance on spirometry surveillance for workers potentially exposed to butter flavoring chemicals (see Appendix D). In August 2005, management provided for NIOSH review the results of spirometry tests performed by the company’s provider from June 2003 through July 2005 on mixers, QC laboratory workers, supervisors, maintenance staff, and janitorial staff.
RESULTS Index Cases NIOSH investigators reviewed the medical records of the affected former workers. Eight of the nine former workers had moderate to severe airways obstruction and other findings consistent with clinical brochiolitis obliterans. Four of these former workers had worked as mixers of soybean oil, butter flavorings, salt, and colorings used in the production of microwave popcorn. The other four worked on the microwave popcorn packaging lines adjacent to the room where the oil and flavoring mixture was prepared (i.e., mixing room). These eight former workers reported no history of high exposures to known occupational causes of bronchiolitis obliterans, such as ammonia, phosgene, chlorine, or nitrogen oxides. They ranged in age from 27 to 51 years at symptom onset. Five of these eight former workers had minimal or no smoking history. The median time from onset of work at the plant to onset of symptoms was 1.5 years (range 5 months – 9 years). All eight affected former workers reported cough, shortness of breath on exertion, and wheezing. Initial FEV1 on spirometry tests

Health Hazard Evaluation Report No. 2000-0401-2991 Page 5
ranged from 14.0 – 66.8 percent predicted, with five former workers having an initial FEV1 less than 30 percent predicted. Seven of these eight former workers had fixed airways obstruction. One of these eight had evidence of restriction (low residual volume and low total lung capacity) as well as airways obstruction on lung function tests. On first evaluation, DLCO was normal in five of seven tested. Chest x-rays were normal or showed hyperinflation. All high resolution chest computed tomography scans (HRCT) showed marked bronchial wall thickening and mosaic attenuation with air trapping on the expiratory view. Some of these scans also showed mild cylindrical bronchiectasis. Thoracoscopic lung biopsies in one of two former workers and an affected current worker at the index plant showed evidence of constrictive bronchiolitis obliterans. None of the workers responded to prescribed oral corticosteroid medications.16 Findings from NIOSH November 2000 Cross-Sectional Medical and Environmental Survey One hundred and twenty-two current workers (90%) participated in a medical survey consisting of a health questionnaire, lung function testing with spirometry and diffusing capacity (DLCO) measurements, and chest x-rays. Plant employees had 2.6 times the rates of chronic cough and shortness of breath compared to national data, adjusted for smoking and age group; younger employees who had never smoked had rates approximately five times higher than expected from national data. Overall, plant employees had 3.3 times the prevalence of airways obstruction on spirometry compared to national data; the prevalence of obstruction in never-smokers was 10.8 times the national rate. Worker reports of physician-diagnosed asthma and chronic bronchitis were approximately twice as frequent as expected from national data, with a 3.3-fold excess of chronic bronchitis in never smokers. Nineteen of 21 workers with obstruction had fixed obstruction (unresponsive to bronchodilators) and most chest x-rays and DLCO tests were normal, findings that are consistent with constrictive bronchiolitis obliterans.1 Using the results of NIOSH air sampling for diacetyl, a
highly volatile butter flavoring chemical with known irritant properties and the predominant contaminant in the air of the plant, estimates of cumulative exposure to butter flavorings were calculated for all survey participants. A strong exposure-response relationship was demonstrated between quartiles of estimated cumulative exposure to diacetyl and the frequency and degree of airway obstruction on NIOSH spirometry tests.17 Five of six quality control (QC) workers who repeatedly popped bags of product in microwave ovens (approximately 100 bags per worker per work shift) in a poorly ventilated room were found to have obstruction on spirometry tests. (See Appendix C, August 2001 interim report, for additional details on the November 2000 NIOSH cross-sectional medical and environmental survey.) NIOSH investigators provided additional control recommendations immediately after the November 2000 cross-sectional survey (Appendix E). In November 2000, NIOSH investigators provided air-purifying respirators that filtered both vapors and particulates for mixers and assisted with employee training in respiratory protection. NIOSH investigators also recommended that all workers in the microwave popcorn production area be encouraged to use respirators while engineering controls were being implemented. In January 2001, NIOSH investigators conducted a detailed engineering control assessment and provided additional control recommendations (Appendix F). In March 2001, NIOSH investigators recommended follow-up medical and environmental surveys at the plant to determine if controls were effective in reducing exposures and protecting workers. NIOSH investigators performed seven additional cross-sectional medical and environmental surveys from April 2001 through August 2003. Starting with the August 2001 survey, NIOSH investigators issued interim reports after each survey that summarized the results of ongoing data analyses for company management and workers (see Appendices G through L).

Page 6 Health Hazard Evaluation Report No. 2000-0401-2991
Effects of Control Changes on Average Diacetyl Exposures Following the January 2001 engineering control technology assessment and recommendations by NIOSH investigators, the Gilster-Mary Lee Corporation began to implement the recommended controls to reduce worker exposures to air contaminants generated by the microwave popcorn production process. The chronology of control implementation is shown in Table 2. Figure 1 shows the average diacetyl air concentrations for five different job categories by survey date, starting with the November 2000 survey and ending with the July 2003 survey. The same data (as well as air concentrations for other jobs and areas in the plant) are presented in Table 3. Diacetyl concentrations (area and personal measurements combined) are presented in parts per million parts air by volume (ppm). Mixing Room: After the implementation of a wall exhaust fan and local exhaust ventilation of tanks in the mixing room, average diacetyl concentrations decreased from 37.8 ppm in November 2000 to 0.27 ppm in April 2001 and 0.11 ppm in September 2001. Diacetyl air concentrations increased following installation of the airlock enclosure for the mixing room entrance in November 2001 (0.52 ppm) and were even higher in March and August 2002 (2.18 and 1.58 ppm respectively). After the company began using a new mixing room in September 2002, the average mixing room diacetyl concentration in January 2003 was 0.23 ppm. The average diacetyl air concentration in July 2003 was 0.46 ppm. This increase may reflect the use of two new butter flavorings after the January 2003 survey. Figure 2 shows tank temperatures in degrees Fahrenheit by tank type and survey date. Mixing tank temperatures generally declined over time, ranging from a high of 134 0F in January of 2001 to a low of 115 0F in July of 2003. Mezzanine tank temperatures did not vary substantially across surveys and had a smaller temperature range, from highs of 121 0F in September 2001 and March 2002 to a low of 115 0F in November of 2001.
Packaging Area: Average diacetyl air concentrations for machine operators declined from 1.68 ppm in November 2000 to 0.08 and 0.01 ppm in April 2001 and September 2001, respectively. This decline is most likely the result of the controls implemented in the mixing room during this time, as local exhaust ventilation of the mezzanine tanks was not completed until after the September 2001 survey. Diacetyl air concentrations for machine operators increased in November 2001 and March 2002 to 0.10 and 0.37 ppm respectively, likely due to decreased dilution ventilation in the packaging area during the colder months of the year. Diacetyl air concentrations for machine operators were lower in August 2002 (0.03 ppm), and declined further in January and July 2003 (all measurements below detectable or quantifiable limits of 0.004 ppm) after the implementation of the new mixing room and ventilation (October 2002) and the enclosure and ventilation of the mezzanine tank area in March 2003. Similar diacetyl exposure reductions were seen for other microwave packaging area workers in the packing and stacking job categories. Quality Control (QC) Laboratory: Average diacetyl concentrations in the quality control room ranged from 0.54 ppm in November 2000 to below detectable limits in September of 2001 (below approximately 0.014 ppm). As occurred in the packaging area, average diacetyl air concentrations were higher in November 2001 and March 2002 (0.11 and 0.25 ppm respectively). This occurred despite the implementation of additional ventilation in the QC laboratory after the September 2001 survey. Diacetyl air concentrations were lower than the March 2002 concentrations again in August 2002 and January 2003. The lowest average diacetyl air concentration occurred during the July 2003 survey (all 10 TWA diacetyl air concentrations were below 0.004 ppm). These reduced air concentrations likely reflect the engineering control changes completed in this area, including placement of the five microwave ovens in a separate, ventilated “popping room” within the QC laboratory.

Health Hazard Evaluation Report No. 2000-0401-2991 Page 7
Shift Effects: Area diacetyl concentrations were measured during all three work shifts during the November 2000 survey and during the first and second shifts for the July 2003 survey to assess the potential for variability in measured concentrations on different shifts. Diacetyl concentrations from machine operators and quality control areas were similar across the shifts for both surveys. During the November 2000 survey, the day shift had the highest TWA mixing room concentrations for diacetyl as contrasted to the second and third shifts. During the July 2003 survey, the mixing room second shift samples had both the highest TWA diacetyl air concentration (2.9 ppm on July 16, 2003) and the lowest TWA diacetyl air concentration (0.04 ppm on July 15, 2003). This documents that average exposures in the mixing room can vary substantially from day to day. Peak Diacetyl and Acetoin Concentrations The magnitude of potential peak exposures to butter flavoring chemicals from oil and flavoring mixtures, mixing activities, and quality control activities was assessed with real-time area air sampling using a portable Fourier Transform Infrared (FTIR) Gas Analyzer, as well as with in-tank air sampling using standard air sampling equipment and analysis by existing NIOSH analytical methods as outlined in Table 1. The diacetyl and acetoin air concentrations measured with these techniques are summarized in Table 4 and Figures 3 - 5. Mixing room: On two different days in September 2001, diacetyl air concentrations were 383 and 1230 ppm in the air space above heated flavorings in a flavor holding tank in the mixing room. As the tank contained the same flavoring on both days, the difference in the measurements may have been due to differences in the effectiveness of tank local exhaust ventilation or from differences is sample inlet positioning within the tank lid opening. Peak diacetyl air concentrations using FTIR in the mixing room air during the August 2002 and January 2003 surveys ranged from 4.7 to 18.5 ppm (Figure 3). These were area samples, collected in the center of the mixing room, and reflect the peak concentrations in general mixing
room air as contrasted to the peak concentrations measured inside the flavor tank lid openings. The highest task-specific area concentration in general room air was measured during butter flavoring transfer when a worker poured butter flavoring into heated soybean oil in the mixing tank and then immediately transferred (pumped) the contents of a barrel of butter flavoring into a heated flavor holding tank. A separate point sample with the FTIR measured a diacetyl air concentration of 189 ppm in the headspace of a bucket of powdered butter flavoring (not shown in the table or figure). In January of 2003, diacetyl air concentrations measured inside the mixing tank (using the NMAM 2557 Method) were 27 and 28 ppm from two separate measurements taken the on same day. Mezzanine tanks: In September 2001, diacetyl air concentrations in a holding tank on the mezzanine were 89 and 184 ppm (measurements may reflect different oil and flavoring formulations in the tank as noted in Table 4.) After the implementation of local exhaust ventilation for all mezzanine holding tanks, the air concentration in a mezzanine holding tank in March 2002 was 2.1 ppm (sampling performed when the tank contained the same formulation that had previously resulted in a diacetyl air concentration of 184 ppm). Diacetyl air concentrations in mezzanine holding tanks in January and July 2003 ranged from 0.6 to 5.6 ppm; the tanks had different oil and flavor formulations than during previous surveys. Quality control laboratory: Real-time, task-specific diacetyl air concentrations measured with FTIR ranged from 0.75 ppm to 4.4 ppm in oven exhaust air during popping, and from 2.4 to 9.3 ppm inside the oven after popping. A peak diacetyl air concentration of 56 ppm was measured inside a microwave popcorn bag immediately after popping. Figure 4 shows the peak air concentrations for diacetyl when the FTIR sampling inlet was positioned near bags of popped microwave popcorn. A diacetyl peak of approximately 13 ppm was noted when the sampling inlet was positioned near the opening of a heated microwave popcorn bag, in a worker’s breathing zone, during dumping of the popped corn into a container.

Page 8 Health Hazard Evaluation Report No. 2000-0401-2991
Packaging area: Real-time air sampling with the FTIR in the microwave popcorn packaging area in August 2002 and January 2003 showed that diacetyl air concentrations varied minimally over the sampling period compared to FTIR sampling in other microwave popcorn production areas. The largest change in real-time diacetyl air concentration recorded was approximately 1 ppm (Figure 5). In the packaging area, measured real-time diacetyl air concentrations were higher than the average air concentrations obtained using NIOSH Method 2557. Average Dust Exposures Figure 6 provides a summary of total dust air concentrations for five different job categories by survey date, starting with the November 2000 survey and ending with the July 2003 survey. The mixing room total dust air concentrations decreased over the last four surveys from 1.1 milligrams per cubic meter of air (mg/m3) in March of 2002 to 0.24 mg/m3 in July 2003. The total dust concentrations measured in July 2003 for the machine operator and quality control job areas were the lowest measured in all eight surveys for these areas. Respirable dust air concentrations by survey date and job are provided in Figure 7. There was considerable variability in respirable dust concentrations across the follow-up surveys. The mean respirable dust concentrations measured during the January and July 2003 surveys in the mixing room were 0.15 mg/m3 and 0.19 mg/m3, respectively; these were lower than the concentration measured during the first survey in November 2000 (0.37 mg/m3). The mean respirable dust concentrations in the microwave packaging area (machine operator job category) ranged from a high of 0.13 mg/m3 in November of 2000 to a low of 0.03 mg/m3 in both September of 2001 and July of 2003. The lowest dust concentration observed in quality control occurred in July of 2003 (0.04 mg/m3) following the isolation of microwave ovens in a separate ventilated room.
Other Air Sampling Results Particle size distribution results are presented by survey date and area sampling location in Figure 8. Collectively, this data shows that a majority of the airborne particulate is of respirable size. In the mixing room, the cumulative percent of airborne particulate mass below 10 micrometers in aerodynamic diameter ranged from a high of 89.5% in November of 2000 to a low of 60% in January of 2003, after the opening of the new mixing room. In July of 2003, following enclosure of the mezzanine area and ventilation of this area through the new mixing room, approximately 82.5% of the airborne particulate mass was below 10 micrometers in aerodynamic diameter. In the packaging area, the percent of airborne particulate mass below 10 micrometers decreased throughout our follow-up sampling period from a high of 84% in November of 2000 to a low of 60% in November of 2001. In the quality control area, approximately 85 to 95 percent of the airborne particulate mass was below 10 micrometers in aerodynamic diameter. The samples collected after November 2001 in the quality control and packaging areas had insufficient mass on some of the sample stages to determine the size distribution. Mean total hydrocarbon concentrations (134 TWA area samples) in air (excluding the ketones diacetyl, acetoin, and 2-nonanone) are presented in Figure 9 by job and survey date starting with November 2001. Individual concentrations ranged from a high of 5.06 mg/m3 in the mixing room in August 2002 to below detectable levels (approximately 0.16 mg/m3). The highest mean hydrocarbon concentration was found in the mixing room (4.44 mg/m3) in August 2002; however, detectable hydrocarbon levels were found in most plant areas including the polyethylene lines, the office, and outside processing. Acetaldehyde measurements (101 TWA area samples taken during all surveys beginning with the March 2002 survey) were largely below quantifiable levels (less than approximately 0.04 ppm). Among the 17 samples with quantifiable concentrations, the highest concentrations were found in the mixing room (0.7 ppm) and in the
Health Hazard Evaluation Report No. 2000-0401-2991 Page 9
quality control room (0.11 ppm); quantifiable levels were found in other areas including microwave packaging, bag printing, maintenance, polyethylene line, and the office. Butyric acid measurements (113 TWA area samples taken during all surveys beginning with the March 2002 survey), were below detectable or quantifiable limits, less than approximately 0.6 ppm. Only 15 of the 145 acetic acid measurements taken since April 2001 were above detectable and quantifiable limits. Among these samples, the highest concentrations were found in microwave mixing (5.7 ppm, January 2003) and in packaging operations (2.9 ppm, September 2001). Follow-Up Medical Surveys Participants: A total of 373 current workers participated in one or more NIOSH surveys, with each participant’s first survey occurring while employed at the plant. Of the 373, 29 participated in surveys after they left employment. One hundred forty-six participants started work at the plant prior to November 4, 2000 (Cohort-1), and 227 started work on or after this date (Cohort-2). Compared to Cohort-1 participants, Cohort-2 participants were younger (mean age 28.7 vs. 36.6 years-old; p<0.0001) and had a higher percentage of males (57.7% vs. 48%; p=0.05), a lower percentage of whites (70.5% vs. 90.4%; p<0.0001), and a higher percentage of current smokers (54.2% vs. 42.5%; p=0.10) (Table 5). The total workforce at the plant varied from survey to survey, ranging from 135 to 165 workers. Participation by current workers at each survey ranged from 71% to 91% (Table 6). Of the 373 total participants, 186 (50%) participated in more than one survey. However, participation in more than one survey was much greater for Cohort-1 (100 of 146 participants, 68%) than for Cohort-2 (86 of 227 participants, 38%) (Table 7). Symptoms and lung function over time: Table 8 shows symptom and spirometry abnormality prevalences, mean percent predicted FEV1, and annualized decline in FEV1 for microwave popcorn production workers in Cohort-1 who participated in one of the last two surveys
(February or August 2003) as well as in an earlier survey. At their first survey, 23 workers reported working in either the QC laboratory or in maintenance or reported ever having worked as mixers of oil and flavorings; 41 worked in the microwave popcorn packaging area. Based on data from participants’ last surveys, mean total time employed was similar in both groups (103.7 months for the packaging-area group and 106.6 for the maintenance, QC, and ever-mixer group). Based on data from each participant’s first survey, similar percentages of workers in both groups reported trouble breathing and shortness of breath on exertion (range: 46.3-54.5%). A higher percentage of workers in the mixer, maintenance, and QC worker group reported usually having a cough (47.8% vs. 36.6%). Similar percentages of workers in both groups reported eye, nose, or throat irritation (68.3% vs. 63.6%). Both groups had high prevalences of spirometry abnormalities, but these were higher in the mixer, maintenance, and QC worker group (any abnormality: 39.1% vs. 22.5%; obstruction: 30.4% vs. 17.5%). Mean percent predicted FEV1 was similar in both groups (87% vs. 85.8%). Based on data from each participant’s last survey, symptom prevalences declined in the mixer, maintenance, and QC worker group, but only the decline in reported eye, nose, or throat irritation was statistically significant. Similarly, the decline in eye, nose, and throat irritation in packaging workers was statistically significant, while the differences in prevalences of other symptoms over time were not. There were no statistically significant changes in the prevalences of abnormal spirometry, airways obstruction, or in mean percent predicted FEV1 over time in either group, and the differences in annualized declines in FEV1 between the groups were also not statistically significant. Of the 86 Cohort-2 participants who participated in more than one NIOSH survey, 76 worked in the microwave packaging area; only two worked in the quality control lab or in maintenance or reported ever having worked as mixers of oil and flavorings. The others worked in non-microwave popcorn production areas of the plant. Table 9 shows symptom and spirometry abnormality prevalences for the 76 packaging

Page 10 Health Hazard Evaluation Report No. 2000-0401-2991
area workers in Cohort-2 that participated in more than one survey. Symptom prevalences based on data from each participant’s first survey ranged from 15.8% for trouble breathing to 34.2% for shortness of breath on exertion. The prevalences of trouble breathing, shortness of breath on exertion, eye, nose, or throat irritation, airways obstruction on spirometry, and mean percent predicted FEV1 based on first survey data in Cohort-2 packaging-area workers (Table 9) were significantly lower than the prevalences of these same outcomes based on first survey data in packaging-area workers in Cohort-1 (Table 8). There were no statistically significant changes in the prevalences of symptoms, spirometry abnormalities, or in mean percent predicted FEV1 from first to last surveys in Cohort-2 packaging workers (Table 9). Based on data from participants’ last surveys, the average length of employment for this group was 12 months (range 2 to 31 months). Fifty-seven of these workers had worked seven or more months, and 31 workers had worked 12 or more months. Excessive FEV1 declines in workers with three or more surveys (Table 10): Of the 88 Cohort-1 participants who participated in three or more NIOSH medical surveys, 19 (22%) had FEV1 declines of greater than 300 ml and/or 10% from their first to their last spirometry test. Three of these 19 had moderate or severe obstruction (with FEV1 less than 60% or 40% of predicted, respectively) on their initial spirometry test, while the rest had normal lung function initially. Five of these 19 stopped working in microwave popcorn production in 2001 and had spirometry tests after this; three of these five had additional excessive FEV1 declines after they stopped working in microwave popcorn production. Of the 41 Cohort-2 participants with three or more surveys, 3 (7%) had FEV1 declines of greater than 300 ml and/or 10% from their first to their last spirometry test. All three started working in microwave popcorn production in 2001. Of the 9 Cohort-2 participants with three or more surveys who began work in January 2002 or later, none had excessive declines. Nine workers who worked as mixers for at least one month after the November 2000 survey
participated in three or more medical surveys. Four of these nine, all from Cohort-1, had excessive FEV1 declines. One mixer experienced an extreme decline in lung function over the eight NIOSH surveys (FEV1 declined 1300 ml from November 2000 through August 2001; after stopping work as a mixer, FEV1 continued to fall, with a total fall of 2800 ml over 2.75 years, representing a decline from 96 percent predicted FEV1 to 39 percent predicted FEV1). Another mixer experienced an 810 ml decline in FEV1, with lung function subsequently returning to baseline while continuing to work as a mixer. Two others experienced 300-400 ml declines in FEV1. The four workers with excessive FEV1 declines averaged 34 months of work as mixers (range 7 – 67.5 months) compared to eight months (range 3 – 11 months) in the five workers without excessive FEV1 declines. Of the nine workers who worked in the QC laboratory at some time after the November 2000 survey and who participated in three or more surveys, seven had stable lung function over time. Two workers, both from Cohort-1, had excessive FEV1 declines. November 2001 induced sputum results:12 Neutrophil counts in nonsmoking workers were significantly higher than those of a healthy nonsmoking external control group (p<0.05). After controlling for smoking, workers who had worked as mixers, on microwave popcorn packaging lines, in the QC laboratory, or in maintenance (microwave popcorn group) had an increased risk of having a high neutrophil count (i.e., higher than the median for all measurements) compared to workers from offices, the warehouse, the polyethylene packaging area, and the outside areas of the plant (non-microwave popcorn group)(odds ratio 3.8; 95% confidence interval, 1.3-11.5). Sputum interleukin-8 (IL-8) and eosinophil cationic protein (ECP) levels were higher in the microwave popcorn group than in the non-microwave popcorn group (p< 0.05). There were no relationships between sputum characteristics and the presence of airways obstruction.12

Health Hazard Evaluation Report No. 2000-0401-2991 Page 11
November 2001 exhaled nitric oxide (ENO) results:13 The median ENO concentrations for plant workers and a healthy external control group were 5.9 ppb (parts per billion) and 7.6 ppb, respectively. ENO was lower in the microwave popcorn group when compared to the non-microwave popcorn group (5.5 vs. 6.6, p<0.05). After adjusting for smoking and age, ENO was significantly lower in workers reporting chest tightness when compared to workers without this symptom (5.8 vs. 6.5, p=0.03). There were no significant associations between ENO and other respiratory symptoms or lung function. Workers with nasal and/or eye irritation symptoms and night sweats had a lower ENO than workers without these symptoms (nasal and/or eye symptoms: 5.9 ppb vs. 6.6 ppb, p=0.052; night sweats: 5.5 ppb vs. 6.5 ppb, p=0.052).13
Company Spirometry Testing Most tests could not be assessed with regard to quality because a sufficient number of forced expiratory maneuvers were not recorded during the test. A minimum of three satisfactory maneuvers are necessary to comply with ATS criteria for standardization of spirometry.10 Some maneuvers failed to meet the ATS criteria for exhalation time of at least six-seconds. Without high quality data, interpretation of lung function changes over time may not be valid (i.e., changes in test values may be due to test performance and not actual changes in lung function).
DISCUSSION The affected former workers of the Gilster-Mary Lee microwave popcorn plant became ill over several years from 1993 through 2000. Many were initially told by their physicians that they had developed asthma or emphysema, and the role of workplace exposures in the development of their illnesses was not initially appreciated. Most of these former workers eventually developed severe fixed airways obstruction, and four were eventually placed on lung transplant lists by their physicians. A review of their medical records revealed findings consistent
with clinical bronchiolitis obliterans including marked bronchial wall thickening with air trapping on HRCT scan expiratory views. Biopsy findings in an affected former worker and an affected current worker were consistent with constrictive bronchiolitis obliterans. The occurrence of several cases of a rare and severe form of lung disease in fairly young workers in a relatively small workforce was highly unusual. When this cluster of similarly affected former workers from one plant was eventually recognized, the possibility of occupational lung disease risk in this plant was finally brought to the attention of public health authorities. Context of investigation: When NIOSH began its investigation in August 2000, there were no reports in the published scientific literature that indicated a risk for occupational lung disease in this work setting. Plain kernel popcorn has been packaged for sale for many decades. However, the production of microwave popcorn with butter flavorings did not start until the mid to late 1980s. While it was known that some butter flavoring chemicals such as diacetyl could cause eye and respiratory irritation, the potential for development of lung disease from their inhalation had not been previously reported. In general, flavoring chemicals are evaluated for safety to consume in small amounts in food; few have been evaluated for safety to inhale in the workplace.18 The results of the November 2000 NIOSH medical survey at the Gilster-Mary Lee plant documented extraordinary respiratory risks to current workers. In addition to finding abnormalities consistent with those in the former worker index cases, three current workers had severe fixed obstruction in the range of that found in former workers on lung transplant lists. In addition to follow-up surveys at the Gilster-Mary Lee plant, NIOSH investigators sought to learn more about the risk of inhalation exposure to butter flavorings by evaluating other microwave popcorn production plants and by conducting animal exposure studies. From 2001 through 2003, NIOSH investigators evaluated five other microwave popcorn plants, four of which had workers with fixed obstruction and other medical findings consistent with

Page 12 Health Hazard Evaluation Report No. 2000-0401-2991
bronchiolitis obliterans.19 - 23 In animal inhalation exposure studies conducted at NIOSH, rats developed severe injury to their airway epithelial lining after a six-hour exposure to vapors from a butter flavoring used at the Gilster-Mary Lee plant.24 In a similar experiment, diacetyl alone produced similar effects.25 Limitations: The interpretation of data from the follow-up surveys at the Gilster-Mary Lee plant was complicated by several issues. For workers hired prior to the implementation of exposure controls, persistent symptoms and continued excessive declines in lung function might be a manifestation of the effects of previous higher exposures, or might be due to levels of exposure that were still too high. Two of the former worker index cases continued to have excessive declines in lung function many months to years after leaving the plant,16 as did three current workers who participated in NIOSH surveys after they stopped working in microwave popcorn production. Because of this, it was important to evaluate new workers who were hired after exposures were controlled. However, these workers had often been in the plant for weeks or months prior to their first NIOSH survey and the company did not provide baseline spirometry testing before they started work. If they were identified as having abnormal lung function on their first NIOSH test, there was no way to know if their abnormality pre-dated the start of work in the plant. Following new workers over time to see if they experienced excessive declines in lung function would potentially provide the clearest evidence for or against continued risk. Unfortunately, because of high turnover of the plant workforce, only 86 (38%) of 227 workers hired after November 4, 2000 had more than one spirometry test by NIOSH; only 41 (18%) of 227 had more than two tests. These numbers were insufficient to provide stable or representative information about respiratory disease risk among newly-hired workers. Another important issue to consider is that, after initially declining in 2001, air concentrations of butter flavoring chemicals increased in November 2001 and March 2002 before declining again. In some areas the lowest
exposures were not achieved until 2003, and mixing room exposures remained somewhat higher than the lowest levels achieved in this area in 2001. Therefore, exposures varied among Cohort-2 workers based on when they were hired; some Cohort-2 workers may have been exposed to concentrations that still posed risk for lung disease. However, compared to Cohort-1 workers, many Cohort-2 workers were exposed for much less time. Provisional interpretation: Despite these limitations, the analyses of the data from the NIOSH medical surveys at this plant do provide some indications that the control of exposures to butter flavoring chemicals has decreased the risk to most workers. In workers hired prior to the first survey (Cohort-1) and who participated in multiple NIOSH surveys including the 7th or 8th surveys in 2003, the prevalence of abnormal spirometry did not increase over this time. In workers hired after the first survey (Cohort-2), prevalences of symptoms and abnormal spirometry (based on data from first surveys) were lower than in Cohort-1 and did not increase over time. The percentage of workers with excessive FEV1 declines in Cohort-2 was 7% compared to 22% in Cohort-1. Using Information from Investigations at Other Plants to Assess Risk Risk from mixing room exposures: In the mixing rooms / areas at five other plants evaluated by NIOSH investigators, average diacetyl air concentrations ranged from 0.2 to 1.2 ppm for area samples and 0.02 to 1.0 ppm for personal samples. These results are comparable to the January and July 2003 average diacetyl air concentrations of 0.23 ppm and 0.46 ppm respectively in the mixing room of the Gilster-Mary Lee plant. Mixers at three of the other five plants had lung disease consistent with bronchiolitis obliterans.19,22,23 At one of these three plants, NIOSH investigators performed real-time air sampling for diacetyl (with the sampling inlet placed in the mixer’s breathing zone) and documented a diacetyl air concentration of greater than 80 ppm while the mixer was pouring liquid butter flavorings into a mixing tank. These findings suggest that mixers

Health Hazard Evaluation Report No. 2000-0401-2991 Page 13
are still at risk from short-term peak exposures even when average air concentrations of butter flavoring chemicals are low. Because of this, Gilster-Mary Lee should re-engineer the production process to a closed system so that workers no longer have to handle open containers of butter flavorings or look into open tanks that contain butter flavorings. Mixers and all other employees who enter the mixing room and mezzanine area must continue to use appropriate respiratory protection at all times until a closed production process is implemented. Respiratory protection should be used only as a last resort or as a temporary measure until engineering controls or substitution to non-hazardous flavoring ingredients is accomplished. Respiratory protection can fail due to improper respirator fit, worker non-compliance with respirator use, or respirator malfunction. Until exposures to butter flavoring chemicals in the mixing room and mezzanine area are eliminated, workers who enter these areas should be monitored with regularly scheduled spirometry to make sure that their lung function remains stable. Risk from packaging-area exposures: In two of the other five microwave popcorn plants evaluated by NIOSH investigators, heated tanks of oil and butter flavoring were located in the packaging area next to the packaging lines. Mean TWA diacetyl air concentrations in the packaging areas at these two plants ranged from 0.3 to 0.7 ppm (area and personal sampling).19,21 One of these two plants had a two-fold excess of obstruction on spirometry tests (compared to national data) and several packaging line workers had lung disease consistent with bronchiolitis obliterans.21 At the other plant, two out of three packaging area workers had mild or borderline airways obstruction on spirometry tests.19 When considered along with the fact that four of the eight index cases among former workers of the Gilster-Mary Lee plant worked in the packaging area, these findings indicate that packaging area workers are at risk from exposures to butter flavoring chemicals when they work near non-isolated tanks. In the other three of five plants where all tanks of heated oil and flavorings were isolated in a separate mixing room, mean TWA packaging-area diacetyl air
concentrations ranged from 0.004 to 0.03 ppm for area sampling and from 0.002 to 0.02 ppm for personal sampling.20,22,23 In two of these three plants there was no excess of abnormalities on spirometry tests,20,22 while the other plant had a slight excess (possibly due to higher past exposures when the tanks were inadequately isolated in that plant).23 Because all tanks of heated oil and flavorings were ultimately isolated from the packaging area at the Gilster-Mary Lee plant and the average diacetyl air concentrations in January and July 2003 were very low (all measurements below detectable or quantifiable limits of 0.004 ppm), packaging area workers at the Gilster-Mary Lee plant are now likely no longer at risk for lung disease related to exposures to butter flavoring chemicals. Risk from exposures in the quality control laboratory: Compared to the evidence of risk seen in QC workers at the Gilster-Mary Lee plant (five of six QC workers had obstruction on spirometry in the November 2000 survey), none of the other five microwave popcorn plants evaluated by NIOSH investigators had similar evidence of risk. Only three of the other five plants popped many dozens of bags of microwave popcorn per shift. The average diacetyl concentration first measured in the QC laboratory at Gilster-Mary Lee (0.54 ppm) was over 3 times as high as the concentrations measured in the QC areas at other plants. Diacetyl air concentrations in the QC laboratory at Gilster-Mary Lee decreased by two orders of magnitude as a result of engineering controls implemented from 2001 through 2003. (All TWA diacetyl air concentration measurements were less than 0.004 ppm in July 2003.) However, QC workers can still have repetitive peak exposures to butter flavoring chemicals from opening microwaved bags of popcorn even though average air concentrations may be low. While current exposures in the QC laboratory may be below the threshold for lung disease risk, QC workers should have regularly scheduled spirometry tests to confirm this.

Page 14 Health Hazard Evaluation Report No. 2000-0401-2991
What is a Safe Level of Exposure to Butter Flavoring Chemicals? Animal experiments at NIOSH indicate that diacetyl is one of the chemicals in butter flavoring that can lead to severe airway injury.24,25 However, levels of exposure to diacetyl that are considered safe have not been established. The other chemicals in butter flavorings that may contribute to the toxicity have not been determined. Recommended workplace air exposure limits have not been established for most chemicals used in flavorings.18 Also unknown is the relative safety of powdered flavorings compared to liquids or pastes. Powders that are formulated (i.e., encapsulated) to have lower emissions of volatile flavoring chemicals may pose lower risk. However, inhalation of powder of respirable size during the handling of these flavorings may increase worker risk for lung problems (due to deposition and local release of flavoring chemicals on contact with moisture in the lining of the airways). Until more is known about which butter flavoring chemicals pose risk and at what air concentrations, worker exposures to these chemicals should be limited to the extent feasible. The Importance of High-Quality Spirometry Tests NIOSH investigators contacted representatives of the spirometry provider for Gilster-Mary Lee and discussed the importance of following the ATS recommendations for standardization of spirometry.10 All tests must have at least three acceptable maneuvers. Additional maneuvers may be necessary in order to obtain measurements that are reproducible. The two largest FVC and FEV1 measurements should differ by less than 200 ml. Spirometry technicians should attend a NIOSH-certified spirometry course and demonstrate knowledge of proper techniques for coaching test subjects as well as the criteria for a satisfactory test. Regular checks of technician performance are appropriate after training. Following these steps should facilitate the performance of high-quality spirometry that can then be used to follow workers’ lung function over time.
CONCLUSIONS The NIOSH investigation of fixed obstructive lung disease in workers at the Gilster-Mary Lee plant revealed a risk for occupational lung disease in workers with inhalation exposure to butter flavoring chemicals. (Some workers may develop restrictive lung disease, as occurred in one of the index cases from this plant due to exposure to butter flavoring chemicals.) Data from multiple medical and environmental surveys at this plant and from similar surveys at five other microwave popcorn plants indicate that workers near non-isolated tanks of oil and butter flavorings, mixers handling open containers of butter flavorings, and QC laboratory workers heating many dozens of bags of product per hour in microwave ovens are at most risk. Other workers that enter the mixing room, such as supervisors, maintenance workers, and janitorial workers may also be at risk. As a result of the implementation of exposure controls from January 2001 through July 2003, average diacetyl air concentrations declined two orders of magnitude in the mixing room (from 38 ppm to 0.46 ppm) and the QC laboratory (from 0.54 to 0.002 ppm) and three orders of magnitude in the packaging area (from 1.69 ppm to 0.002 ppm for machine operators). Workers in the packaging area are now probably no longer at risk for lung disease from inhalation exposure to butter flavoring chemicals as long as isolation of the mixing room and mezzanine are maintained and all ventilation systems are operational. The exposure controls implemented in the QC laboratory have likely minimized the risk to workers in this area. However, QC laboratory workers should have regularly scheduled spirometry to assure that their lung function remains stable. The use of respiratory protection to minimize mixers’ exposures to butter flavoring chemicals should only be considered a short-term solution. Re-engineering the production process to a closed system (so that mixers do not have to handle open containers of flavoring and no longer have to open tanks that contain heated oil and/or butter flavoring) is an appropriate long-term solution. Until a closed process is implemented, all workers who enter the mixing room or mezzanine area should use appropriate

Health Hazard Evaluation Report No. 2000-0401-2991 Page 15
respiratory protection when in these areas and should have regularly scheduled spirometry to identify early declines in lung function that may be due to exposures to butter flavoring chemicals. Spirometry of high quality is necessary in order to enhance the validity of comparisons of results over time.
RECOMMENDATIONS 1. Identify and implement engineering changes
that allow flavorings to be added to heated oil in a closed system (i.e., no worker exposures to open containers of flavorings) and that eliminate the need for workers to look into open tanks of heated oil and flavorings. A closed system requires that all aspects of the mixing process be tightly contained (e.g., all tanks should have lids that seal tightly and prevent the escape of vapors into the air).
2. Until a closed system for mixing of oil and flavoring is implemented, assure that ventilation minimizes worker exposures to the lowest extent feasible. Maintain general dilution ventilation in all production areas. Maintain isolation of all tanks that contain flavorings and oil/flavoring mixtures in the mixing room and mezzanine area, and keep both of these areas under negative air-pressure relative to the rest of the plant.
3. Consider flavoring substitution to powder flavorings that limit the release of VOCs during production (e.g., encapsulated flavorings) and that generate little airborne dust during handling. Continue to require the use of appropriate respirators (see below) by workers handling open containers of flavorings of any type.
4. Perform regularly-scheduled air sampling for diacetyl to ensure the effectiveness of control interventions.
5. Until the production process is reengineered to eliminate exposures to butter flavoring chemicals, continue to require mandatory respirator use by mixers and any other workers whenever they enter the mixing room and the mezzanine area. A formal respiratory protection program that adheres to the requirements of the OSHA
Respiratory Protection Standard (29 CFR 1910.134) is required. The program administrator that you select for the program must have adequate training and experience to run it and regularly evaluate its effectiveness. Details on the Respiratory Protection Standard and on how a company can set up a respiratory protection program are available on the OSHA website (www.osha.gov). A NIOSH-certified half-facepiece negative-pressure respirator with organic vapor cartridges and particulate filters is the minimum level of respiratory protection recommended for entry into the mixing or mezzanine areas; these respirators should be used in conjunction with goggles or safety glasses with side-shields. A full-facepiece respirator would provide eye protection as well. A loose-fitting powered air-purifying respirator (PAPR) with a particulate filter and organic vapor cartridge is an option to consider for increased worker comfort and, unlike tight-fitting respirators, does not require fit testing. Another option is a supplied-air respirator like those currently required for use by mixers at this plant. For flavor mixing, opening flavoring tanks, or cleaning large spills of butter flavorings, a PAPR or supplied-air respirator is the minimum level of respiratory protection recommended.
6. Continue spirometry testing (at least twice a year) for QC laboratory workers and any workers that enter the mixing room or mezzanine. All workers should have a baseline spirometry test before they are assigned to work in these areas. Declines in FEV1 of 300 ml or 10% from baseline should prompt an evaluation of the workplace to determine if a problem with exposure controls or work practices is causing increased exposures to butter flavoring chemicals which may be responsible for the decline in lung function. Workers found to have declines of this magnitude should have a follow-up test in 3-4 weeks to see if the decline persists. Workers with persistent declines of this magnitude should be referred by management to an occupational or pulmonary medicine physician for additional

Page 16 Health Hazard Evaluation Report No. 2000-0401-2991
evaluation and consideration of exposure limitation.
REFERENCES 1. King TE [1998]. Bronchiolitis. In: Fishman
AP, ed. Fishman’s pulmonary diseases and disorders. New York, NY: McGraw-Hill, pp. 825-847.
2. King TE [2000]. Bronchiolitis. Eur Respir
Mon 14:244–266. 3. NIOSH [2003]. In: Schlecht PC, O’Connor
PF, Manual of Analytical Methods (NMAM), 4th ed., Third Supplement. Cincinnati, OH: Department of Health and Human Services, Public Health Service, Center for Disease Control and Prevention, National Institute for Occupational Safety and Health. DHHS (NIOSH) Publication No. 2003-154.
4. Hinds WC [1982]. Aerosol Technology.
New York: John Wiley and Sons, pp 1-314. 5. ACGIH [1995]. Air Sampling Instruments
for Evaluation of Atmospheric Contaminants, 8th ed. Cincinnati: OH: American Conference of Governmental Industrial Hygienists.
6. Leichnitz, K [1989]. Detector Tube
Handbook, 6th ed. Lubeck, Germany: Draeger Werk Ag., pp. 1-49.
7. Kullman G, Boylstein R, et al. [2005].
Characterization of respiratory exposures at a microwave popcorn plant with cases of bronchiolitis obliterans. JOEH 2:169-178.
8. Ferris BG [1978]. Epidemiology
standardization project. Am Rev Respir Dis 118:Suppl:1-53.
9. CDC [1996]. Third National Health and
Nutrition Examination Survey, 1988-1994, NHANES III Examination Data File [CD-ROM]. Hyattsville, Maryland: U.S. Department of Health and Human Services,
Public Health Service, CDC. (Public use data file documentation No. 76300.)
10. American Thoracic Society [1995].
Standardization of spirometry: 1994 update. Am J Respir Crit Care Med 152:1107-1136.
11. Hankinson JL, Odencrantz JR, Fedan KB
[1999]. Spirometric reference values from a sample of the general U.S. population. Am J Resp Crit Care Med 159:179-187.
12. Akpinar-Elci M, Stemple KJ, Enright PL, et
al. [2005]. Induced sputum evaluation in microwave popcorn production workers. Chest 128(2):991-997.
13. Akpinar-Elci M, Stemple KJ, Elci OC,
Dweik RA, Kreiss K, Enright PL. Exhaled nitric oxide measurement in microwave popcorn production plant workers. Int J Occup Environ Health (in press).
14. Institute of Medicine [2001]. Chapter 14:
Non-neoplastic respiratory diseases. In: Clearing the smoke: assessing the science base for tobacco harm reduction. pp. 500-542.
15. Wang M, Petsonk E [2004]. Repeated
measures of FEV1 over six to twelve months: what change is abnormal? J Occup Environ Med 46:591-595.
16. Akpinar-Elci M, Travis WD, Lynch DA,
Kreiss K [2004]. Bronchiolitis obliterans syndrome in popcorn plant workers. Eur Resp J 24: 298-302.
17. 17. Kreiss K, Gomaa A, Kullman G, et al.
[2002]. Clinical bronchiolitis obliterans in workers at a microwave-popcorn plant. N Engl J Med 347 (5):330-338.
18. NIOSH [2004]. NIOSH Alert: Preventing
lung disease in workers that use or make flavorings, Division of Respiratory Disease Studies, National Institute for Occupational Safety and Health, Department of Health and Human Services, DHHS (NIOSH) Publication Number 2004-110.

Health Hazard Evaluation Report No. 2000-0401-2991 Page 17
19. Kanwal R [2003]. Letter of May 13, 2003, from R. Kanwal and S. Martin, Division of Respiratory Disease Studies, National Institute for Occupational Safety and Health, Centers for Disease Control and Prevention, Department of Health and Human Services, to Keith Heuermann, B. K. Heuermann Popcorn, Inc., Phillips, Nebraska.
20. Kanwal R [2003]. Letter of July 2, 2003,
from R. Kanwal, Division of Respiratory Disease Studies, National Institute for Occupational Safety and Health, Centers for Disease Control and Prevention, Department of Health and Human Services, to Frank Morrison, Nebraska Popcorn, Clearwater, Nebraska.
21. NIOSH [2003]. Hazard Evaluation and
Technical Assistance Report: Agrilink Foods Popcorn Plant, Ridgway, Illinois. Cincinnati, OH: U.S. Department of Health and Human Services, Public Health Service, Centers for Disease Control and Prevention, National Institute for Occupational Safety and Health, DHHS (NIOSH) Publication No. 2002-0408-2915.
22. NIOSH [2004]. Hazard Evaluation and
Technical Assistance Report: American Pop Corn Company, Sioux City, Iowa. Cincinnati, OH: U.S. Department of Health and Human Services, Public Health Service, Centers for Disease Control and Prevention, National Institute for Occupational Safety and Health, DHHS (NIOSH) Publication No. 2001-0474-2943.
23. NIOSH [2004]. Hazard Evaluation and
Technical Assistance Report: ConAgra Snack Foods, Marion, Ohio. Cincinnati, OH: U.S. Department of Health and Human Services, Public Health Service, Centers for Disease Control and Prevention, National Institute for Occupational Safety and Health, DHHS (NIOSH) Publication No. 2003-0112-2949.
24. Hubbs AF, Batelli LA, Goldsmith WT, et al.
[2002]. Necrosis of nasal and airway epithelium in rats inhaling vapors of artificial butter flavoring. Toxicol Appl Pharmacol 185:128-135.
25. Hubbs AF, Battelli LA, Mercer RR, Kashon M, Friend S, Schwegler-Berry D, Goldsmith WT [2004]. Inhalation toxicity of the flavoring agent, diacetyl (2, 3-butanedione), in the upper respiratory tract of rats. Toxicol Sci 78 (S1): 438-439.

Page 18 Health Hazard Evaluation Report No. 2000-0401-2991
Tables and Figures Table 1. Industrial hygiene sampling methods
Analytes
Media/sampler
Flow (lpm)
Analytical methods
Total dust in air
37-mm PVC Filter, Open-Face Filter Cassette
3.0
Gravimetric analysis by NIOSH Manual of Analytical Methods (NMAM) Method 0500 3
Respirable dust in air
37-mm PVC Filter, BGIR Cyclone
4.2
Gravimetric analysis by NMAM Method 0600 3
Particle size distributions in air
Six stage cascade impactor
2.0
Gravimetric analysis 3,4
Volatile organic compounds (VOCs) in air
Thermal Desorption Tube
0.03 to
0.05
Gas chromatography / mass spectrometry by NMAM Method 2549 3
VOCs in air
Photoionization meter
--
Direct-reading instrument 5
Total hydrocarbons in air Coconut shell charcoal (CSC) tubes 0.05 Gas chromatography by NMAM Method 1550 3
Ketone compounds in air (diacetyl, acetoin, and 2-nonanone)
Anasorb tube
0.03 to
0.15
Gas chromatography by NMAM Methods 2557 and 2558 3
Real-time diacetyl, acetoin, and nonanone concentrations in air
Fourier Transform Infrared (FTIR) Gas Analyzer
-- Direct-reading instrument (6) (Gasmet DX-4010,TM Temet Instruments Oy, Helsinki, Finland)
Acetaldehyde in air
Sorbent tube (silica gel treated with 2,4 dinitrophenylhydrazine)
0.03
High performance liquid chromatography (HPLC) by NMAM Method 2016 (NIOSH, 2003) 3
Acetic acid in air
Long-term diffusion tubes
--
Direct-reading results by colorimetric methods 5,6,7
Inorganic gases in air Short-term indicator tubes -- Direct-reading results by colorimetric methods 5,6,7
Acetic and butyric acid in air Sorbent tube (washed silica gel) 0.3 Ion chromatography by NMAM Method 7903 3
Air temperature and % relative humidity
Psychrometer
--
Direct-reading meter 5

Health Hazard Evaluation Report No. 2000-0401-2991 Page 19
Table 2. Dates of exposure control changes and NIOSH industrial hygiene surveys
Date Event Cross-Sectional Industrial Hygiene Survey, Respiratory protection training by NIOSH (November 11-18, 2000) Engineering Control Technology Survey (January 17 – 19, 2001) February 12, 2001 Exhaust fan installed in oil and flavoring mixing room February 2001 Heated liquid flavoring tanks (2) vented to exhaust fan
March 29, 2001 Pump installed for closed transfer of flavorings between holding and mixing tanks
Follow-up Survey (April 2-5, 2001)
April 6, 2001
Mixers supplied with powered air-purifying respirators and respirator training. Respirators available to workers in other microwave production areas on voluntary basis
May 22, 2001 Local exhaust ventilation installed for 2 of 7 oil tanks on mezzanine. (Note, tanks were initially vented into packaging area air until September 2001)
June 6, 2001 Flavoring storage cabinets completed for storing bulk flavorings July 16, 2001 Temperature control installed on one flavoring tank
August 7, 2001 Tempered, outside supply air intake system completed, providing replacement air for microwave popcorn production areas
Follow-up Survey (September 4 - 8, 2001) September 11, 2001 Exhaust fan installed in quality control lab September 18, 2001 Fresh air intake installed in quality control lab September 21-30, 2001 Completion of local exhaust ventilation for all mezzanine oil tanks November 2, 2001 Flavoring transfer pump installed for 5-gallon containers November 2, 2001 Air lock installed outside of mixing room Follow-up Survey (November 6 - 8, 2001) Follow-up Survey (March 18 - 21, 2002)
August 2, 2002
Started use of supplied-air respirators for mixers in mixing room and mezzanine (air-purifying respirators with organic vapor cartridges and particulate filters had been used prior to this.)
August 9, 2002 Microwave ovens and testing counter in quality control lab enclosed with plastic curtain
Follow-up Survey (August 11 - 16, 2002) September 7, 2002 Started using new mixing room (ventilation incomplete) September 30, 2000 Discontinued use of one paste butter flavoring October 1, 2002 New mixing room wall exhaust fan operational Follow-up Survey (January 27 - 31, 2003) March 9, 2003 Enclosure of tanks on mezzanine completed April 10, 2003 Air-handler functional on mezzanine April 15, 2003 New exhaust fan operational in quality control lab (in new “popping room”) April 15, 2003 2 additional exhaust fans (for mezzanine and mix room) May 13, 2003 Microwave ovens moved into popping room in quality control lab Follow-up Survey (July 14 - 18, 2003)
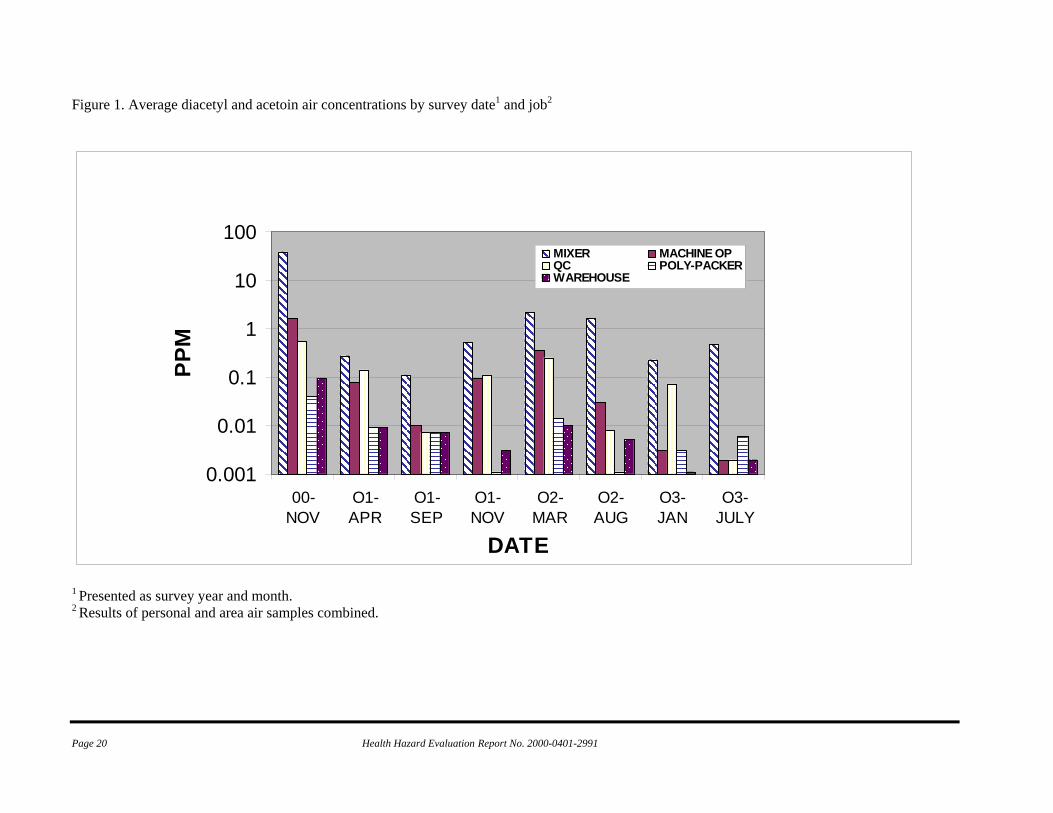
Page 20 Health Hazard Evaluation Report No. 2000-0401-2991
Figure 1. Average diacetyl and acetoin air concentrations by survey date1 and job2
0.001
0.01
0.1
1
10
100
00-NOV
O1-APR
O1-SEP
O1-NOV
O2-MAR
O2-AUG
O3-JAN
O3-JULY
DATE
PPM
MIXER MACHINE OPQC POLY-PACKERWAREHOUSE
1 Presented as survey year and month. 2 Results of personal and area air samples combined.

Health Hazard Evaluation Report No. 2000-0401-2991 Page 21
Table 3. Diacetyl air concentrations (ppm) by job category and survey date
Mixer Time N Mean STD GM GSD Range Nov, 2000 10 37.8 27.6 26 3.03 2.26 to 97.9 Apr, 2001 9 0.27 0.2 0.2 2.62 0.03 to 0.67 Sep, 2001 5 0.11 0.1 0.06 4.22 0.007* to 0.24 Nov, 2001 8 0.52 0.49 0.322 3.30 0.03 to 1.49 Mar, 2002 4 2.18 1.27 1.96 1.67 1.23 to 4.05 Aug, 2002 6 1.58 2.25 0.444 7.35 0.04 to 5.86 Jan, 2003 12 0.23 0.22 0.146 3.62 0.004** to 0.89 July, 2003 8 0.46 1.0 0.054 11.9 0.002* to 2.92 Machine Operator
Time N Mean STD GM GSD Range Nov, 2000 9 1.68 1.61 1.15 2.59 0.26 to 5.53 Apr, 2001 9 0.08 0.07 0.06 2.25 0.02 to 0.18 Sep, 2001 9 0.01 0.02 0.009** 2.07 0.007* to 0.06 Nov, 2001 9 0.10 0.06 0.07 2.2 0.02 to 0.2 Mar, 2002 5 0.37 0.06 0.37 1.18 0.29 to 0.43 Aug, 2002 7 0.03 0.03 0.02 4.0 0.004** to 0.09 Jan, 2003 6 0.003** 0.001 0.001* 2.04 0.001* to 0.004** July, 2003 8 0.002* 0 0.002* 1.0 All LOD (0.002*) Microwave Packer
Time N Mean STD GM GSD Range Nov, 2000 6 2.05 1.69 1.59 2.22 0.44 to 5.32 Apr, 2001 9 0.06 0.04 0.05 1.78 0.025 to 0.17 Sep, 2001 7 0.05 0.11 0.01** 4.12 0.007* to 0.3 Nov, 2001 9 0.07 0.06 0.04 3.76 0.004** to 0.18 Mar, 2002 5 0.34 0.13 0.32 1.44 0.20 to 0.54 Aug, 2002 7 0.02 0.01 0.0148 2.5 0.004* to 0.04 Jan, 2003 8 0.003** 0.002 0.002** 2.05 0.001* to 0.004** July, 2003 9 0.002* 0 0.002* 1.0 All LOD (0.002*)
Microwave Stacker Time N Mean STD GM GSD Range Nov, 2000 7 1.98 2.24 1.32 2.46 0.54 to 6.80 Apr, 2001 9 0.04 0.02 0.04 1.55 0.02 to 0.1 Sep, 2001 7 0.007* 0 0.007* 1 All LOD (0.007*) Nov, 2001 9 0.05 0.04 0.03 3.56 0.004** to 0.1 Mar, 2002 5 0.24 0.06 0.23 1.33 0.15 to 0.32 Aug, 2002 7 0.01 0.009 0.008 4.15 0.001* to 0.024 Jan, 2003 8 0.003** 0.001 0.003** 1.9 0.001* to 0.004** July, 2003 8 0.002* 0 0.002* 1 All LOD (0.002*)
Supervisor
Time N Mean STD GM GSD Range Nov, 2000 0 -- -- -- -- --

Page 22 Health Hazard Evaluation Report No. 2000-0401-2991
Apr, 2001 2 0.03 0 0.03 1.0 All 0.03 Sep, 2001 2 0.007* 0 0.007* 1.0 All LOD (0.007*) Nov, 2001 4 0.08 0.05 0.05 5.35 0.004** to 0.13 Mar, 2002 1 0.21 0 0.21 0 -- Aug, 2002 2 0.02 0.002 0.01 1.19 0.01 to 0.02 Jan, 2003 2 0.002** 0.002 0.002 2.67 0.001* to 0.004** July, 2003 2 0.002* 0 0.002 1.0 All LOD (0.002*)
Quality Control
Time N Mean STD GM GSD Range Nov, 2000 3 0.54 0.3 0.49 1.69 0.33 to 0.89 Apr, 2001 5 0.14 0.18 0.08 3.08 0.02 to 0.46 Sep, 2001 3 0.007* 0 0.007* 1.0 All LOD (0.007*) Nov, 2001 7 0.11 0.05 0.09 2.52 0.01 to 0.19 Mar, 2002 4 0.25 0.02 0.25 1.09 0.22 to 0.27 Aug, 2002 5 0.008 0.007 0.005 3.14 0.001* to 0.02 Jan, 2003 5 0.07 0.15 0.01 6.24 0.004** to 0.34 July, 2003 10 0.002* 0 0.002* 1.0 All LOD (0.002*)
Bag printer
Time N Mean STD GM GSD Range Nov, 2000 1 0.007* -- 0.007* -- -- Apr, 2001 5 0.06 0.09 0.02** 3.73 0.007* to 0.21 Sep, 2001 3 0.007* 0 0.007* 1.0 All LOD (0.007*) Nov, 2001 3 0.007** 0.007 0.006** 2.51 0.004** to 0.01 Mar, 2002 4 0.03 0.03 0.01 4.57 0.002* to 0.08 Aug, 2002 2 0.02 0.02 0.01 3.81 0.004** to 0.03 Jan, 2003 3 0.003** 0.002 0.003** 2.23 0.001* to 0.004** July, 2003 2 0.002* 0 0.002* 1.0 All LOD (0.002*)
Polyethylene Packer
Time N Mean STD GM GSD Range Nov, 2000 2 0.04 0.05 0.02 4.18 0.007* to 0.08 Apr, 2001 4 0.007* 0.0007 0.007* 1.0 All LOD (0.007*) Sep, 2001 4 0.007* 0 0.007* 1 All LOD (0.007*) Nov, 2001 4 0.001* 0 0.001* 1 All LOD (0.001*) Mar, 2002 2 0.01 0.001 0.01 1.1 0.01 to 0.015 Aug, 2002 3 0.001* 0 0.001* 1 All LOD (0.001*) Jan, 2003 6 0.004** 0.001 0.003** 1.76 0.001* to 0.004** July, 2003 1 0.006** -- 0.006** 0.006**
Warehouse
Time N Mean STD GM GSD Range Nov, 2000 3 0.09 0.136 0.04 5.35 0.007* to 0.25 Apr, 2001 5 0.007* 0 0.007* 1.0 All LOD (0.007*) Sep, 2001 4 0.007* 0 0.007* 1 All LOD (0.007*) Nov, 2001 5 0.003** 0.003 0.002** 2.66 0.001* to 0.008 Mar, 2002 4 0.01 0.01 0.006** 3.74 0.002* to 0.03

Health Hazard Evaluation Report No. 2000-0401-2991 Page 23
Aug, 2002 4 0.003** 0.002 0.002 2.23 0.001* to 0.004** Jan, 2003 4 0.001* 0 0.001* 1.0 All LOD (0.001*) July, 2003 4 0.002* 0 0.002* 1.0 All LOD (0.002*)
Maintenance
Time N Mean STD GM GSD Range Nov, 2000 2 0.6 0.27 0.57 1.6 0.41 to 0.79 Apr, 2001 5 0.04 0.04 0.02** 3.03 0.007* to 0.12 Sep, 2001 6 0.007* 0 0.007* 1.0 All LOD (0.007*) Nov, 2001 5 0.03 0.03 0.01 5.37 0.001* to 0.08 Mar, 2002 2 0.01 0 0.01 1.0 All 0.01 Aug, 2002 4 0.005 0.007 0.003** 3.76 0.001* to 0.02 Jan, 2003 4 0.001* 0 0.001* 1.0 All LOD (0.001*) July, 2003 4 0.002* 0 0.002* 1.0 All LOD (0.002*)
Office worker
Time N Mean STD GM GSD Range Nov, 2000 2 0.02** 0.01 0.01** 1.95 0.007* to 0.03 Apr, 2001 6 0.007* 0 0.007* 1.0 All LOD (0.007*) Sep, 2001 5 0.007* 0 0.007 1 All LOD (0.007*) Nov, 2001 7 0.002** 0.002 0.002** 2.05 0.001* to 0.006 Mar, 2002 2 0.01 0 0.01 1.0 All 0.01 Aug, 2002 3 0.001* 0 0.001* 1.0 All LOD (0.001*) Jan, 2003 3 0.004** 0 0.004** 1.0 All LOQ (0.004**) July, 2003 3 0.002* 0 0.002** 1.0 All LOD (0.002*)
Outside Processing
Time N Mean STD GM GSD Range Nov, 2000 3 0.007* 0 0.07* 1.0 All LOD (0.007*) Apr, 2001 4 0.007* 0 0.007 1.0 All LOD (0.007*) Sep, 2001 5 0.007* 0 0.007* 1.0 All LOD (0.007*) Nov, 2001 3 0.001* 0 0.001* 1.0 All LOD (0.001*) Mar, 2002 2 0.004** 0.003 0.003** 2.17 0.002* to 0.006** Aug, 2002 4 0.001* 0 0.001 1.0 All LOD (0.001*) Jan, 2003 4 0.001* 0 0.001 1.0 All LOD (0.001*) July, 2003 4 0.002* 0 0.002 1.0 All LOD (0.002*)
*Designates means and ranges below detectable limits (LOD) and **designates those below quantifiable limits (LOQ). Concentrations below detectable or quantifiable limits were assigned a value of one-half of the LOD or LOQ. STD – Standard deviation; GM – geometric mean, GSD – geometric standard deviation.
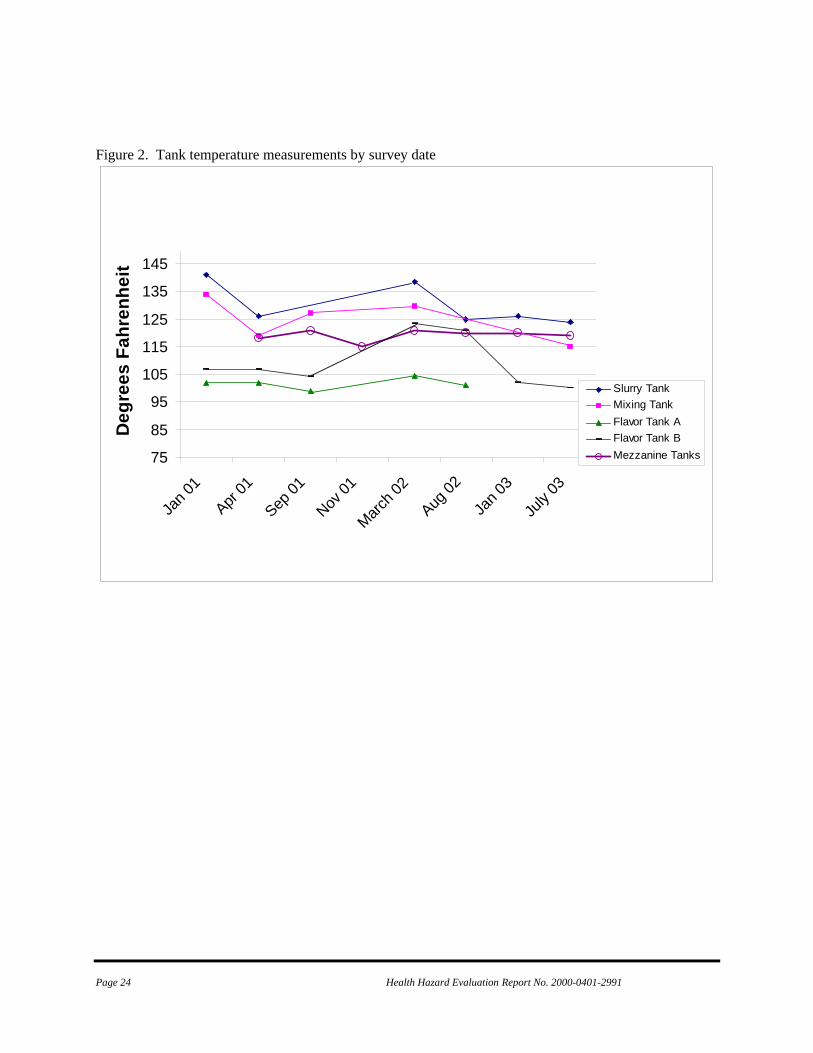
Page 24 Health Hazard Evaluation Report No. 2000-0401-2991
Figure 2. Tank temperature measurements by survey date
75
85
95
105
115
125
135
145
Jan 0
1
Apr
01
Sep
01
Nov
01
Marc
h 02
Aug
02
Jan 0
3
July
03
Deg
rees
Fah
renh
eit
Slurry TankMixing TankFlavor Tank AFlavor Tank BMezzanine Tanks
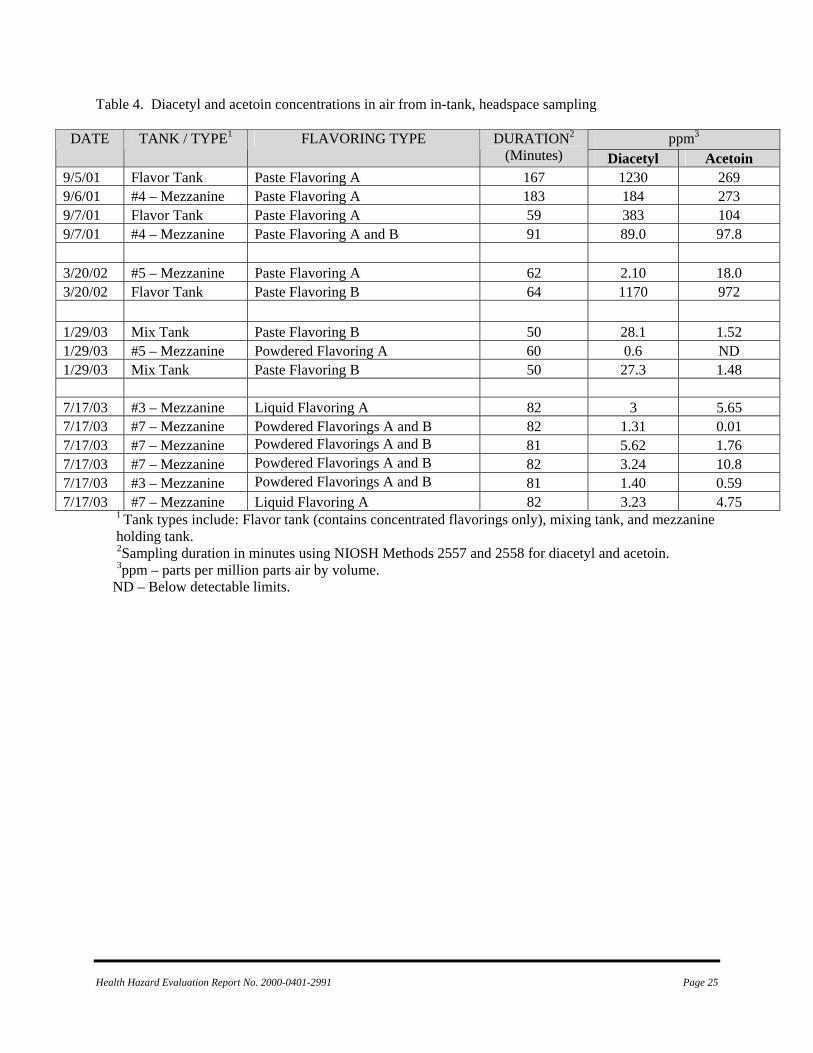
Health Hazard Evaluation Report No. 2000-0401-2991 Page 25
Table 4. Diacetyl and acetoin concentrations in air from in-tank, headspace sampling
ppm3 DATE TANK / TYPE1 FLAVORING TYPE DURATION2 (Minutes) Diacetyl Acetoin
9/5/01 Flavor Tank Paste Flavoring A 167 1230 269 9/6/01 #4 – Mezzanine Paste Flavoring A 183 184 273 9/7/01 Flavor Tank Paste Flavoring A 59 383 104 9/7/01 #4 – Mezzanine Paste Flavoring A and B 91 89.0 97.8 3/20/02 #5 – Mezzanine Paste Flavoring A 62 2.10 18.0 3/20/02 Flavor Tank Paste Flavoring B 64 1170 972 1/29/03 Mix Tank Paste Flavoring B 50 28.1 1.52 1/29/03 #5 – Mezzanine Powdered Flavoring A 60 0.6 ND 1/29/03 Mix Tank Paste Flavoring B 50 27.3 1.48 7/17/03 #3 – Mezzanine Liquid Flavoring A 82 3 5.65 7/17/03 #7 – Mezzanine Powdered Flavorings A and B 82 1.31 0.01 7/17/03 #7 – Mezzanine Powdered Flavorings A and B 81 5.62 1.76 7/17/03 #7 – Mezzanine Powdered Flavorings A and B 82 3.24 10.8 7/17/03 #3 – Mezzanine Powdered Flavorings A and B 81 1.40 0.59 7/17/03 #7 – Mezzanine Liquid Flavoring A 82 3.23 4.75
1 Tank types include: Flavor tank (contains concentrated flavorings only), mixing tank, and mezzanine holding tank.
2Sampling duration in minutes using NIOSH Methods 2557 and 2558 for diacetyl and acetoin. 3ppm – parts per million parts air by volume. ND – Below detectable limits.

Page 26 Health Hazard Evaluation Report No. 2000-0401-2991
Figure 3. Diacetyl and acetoin air concentrations in the mixing room.
0.00
2.00
4.00
6.00
8.00
10.00
12.00
14.00
16.00
18.00
20.00
7:52:3
8
8:08:1
2
8:14:2
8
8:18:5
7
8:23:2
6
8:27:5
4
8:32:2
1
8:36:4
9
8:41:1
7
8:45:4
5
8:50:1
2
8:54:4
0
8:59:0
8
9:03:3
6
9:08:0
3
9:12:3
0
9:16:5
8
9:21:2
6
9:25:5
5
9:30:2
5
9:38:1
1
9:42:4
2
9:47:1
0
9:51:3
8
9:56:0
6
10:00
:33
10:07
:21
TIME
PPM
DiacetylAcetoinMicrowave Mixing Room
August 12, 2002
0.00
0.50
1.00
1.50
2.00
2.50
3.00
3.50
4.00
4.50
5.00
9:27:5
7
9:35:5
7
9:42:5
9
9:49:5
9
12:52
:07
12:59
:07
13:06
:06
13:13
:07
13:20
:06
13:27
:06
13:34
:06
13:41
:06
13:48
:05
13:55
:05
14:02
:04
14:09
:04
14:16
:03
14:23
:03
14:30
:02
14:37
:02
14:44
:01
14:51
:00
14:57
:59
15:04
:58
15:11
:57
15:18
:56
15:25
:56
15:32
:55
15:39
:54
15:46
:54
15:53
:53
16:00
:53
16:07
:52
TIME
PPM
DiacetylAcetoinMicrowave Mixing Room
August 13, 2002
Pouring / pump transfer of butter flavoring

Health Hazard Evaluation Report No. 2000-0401-2991 Page 27
0.00
1.00
2.00
3.00
4.00
5.00
6.00
7.00
8.00
9:25:0
5
9:41:0
8
9:57:1
2
10:13
:16
10:29
:20
10:45
:24
11:01
:27
11:17
:31
11:33
:34
11:49
:37
12:05
:39
12:21
:42
12:37
:44
12:53
:46
13:09
:47
13:25
:49
13:41
:50
13:57
:51
14:13
:51
14:29
:51
14:45
:51
15:01
:50
15:17
:49
15:33
:48
15:49
:48
16:05
:48
TIME
PPM
DiacetylAcetoin
Microwave Mixing RoomJan 30, 2003
Note: The peak exposures for diacetyl and acetoin are from butter flavor handling / mixing operations.

Page 28 Health Hazard Evaluation Report No. 2000-0401-2991
Figure 4. Diacetyl and acetoin air concentrations in the quality control room.
0.00
1.00
2.00
3.00
4.00
5.00
6.00
7.00
8.00
12:22
:00
12:29
:45
12:32
:02
12:34
:19
12:36
:36
12:38
:54
12:41
:11
12:43
:28
12:45
:45
12:48
:02
12:50
:19
12:52
:36
12:54
:53
12:57
:10
12:59
:26
13:01
:42
13:03
:58
13:06
:14
13:08
:30
13:10
:46
13:13
:03
13:15
:21
13:17
:39
13:19
:57
13:22
:15
13:24
:34
13:26
:51
13:29
:08
13:31
:25
13:33
:43
13:39
:38
13:42
:22
TIME
PPM
Diacetyl
Acetoin
Quality Control RoomAugust 12, 2002,
Peak concentrations from microwave bag opening after popping with sampling inlet near bag.
0.00
2.00
4.00
6.00
8.00
10.00
12.00
14.00
8:24:4
2
8:34:0
1
8:41:0
7
8:48:1
2
8:55:1
8
9:02:2
3
9:09:2
9
9:16:3
4
9:23:4
0
9:30:4
5
9:37:5
0
9:44:5
5
9:52:0
0
9:59:0
4
10:06
:09
10:13
:13
10:20
:18
10:27
:24
TIME
PPM
DiacetylAcetoin
Quality Control RoomAugust 14, 2002
Peak concentration from microwave bag opening after popping with sampling inlet near bag.

Health Hazard Evaluation Report No. 2000-0401-2991 Page 29
Figure 5. Diacetyl and acetoin air concentrations in the microwave popcorn packaging area.
0.00
0.20
0.40
0.60
0.80
1.00
1.20
1.40
1.60
1.80
10:10
:14
10:15
:05
10:17
:53
10:20
:41
10:23
:30
10:26
:18
10:29
:06
10:31
:54
10:34
:41
10:37
:29
10:40
:17
10:43
:06
10:45
:54
10:48
:42
10:51
:30
10:54
:17
10:57
:05
10:59
:53
11:02
:40
11:05
:28
11:08
:16
11:11
:03
11:13
:51
11:16
:39
11:19
:27
11:22
:15
11:25
:02
11:30
:12
11:34
:30
11:37
:17
11:40
:05
11:42
:53
11:45
:41
11:48
:29
11:51
:17
11:54
:05
11:56
:52
11:59
:40
12:02
:28
12:05
:17
12:08
:04
12:10
:53
TIME
PPM
DiacetylAcetoin
Microwave Machine Operator - Lines 1 & 2 August 12, 2002
0.00
0.50
1.00
1.50
2.00
2.50
3.00
8:06:1
8
8:25:4
1
8:41:3
4
8:57:2
6
9:13:1
6
9:29:0
6
9:44:5
5
10:00
:44
10:16
:33
10:32
:21
10:48
:09
11:03
:56
11:19
:42
11:35
:28
11:51
:13
12:06
:57
12:22
:42
12:38
:25
12:54
:09
13:09
:52
13:25
:35
13:41
:18
13:56
:59
14:12
:41
14:28
:23
14:44
:05
14:59
:46
TIME
PPM
DiacetylAcetoin
Microwave Machine Operator - Line 2August 15, 2002

Page 30 Health Hazard Evaluation Report No. 2000-0401-2991
Figure 6. Average total dust concentrations by survey date (year/month) and job
0.01
0.1
1
10
00-NOV O1-APR O1-SEP O1-NOV O2-MAR O2-AUG O3-JAN O3-JULY
DATE
mg/
m3
MIXERMACHINE OPPACKERSTACKERQC
Figure 7. Average respirable dust concentrations by survey date (year/month) and job
0.01
0.1
1
00-NOV O1-APR O1-SEP O1-NOV O2-MAR O2-AUG O3-JAN O3-JULY
DATE
mg/
m3
MIXERMACHINE OPPACKERSTACKERQC

Health Hazard Evaluation Report No. 2000-0401-2991 Page 31
Figure 8. Airborne particle size data1 by survey date and location
Mixing Room
0
10
20
30
40
50
60
70
80
90
100
November2000
April 2001
September2001
November2001
August2002
January2003
July 2003
Survey Date
Cum
ulat
ive
Perc
ent L
ess
Than
Siz
e
10 µm 3.5 µm 1 µm
Microwave Packaging
0
10
20
30
40
50
60
70
80
90
November 2000 April 2001 September 2001 November 2001
Survey Date
Cum
ulat
ive
Prec
ent L
ess
than
Siz
e
10 µm 3.5 µm 1 µm

Page 32 Health Hazard Evaluation Report No. 2000-0401-2991
Airborne Particle Size Distribution by Survey Date for Quality Control
0
10
20
30
40
50
60
70
80
90
100
November 2000 September 2001 November 2001
Survey Date
Cum
ulat
ive
Perc
ent L
ess
Than
Siz
e
10 µm 3.5 µm 1 µm
1 Presented as cumulative percent less than aerodynamic size category in micrometers (um).

Health Hazard Evaluation Report No. 2000-0401-2991 Page 33
Figure 9. Total hydrocarbon concentrations1 in air by survey date2 and area.
0.1
1
10
O1-NOV O2-MAR O2-AUG O3-JAN O3-JULY
DATE
mg/
m3
MIXERMACHINE OPPACKERSTACKERQC
1 Total hydrocarbon concentrations in milligrams per cubic meter of air excluding the ketones diacetyl, acetoin, and 2-nonanone. 2 Survey date presented as year and month. mg/m3 – milligrams per cubic meter of air.

Page 34 Health Hazard Evaluation Report No. 2000-0401-2991
Table 5. Characteristics of survey participants by hire date before or after November 4, 2000 (the last day of the first NIOSH medical survey).
Characteristic Cohort-1**
Cohort-2**
Participants, n 146 227 Mean 36.6 28.7 Median 34.5 25.0
Age, years
Range 18-67 18-63 Gender, n (%) Male 70 (48.0) 131 (57.7) Race, n (%) White 132 (90.4) 160 (70.5)
Current 62 (42.5) 123 (54.2) Former 19 (13.0) 22 (9.7)
Smoking status, n (%)
Never 65 (44.5) 82 (36.1) Length of employment, months* 72.5 6.2 *Based on data from each participant’s last survey **Cohort-1: Workers hired prior to Nov 4, 2000; Cohort-2: Workers hired on/after Nov 4, 2000 Table 6. Current worker participation rates by survey.
Survey
New
Participants
Previous Participants
Total Participation
Total Workforce Participation Rate
(%)
Nov 2000 123 --- 123 135 91 Apr 2001 41 65 106 150 71 Aug 2001 40 69 109 150 73 Dec 2001 42 94 136 149 91 Apr 2002 32 85 117 160 73 Aug 2002 25 89 114 150 76 Feb 2003 31 92 123 165 75 Aug 2003 39 97 136 155 88 Table 7. Participants by number of surveys and hire cohort
*Cohort-1: Workers hired prior to Nov 4, 2000; Cohort-2: Workers hired on/after Nov 4, 2000
Number of Surveys Cohort-1* (n=146)
Cohort-2* (n=227)
Total
Participants (N=373)
1 45 141 186 2 12 45 57 3 10 18 28 4 12 10 22 5 10 9 19 6 12 3 15 7 16 1 17 8 29 0 29
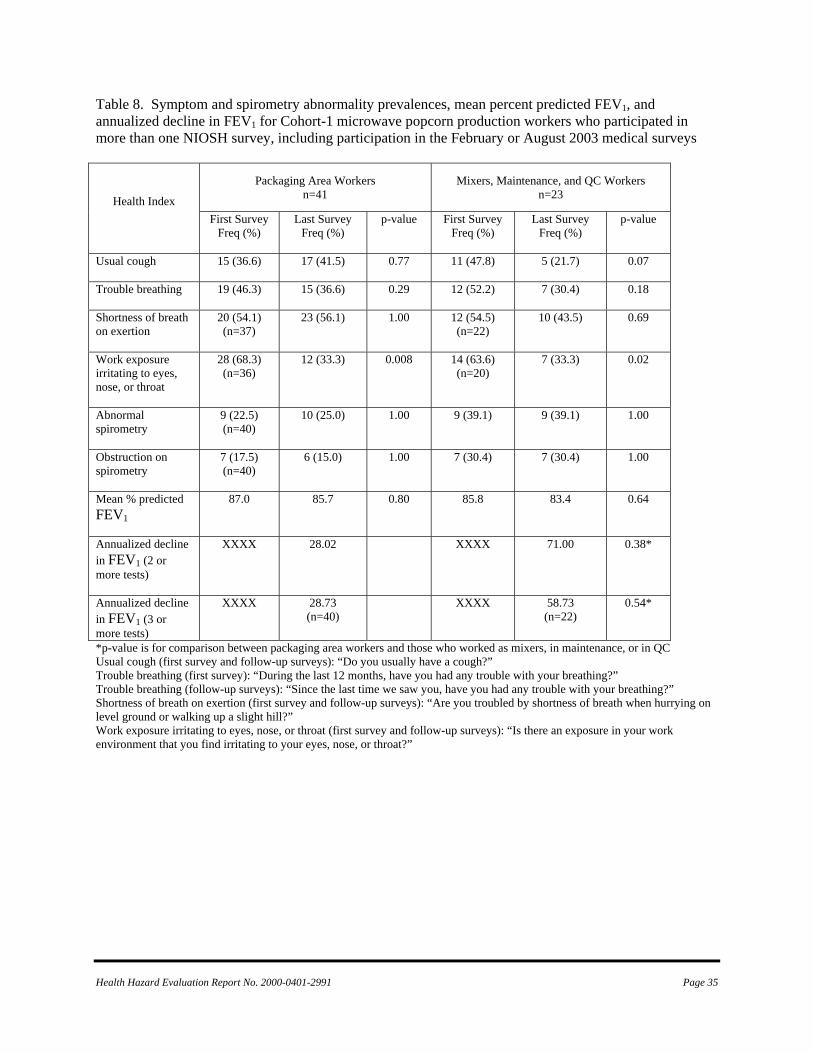
Health Hazard Evaluation Report No. 2000-0401-2991 Page 35
Table 8. Symptom and spirometry abnormality prevalences, mean percent predicted FEV1, and annualized decline in FEV1 for Cohort-1 microwave popcorn production workers who participated in more than one NIOSH survey, including participation in the February or August 2003 medical surveys
*p-value is for comparison between packaging area workers and those who worked as mixers, in maintenance, or in QC Usual cough (first survey and follow-up surveys): “Do you usually have a cough?” Trouble breathing (first survey): “During the last 12 months, have you had any trouble with your breathing?” Trouble breathing (follow-up surveys): “Since the last time we saw you, have you had any trouble with your breathing?” Shortness of breath on exertion (first survey and follow-up surveys): “Are you troubled by shortness of breath when hurrying on level ground or walking up a slight hill?” Work exposure irritating to eyes, nose, or throat (first survey and follow-up surveys): “Is there an exposure in your work environment that you find irritating to your eyes, nose, or throat?”
Packaging Area Workers n=41
Mixers, Maintenance, and QC Workers n=23 Health Index
First Survey Freq (%)
Last Survey Freq (%)
p-value First Survey Freq (%)
Last Survey Freq (%)
p-value
Usual cough
15 (36.6) 17 (41.5) 0.77 11 (47.8) 5 (21.7) 0.07
Trouble breathing
19 (46.3) 15 (36.6) 0.29 12 (52.2) 7 (30.4) 0.18
Shortness of breath on exertion
20 (54.1) (n=37)
23 (56.1) 1.00 12 (54.5) (n=22)
10 (43.5) 0.69
Work exposure irritating to eyes, nose, or throat
28 (68.3) (n=36)
12 (33.3) 0.008 14 (63.6) (n=20)
7 (33.3) 0.02
Abnormal spirometry
9 (22.5) (n=40)
10 (25.0) 1.00 9 (39.1) 9 (39.1) 1.00
Obstruction on spirometry
7 (17.5) (n=40)
6 (15.0) 1.00 7 (30.4) 7 (30.4) 1.00
Mean % predicted FEV1
87.0 85.7 0.80 85.8 83.4 0.64
Annualized decline in FEV1 (2 or more tests)
XXXX
28.02 XXXX
71.00 0.38*
Annualized decline in FEV1 (3 or more tests)
XXXX
28.73 (n=40)
XXXX
58.73 (n=22)
0.54*

Page 36 Health Hazard Evaluation Report No. 2000-0401-2991
Table 9. Symptom prevalences and spirometry results in microwave popcorn packaging-area workers in Cohort-2 who participated in more than one survey.
Health Index First survey
n=76 Freq (%)
Last survey
n=76 Freq (%)
p-value
Usual cough
17 (22.4) 20 (26.3) 0.51
Trouble breathing
12 (15.8) 9 (11.8) 0.61
Shortness of breath on exertion
26 (34.2) 20 (26.3) 0.26
Work exposure irritating to eyes, nose, or throat
19 (25.0) 21 (28.0) 0.83
Abnormal spirometry
11 (14.5) 11 (14.5) 1.00
Obstruction on spirometry
4 (5.3) 5 (6.7) 1.00
Mean % predicted FEV1
96.8 95.7 0.64
Annualized decline in FEV1 (2 or more surveys)
XXXX 92.32
Annualized decline in FEV1 (3 or more surveys)
XXXX 17.63 (n=32)
Usual cough (first survey and follow-up surveys): “Do you usually have a cough? “ Trouble breathing (first survey): “During the last 12 months, have you had any trouble with your breathing?” Trouble breathing (follow-up surveys): “Since the last time we saw you, have you had any trouble with your breathing?” Shortness of breath on exertion (first survey and follow-up surveys): “Are you troubled by shortness of breath when hurrying on level ground or walking up a slight hill?” Work exposure irritating to eyes, nose, or throat (first survey and follow-up surveys): “Is there an exposure in your work environment that you find irritating to your eyes, nose, or throat?” Table 10. FEV1 declines of 300 ml and/or 10% from baseline in workers who had three or more spirometry tests.
Cohort-1 Cohort-2 All workers 19* / 88 (22%) 3 / 41† (7%) Worked as mixer after November 2000
4 / 5 0 / 4
Worked in QC laboratory after November 2000
2 / 8 0 / 1
*5 of these 19 workers stopped working in microwave popcorn production in 2001 and had spirometry tests after that time; 3 of these 5 continued to have excessive declines. †0 / 9 workers who started work after January 2002 had excessive FEV1 declines.

Health Hazard Evaluation Report No. 2000-0401-2991 Page 37
APPENDICES Appendix A October 23, 2000 HETA 2000-0401
Interim I Mr. Jim Cook Plant Manager Gilster Mary Lee Company 311 West Mercer Jasper, Missouri 64755 Dear Mr. Cook: This letter provides interim exposure control recommendations for workers in the microwave popcorn production areas at Gilster Mary Lee Company in Jasper, MO. These recommendations are provided through an ongoing National Institute for Occupational Safety and Health (NIOSH) Occupational Health Evaluation (HETA 2000-0401) on the respiratory health status of plant workers. This evaluation was undertaken in response to a request for technical assistance received from the Missouri State Department of Health regarding reported cases of bronchiolitis obliterans among some of the former plant workers. The recommendations provided below are based on the two NIOSH site visits to Gilster Mary Lee Company on August 31st and September 26th, 2000: 1) Respiratory Protection - Workers in the ingredient mixing area should use respiratory protection when mixing ingredients or observing any of the mixing / holding tank operations. The minimum recommendation for respiratory protection would include a half-mask, non-powered, air purifying particulate filter respirator. The cartridges used with this respirator should be a NIOSH approved P-100 filter cartridge. These respirators should be used as part of a formal respiratory protection program as specified by 29 CFR 1910.134 (Copy enclosed).
2) General Dilution Ventilation - Maximize the use of existing general dilution ventilation in the microwave popcorn areas of the plant. This would include operating the wall exhaust fans and the outside air intakes during each production shift to the fullest extent possible. Keep the doors to the ingredients mixing area open and use the portable floor fans to direct air from this room toward the axial exhaust fans on the north wall of the microwave popcorn area. 3) Local Exhaust Ventilation - Operate the local exhaust ventilation system in the ingredients mix room whenever salt is mixed. The exhaust ductwork from this local exhaust ventilation system should be ducted directly outside the building following the bag house filtration unit. (The current system exhausts the air inside, in front of an exhaust fan on the north wall of the plant). The exhaust port should be positioned to prevent any reintrainment into the building through existing outside air intakes. Additionally, the seals for the bag-house filtration system shake-out point should be inspected regularly and maintained to prevent reaerosolization of salt

Page 38 Health Hazard Evaluation Report No. 2000-0401-2991
particulate into plant air during shake-out operations. (Note: Any recommendations for additional engineering exposure controls in the ingredients mixing room will be based on subsequent findings from this evaluation). Please call if you have any questions regarding these recommendations; my telephone number is 304-285-5959. As noted previously, these recommendations are provided on an interim basis. A final summary of the medical and environmental findings from this evaluation, including final recommendations, will be provided at the conclusion of this project. In closing, thank you and all the workers at Gilster Mary Lee Company for the outstanding support provided to date on this evaluation.
Sincerely,
Greg Kullman, Ph.D., CIH Health Evaluations and Technical Assistance Program Field Studies Branch Division of Respiratory Disease Studies

Page 39 Health Hazard Evaluation Report No. 2000-0401-2991
Appendix B

Page 40 Health Hazard Evaluation Report No. 2000-0401-2991

Page 41 Health Hazard Evaluation Report No. 2000-0401-2991

Page 42 Health Hazard Evaluation Report No. 2000-0401-2991
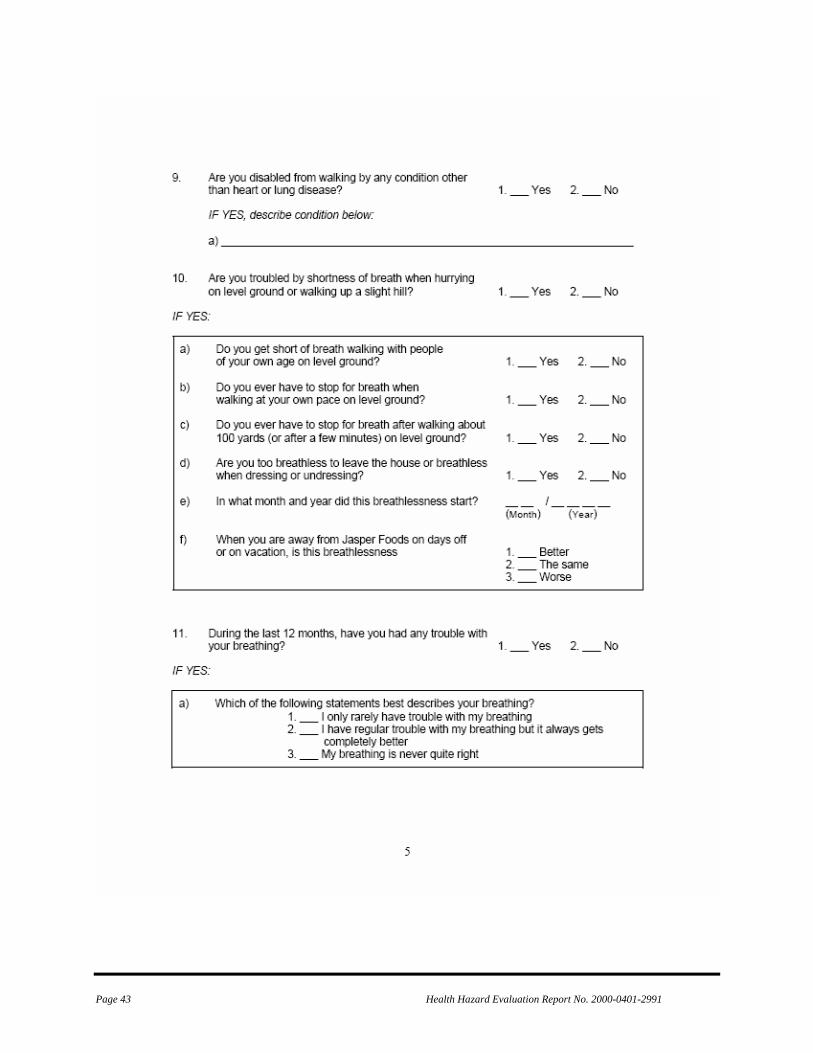
Page 43 Health Hazard Evaluation Report No. 2000-0401-2991

Page 44 Health Hazard Evaluation Report No. 2000-0401-2991

Page 45 Health Hazard Evaluation Report No. 2000-0401-2991

Page 46 Health Hazard Evaluation Report No. 2000-0401-2991

Page 47 Health Hazard Evaluation Report No. 2000-0401-2991

Page 48 Health Hazard Evaluation Report No. 2000-0401-2991

Page 49 Health Hazard Evaluation Report No. 2000-0401-2991

Page 50 Health Hazard Evaluation Report No. 2000-0401-2991

Page 51 Health Hazard Evaluation Report No. 2000-0401-2991

Page 52 Health Hazard Evaluation Report No. 2000-0401-2991

Page 53 Health Hazard Evaluation Report No. 2000-0401-2991

Page 54 Health Hazard Evaluation Report No. 2000-0401-2991

Page 55 Health Hazard Evaluation Report No. 2000-0401-2991

Page 56 Health Hazard Evaluation Report No. 2000-0401-2991
This page was intentionally left blank.

Page 57 Health Hazard Evaluation Report No. 2000-0401-2991
Appendix C
NIOSH Investigation of Gilster Mary Lee HETA # 2000-0401
Technical Assistance to Missouri Department of Health
Interim Report
August 22, 2001
Ahmed Gomaa, MD, ScD Greg Kullman, PhD, CIH
Kathleen Fedan, BS Paul Enright, MD
Patricia Schleiff, MS Patrick E. Phillips, DVM, MSPH1 Eduardo Simoes, MD, MSc, MPH1
Kathleen Kreiss, MD
1Missouri Department of Health, Office of Epidemiology

Page 58 Health Hazard Evaluation Report No. 2000-0401-2991
SUMMARY Nine former workers from a microwave popcorn packaging plant were reported to have a severe lung disease, bronchiolitis obliterans, but no recognized causes of this rare condition were evident in the plant. At the request of the Missouri Department of Health, staff of the National Institute for Occupational Safety and Health have investigated exposures and health outcomes at the company. Industrial hygiene assessments divided the plant into four work areas based on anticipated exposure levels to dust and volatile organic chemicals from artificial butter flavorings. Respirable dust concentrations from salt dumping operations were about 10-fold higher in the area in which flavorings were mixed compared to the office and outdoor work areas. Diacetyl, the predominant ketone in the plant, was present in concentrations 17 times higher in the mixing area compared to the microwave packaging area, 100 times higher compared to the warehouse and polyethylene packaging area, and 1000 times higher compared to the office and outdoor areas. In late October 2000, 117 current workers (87%) participated in health questionnaire interviews, spirometry, diffusing capacity, and chest x-rays. Plant employees had 2.6 times the rates of chronic cough and shortness of breath compared to national data, adjusted for smoking and age group; younger employees who had never smoked had rates about five times higher than expected from national rates. Overall, plant employees had 3.3 times the rate of obstructive spirometry abnormalities compared to national adjusted rates; never smokers had 10.8 times the national expected rate. Worker reports of physician-diagnosed asthma and chronic bronchitis were about twice as frequent as expected from national data, with a 3.3-fold excess of chronic bronchitis in never smokers. Microwave popcorn production workers had statistically higher rates of regular trouble with breathing and unusual fatigue, compared with workers in two lower exposure groups. Strong exposure-response relationships existed between quartile of estimated cumulative exposures to diacetyl and respirable dust and frequency and degree of airway obstruction. The survey findings are best explained by work-related bronchiolitis obliterans in relation to exposures arising in the mixing room but widely disseminated through other areas of the plant. We recommend extensive primary, secondary, and tertiary prevention efforts for all current and former workers.

Page 59 Health Hazard Evaluation Report No. 2000-0401-2991
ABBREVIATIONS CFU Colony forming units DLCO Diffusion capacity of lung to carbon monoxide FEV1 Forced expiratory volume in one second FVC Forced vital capacity MMAD Mass median aerodynamic diameter MEK Methyl ethyl ketone NIOSH National Institute for Occupational Safety and Health NHANES III National Health and Nutrition Examination Survey III OSHA Occupational Safety and Health Administration PEL Permissible exposure limit p Probability ppm Parts per million STD Standard deviation TWA Time-weighted average VOC Volatile organic compound

Page 60 Health Hazard Evaluation Report No. 2000-0401-2991
BACKGROUND
In May 2000, nine former workers at a factory that mixes and packages microwave popcorn were reported to the Missouri Department of Health by an occupational medicine physician to have bronchiolitis obliterans, a severe lung disease characterized by fixed airflow obstruction. Four of these workers were placed on a lung transplant list. Many of the workers had no history of smoking. On the basis of these cases, the Missouri Department of Health (MDOH) requested technical assistance from the Centers for Disease Control and Prevention=s National Institute for Occupational Safety and Health (NIOSH) in August of 2000 to determine whether exposures at the popcorn plant contributed to the disease and whether other former and current workers had developed this illness. In August and September of 2000, NIOSH investigators made site visits to the plant and conducted initial investigations of the environmental conditions and health concerns. These investigations consisted of interviews with current and former workers, inspection of the plant and processes, review of company environmental records, and some preliminary sampling for contaminants in air and bulk materials. Index cases among former workers in this plant had been diagnosed during the period of 1992-2000, and none reported an incident of presumed overexposure that preceded their symptoms. Among diagnosed cases, duration of employment before symptom onset ranged from 3 months to 3 years. Five of the diagnosed cases worked as mixers for flavoring agents of microwave popcorn, but four had only worked on the microwave popcorn packaging lines. In nearly all cases, chronic and progressive shortness of breath, persistent cough, and unusual fatigue preceded the diagnosis by several months to several years. However, several affected individuals described other symptoms, such as phlegm, wheezing, episodes of mild fever, and generalized aches. One mixer reported severe skin dermatitis. Most diagnosed cases had fixed airflow obstruction, resulting in low forced expiratory volume (FEV1) (14% of predicted in one case) and air trapping (increased residual volume and total lung capacity), normal chest x-rays, and normal diffusing capacity. Pulmonary function testing in the early stages of the disease was unavailable, and mis-diagnosis and referral to specialized centers for final diagnosis were common. In almost every diagnosed case, the symptoms slowly improved when the affected worker stopped working at the popcorn plant, but lung function remained abnormal. From October 30 to November 3, 2000, NIOSH conducted a medical survey of current plant workers. In November 2000, NIOSH conducted quantitative industrial hygiene surveys. Respirator training and fit testing were provided for workers in the microwave production mixing area which had the highest flavoring and particulate exposures. Animal exposure studies were also begun at NIOSH. In December 2000, NIOSH provided notification letters to all participants in the medical survey for test results including spirometry, chest x-rays, and diffusing capacity tests. NIOSH supported state and county health department efforts to vaccinate workers against influenza and pneumonia. On the basis of preliminary clinical findings, NIOSH issued interim control recommendations in December 2000 for respirator use by all workers in the microwave production area, pending the implementation of engineering controls. In January 2001, NIOSH investigators assisted the company with the planning and selection of new engineering controls. Before and after industrial hygiene measurements on January 18-19 showed that the initial engineering control changes recommended by NIOSH were effective in reducing concentrations of organic vapors in plant air. In March 2001, NIOSH met with company officials and consultants and with the Missouri Department of Health to review the preliminary survey results from this evaluation and to discuss future actions.

Page 61 Health Hazard Evaluation Report No. 2000-0401-2991
Following this meeting, the company invited NIOSH to perform recommended longitudinal medical and environmental follow-up studies at the plant over an 18-month interval. These surveys were initiated the first week in April. NIOSH also prepared a fact sheet for plant workers describing NIOSH=s efforts, preliminary findings, and future plans. This fact sheet was distributed to plant workers prior to the April surveys. Investigation of this outbreak is continuing through longitudinal medical and environmental follow-up studies at the plant, animal exposure studies, and evaluation of other microwave popcorn plants. This interim report provides a summary of the findings available to date from this study. PROCESS DESCRIPTION Gilster Mary Lee packages popcorn for both national and international distribution under private label. The plant has been in operation since 1983, formerly as Jasper Popcorn Company and as Gilster Mary Lee Corporation since 1999. The plant produces packaged popcorn kernels and since 1986, microwave popcorn. The plant receives whole kernel corn largely from grain silos in Missouri and Nebraska. Three to four hybrid varieties are processed; genetically engineered corn is not processed at the plant. The popcorn arrives by truck and is air cleaned after unloading. An organo-phosphate insecticide is applied, and the corn is transferred by conveyor to plant silos. The corn is typically stored in the silos for 2 months or less prior to processing. From the silo, the corn is processed by screening and by air cleaning on a gravity table. A magnet is used to remove any metal objects in the corn. A worker (outside processing job category) oversees this operation. Following this processing, the popcorn is sent to either the microwave packaging area or the polyethylene packaging area. In the polyethylene area, the corn is directly packaged in polyethylene bags by machine on the polyethylene line, with no flavorings or food additives. Typically three workers (packers and stackers) operate the polyethylene line with one supervisor present. There is one polyethylene packaging line at this plant, and it is typically operated daily for two shifts. After packaging, the bags are boxed, stacked, wrapped in plastic, and transported to the warehouse by fork lift. A majority of the corn processed at this plant is packaged in the microwave production area, which encompasses a mixing room and packaging lines to produce microwave bags containing popcorn and flavorings. These flavorings include soybean oil, salt, artificial butter flavorings and coloring agents. The flavoring agents are batch mixed in the mixing room, which opens onto the large room with seven packaging lines. The mixing room has a salt dump station, which augers salt into a heated tank of oil to which other flavorings were added by raising the lid. Typically one worker, the mixer, operates the mixing room per shift. Following mixing, the flavorings mixture is piped as a liquid to holding tanks above the microwave popcorn packaging lines. These tanks are maintained at a temperature above 108 degrees Fahrenheit to keep the flavorings mixture from solidifying. On the line operations, the popcorn and flavorings are automatically added to the popcorn bags by a bartell machine; one worker, the machine operator, oversees this process. After the popcorn and flavorings have been added, the bags of popcorn are sealed, labeled and automatically enclosed in a plastic wrap on the packaging line. The bags of popcorn are next placed into boxes for distribution to market. Two different packing stations are operated on each line, and small boxes are placed in larger boxes in the packaging operations. Approximately three workers per line complete the packaging operations. Following packaging, the boxes of microwave popcorn are stacked on pallets and enclosed in plastic wrap. One worker is typically involved in stacking
Page 62 Health Hazard Evaluation Report No. 2000-0401-2991
operations for one or two of the seven lines. The microwave area typically operates three shifts per day and five-seven days per week depending upon the season. After the boxes of popcorn are stack-wrapped on pallets, they are transported from the microwave area to a large warehouse by workers operating fork lifts. These workers also load the product onto trucks in the warehouse loading dock. The plant has quality control operations for both the microwave popcorn and polyethylene products. Maintenance personnel keep the lines operating. Management and clerical workers are located in an office physically removed from the microwave packaging area. The plant has general dilution ventilation, although prior to this evaluation, these systems were not operated in the winter when ambient temperatures were low. In the summer of 1999, a local exhaust ventilation system was added to the microwave mixing room to control salt dumping operations. Roof air intake systems were also added to the microwave area in the summer of 1999. In January 2001, axial dilution ventilation wall fans, continuous use of the local exhaust ventilation fan on the salt dump station in the microwave mixing room, and closing of the large door to the microwave mixing room were initiated to better contain and exhaust contaminants generated during mixing and production operations. OBJECTIVES In response to this technical assistance request from the Missouri Department of Health, the following objectives were the focus of this project: 1. Investigate the occurrence of possible occupational respiratory illness and symptoms among the popcorn plant employees via the use of respiratory questionnaires, spirometry, chest X-ray, and carbon monoxide diffusion capacity. 2. Identify processes or agents associated with respiratory disease. Based on the sentinel (index) cases and information from NIOSH walk-through surveys, respiratory exposures from flavors, individual organic chemicals, and salt dust were selected as a focus of these evaluations. 3. Determine exposure controls and prevention methods needed based on any identified associations between exposures and respiratory effects or based on worker over-exposures by existing occupational exposure standards. 4. Recommend preventive health actions for the company, health department, local physicians, and workers. 5. Evaluate the effectiveness of interventions in preventing respiratory disease. 6. Disseminate the results and recommendations to encourage prevention strategies in similar work environments nationwide. METHODS Environmental assessment. Industrial hygiene sampling measured contaminants generated by the production of popcorn and microwave popcorn with both full-shift, personal and area samples, and for some gases, partial shift and grab samples (Table 1). We sampled during four separate visits: a

Page 63 Health Hazard Evaluation Report No. 2000-0401-2991
preliminary walk-through survey (August), a qualitative environmental survey (September), a cross-sectional industrial hygiene survey (November), and a follow-up industrial hygiene survey (January). The walk-through survey provided the opportunity to become familiar with the plant processes and materials and to assess potential process contaminants for later evaluation. During the subsequent semiquantitative environmental survey, we conducted area sampling for airborne total dusts, total endotoxins, and organic vapors. We collected bulk samples of corn and soybean oil for microbiological analysis. The sampling results from this survey helped to refine the potential analytes for the subsequent quantitative industrial hygiene survey. Diacetyl, a ketone with butter flavor characteristics, was the predominant volatile organic compound. The cross-sectional industrial hygiene survey included personal sampling for respirable dusts and qualitative organic vapors in air. We conducted area sampling for a number of analytes including airborne total and respirable dusts (using both high and low volume sampling), particle size distributions, volatile organic compounds in air, ketones (diacetyl, acetoin, nonanone, and methyl ethyl ketone), acetylaldehyde, and acetic acid. We measured temperature and relative humidity. Environmental analytes collected during the January follow-up included personal and area sampling for ketones. Medical survey. Company management distributed announcements of the NIOSH survey, and company staff scheduled current employees who volunteered to participate in the survey during their work shift. Trained NIOSH interviewers administered a questionnaire in a NIOSH trailer located onsite. The questionnaire consisted of a subset of standardized questions on demographic information, respiratory symptoms, and tobacco use (Ferris, 1978); details of current and past duties, work exposures, and practices at the microwave popcorn plant; previous work history; health history; additional acute and chronic respiratory, irritant, and constitutional symptoms; and respirator use (Table 2). The questionnaire also recorded duration and changes of symptoms away from the work environment; change of job, duties, or work area due to breathing problems; physician diagnoses pertinent to the outbreak; and subjective classification of work environment changes after ventilation was added in mid-1999. Symptoms and job history data were updated on an interviewer-administered, computer-assisted follow-up questionnaire in April 2001, including subjective assessment of the work environment after ventilation changes in January 2001. Qualified technicians performed pulmonary function tests and obtained chest x-rays, which were taken as objective health outcome measures. Spirometry. We used a dry rolling-seal spirometer interfaced to a personal computer to record at least 3 maximal expiratory maneuvers. Testing procedures conformed to the American Thoracic Society's recommendations for spirometry (ATS, 1995). We selected the largest forced vital capacity (FVC) and forced expiratory volume in one second (FEV1) for analysis. We calculated predicted values and lower limits of normal using reference values (Hankinson, 1999) generated from the third National Health and Nutrition Examination Survey (NHANES III). Test results were compared to the lower limit of normal values to identify participants with abnormal spirometry patterns of obstruction and restriction (ATS, 1991). We defined obstruction as a FEV1 /FVC% below the lower limit of normal and assessed reversibility with bronchodilator, using a 12%/200 milliliter FEV1 improvement criterion. We defined restriction as a low FVC and normal FEV1 /FVC%. DLCO. We used commercial systems purchased from Jaeger and Medical Graphics to measure the carbon monoxide diffusion capacity of the lung (DLCO), which reflects the ease with which a gas passes across the lung tissue and into the bloodstream. Using standard guidelines for performing the test (ATS, 1995), we compared DLCO results to reference values determined from a sample of non-smoking adults from the state of Michigan (Miller, 1983) and defined them as abnormal if the observed DLCO was less than the calculated lower limit of normal.

Page 64 Health Hazard Evaluation Report No. 2000-0401-2991
Chest x-rays. We took posterior-anterior chest x-rays on a full-size (14 x 17 inch) film. Two NIOSH-certified B Readers (physicians trained and certified in the classification of chest x-rays for the pneumoconioses) independently classified the films according to the current international classification system for pneumoconiosis (ILO, 1980), without knowledge of the participant=s age, occupation, symptoms, smoking history, or pulmonary function abnormalities. Statistical analyses. We used a double entry verification technique on responses from participants and used program modules provided by the SAS Institute, Inc. (SAS, 1990) for all statistical analyses. Outcome measures, exposure measures, and confounders were defined both before and after examination of the data. We calculated averages, standard deviations (STD), and prevalence estimates. We used chi-square and Fisher=s exact methods to test categorical data and Student=s t test and Pearson=s correlation to evaluate continuous data. We considered probability (p) values less than 0.05 to represent associations unlikely to be due by chance. Exposure estimates. We divided the worker population into four groups based on anticipated exposure levels: office and outdoor workers (the Acontrol@ or internal reference group with expected very low exposures); warehouse, polyethylene, maintenance, and quality control workers (with low exposures); microwave packaging workers (moderate exposures); and mixers (high exposures). In each of the work groups, we averaged the measurements for jobs sampled within that area as a representative measure of current exposure. We assessed relations between current exposure group and health outcome. To protect confidentiality of worker symptoms and pulmonary function abnormalities in the three mixers, we aggregated their results for presentation here with the remainder in microwave production. We estimated cumulative exposures for each participant by summing the products of time worked in each of the four exposure groups and mean exposure for that group. To assess exposure-response relations for respirable dust and for diacetyl, we ranked participants by estimated cumulative exposures, divided them into quartiles, and compared rates of health outcomes among quartiles of the cumulative exposure metrics. RESULTS Environmental Assessment, September 2000 In the initial semi-quantitative sampling in September 2000, the area total dust concentration from the microwave mixing room was the highest at 0.73 mg/m3. The total dust concentration from the microwave machine operator area on line 1 was 0.2 mg/m3, and the concentration from the microwave packaging area for line 1 was 0.15 mg/m3. Scanning electron micrographs of the salt used in the microwave popcorn flavoring mixture suggest that much of the salt has a physical diameter below 10 micrometers and, consequently, would contain a substantial respirable fraction (Figure 1A). Scanning electron microscopic evaluation of airborne samples collected on glass slides, when the lid of a flavoring holding tank was lifted, suggested the presence of salt and oil particles in plant air (Figure 1B). Qualitative sampling for volatile organic compounds (VOCs) in the air detected over 100 different VOCs in the microwave processing area (Figure 2); the predominant compounds identified in the microwave

Page 65 Health Hazard Evaluation Report No. 2000-0401-2991
mixing room included the ketones diacetyl, methyl ethyl ketone (MEK), acetoin, and 2-nonanone, and acetic acid. The endotoxin concentration from the microwave mixing room was low at 56 EU/m3. The concentration from the line 1 machine operator location was 58 EU/m3 and from the line 1 packaging area, 26 EU/m3. Concentrations of fungi and bacteria were below detectable limits [< 2 colony forming units (CFUs) per milliliter] in the bulk sample of soybean oil and in the bulk samples of popcorn obtained following cleaning processes (< 7 CFU/gram). While some spores were detected in plant air, they were not common. There is no Occupational Safety and Health Administration (OSHA) permissible exposure limit (PEL) for endotoxins or culturable fungi and bacteria (CFR, 1998). NIOSH review of company sampling records for aflatoxin in bulk corn in the year 2000 indicated that the samples were all below detectable limits by thin layer chromatography at the University of Missouri. Plant management reported that aflatoxins had not been detected in any of the corn samples submitted for analysis in previous years. There is no OSHA PEL for aflatoxins (CFR, 1998). Industrial Hygiene Survey, November 2000 Dust. Total dust concentrations [full-shift, time-weighted averages (TWAs)] from the 55 area samples ranged from below detectable concentrations (< 0.007 mg/m3) to a high of 1.0 mg/m3, with a mean concentration of 0.24 mg/m3 (STD 0.19 mg/m3). The non-combustible fraction of five high volume airborne total dust samples ranged from approximately 15 to 30 percent by weight (average 21%). Microscopic examination of the non-combustible fraction showed generally higher salt content in the mixing room samples. The 140 TWA respirable dust samples had a mean of 0.13 mg/m3 (STD 0.11 mg/m3), and the personal and area samples had similar means and standard deviations. The average total and respirable dust concentrations were highest in the microwave areas (Figure 3), with the highest mean concentrations in the mixing room. In mixing, the mean respirable dust concentration of seven personal samples was 0.38 mg/m3 (STD 0.22 mg/m3). These respirable and total dust concentrations are below the existing OSHA PEL for particulates not otherwise regulated including total dusts (15 mg/m3) and respirable dusts (5 mg/m3); however, these standards may not be appropriate to protect plant workers considering the respiratory disease at this plant (CFR, 1998). Particle size distributions from cascade impactors in the microwave mixing room were unimodal, with mass median aerodynamic diameters (MMADs) ranging from 2.3 to 5 micrometers, expressed as geometric means (Table 3). The nine particle size distributions from the microwave machine operators, packers, and stackers locations had a MMAD of 2.5 or less; most of the samples appeared unimodal. The polyethylene packaging lines and the warehouse had larger particle size distributions with MMADs ranging from 5 to 8.5 micrometers (Figures 4-5). Ketones and other organic compounds. Thermal desorption tube samples indicated that several ketone compounds (diacetyl, acetoin, nonanone, and MEK) were the predominant hydrocarbons in the microwave popcorn production area (Table 4). The 53 area samples for diacetyl ranged from below detectable limits to 98 parts per million (ppm) parts air by volume, with a mean of 8.1 ppm (STD 18.5 ppm). Acetoin concentrations were lower (mean 1.0 ppm). Only five of the 52 nonanone samples had quantifiable levels with the highest concentration being 0.06 ppm. The two samples analyzed for MEK had concentrations of 3.1 and 4.7 ppm. The OSHA PEL for MEK is 200 ppm as a TWA. The average ketone concentrations were highest in the microwave mixing room (Figure 6B), where the 10 area samples had a mean diacetyl concentration of 37.8 ppm (STD 27.6 ppm) and a mean acetoin

Page 66 Health Hazard Evaluation Report No. 2000-0401-2991
concentration of 4.1 ppm (STD 4.1 ppm). Diacetyl was also detected in areas outside of microwave production, including the polyethylene line area, warehouse, and office areas (Figure 6A); however, most of the samples from these locations were below quantifiable levels. Acetic acid was detected in samples from the microwave mixing and packaging, maintenance, and quality control areas. The area airborne TWA acetic acid concentrations on 49 samples from these areas ranged from below detectable limits (< 0.04 ppm) to a high of 12.4 ppm, with a mean concentration of 1.4 ppm (STD 2.3 ppm). The highest acetic acid concentrations were measured in the mixing area, with a mean of 5.5 ppm (STD 3.2 ppm) from eight samples. This was the only area with a TWA concentration in excess of 10 ppm, the OSHA PEL for acetic acid (CFR, 1998). In the microwave packaging area, 24 samples had a mean of 2.7 ppm (STD 2.7). Acetaldehyde concentrations were low, ranging from below detectable limits (approximately 0.007 ppm) to 0.1 ppm. The OSHA PEL for acetaldehyde is 200 ppm as a TWA (CFR, 1998). Summary exposures by work area. Average current exposure levels by work area for dust and diacetyl are summarized in Table 5, indicating that mixing area employees had 1000-fold exposures to diacetyl compared to office and outside workers, 100-fold exposures compared to polyethylene packaging, warehouse, maintenance, and quality control workers, and about 17-fold compared to other microwave production workers. The gradient of exposure for respirable dust was less than 10-fold between least and most exposed groups. Medical Survey Results Worker characteristics. Of approximately 135 employees working at the plant in late October 2000, 117 (87%) completed a questionnaire (Table 6). The median age of the respondents was 36 years (range: 18-67). Most (91%) were white, five were Hispanic, two were black, two were Native American, and one a Pacific Islander. The majority were current or former cigarette smokers. The night workforce was younger and had shorter tenure in the plant. Length of employment ranged from 1 month to 17 years, 7 months, with a median of 4 years, 5 months. All employees worked full-time at 36-50 hours per week, with a median of 40 hours. Sixty-eight percent of workers currently worked in microwave popcorn production, including mixing and packaging areas (Table 6). Eight workers reported having changed their jobs because of breathing difficulties; two associated their breathing difficulties with the polyethylene production area and six with the microwave production area. Of the six in microwave popcorn production, four were either mixers or training to be mixers when they made a job change. Seven of the eight reported that their breathing improved after their job change. Cumulative exposures for diacetyl ranged from 0 to 110 ppm-years. The cut points for the four quartiles of cumulative diacetyl exposure were 0.5, 5, and 11 ppm-years. For respirable dust, cumulative exposures ranged from 0 to 2.1 mg-years/m3, with quartile cut points of 0.05, 0.4, and 0.9 mg-years/m3. A statistically significant correlation existed between individual cumulative diacetyl and cumulative respirable dust exposures (Pearson=s correlation = 0.60, N = 117). A significant correlation existed between the two exposures for 79 workers in microwave packaging and mixing room areas (Pearson=s correlation = 0.67).

Page 67 Health Hazard Evaluation Report No. 2000-0401-2991
Of 116 employees with spirometry tests, 73.3% had normal spirometry; 8.6% had a low vital capacity (restriction); 9.5% had airway obstruction; and another 8.6% had airway obstruction and a low vital capacity. Of those 18.1% with airflow obstruction, three had severe abnormalities with FEV1 less than 40% predicted. Only two workers with airway obstruction had a significant response to the inhaled bronchodilator. Of those 10 employees with pure restriction, the vital capacity was borderline to mildly low in 9, and all had a body mass index of more than 24 kg/m2, suggesting that their restriction may be due, in part, to their being overweight. Of 116 employees who performed testing for DLCO, 106 had interpretable tests. Only seven (6%) had a low DLCO test result; six of the seven had normal spirometry and the seventh had airway obstruction and a low vital capacity. Chest radiographs on 115 participants showed no small (1/0 criterion) or large opacities consistent with pneumoconiosis and no cor pulmonale. Two films showed radiologic emphysema (one of which had bullae); one film had saber sheath tracheal narrowing attributed to chronic obstructive pulmonary disease (COPD) or tracheal stenosis; and one film had focal upper zone scarring and left base atelectasis. Four x-rays had abnormalities requiring follow-up, including solitary pulmonary nodules or asymmetric pleural thickening. Symptom rates compared to national data. We compared the respiratory symptoms and physician-diagnosed respiratory diseases reported by the current employees to expected responses to the same or similar questions from a recent national survey (NHANES III). The prevalence of chronic cough, shortness of breath, and wheezing apart from colds among the current work force were 2.6, 2.6, and 3.0 times higher than expected, as reflected in observed/expected prevalence ratios (Table 7). Except for wheezing in the last 12 months, the prevalence ratios were higher in never smokers and younger employees (17-39 year olds). Lung disease diagnosis rates compared to national data. The prevalences of self-reported physician-diagnosed asthma, chronic bronchitis, and hayfever among the current workforce were 1.8, 2.1, and 1.2 times higher than expected (Table 8). The prevalence of chronic bronchitis in older and younger never smokers were 2.3 and 5 times higher than expected, respectively. Abnormal lung function compared to national data. The number of employees with airflow obstruction by smoking status and in relation to expected rates from the national data (NHANES III) is given in Table 8. The prevalence of obstruction increased by age group in both smokers and never smokers, and the excess over national rates was particularly apparent for never smokers. The observed/expected prevalence ratios for never smokers were 11.4 for workers above 40 years old and 8.3 for those under 40 years old. Overall, current employees had 3.3 times the rate of airway obstruction, when compared to the national population sample. Symptom prevalence by work area. Responses to questions regarding respiratory and systemic symptoms and physician-diagnosed diseases are summarized by current work area in Table 9. Workers in microwave production (including mixers) tended to report chronic cough, chronic wheezing, attacks of wheezing, chest tightness, and shortness of breath with exertion more frequently than the workers in the other two categories. They differed statistically from the other two exposure groups in reporting regular trouble with their breathing. About two-thirds of the microwave production workers and half of the polyethylene packaging, warehouse, maintenance, and quality control workers reported one or more respiratory or systemic symptoms, compared to 2 of 7 (29%) workers in the office and outdoor areas. When we only counted employees with incident symptoms and diagnoses which started after hire, rates of

Page 68 Health Hazard Evaluation Report No. 2000-0401-2991
respiratory symptoms and physician diagnoses in microwave production workers were similar to those in the warehouse and polyethylene areas, but tended to be higher than in the small group of office and outdoor workers (Table 10). About half (46%) of the microwave production workers reported one or more systemic symptoms compared to 23% in the polyethylene/warehouse areas and none in the office and outside area. The predominant systemic symptom was unusual fatigue, with only 13% and 10% of the microwave production workers reporting night sweats and flu-like achiness, respectively. When comparisons of symptoms with onset since employment were made, systemic symptoms and skin problems (but not respiratory symptoms) were in statistically significant excess among microwave production workers in comparison to the other groups (Table 10). Episodes of acute bronchitis were not correlated with work area. Similarly, physician diagnoses of asthma, emphysema, and chronic bronchitis did not differ in prevalence by work area. Mucous membrane irritation symptoms were more common in moderate to high exposure work areas. About 72% of the microwave production workers reported work-related irritation to their eyes, nose, or throat, compared to 58% in the polyethylene packaging, warehouse, maintenance, and quality control exposure areas and 3 of 7 (43%) in the least exposed office and outdoor workers. Onset of skin rashes and skin problems after hire were also clustered in microwave production, and twice as many reported skin problems compared to those with lower exposures. Spirometry results by cumulative exposure. Employees with obstructive abnormalities clustered among those with higher exposures using either the diacetyl or respirable dust cumulative exposure metric (Figures 7 and 8). For diacetyl exposure quartiles, the rates of obstructive spirometry were 6.9%, 14.3%, 23.3%, and 27.6% with increasing cumulative exposure. The rate in the highest quartile of exposure differed statistically from that in the lowest quartile; there was a statistically significant trend (p = .01). For respirable dust quartiles, the rates of obstructive spirometry were 0%, 10.3%, 40%, and 20.7% with increasing cumulative exposure. As the quartiles of exposure increased (lowest to highest), there was a significant increase in the rate of obstructive spirometry (p = .002). The proportion of employees with abnormal spirometry increased by quartile of increasing exposure from 13.8% in the office and outdoor group to 25%, 30%, and 37.9% in the highest diacetyl cumulative exposure quartile. For cumulative respirable dust quartiles, the proportion of employees with abnormal spirometry increased from 3.6% in the lowest exposure quartile to 20.7%, 46.7%, and 34.5%. Quartiles of increasing cumulative exposure to diacetyl had decreasing average percent predicted FEV1 (which is corrected for age, gender, and height), a good measure of the severity of both restrictive and obstructive spirometry outcomes. Using the lowest diacetyl exposure quartile as the reference group, average percent predicted FEV1 fell by 5.5%, 10.5%, and 14.2% in the second, third, and fourth quartiles, respectively (Figure 9A). Similar trends were seen when using respirable dust cumulative exposure quartiles (Figure 9B). Associations between the outcome measures. Workers with airway obstruction had more incident chronic cough, chronic wheeze, attacks of wheezing, chest tightness, and shortness of breath with onset after hire compared to workers who had no airways obstruction (Table 11). On the other hand, about a quarter of those with obstructive abnormalities did not report onset of any of these symptoms after hire.

Page 69 Health Hazard Evaluation Report No. 2000-0401-2991
Workers with airway obstruction did not have higher prevalence of systemic symptoms and skin problems with onset after hire compared to workers without airway obstruction. Those participants with airway obstruction by spirometry were more likely to have a diagnosis of attacks of bronchitis, chronic bronchitis, asthma, pneumonia, and emphysema since employment (Table 11). Among those with physician-diagnosed attacks of bronchitis since employment, the number of attacks ranged up to 22 (median 4). Although those with airflow obstruction were much more likely to have reported a doctor diagnosis of chronic bronchitis or asthma after hire, only 13 of the 21 (62%) had a physician diagnosis that would account for obstructive impairment (asthma, emphysema, and chronic bronchitis). Employees with pure restriction on spirometry were largely asymptomatic and were not clustered in the microwave production area. There were no significant associations between a low DLCO and airway obstruction or work area. Initial Engineering Interventions Ventilation changes in the microwave production area would not likely affect office, outdoor, and polyethylene packaging workers. Warehouse, maintenance, and quality control workers have work areas which open into the microwave packaging area, but might not notice effects of ventilation interventions in the microwave packaging area. In the late October-November survey, 17/79 (22%) of the workers currently in microwave packaging and mixing operations reported that the addition of ventilation in the summer of 1999 had improved the work environment; an additional 33% reported that the environment had stayed the same; and the remainder (46%) didn=t know. Of the 42 microwave packaging and mixing operations workers who participated in both October 2000 and April 2001 surveys, 26% reported improvement in the work environment following the January engineering interventions; 50% reported it had not changed; and 21% did not know. On January 18, 2001, before the increase in ventilation, closing the mixing room door, and continuous exhaust of the salt dump operation in the mixing room, ketone concentrations were similar to those documented for particular jobs and areas in November 2000 (Table12). Following these initial engineering interventions on January 19, 2001, the mean diacetyl concentration fell about 3 to 12-fold for specific personal and area sampling pairs in microwave production, with the least effect on the personal samples for mixers. Total organic vapor concentrations, assessed with 15-minute TWAs and peak concentrations, fell markedly for mixing and microwave popcorn production line jobs between January 18 and January 19 with the institution of controls (Figure 10). Comparison of spirometry results for the 64 workers tested in the late October survey and April follow-up documented four participants with declines in FEV1 of 10% or more, ranging to 27% in a newly symptomatic worker in the fall of 2000 whose spirometry had then been normal. DISCUSSION Nature of the disease. Bronchiolitis obliterans, which occurred in some former workers from this plant, is a rare lung disease with inflammation of the small airways (King, 1998). Known work-related causes include inhalation of nitrogen dioxide, silo gases, ammonia, chlorine, hydrogen fluoride, ozone, phosgene, fly ash, and sulfur dioxide. In occupational settings, an incident of overexposure often results in severe initial symptoms of pulmonary edema, followed by seeming recovery and development of

Page 70 Health Hazard Evaluation Report No. 2000-0401-2991
bronchiolitis obliterans weeks later. Bronchiolitis obliterans has also been reported in cases of hypersensitivity pneumonitis in work settings with aerosols of micro-organisms or chemicals to which workers become sensitized. Apart from work-related exposures, most bronchiolitis obliterans cases are diagnosed in the months following bone marrow or lung transplants. In these evolving cases, the disease may progress from the mild (subclinical) stage to the severe stage within a few months. In the early (mild) stage, there are no symptoms. In the severe stage, bronchiolitis obliterans causes shortness of breath upon mild to moderate exertion. The respiratory symptoms in the moderate and severe stages are common to many types of lung disease. When the development of bronchiolitis obliterans is insidious (as in post-transplant patients), lung function test abnormalities begin during the mild stage and become progressively abnormal during the moderate and severe stages. The lung function test results show airways obstruction (a low FEV1/FVC and a low FEV1) which does not improve with use of an inhaled bronchodilator (such as albuterol), and in the moderate to severe stages, hyperinflation of the residual volume may occur. The DLCO is normal, but oxygen desaturation may occur during exercise. The chest x-ray is normal, but a high resolution lung computerized tomography exam may show inhomogeneity of aeration in the moderate to severe stages. The diagnosis of bronchiolitis obliterans is suspected when the clinical history includes one of the known causes, more common lung diseases are ruled out, and the above pattern of lung function abnormalities is present. The diagnosis of bronchiolitis obliterans is then confirmed by the histological examination of lung tissue obtained during an open lung biopsy. The treatment of bronchiolitis obliterans arising from chemical inhalation injury is generally ineffective in curing the disease and limited to treatment of symptoms. The clinical features of the index cases are similar to those of Aconstrictive@ bronchiolitis, which occurs with chemical causes. Only a minority of cases, such as those arising in hypersensitivity pneumonitis cases or those with organizing pneumonia (proliferative bronchiolitis), respond to oral corticosteroids or other strong anti-inflammatory medications, most of which have serious side-effects. Three outcomes. The above discussion suggests that there are three lung disease outcomes which can be measured: 1) respiratory symptoms, 2) abnormal lung function, and 3) a physician diagnosis of lung disease. This NIOSH investigation measured all three of these outcomes during the fall 2000 examination of the current employees of the Jasper popcorn plant. We compared the abnormality rates for these three outcomes to national data (an external control group) and to relatively unexposed employees at the plant (an internal control group). Excessive rates when compared to national data. Excellent up-to-date data on the rates of 1) respiratory symptoms, 2) lung function (spirometry) abnormalities, and 3) physician-diagnosed common lung diseases from a sample of the population of the United States are available from the NHANES III study. NIOSH employees provided the spirometers and helped to obtain and analyze the NHANES III data. The most important factors which are known to affect the abnormality rates of these 3 outcomes are age, gender, and smoking status. Therefore, we stratified our comparisons to take these factors into consideration. Smoking status (current or former) is slightly under-estimated when self-reported, but this applies equally for both the NHANES III study and this investigation. By design, the identical standardized respiratory symptom and disease questions used by the NHANES III were also used for this investigation (Table 2), which allows direct comparisons of response rates.

Page 71 Health Hazard Evaluation Report No. 2000-0401-2991
Excessive symptoms. The most common respiratory symptoms are cough, phlegm, wheezing, and shortness of breath. Both never smokers and smokers in both age groups from the plant reported higher rates of respiratory symptoms (observed) than the national data (expected) (Table 7). The observed/expected ratios (excessive rates) for respiratory symptoms were larger in the younger never-smokers than in the smoking employees and older employees. For three of the symptoms, the younger never-smoking employees had about 4 to 5 times the expected rate of symptoms. This excess of respiratory symptoms is not specific for any single type of lung disease, but strongly suggests that at least some of the employees at the plant are experiencing some type of lung disease more frequently than the national population sample Excessive lung function abnormality rates. The most common pattern of lung function abnormality is limitation of forced exhaled airflow, diagnosed by the spirometry test where the FEV1/FVC and the FEV1 are found to be low. Airway obstruction is the most common pattern because asthma and chronic obstructive pulmonary disease, which includes emphysema and chronic bronchitis due to cigarette smoking, are obstructive lung diseases. Since about 1 of every 5 adult smokers over age 45 develop chronic obstructive pulmonary disease, it is important to stratify comparisons of lung function abnormality rates by smoking status. Predicted (expected) values for spirometry results are corrected for height, age, gender, and race. The same predicted equations (from the healthy subset of NHANES III participants) were used to determine spirometry abnormality rates for both the national data and the employees in this plant. Young never-smoking employees had about 8 times the expected rate of airways obstruction, while the older never-smoking employees had over 11 times more airways obstruction than the national rate (Table 8). The older smokers were also 3.3 times more likely to have airways obstruction than the national rate for this age group of smokers. These results suggest that employees at the plant have obstructive lung disease much more frequently than the national population sample. Excessive respiratory disease diagnoses. The most common types of chronic obstructive airway diseases in the United States are asthma, chronic bronchitis, and emphysema. We also asked about hayfever (allergic rhinitis) because it is common, associated with asthma, and not due to smoking or occupational exposures. Plant employees had about twice the national rates for a physician diagnosis of asthma and for chronic bronchitis, but about the same rates of hayfever. The emphysema rates were too low in both the employees and the national data for this age group for meaningful comparisons. Exposure-response relations within the plant. Internal comparisons of relatively exposed versus relatively unexposed employees at a given plant are also important, since they are not subject to any biases between this investigation and national studies, and they may establish an exposure-response relationship between the degree of the exposure and the risk or severity of the health outcomes. In studies of occupational diseases, the presence of an exposure-response relationship suggests that the exposure index is causally related to the health outcome or is a marker for the causative exposure. Since the microwave popcorn company did not have exposures previously known to cause bronchiolitis obliterans, the distribution of health effects among the workforce and in relation to possible (previously unrecognized) causes provides clues to what has caused the cluster of bronchiolitis obliterans cases in former workers and the excess respiratory disease in this workforce. The findings of this investigation indicate that the causative exposure is long-standing in the plant, since the earliest case among former workers dated to 1992. The exposure continued past the fall survey, since a few workers were apparently

Page 72 Health Hazard Evaluation Report No. 2000-0401-2991
newly affected between the beginning of November 2000 and the beginning of April 2001. This endemic pattern of disease occurrence argues for a hazard which is present frequently and perhaps continually. The greatest hazard was for mixers, as reflected in their over-representation among the former worker cases. However, severe index cases occurred among others in microwave packaging, which shared high risk of symptoms, in comparison to workers in the warehouse, polyethylene line, offices, and outdoors. The current exposures to ketones, other volatile organic compounds, and respirable dust were all greatest in microwave popcorn production and were particularly high for mixers. Estimated cumulative exposures were correlated with chronic lung function effects, reflected both in rates of obstructive and abnormal spirometry abnormalities and in average decreases in FEV1 for the higher cumulative exposure quartiles. The exposure-response relationship between diacetyl cumulative exposure and pulmonary function was unequivocal, suggesting that diacetyl may be the cause or a marker for a cause of respiratory disease in this workforce. Cumulative respirable dust was also associated with respiratory outcomes, although the highest quartile of exposure did not have the lowest average percent predicted FEV1 nor the highest rate of FEV1 abnormalities. Since diacetyl, other volatile organic compounds, and respirable dust measurements by job area were correlated (as were the diacetyl and respirable dust cumulative exposure indices), any of them may be a marker for the causative agent or agents in the mixing and microwave popcorn production areas. Our understanding of the cause will be enhanced by ongoing animal respiratory toxicology studies. To date, BBA butter flavoring, which contains diacetyl and many volatile organic compounds, has caused damage to epithelial lining of the rat respiratory system in animal experiments. These preliminary animal findings suggest that diacetyl exposure or another flavoring component is a biologically plausible cause of the excess human respiratory effects in the popcorn plant. Animal exposures to respirable salt have not yet been conducted at NIOSH. Support for the flavoring-as-cause hypothesis exists in a NIOSH Health Hazard Evaluation in a company mixing flavorings in corn starch for the baking industry (NIOSH, 1986). This company had two young workers who developed bronchiolitis obliterans, one of whom reported his suspicion of Acinnabutter@ as a cause. In addition to animal studies, investigations of workers in other microwave popcorn plants and in the flavoring industry may help establish the risk of particular suspected agents and their exposure-response relations. Clinical characteristics of the excess work-related lung disease. The bronchiolitis obliterans diagnosis of many of the former worker index cases depended upon extensive clinical tests that are not available in a plant investigation setting. The pattern of cough and shortness of breath with exertion, coupled with the finding of airway obstruction that did not change with bronchodilator, normal chest x-rays, and normal diffusing capacity, is consistent with bronchiolitis obliterans as the most likely explanation for the excess respiratory disease in the plant population and its association with exposures arising in the mixing room of microwave popcorn production. The clinical picture is not that of occupational asthma, emphysema, or interstitial lung disease. This investigation provides evidence that some workers with airway obstruction do not report symptoms; conversely, the prevalence of symptoms far exceeds the rates of obstructive airways abnormalities. This may be a result of an insensitive definition of abnormal, in the absence of baseline spirometry data at the beginning of employment. Whether symptomatic workers are at higher risk for developing airways obstruction remains to be determined by longitudinal followup. The clinical course of many of the former worker cases suggests that the pulmonary function impairment is irreversible, despite exposure cessation.

Page 73 Health Hazard Evaluation Report No. 2000-0401-2991
The association of cumulative exposure metrics with pulmonary function impairment is consistent with a long term effect. Whether the current workers with abnormalities will improve with reduction of exposure is impossible to know without careful followup. In the face of this uncertainty, affected workers and their physicians need to be told the findings of this investigation so that they can make decisions about acceptable risks and continued exposure. Although some of the most severe cases among former workers had suffered systemic symptoms and skin problems, only respiratory symptoms appeared associated with the lung abnormalities among the current workforce. On the other hand, work-related excesses of skin problems and systemic symptoms were evident in microwave production processes. These may be independent outcomes of the same or different exposures or reflect effects at earlier stages of disease. In summary, we found excessive rates of 1) respiratory symptoms, 2) lung function abnormality (airway obstruction), and 3) physician-diagnosed asthma and chronic bronchitis in the plant employees. We found an exposure-response relationship between plant areas with differing current exposures and symptoms. Indices of cumulative exposure to both particulates and diacetyl vapor were related to obstructive lung function outcomes in plant employees. The survey findings are best explained by the occurrence of work-related bronchiolitis obliterans in this microwave popcorn plant in relation to exposures arising in the mixing room but widely disseminated to varying extents through other areas of the plant. Implications for screening and surveillance for bronchiolitis obliterans. The severity of bronchiolitis obliterans in some of the index cases makes prevention of the disease in exposed employees critically important. The excessive rates of both respiratory symptoms and impaired lung function (airway obstruction) in the current employees suggest that some of the current employees have mild to moderate bronchiolitis obliterans. This disease may progress to severe disabling disease (as in the index cases) if their past workplace exposures were to continue. All levels of disease prevention are important in this situation: 1) primary, 2) secondary, and 3) tertiary. Primary prevention at the plant has already begun, by identifying the major sources of particulates and organic vapors, and lowering employee exposures to these sources. The first step of secondary prevention has also begun, the identification of employees who have subclinical disease (airway obstruction, but without respiratory symptoms). These screening exams should be repeated at regular intervals to identify incident (additional new) cases of airway obstruction. The next steps should be to prevent further hazardous workplace exposures in these affected employees; to prevent further lung disease by promoting smoking cessation for those who are current smokers; and to assess the effectiveness of preventive interventions by repeating the respiratory questions and spirometry tests at intervals determined by the findings. Tertiary prevention is the treatment of established disease. Employees who have any respiratory symptoms or airway obstruction should be referred to a physician for a diagnostic work-up and appropriate treatment. Those with moderate to severe airway obstruction should be referred even if they don=t report any respiratory symptoms. Surveillance is the detection of abnormal rates of disease in groups of persons (in contrast to screening of individuals to see if they have disease). The severity of this outbreak of work-related obstructive lung disease suggests that surveillance be initiated for the entire plant to ensure the effectiveness of the primary prevention efforts. If new cases arise, the causative exposure is continuing either because controls are

Page 74 Health Hazard Evaluation Report No. 2000-0401-2991
inadequate or because we have overlooked a causative source or agent. Only by surveillance will we determine the quantitative risk of particular exposure levels. No occupational exposure standards exist for the likely cause(s) of this outbreak, and the standard for particulates not otherwise regulated is inappropriate, given the severity of the demonstrated disease. The excess level of symptoms in the microwave production area, apart from mixing, suggests that exposures measured there in November were too high. Even the warehouse, quality control, maintenance, and polyethylene groups had higher symptom rates than the lowest exposure comparison workers from outdoor and office locations. The April follow-up indicated that new cases of obstructive abnormalities had arisen since November, but we do not know whether these cases occurred as a result of continuing higher exposures before January 19 or whether the engineering controls are still inadequate in protecting workers from lung disease. On the basis of this investigation, we recommend surveillance of exposures and workforce health at other plants with similar workplace exposures. Why not just use physician diagnoses to find new cases? It took many years for community physicians to suspect that work-place exposures might be responsible for the employees they saw with severe airways obstruction. The symptoms were non-specific and could be due to any serious chronic lung disease. The fixed airways obstruction seen on spirometry testing was probably attributed in individual cases to smoking-related chronic bronchitis or emphysema (COPD) or Aairway remodelling@ due to long-term untreated asthma. More than a third of employees with obstructive airways disease did not receive a physician diagnosis which might explain their condition. DLCO tests were not used to exclude the diagnosis of COPD. Standard chest x-rays were largely normal. Since bronchiolitis obliterans is a rare disease, most clinicians did not consider this diagnosis, and this food production industry had not been previously recognized as having this type of lung hazard. Most index cases did not report a tight temporal association between being at work and increased symptoms. In the circumstance of a new exposure-disease association, recognition of a disease cluster and findings in the entire workforce can lay the basis for attributing respiratory disease in individuals to the workplace. The disease was severe and probably not reversible when employees waited to seek medical attention until they experienced shortness of breath with mild to moderate exercise. These factors suggest that screening or surveillance for new cases of bronchiolitis obliterans should not depend on waiting for diagnoses from community physicians. Limitations of this investigation. The cross-sectional survey was limited since both exposure and outcome were measured simultaneously. Measured exposures may not reflect historical exposures, particularly for respirable dust, since exhausting of salt dumping operations occurred in the summer of 1999. On the other hand, exposures to volatile organic compounds, such as diacetyl, may not have been much affected by past ventilation interventions. In these analyses, we assigned workers and jobs to four assumed exposure groups, which we demonstrated had different average exposures; nevertheless, individual exposure may be misclassified by these assumptions, leading to biased estimates of current and cumulative exposures. An example is the quality control workers, who were grouped a priori with warehouse and polyethylene workers; later diacetyl and respirable dust measurements show that they would more appropriately be grouped with microwave packaging workers. Such misclassification of exposure may reduce the probability of recognizing a true effect. Another consequence of cross-sectional surveys is underestimation of the health outcomes associated with exposures due to the healthy worker effect. In this plant, nine former workers left employment because of lung disease, thereby leaving a healthier workforce which does not show the true burden of disease. Eight of the current workforce changed assignments due to respiratory problems. To the extent they moved to

Page 75 Health Hazard Evaluation Report No. 2000-0401-2991
lower exposure areas, these workers are counted as having developed health effects in their current assignments, which may be inaccurate. Our indices of cumulative exposure are one way to correct for this limitation. Despite an 87% participation rate, this cross-sectional survey was limited by the reduced statistical power to make internal comparisons, especially between minimally-exposed and highly-exposed groups. Because of this, we have presented data even when statistically significant differences were not demonstrated. Since some ill employees left the workplace due to respiratory symptoms, our statistical power to detect association between workplace exposures and respiratory outcomes was reduced. This may account for our observation that neither current nor cumulative exposure indices were related in a statistically significant way to rates of physician-diagnosed lung diseases which were commonly given to ill employees. The worker surveys from October and April include additional data not presented here, as analyses are ongoing. Although we took into account major confounders, such as age, gender, and smoking, this interim report does not address prior occupational history, for example. Planned analyses include multivariate modeling. The respiratory abnormality excesses reported here are so large that we do not expect our major conclusions to change. Rather than delay public health action, we seek to get this interim information in the hands of employers, who can reduce exposures and implement surveillance, and of workers, who can protect themselves by using respiratory protection, good work practices, and medical screening and follow-up.

Page 76 Health Hazard Evaluation Report No. 2000-0401-2991
REFERENCES ACGIH: Air sampling instruments for evaluation of atmospheric contaminants, 8th ed. Cincinnati: OH: American Conference of Governmental Industrial Hygienists, 1995. ACGIH. Bioaerosols: Assessment and control. Cincinnati, OH: American Conference of Governmental Industrial Hygienists, 1999; pp 11-1 to 11-25. American Thoracic Society. Screening for adult respiratory disease. Am Rev Resp Dis 1983; 128:768-774. American Thoracic Society. Lung function testing: selection of reference values and interpretive strategies. Am Rev Resp Dis 1991; 144:1202-1218. American Thoracic Society. Standardization of spirometry: 1994 update. Am J Resp Crit Care Med 1995; 152:1107-1136. American Thoracic Society. Single-breath carbon monoxide diffusing capacity: recommendations for a standard technique - 1995 update. Am J Resp Crit Care Med 1995; 152:2185-2198. American Thoracic Society. Standards for the diagnosis and care of patients with chronic obstructive pulmonary disease. Am J Resp Crit Care Med 1995; 152:S78-S121. BioWhittaker: Kinetic-QCL, Limulus Amebocyte Lysate 192 Test Kit. Catalog No. 50-650U, Walkersville, MD, 2000. Boswell RT, McCunney RJ. Bronchiolitis obliterans from exposure to incinerator fly ash. J Occup Environ Med 1995;37:850-855. Burt VL, Whelton P, Roccella EJ, et al. Prevalence of hypertension in the US adult population: results from the Third National Health and Nutrition Examination Survey, 1988-1991. Hypertension 1995; 25:305-313. Code of Federal Regulations. 40 CFR 503. Washington, DC: U.S. Government Printing Office, Federal Register, 1998. Consensus Statement. The agency for health care policy and smoking cessation. Clinical Practice Guideline. JAMA 275:1270-1280, 1996. Ferris BG. Epidemiology standardization project. Am Rev Resp Dis 1978; 118:1-53. Hankinson JL. Pulmonary function testing in the screening of workers; Guidelines for instrumentation, performance and interpretation. J Occup Med 1986: 28:1081-1092.

Page 77 Health Hazard Evaluation Report No. 2000-0401-2991
Hankinson JL, Wagner GR. Medical screening using periodic spirometry for detection of chronic lung disease. J Occup Med 1993; 8:353-361. Hankinson JL, Odencrantz JR, Fedan KB. Spirometric reference values from a sample of the general U.S. population. Am J Resp Crit Care Med 1999; 159:179-187. Hinds, W.C.: Aerosol Technology. New York: John Wiley and Sons, 1982. pp 1-13, 164-186, and 284-314. ILO. Guidelines for the use of ILO international classification of x-rays of pneumoconioses, 1980 edition. Geneva: International Labour Office, 1980. Occupational Safety and Health Series, No. 22 (rev.). King TE. Bronchiolitis. In Fishman AP, Elian JA, Fishman JA, Grippi MA, Kaiser LR, Senior RM. Fishman=s Pulmonary Diseases and Disorders. New York: McGraw-Hill, 1998, pp. 825-847. Leichnitz, K.: Detector Tube Handbook, 6th ed. Lubeck, Germany: Draeger Werk Ag., 1989, pp. 1-49. Miller A, Thornton JC, Warshaw R, et al. Single-breath diffusing capacity in a representative sample of the population of Michigan, a large industrial state. Am Rev Resp Dis 1983; 127:270-277. NIOSH. Health hazard evaluation and technical assistance report: International Bakers Services, Inc., South Bend, Indiana. Cincinnati, OH; U.S. Department of Health and Human Services, Public Health Service, Centers for Disease Control, National Institute for Occupational Safety and Health, DHHS (NIOSH) Publication No. 85-171-1710, 1986. NIOSH. NIOSH manual of analytical methods (4th edition). Cincinnati, OH: U.S. Department of Health and Human Services, Public Health Service, Centers for Disease Control, National Institute For Occupational Safety and Health. DHHS (NIOSH) Publication No.94-113, 1994. SAS Institute, Inc. SAS/STAT User=s Guide, version 6. Cary NC: SAS Institute, Inc., 1990. Simpson FG, Belfield PW, Cooke NJ. Chronic airflow limitation after inhalation of overheated cooking oil fumes. Postgraduate Medical Journal 1985;61:1001-1002. U.S. Department of Health and Human Services (DHHS). National Center for Health Statistics. Third National Health and Nutrition Examination Survey, 1988-1994, NHANES III Laboratory Data File (CD-ROM). Public Use Data File Documentation Number 76200. Hyattsville, MD: Centers for Disease Control and Prevention, 1996.

Page 78 Health Hazard Evaluation Report No. 2000-0401-2991

Page 79 Health Hazard Evaluation Report No. 2000-0401-2991

Page 80 Health Hazard Evaluation Report No. 2000-0401-2991

Page 81 Health Hazard Evaluation Report No. 2000-0401-2991
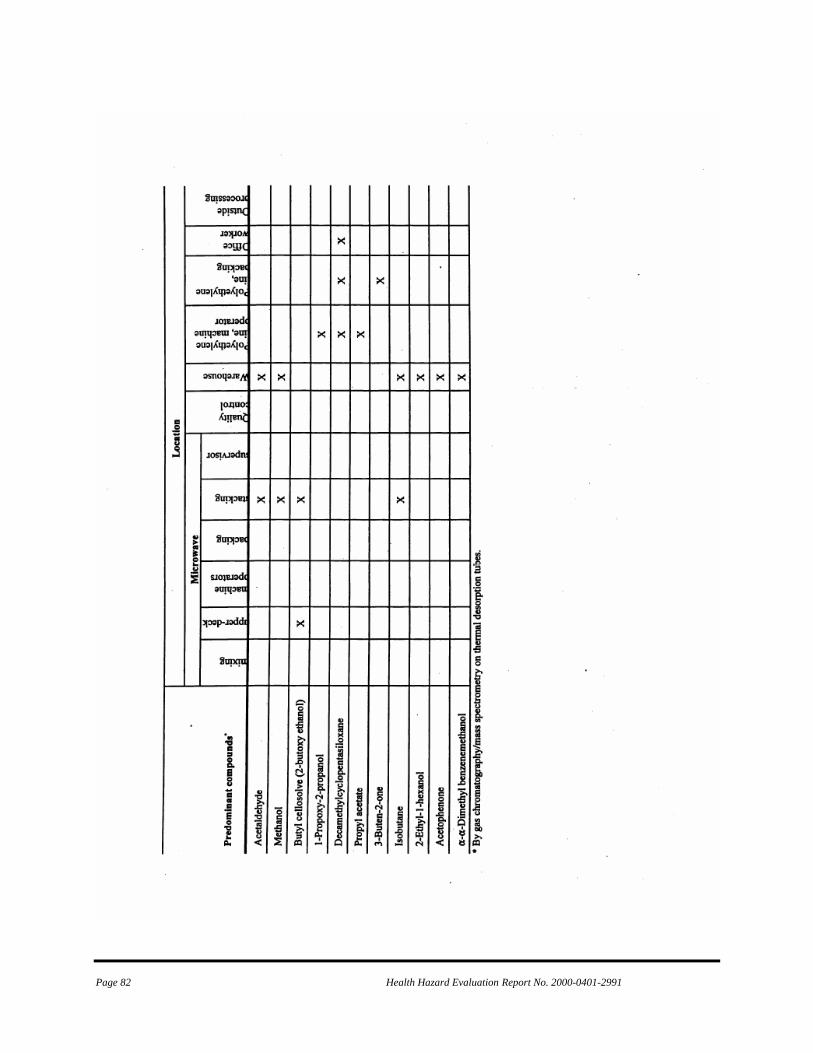
Page 82 Health Hazard Evaluation Report No. 2000-0401-2991

Page 83 Health Hazard Evaluation Report No. 2000-0401-2991

Page 84 Health Hazard Evaluation Report No. 2000-0401-2991

Page 85 Health Hazard Evaluation Report No. 2000-0401-2991

Page 86 Health Hazard Evaluation Report No. 2000-0401-2991

Page 87 Health Hazard Evaluation Report No. 2000-0401-2991

Page 88 Health Hazard Evaluation Report No. 2000-0401-2991

Page 89 Health Hazard Evaluation Report No. 2000-0401-2991

Page 90 Health Hazard Evaluation Report No. 2000-0401-2991

Page 91 Health Hazard Evaluation Report No. 2000-0401-2991
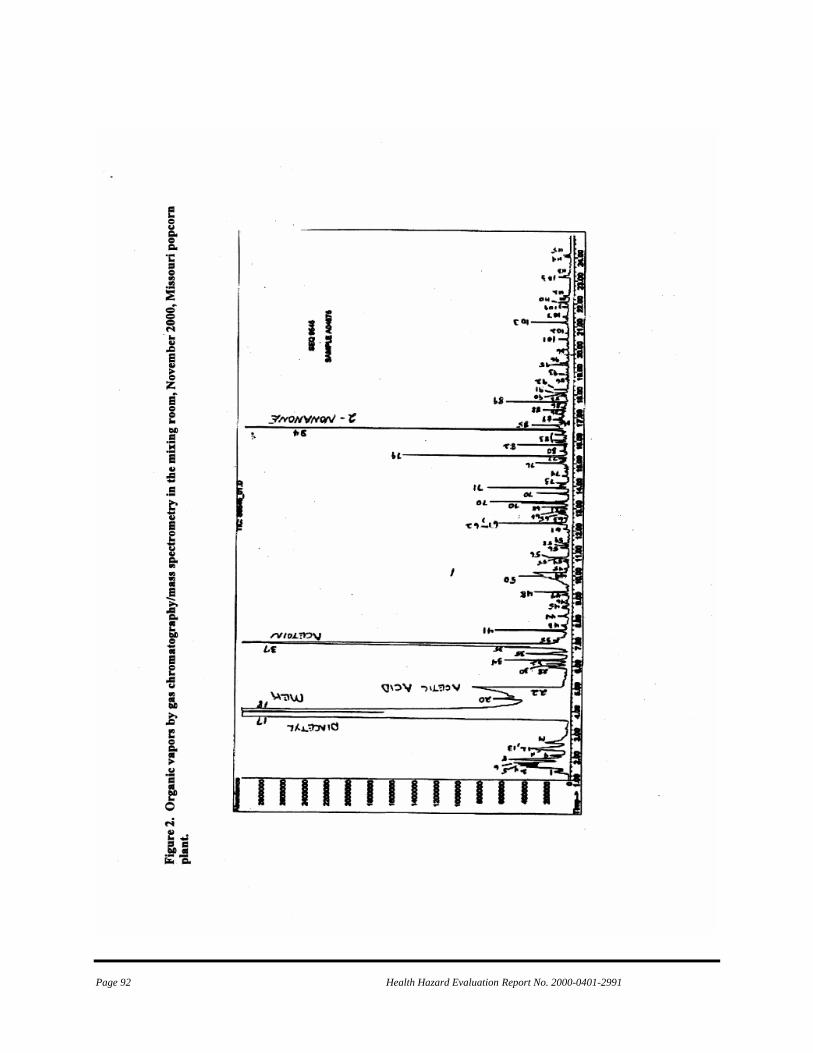
Page 92 Health Hazard Evaluation Report No. 2000-0401-2991

Page 93 Health Hazard Evaluation Report No. 2000-0401-2991

Page 94 Health Hazard Evaluation Report No. 2000-0401-2991

Page 95 Health Hazard Evaluation Report No. 2000-0401-2991

Page 96 Health Hazard Evaluation Report No. 2000-0401-2991

Page 97 Health Hazard Evaluation Report No. 2000-0401-2991

Page 98 Health Hazard Evaluation Report No. 2000-0401-2991

Page 99 Health Hazard Evaluation Report No. 2000-0401-2991

Page 100 Health Hazard Evaluation Report No. 2000-0401-2991

Page 101 Health Hazard Evaluation Report No. 2000-0401-2991
Appendix D

Page 102 Health Hazard Evaluation Report No. 2000-0401-2991

Page 103 Health Hazard Evaluation Report No. 2000-0401-2991

Page 104 Health Hazard Evaluation Report No. 2000-0401-2991
This page was intentionally left blank.

Page 105 Health Hazard Evaluation Report No. 2000-0401-2991
Appendix E December 22, 2000 HETA 2000-0401
Mr. Jim Cook Plant Manager Gilster Mary Lee Corporation/Jasper Popcorn Company 311 West Mercer Jasper, Missouri 64755 Dear Mr. Cook: This letter provides interim exposure control recommendations for workers in the microwave popcorn production areas at Gilster Mary Lee Corporation/Jasper Popcorn Company in Jasper, MO. These recommendations are provided through an ongoing National Institute for Occupational Safety and Health (NIOSH) Health Hazard Evaluation (HETA 2000-0401) on the respiratory health status of plant workers. This evaluation was undertaken in response to a request for technical assistance received from the Missouri State Department of Health regarding reported cases of bronchiolitis obliterans among some of the former plant workers. The recommendations provided below are based on the NIOSH site visits to Gilster Mary Lee Corporation/Jasper Popcorn Company during the last 3 months. Nine former workers at your factory were reported in May 2000 with bronchiolitis obliterans, a severe lung disease characterized by fixed airflow obstruction. Four of these workers await lung transplant. Most of the workers had no history of smoking. Two of the most severe cases worked as packers in microwave popcorn production and never worked in the mixing room. We have now collected detailed health and exposure information from current and former workers through structured interviews and lung function tests such as spirometry, diffusing capacity measurement, and chest radiographs. Spirometry is a diagnostic tool for evaluation of obstructive lung disease. Preliminary results showed that 28% of the current workers have abnormal spirometry, a few in the range of the sentinel cases awaiting lung transplant. This percentage of abnormal spirometry is at least three times higher than expected compared to the average population including smokers. Some current employees developed chest symptoms such as cough and shortness of breath after the exposure interventions by the company in the summer of 1999, suggesting ongoing risk. Workers with abnormal results and lung symptoms are located in the microwave production lines area, as well as the mixing room. Based on these preliminary results, we suspect that some agent used at Gilster Mary Lee Company has produced obstructive lung disease in some employees. The specific agent(s) is not identified yet which may depend on the studies in animals which will likely take months. We offer consultation on engineering controls with a NIOSH engineer in January or early February to make recommendations to prevent process-related exposures. As we work together to better understand this previously unsuspected occupational lung hazard and to lower exposure, we are

Page 106 Health Hazard Evaluation Report No. 2000-0401-2991
Mr. Jim Cook Page 2 concerned about protecting all workers in the microwave popcorn area from developing new or progressive respiratory illness. On the basis of preliminary analyses, NIOSH is recommending that all workers in the microwave area should be encouraged to use respiratory protection; those who elect to use respirators should be provided with a respirator and given respirator training and fit testing. The minimum recommendation for respiratory protection would include a half-mask, non-powered, air purifying respirator. The cartridges used with this respirator should be a combination of a NIOSH approved P-100 filter and organic vapor cartridge. These respirators should be used as part of a formal respiratory protection program as specified by 29 CFR 1910.134 (Copy enclosed). Those with lung disease or a need to communicate may need powered air purifying respirators. Respirators are not a long-term solution but offer some protection until the addition of appropriate engineering controls or product substitution can be identified, which will likely take months. Please call if you have any questions regarding these recommendations or if you want to explore how we might help you to implement them. As noted previously, these recommendations are provided on an interim basis. A final summary of the medical and environmental findings from this evaluation, including final recommendations, will be provided at the conclusion of this project. In closing, we thank you and all the workers at Jasper Popcorn Company for the outstanding support provided to date on this evaluation.
Sincerely,
Greg Kullman, Ph.D. Field Studies Branch Division of Respiratory Disease Studies 304-285-5959.
Ahmed Gomaa, M.D. Field Studies Branch Division of Respiratory Disease Studies 304-285-6189
Enclosure

Page 107 Health Hazard Evaluation Report No. 2000-0401-2991
Appendix F

Page 108 Health Hazard Evaluation Report No. 2000-0401-2991

Page 109 Health Hazard Evaluation Report No. 2000-0401-2991

Page 110 Health Hazard Evaluation Report No. 2000-0401-2991

Page 111 Health Hazard Evaluation Report No. 2000-0401-2991
Appendix G

Page 112 Health Hazard Evaluation Report No. 2000-0401-2991

Page 113 Health Hazard Evaluation Report No. 2000-0401-2991

Page 114 Health Hazard Evaluation Report No. 2000-0401-2991

Page 115 Health Hazard Evaluation Report No. 2000-0401-2991

Page 116 Health Hazard Evaluation Report No. 2000-0401-2991
This page was intentionally left blank.

Page 117 Health Hazard Evaluation Report No. 2000-0401-2991
Appendix H
February 27, 2002 HETA 2000-0401 Interim Letter Report
Mr. Eric Asselmeier Corporate Sanitarian and Compliance Officer Gilster Mary Lee Corporation 1037 State Street Chicago, Illinois 62233 Dear Mr. Asselmeier: In December 2001, the National Institute for Occupational Safety and Health (NIOSH) completed a one-year follow-up of medical and environmental testing at the Gilster Mary Lee plant in Jasper, Missouri. Although we continue to analyze the extensive data collected at your plant, we want to share what we have learned so far. This letter provides interim results.
Exposures. The attached figure shows the diacetyl concentrations for three different job categories by survey date starting with the November 2000 survey and ending with the November 2001 survey. Concentrations are presented in parts per million parts of air by volume (ppm) on a logarithmic scale. These data demonstrate impressive reductions in diacetyl concentration measurements with the added engineering controls. For example, concentrations in the microwave mixing room have been reduced from an average of 38 ppm in November 2000 to approximately 0.0005 ppm in November 2001. Reductions in concentrations were also consistently seen for the machine operators job and quality control. In the April and September 2001 results, the diacetyl concentrations seen in the mixing job category were still similar in magnitude to the machine operators job category in November of 2000; the epidemiologic findings document that such exposure levels were associated with health effects present in microwave packaging workers in November 2000. The subsequent results from November 2001 were substantially lower. Collectively, these results reflect the effectiveness of the ongoing engineering control efforts taken by your company to reduce worker exposures to volatile organic compounds from plant operations. Lung Function. During our visits in November 2000 and April, August, and December 2001, we tested 242 different current workers at the Jasper plant, some of whom began or left employment in this one-year period. Of the 122 participating workers in November 2000 with pulmonary function measurement, 84 were tested more than once over the succeeding year. Among these 84 workers, 35 (42%) had no decrease in their forced expiratory volume in one second (FEV1) from first to last tests; 17 (20%) had a decrease of 100 milliliters (ml) or less in FEV1; 13 workers (16%) showed a decrease of 101-150 ml, and 19 of them (23%) had a decrease of more than 150 ml. The largest fall was 2,330 ml over a one year period. Declines of 150 ml or greater over a year are very unusual and cannot be attributed to smoking alone. Some of the above declines occurred over testing intervals of four or nine months, rather than over a one year interval. We expect normal nonsmokers and most smokers to lose about 30 ml in the FEV1 measurement over the course of a year after they have reached their maximum lung volume in their mid-twenties. In comparison, Gilster Mary Lee employees who had never smoked had an average decrease of 46 ml over the year between their tests, and half had lost 70 ml or more. We expect that about 15% of smokers lose more than 30 ml per year, and these are the smokers who will probably develop emphysema after decades

Page 118 Health Hazard Evaluation Report No. 2000-0401-2991
of smoking. The average expected annual loss in this subset of smokers is about 60 ml. In comparison, Gilster Mary Lee employees who had ever smoked had an average loss of 121 ml, and half had lost 50 ml or more. Overall, half of the Gilster Mary Lee workers, both nonsmokers and smokers, tested more than once in the period of November 2000 to December 2001, had lost 60 ml after intervals of 4-12 months. We expect such losses over a 12 month interval in less than 15% of the smoking group (less than 7% of the workforce).
In November 2000, we identified 21 of 122 persons with abnormal airways obstruction. Over the succeeding year, an additional 3 persons in the originally participating group developed airways obstruction, for a total of 24 (19.7% of 122). Eight of the original 21 abnormal workers had increases in their FEV1s over some time intervals tested, but seven of the eight remained in the abnormal range. For example, a worker had an FEV1 increase of 510 ml during the one-year period, but this was not enough to bring the worker back up into the normal (predicted) range; the FEV1 continues to show airways obstruction. Risk factors. In more complex analyses performed since our interim report in August, we found an additional high risk work area in the plant – quality control. As you may recall, we had originally classified this area (before data analyses) as an intermediate exposure area. We questioned that classification when we saw that the average diacetyl exposure levels for quality control in November 2000 were closer to those in microwave packaging than warehouse measurements. In looking at workers in this area as a group, we found that 5 of 6 had airways obstruction. Those with obstruction were 37 times more likely to work in quality control than those without airways obstruction (when controlled for cigarette smoking and age). The comparable factor for mixers was 11. We wonder if the relative levels of airborne flavoring components differ for quality control workers because of the higher temperatures that flavorings reach during microwave popping. If this is the case, measurements of diacetyl in quality control may not be a good marker of volatile chemical exposure in quality control. Quality control diacetyl measurements probably should not be compared to diacetyl measurements in other parts of microwave popcorn production, since diacetyl may contribute a different proportion of the flavoring chemical exposures than in other areas of microwave production.
In our August 2001 interim report on the November 2000 cross-sectional data, we observed a relationship between airways obstruction and cumulative (but not current) occupational exposures. We have not seen a relationship between pulmonary function falls over the intervals of testing and current exposure measurements in 2000. As we reported to you by letter in early September 2001, many workers had excessive declines in their pulmonary functions between April and August. Between August and December, many workers had excessive declines, despite lower exposure measurements. Of 50 persons tested in both August and December 2001, nine had FEV1 losses of more than 150 ml in less than four months. Five had losses between 101 and 150 ml. Explaining the Paradox. Three explanations are possible for the continuing excess decline in pulmonary functions that have occurred among your workers despite reductions in exposure: 1) The airway injury in affected persons may progress for months after exposure is controlled. Some support for progressive damage after cessation of exposure exists in the former worker cases, two of whom had progressive declines after leaving employment for 19 and 35 months before stabilizing. The Springfield physicians caring for your workers have observed progression after some employees left

Page 119 Health Hazard Evaluation Report No. 2000-0401-2991
employment last fall, as well. Thus, it may not be surprising that control of exposure in the plant has not yet stopped excess declines in lung function. Since exposures fell further between August and November 2001, the next medical screening will be critical in showing whether injury progresses after exposure is controlled to low levels. 2) The levels of exposure may still be too high. This possibility raises the question of whether previously exposed workers may have been sensitized by previously higher levels and now react to low, even unmeasurable levels (by way of an allergy-like recognition of flavoring ingredients by the immune system). This phenomenon is common with some forms of occupational asthma and hypersensitivity pneumonitis, in which sensitized workers can never safely return to even low exposures. Some evidence exists for a sensitization mechanism in pathology specimens from two workers who have granulomas. Granulomas in lung biopsies often indicate immune sensitivity of lymphocytes which recognize specific foreign matter. In addition, an immune sensitivity would explain the report of a former worker with contact dermatitis, whose skin disease flared when he returned to the plant offices months after leaving employment. 3) We may not be measuring the right thing. The exposure causing the lung problems in the plant may still be uncontrolled. However, the epidemiologic information associating the symptom burden and pulmonary function abnormalities with a marker of volatile organic chemicals is strong, and we think that ingredients of the butter flavoring remain the most likely cause. Your approach to isolation and ventilation should work, regardless of the specific cause. Whatever the explanation, you and we will know that the present levels of exposure are safe enough for workers who have not already been affected only if new employees and previously unaffected employees do not develop either airway obstruction or excessive falls in FEV1 over three to four month intervals in the next year. New Workers. Of the 39 workers first tested in April, three additional persons had airways obstruction, two of whom had diagnoses of asthma prior to employment. Their first employment dates in the plant were November 2000, January 2001, and February 2001. Hence, they all were employed before many of your interventions to lower exposure were complete at the end of March. Their FEV1 results were abnormal, ranging from 46 to 74% of predicted on first testing in April. Only one improved after inhaling bronchodilator medication. In asthma, FEV1 improves after bronchodilator. The two retested in August had FEV1 declines of 210 and 400 ml. The employee with no history of asthma and no chest symptoms in April was retested in December and had lost 430 ml of FEV1. This employee may have developed fixed airway obstruction after less than five months employment, which has progressed rapidly since then. Of the 40 workers first tested in August 2001, only one had abnormal spirometry, with both obstruction and low forced vital capacity. This worker had been employed at the plant for many years and was likely exposed to the levels of flavoring chemicals that caused airways obstruction in other workers. In 41 workers first tested in December 2001, we found no new cases of airways obstruction. The group of employees first employed after controls will be the group that demonstrates whether the plant exposures are adequately controlled to prevent new employees from developing lung disease and excessive falls in pulmonary function. In 2002, we will look at the followup pulmonary functions of subgroups hired in April through October and hired after the controls were complete, excluding those known to be abnormal. These subgroups have different baseline pulmonary function on first testing. We expect that a normal population will have average pulmonary function of about 100% of predicted for their age, height, and
Page 120 Health Hazard Evaluation Report No. 2000-0401-2991
sex. In November 2000, the average FEV1 measurement of participating employees was 90.4%. In April 2001, the average FEV1 measurement for newly tested employees was 96.7%. In August, the average FEV1 measurement was 100.3%. In December, the average FEV1 measurement for newly tested employees was 98.4%. We conclude that many ill employees in November 2000 testing lowered the average below 100% and that the more recently employed workers in August and December have about what we would expect in average pulmonary function. Improvements in Lung Function. On the positive side, some employees have had impressive increases in their pulmonary functions in the last year, up to 510 ml. Improvement of lung function in some persons holds promise that control or elimination of exposure may result in at least partial reversal of ill health in some cases of obstructive disease. Plan. We plan our next environmental survey on March 19-20, if that is convenient for you. We would like to look more closely at quality control exposures. Our medical team can come April 8-11 to administer updated questionnaires and perform medical testing. We will conduct training of your staff in pulmonary function testing at the end of our visit, if possible. Please let us know whether these dates will work and whether you have questions that further analyses can help answer. Your efforts to control exposures have been impressive. We hope that the next survey will bring reassurance that the health of employees in the plant is stabilizing. The high participation rate in the December 2001 survey reflects management commitment and increases confidence in the results. High levels of participation by new and asymptomatic employees in our next testing will be critical to showing whether there are persistent risks to those who have never had higher exposures and have not been affected to date. We appreciate the excellent cooperation you have given us and hope that our collaboration will help prevent health problems in your employees.
Sincerely,
Kathleen Kreiss, M.D. Chief, Field Studies Branch
Greg Kullman, Ph.D., CIH Respiratory Disease Hazard Evaluation and Technical
Assistance Program Field Studies Branch Division of Respiratory Disease Studies
Enclosure cc: Jim Cook

Page 121 Health Hazard Evaluation Report No. 2000-0401-2991
Appendix I July 26, 2002 HETA 2000-0401 Interim Letter Report Mr. Eric Asselmeier Corporate Sanitarian and Compliance Officer Gilster Mary Lee Corporation 1037 State Street Chicago, Illinois 62233 Dear Mr. Asselmeier: In March and April of 2002, the National Institute for Occupational Safety and Health (NIOSH) conducted follow-up medical and environmental testing at the Gilster Mary Lee plant in Jasper, Missouri. Although we continue to analyze the extensive data collected at your plant, we want to share what we have learned so far. This letter provides interim results for these last visits. Exposures. The attached figures show the diacetyl and total dust concentrations for three different job categories by survey date starting with the November 2000 survey and ending with the March 2002 survey. Diacetyl concentrations (area and personal combined) are presented in Figure 1 in parts per million parts air by volume (ppm), and total dust concentrations (Figure 2) are in milligrams per cubic meter of air (mg/m3). Diacetyl concentrations in the microwave mixing room ranged from an average of 37.8 ppm in November 2000 to a low of approximately 0.11 ppm in September 2001. Note the diacetyl concentrations for November 2001 are higher than those reported in the February 27 interim report, which were in error. Although the diacetyl concentration measurements are lower since engineering controls were added in March 2001, the measurements for March 2002 were increased relative to those collected during 2001. We don’t know why levels have increased since September 2001 and wonder if this is a seasonal effect associated with less dilution from outside ventilation in cooler months. The average diacetyl measurements by job category for each of our visits are given in Table 1 (the same data as Figure 1). The average area total dust concentrations from the mixing room ranged from 0.17 mg/m3 (September of 2001) to 1.1 mg/m3 (March of 2002) as seen in Figure 2. Among machine operators and quality control areas, the lowest average concentration of total dust was found in machine operators in November 2001 (0.1 mg/m3) and the highest was found in the quality control area (0.24 mg/m3) in March of 2002. In general, total dust concentrations have not changed greatly with time and the implementation of engineering controls; however, the engineering controls implemented to date have been largely directed at reducing air concentrations of volatile organic gases and vapors from flavorings. The local exhaust ventilation system for salt dust control was already in place during the November 2000 survey.
Page 122 Health Hazard Evaluation Report No. 2000-0401-2991
QC Workers. In more complex analyses performed since our interim report in August of 2001, we reported an additional high risk work area in the plant - quality control (QC), in which 5 of the 6 workers had airways obstruction. Consequently, during our March 2002 survey, we took a closer look at operations in the QC area and observed the quality tests including the microwaving of the popcorn bags obtained from the packaging operations. The bags were subsequently opened and emptied into tall graduated cylinders to measure the popped corn volume. The unpopped kernels were counted and the salinity measured from some samples. We were informed that both of the QC workers on each of the three shifts tested between 9 and 30 bags an hour - sometimes several simultaneously in the five microwave ovens. A photo ionization detector was used in the QC room to directly measure total volatile organic compounds (VOCs) as QC tests were conducted on ten bags of popcorn, including several different popcorn recipes. During some of the tests, temperatures were measured using a handheld non-contact infrared thermometer. Readings were taken 1) prior to placement of the bag into a microwave oven, 2) while the corn was popping in the oven, 3) as the bag was opened subsequent to being microwaved, and 4) while the corn was being emptied from the bags into the graduated cylinders. These 4 steps are performed over a period of 2 to 5 minutes. The average peak measurements for these steps are shown in Figure 3. The probe of the VOC meter was positioned in front of the microwave door during steps 1 and 2, and one inch from the bag opening during steps 3 and 4. The surface temperature of the table was measured during step 1, the front of the oven door during step 2, and the bag opening during steps 3 and 4. Notably, as the temperature of the corn rose, so did the release of VOCs. As the bags were emptied, the corn started to cool and VOCs decreased quickly. We observed that the air from the ventilation exhausts under the 5 microwave ovens in the QC room is vented out towards the QC workers in the room. A burst of steam (and volatile organic emissions) could sometimes be seen as microwave popcorn bags were opened after heating. This was not always the case, as some bags had already burst at the seam prior to removal from the oven. Steam continued to rise from the corn as it was emptied into the test cylinders, but it quickly dissipated soon after. From our observations and measurements, we conclude that QC workers are repeatedly exposed for intervals of several seconds up to several minutes to elevated organic vapor concentrations by work processes throughout the shift. The sources of these vapors are the following: 1. Microwave oven fan exhaust air during cooking of the corn 2. Bursts of steam and flavoring vapors ejected as bags are opened 3. Vapors rising from corn while being loaded into graduated cylinder Additionally, the increased heat from microwaving the popcorn and flavoring ingredients can create a profile of volatile organic compounds different from other plant areas. In our March 2002 survey, chlorodifluoromethane, isobutane, C7 aliphatic hydrocarbons, heptane, furfural, and 2-(2-butoxyethoxy)ethanol were more abundant in the quality control room than in the microwave mixing room. Exposure Control. Currently, ventilation in the QC room consists of a small ceiling exhaust fan located towards the rear of the room. This ventilation system is not adequate to remove the volatile compounds generated through QC testing. Control at the sources would improve air quality in the QC room and reduce worker exposures. We suggest that a

Page 123 Health Hazard Evaluation Report No. 2000-0401-2991
vented enclosure(s), similar to a laboratory hood, be installed and all of the testing operations that involve heated popcorn flavorings be performed within that enclosure. It should have a vertical sash in front that can be lowered to the minimal height that allows the workers to perform their tasks with their arms under the sash. Ventilation slots should be located to the rear of the enclosure. It may be necessary to seal the top, bottom, and sides of the ovens so that the air will be directed only to the ventilation slots at the rear. The measuring cylinders are too tall to manipulate on the counter within the enclosure, so part of the cabinet below could be cut out to allow the tops of the cylinders to be at a convenient working level within the enclosure. In addition to these recommended engineering changes in quality control, we recommend the addition of a supply air source for the mixing room since this room is now closed with the air lock system. This would aid removal of contaminants from this room and the building. Lung Function. During our visits in November 2000, April, August, and December 2001, and April 2002 we tested 276 different current workers at the Jasper plant, some of whom began or left employment in this period. In April 2002, we tested 118 workers currently on the GML payroll; 110 of these workers were working at the time of the testing and eight were on medical leave and tested off-site. Of the 117 with good quality spirometry, 85 (73%) had been tested at least once before. Of these 85, the change in forced expiratory volume in one second (FEV1) since their last test ranged from -860 ml to +510 ml in the current workforce and -340 ml to +250 ml in those workers on medical leave (Figure 4). We expect normal nonsmokers and most smokers to lose about 30 ml in the FEV1 measurement over the course of a year after they have reached their maximum lung volume in their mid-twenties. FEV1 declines of 150 ml or greater over a year are very unusual and cannot be attributed to smoking alone, yet they occurred in 17 (22%) of the current workers tested and 3 (43%) of workers on medical leave tested in April 2002. The interval between tests for most workers tested on two occasions was four months. In April 2002, four workers had newly documented airways obstruction, all of whom were current smokers. Two had borderline airways obstruction during previous tests and had worked in the plant before engineering controls were implemented (March 2001). They had developed symptoms prior to controls being in place and had progressive declines in FEV1 over the period of NIOSH testing. The other two workers with airways obstruction were hired in the two-month period before the April 2002 testing. One of them may have had pre-employment lung disease, although symptoms worsened with employment. The other new employee had no previous or current respiratory symptoms, had no response to bronchodilator, and was younger than we would expect to see abnormalities due to smoking habit. Without preplacement spirometry testing, we cannot exclude the possibility that this worker’s airways obstruction is related to exposures encountered in Gilster Mary Lee employment. The 26 newly tested workers who were employed since the December testing had a mean FEV1 percent predicted of 102%. The total number of workers with airways obstruction among the 276 persons ever tested by NIOSH is 34. Thirty of these 34 workers were employed before exposures were lowered by April 2001. These updated numbers correct a miscount in the February 27 report. We are preparing a manuscript entitled “Pulmonary Function Decrease In Popcorn Production Workers: One-Year Follow-Up”. When using time dependent proportional hazard analysis (Cox models) for this manuscript, we observed an excess risk of airways obstruction for mixers and quality control workers. The reported duration of work at the plant times the exposure levels measured in November 2000 were used to estimate exposures for each employee through March 2001. The risk of airways obstruction was excessive for all workers with high exposures, including quality control workers, mixers, and microwave popcorn packagers. We then extended the analysis to include the results of

Page 124 Health Hazard Evaluation Report No. 2000-0401-2991
surveys done in April, August, and November 2001. We used exposure measurements from April and August 2001. The excessive risk of developing airways obstruction remained for quality control workers. Exhaled nitric oxide. In December 2001 testing, we collected exhaled breath in Mylar balloons from 135 workers. Participants received their personal results in December. Exhaled nitric oxide is elevated in patients with poorly controlled asthma and is reduced in cigarette smokers with chronic bronchitis. The median concentration of exhaled nitric oxide was 5.9 parts per billion (ppb) (range 2.4-15.6). Workers in microwave mixing, packaging, quality control and maintenance (the high risk group) had a lower median measurement (5.5 ppb), compared with lower risk workers (median: 6.6 ppb). After adjusting for smoking status, workers reporting fever, chills, night sweats, and tiredness were more likely to have an exhaled nitric oxide measurement above 9 ppb. We did not observe any significant differences in exhaled nitric oxide between workers with and without respiratory symptoms, spirometry abnormalities or excessive FEV1 decline. These results, although interesting to us, do not suggest that this test is useful in screening for early airways problems associated with flavoring exposures before spirometry becomes abnormal. Our results are limited by having only a single occasion of exhaled nitric oxide measurement, about eight months after engineering changes had lowered exposures to flavoring volatiles. Plan. We plan our next environmental survey on August 13-15, 2002, if these dates are still convenient for you. From an environmental standpoint, we would like to look more closely at potential sources of exposure variability in microwave operations, including evaluating ratios of flavoring volatiles by work process, reevaluation of exposure point sources, and evaluating ventilation patterns in the mixing room and microwave packaging areas. We would also like to document breathing zone exposure of QC workers with a direct reading instrument. Our medical team is coming on August 5 -9, 2002, to administer updated questionnaires and perform medical testing. Please let us know whether you have questions that further analyses can help answer. Your collaborative efforts in the longitudinal follow-up study as well as continued exposure control are an important part of protecting worker health. We have some concern that recent exposure measurements show increased concentrations of diacetyl, despite isolation of the mixing room and additional engineering controls in the fall of 2001. We had hoped that our training of your staff in spirometry would allow you to develop experience and demonstrate proficiency in spirometry of adequate quality for longitudinal comparison. Following a November 2002 longitudinal follow-up survey, we would like to again consider options for the transfer of these medical and environmental evaluation efforts to your company and/or consultants if the hazard seems to be controlled and health effects are stabilizing. Too date, however we are unable to assure your workforce that the hazard is resolved. We appreciate the excellent cooperation you have given us to date and hope that our combined efforts will help prevent health problems in your employees. Sincerely,
Kathleen Kreiss, M.D. Chief, Field Studies Branch Division of Respiratory Disease Studies

Page 125 Health Hazard Evaluation Report No. 2000-0401-2991
Greg Kullman, Ph.D., CIH
Respiratory Disease Hazard Evaluation and Technical Assistance Program
Field Studies Branch Division of Respiratory Disease Studies Enclosure cc: Jim Cook Dr. Rich Rethorst Dr. Cary Bisbey Dr. John Wolfe Dr. Eduardo Simoes

Page 126 Health Hazard Evaluation Report No. 2000-0401-2991
Table 1. Average Diacetyl Concentrations by Survey Date and Job Category
DATE JOB N MEAN (ppm)
STD (ppm)
Nov 2000 Mixer 10 37.8 27.6
Machine Operator 9 1.68 1.61
Quality Control 3 0.54 0.30
April 2001 Mixer 9 0.27 0.20
Machine Operator 9 0.08 0.07
Quality Control 5 0.14 0.18
Sep. 2001 Mixer 5 0.11 0.10
Machine Operator 9 0.01 0.02
Quality Control 3 ND --
Nov. 2001 Mixer 8 0.52 0.49
Machine Operator 9 0.10 0.06
Quality Control 7 0.11 0.05
March 2002 Mixer 4 2.18 1.27
Machine Operator 5 0.37 0.06
Quality Control 4 0.25 0.02 ppm - parts per million parts air STD - Standard Deviation N - Number of Measurements ND - Not Detectable

Page 127 Health Hazard Evaluation Report No. 2000-0401-2991
Figure 1. Average Diacetyl Concentrations by SurveyDate and Job
0.001
0.01
0.1
1
10
100
00-NOV O1-APR O1-SEP O1-NOV O2-MAR
DATE
PPM
MIXER MACHINE OP QC

Page 128 Health Hazard Evaluation Report No. 2000-0401-2991
Figure 2. AverageTotal Dust Concentrations by SurveyDate and Job
0.01
0.1
1
10
00 - NOV O1 - APR O1 - SEP O1 - NOV O2 - Mar
DATE
MgM
3
MIXER MACHINE OP QC

Page 129 Health Hazard Evaluation Report No. 2000-0401-2991
*Figure 3 Legend: Measurements of peak temperature and VOCs during four steps in the QC process. Each point presents the average of readings taken during QC testing of ten different bags of popcorn.
Figure 3. Average Peak Temperatures and VOC Concentrations during QC Testing
0
50
100
150
200
250
300
350
prior to cooking popping opening bag emptying bag
Tem
pera
ture
(o F)
0
10
20
30
40
50
60
70
Tota
l VO
Cs
(abu
ndan
ce)
Temp VOC

Page 130 Health Hazard Evaluation Report No. 2000-0401-2991
This page was intentionally left blank.

Page 131 Health Hazard Evaluation Report No. 2000-0401-2991
Appendix J December 13, 2002 HETA 2000-0401 Interim Letter Report Mr. Eric Asselmeier Corporate Sanitarian and Compliance Officer Gilster Mary Lee Corporation 1037 State Street Chicago, Illinois 62233 Dear Mr. Asselmeier: In August of 2002, the National Institute for Occupational Safety and Health (NIOSH) conducted follow-up medical and environmental testing at the Gilster Mary Lee plant in Jasper, Missouri. We want to share what we have learned so far, as our analyses continue. This letter provides interim results for our November 2000 through August 2002 visits. Exposures The attached figures provide a summary of diacetyl and total dust concentrations for three different job categories by survey date, starting with the November 2000 survey and ending with the August 2002 survey. Diacetyl concentrations (area and personal combined) are presented in Figure 1 in parts per million parts air by volume (ppm). Total dust concentrations are presented in Figure 2 in milligrams per cubic meter of air (mg/m3). Diacetyl concentrations in the microwave mixing room ranged from an average of 37.8 ppm in November 2000 to a low of approximately 0.11 ppm in September 2001. The mixing room diacetyl concentrations for August 2002 were 1.6 ppm, down slightly from those previously reported from the March 2002 sampling. During the August 2002 survey, we observed the exhaust fan port for the mixing room had been reduced in size due to recent construction activities. Additionally, the mixing room was still without a supply air source; however, it was reported that mixing operations were to be relocated soon into a new mixing room adjacent to the existing room. Further, this new mixing room will have supply and exhaust ventilation systems separate from the packaging area. Diacetyl concentrations among machine operators ranged from an average of 1.68 ppm in November 2000 to a low of approximately 0.01 ppm in September 2001. The machine operators diacetyl concentrations for August 2002 were 0.03 ppm. The quality control (QC) room showed the greatest reduction in average diacetyl concentration, compared to both the November 2000 and March 2002 concentrations. The average diacetyl concentration in the QC room for August 2002 was 0.008 ppm. These reduced diacetyl concentrations likely reflect the additional outside air supplied to the microwave areas during summer operating conditions plus recent exposure controls added to the QC room. The average diacetyl concentrations by job category for each of our visits are given in Table 1 (the same data as Figure 1). The average area total dust concentrations from the mixing room ranged from 0.17 mg/m3 (September of 2001) to 1.1 mg/m3 (March of 2002) as seen in Figure 2. The mixing room total dust concentration for the August 2002 survey was 0.69 mg/m3. Among machine operators, the average area total dust concentrations ranged from 0.18 mg/m3 (November 2000) to 0.1 mg/m3 (September 2001). In general, the machine operators' total dust concentrations have not changed greatly with time and the

Page 132 Health Hazard Evaluation Report No. 2000-0401-2991
implementation of engineering controls. The engineering controls implemented to date have been largely directed at reducing air concentrations of volatile organic gases and vapors from flavorings. The total dust concentrations in the quality control room were lowest in August of 2002 (0.09 mg/m3), in contrast to the highest concentrations measured during the March 2002 survey of 0.24 mg/m3. QC Workers We previously reported that QC workers were a high risk population since 5 of the 6 workers in this job category had airways obstruction. During our March 2002 survey, we took a closer look at process operations and worker exposures in the QC area. From these observations and measurements, we concluded that QC workers were repeatedly exposed for several-second to several-minute intervals of elevated organic vapor concentrations by work processes throughout the shift. Additionally, we observed that the increased heat from microwaving the popcorn and flavoring ingredients created a profile of volatile organic compounds different from other plant areas. Based on these observations, we recommended that a vented enclosure(s), similar to a laboratory hood, be installed and all of the QC testing operations that involve heated popcorn flavorings be performed within that enclosure. We also recommended that the measuring cylinders be used at a convenient working height and location within the enclosure. Prior to our August 2002 survey, a hood enclosure was added to the QC bench. The hood used existing QC room exhaust ventilation and had plastic front curtains to allow worker access for quality tests. All quality tests were done within the hood. Further, microwaved bags of popcorn were allowed to cool prior to opening for subsequent QC tests, further reducing volatilization of flavoring constituents and worker exposures. Following these control changes, both time-weighted average dust and diacetyl concentrations in the QC room were reduced relative to the concentrations measured during the previous March 2002 survey. Additionally, direct measures of diacetyl and acetoin were lower in the QC workers' breathing zones than those measured within the new hood enclosure. These concentration reductions may be due in part to the increased outside air intake during summer operating conditions and also the additional control changes added to the QC area. Further engineering control changes are planned for the QC room including 1) the redesign of the existing hood to increase the size of the exhaust fan and hood; 2) redirecting the microwave oven exhausts away from the hood opening; 3) increased exhaust air, and 4) a powered source for air supply. Collectively these control modifications should further reduce worker exposures and should be further evaluated with environmental sampling. Lung Function and Trends in FEV1 We performed spirometry testing August 5-9, 2002, for a total of 114 current workers who volunteered for the survey; seven were on medical leave and 24 had not been previously tested. Of the 24 newly tested current workers (with no prior spirometry testing), 1 had mild airways obstruction and 4 had borderline or mild reductions in their vital capacity (restriction). These findings underscore the need for preplacement lung function testing at your facility, since all 5 of these workers with borderline or abnormal spirometry had started work since our last medical survey in April 2002. In the absence of preplacement testing you cannot know if these are new or pre-existing abnormalities.

Page 133 Health Hazard Evaluation Report No. 2000-0401-2991
Since we now have spirometry results for up to six surveys done for 83 current employees, we concentrated our effort on interpreting the trends (changes) in their lung function. For each of these employees, we printed a trend graph which shows how their forced expiratory volume in one second (FEV1) changed over the surveys in which they participated. The FEV1 is the most important lung function measurement since it is highly repeatable and is sensitive to both of the major types of lung disease: airways obstruction and restriction of lung volumes. In the Appendix, we show six examples of trend graphs and the pertinent portions of the letters to participants which accompanied each of them. We categorized the FEV1 trends from each of the 83 employees into one of these six categories. We assigned a category letter (A to F) to each one, in order of our increasing concern. Category A, for example, is for workers whose lung function is normal and stable. Category B is for those whose lung volume is at the lower limit of normal or slightly below, but stable. Category E is for participants whose lung function is definitely abnormal, but stable. If a participant's FEV1 was falling faster than 150 ml between their most recent two surveys or if their annualized FEV1 decline was greater than 150 milliliters, we categorized them as "rapid fallers." Rapid fallers can be in one of three trend categories: C (falling within the normal range), D (falling recently within the normal range), or F (abnormal and falling rapidly). Before assigning each worker to a category, we decided that if more than 10% of current employees were rapid fallers, we would conclude that a respiratory hazard remains at the plant. We believe that about 5% of the general population of adults may be rapid fallers (due to cigarette smoking or other health hazards); so we decided that it would be highly worrisome if more than twice that rate of current workers were rapid fallers. A recently published study shows that in adult smokers with airways obstruction, the trend in lung function determined by six surveys does very well at predicting lung function (and lung function impairment) six years later (Am J Respir Crit Care Med 2002; 166:675-679). This means that workers who are rapid fallers may develop disabling loss of lung function before retirement. The following numbers of employees fell into each category: 42 in A (normal and stable); 6 in B (borderline and stable); 19 in the combined C and D groups (normal but falling rapidly); 13 in E (abnormal and stable); and 3 in F (abnormal and falling rapidly). Therefore, we categorized 26.5% of the current workers with 2 or more spirometry tests as rapid fallers (downward trends C, D, or F). Of these 22 workers, five were currently working in jobs with direct exposure to flavorings--four in full- or part-time mixing and one in quality control, both jobs previously shown to have high risk of airways obstruction. The four mixers with rapid declines constitute half of the eight participants in the survey who have ever listed mixer or back-up mixer as their job title. Overall, 11 of the 19 normal participants with rapidly falling FEV1 reported some past exposure in the mixing room, and six of the 11 had done mixing tasks. Of the 24 workers who began work at the Jasper plant after April 2001, when the majority of engineering controls for flavoring exposures were in place, seven (29.2%) had rapidly declining FEV1. Five of these individuals reported that all of their time had been spent working as packers, stackers, and/or machine operators on the microwave production line (27.8% of 18 with such job history). New employee participants appear to have similar rates of rapid decline as participating employees hired before controls were in place. Seven current workers on medical leave were tested again and had the following trend classifications: 1 in D (normal with recent fall); 3 in E (abnormal and stable); and 3 in F (abnormal and falling rapidly).

Page 134 Health Hazard Evaluation Report No. 2000-0401-2991
Conclusions The longitudinal sampling results suggest that diacetyl exposures are lower during summer operating conditions. This may be a result of operation of the outside air intake systems and more infiltration through doors and windows. Whether the fluctuating concentrations are safe is dubious, at best, given the longitudinal medical results. Average exposures in mixing in August 2002 are similar to the November 2000 exposures on the microwave production lines, which clearly carried excess risk. This underscores the importance of full-time mandatory respiratory protection for mixers and quality control workers, for all employees with either abnormal pulmonary function or rapid declines in lung function, and for all employees who wish to protect their lung health until the plant has been shown to be safe with regards to lung health effects. Exposures for machine operators, mixers, and quality control were all higher in August 2002 than in September 2001, even though they are improved since March 2002. To avoid increasing exposures with the colder season requires more attention to isolation of sources and enhanced ventilation. The occurrence of rapid lung function falls in new employees on the microwave packaging lines means that you would be wise to enclose or isolate the mezzanine holding tanks so that flavoring contaminants are not released into the general microwave packaging area. Preliminary sampling results show lower diacetyl and total dust concentrations in the QC room with the new engineering and work practice controls. On the health side, the trend results for lung function strongly suggest that there is a continuing risk to workers in the plant, in that a substantial subset of the workforce continues to have excessive decline in lung function. Recent rapid falls are difficult to attribute to higher exposures prior to engineering controls implemented by April 2001. We had hoped that testing of newly employed workers would give us and you confidence that those new to employment, after controls were introduced, were not being affected by flavoring exposures. However, the documentation of rapid declines in new employees over the last 16 months cannot reassure your work force that current exposures are safe. Although some new workers may be bringing pre-existing abnormalities to their employment at Gilster Mary Lee, the rates of abnormalities are high over the last 16 months, and without baseline testing you cannot document that these abnormalities did not result from employment at your facility. Serial spirometry allows identification of new and longer-term workers with rapid falls in breathing tests, still within the normal range. Persons with rapid declines would not be identified by preplacement testing or spirometry tests at a single point in time, but identifying workers with rapid declines may allow them to avoid developing significant lung disease. We repeat our counsel that you should provide employees with spirometry testing at the beginning of employment and at four-month intervals until you have demonstrated that your employees are not developing work-related lung disease. Recommendations and Plan In our meeting in St. Louis in March 2001, you indicated that you wanted NIOSH's involvement with your plant to be limited in time to 18 additional months. The results to date have not established that you have adequate environmental control in all seasons, and your employees continue to show effects of the exposures they have had in the past and more recently. However, we recognize that NIOSH studies have been disruptive of your production and workforce and also that it takes time to implement controls, such as isolating the mixing room and changing exposures in Quality Control. With this in mind, we agreed with you by phone to put off our next medical and environmental evaluation until early 2003. Anticipating that the next surveys might be our last, we wanted to see the exposure levels that resulted

Page 135 Health Hazard Evaluation Report No. 2000-0401-2991
from the continuing controls you have put in. We also wanted you to have the opportunity to implement lung function testing of your workforce so that we could document the quality that is required for comparing lung function tests over time. We sent two of our field staff to Jasper on November 14 and 15, 2002, to help you get started again, since the training we conducted for your staff on our equipment in April 2002 likely needed reinforcement. However, we now realize that there had been insufficient communication and mutual understanding, since you had no evident plan for serial testing of employees nor for preplacement testing of employees from your temporary agency. We will call you after you receive this letter so that we better understand the difficulties you have encountered and how we can help. We would like to schedule our industrial hygiene sampling during the last week of January 2003 and our medical testing during the first week of February, by which time we assume you will have moved the mixing room out of the plant and have fully implemented controls in Quality Control. The current findings support the following additional recommendations: 1. Communicate these findings to your workforce, so that workers can again weigh their lung risks in the plant and the advisability of respiratory protection. This is particularly important for those with abnormal lung function, those with rapid falls, and those in job categories with direct exposure to flavoring volatiles in mixing and quality control. We will prepare a worker update sheet to assist in this effort and assume that you will revitalize your respiratory protection program. 2. Complete implementation of controls on sources of flavoring exposure, with attention to possible short-term peak exposures. In light of cold-weather increases in diacetyl exposures and lung function declines among newer employees in the microwave packaging area, you should isolate the mezzanine holding tanks to further protect employees in the packaging area. 3. Characterize exposures after controls are in place to document the levels of exposure that hopefully will be shown to be safe through medical surveillance. NIOSH is prepared to assist you in these efforts. 4. Institute a lung function program conducting a lung function testing program of adequate quality to look at measurements in individual employees over time so that you can monitor and share your progress in assuring a healthful workplace for employees. NIOSH is prepared to continue intermittent testing until your staff have demonstrated excellent quality spirometry measurements for serial testing or until rapid declines in lung function are at expected rates. 5. Encourage workers with rapid falls even within the normal or borderline range to seek medical evaluation through your workers' compensation providers. Prevention of further damage is prudent for a condition which can be screened for by serial lung function measurements before workers are impaired. 6. Until the lung hazard in this plant has been controlled, continue testing all employees at four-month intervals. Although we have counseled individual participants who are normal or borderline and stable that they need to be tested annually, this interval may be excessive in view of the recent rapid declines seen in some participants. 7. Evaluate whether diacetyl and other volatile butter flavoring exposures can be lowered by changing flavoring formulations used in your microwave popcorn products, at least until exposure controls are effective in preventing continuing loss of lung function in employees.

Page 136 Health Hazard Evaluation Report No. 2000-0401-2991
As always, please let us know whether you have questions that further analyses can help answer. We have learned a lot at other popcorn plants in the last year, which you may find interesting. You are not alone in having this lung problem among your workers, as we can discuss by phone. We regret our misunderstanding about your intentions or readiness to assume responsibility for medical testing of your workers. Perhaps the six-month interval between August 2002 and February 2003 will demonstrate that the additional steps you are taking to prevent health problems in the workers are effective. We appreciate the excellent cooperation you have given us to date and hope that our combined efforts will prevent further health problems in your employees. Sincerely,
Kathleen Kreiss, M.D. Chief, Field Studies Branch Division of Respiratory Disease Studies Greg Kullman, Ph.D., CIH
Respiratory Disease Hazard Evaluation and Technical Assistance Program
Field Studies Branch Division of Respiratory Disease Studies Enclosure cc: Jim Cook Dr. Rich Rethorst Dr. Cary Bisbey Dr. John Wolfe Dr. Eduardo Simoes

Page 137 Health Hazard Evaluation Report No. 2000-0401-2991
Table 1. Average Diacetyl Concentrations by Survey Date and Job Category Concentrations in ppm
DATE JOB N MEAN STD
Nov 2000 Mixer 10 37.8 27.6
Machine Operator 9 1.68 1.61
Quality Control 3 0.54 0.3
April 2001 Mixer 9 0.27 0.2
Machine Operator 9 0.08 0.07
Quality Control 5 0.14 0.18
Sep. 2001 Mixer 5 0.11 0.1
Machine Operator 9 0.01 0.02
Quality Control 3 ND --
Nov. 2001 Mixer 8 0.52 0.49
Machine Operator 9 0.1 0.06
Quality Control 7 0.11 0.05
March 2002 Mixer 4 2.18 1.27
Machine Operator 5 0.37 0.06
Quality Control 4 0.25 0.02
August 2002 Mixer 6 1.6 2.25
Machine Operator 7 0.03 0.03
Quality Control 5 0.008 0.007
ppm - parts per million parts air STD - Standard Deviation N - Number of Measurements ND - Not Detectable

Page 138 Health Hazard Evaluation Report No. 2000-0401-2991
Figure 1. Average Diacetyl Concentrations by Survey Date and Job
0.001
0.01
0.1
1
10
100
00-NOV O1-APR O1-SEP O1-NOV O2-MAR O2-AUG
DATE
PPM
MIXER MACHINE OP QC

Page 139 Health Hazard Evaluation Report No. 2000-0401-2991
Figure 2. AverageTotal Dust Concentrations by SurveyDate and Job
0.01
0.1
1
10
00 - NOV O1 - APR O1 - SEP O1 - NOV O2 - MAR O2 - AUG
DATE
Mg/
M3
MIXER MACHINE OP QC

Page 140 Health Hazard Evaluation Report No. 2000-0401-2991
This page was intentionally left blank.

Page 141 Health Hazard Evaluation Report No. 2000-0401-2991
Appendix K
May 30, 2003 HETA 2000-0401
Interim Letter Report Mr. Eric Asselmeier Corporate Sanitarian and Compliance Officer Gilster Mary Lee Corporation 1037 State Street Chicago, Illinois 62233 Dear Mr. Asselmeier: In January and February of 2003, the National Institute for Occupational Safety and Health (NIOSH) conducted follow-up environmental and medical testing at the Gilster Mary Lee plant in Jasper, Missouri. We want to share what we have learned so far, as our analyses continue. This letter provides interim results for our November 2000 through February 2003 visits. Exposures Figure 1 provides a summary of diacetyl concentrations for three different job categories by survey date, starting with the November 2000 survey and ending with the January 28-30, 2003 survey. Diacetyl concentrations (area and personal combined) are presented in parts per million parts air by volume (ppm). Diacetyl concentrations in the microwave mixing room ranged from an average of 37.8 ppm in November 2000 to a low of approximately 0.11 ppm in September 2001. The average mixing room diacetyl concentrations for January 2003 were 0.23 ppm, down considerably from those previously reported from the March and August 2002 sampling. This average mixing room diacetyl concentration was the lowest measured in winter operating conditions. Changes since August included a new mixing room and the substitution of the new powder flavoring to replace one of the paste flavorings. Diacetyl concentrations among machine operators ranged from an average of 1.68 ppm in November 2000 to a low of approximately 0.003 ppm in January 2003, the lowest average exposure yet measured for this job category. Diacetyl concentrations in the quality control room ranged from an average of 0.54 ppm in November 2000 to below detectable limits (less than approximately 0.007 ppm) in September of 2001. The average diacetyl concentration measured in the quality control room for January 2003 was 0.07 ppm, increased from the previous average concentration measured during August of 2002; the five measurements ranged from nondetectable to 0.34 ppm. The average diacetyl concentrations by job category for each of our visits are also given in Table 1 (the same data as Figure 1). Figure 2 shows diacetyl concentrations from samples collected inside microwave mixing or holding tanks. Two samples were collected in the mixing tank which contained a slurry mix with Scisorek & Son paste flavoring; the concentrations were 28.1 and 27.3 ppm. The sample collected inside a flavor holding tank containing a slurry mix with a Flavor Concepts powder flavoring had a concentration of 0.6 ppm. These sampling results suggest that diacetyl concentrations in plant air can be influenced by the type of butter flavoring used.

Page 142 Health Hazard Evaluation Report No. 2000-0401-2991
Figure 3 shows the diacetyl sampling results from six side-by-side samples collected in two different locations: the mixing room and on the upper deck. Each bar represents an individual sampling result in terms of diacetyl concentration in ppm. This sampling was done to assess the reproducibility of the sampling used to measure diacetyl in air at Gilster Mary Lee. Collectively, the sampling results indicate good reproducibility for these sampling methods/efforts. Lung Function and Trends in FEV1 We performed spirometry testing on 121 current workers from January 31- February 7, 2003, during our seventh medical survey at your plant. Seven of these workers were on medical leave from the plant, 30 workers were tested for the first time, and 84 (69%) had participated in at least one previous survey. Of the 30 newly tested current workers, 1 test was uninterpretable, 1 had moderate airways obstruction without bronchodilator response, 1 had a borderline reduction in vital capacity (restriction), and 1 had a moderate reduction in vital capacity. All three employees with abnormal spirometry had started work in July 2002 or after. Among the 84 previously tested current workers, one new obstructive abnormality was documented in a worker who had been declining rapidly among the group that we consider high risk – those with any work in the mixing room and quality control. With this additional case, 22 (26%) had abnormal spirometry, of whom 10 (12%) had obstructive abnormalities. Eleven more workers (13%) had a borderline obstructive pattern (low FEV1/FVC ratio, but normal FVC and FEV1), but these have been observed before and are stable. Of the seven workers on medical leave, six continue to have abnormal pulmonary function. One of the seven increased 500 milliliters (ml) in FEV1 and is now in the normal range. Four others had some improvement in FEV1 but remained abnormal. One continued to have a rapid decline in FEV1. The worker with the greatest overall fall in FEV1 since November of 2000 has increased 230 ml since his test six months earlier. These improvements are very encouraging, since they show that with cessation of exposure to flavoring, some affected workers appear to have stabilized with some partial recovery. For each of the 84 current employees that we have tested multiple times since the fall of 2000, we provided a trend graph that showed how their forced expiratory volume in one second (FEV1) changed over the surveys in which they participated. The FEV1 is the most important lung function measurement since it is highly repeatable and is sensitive to both of the major types of lung disease: airways obstruction and restriction of lung volumes. Forty-five (54%) of these current workers have participated in five or more NIOSH surveys, and 23 (27%) have participated in all seven NIOSH surveys beginning in November 2000. If a participant's FEV1 fell more than 150 ml between their most recent two surveys or if their annualized FEV1 decline (based on all measurements) was greater than 150 ml, we categorized

Page 143 Health Hazard Evaluation Report No. 2000-0401-2991
them as "rapid fallers." We categorized 17 (20.2%) of the current workers with 2 or more spirometry tests as rapid fallers. This compares to 26.5% of the current workers being classified as rapid fallers during the trend analysis following the August 2002 survey. No difference existed in the proportion of rapid fallers in employees who were hired in April 2001 or subsequently (6/28 or 21.4%) and employees who were hired previously when exposures were higher on average (11/56 or 19.6%). Similarly, no difference existed in the proportion of rapid fallers among employees who were hired in April 2002 or subsequently compared to employees hired previously. Of the 23 persons who had participated in all seven surveys, only 8.7% had annualized slopes of 150 ml or more each year, based on all of their measurements. This is now below the 10% level we felt was cause for concern. Their average annualized change in FEV1 based on the last three measurements (April 2002 - January/February 2003) was an increase of 1 ml with a median increase of 19 ml, which compares to their average annualized decline in the first year of follow-up (November 2000 - November 2001) of 56 ml with a median decline of 53 ml. Using all the FEV1 data from seven measurements, these 23 employees had an average annualized decline of 26 ml and a median decline of 17 ml. These data suggest that there has been some recovery of average pulmonary function in the group in the ten months before the February testing. Recent NIOSH analyses of longitudinal spirometry testing in other workplaces support using a "rapid faller" criterion higher than 150 ml/year. Differences in data quality, level of risk, intervals between pulmonary function tests, and numbers of tests all affect what criterion should be used for an individual’s results and for the group results. If we use a 300 ml criterion, the respiratory health over time of your workforce as a group appears to be normal, even though individuals have become abnormal during the two and a quarter years of testing. We appreciated your allowing us to address your workforce during working hours in small groups in February, in lieu of public meetings in Carthage. We got consistent feedback that our results notification letters were ineffective in communicating our concerns about occupational lung hazards and whether individual workers needed to consider personal risk. Several groups asked us to put a “red star” on their letters if we had concerns about their personal results. Accordingly, in notifying workers of their personal results from the January/February 2003 testing, we pursued a different strategy from previous reporting of results. As you know, we had a cover sheet with a red sign for those with abnormal values or very rapid falls; yellow for those with rapid falls within the normal range; and green for those whose results were normal and stable. We spent considerable time customizing the letters, depending on their longitudinal graphs of FEV1 and the number and variability of their results. We suggested that most of those with very rapid falls or abnormalities seek workers’ compensation evaluation, and we knew that eight were already under the care of the Cox Medical Center in Springfield. We suggested referral to 21 additional persons not known to be under the care of the workers’ compensation physicians. Of these, 15 had abnormal spirometry which was stable and six were falling rapidly within the normal range. Our rationale was that

Page 144 Health Hazard Evaluation Report No. 2000-0401-2991
evaluation and counsel might prevent some workers who are still normal from becoming abnormal and prevent those with possible susceptibility from getting worse. We did not suggest workers’ compensation evaluation to all persons who met an arithmetic criterion for an annualized 150 ml rapid fall over the course of longitudinal testing, since some of them appeared to be improving, had participated in only a couple of surveys, or had sufficient variability in results to make us uncertain that they might benefit from consultation. Conclusions The decrease in exposure during the winter months on the packaging line is heartening, and we suspect that exposures are even lower, now that the upper deck area is enclosed. The January upper deck measurements shown in Figure 3 were substantially higher than machine operator measurements, which supports enclosing the upper deck holding tanks to control exposures in the packaging area. Mixing exposures were lower than they have been since November 2001, although they are comparable to or higher than the exposures measured in April and September of 2001. We suspect that the use of powdered encapsulated flavorings in late January 2003 likely contributed to the somewhat lowered exposures over previous measurements in 2002 when liquid and paste flavorings were being used. This interpretation is supported by our finding decreased diacetyl levels in the headspace of holding tanks containing powdered flavorings compared to tanks with paste or liquid flavorings. However, during the medical testing week in early February, the Kroger label flavorings were being used and may have been accompanied by increases in exposures, since plant personnel complained about more odor and eye and nose irritation with the change in flavoring formulation. We know that the plant previously producing the Kroger label had a high rate of pulmonary function abnormalities, which suggests that the Kroger flavoring now introduced into the Gilster Mary Lee plant may be accompanied by respiratory health effects among those workers who remain exposed in mixing, quality control, and maintenance. We are worried that quality control exposures appear to have increased again, compared to summer measurements. The use of powdered flavoring may decrease volatile organic chemical exposures in mixers but may result in unchanged exposures to quality control workers. The high temperatures in microwave ovens, paired with the generation of steam that dissolves the encapsulating materials in the flavoring, likely leads to similar magnitude exposures in quality control workers, regardless of whether paste, liquid, or powdered encapsulated flavors are used. The approach to protecting quality control workers should be a combination of respiratory protection and engineering controls, and the January measurements suggest that there is more progress to be made in lowering quality control exposures. The enclosure of the upper deck is not likely to have helped the quality control workers, since they have intense brief sources of exposures in the popping of microwave popcorn. We were pleased to hear in our May telephone call that you have now introduced additional ventilation in quality control.

Page 145 Health Hazard Evaluation Report No. 2000-0401-2991
On the health side, we have seen encouraging results from longitudinal testing. The proportion of your workforce with 150 ml falls in pulmonary function in two or more tests has fallen. The 23 current workers who have participated in all seven surveys show some slight reversal in their overall downward trend in FEV1, and the average loss in FEV1 is in the range suggested by cross-sectional data. Final interpretation of these trends requires complex statistical modeling and comparison with longitudinal pulmonary function data from other working populations. In the meantime, we believe that the data show that risk of occupational lung disease has decreased for many of your workers. We applaud the speed with which you implemented our recommendation that you enclose the upper deck with the holding tanks which were potential strong sources for volatile flavoring exposures in the packaging area. The worker groups that we continue to have concerns about are mixers, maintenance, and quality control workers. As we discussed by telephone, we have seen obstructive lung disease in mixers in most microwave popcorn plants that we have visited in the last two years, even when respiratory protection programs and exhaust ventilation of mixing tanks has been in place for a decade or more. These facilities also had measured diacetyl concentrations that were similar to, or lower than, the concentrations we measured in your mixing room in our last survey. We feel that mixers are at risk from intense brief exposures during open handling of flavorings and when looking into heated tanks that contain flavorings even when ventilation maintains low average air concentrations. As you know from your own experience, it is extremely difficult to assure compliance with the use of respiratory protection in employees who enter the mixing room. You have had disproportionate lung health deterioration in this group of employees in the last two years, with evolution of new abnormalities in young workers. The two potential solutions that merit a try are 1) complete substitution of encapsulated flavorings for pastes and liquid formulations and 2) engineering completely closed transfers of flavorings to prevent worker exposures. Quality control worker risk may be more difficult to prevent. Our exposure data from January 2003 suggest that encapsulated flavorings will not lower the exposures produced in microwave popping of the product. The exposures measured in January 2003 were about ten times higher than those measured in August 2002, despite the use of powdered flavorings. The highest measurement in quality control exceeded the average mixing room concentration. We suggest that you require respiratory protection in the quality control workers until further controls are in place. We understand that you are getting experience with baseline pulmonary function tests of new employees. As we wrote in our April 16 letter, we would like to return this summer to document that the pulmonary function declines in the workforce have leveled off. Would late July or early August be a possibility? Our focus could be on those ever in the mixing room and quality control. We could also help you develop your ongoing surveillance of these high risk groups. Our field staff is being deployed to U.S. ports of entry to assist with the Severe Acute Respiratory Syndrome (SARS) control, so we need to establish dates as quickly as we can. Our environmental team is planning to repeat measurements in the week of July 14, which we suspect

Page 146 Health Hazard Evaluation Report No. 2000-0401-2991
will document decreased exposures to packaging workers and hopefully to quality control workers. Recommendations and Plan 1. Communicate these findings to your workforce. 2. Require mixers and quality control workers to wear respiratory protection. Require maintenance workers to wear respiratory protection when near mixing or quality control operations. 3. Lower worker exposures in mixing, including short-term peak exposures, by developing closed systems for flavor handling. 4. Evaluate peak and average exposures in quality control with NIOSH in light of recent engineering controls. 5. Schedule NIOSH pulmonary function testing of your workforce in July or August of 2003 to document that high-risk worker groups are not having rapid declines. 6. Test new workers before placement so that pre-existing abnormalities are considered and a baseline exists, especially for follow-up of mixers, maintenance, and quality control workers, who should be tested three times per year. 7. Encourage workers with rapid falls even within the normal or borderline range to seek medical evaluation through your workers' compensation providers. 8. Continue to help evaluate whether diacetyl and other volatile butter flavoring exposures can be lowered in mixing by changing flavoring formulations used in your microwave popcorn products, at least until exposure controls are effective in preventing continuing loss of lung function in employees. We appreciate the excellent cooperation you have given us to date and hope that our combined efforts will prevent further health problems in your employees.
Sincerely,
Kathleen Kreiss, M.D. Greg Kullman, Ph.D., CIH Chief, Field Studies Branch Respiratory Disease Hazard Evaluation Division of Respiratory Disease Studies Technical Assistance Program Field Studies Branch Division of Respiratory Disease Studies
Page 147 Health Hazard Evaluation Report No. 2000-0401-2991
Enclosures cc: Jim Cook Dr. Rich Rethorst Dr. Cary Bisbey Dr. John Wolfe Dr. Eduardo Simoes

Page 148 Health Hazard Evaluation Report No. 2000-0401-2991
Table 1. Average Diacetyl Concentrations by Survey Date and Job Category Concentrations in ppm
DATE JOB N MEAN STD
Nov 2000 Mixer 10 37.8 27.6
Machine Operator 9 1.68 1.61
Quality Control 3 0.54 0.3
April 2001 Mixer 9 0.27 0.2
Machine Operator 9 0.08 0.07
Quality Control 5 0.14 0.18
Sep. 2001 Mixer 5 0.11 0.1
Machine Operator 9 0.01 0.02
Quality Control 3 ND --
Nov. 2001 Mixer 8 0.52 0.49
Machine Operator 9 0.1 0.06
Quality Control 7 0.11 0.05
March 2002 Mixer 4 2.18 1.27
Machine Operator 5 0.37 0.06
Quality Control 4 0.25 0.02
August 2002 Mixer 6 1.6 2.25
Machine Operator 7 0.03 0.03
Quality Control 5 0.008 0.007
January 2003 Mixer 12 0.23 0.22
Machine Operator 6 0.003 0.001
Quality Control 5 0.07 0.15
ppm - parts per million parts air STD - Standard Deviation N - Number of Measurements ND - Not Detectable
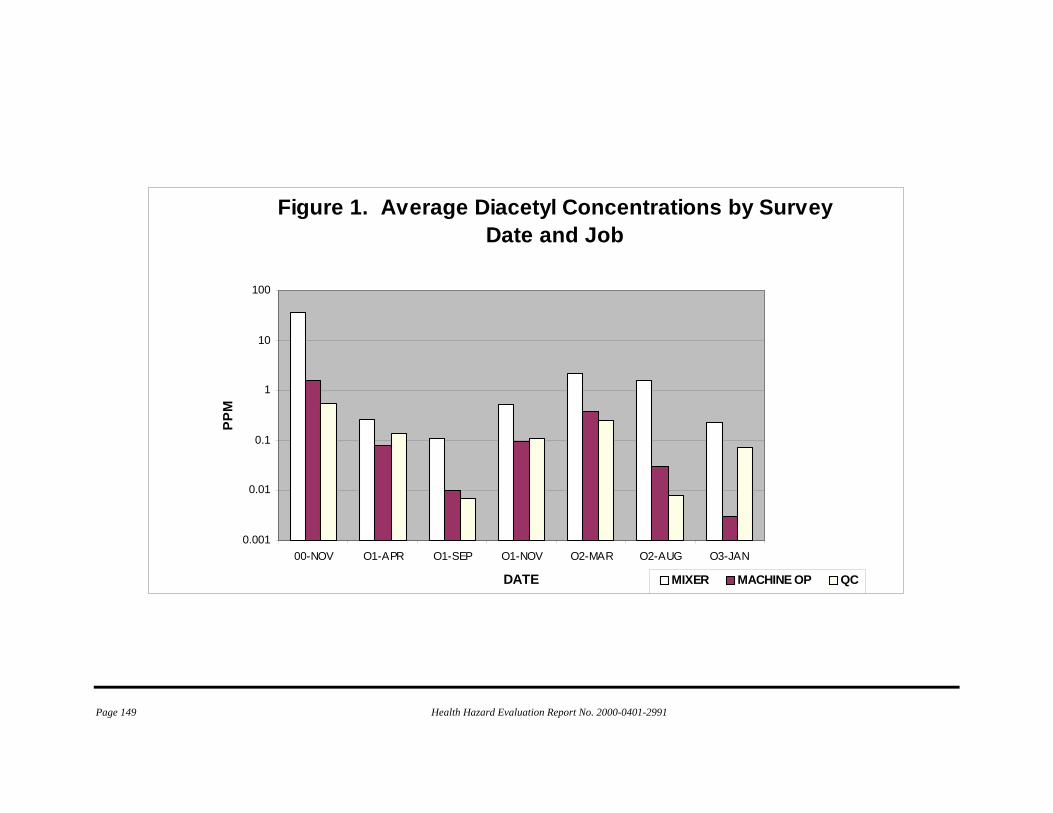
Page 149 Health Hazard Evaluation Report No. 2000-0401-2991
Figure 1. Average Diacetyl Concentrations by Survey Date and Job
0.001
0.01
0.1
1
10
100
00-NOV O1-APR O1-SEP O1-NOV O2-MAR O2-AUG O3-JAN
DATE
PPM
MIXER MACHINE OP QC

Page 150 Health Hazard Evaluation Report No. 2000-0401-2991
Figure 2. Diacetyl Concentrations from In-tank Samples
0.1
1
10
100
PPM
Paste Flavor Powder Flavor

Page 151 Health Hazard Evaluation Report No. 2000-0401-2991
Figure 3. Diacetyl Concentrations,Side-By-Side Method Comparison
0.01
0.1
1
Mixing Upper Deck
PPM
SAMPLING LOCATION

Page 152 Health Hazard Evaluation Report No. 2000-0401-2991
This page was intentionally left blank.

Page 153 Health Hazard Evaluation Report No. 2000-0401-2991
Appendix L
October 31, 2003 HETA 2000-0401
Interim Letter Report Mr. Eric Asselmeier Corporate Sanitarian and Compliance Officer Gilster Mary Lee Corporation 1037 State Street Chicago, Illinois 62233 Dear Mr. Asselmeier: In July and August of 2003, the National Institute for Occupational Safety and Health (NIOSH) conducted follow-up environmental and medical testing at the Gilster Mary Lee plant in Jasper, Missouri. We want to share what we have learned so far, as our analyses continue. This letter provides interim results for our November 2000 through August 2003 visits. Exposures
Cross-sectional industrial hygiene surveys were first undertaken at Gilster Mary Lee in a November 2000 survey. In January of 2001, NIOSH conducted an engineering control technology assessment and provided recommendations to reduce worker exposures. Since March of 2001, exposure measurements have been taken at intervals by NIOSH as exposure control changes were completed to reduce worker exposures and associated respiratory health problems. These changes were sequential, as noted in Table 1. The diacetyl and total dust exposures from the most recent July 2003 survey are presented in Table 2 and Figures 1 and 2. (The sampling and analytical methods were similar to those previously reported). Figure 1 provides a summary of diacetyl concentrations for three different job categories by survey date, starting with the November 2000 survey and ending with the July 2003 survey. The average diacetyl concentrations by job category for each of our visits are also given in Table 2 (the same data as Figure 1). Concentrations below detectable limits were assigned a value of one-half of the minimum detectable concentration in air for statistical analyses. Diacetyl concentrations (area and personal combined) are presented in parts per million parts air by volume (ppm). Average diacetyl concentrations in the microwave mixing room ranged from an average of 37.8 ppm in November 2000 to a low of approximately 0.11 ppm in September 2001. While the enclosure and ventilation of the mixing room has contributed to reduced worker exposures in packaging areas (since the mixing room was the primary point source for volatile organic exposures including diacetyl), area diacetyl concentrations in the mixing room increased following installation of the airlock enclosure in November of 2001. Respiratory protection is required in the mixing room and the mixer typically uses an air-line respirator. The average mixing room diacetyl concentration from the 8 samples collected during July 2003 was 0.46 ppm, up slightly from the January 2003 measure of 0.23 ppm. This increase may reflect the use of two new flavorings used to produce the new brand of microwave popcorn; these flavorings were not used during the previous January 2003 survey. Enclosure and ventilation of the mezzanine level in March of 2003 resulted in worker exposures below detectable levels in the packaging area. In July of 2003, diacetyl concentrations among machine operators (8 personal and area samples) were all below detectable limits, less than approximately 0.004 ppm. These were among the lowest diacetyl concentrations measured for this job category. Diacetyl

Page 154 Health Hazard Evaluation Report No. 2000-0401-2991
concentrations were also below detectable limits for the other microwave packaging room job categories (stacker and packer). Diacetyl concentrations in the quality control room ranged from an average of 0.54 ppm in November 2000 to below detectable limits in September of 2001 (below approximately 0.014 ppm) and also during the July 2003 survey (below approximately 0.004 ppm). The 10 diacetyl concentrations measured in the quality control room during the July 2003 survey were all below 0.004 ppm. These reduced concentrations in quality control reflect the engineering control changes completed in this area, including enclosure of the five microwave ovens in a separate, ventilated room. Area diacetyl concentrations were measured during both first and second shifts to assess potential for shift concentration differences for three job categories including mixer, machine operator, and quality control. Diacetyl concentrations from machine operators and quality control areas were similar across the two shifts, all below detectable limits. In the mixing room, the second shift area samples had both the highest diacetyl concentration (2.9 ppm on July 16, 2003) and the lowest mixing room diacetyl concentration (0.04 ppm on July 15, 2003). This documents that shifts and days vary in average exposures in the mixing room. Figure 2 provides a summary of total dust concentrations for three different job categories by survey date, starting with the November 2000 survey and ending with the July 2003 survey. The mixing room total dust concentrations have decreased over the last 3 surveys from 1.1 milligrams per cubic meter of air (mg/m3) in March of 2002 to 0.24 mg/m3 in the July 2003 survey. The total dust concentrations measured in July of 2003 for the machine operator and quality control job areas were the lowest levels measured to date. Lung Function and Trends in FEV1
We conducted our eighth medical survey of current workers from August 8 – August 15, 2003. A total of 135 current workers were tested: 97 (72%) of these workers have participated in at least one previous NIOSH survey, and 38 workers were tested for the first time. Five of the workers tested were on medical leave at the time of the survey. Six of the 38 newly tested current workers had an abnormal spirometry test; one had a mixed pattern of moderate airways obstruction (without bronchodilator response) and a low vital capacity, 4 had mild reduction in vital capacity (restriction), and 1 had a moderate reduction in vital capacity. Four additional workers had borderline airways obstruction (low FEV1/FVC ratio, but normal FVC and FEV1). All six employees with abnormal spirometry had started work in February 2003 or later, and all six currently worked in areas with diacetyl concentrations below detectable levels after the mezzanine tanks were isolated in March 2003. Among the 92 current workers with at least one previous test, 19 (20.7%) workers had abnormal spirometry, including 13 (14.1%) workers who had an obstructive pattern. One of these current workers was discovered to have a new obstructive abnormality during this survey. This worker had been warned during a previous survey that their lung function was falling faster than expected, although this worker has not reported ever working in a job or area that we consider at high risk for flavorings exposure (mixing, mezzanine, and quality control areas). Nine (9.8%) additional workers had borderline airways obstruction. Four of the five workers on medical leave from work continued to have abnormal spirometry tests. Three of these workers appear to have stable lung function, while the remaining two had drops in their FEV1 of more than 300 ml during the last six months. Both of these workers have been out of the plant for at least

Page 155 Health Hazard Evaluation Report No. 2000-0401-2991
two years. One worker on medical leave is being referred to a major medical center for a lung transplant evaluation. We have tested the lung function of 368 current workers from November 2000 through August 2003. Of these, 75 had abnormal pulmonary function, of whom 39 had obstruction (Figure 3). Six had an FEV1 that fell below 40% of their predicted FEV1 – the criterion used by the Social Security Administration to determine total lung disability. Two of these six are still working at the plant. Of the 92 current workers who have been tested more than once by NIOSH, 21 (23%) have participated in all eight medical surveys beginning in November of 2000, and 47 (51%) have participated in six or more surveys. Any worker with at least two measurements over time was sent a trend graph in months and years that showed how their forced expiratory volume in one second (FEV1) changed over the surveys. We followed the same procedure as used with the February 2003 data when interpreting change over time: If a participant's FEV1 fell more than 150 ml between their two most recent surveys or if their annualized FEV1 decline (based on all measurements) was greater than 150 ml, we categorized them as "rapid fallers." Using this strategy, we categorized 24 (26.1%) of the current workers with 2 or more spirometry tests as rapid fallers. This compares to 20.2% of the current workers tested in February 2003 and 26.5% of the current workers being classified as rapid fallers during the trend analysis following the August 2002 survey. In giving workers their individualized reports, we did not solely use the strict arithmetic criterion listed above. All workers’ trend plots were individually interpreted based on the number of tests, and the consistency and quality of the test results, in addition to whether they met the rapid faller criterion. Twelve (13%) of the workers were sent a letter indicating that their test results were falling faster than we would expect; seven of the workers had spirometry that was still within the normal range, and five had spirometry that was abnormally low. The attached Appendix contains the standardized text used to notify the workers of their trend results, although some letters were further customized to exclude the recommendation for workers’ compensation evaluation if we felt test results did not support referral. Respiratory Symptoms
Questionnaires were administered to 136 current workers during the August 2003 medical survey (one worker answered the questionnaire but did not have a lung function test). We have excluded the five workers on medical leave from the following comparisons. The questions used to define symptoms are in Table 3. Of the 131 current workers interviewed during the August 2003 survey, 24 (18%) reported usual cough, 20 (15%) reported shortness of breath, and 12 (9%) reported having regular trouble with their breathing (Table 4). Twenty-nine workers (22%) reported systemic symptoms, eight (6%) reported new skin problems since beginning work at the Jasper plant and 30 (23%) experienced work-related eye, nose, or throat irritation. All symptoms were reported less frequently in August 2003 than during our initial survey in November 2000. To gain some insight into whether the current conditions for workers at the Jasper plant differ from those present when we first surveyed this workforce, we compared respiratory, irritation, and systemic symptoms reported by the 30 current workers hired in March 2003 or after (when the enclosure of the mezzanine was completed) to the workers surveyed in November 2000 (Table 4). In general, the workers tested in November 2000 reported these symptoms 2-4 times more often than those recently hired. We also looked at the 49 workers who had participated in both the first and last medical surveys, as they have been present during most of the exposure control changes made at the plant. When we compared their symptoms reported in November 2000 to those reported in August 2003, there appeared to be no

Page 156 Health Hazard Evaluation Report No. 2000-0401-2991
change in usual cough, shortness of breath, or systemic symptoms, although fewer reported regular trouble with their breathing in August 2003 (Table 5). Eye, nose, and throat irritation was reported less frequently in August 2003 than in November 2000. Conclusions
Recent engineering controls appear to have eliminated detectable concentrations of diacetyl in the packaging and quality control areas. Ventilation tests (smoke tube samples) show that the mixing room and mezzanine areas are now under negative pressure relative to the packaging area so that volatile organic compounds from flavoring ingredients are contained. The packaging area is now likely safe for workers without respiratory protection, provided existing ventilation practices are maintained. The quality control room is greatly improved. However, diacetyl may not be a reliable marker of hazard in quality control, since it accounts for a lower proportion of volatiles generated at the high temperatures attained in microwaving. For this reason, safety can be assured in QC only by absence of new or progressive disease with continued medical monitoring. QC workers wishing to be prudent may want to continue use of respiratory protection in that area. Mixing room concentrations of diacetyl continue to be in a hazardous range. Persons entering the mixing room have shown rapid falls in lung function in the range of exposures that were documented in July. New cases of airways obstruction have occurred in the last year in this group. In other microwave popcorn plants, we have documented abnormal pulmonary function consistent with bronchiolitis obliterans in settings with 8-hour mixing exposures as low as 0.57 ppm diacetyl. We have documented abnormal pulmonary function in packagers in other plants with diacetyl exposures as low as 0.41 ppm. The mixing room in your plant had exposures as high as 2.9 ppm on one shift. Additional control of exposure is needed in the mixing/mezzanine area, since enclosure has increased worker exposure in these areas. Respiratory protection has not completely protected this subgroup of workers, as noted in our May 30 report, in which we described excessive pulmonary function decline and a new case of abnormal lung function among workers who enter the mixing room. We have observed cases of obstructive spirometry despite respiratory protection use in another microwave popcorn plant with a longstanding requirement of air-supplied respirators in mixing personnel. Further control of flavoring exposures in the mixing/mezzanine areas will require either the use of enclosed systems and transfers or the substitution of flavorings with lower emission of volatile organic flavorings including diacetyl. Both approaches may be necessary to reduce diacetyl concentrations in mixing room air to non-hazardous levels. We do not yet know how low volatile flavoring concentrations have to be to fully protect the health of workers. In fact, intermittent high exposures, as occurred in quality control and likely occurs when mixers raise tank lids, may be extremely hazardous even when average exposures over an 8-hour day are low. For this reason, we suggest that you proceed to eliminate the potential for peak exposures by eliminating any need for workers to lift lids on heated tanks. Until you have lowered exposures to flavoring volatiles to non-detectable concentrations, strict adherence to a formal respiratory protection program is required to protect mixers, supervisors, maintenance workers, and others who even occasionally enter the mixing or mezzanine area. Prudence dictates restricting the number of employees who enter the mixing and mezzanine areas. Our medical findings show that the work environment is much improved for the workforce as a whole by many engineering changes you have made since November 2000. This improvement is reflected in the dramatic drop in eye, nose, and throat irritation and respiratory symptoms in the whole workforce now compared to the whole workforce in November 2000. Employees hired since the mezzanine was enclosed have very low rates of symptoms. Of course, few employees remain of those who were tested in November 2000. Their respiratory and systemic complaints have not fallen to the level of new employees and they remain about twice as symptomatic as the plant population as a whole. This is expected for an

Page 157 Health Hazard Evaluation Report No. 2000-0401-2991
irreversible respiratory condition. In particular, they report no decrease in the prevalence of shortness of breath. One in three of these employees present in November 2000 appears to have persistent shortness of breath, similar to the sentinel former worker cases, who never improved. They report decreases in regular trouble breathing, and mucous membrane irritation with lower exposures, similar to the sentinel former worker cases after leaving employment. Some of the former worker cases reported in 2000 to the Missouri Department of Health and Senior Services continued to worsen in pulmonary functions over the two years after they ceased to have exposure (or left employment). This pattern of continued worsening is occurring among two of the workers on medical leave, as well. The lung transplant evaluation for yet another of your employees is a spur for continued vigilance in preventing any further cases, however mild. The occurrence of a new case of abnormality among those with rapid falls is distressing since we and you have not prevented this case even while testing employees frequently and notifying them of our concern about their course. Hopefully, your vigilance can be greater for those who enter mixing areas and quality control. The vast majority of workers are now no longer at risk, although evolution of injury sustained at past higher exposure levels may occur. New employees had high rates of abnormal lung functions. We do not have access to baseline tests you may have performed on the six persons with abnormalities, but these are not likely to be helpful if they were abnormal after variable times at work before testing. If your baseline tests are normal on these employees, you have reason for concern. If you obtained workers’ permission to release their baseline tests to NIOSH, as we suggested, we can answer this question of whether their NIOSH documented abnormalities are new. In any case, it is reassuring that only one (2.6%) had airways obstruction. All six (15.8% of twenty workers) had restriction. We have run some further analyses of the November 2000 pulmonary function data, comparing the rates of restrictive pulmonary functions with national data. These show that younger never smokers in your plant had about three times the risk of restriction on pulmonary function testing, but other subgroups did not have statistically significant increases. We do not know whether the new employees in the August testing are showing early signs of lung disease which might be part of the spectrum of flavoring-related occupational lung problems. We will be looking into data we have collected from other plants in the coming weeks to see if we can clarify the possible risk of restrictive lung disease in the industry. Over all, the serial lung function testing has identified progressive disease in individuals but has not helped to establish whether the plant is safe. The rates of rapid falls have remained the same. We will continue analyses looking for evidence that rates of larger falls have decreased. The proportions of the workforce with abnormalities and airways obstruction have decreased with each follow-up survey, which suggests that new employees are not becoming ill at the rates that we observed in November 2000.
Recommendations
1. Communicate these findings to your workforce. We will supply you with a fact sheet that will summarize these findings for your workers. 2. Implement engineering controls and product substitution to lower concentrations of diacetyl and other flavoring-related volatile organic compounds in the mixing room and mezzanine area. 3. Mandate respiratory protection in the mixing and mezzanine areas until levels of diacetyl and other volatile organic compounds are lowered to below detectable limits. The provisions of a formal respiratory protection program should be followed as specified by the Occupational Safety and Health Administration, with quality control checks and assessment to ensure compliance.

Page 158 Health Hazard Evaluation Report No. 2000-0401-2991
4. Make respiratory protection available to quality control workers since diacetyl has not proven to be a reliable marker of hazard in this work area. Quality control workers who wear respirators should also participate in the formal respiratory protection program. 5. Conduct environmental sampling during winter operating conditions because diacetyl levels have been higher in the winter. 6. Develop a routine sampling program for mixing operations and continue sampling until diacetyl concentrations are below detectable levels. Conduct sampling in other microwave plant areas to guide intervention priorities when plant processes, materials, or environmental conditions change. 7. Provide workers who have routine or possible exposure to flavorings (including mixers, back-up mixers, maintenance workers, production supervisors, and quality control workers) with lung function tests three times a year to monitor their lung health, guide individual worker placement decisions, and assess need for lowering exposures. Employees should receive a copy of their individual test results and referral for workers’ compensation physician evaluation for abnormals and rapid declines. The company performing your spirometry testing should provide test interpretations, compare serial test results, and refer employees as necessary. This medical surveillance should continue until transfers in mixing the flavorings are completely enclosed or levels of diacetyl and other volatile organic compounds are maintained below detectable limits. We appreciate your substantial investment in engineering changes in your plant that will likely protect most microwave popcorn production workers. We will review your medical and environmental surveillance testing of those with mixing room and quality control room exposure in early 2004. Please let us know whether we can assist you in implementing our recommendations. We hope that what we have learned together over three years can prevent further cases of lung disease, even among your workers at continuing high risk in the mixing and mezzanine areas.
Sincerely,
Kathleen Kreiss, M.D. Chief, Field Studies Branch
Greg Kullman, Ph.D., CIH Respiratory Disease Hazard Evaluation Technical Assistance Program Field Studies Branch Division of Respiratory Disease Studies cc: Jim Cook Dr. Rich Rethorst Dr. Cary Bisbey Dr. John Wolfe Dr. Baoping Zhu, MODOH

Page 159 Health Hazard Evaluation Report No. 2000-0401-2991
Table 1. Exposure Control Changes by Completion Date
Date Event April 18, 2000 Added 2 powered roof intake fans in microwave packaging. April 18, 2000 Roof intake fan added to compressor room. February 12, 2001 Exhaust fan in mix room. February 2001 Flavor tanks vented to exhaust fan. March 29, 2001 Pump for transfer of flavor between holding and mixing tanks. May 22, 2001 Ventilation of oil tanks # 1 & 2 on mezzanine. June 6, 2001 Flavoring cabinets. July 16, 2001 Controller for heat on flavor tank. August 7, 2001 Intake for Rupp completed. September 11, 2001 Exhaust fan in QC lab. September 18, 2001 Fresh air intake to QC lab installed. September 21, 2001 Exhaust for tank vents. 4 oil tanks on mezzanine vented. September 30, 2001 Exhaust blower installed on # 5-7 oil tanks on mezzanine. November 2, 2001 Flavoring transfer pump installed for 5 gallon containers. November 2, 2001 Air lock installed outside of the mix room.
May 13, 2002 SAR system in mix room and on mezzanine completed, but.worker training outstanding.
April 18, 2002 10,000 gallon bulk oil tank removed from plant. July 12, 2002 Exhaust fan in printer repair room in operation. August 2, 2002 Trained 1st shift mixer and placed SAR in operation.
August 9, 2002 Microwaves and testing counter in QC lab enclosed with curtains.
August 12, 2002 Installed multi fan in new mix room. September 7, 2002 Mix room moved but not completed. October 1, 2002 New mix room fan operational. February 14, 2003 Changed pre filter in SAR system. March 9, 2003 Mezzanine enclosure completed. April 10, 2003 Air handler functional on mezzanine. April 15, 2003 Exhaust fan for QC lab. April 15, 2003 2 Exhaust fans for mezzanine and mix room. May 13, 2003 Microwave ovens moved away from the lab.

Page 160 Health Hazard Evaluation Report No. 2000-0401-2991
Table 2. Average Diacetyl Concentrations (in ppm) by Survey Date and Job Category
DATE JOB N MEAN STD
Nov. 2000 Mixer 10 37.8 27.6
Machine Operator 9 1.68 1.61
Quality Control 3 0.54 0.30
April 2001 Mixer 9 0.27 0.20
Machine Operator 9 0.08 0.07
Quality Control 5 0.14 0.18
Sep. 2001 Mixer 5 0.11 0.10
Machine Operator 9 0.01 0.02
Quality Control 3 ND --
Nov. 2001 Mixer 8 0.52 0.49
Machine Operator 9 0.10 0.06
Quality Control 7 0.11 0.05
March 2002 Mixer 4 2.18 1.27
Machine Operator 5 0.37 0.06
Quality Control 4 0.25 0.02
August 2002 Mixer 6 1.60 2.25
Machine Operator 7 0.03 0.03
Quality Control 5 0.008 0.007
January 2003 Mixer 12 0.23 0.22
Machine Operator 6 0.003 0.001
Quality Control 5 0.07 0.15
July 2003 Mixer 8 0.46 1.00
Machine Operator 8 ND --
Quality Control 10 ND -- ppm - parts per million parts air. STD - standard deviation. N - number of measurements. ND - not detectable, less than 0.004 ppm for the July 2003 survey and less than 0.014 for September 2001 survey.

Page 161 Health Hazard Evaluation Report No. 2000-0401-2991
Table 3. Questions Used to Define Symptoms
Symptom Question
Usual Cough
Do you usually have a cough?
Shortness of breath Do you get short of breath walking with people of you own age on level ground?
Trouble breathing Selection of one of the following descriptions:
I have regular trouble with my breathing but it always gets completely better.
My breathing is never quite right.
Systemic symptoms A positive response to at least one of the following:
While working at Jasper Foods, have you had weekly or daily fever?
While working at Jasper Foods, have you had weekly or daily chills?
While working at Jasper Foods, have you had weekly or daily night-sweats?
While working at Jasper Foods, have you had weekly or daily flu-like achiness?
While working at Jasper Foods, have you had weekly or daily unusual tiredness or fatigue?
Skin problems since hire Since working at Jasper Foods, have you developed any new skin rash or skin problems?
Eyes, nose, throat irritation Is there any exposure in your work environment that you find irritating to your eyes, nose, or
throat?

Page 162 Health Hazard Evaluation Report No. 2000-0401-2991
Table 4. Comparison of Reported Symptoms Between Workers Hired Since Mezzanine Enclosure, Workers Initially Interviewed in November 2000, and All Workers Interviewed in August 2003
Reported symptom November 2000
Survey (117 workers)
August 2003 Survey
(131 workers)
Employees hired 3/2003–8/2003 (30 workers)
Usual cough 36 (31%) 24 (18%) 2 (7%)*
Shortness of breath 31 (28%)** 20 (15%) 3 (10%)*
Trouble breathing 37 (32%) 12 (9%) 3 (10%)*
Systemic symptoms 43 (37%) 29 (22%) 5 (17%)*
Skin problems since hire 34 (29%) 8 (6%) 0*
Eyes, nose, throat irritation 76 (67%) 30 (23%) 6 (20%)*
*Statistically significant difference in symptom prevalence between recently hired workers and November 2000 workers (p < 0.05)
**112 workers answered this question
Table 5. Comparison of Symptoms Reported in November 2000 and August 2003 by the 49 Workers Who Participated in Both Medical Surveys
Reported symptom November 2000
Survey August 2003
Survey
Usual cough 13/49 (27%) 12/49 (24%)
Shortness of breath 11/47 (23%) 13/49 (27%)
Trouble breathing 14/49 (29%) 9/49 (18%)
Systemic symptoms 15/49 (31%) 19/49(39%)
Eyes, nose, throat irritation 32/49 (65%) 14/49 (29%)

Page 163 Health Hazard Evaluation Report No. 2000-0401-2991
Figure 1. Average Diacetyl Concentrations by Survey Date and Job
0.001
0.01
0.1
1
10
100
OO-NOV
O1-APR
O1-SEP
O1-NOV
O2-MAR
O2-AUG
O3-JAN
O3-JULY
DATE
PPM
MIXER MACHINE OP QC

Page 164 Health Hazard Evaluation Report No. 2000-0401-2991
Figure 2. Average Total Dust Concentrations by Survey Date and Job
0.01
0.1
1
10
OO -NOV
O1 -APR
O1 -SEP
O1 -NOV
O2 -MAR
O2 -AUG
O3 -JAN
O3 -JULY
DATE
Mg/
M3
MIXER MACHINE OP QC

Page 165 Health Hazard Evaluation Report No. 2000-0401-2991
Figure 3. Cumulative Obstruction and Abnormal Lung Function
0
50
100
150
200
250
300
350
400
Nov-00 Apr-01 Aug-01 Dec-01 Apr-02 Aug-02 Feb-03 Aug-03
Survey
Par
ticip
ants
Total Number Tested Obstruction Abnormal

Page 166 Health Hazard Evaluation Report No. 2000-0401-2991
EVALUATION CRITERIA To assess the hazards posed by workplace exposures, NIOSH investigators use a variety of environmental evaluation criteria. These criteria suggest exposure levels to which most workers may be exposed for a working lifetime without experiencing adverse health effects. However, because of wide variation in individual susceptibility, some workers may experience occupational illness even if exposures are maintained below these limits. The evaluation criteria do not take into account individual hypersensitivity, pre-existing medical conditions, possible interactions with other work place agents, medications being taken by the worker, or environmental conditions. The primary sources of evaluation criteria for the workplace are: NIOSH Criteria Documents and Recommended Exposure Limits (RELs)1, the Occupational Safety and Health Administration (OSHA) Permissible Exposure Limits (PELs)2, and the American Conference of Governmental Industrial Hygienists (ACGIH®) Threshold Limit Values (TLVs®).3 The objective of these criteria for chemical agents is to establish levels of inhalation exposure to which the vast majority of workers may be exposed without experiencing adverse health effects. Occupational health criteria are established based on the available scientific information provided by industrial experience, animal or human experimental data, or epidemiologic studies. Differences between the NIOSH RELs, OSHA PELs, and ACGIH® TLVs® may exist because of different philosophies and interpretations of technical information. It should be noted that RELs and TLVs are guidelines, whereas PELs are standards which are legally enforceable. OSHA PELs are required to take into account the technical and economical feasibility of controlling exposures in various industries where the agents are present. The NIOSH RELs are primarily based upon the prevention of occupational disease without assessing the economic feasibility of the affected industries and as such tend to be conservative. A Court of Appeals decision vacated the OSHA 1989 Air Contaminants Standard in AFL-CIO v OSHA, 965F.2d 962 (11th cir., 1992); and OSHA is now enforcing the previous 1971 standards (listed as Transitional Limits in 29 CFR 1910.1000, Table Z-1-A). However, some states which have OSHA-approved State Plans continue to enforce the more protective 1989 limits. NIOSH encourages employers to use the 1989 limits or the RELs, whichever are lower. Evaluation criteria for chemical substances are usually based on the average personal breathing zone exposure to the airborne substance over an entire 8- to 10-hour workday, expressed as a time-weighted average (TWA). Personal exposures are usually expressed in parts per million (ppm), milligrams per cubic meter (mg/m3), or micrograms per cubic meter (µg/m3). To supplement the 8-hour TWA where there are recognized adverse effects from short-term exposures, some substances have a short-term exposure limit (STEL) for 15-minute peak periods; or a ceiling limit, which is not to be exceeded at any time. Additionally, some chemicals have a "skin" notation to indicate that the substance may be absorbed through direct contact of the material with the skin and mucous membranes. It is important to note that not all workers will be protected from adverse health effects if their exposures are maintained below these occupational health exposure criteria. A small percentage may experience adverse health effects because of individual susceptibility, a pre-existing medical condition, previous exposures, and/or hypersensitivity (allergy). In addition, some hazardous substances may act in combination with other work place exposures, or with medications or personal habits of the worker (such as smoking, etc.) to produce health effects even if the occupational exposures are controlled to the limit set by the evaluation criterion. These combined effects are often not considered by the chemical specific evaluation criteria. Furthermore, many substances are appreciably absorbed by direct contact with the skin and thus potentially increase the overall exposure and biologic response beyond that expected from inhalation alone. Finally, evaluation criteria may change over time as new information on the toxic
Page 167 Health Hazard Evaluation Report No. 2000-0401-2991
effects of an agent become available. Because of these reasons, it is prudent for an employer to maintain worker exposures well below established occupational health criteria. Diacetyl, Acetoin, and 2-Nonanone The ketones, diacetyl, acetoin, and 2-nonanone are predominant components of artificial butter flavorings and are extremely irritating to skin, eyes, mucous membranes and the respiratory tract. Currently, there are no NIOSH, OSHA, or ACGIH® occupational exposure standards or guidelines for them. Acetaldehyde Acetaldehyde is a colorless liquid used as a flavoring agent and adjuvant. When ingested or inhaled it can irritate the eye, nose, and throat. The Food and Drug Administration regulates it as a direct food additive and a synthetic flavoring substance. The OSHA PEL is 200 ppm (8-hour TWA). Acetaldehyde is considered a potential occupational carcinogen by the U.S. Environmental Protection Agency (EPA), the International Agency for Research on Cancer (IARC), and NIOSH. For this reason NIOSH recommends that occupational exposure levels of acetaldehyde be kept at the lowest feasible concentration (LFC). ACGIH® has a ceiling limit of 25 ppm. Acetic acid and Butyric acid Acetic acid is a colorless liquid with a strong vinegar-like odor. It is used in making dyes, drugs, plastics, food additives, and insecticides. The OSHA PEL is 10 ppm (8-hour TWA). NIOSH has an REL of 10 ppm (10-hour TWA) and a ceiling limit of 15 ppm. ACGIH® also has a TLV® of 10 ppm (8-hour TWA) and a ceiling limit of 15 ppm. Butyric acid is a colorless liquid with the smell of rancid butter. It is a low molecular weight fatty acid and can be found as a fermentation product in butter and beer. It is used in the manufacture of plastics. Currently, there are no NIOSH, OSHA, or ACGIH® occupational exposure standards or guidelines. Volatile Organic Compounds Volatile organic compounds (VOCs) describe a large class of chemicals which are organic (i.e., containing carbon) and have a sufficiently high vapor pressure to allow some of the compound to exist in the gaseous state at room temperature. These compounds are emitted in varying concentrations from numerous indoor sources and chemicals including, but not limited to, carpeting, fabrics, adhesives, solvents, paints, cleaners, waxes, cigarettes, combustion sources, and the flavorings used in the production of microwave popcorn. Studies have measured wide ranges of VOC concentrations in indoor air as well as differences in the mixtures of chemicals which are present. Research also suggests that the irritant potency of these VOC mixtures can vary. The use of total VOC concentration as an indicator, however, has never been standardized and neither NIOSH nor OSHA currently has specific exposure criteria for VOC mixtures. Particulates, Not Otherwise Classified Often the chemical composition of the airborne particulate does not have an established occupational health exposure criterion. It has been the convention to apply a generic exposure criterion in such cases. Formerly inappropriately referred to as “nuisance” dust, the preferred terminology for the non-specified particulate is now "particulates, not otherwise classified” (PNOC) (ACGIH® TLV®), or "particulates, not otherwise regulated" (PNOR) (OSHA PEL).

Page 168 Health Hazard Evaluation Report No. 2000-0401-2991
The OSHA PELs for PNOR are 15.0 mg/m3 (total dust) and 5.0 mg/m3 (respirable fraction), determined as 8-hour averages. The ACGIH® recommended TLV® for exposure to PNOC is 10.0 mg/m3 (total dust, 8-hour TWA) and 3 mg/m3 (respirable dust). These are generic criteria for airborne dusts which do not produce significant organic disease or toxic effect when exposures are kept under reasonable control. These criteria are not appropriate for dusts that have a biologic effect and may not be appropriate for evaluating general particulate matter in microwave popcorn packaging facilities. REFERENCES 1. NIOSH [2003]. Pocket guide to chemical hazards. Cincinnati, OH: U.S. Department of Health and Human Services, Public Health Service, Centers for Disease Control and Prevention, National Institute for Occupational Safety and Health, DHHS (NIOSH) publication No.97-140. 2. CFR [1997]. 29 CFR 1910.1000 Code of Federal Regulations. Washington, DC: U.S. Government Printing Office, Office of the Federal Register. 3. ACGIH [2003]. 2003 TLVs® and BEIs®; threshold limit values for chemical substances and physical agents. Cincinnati, OH: American Conference of Governmental Industrial Hygienists.

DEPARTMENT OF HEALTH AND HUMAN SERVICES Centers for Disease Control and Prevention National Institute for Occupational Safety and Health 4676 Columbia Parkway Cincinnati, OH 45226-1998 OFFICIAL BUSINESS Penalty for private use $300
Delivering on the Nation's promise:
Safety and Health at work for all people through research and prevention
To receive NIOSH documents or information about occupational Safety and Health topics
contact NIOSH at:
1-800-35-NIOSH (356-4674) Fax: 1-513-533-8573
E-mail: [email protected] or visit the NIOSH web site at:
http://www.cdc.gov/niosh S A F E R • H E A L T H I E R • P E O P L E™