hhe report no. heta-2012-0081-3169, lighting, indoor ... · pdf filelighting, indoor...
TRANSCRIPT

Lighting, Indoor Environmental Quality Concerns, and Job Stress at a Call Center – California
Douglas M. Wiegand, PhDJessica G. Ramsey, MS, CPEGregory A. Burr, CIHJungHo Choi, MS, CIH
Health Hazard Evaluation ReportHETA 2012-0081-3169January 2013
DEPARTMENT OF HEALTH AND HUMAN SERVICES Centers for Disease Control and Prevention
WorkplaceSafety and Health
National Institute for Occupational Safety and Health
The employer shall post a copy of this report for a period of 30 calendar days at or near the workplace(s) of affected employees. The employer shall take steps to insure that the posted determinations are not altered, defaced, or covered by other material during such period. [37 FR 23640, November 7, 1972, as amended at 45 FR 2653, January 14, 1980].
Page iHealth Hazard Evaluation Report 2012-0081-3169
RepoRt Abbreviations ................................................................................................ ii
Highlights of the NIOSH Health Hazard Evaluation ........................iii
Summary .........................................................................................................v
Introduction ...................................................................................................1
Assessment .....................................................................................................2
Results ..............................................................................................................3
Discussion .................................................................................................... 13
Conclusions ................................................................................................. 16
Recommendations .................................................................................... 16
References .................................................................................................... 19
Contents
ACknowledgments Acknowledgments and Availability of Report ................................ 27
Appendix A Tables ............................................................................................................. 21
Appendix B Figures ........................................................................................................... 24
Page ii Health Hazard Evaluation Report 2012-0081-3169
ABBReviAtions
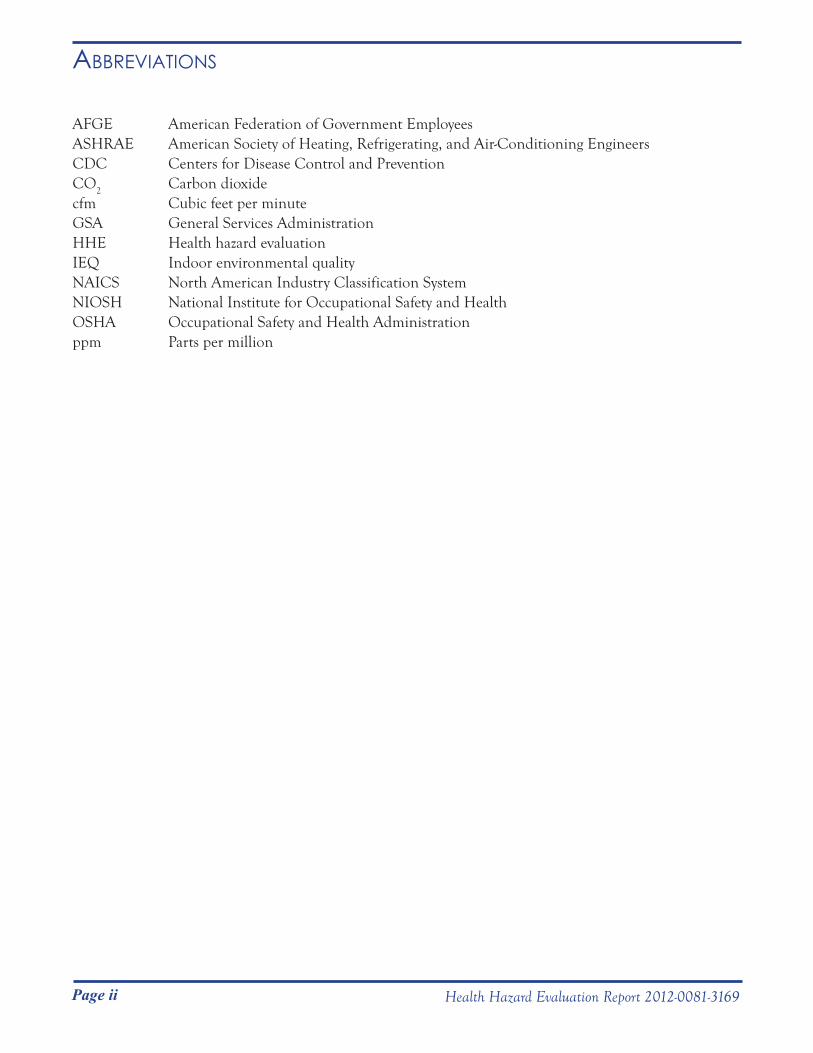
AFGE American Federation of Government EmployeesASHRAE American Society of Heating, Refrigerating, and Air-Conditioning EngineersCDC Centers for Disease Control and PreventionCO
2 Carbon dioxide
cfm Cubic feet per minuteGSA General Services AdministrationHHE Health hazard evaluationIEQ Indoor environmental qualityNAICS North American Industry Classification SystemNIOSH National Institute for Occupational Safety and HealthOSHA Occupational Safety and Health Administrationppm Parts per million
Page iiiHealth Hazard Evaluation Report 2012-0081-3169
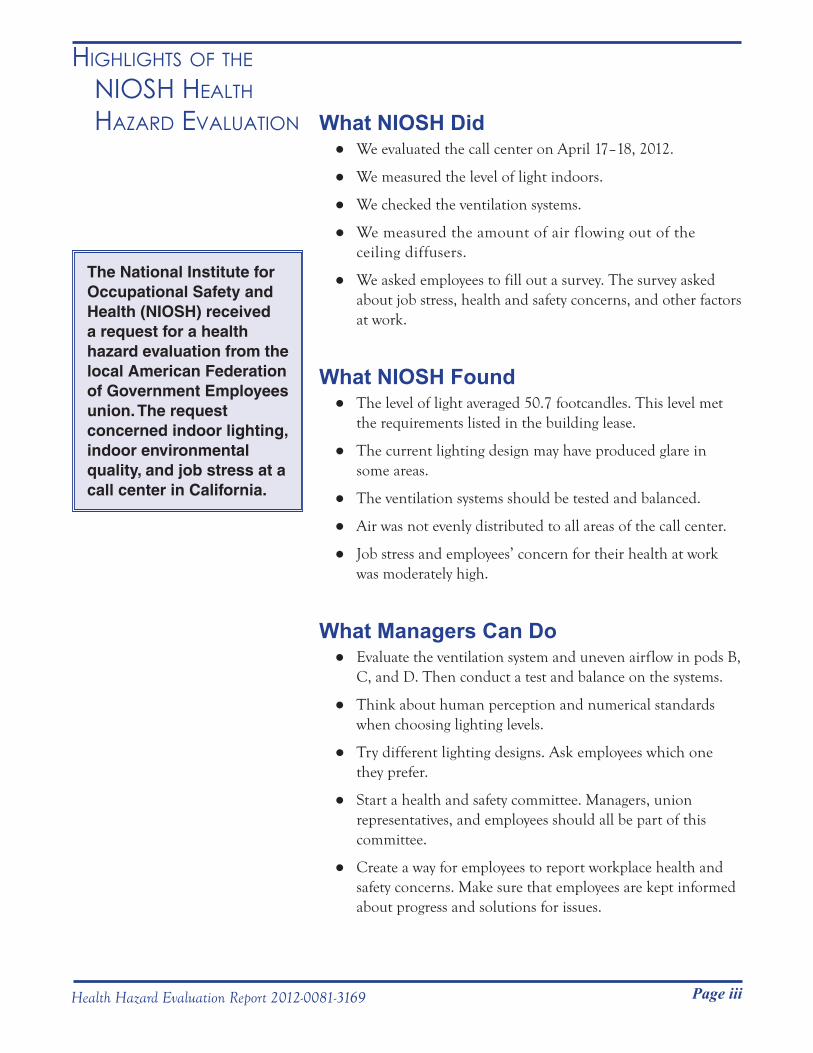
The National Institute for Occupational Safety and Health (NIOSH) received a request for a health hazard evaluation from the local American Federation of Government Employees union. The request concerned indoor lighting, indoor environmental quality, and job stress at a call center in California.
HigHligHts of tHe niosH HeAltH HAzARd evAluAtion What NIOSH Did
● We evaluated the call center on April 17–18, 2012.
● We measured the level of light indoors.
● We checked the ventilation systems.
● We measured the amount of air flowing out of the ceiling diffusers.
● We asked employees to fill out a survey. The survey asked about job stress, health and safety concerns, and other factors at work.
What NIOSH Found ● The level of light averaged 50.7 footcandles. This level met
the requirements listed in the building lease.
● The current lighting design may have produced glare in some areas.
● The ventilation systems should be tested and balanced.
● Air was not evenly distributed to all areas of the call center.
● Job stress and employees’ concern for their health at work was moderately high.
What Managers Can Do ● Evaluate the ventilation system and uneven airflow in pods B,
C, and D. Then conduct a test and balance on the systems.
● Think about human perception and numerical standards when choosing lighting levels.
● Try different lighting designs. Ask employees which one they prefer.
● Start a health and safety committee. Managers, union representatives, and employees should all be part of this committee.
● Create a way for employees to report workplace health and safety concerns. Make sure that employees are kept informed about progress and solutions for issues.

Page iv Health Hazard Evaluation Report 2012-0081-3169
HigHligHts of tHe niosH HeAltH HAzARd evAluAtion
(Continued)
● Give employees feedback that they can use to improve their communications with customers. Do not forget to provide positive feedback to employees on what they did well.
● Ask employees to comment on processes and procedures being used in the call center. Listen to their suggestions on how things can be improved; this can improve employee morale and productivity.
● Encourage employees to debrief with their supervisor or a coworker immediately after a call with an unfriendly customer. This will help reduce employees’ stress levels and improve communication in the center.
● Encourage employees to take sick leave when they are ill or when they may be contagious.
● Talk to employees about workplace violence and workplace bullying. Train employees on ways to deal with stress.
What Employees Can Do ● Participate in health and safety meetings. If you have health
or safety concerns you should report those at these meetings.
● Seek counseling if you experience symptoms of anxiety, anger, depression, or other mental health issues that affect you in occupational, social, or other settings. If these symptoms affect your daily life, you should get help. Seek care from a licensed clinical psychologist or psychiatrist.
● Report any suspicious behavior or expressions of violence to a supervisor immediately.
● Keep your workstation at the proper settings. Computer monitors should be placed so that the top line of the screen is at or below eye level. Chairs should provide back support and allow feet to rest on the floor. These settings will reduce your risk of developing musculoskeletal disorders.

Page vHealth Hazard Evaluation Report 2012-0081-3169
Call center employees were concerned about indoor lighting, IEQ, and job stress. We found that the lighting was within the limits specified in the lease agreement. Lighting may need adjustment to account for glare and employee comfort. The ventilation system needs maintenance to balance the airflow. Employees should report their work-related health concerns at joint management and employee safety committee meetings. Managers should follow up on all health and safety concerns raised by employees. To reduce stress, employees should talk to a supervisor or coworker immediately after working with an angry customer.
summARyIn February 2012, the AFGE submitted an HHE request to NIOSH regarding indoor lighting, IEQ, and job stress at a call center in California. We evaluated the call center on April 17–18, 2012. HHE Program investigators met with managers, local union representatives, and employees and observed work processes, practices, and workplace conditions throughout the call center. We measured illumination; examined the ventilation systems; and measured temperature, relative humidity, and carbon dioxide throughout the workday. We also administered a voluntary survey of employees to assess their health and safety concerns as well as their perceptions of the psychosocial work environment.
We collected 53 light measurements throughout the call center. The light level averaged 50.7 footcandles, meeting the U.S. GSA illumination recommendations. However, luminance levels (commonly called brightness) in the employee’s field of view can cause glare. This glare may cause some of the visual discomfort reported by employees.
The CO2 concentrations in the call center ranged from 410 to
635 ppm during this evaluation; outdoor concentrations were 380 ppm. Indoor CO
2 concentrations were similar to outdoor
concentrations, suggesting that the call center ventilation was adequate. Temperature in the call center ranged from 68°F to 76°F, and relative humidity ranged from 43% to 49%, compared to an outdoor temperature of 60°F to 71°F and relative humidity ranging from 49% to 54%. These values are within the ASHRAE-recommended thermal comfort guidelines.
We measured airflow at 71 of 86 ceiling diffusers. Airflow ranged from 0 cfm to 917 cfm, demonstrating that supply air was not evenly distributed to all occupied areas of the call center by the ventilation systems. We were unable to measure airflow at all diffusers because of furniture or file cabinets blocking access.
We received 283 completed employee surveys (85% response rate) on job stress, work-related health and safety concerns, and psychosocial factors at work. Participants’ reported levels of job stress and concerns for their health at work were moderately high. Most participants reported very little concern for their own personal safety at work. Some employees indicated that they were concerned about being physically attacked by a member of the public on the building grounds or by another call center employee.

Page vi Health Hazard Evaluation Report 2012-0081-3169
Keywords: NAICS 923130 Administration of Human Resource Programs (except Education, Public Health, and Veterans’ Affairs Programs), call center, office building, IEQ, lighting, ventilation, job stress, psychosocial, cancer
To address job stress, work-related health and safety concerns, and psychosocial factors we recommended creating a joint management and employee health and safety committee. We also recommended that a system be created for employees to document health and safety concerns. Management should use this system to keep employees informed about how concerns are being addressed. Suggestions for ways to reduce job stress were also provided.
We recommended testing and balancing the ventilation systems and modifying the lighting design policy to take employee perception and satisfaction into consideration. Management should look into different parabolic louver designs that may better control light into the work area and reduce glare for employees working nearby. A guard rail should be installed on the loading dock that is used as an employee break area.
summARy
(Continued)

Page 1Health Hazard Evaluation Report 2012-0081-3169
intRoduCtionNIOSH received an HHE request from the local AFGE union representing employees at a telephone call center (call center) in California. The request concerned indoor lighting, IEQ, and job stress. Health effects described in the request included eye strain, headaches, colds, flu, and sneezing. NIOSH investigators evaluated the call center on April 17–18, 2012.
During the evaluation we met with managers, local union representatives, and employees to discuss the HHE request. Following an opening meeting, we observed work processes, practices, and workplace conditions in the call center. We measured illumination; examined the ventilation systems; and measured temperature, relative humidity, and CO
2 throughout the
workday. We also administered a voluntary survey to employees to assess their job stress, work-related health and safety concerns, and various psychosocial factors at work. On April 30, 2012, we sent an interim letter containing our preliminary findings and recommendations to the managers, local and national union representatives, and the building owner.
Background
At the time of this evaluation 333 employees worked in the approximately 70,000 square foot call center. The carpeted call center occupied a single story masonry building constructed in the 1970s in a suburban retail area. The building had a flat roof with a decorative tiled parapet. Ten air handling units and solar panels were located on the roof. A paved employee parking lot that was also accessible to the public was situated on three of the four sides of the call center. Employees could access a landscaped, open-air atrium in the middle of the call center during breaks. This atrium was not accessible to the general public.
Call center employees worked 8.5-hour shifts. The shift start times were staggered from 6:45 a.m. to 9:00 a.m. to accommodate calls from different time zones. Call center employees averaged about 7 hours on either the phone or computer each shift answering questions from the public.
The building was divided into four sections called pods. Most employees worked from cubicles (fabric covered walls, partition height about 4 to 5 feet) in pods B, C, and D. Administrative

Page 2 Health Hazard Evaluation Report 2012-0081-3169
intRoduCtion
(Continued)
Assessment
offices, training rooms, a lunch room, and a health clinic (that was unoccupied during our evaluation) were located in pod A. We focused our evaluation on pods B, C, and D because that was where most of the employees worked.
We learned that until February 2012 employees could bring in a doctor’s note asking to have fluorescent bulbs removed from ceiling light fixtures above their workstation to reduce the light level. In February 2012, call center managers notified union officials and employees that all fluorescent bulbs in all ceiling light fixtures would be replaced and kept on to maintain the GSA-required minimum level of illumination.
We measured illumination in pods B, C, and D using a Sper Scientific light meter, Model 840020 (Sper Scientific Ltd., Scottsdale, Arizona). This light meter measures footcandles, a unit of illumination commonly used in the United States. A footcandle is the illumination on a one square foot surface area on which the light of one candela (essentially the light output of a candle) is uniformly distributed [Crouch 1978]. We took our light meter readings in occupied cubicles on the work surface directly in front of the keyboard. These work surfaces were positioned by the employees for either a sitting or standing workstation configuration; we did not change the configuration.
We looked for evidence of water damage, water incursion, visible mold, and other potential IEQ problems in the call center. We took measurements for temperature, relative humidity (employee comfort indicators), and CO
2 (an indicator of ventilation
effectiveness) with a Q-TRAK™ Plus Indoor Air Quality Monitor, Model 8554 (TSI Incorporated, Shoreview, Minnesota). We visually inspected four of the ten rooftop air handling units that provided ventilation for the call center. To evaluate how supply air was distributed by the air handling units in the call center, we measured airflow with a TSI Model 8371 ventilation flow hood (TSI Incorporated, Shoreview, Minnesota).
We distributed a self-administered, anonymous survey, along with instructions and information regarding participant confidentiality, to all employees’ (N = 333) desks the morning of April 17, 2012. The survey included scaled and open-ended items and covered participant demographics, job stress, work-related health and safety
Page 3Health Hazard Evaluation Report 2012-0081-3169
Assessment
(Continued) concerns, and psychosocial factors at work. Psychosocial factors at work were assessed in six domains: the physical work environment, job demands, job satisfaction, safety climate, perceived job control, and social support. Once complete, participants were asked to seal their anonymous survey in an envelope and return it directly to a NIOSH project officer.
Results
Lighting Levels
We took 53 measurements, with results ranging from 34 footcandles to 77.2 footcandles. The average measurement, 50.7 footcandles, meets the GSA illumination recommendation of 50 average maintained footcandles at working surface height throughout the space. We measured illumination, the amount of light falling on a surface. We did not measure luminance (also called brightness), which is the amount of light coming toward the eye from an object(s). Brightness is a metric used to characterize emission or reflection from flat, diffuse surfaces. An uncomfortable level of brightness is described as glare. However, because glare is not a precisely defined lighting term, and measuring glare requires specialized equipment, this report instead focuses on providing sufficient illumination, selecting the best lighting design, and arranging the workspace to minimize glare.
Regarding lighting design, most fluorescent ceiling light fixtures had louvers with a grid pattern containing 18 parabolic reflective cells. Some workstations near the atrium were positioned so that employees faced the courtyard atrium, an orientation that resulted in bright outdoor light behind the employee’s computer screen, producing a potential contrast problem, which might cause difficulty in reading characters and lettering on the screen. We also noted other potential sources of glare, such as placement of mirrors, in some workstations.
We learned that as the “cool white” fluorescent light bulbs in the ceiling fixtures burned out, the call center’s facility manager replaced them with “warm white” fluorescent bulbs, so we observed light fixtures containing bulbs of different colors. A cool white fluorescent bulb has a subtle blue color similar to ice. A warm white fluorescent light bulb imparts a more orange or red light on objects and is often described as a warmer light.

Page 4 Health Hazard Evaluation Report 2012-0081-3169
Results
(Continued) Ventilation
A variable air volume system provided heating and cooling to pod A. Constant volume air handling systems heated and cooled pods B, C, and D. The air handling systems we visually inspected were well maintained. According to the call center’s facility manager, the ventilation ducts had been cleaned about 2 weeks before our evaluation. All of the air handling systems used air filters with a minimum efficiency reporting value rating of 8 (similar to a minimum efficiency air filter), and these filters were changed quarterly. All air filters were last changed on April 6, 2012.
The CO2 concentrations in the call center ranged from 410 to
635 ppm during this evaluation; outdoor concentrations were 380 ppm. We compare indoor and outdoor CO
2 concentrations
to determine if indoor occupied spaces are adequately ventilated [ANSI/ASHRAE 2010a]. Indoor CO
2 concentrations that are
similar to outdoor concentrations (as in this instance) suggest that the ventilation for the call center was adequate to dilute normal indoor contaminants and odors [ANSI/ASHRAE 2010a].
Temperature in the call center ranged from 68°F to 76°F, and relative humidity ranged from 43% to 49%, compared to an outdoor temperature of 60°F to 71°F and relative humidity ranging from 49% to 54%. These temperatures and relative humidity values are within the ASHRAE-recommended thermal comfort guidelines [ANSI/ASHRAE 2010b].
We measured airflow from 71 of 86 ceiling diffusers located in pods B, C, and D. The airflow results are listed in Appendix A, and Appendix B displays the ceiling diffuser locations. We were unable to measure airflow at 15 ceiling diffusers because they were blocked by furniture or file cabinets. Airflow from these 71 diffusers ranged from 0 cfm at a diffuser in the union office in pod C to 917 cfm at a diffuser in the center of pod D.
Employee Survey on Job Stress, Work-related Health and Safety Concerns, and Psychosocial Factors at Work
We received 283 (85%) of the 333 surveys we handed out. Eighty-one percent of respondents were female, and the average age was

Page 5Health Hazard Evaluation Report 2012-0081-3169
Results
(Continued)
44 years (range: 24–71 years). Respondents reported an average of 12 years (range: 1–37) of employment with the call center.
Job Stress Participants were asked to rate their level of job stress over the past week on a scale from 0 (as low as it can be) to 10 (as high as it can be). The average job stress score was 6.3 (N = 279). Figure 1 shows the distribution of job stress scores.
Figure 1. Frequency of reported job stress level over the past week (N = 279).
Using an open-ended question, participants were also asked to identify one or more major source(s) of job stress, if any. Seventy-two (25%) respondents did not respond to this item. Job stressors reported by five or more employees are listed in Table 1.
Page 6 Health Hazard Evaluation Report 2012-0081-3169
Results
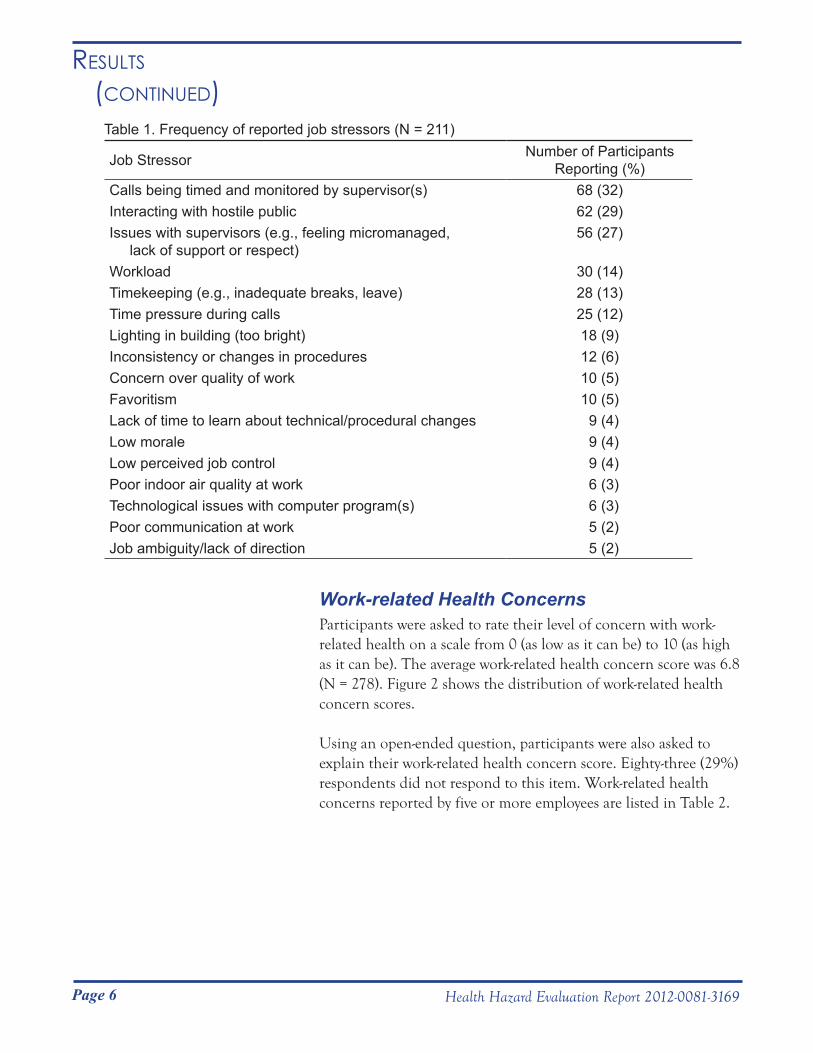
(Continued)Table 1. Frequency of reported job stressors (N = 211)
Job Stressor Number of Participants Reporting (%)
Calls being timed and monitored by supervisor(s) 68 (32)Interacting with hostile public 62 (29)Issues with supervisors (e.g., feeling micromanaged, lack of support or respect)
56 (27)
Workload 30 (14)Timekeeping (e.g., inadequate breaks, leave) 28 (13)Time pressure during calls 25 (12)Lighting in building (too bright) 18 (9)Inconsistency or changes in procedures 12 (6)Concern over quality of work 10 (5)Favoritism 10 (5)Lack of time to learn about technical/procedural changes 9 (4)Low morale 9 (4)Low perceived job control 9 (4)Poor indoor air quality at work 6 (3) Technological issues with computer program(s) 6 (3)Poor communication at work 5 (2)Job ambiguity/lack of direction 5 (2)
Work-related Health ConcernsParticipants were asked to rate their level of concern with work-related health on a scale from 0 (as low as it can be) to 10 (as high as it can be). The average work-related health concern score was 6.8 (N = 278). Figure 2 shows the distribution of work-related health concern scores. Using an open-ended question, participants were also asked to explain their work-related health concern score. Eighty-three (29%) respondents did not respond to this item. Work-related health concerns reported by five or more employees are listed in Table 2.

Page 7Health Hazard Evaluation Report 2012-0081-3169
Results
(Continued)
Figure 2. Frequency of reported work-related health concern scores (N = 278).
Table 2. Frequency of reported work-related health concerns (N = 200)
Work-related Health Concern Number of Participants Reporting (%)
Stress-related physical health concerns 73 (37) Indoor air quality 61 (29)Germs from coworkers reporting to work while ill 33 (17)Bright lighting 28 (14)Mental health (e.g., anxiety, depression) 28 (14)Cancer 26 (13)Overly hot or cold indoor temperatures 23 (12)Sedentary nature of the job 22 (12)Vision problems with computer monitor 14 (7)Repetitive motion injuries 14 (7)Helicobacter pylori (H. pylori) 8 (4)Secondhand smoke 7 (4)
Page 8 Health Hazard Evaluation Report 2012-0081-3169
Results
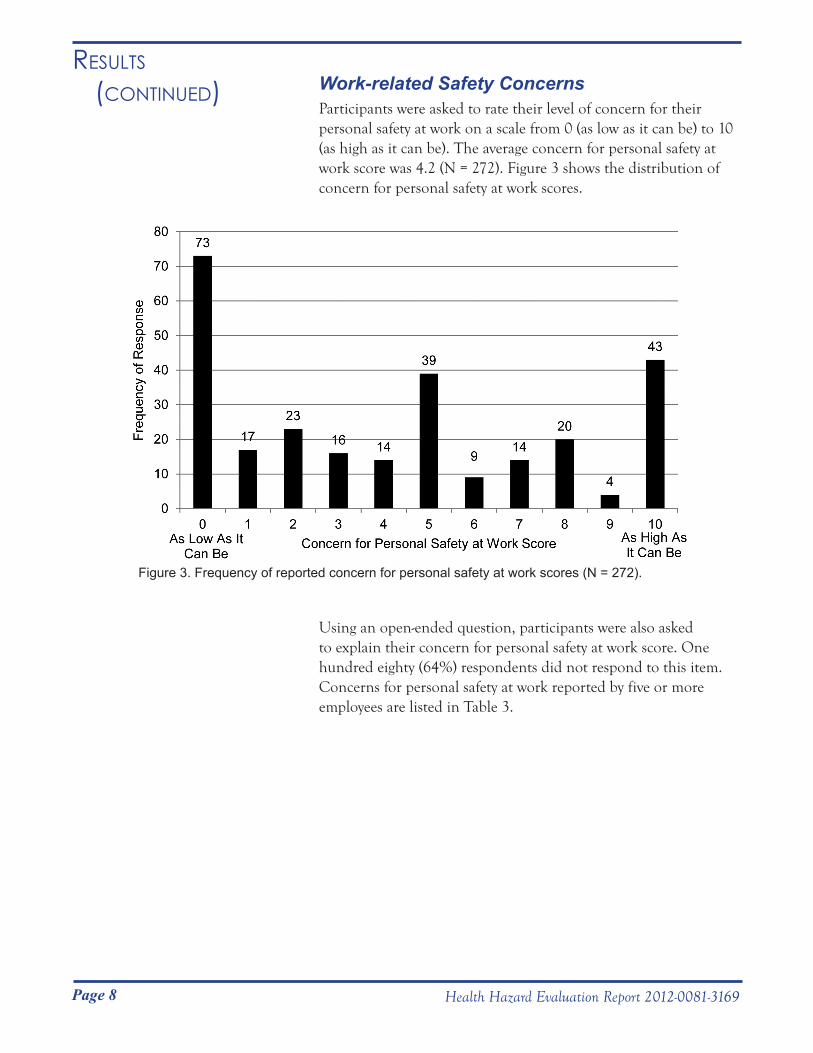
(Continued) Work-related Safety ConcernsParticipants were asked to rate their level of concern for their personal safety at work on a scale from 0 (as low as it can be) to 10 (as high as it can be). The average concern for personal safety at work score was 4.2 (N = 272). Figure 3 shows the distribution of concern for personal safety at work scores.
Figure 3. Frequency of reported concern for personal safety at work scores (N = 272).
Using an open-ended question, participants were also asked to explain their concern for personal safety at work score. One hundred eighty (64%) respondents did not respond to this item. Concerns for personal safety at work reported by five or more employees are listed in Table 3.
Page 9Health Hazard Evaluation Report 2012-0081-3169
Results
(Continued)
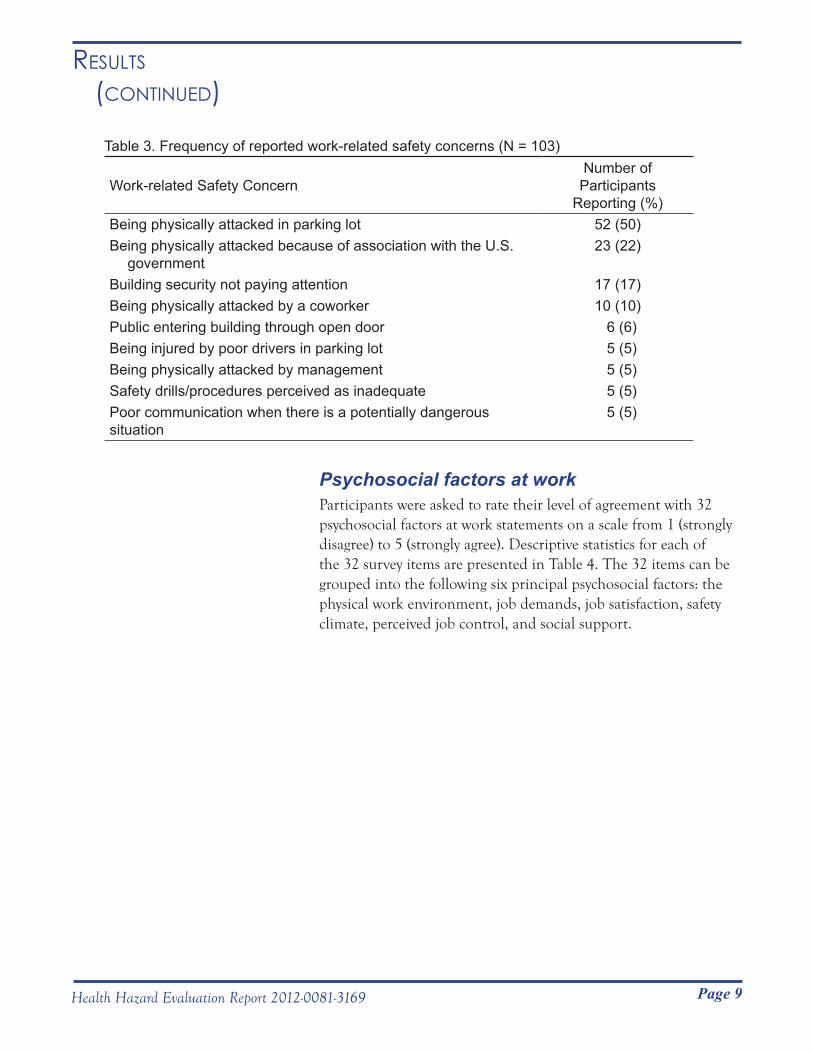
Table 3. Frequency of reported work-related safety concerns (N = 103)
Work-related Safety ConcernNumber of
Participants Reporting (%)
Being physically attacked in parking lot 52 (50)Being physically attacked because of association with the U.S.
government23 (22)
Building security not paying attention 17 (17)Being physically attacked by a coworker 10 (10)Public entering building through open door 6 (6)Being injured by poor drivers in parking lot 5 (5)Being physically attacked by management 5 (5)Safety drills/procedures perceived as inadequate 5 (5)Poor communication when there is a potentially dangerous situation
5 (5)
Psychosocial factors at workParticipants were asked to rate their level of agreement with 32 psychosocial factors at work statements on a scale from 1 (strongly disagree) to 5 (strongly agree). Descriptive statistics for each of the 32 survey items are presented in Table 4. The 32 items can be grouped into the following six principal psychosocial factors: the physical work environment, job demands, job satisfaction, safety climate, perceived job control, and social support.

Page 10 Health Hazard Evaluation Report 2012-0081-3169
Results
(Continued)Table 4. Level of agreement (1 = Strongly Disagree; 5 = Strongly Agree) regarding work factors (N range: 277–283)Survey Item Average Mode*
Phy
sica
l Wor
k E
nviro
nmen
t
The level of noise in the area(s) in which I work is usually high 2.8 3.0
The level of lighting in the area(s) in which I work is usually too dim 1.4 1.0
The level of lighting in the area(s) in which I work is usually too bright 3.8 5.0
There is excessive glare on my computer screen due to lighting 3.4 5.0The temperature of my work area(s) during the summer is usually comfortable 2.8 3.0
The temperature of my work area(s) during the winter is usually comfortable 2.7 3.0
The humidity in my work area(s) is usually either too high or too low 2.9 3.0
The level of air circulation in my work area(s) is good 2.3 1.0
The air in my work area(s) is clean and free of pollution 2.2 1.0
The overall quality of the physical environment where I work is poor 2.7 3.0
The work area(s) is/are overly crowded 2.1 1.0
Job
Dem
ands
I am often required to work for long periods with my body in physically awkward positions
2.1 1.0
I have constant time pressure due to a heavy work load 3.0 5.0
I have many interruptions and disturbances while performing my job 2.4 1.0
Over time, my job has become more and more demanding 3.2 5.0
Job
Sat
isfa
ctio
n
I receive the respect I deserve at work 3.2 5.0
My job promotion prospects are poor 3.0 3.0
I have experienced or I expect to experience an undesirable change in my work situation
2.4 1.0
My job security is poor 2.1 1.0
I am exposed to hostility or conflict from my supervisor(s) 2.1 1.0Considering all my efforts and achievements, my salary/income is adequate 3.3 3.0
Saf
ety
Clim
ate
There is sufficient opportunity to discuss and deal with health & safety issues in meetings 2.5 1.0
There is open communication about health and safety issues within this workplace 2.7 1.0
Employees are regularly consulted about workplace health and safety issues 2.8 1.0
My supervisor is concerned about the welfare of those under him/her 3.5 5.0

Page 11Health Hazard Evaluation Report 2012-0081-3169
Results
(Continued)Table 4. Level of agreement (1 = Strongly Disagree; 5 = Strongly Agree) regarding work factors (N range: 277–283) (continued)Survey Item Average Mode*
Per
ceiv
ed J
ob C
ontro
l I am given a lot of freedom to decide how to do my own work 2.6 1.0
I am given a lot of freedom to decide the amount of work I do 2.1 1.0
I am given a lot of freedom to decide the pace of my work, that is, how fast or slow I work
2.4 1.0
I am allowed adequate breaks during my shift to stretch, rest my eyes, etc. 3.1 5.0
I get to do a variety of different tasks on my job 3.1 5.0
Soc
ial
Sup
port The people I work with (my coworkers) are friendly 4.3 5.0
The people I work with (my coworkers) are helpful in getting the job done 4.0 5.0
* Mode: the most frequent response to the item.
Statistical AnalysesComposite scores were calculated for each of the six principal psychosocial factors by averaging the scores of the items within each factor. (Note: some survey items were reverse scored when necessary). Linear regression analyses were then used to determine which of the psychosocial factors at work are independently associated with job stress, work-related health concerns, and concern for personal safety at work scores.
Negative views of the physical work environment (P = 0.01) and job demands (P < 0.01) were associated with higher job stress scores. Positive views of job satisfaction (P < 0.05), perceived job control (P < 0.05), and social support (P < 0.05) were associated with lower job stress scores.
Negative views of the physical work environment (P < 0.01) and job demands (P < 0.01) were associated with greater work-related health concern scores.
Positive views of job satisfaction (P < 0.01) and safety climate (P < 0.05) were associated with lower concern for personal safety at work scores.

Page 12 Health Hazard Evaluation Report 2012-0081-3169
Results
(Continued) Other Workplace Observations and Employee Concerns
During our walk-through evaluation we noted that a loading dock on the south side of the call center did not have a safety railing to prevent falls. Call center employees used the loading dock during their break periods.
The safety committee included only managers. According to the managers, the union had been invited to previous meetings but had not attended, and no employee representatives currently served on the committee.
Survey responses indicated some concern about possible exposure to carcinogens at work. Several employees also mentioned that a sign posted on the door of a neighboring tenant warned of carcinogen exposures. The CDC website on occupational cancer clusters is a good resource for information that could be used to address these concerns. The address for this informative website can be found in the recommendations section of this report.
Regarding the carcinogen warning sign posted by a neighboring tenant, a 1986 California voter-approved initiative (Proposition 65) required the state to publish a list of chemicals known to cause cancer, birth defects, or other reproductive harm. Under Proposition 65, businesses are required to give a “clear and reasonable” warning before knowingly exposing anyone to a listed chemical above a specified level [OEHHA 2012]. This warning can be included on product labels, published in a newspaper, or posted at the workplace or public area affected by the chemical [OEHHA 2012]. Call center management should discuss the warning with the tenant to learn why it was provided so that an informed decision can be made about exposure to any of these chemicals.
Several survey participants expressed concern about contacting Helicobacter pylori (H. pylori) at work. H. pylori, a common bacterium found in the gastrointestinal tract, is associated with ulcers. Nearly two thirds of the world’s population is infected with H. pylori, though most people do not experience symptoms. It is very difficult to determine the cause of H. pylori infection, though the bacterium is believed to be transmitted from person to person primarily through oral-oral or fecal-oral contact. Because the source of H. pylori is not yet known, recommendations for avoiding
Page 13Health Hazard Evaluation Report 2012-0081-3169
Results
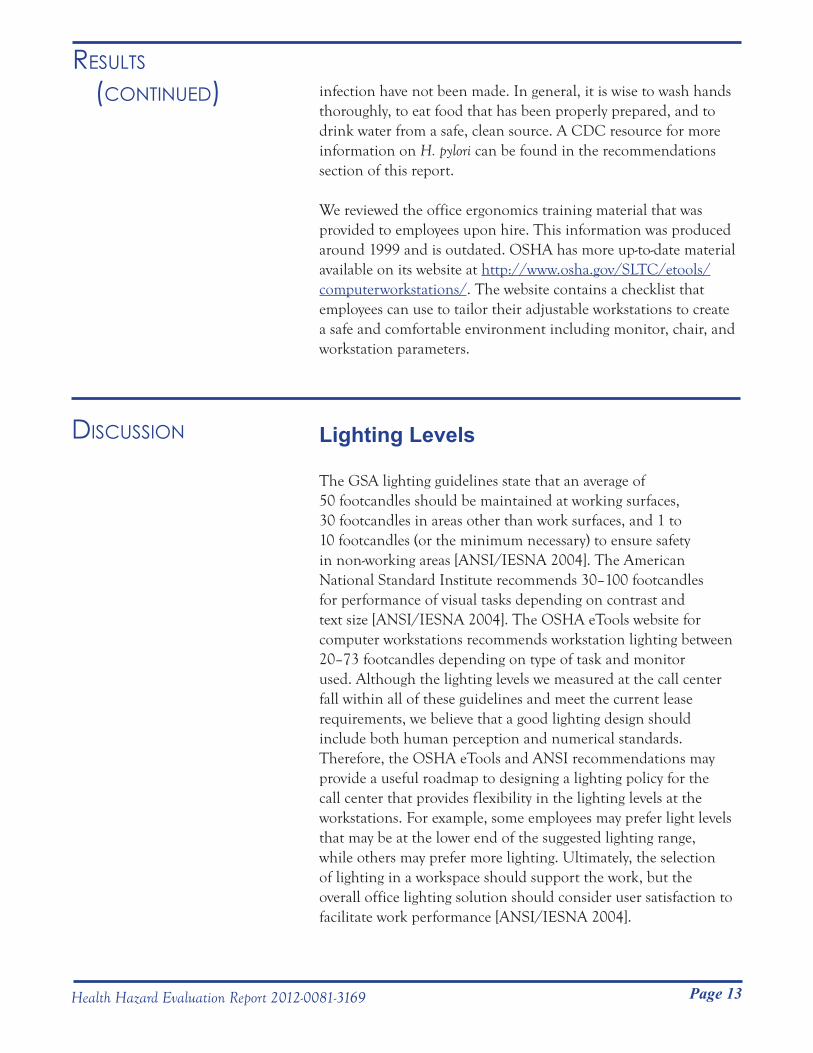
(Continued) infection have not been made. In general, it is wise to wash hands thoroughly, to eat food that has been properly prepared, and to drink water from a safe, clean source. A CDC resource for more information on H. pylori can be found in the recommendations section of this report.
We reviewed the office ergonomics training material that was provided to employees upon hire. This information was produced around 1999 and is outdated. OSHA has more up-to-date material available on its website at http://www.osha.gov/SLTC/etools/computerworkstations/. The website contains a checklist that employees can use to tailor their adjustable workstations to create a safe and comfortable environment including monitor, chair, and workstation parameters.
disCussion
Lighting Levels
The GSA lighting guidelines state that an average of 50 footcandles should be maintained at working surfaces, 30 footcandles in areas other than work surfaces, and 1 to 10 footcandles (or the minimum necessary) to ensure safety in non-working areas [ANSI/IESNA 2004]. The American National Standard Institute recommends 30–100 footcandles for performance of visual tasks depending on contrast and text size [ANSI/IESNA 2004]. The OSHA eTools website for computer workstations recommends workstation lighting between 20–73 footcandles depending on type of task and monitor used. Although the lighting levels we measured at the call center fall within all of these guidelines and meet the current lease requirements, we believe that a good lighting design should include both human perception and numerical standards. Therefore, the OSHA eTools and ANSI recommendations may provide a useful roadmap to designing a lighting policy for the call center that provides flexibility in the lighting levels at the workstations. For example, some employees may prefer light levels that may be at the lower end of the suggested lighting range, while others may prefer more lighting. Ultimately, the selection of lighting in a workspace should support the work, but the overall office lighting solution should consider user satisfaction to facilitate work performance [ANSI/IESNA 2004].

Page 14 Health Hazard Evaluation Report 2012-0081-3169
disCussion
(Continued) Although the lighting levels were within GSA recommendations, the design and location of the ceiling lighting fixtures could still produce high luminance levels in the employees’ field of view, potentially causing some of the employees glare discomfort. Selecting the most appropriate parabolic lighting louver for the call center ceiling light fixtures should help control the light into a designated area and also provide a low brightness appearance, thereby reducing glare. The ability to control the direction of light and its apparent brightness results from the size and shape of the vertical cell walls in a parabolic louver. At the time of our evaluation we observed that most of the ceiling light fixtures used parabolic louvers with 18 cells (each cell approximately 7.5″ square). Switching to a parabolic louver with smaller cells (for example, 0.5″ square cells) may be preferable in office situations such as the call center where computer usage dictates maximum glare control. Parabolic louvers with smaller cells are better able to direct all light into a task area and minimize or eliminate objectionable sources of brightness or glare [Lumco 2012].
Another work practice at the call center that may have resulted in visual discomfort was computer use. During our walk-through survey we observed that call center employees used different computer programs and databases in responding to a customer’s question or problem. As a result, employees switched back and forth between white and dark background displays, depending on the software used. Because the luminance level of a white background display on a computer is more similar to the work environment than a dark background display, it is usually more comfortable. Dark background displays also require lower light levels in offices to achieve the correct luminance ratio [CVC 2012].
Ventilation
Our ventilation measurements demonstrated that supply air was not evenly distributed to all areas of the call center. However, the CO
2 concentrations during our evaluation were comparable
to outdoor concentrations, suggesting that an adequate amount of outdoor air was being provided to dilute nuisance odors and maintain effective ventilation [ANSI/ASHRAE 2010a]. Although temperature and relative humidity measurements were within the ASHRAE-recommended thermal comfort guidelines during our evaluation, imbalanced air handling systems may not provide the

Page 15Health Hazard Evaluation Report 2012-0081-3169
disCussion
(Continued) maximum occupant comfort at the lowest energy cost [ANSI/ASHRAE 2010b]. We asked for, but were not provided with, a test and balance report from the building owner, so we are unable to compare our airflow measurements to the design airflow rates.
Employee Survey
The level of self-reported job stress was moderately high at this workplace, with 61% of participants rating their job stress level as 6 or greater on a scale from 0 to 10, with 10 representing extreme stress (average = 6.3). The results of our survey suggest that job stress is associated with various factors, including the nature of the job (e.g., high call volume, time pressure, having calls monitored, interacting with a hostile public), psychosocial factors (e.g., negative perceptions of management/supervision, perceived lack of communication), and concerns regarding the physical working environment (e.g., lighting, poor air quality and circulation).
NIOSH has completed several HHEs at call centers in the past, and found that many employees experience a high workload, face hostility or abuse from customers, and report being physically and mentally exhausted at the end of their workday [NIOSH 1994, 2007a,b]. These job stressors have consistently been found to recur in the call centers we have evaluated. What makes the present HHE unique is that the request involved concerns over the physical work environment and its impact on job stress and health. The survey results showed that concerns about the physical work environment were positively associated with job stress and work-related health concerns. Specifically, participants were most concerned about lighting being too bright, excessive glare on their computer monitors, and indoor environmental quality problems, such as proper air circulation and general air quality. Addressing these issues in the working environment may reduce employees’ job stress and work-related health concerns.
Research has shown that job resources such as social support from management and coworkers, feedback, and employee involvement in decision making and providing input to management is associated with greater job satisfaction, positive perceptions of work, and lower turnover [Kain and Jex 2010]. A relative strength highlighted by the survey results is that many of the participants find their coworkers to be friendly and helpful. Favorable (higher) scores in this factor of social support were associated with lower job stress scores.

Page 16 Health Hazard Evaluation Report 2012-0081-3169
disCussion
(Continued) While most participants reported a positive relationship with their supervisor(s), 25% (N = 70) of participants either disagreed or strongly disagreed that their supervisor was concerned about the welfare of those under him/her. This may be linked to responses to the safety climate factor of the survey, which indicates that participants were not satisfied with communication between managers and employees regarding health and safety issues at the workplace. Forming a joint management, union, and employee safety committee, as well as developing a formal process for employees to report safety and health concerns and receive feedback may strengthen perceptions of support and concern from management.
ConClusions
ReCommendAtions
Our lighting measurements show that lease requirements were being met, but employee perception and satisfaction were not being considered with the current lighting design. Our ventilation measurements showed that supply air was not evenly distributed to all areas of the call center. Addressing specific job stressors identified in the employee survey may reduce the moderately high levels of job stress and work-related health concerns.
On the basis of our findings, we recommend the actions listed below to create a more healthful workplace. We encourage the call center to use a labor-management health and safety committee or working group to discuss the recommendations in this report and develop an action plan. Those involved in the work can best set priorities and assess the feasibility of our recommendations for the specific situation at the call center.
1. Reinstate the policy that employees may have less lighting in their workspace (if supported by a doctor’s note) by deactivating or removing fluorescent bulbs.
2. Consider a trial process for different lighting configurations in different pods. This could include removal of bulbs or changing lighting louvers to better control illumination to designated areas. Solicit employee feedback during the process.
3. Consider accelerating the replacement of the fluorescent bulbs to avoid having both “cool white” and “warm white” bulbs in the same light fixture.

Page 17Health Hazard Evaluation Report 2012-0081-3169
ReCommendAtions
(Continued) 4. Minimize reflective surfaces at employees’ workstations to reduce glare. Employees could also slightly tilt their monitor downward, being mindful to maintain proper workstation settings.
5. Remind all employees of proper workstation settings, particularly computer monitor height. The top of the computer monitor should be flush with the operator’s brow to prevent neck strain.
6. Have a ventilation engineer evaluate the ventilation systems and areas of uneven airflow in pods B, C and D, then conduct a test and balance on these air handling systems.
7. Clean the exterior of the supply and return air vents in the workplace regularly.
8. Start a joint management, union, and employee health and safety committee.
9. Create a formal procedure for employees to report and receive feedback regarding health and safety concerns, perhaps through the health and safety committee. This would involve documenting the concerns, explaining what will be done to address the concerns, or explaining why no action is necessary. The documentation of this process can then be shared with all employees as part of the committee meeting minutes or by e-mail.
10. Give employees feedback that they can use to improve their communications with customers. Do not forget to provide positive feedback to employees on what they did well.
11. Ask employees to comment on processes and procedures being used in the call center. Listen to their suggestions on how things can be improved. This can improve employee morale and productivity.
12. Encourage employees who interact with a hostile customer on the phone to immediately debrief with their supervisor or another coworker following the call. This practice may boost social support and have a buffering effect on job stress.
13. Evaluate employee workload and obtain employee input regarding the volume of calls they receive daily and how it affects job stress, job satisfaction, and job control. Engage employees in discussion about whether workload could be better managed and how.

Page 18 Health Hazard Evaluation Report 2012-0081-3169
ReCommendAtions
(Continued) 14. Employees experiencing symptoms of anxiety, depression, anger, or any other mental health problems should seek counseling from a licensed clinical psychologist or psychiatrist if such symptoms are interfering with social, occupational, or other important areas of functioning.
15. Provide all employees with training in workplace violence, workplace bullying, and stress reduction.
16. Encourage employees to immediately report any concerns regarding suspicious behavior or threatening language/statements made by coworkers or immediate supervisors. If one’s immediate supervisor is the individual in question, the report should be made to his/her supervisor.
17. All employees and supervisors should be familiar with the building’s evacuation plan and know how to quickly and safely exit the building in the case of an emergency.
18. If practical, consider arranging for security to escort call center employees who do not feel safe walking to/from their vehicle in the parking lot.
19. Verify if a sign warning of carcinogen exposure is located on the door of the neighboring tenant. If so, obtain information as to why this is so, and share this information with employees.
20. Inform employees concerned about occupational cancer that they can find information on cancer clusters from CDC at http://www.cdc.gov/niosh/topics/cancer/clusters.html.
21. Inform employees concerned about H. pylori that they can find additional information from CDC at http://www.cdc.gov/ulcer/files/hpfacts.PDF. Individuals who are concerned that they are experiencing symptoms of the infection should speak to their primary care physician.
22. Discourage employees from reporting to work when they are ill if they are likely contagious.
23. Install a protective railing on the loading dock to prevent falls.

Page 19Health Hazard Evaluation Report 2012-0081-3169
RefeRenCesANSI/ASHRAE [2010a]. Ventilation for acceptable indoor air quality. American National Standards Institute/ASHRAE standard 62.1-2010. Atlanta, GA: American Society of Heating, Refrigerating, and Air-Conditioning Engineers, Inc.
ANSI/ASHRAE [2010b]. Thermal environmental conditions for human occupancy. American National Standards Institute/ASHRAE standard 55-2010. Atlanta, GA: American Society for Heating, Refrigerating, and Air-Conditioning Engineers, Inc.
ANSI/IESNA [2004]. IESNA Office Lighting Committee. American national standard practice for office lighting. RP-1-04.
CVC [2012]. Suggestions for improving comfort at a computer workstation. Online article from Corporate Vision Consulting. [http://www.cvconsulting.com/articles4.shtml]. Date accessed: December 2012.
Crouch CL [1978]. Lighting for seeing. In: Clayton GD, Clayton FE, eds. Patty’s industrial hygiene and toxicology, 3rd rev. ed. Vol. 1. New York: Wiley-Interscience Publishers, pp. 513–515.
Kain J, Jex S [2010]. Karasek’s (1979) job demands-control model: a summary of current issues and recommendations for future research. In: Perrewe PL, Ganster DC, eds. Research in occupational stress and well-being. Vol. 8: New developments in theoretical and conceptual approaches to job stress. Bingley, UK: Emerald Books, pp. 237–268.
Lumco [2012]. Optics – optiques guide. Online article from Standard™. [http://www.lumco.ca/eclairage/doc/opt_guide.pdf]. Date accessed: December 2012.
NIOSH [1994]. Hazard evaluation and technical assistance report: Social Security Administration teleservice centers – Boston, Massachusetts, Fort Lauderdale, Florida. Cincinnati, OH: U.S. Department of Health and Human Services, Centers for Disease Control and Prevention, National Institute for Occupational Safety and Health, NIOSH HETA Report No. 92-0382-2450.
NIOSH [2007a]. Hazard evaluation and technical assistance report: Cincinnati police department police communication section – Cincinnati, Ohio. Cincinnati, OH: U.S. Department of Health and Human Services, Centers for Disease Control and Prevention,
Page 20 Health Hazard Evaluation Report 2012-0081-3169
RefeRenCes (Continued) National Institute for Occupational Safety and Health, NIOSH
HETA Report No. 1999-0199-3053.
NIOSH [2007b]. Hazard evaluation and technical assistance report: New York City police department, police communications section – New York, New York. Cincinnati, OH: U.S. Department of Health and Human Services, Centers for Disease Control and Prevention, National Institute for Occupational Safety and Health, NIOSH HETA Report No. 97-0137-3026.
OEHHA [2012]. Proposition 65 fact sheet for tenants. California Office of Environmental Health Hazard Assessment. [http://www.oehha.ca.gov/prop65/background/P65ten.html]. Date accessed: December 2012.

Page 21Health Hazard Evaluation Report 2012-0081-3169
Appendix A: tABles
Table A1. Airflow measurements in call center pod B
Diffuser Location(Figure B1)
Airflow (cfm)CommentsMeasurement
Average1 2 3
B1* — — — — Blocked by furnitureB2 — — — — Blocked by furnitureB3 — — — — Blocked by furnitureB4 — — — — Blocked by furnitureB5 450 420 410 427B6 475 480 490 482B7 250 250 255 252B8 340 320 345 335B9 350 340 345 345B10 385 385 380 383B11 355 370 360 362B12 340 330 340 337B13 290 285 300 292B14 580 580 600 587B15 — — — — Blocked by furnitureB16 240 230 235 235B17 310 290 285 295B18 225 220 230 225B19 — — — — Blocked by furnitureB20 — — — — Blocked by furnitureB21 — — — — Blocked by furnitureB22 440 450 445 445B23 620 610 610 613B24 450 460 465 458B25 512 539 522 524B26 249 257 266 257B27 276 295 279 283B28 364 340 328 344B29 — — — — Blocked by furnitureB30 553 546 551 550B31 199 173 187 186B32 288 292 288 289B33 541 527 539 536B34 185 203 168 185 Individual office* All ceiling diffusers were 2′ x 2′, unless otherwise noted.

Page 22 Health Hazard Evaluation Report 2012-0081-3169
Appendix A: tABles
(Continued)Table A2. Airflow measurements in call center pod C
Diffuser Location(Figure B2)
Airflow (cfm)CommentsMeasurement
Average1 2 3
C1* 172 176 173 174
C2 553 611 540 568 Noise from air blowing from diffuser
C3 392 421 353 389
C4 414 415 421 417
C5 472 461 450 461
C6 520 583 531 545
C7 387 374 367 376
C8 146 148 148 147
C9 136 128 99 121
C10 0 0 0 0 No air movement from diffuserC11 100 106 101 102 1′ X 1′ diffuserC12 36 111 36 61 1′ X 1′ diffuser
C13 557 523 540 540
C14 387 396 392 392
C15 353 356 358 356
C16 257 242 252 250
C17 236 239 232 236
C18 649 674 666 663 Noise from air blowing from diffuser
C19 265 248 287 267
C20 492 503 457 484
C21 282 296 283 287
C22 208 231 221 220
C23 — — — — Blocked by furnitureC24 — — — — Blocked by furniture
C25 269 295 284 283
C26 264 309 300 291
C27 448 459 459 455
* All ceiling diffusers were 2′ x 2′, unless otherwise noted.

Page 23Health Hazard Evaluation Report 2012-0081-3169
Appendix A: tABles
(Continued)Table A3. Airflow measurements in call center pod D
Diffuser Location(Figure B3)
Airflow (cfm)CommentsMeasurement
Average1 2 3
D1 428 416 407 417
D2 274 245 261 260
D3 81 77 83 80
D4 496 489 527 504
D5 333 330 310 324
D6 85 79 87 84
D7 388 414 412 405
D8 585 574 635 598
D9 409 378 474 420
D10 407 350 420 392
D11 947 852 951 917 Noise from air blowing from diffuser
D12 248 227 263 246
D13 504 509 517 510
D14 — — — — Blocked by furniture
D15 272 256 264 264
D16 328 345 315 329
D17 — — — — Blocked by furniture
D18 401 396 380 392
D19 167 176 153 165 Individual officeD20 323 352 333 336 Noisy; different diffuser designD21 — — — — Blocked by furnitureD22 — — — — Blocked by furniture
D23 537 504 481 507
D24 499 491 454 481
D25 386 375 386 382 Diffuser partially blocked by window shade* All ceiling diffusers were 2′ x 2′, unless otherwise noted.

Page 24 Health Hazard Evaluation Report 2012-0081-3169
Appendix B: figuRes

Page 25Health Hazard Evaluation Report 2012-0081-3169
Appendix B: figuRes
(Continued)

Page 26 Health Hazard Evaluation Report 2012-0081-3169
Appendix B: figuRes
(Continued)

Page 27Health Hazard Evaluation Report 2012-0081-3169
ACknowledgments And AvAilABility of RepoRt
The Hazard Evaluations and Technical Assistance Branch (HETAB) of the National Institute for Occupational Safety and Health (NIOSH) conducts field investigations of possible health hazards in the workplace. These investigations are conducted under the authority of Section 20(a)(6) of the Occupational Safety and Health Act of 1970, 29 U.S.C. 669(a)(6) which authorizes the Secretary of Health and Human Services, following a written request from any employer or authorized representative of employees, to determine whether any substance normally found in the place of employment has potentially toxic effects in such concentrations as used or found. HETAB also provides, upon request, technical and consultative assistance to federal, state, and local agencies; labor; industry; and other groups or individuals to control occupational health hazards and to prevent related trauma and disease.
Mention of any company or product does not constitute endorsement by NIOSH. In addition, citations to websites external to NIOSH do not constitute NIOSH endorsement of the sponsoring organizations or their programs or products. Furthermore, NIOSH is not responsible for the content of these websites. All Web addresses referenced in this document were accessible as of the publication date.
This report was prepared by Douglas Wiegand, Jessica Ramsey, Gregory Burr, and JungHo Choi of HETAB, Division of Surveillance, Hazard Evaluations and Field Studies. Industrial hygiene equipment and logistical support was provided by Donald Booher and Karl Feldmann. Statistical consultation was provided by Charles Mueller. Health communication assistance was provided by Stefanie Brown. Editorial assistance was provided by Ellen Galloway. Desktop publishing was performed by Mary Winfree.
Copies of this report have been sent to employee and management representatives at the call center, the state health department, and the Occupational Safety and Health Administration Regional Office. This report is not copyrighted and may be freely reproduced. The report may be viewed and printed at http://www.cdc.gov/niosh/hhe/. Copies may be purchased from the National Technical Information Service at 5825 Port Royal Road, Springfield, Virginia 22161.
Below is a recommended citation for this report:NIOSH [2013]. Health hazard evaluation report: lighting, indoor environmental quality concerns, and job stress at a call center – California. By Wiegand D, Ramsey J, Burr G, Choi J. Cincinnati, OH: U.S. Department of Health and Human Services, Centers for Disease Control and Prevention, National Institute for Occupational Safety and Health, NIOSH HETA No. 2012-0081-3169.
To receive NIOSH documents or information about occupational safety and health topics, contact NIOSH at:1-800-CDC-INFO (1-800-232-4636)TTY: 1-888-232-6348E-mail: [email protected]
or visit the NIOSH web site at: www.cdc.gov/niosh.
For a monthly update on news at NIOSH, subscribe to NIOSH eNews by visiting www.cdc.gov/niosh/eNews.
Delivering on the Nation’s promise:Safety and health at work for all peoplethrough research and prevention.
National Institute for Occupational Safety and Health