hidden costs: the precautionary principle, and risks of
TRANSCRIPT
Hidden Costs: The Precautionary Principle, and Risks of Clean Energy Policy
Dr. Dino Falaschetti∗
PERC
July 15, 2013
∗ Executive Director, Property and Environment Research Center (PERC) and Special Consultant, Economists Incorporated. Email: [email protected]. This research was commissioned by the George W. Bush Presidential Center, and benefitted not only from the Bush Center’s support, but also conversations with Terry Anderson, Matthew Denhart, Roger Meiners, Michael Orlando, Steve Pociask, Shawn Regan, Amity Shlaes, Machir Stull, and Matthew Turner. Without claiming endorsement, I thank each for their thoughtful consideration.
2
Hidden Costs: The Precautionary Principle, and Risks of Clean Energy Policy
Dr. Dino Falaschetti
PERC
Policy makers and commentators frequently cite the Precautionary Principle to
rationalize public support for clean energy initiatives. The Principle holds that
preemptive environmental protection is warranted, even if the nature of threats is
not yet clear. Such action is said to offer, as former Secretary of State George Shultz
has put it, a kind of insurance policy against environmental disaster. Adhering to
the Principle can cause more harm than good, however. For every $100 billion that
the United States centrally directs to clean energy, GDP may decrease by over
0.4%. Compounded over a generation, this reduction approximates today’s per
capita income gap between the United States and Italy. In addition, the physics of
climate variation may be such that little benefit will come from slowing our rates of
carbon emissions. And in any event, centrally directing resources to clean energy
can fuel environmental degradation by encouraging inefficiencies in the
production of energy, which can cause people to consume more resources for any
level of energy-use and spend more of their shrinking budgets on economic
necessities rather than environmental amenities.
Keywords: Clean energy subsidies, environmental regulation, economic growth,
environmental markets, environmental quality
In order to protect the environment, the precautionary approach shall be widely
applied by States according to their capabilities. Where there are threats of serious
or irreversible damage, lack of full scientific certainty shall not be used as a reason
for postponing cost-effective measures to prevent environmental degradation.1
1 Principle 15, quoted from the United Nations’ report on the Conference on Environment and Development, Rio de Janeiro, June 3-14, 1992. Accessed June 15, 2013, from www.un.org/documents/ga/conf151/aconf15126-1annex1.htm.
3
1. Introduction
Principle 15 from the United Nation’s Rio Declaration, quoted above, offers a
moderate interpretation of the Precautionary Principle.2 Introduced as a catalyst for
1970’s environmental policies in Europe, the Principle now receives reference in
numerous international treaties and declarations, including the 1992 Treaty on
European Union (Foster et al. 2000, p. 979).
A growing body of case law, including important decisions by the (European)
Court of Justice, also refers to various interpretations of the Principle (Foster et al.
2000, p. 979). And while American case law contains few references to the Principle,
arguments for clean energy policies contain many.3 During a recent state visit to
Germany, for example, President Barack Obama urged “all nations, not just some”
to serve more of their energy demands “from clean sources like wind and solar
power.” The urgency for action was framed as an overdue precaution against the
perils of continued carbon energy use:4
The grim alternative [to not capping carbon emissions] affects all
nations — more severe storms, more famine and floods, new waves of
refugees, coastlines that vanish, oceans that rise. This is the future we
must avert. This is the global threat of our time. And for the sake of
future generations, our generation must move toward a global
compact to confront a changing climate before it is too late.
2 Foster et al. (2000, p. 979) characterize the Principle’s “strongest formulations” as those that call for “absolute proof of safety before allowing new technologies to be adopted.” Rupert Darwall (2013, p. 151) refers to the Rio Declaration’s 15th principle as the “precautionary principle.” 3 While “few if any laws [in the United States] cite the Precautionary Principle,” courts have nevertheless “upheld the ability of government to base regulatory decisions on substantial evidence that is ‘less than a preponderance, but more than a scintilla.’” (Foster et al. 2000, p. 981) 4 The Guardian (2013). Barack Obama’s Berlin Speech – full text, June 19. Accessed June 20, 2013, at http://www.guardian.co.uk/world/2013/jun/19/barack-obama-berlin-speech-full-text.
4
Former Secretary of State George Shultz also referenced the Principle in a recent
Wall Street Journal conference on ECO:nomics,5 rationalizing clean energy subsidies
as a necessary “insurance policy” against the catastrophic consequences of climate
change. And according to some commentators, enjoying the benefits of
precautionary measures like these may not cost much.6
This type of argument enjoys considerable appeal. After all, who wouldn’t
insure against the “the grim alternative” of famines, floods, and other perils,
especially if the insurance is cheap? Despite repeated characterization as a low-cost
precaution against increasing temperatures and now climate variability, however,
clean energy policies are not insurance and may themselves be creating
considerable risks for the economy and environment. Indeed, while we frequently
consider the cost of doing too little about carbon emissions, we infrequently
consider the cost of doing too much. Both can be high.
In this introduction’s remainder, I review some of the science behind this more
balanced view of carbon-based energy. The short story here is that no economically
feasible slowing of carbon emissions may be capable of reducing our climate’s
variability. Centrally directing resources to clean energy may thus be shrinking
economic opportunities while returning relatively little in the way of environmental
benefits. Even more, inefficiencies associated with such poorly informed and
weakly incented allocation methods can damage our environment. Despite its
characterization as a prudent exercise in precaution, publicly supporting clean
energy may instead be exacerbating the very problems it claims to solve.
This opinion rests in part on relaxing a popular assumption that clean energy, if
only produced on a more widespread basis, can mitigate climate variability.
5 Comments during presentation of “A bipartisan approach to energy policy,” March 21, 2013, Santa Barbara, CA. 6 The Nobel Laureate Paul Krugman (2009), for example, argued that “Saving the planet won’t…cost all that much either… the best available economic analyses suggest that even deep cuts in greenhouse gas emissions would impose only modest costs on the average family…And all of this, of course, ignores the benefits of limiting global warming…The claim that climate legislation will kill the economy deserves the same disdain as the claim that global warming is a hoax. The truth about the economics of climate change is that it’s relatively easy being green.”
5
The Nobel Prize winning physicist, Robert Laughlin, offers a stark alternative,
arguing that whether we exhaust carbon-based fuels over 50 or 500 years doesn’t
matter when considered in terms of geologic time. According to Laughlin, any such
time period constitutes “the bat of an eyelash as far as the earth is concerned.”7
Laughlin’s argument suggests that environmental benefits from publicly
supporting clean energy (or discouraging conventional energy) are much smaller
than what is popularly assumed.8 Importantly, this less sanguine view of clean
energy builds on the laws of physics, and thus obtains even if we ignore
complications from the laws of politics. If we also account for efficiency losses from
omnipresent incentives to divert resources toward building political coalitions
rather than expanding economic opportunity, a more complete set of clean energy
costs comes into view.9
7 Laughlin (2011, p. 8) observes that:
The earth has suffered mass volcanic explosions, floodings, meteor impacts, mountain building, and all manner of other abuses greater than anything people could inflict, and it’s still here. It’s a survivor. Nonetheless, damaging the earth is precisely what’s concerning a lot of responsible people at the moment…Governments around the world have become so alarmed at this prospect that they’ve taken significant (though ineffective) steps to slow the warming. These actions include legislating carbon caps, funding carbon sequestration research, subsidizing alternate energy technologies, and initiating at least one serious international treaty process to balance the necessary economic sacrifices across borders. Unfortunately, this concern isn’t reciprocated. On the scales of time relevant to itself, the earth doesn’t care about any of these governments or their legislation…These actions simply spread the pain over a few centuries, the bat of an eyelash as far as the earth is concerned, and leave the end result exactly the same.
8 To be sure, Dr. Laughlin is not unconcerned about environmental issues. He observes, for example, that “The real problem is human population pressure generally – overharvesting, habitat destruction, pesticide abuse, species invasion, and so forth.” (Laughlin 2011, p. 10) It is important to note, however, that even these environmental problems may resist even the best of intentions when funneled through highly political institutions. 9 Falaschetti (2009), among others, reviews the literature on why political processes are prone to inefficient distributive interests.
6
That such distributional forces are both strong and persistent is evident in the
fact that the United States has subsidized clean energy since at least President
Jimmy Carter’s 1978 signing of the Public Utilities Regulatory Policy Act and the
Energy Tax Act.10 Today’s Department of Energy also offers evidence that is easier
to rationalize with a model where political inefficiencies create a sizable wedge
between actual public actions and stated good intentions. It reports, for example,
that a $34.5 billion “Financing Force Behind America’s Clean Energy Economy”
created or saved about 60,000 jobs.11 At this rate, each $575,000 in loans is associated
with only one green job created or saved.
To the extent that “climate is a profoundly grander thing than energy,”12
reducing our rate of carbon emissions may have little effect on climate variation,
and even the most productive politics would be incapable of improving
environmental quality on this dimension. In this case, the politics of clean energy
may primarily be directing resources to lower-valued uses, which not only weakens
economic performance but also reduces environmental quality by increasing
resource demands for any level of production. Rather than being a dominant
strategy in the sense of reducing the possibility of harm with little if any downside,
precautionary energy policies appear capable of inflicting considerable costs on
both our economy and environment.
In the following section of this article, I estimate how costly public support for
clean energy might be in terms of lost economic output, and build on these
estimates to evaluate the economic impact of specific subsidies and regulations. In
section three, I consider how this evaluation may be conservative in the sense that it
ignores feedback channels between economic performance and environmental 10 These subsidies have increased over time with the Energy Policy Act of 1992, for example, as well as the creation of tax credits for clean energy investment and production. Standing at 2.2 cents (after taxes) per kilowatt-hour (kWh), for example, today’s production tax credit (PTC) often exceeds the wholesale price of electricity (Lesser 2013, p. 23). 11 U.S. Department of Energy, Loan Programs Office, http://lpo.energy.gov/?page_id=45. Accessed May 2, 2013. 12 “The geologic record as we know it…suggests that climate is a profoundly grander thing than energy.” (Laughlin 2011, p. 16)
7
quality. This broader lens view highlights how big of a wrong turn, for both our
economy and environment, public policies may be making by encouraging clean
energy development. I conclude in section four by highlighting that, rather than
being an abstraction that invites loose storytelling, economies fueled by organic
energy were the norm in our not too distant past.13 Policies that risk pushing us
back to this future may also be hastening a return to inferior living standards and
poorer environmental quality.
2. Can “Precaution” Create Risks? Yes, to the Economy and the Environment
2.1 On the high cost and low benefit of clean energy14
Absent considerable policy support, clean energy may have little economic viability.
Laughlin (2011, p. 32), for example, observes that
Carbon is just too superior in portability, lightness, and safety to all other
energy storage media, at least here on earth.
Given this superiority, he concludes that,
without subsidies…cost-conscious buyers will choose conventional engines,
which are simple, reliable, and cheap (2011, p. 37).15
Cruz and Taylor (2012, p. 2) add that “many energy economists today debate the role
green power can play in powering a modern developed economy in the future.”
13 Energy consumption in the United States was exclusively sourced from biomass until about 1850, for example, and biomass continued to be the States’ main source of energy until about 1890 (Cruz and Taylor 2012, p. 8). 14 “Clean energy” refers to energy produced from purportedly low-emission sources like solar and wind. 15 Laughlin (and others) observe that carbon-based fuels enjoy a remarkable energy-efficiency and, given our self-interest, we are unlikely to forego these fuels until the fundamental costs of production become prohibitive. California’s electricity shortage in the early 2000s is illustrative. While residing in Berkeley, California during this period, I didn’t hear anyone characterize the large-scale blackouts as having a silver lining – that is, the considerable reduction in carbon-based energy consumption was helping the environment. Rather, anger about the sporadic supply of reliable power was so strong that voters recalled the state’s governor – only the second time ever in U.S. history. Laughlin offers a related story and others to illustrate how economic forces are likely to overwhelm support from clean energy regulations and subsidies. He goes further, arguing that energy may not be clean even after carbon based energy is gone.
8
And even self-described environmentalists have voiced skepticism about clean energy’s
efficiency problem.16 In addition to facing challenges from the laws of physics, centrally
directed resources to clean energy must overcome political inefficiencies. Both hurdles
are formidable, and put public support for alternatives like solar and wind at risk of
consuming more resource inputs to produce less energy. Realizing this risk is clearly
bad for economic performance, and viewed through an environmental lens, appears
inconsistent with the principles of sustainable use or conservation. Rather than
supporting a win-win reallocation of economic resources for jobs and the environment,
precautionary energy policies can fuel a lose-lose race to the bottom.17 By effectively
increasing the resource cost of producing goods and services, public support for clean
energy can shrink economic opportunity in general while weakening demand for
environmental amenities as people allocate more of their tightening budgets to economic
necessities.
2.2 A methodology for measuring the economic cost of clean energy support
While researchers like Laughlin (2011) and Cruz and Taylor (2012) question the
potential for clean energy to create environmental benefits, public support for clean
energy could be shrinking our economic opportunities. To estimate how much
economic wealth may be squandered from centrally directing resources to clean
energy, I consider how productive those resources could have been if employed
elsewhere. In particular, I assume that a competitive market would have directed
associated resources to the carbon-based energy sector. I then estimate how much
more (or less) value those resources would have created by calculating the
16 Nordhaus and Shellenberger (2013), for example, appreciate that end-of-the-world scenarios can fuel support for clean energy. They also argue, however, that “anyone truly concerned about climate change will need to reconsider their opposition to nuclear.” 17 Former Michigan governor Jennifer Granholm emphasizes the importance of highlighting job creation benefits when lobbying for alternative energy, Tweeting that it is “Important 2 couch climate change in terms of jobs that can be created in the globe’s fastest growing sector:clean energy” (@JenGranholm, May 8, 2013). Also see Lesser (2013, p. 22).
9
differences between financial rates of return from private oil and gas investments
versus those from publicly supported projects.
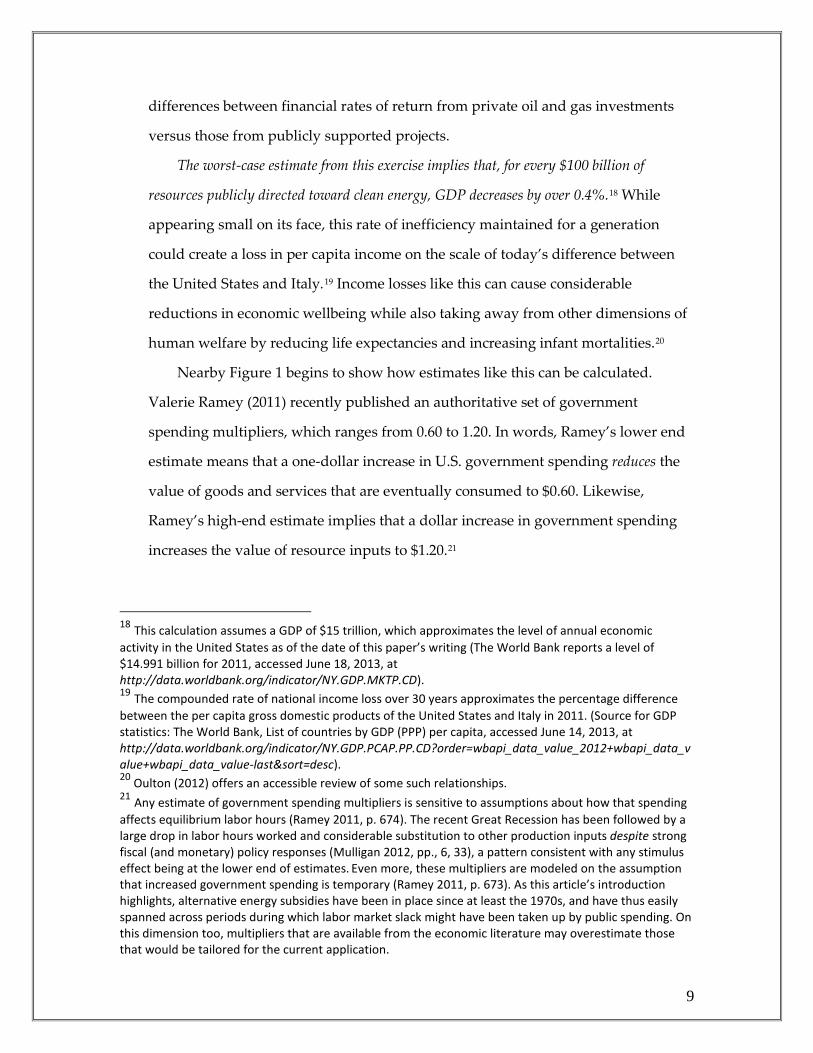
The worst-case estimate from this exercise implies that, for every $100 billion of
resources publicly directed toward clean energy, GDP decreases by over 0.4%.18 While
appearing small on its face, this rate of inefficiency maintained for a generation
could create a loss in per capita income on the scale of today’s difference between
the United States and Italy.19 Income losses like this can cause considerable
reductions in economic wellbeing while also taking away from other dimensions of
human welfare by reducing life expectancies and increasing infant mortalities.20
Nearby Figure 1 begins to show how estimates like this can be calculated.
Valerie Ramey (2011) recently published an authoritative set of government
spending multipliers, which ranges from 0.60 to 1.20. In words, Ramey’s lower end
estimate means that a one-dollar increase in U.S. government spending reduces the
value of goods and services that are eventually consumed to $0.60. Likewise,
Ramey’s high-end estimate implies that a dollar increase in government spending
increases the value of resource inputs to $1.20.21
18 This calculation assumes a GDP of $15 trillion, which approximates the level of annual economic activity in the United States as of the date of this paper’s writing (The World Bank reports a level of $14.991 billion for 2011, accessed June 18, 2013, at http://data.worldbank.org/indicator/NY.GDP.MKTP.CD). 19 The compounded rate of national income loss over 30 years approximates the percentage difference between the per capita gross domestic products of the United States and Italy in 2011. (Source for GDP statistics: The World Bank, List of countries by GDP (PPP) per capita, accessed June 14, 2013, at http://data.worldbank.org/indicator/NY.GDP.PCAP.PP.CD?order=wbapi_data_value_2012+wbapi_data_value+wbapi_data_value-last&sort=desc). 20 Oulton (2012) offers an accessible review of some such relationships. 21 Any estimate of government spending multipliers is sensitive to assumptions about how that spending affects equilibrium labor hours (Ramey 2011, p. 674). The recent Great Recession has been followed by a large drop in labor hours worked and considerable substitution to other production inputs despite strong fiscal (and monetary) policy responses (Mulligan 2012, pp., 6, 33), a pattern consistent with any stimulus effect being at the lower end of estimates. Even more, these multipliers are modeled on the assumption that increased government spending is temporary (Ramey 2011, p. 673). As this article’s introduction highlights, alternative energy subsidies have been in place since at least the 1970s, and have thus easily spanned across periods during which labor market slack might have been taken up by public spending. On this dimension too, multipliers that are available from the economic literature may overestimate those that would be tailored for the current application.
10
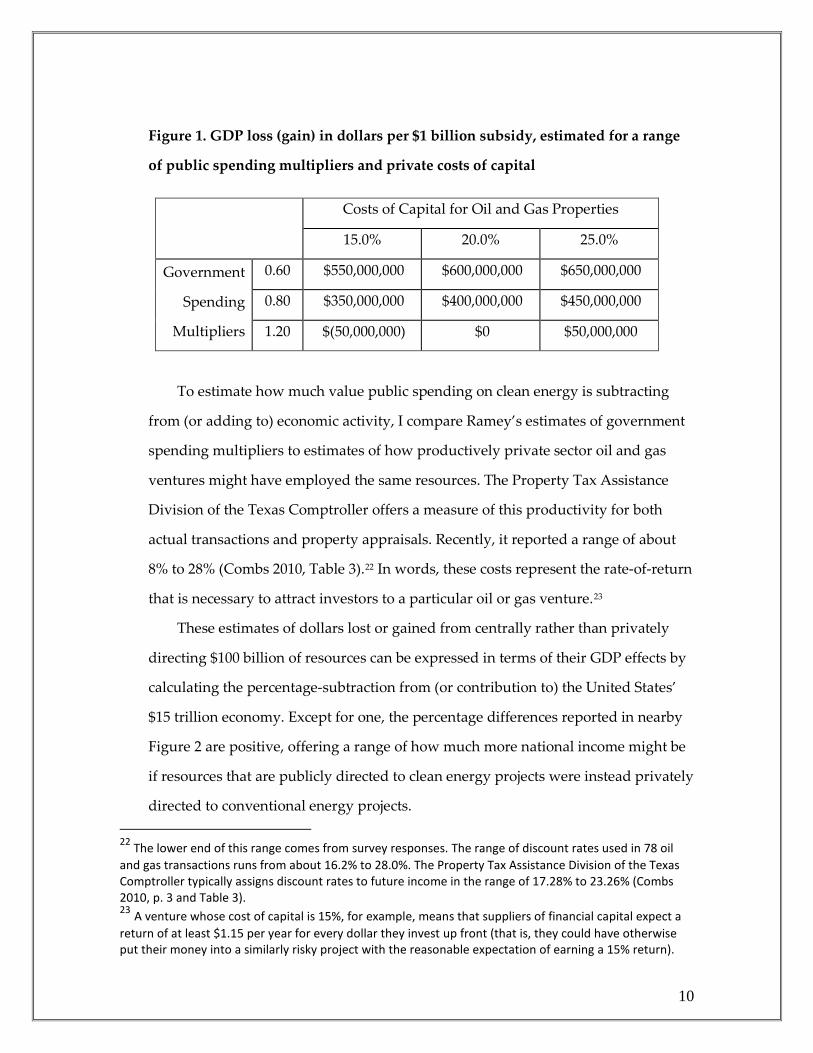
Figure 1. GDP loss (gain) in dollars per $1 billion subsidy, estimated for a range
of public spending multipliers and private costs of capital
Costs of Capital for Oil and Gas Properties
15.0% 20.0% 25.0%
Government
Spending
Multipliers
0.60 $550,000,000 $600,000,000 $650,000,000
0.80 $350,000,000 $400,000,000 $450,000,000
1.20 $(50,000,000) $0 $50,000,000
To estimate how much value public spending on clean energy is subtracting
from (or adding to) economic activity, I compare Ramey’s estimates of government
spending multipliers to estimates of how productively private sector oil and gas
ventures might have employed the same resources. The Property Tax Assistance
Division of the Texas Comptroller offers a measure of this productivity for both
actual transactions and property appraisals. Recently, it reported a range of about
8% to 28% (Combs 2010, Table 3).22 In words, these costs represent the rate-of-return
that is necessary to attract investors to a particular oil or gas venture.23
These estimates of dollars lost or gained from centrally rather than privately
directing $100 billion of resources can be expressed in terms of their GDP effects by
calculating the percentage-subtraction from (or contribution to) the United States’
$15 trillion economy. Except for one, the percentage differences reported in nearby
Figure 2 are positive, offering a range of how much more national income might be
if resources that are publicly directed to clean energy projects were instead privately
directed to conventional energy projects. 22 The lower end of this range comes from survey responses. The range of discount rates used in 78 oil and gas transactions runs from about 16.2% to 28.0%. The Property Tax Assistance Division of the Texas Comptroller typically assigns discount rates to future income in the range of 17.28% to 23.26% (Combs 2010, p. 3 and Table 3). 23 A venture whose cost of capital is 15%, for example, means that suppliers of financial capital expect a return of at least $1.15 per year for every dollar they invest up front (that is, they could have otherwise put their money into a similarly risky project with the reasonable expectation of earning a 15% return).
11
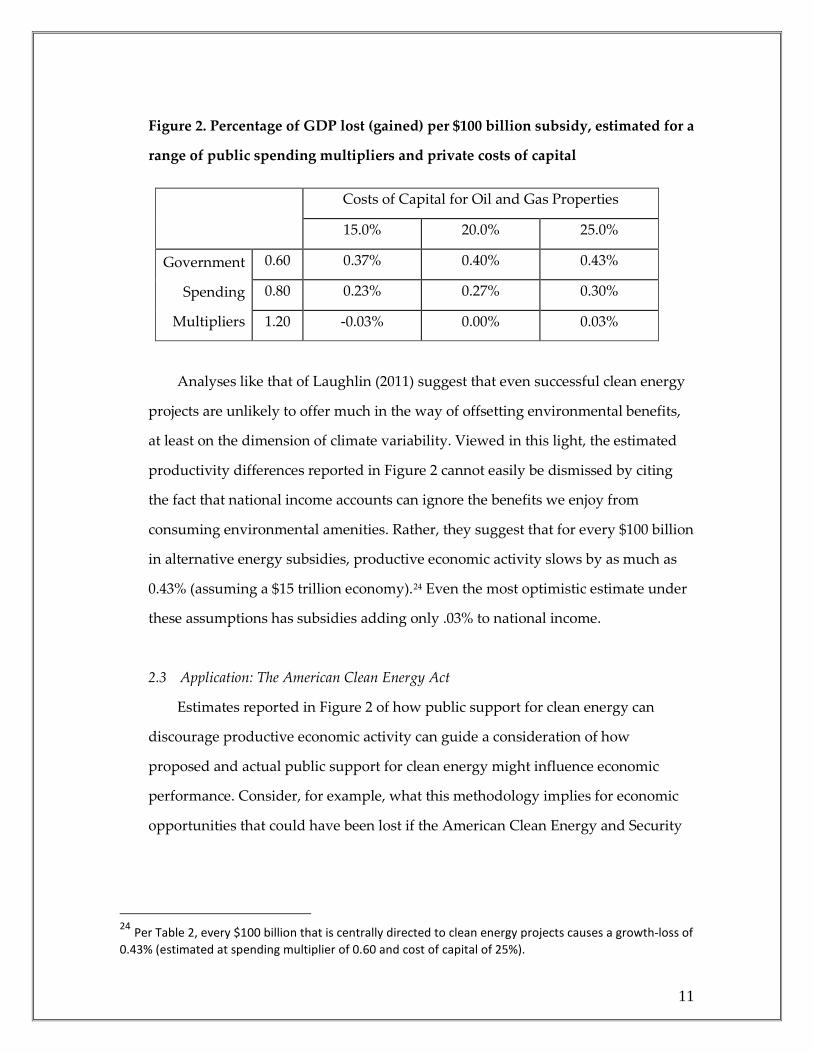
Figure 2. Percentage of GDP lost (gained) per $100 billion subsidy, estimated for a
range of public spending multipliers and private costs of capital
Costs of Capital for Oil and Gas Properties
15.0% 20.0% 25.0%
Government
Spending
Multipliers
0.60 0.37% 0.40% 0.43%
0.80 0.23% 0.27% 0.30%
1.20 -0.03% 0.00% 0.03%
Analyses like that of Laughlin (2011) suggest that even successful clean energy
projects are unlikely to offer much in the way of offsetting environmental benefits,
at least on the dimension of climate variability. Viewed in this light, the estimated
productivity differences reported in Figure 2 cannot easily be dismissed by citing
the fact that national income accounts can ignore the benefits we enjoy from
consuming environmental amenities. Rather, they suggest that for every $100 billion
in alternative energy subsidies, productive economic activity slows by as much as
0.43% (assuming a $15 trillion economy).24 Even the most optimistic estimate under
these assumptions has subsidies adding only .03% to national income.
2.3 Application: The American Clean Energy Act
Estimates reported in Figure 2 of how public support for clean energy can
discourage productive economic activity can guide a consideration of how
proposed and actual public support for clean energy might influence economic
performance. Consider, for example, what this methodology implies for economic
opportunities that could have been lost if the American Clean Energy and Security
24 Per Table 2, every $100 billion that is centrally directed to clean energy projects causes a growth-loss of 0.43% (estimated at spending multiplier of 0.60 and cost of capital of 25%).
12
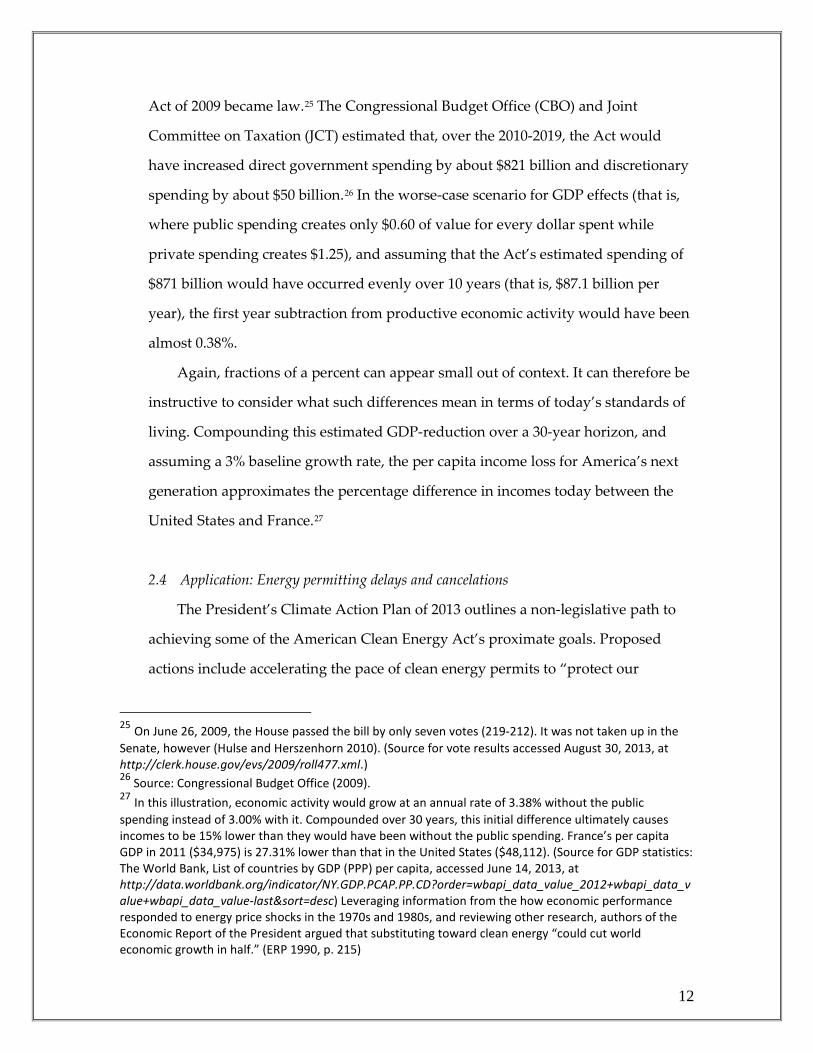
Act of 2009 became law.25 The Congressional Budget Office (CBO) and Joint
Committee on Taxation (JCT) estimated that, over the 2010-2019, the Act would
have increased direct government spending by about $821 billion and discretionary
spending by about $50 billion.26 In the worse-case scenario for GDP effects (that is,
where public spending creates only $0.60 of value for every dollar spent while
private spending creates $1.25), and assuming that the Act’s estimated spending of
$871 billion would have occurred evenly over 10 years (that is, $87.1 billion per
year), the first year subtraction from productive economic activity would have been
almost 0.38%.
Again, fractions of a percent can appear small out of context. It can therefore be
instructive to consider what such differences mean in terms of today’s standards of
living. Compounding this estimated GDP-reduction over a 30-year horizon, and
assuming a 3% baseline growth rate, the per capita income loss for America’s next
generation approximates the percentage difference in incomes today between the
United States and France.27
2.4 Application: Energy permitting delays and cancelations
The President’s Climate Action Plan of 2013 outlines a non-legislative path to
achieving some of the American Clean Energy Act’s proximate goals. Proposed
actions include accelerating the pace of clean energy permits to “protect our
25 On June 26, 2009, the House passed the bill by only seven votes (219-212). It was not taken up in the Senate, however (Hulse and Herszenhorn 2010). (Source for vote results accessed August 30, 2013, at http://clerk.house.gov/evs/2009/roll477.xml.) 26 Source: Congressional Budget Office (2009). 27 In this illustration, economic activity would grow at an annual rate of 3.38% without the public spending instead of 3.00% with it. Compounded over 30 years, this initial difference ultimately causes incomes to be 15% lower than they would have been without the public spending. France’s per capita GDP in 2011 ($34,975) is 27.31% lower than that in the United States ($48,112). (Source for GDP statistics: The World Bank, List of countries by GDP (PPP) per capita, accessed June 14, 2013, at http://data.worldbank.org/indicator/NY.GDP.PCAP.PP.CD?order=wbapi_data_value_2012+wbapi_data_value+wbapi_data_value-last&sort=desc) Leveraging information from the how economic performance responded to energy price shocks in the 1970s and 1980s, and reviewing other research, authors of the Economic Report of the President argued that substituting toward clean energy “could cut world economic growth in half.” (ERP 1990, p. 215)
13
children’s health and begin to slow the effects of climate change” (Executive Office
of the President 2013, pp. 4, 7).
Both clean and conventional energy projects can encounter considerable delays
while waiting for regulatory permission. And associated costs can rise so high that
the permitting process effectively cancels projects before they can get started.28 Steve
Pociask and Joseph Fuhr Jr. (2011), for example, documented over 300 projects that
are currently delayed or have effectively been canceled through such channels.
Their sample of projects alone represents almost $600 billion of investment that may
be idling inefficiently (Pociask and Fuhr 2011, p. 4).
One way to estimate economic losses from these delays and cancellations is to
simply extend the methodology described earlier in this section by characterizing
permitting delays and cancelations as a channel for political rather than market
forces to direct economic resources. The worst-case estimate that every $100 billion
subjected to such influence causes $65 billion in lost economic opportunities, for
example, implies that permitting delays and cancelations are scrubbing almost $400
billion off GDP.29 To put this number into context, supplemental appropriations for
September 11, 2001 and Hurricane Katrina were $40 billion and $94.8 billion,
respectively.30
Data from Pociask and Fuhr (2011) also lend themselves to analysis via
standard capital budgeting methods.31 Here, lost economic opportunities from
permitting delays and cancelations can be estimated from revenues that are
28 Source: Introduction to Pociask and Fuhr (2011) and phone conversation with Steve Pociask, June 26, 2013. 29 If the opportunity cost for every $100 billion of publicly directed resources equals $65 billion, then the opportunity cost of having $577 billion sidelined by the permitting process equals $375.05 billion (that is, $5.77 × $65 billion). 30 Source for 9/11 spending: Public Law 107-38 (2001 Emergency Supplemental Appropriations Act for Recovery from and Response to Terrorist Attacks on the United States), accessed July 15, 2013, at www.gpo.gov/fdsys/pkg/PLAW-107publ38/html/PLAW-107publ38.htm. Source for Katrina spending: Congressional Budget Office (2007). The Federal Government’s Spending and Tax Actions in Response to the 2005 Gulf Coast Hurricanes. Accessed July 15, 2013, at www.cbo.gov/sites/default/files/cbofiles/ftpdocs/85xx/doc8514/08-07-hurricanes_letter.pdf. 31 Brealey, Richard, Stewart Myers, and Franklin Allen (2010), among others, offer a textbook treatment of these methods.
14
necessary to competitively support their sample of $577 billion sidelined
investments. If investors require a 25% rate of return before supplying financial
capital to these projects (Combs 2010), and all of the projects are cancelled, then the
loss of annual revenues over an assumed twenty-year project life is over $145 billion
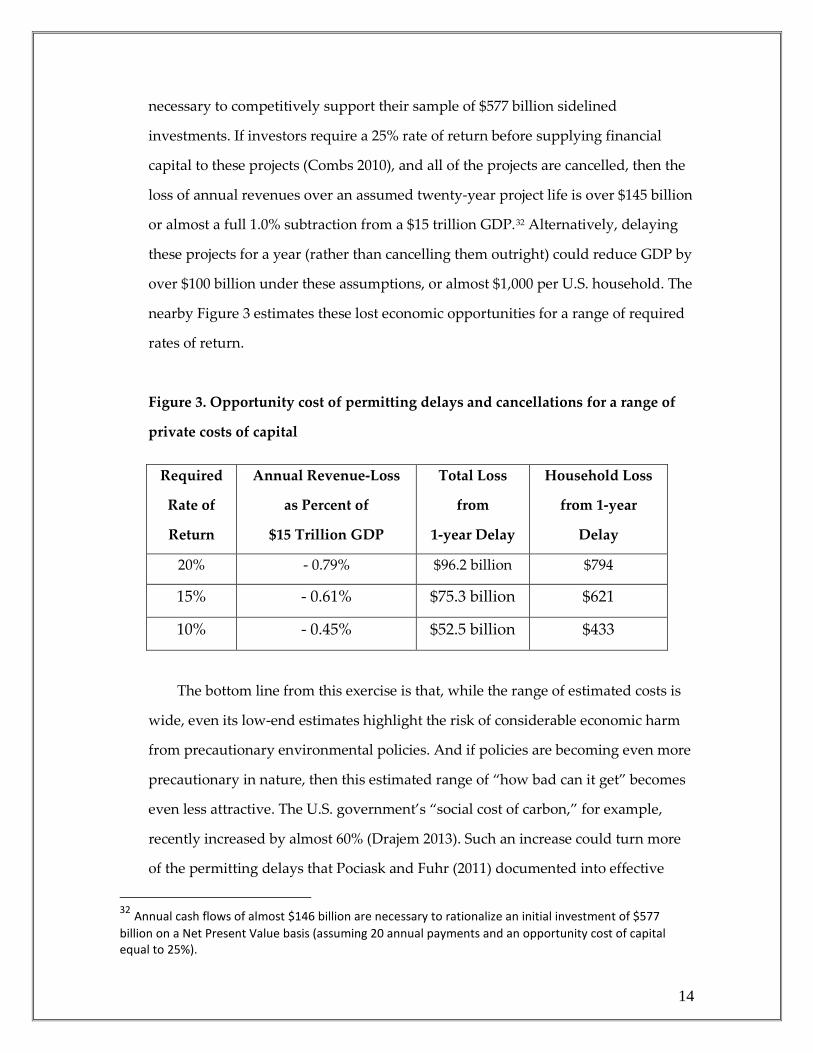
or almost a full 1.0% subtraction from a $15 trillion GDP.32 Alternatively, delaying
these projects for a year (rather than cancelling them outright) could reduce GDP by
over $100 billion under these assumptions, or almost $1,000 per U.S. household. The
nearby Figure 3 estimates these lost economic opportunities for a range of required
rates of return.
Figure 3. Opportunity cost of permitting delays and cancellations for a range of
private costs of capital
Required
Rate of
Return
Annual Revenue-Loss
as Percent of
$15 Trillion GDP
Total Loss
from
1-year Delay
Household Loss
from 1-year
Delay
20% - 0.79% $96.2 billion $794
15% - 0.61% $75.3 billion $621
10% - 0.45% $52.5 billion $433
The bottom line from this exercise is that, while the range of estimated costs is
wide, even its low-end estimates highlight the risk of considerable economic harm
from precautionary environmental policies. And if policies are becoming even more
precautionary in nature, then this estimated range of “how bad can it get” becomes
even less attractive. The U.S. government’s “social cost of carbon,” for example,
recently increased by almost 60% (Drajem 2013). Such an increase could turn more
of the permitting delays that Pociask and Fuhr (2011) documented into effective
32 Annual cash flows of almost $146 billion are necessary to rationalize an initial investment of $577 billion on a Net Present Value basis (assuming 20 annual payments and an opportunity cost of capital equal to 25%).

15
cancellations, and thus move more of the opportunity costs reported in the above
Figure 3 from the relatively low estimates for “delays” to the high estimates for
“cancelations.”
2.5 Application: Clean energy loan guarantees
Economic costs associated with loan guarantees are relatively easy to estimate,
at least when a borrower defaults. In the highly publicized Solyndra bankruptcy, for
example, taxpayers spent an estimated $500 million to fill the gap between what
lenders invested in Solyndra and what was left after Solyndra failed to put this
financial capital to productive use (Broder 2012).
The full economic cost of such guarantees, however, likely exceeds such
headline numbers. Publicly supported guarantees can weaken economic
performance, even if they are never called upon. As noted in the present article’s
introduction, centrally directing resources is prone to considerable influence by
those who benefit more from producing votes than economic value. And according
to an 18-month Congressional investigation, public support for Solyndra appears to
have fallen into this foreseeable trap (Broder 2012). While Solyndra ended up losing
taxpayers’ money in a rather transparent way, the risk of it doing so in ways that
are harder to see was non-negligible from the start. A less well-publicized venture is
illustrative.
Having received $1.6 billion in clean-energy loan guarantees, a Google-
supported investment team is now spending tens of millions of dollars to relocate
and discourage the return of Mojave Desert tortoises. In addition to living on prime
real estate for generating solar energy, the Mojave population of the desert tortoise
is listed as threatened under the Endangered Species Act. Taxpayers are thus paying
to both protect the turtles and put their habitat at risk. And while taxpayers are
supporting both the problem and solution in this case, clean energy production at
the Google-supported consortium remains at a standstill (Huggins and Currie 2013).
16
Loan guarantees like these are administered through an almost $80 billion
Department of Energy (DOE) program (Ardani and Margolis 2011). Part of these
guarantees’ economic cost can be estimated from the Congressional Budget Office’s
valuation of historical Federal loan guarantees to America West Airlines and
Chrysler, which are reported as 35.1% and 23.2% of the guaranteed loan amounts,
respectively.33 Using the higher cost estimate, the market value of DOE loan
guarantees is $76 billion X 0.351 = $26.7 billion. The associated one-year GDP loss
with a 0.60 public spending multiplier and a 25% private cost of capital is 0.12%, or
$17.4 billion (assuming a $15 trillion economy). Compounding this loss over 30
years results in a generational income gap of about 8.31%.
While offering a worse-case scenario in one sense, this estimate is conservative
in that it excludes consideration of political inefficiencies that are evident in the
previous illustrations from Solyndra and Google’s solar consortium. It also ignores
how other centrally directed efforts to advance the solar sector can weaken
economic performance. This methodology ignores, for example, opportunity costs
of and economic distortions from investment tax credits, renewable energy grants,
manufacturing tax credits, modified depreciation allowances, tax-favored financing
mechanisms, block grants, and state and local initiatives.34
3. Can we Enjoy Economic Growth and Environmental Quality?
The Nobel laureate Robert Solow (1956) highlighted a fundamental role for
productivity in helping economies grow. Importantly, he showed why expanding
economic opportunities in the long-run requires advances in technology that
leverage how hard labor and capital can work. Simply putting in more hours, for
example, can’t facilitate long run growth — at most, we can work 24 hours per day,
and that pace wouldn’t last long. Something more than increasing levels of resource
33 Source: CBO (2004, Table 2). 34 Ardani and Margolis (2010, Sections 4.1 and 4.2) review these programs. The manner in which these programs are structured, however, masks the data that are necessary to estimate their growth-effects via my spending-multiplier / cost-of-capital methodology.

17
inputs is necessary. According to Solow’s model, an important reason why we enjoy
so much more in terms of consumption opportunities today, while working
considerably fewer hours than did people in past generations, is that technological
advances now let us make more of what we enjoy consuming from each hour of that
we work.
Federal Reserve economists, among others, offer empirical support for this
hypothesis. They estimated that over half of today’s economic growth comes from
technological advances that economize on resource inputs to finished goods and
services.35 The evolution of skyscrapers is illustrative. For example, Chicago’s Willis
Tower (completed in 1974)36 stands 200 feet taller than does New York’s Empire
State Building (completed in 1931). Materials that went into constructing Willis,
however, weigh almost 40% less (Gort et al. 1999).37 Viewed in the context of
Solow’s model, this conservation of resources was made possible by people who
discovered how to make more from less and effectively put those discoveries to
productive use.
Efficiency-gains like this not only illustrate an important force for expanding
our economic wellbeing, they appear to also serve environmental demands for
“sustainable use” and “conservation.” If expanding economic opportunity requires
increasing productivity, and increasing productivity means making more of what
consumers demand from fewer resource inputs, then a growing economy can also
be green in this important sense.38
35 Gort et al. (1999) conclude that “investment-specific technological advance accounts for more than half of economic growth. Evidently, Solow was right.” 36 At completion, today’s Willis Tower was named the Sears Tower. 37 Gort et al. observed that the “Sears Tower is 200 feet taller than the Empire State Building (circa 1931), but it weighs much less (223,000 tons versus 365,000).” 38 Edward Glaeser (2011) offers another illustration of this relationship between economic efficiency and environmental quality in his chapter on “Is there anything greener than blacktop?”
18
In addition to this rather direct and desirable environmental consequence of a
growing economy, an indirect channel may exist for environmental quality to
increase with economic growth. Economists have found evidence, for example, that
pollution decreases after incomes break through a sufficiently high level — a
relationship known as the Environmental Kuznets Curve (EKC).39 A highly cited
contribution to this literature finds
no evidence that environmental quality deteriorates steadily with economic
growth for most indicators. Rather, for most indicators, economic growth
brings an initial phase of deterioration followed by a subsequent phase of
improvement. (Grossman and Krueger 1995, p. 353)
This empirical pattern may reflect lower income households allocating a relatively
large proportion of their small budgets to economic necessities, with higher-income
households enjoying luxuries like those associated with environmental amenities.40
Consistent with this hypothesis, pollution abatement policies advanced in the
name of environmental justice for poor renters and homeowners may have instead
sparked environmental gentrifications. To the extent that such policy risks are
realized, housing costs can increase for the very people who were supposed to
receive a hand up.41 Because housing prices can increase with the value of
associated environmental amenities, individuals with relatively low incomes may
choose to live in areas that are more polluted but cheaper.42 According to this
hypothesis, the quality of environmental amenities can also indirectly increase as
economic opportunities expand in general.
39 The EKC takes its name after a similar relationship that esteemed economist Simon Kuznets found between economic development and income inequality. 40 “Necessity” and “luxury” are used here as formal economic terms. 41 Banzhaf (2008, p. 16), quoting the National Environmental Justice Advisory Council’s report to the U.S. Environmental Protection Agency. 42 See Banzhaf (2008, 20-1) and references to related studies therein.

19
4. Clean Energy Policy: Back to the Future?
Section two of this article describes how centralized support for clean energy may
be taking away from our economic opportunities while doing relatively little to
improve environmental quality. Section three goes further, highlighting how
support for clean energy via political rather than economic markets may be
reducing the quality of our environmental amenities, both directly and indirectly.
In this concluding section, I describe related insights from energy economists
and economic historians. While their assumptions differ from those that support my
earlier results, their conclusions appear similar — that is, clean energy policies
advanced in the name of “precaution” may be accelerating us to a future where
neither the economy nor environment is green.
Until the 19th century, renewables fueled all economic activity in the United
States (Cruz and Taylor 2012, p. 8). Economic wellbeing during that period,
however, pales in comparison to that of today. And both casual and scientific
observations suggest that environmental quality walked in lock step with this
dismal economic performance.43 Precautionary measures that discourage
productivity advances and thus resource conservation, or impede cities and
countries from summiting the Environmental Kuznets Curve, may be slowing or
even stopping the type of social progress that has seen economic and environmental
performance improve together.
This unattractive history, and the risks it highlights for going back in the future,
have also been attributed to the “density” advantage of fossil fuels over renewables
(Cruz and Taylor 2012, Laughlin 2011). Density, in this context, offers a combined
measure of a power-source’s energy richness and its geographic requirements. Oil,
for example, enjoys a density advantage by packing a high-energy content while
demanding little in the way of geographic area for extraction. Geographic demands
from sources like wind-farms are considerably greater, and coupled with their
43 Air pollution in London, for example, reportedly deteriorated for over 300 years until the late 19th century (Lomborg 2001).

20
inferior energy content, reduce their density while increasing their economic and
environmental opportunity costs.
Energy cannot improve economic wellbeing until it reaches people who can
productively employ it. For an energy source to make economic sense, it needs to
not only pack enough reliable power to efficiently fuel end-user activity, its density
must be high enough to make transport worthwhile. By their nature, fuels that lack
density cannot travel far — people must move to them, creating a type of energy
sprawl. Dense sources like oil, on the other hand, can support their own
transportation from miles below the oceans to fuel-tanks in our cars.44
Simply adding important issues like fuel-transport to an otherwise narrow
focus on end-of-pipe emissions highlights difficulties for renewables on both
economic and environmental dimensions. Cruz and Taylor’s (2012) “density-
creates-density” model supports observations from the economic history literature
that not only does population density increase with that of available energy, so does
economic welfare.45 And perhaps independent of these rather direct links between
energy/population density and economic performance, Harvard economist Edward
Glaeser (2011) has argued that population-dense cities are important for both strong
economic performance and environmental quality.
These models, like those developed and reviewed in earlier sections of this
article, highlight economic and environmental risks from supporting clean energy
in the name of precaution. This support can influence the relative prices we face
when choosing how to fuel our economic activity. Its prospects for changing the
laws of physics or economics, on the other hand, appear considerably weaker.
44 Villages in the Middle Ages rarely sourced fuel wood from more than a few miles away. Coal however has been transported hundreds of miles on barges, wagons and trains for much of the last two centuries. Today oil is sourced from some of the most inhospitable climates in the far reaches of the planet and from wells drilled literally miles deep below the ocean surface. (Cruz and Taylor 2012, pp. 14-15) 45 “More dense energy sources produce greater peak consumption, support larger populations at these peaks, and present an obvious power density driven incentive for the agglomeration of economic activity.” (Cruz and Taylor 2012. P. 59)
21
Cruz and Taylor (2012, p. 7), for example, observe that “humans have always
turned to increasingly dense fuels.” By curbing our demand for such fuels,
precautionary measures may be weakening economic performance and reducing
environmental quality. Rather than encouraging prudent decision making in the
face of uncertainty, adherence to an even moderate interpretation of the
Precautionary Principle may be creating knowable and considerable costs for our
environment and economy.
22
References Ardani, Kristen and Robert Margolis (2011). 2010 Solar Technologies Market Report. Washington,
DC: U.S. Department of Energy. Banzhaf, Spencer (2008). Environmental justice: Opportunities through markets. PERC Policy
Series, No. 42. Brealey, Richard, Stewart Myers, and Franklin Allen (2010). Principles of Corporate Finance, 10th
Edition. McGraw-Hill/Irwin. Broder, John M. (2012). “Presidential Debate Fact-Check and Updates.” New York Times.
Accessed June 24, 2013, at http://elections.nytimes.com/2012/debates/presidential/2012-10-03#sha=82ee6d65d.
Combs, Susan (2010). 2010 Property Value Study: Discount Rate Range for Oil and Gas Properties.
Texas Comptroller of Public Accounts, Property Tax Assistance Division. Accessed May 3, 2013, at www.window.state.tx.us/taxinfo/proptax/drs10/.
Congressional Budget Office (2004). Estimating the value of subsidies for federal loans and loan
guarantees, August. Accessed June 14, 2013, at http://www.cbo.gov/sites/default/files/cbofiles/ftpdocs/57xx/doc5751/08-19-creditsubsidies.pdf.
Congressional Budget Office (2009). Cost Estimate: H.R. 2454 American Clean Energy and
Security Act of 2009, June 5. Accessed May 3, 2013, at http://www.cbo.gov/sites/default/files/cbofiles/ftpdocs/102xx/doc10262/hr2454.pdf.
Cruz, Juan Moreno and M. Scott Taylor (2012). “Back to the future of green powered economies.”
NBER Working Paper No. 18236, July. Drajem, Mark (2013). “Obama quietly raises ‘carbon price’ as costs to climate increase.”
Bloomberg. Accessed June 12, 2013, at www.bloomberg.com/news/print/2013-06-12/tougher-regulations-seen-from-obama-change-in-carbon-cost.html.
Executive Office of the President (1990). The economy and the environment. Economic Report of the
President, Chapter 6. Executive Office of the President (2013). The President’s Climate Action Plan, June 25. Falaschetti, Dino (2009). Democratic Governance and Economic Performance: How Accountability can
go too far in Politics, Law, and Business. New York: Springer. Foster, Kenneth R., Paolo Vecchia and Michael H. Repacholi (2000). “Science and the
Precautionary Principle.” Science, 288 (5468), 979-81. Glaeser, Edward (2011). Triumph of the City: How Our Greatest Invention Makes Us Richer, Smarter,
Greener, Healthier, and Happier. Penguin Press.
23
Gort, Michael, Jeremy Greenwood, and Peter Rupert (1999). “How much of economic growth is fueled by investment-specific technological progress?” Economic Commentary, March 1. Accessed July 6, 2013, at http://www.clevelandfed.org/research/commentary/1999/0301.pdf.
Grossman, Gene M. and Alan B. Krueger (1995). “Economic growth and the environment.”
Quarterly Journal of Economics 110(2), 353-77. Huggins, Laura and David Currie (2013). A good time to rethink how we protect wildlife. San Jose
Mercury News, p. A12. Hulse, Carl and David M. Herszenhorn (2010). “Democrats call off climate bill effort. New York
Times, July 22. Krugman, Paul (2009). “It’s easy being green.” New York Times, September 25. Laughlin, Robert B. (2011). Powering the Future: How we will (Eventually) Solve the Energy Crisis and
Fuel the Civilization of Tomorrow. Basic Books. Lesser, Jonathan A. (2013). “The high cost of low-value wind power: Subsidized wind generates
the least amount of power when it is most needed.” Regulation, Spring, 22-7. Lomborg, Bjorn (2001). “Take a deep breath…air quality is getting better.” The Guardian, August
14. Accessed July 10, 2013, at http://www.guardian.co.uk/environment/2001/aug/15/physicalsciences.globalwarming.
Mulligan, Casey B. (2012). The Redistribution Recession: How Labor Market Distortions Contracted the
Economy. Oxford University Press. Nordhaus, Ted and Michael Shellenberger (2013). “Going green? Then go nuclear.” Wall Street
Journal, May 23, A15. Oulton, Nicholas (2012). Hooray for GDP! GDP as a measure of wellbeing. VOX (Research-based
analysis and commentary from leading economists). Accessed July 14, 2013 at voxeu.org/article/defence-gdp-measure-wellbeing.
Pociask, Steve and Joseph P. Fuhr Jr. (2011). “Progress denied: A study on the potential economic
impact of permitting challenges facing proposed energy projects.” Report commissioned by the U.S. Chamber of Commerce in Conjunction with its Project No Project Initiative, March 10.
Ramey, Valerie A. (2011). “Identifying government spending shocks: It’s all in the timing.”
Quarterly Journal of Economics, 126(1), 1-50. Solow, Robert M. (1956). “A contribution to the theory of economic growth.” Quarterly Journal of
Economics, 70(1), 65-94.