hierarchical multi-species modeling of carnivore responses...
TRANSCRIPT
Hierarchical Multi-Species Modeling of CarnivoreResponses to Hunting, Habitat and Prey in a West AfricanProtected AreaA. Cole Burton1,2*, Moses K. Sam3, Cletus Balangtaa3, Justin S. Brashares1
1 Department of Environmental Science, Policy and Management, University of California, Berkeley, California, United States of America, 2 Alberta Biodiversity Monitoring
Institute, University of Alberta, Edmonton, Alberta, Canada, 3 Wildlife Division of the Forestry Commission of Ghana, Accra, Ghana
Abstract
Protected areas (PAs) are a cornerstone of global efforts to shield wildlife from anthropogenic impacts, yet theireffectiveness at protecting wide-ranging species prone to human conflict – notably mammalian carnivores – is increasinglyin question. An understanding of carnivore responses to human-induced and natural changes in and around PAs is criticalnot only to the conservation of threatened carnivore populations, but also to the effective protection of ecosystems inwhich they play key functional roles. However, an important challenge to assessing carnivore communities is the ofteninfrequent and imperfect nature of survey detections. We applied a novel hierarchical multi-species occupancy model thataccounted for detectability and spatial autocorrelation to data from 224 camera trap stations (sampled betweenOctober 2006 and January 2009) in order to test hypotheses about extrinsic influences on carnivore community dynamicsin a West African protected area (Mole National Park, Ghana). We developed spatially explicit indices of illegal huntingactivity, law enforcement patrol effort, prey biomass, and habitat productivity across the park, and used a Bayesian modelselection framework to identify predictors of site occurrence for individual species and the entire carnivore community.Contrary to our expectation, hunting pressure and edge proximity did not have consistent, negative effects on occurrenceacross the nine carnivore species detected. Occurrence patterns for most species were positively associated with small preybiomass, and several species had either positive or negative associations with riverine forest (but not with other habitatdescriptors). Influences of sampling design on carnivore detectability were also identified and addressed within ourmodeling framework (e.g., road and observer effects), and the multi-species approach facilitated inference on even therarest carnivore species in the park. Our study provides insight for the conservation of these regionally significant carnivorepopulations, and our approach is broadly applicable to the robust assessment of communities of rare and elusive speciessubject to environmental change.
Citation: Burton AC, Sam MK, Balangtaa C, Brashares JS (2012) Hierarchical Multi-Species Modeling of Carnivore Responses to Hunting, Habitat and Prey in a WestAfrican Protected Area. PLoS ONE 7(5): e38007. doi:10.1371/journal.pone.0038007
Editor: Matt Hayward, Australian Wildlife Conservancy, Australia
Received November 18, 2011; Accepted May 1, 2012; Published May 30, 2012
Copyright: � 2012 Burton et al. This is an open-access article distributed under the terms of the Creative Commons Attribution License, which permitsunrestricted use, distribution, and reproduction in any medium, provided the original author and source are credited.
Funding: Funding was received from the Panthera/Wildlife Conservation Society Kaplan Awards Program, Safari Club International, Hellman Family Fund, andCollege of Natural Resources of the University of California, Berkeley. ACB was supported by fellowships from the U.S. National Science Foundation and theNatural Sciences and Engineering Research Council of Canada. The funders had no role in study design, data collection and analysis, decision to publish, orpreparation of the manuscript.
Competing Interests: The authors have declared that no competing interests exist.
* E-mail: [email protected]
Introduction
Protected areas are a cornerstone of global conservation efforts
to shield wildlife from anthropogenic impacts such as excessive
hunting and habitat loss [1,2]. The number and extent of
protected areas (hereafter PAs or parks) have grown exponentially
over recent decades, yet their ecological effectiveness is increas-
ingly in question since many are small and isolated, lack adequate
capacity for law enforcement, and are beset by illegal hunting and
resource collection [3–6]. Moreover, rapid human population
growth around PAs and the attractiveness of a park’s otherwise
scarce resources may result in elevated impacts at PA edges and
cause increased isolation and edge effects [7,8]. Such detrimental
effects may be particularly severe for large, wide-ranging species
prone to conflict with humans, most notably mammalian
carnivores [9–11]. Effective PA networks are presumed to be
key to the long-term viability of many carnivore species [12,13], so
an understanding of carnivore responses to human-induced and
natural changes in and around PAs is critical not only to the
conservation of threatened carnivore populations, but also to the
protection of ecosystems in which they play important functional
roles [14,15].
Anthropogenic activities can impact carnivore populations
directly and indirectly. Direct persecution is often a major threat
to both large- and smaller-bodied carnivores as they may be
hunted as trophies [16], for traditional uses like bushmeat [17,18],
and in retaliation for real or perceived threats to livestock or
human life [19,20]. Furthermore, many carnivore species are wary
by nature and avoid areas of elevated human activity, such that
even non-lethal activities (e.g. pastoralism, tourism) can influence
their occurrence and viability [21,22]. Besides these direct
anthropogenic influences, hunting of prey populations can be an
important indirect human impact on carnivore viability, given that
the availability of suitable prey is a key determinant of carnivore
PLoS ONE | www.plosone.org 1 May 2012 | Volume 7 | Issue 5 | e38007
occurrence and abundance [23–25]. Finally, habitat destruction
can influence carnivores both directly and indirectly and is
predicted to affect some species more than others (e.g., [26]).
Effects of habitat change on carnivores may be mediated through
the response of their prey, or other factors such as associated
changes in disease dynamics [27].
Management efforts attempt to address the threats faced by
carnivores in and around PAs through more effective enforcement
of anti-poaching laws [28,29], creation of partially protected buffer
zones or corridors [11,30,31], restoration of habitat and prey (i.e.,
increasing predator carrying capacity; [25]), resolution of human-
carnivore conflict [32–35], and metapopulation management to
minimize loss of genetic diversity [31,36]. However, in practice,
these interventions are exceedingly difficult to implement for
political, economic and social reasons. Given limited resources, PA
managers must identify approaches that will provide the greatest
conservation return on their investment, but designing and
implementing these optimal strategies requires an understanding
of carnivore responses to specific stressors. Furthermore, manage-
ment actions targeted to address responses of entire carnivore
communities may be more ecologically- and cost-effective than
single-species approaches [37–41], which have typically focused
only on larger-bodied carnivores.
A significant challenge to assessing carnivore communities and
their responses to anthropogenic impact is the often infrequent
and imperfect nature of survey detections [42]. Accurate modeling
of species’ distributions and habitat suitability typically requires a
large number of observations and implicitly assumes that species
are absent from surveyed locations where they are not detected
[43]. However, the rare and elusive nature of many carnivore
species frequently translates into small sample sizes and low
detection probabilities, and hence biased population estimates
[44]. Fortunately, recent advances in survey and statistical
techniques can be applied to address this challenge. Camera
trapping has proven an effective technique for detecting cryptic
carnivores [45,46], particularly for mark-recapture estimation of
abundance for individually identifiable species [47,48]. The nature
of camera-trap surveys – with camera stations sampling contin-
uously over time at specific sites – is well-suited to an occupancy
modeling analytical framework that explicitly accounts for
imperfect detection [41,49]. The use of occupancy as a surrogate
for abundance has been widely adopted [50] and is appropriate for
widespread, low-density carnivore populations [51]. Furthermore,
recently developed hierarchical multi-species occupancy models
capitalize on the information content of multiple detection
histories to improve inference for rare species and generate insight
on aggregated responses of wildlife communities [52,53]. Hierar-
chical models also provide a flexible modeling framework capable
of addressing other important assumptions, including spatial
independence among sampling sites [54,55]. Models explicitly
accounting for spatial autocorrelation are increasingly being
applied to the estimation of animal occurrence patterns [56–58],
and have in many cases been shown to improve inference [59,60].
In this study, we developed a Bayesian hierarchical multi-species
occupancy model accounting for spatial autocorrelation to assess
patterns of carnivore occurrence in relation to key landscape
features in Mole National Park, Ghana (hereafter MNP). MNP is
among the largest protected areas in West Africa and, as with most
of this region, its carnivore populations are poorly studied yet
subjected to considerable pressure from the region’s high human
densities and widespread hunting for bushmeat [61,62]. Illegal
hunting is a central management concern in MNP, and previous
work indicates that the park’s carnivore community has been
heavily impacted, with evidence of human-caused mortality and
the decline and likely extirpation of several species [18].
Nevertheless, the direct and indirect effects of hunting on MNP’s
carnivore populations are unknown. We used law enforcement
patrol records to develop a spatially explicit index of hunting
pressure and test the hypothesis that hunting is a major
determinant of carnivore occurrence patterns in MNP. Using a
Bayesian model selection framework, we further tested the
importance of other anthropogenic and natural factors on
carnivore occurrence, including prey availability, habitat type,
and law enforcement protection. Our approach not only informs
the conservation of MNP’s regionally important carnivore
populations, but is also broadly applicable to the robust assessment
of rare and elusive species subject to environmental change.
Methods
Ethics statementWe thank the Wildlife Division of the Forestry Commission of
Ghana for their permission to conduct this work in Mole National
Park (Research project permit code 01/09/2006).
Study areaMNP is the largest of Ghana’s protected areas and covers
approximately 4600 km2 of woodland savanna habitat in the
country’s Northern Region (,09o119–10o06 N and 01o229–02o
169 W). Elevation ranges from 120–490 m and open savanna
woodland is the dominant habitat type, with tree cover averaging
about 30% and grasses reaching 2–3 m in height during the April-
to-October wet season [63]. Mean annual rainfall is approximately
1100 mm and most of the park’s rivers are seasonal, draining into
the White Volta River.
Camera trap surveyWe conducted a camera trap survey between October 2006 and
January 2009 to estimate carnivore occurrence patterns in MNP
(see also [18,64]). For this study, we used data from 224 camera
stations deployed along gradients of proximity to park boundary,
potential prey abundance, and availability of water and associated
riparian forest habitat (Fig. 1). Our survey design was constrained
by access limitations (particularly in northern portions of the park)
and the number of available cameras, but we covered represen-
tative gradients using systematic sampling within 31 camera arrays
targeting different portions of the park and different seasons
(mean = 7.2 stations per array). Within an array, stations were
spaced at about 1-km intervals near specific features expected to
maximize carnivore capture probability, such as dirt roads, wildlife
trails, waterholes, and salt licks (with a mix of stations on and off
roads – see below). Most stations consisted of a single passive infra-
red DeerCam DC-300 film camera trap unit (Non Typical, Park
Falls, WI, USA) set on a tree at a height of about 40 cm, facing
perpendicular to the expected direction of animal travel and
approximately 3 m from the anticipated site of capture. Sampling
effort at a station was calculated as the number of days for which a
camera was set (or until the last photo was taken if the roll was fully
exposed before collection) and total effort across the 224 stations
was 4,867 trap-days (mean = 21.7, SD = 13.0, range = 3–93).
Effort was concentrated in the central and southeastern portions
of the park (Fig. 1) and during dry season months when access was
greatest (,70% of trap-days between October and April).
Detection or non-detection of carnivore species was recorded at
each station for each trap day, yielding a response variable
representing an uncorrected or ‘‘naıve’’ estimate of carnivore
occurrence across the sampling sites [50].
Carnivore Responses to Hunting, Habitat and Prey
PLoS ONE | www.plosone.org 2 May 2012 | Volume 7 | Issue 5 | e38007
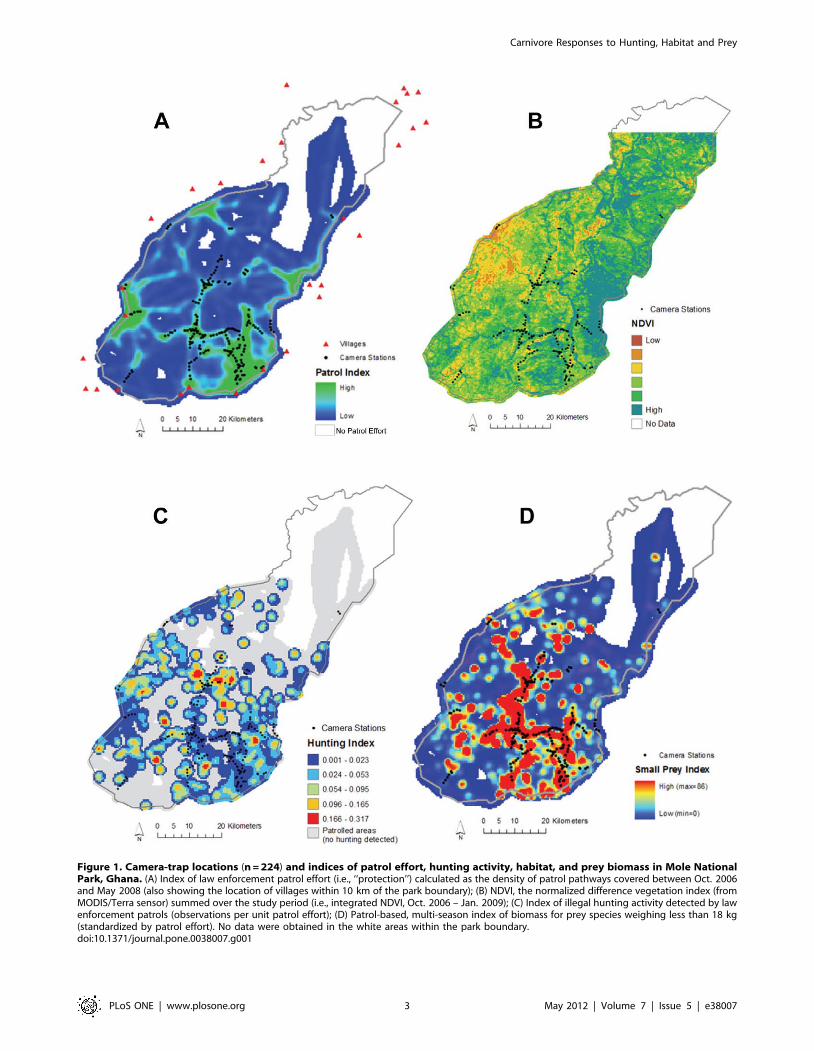
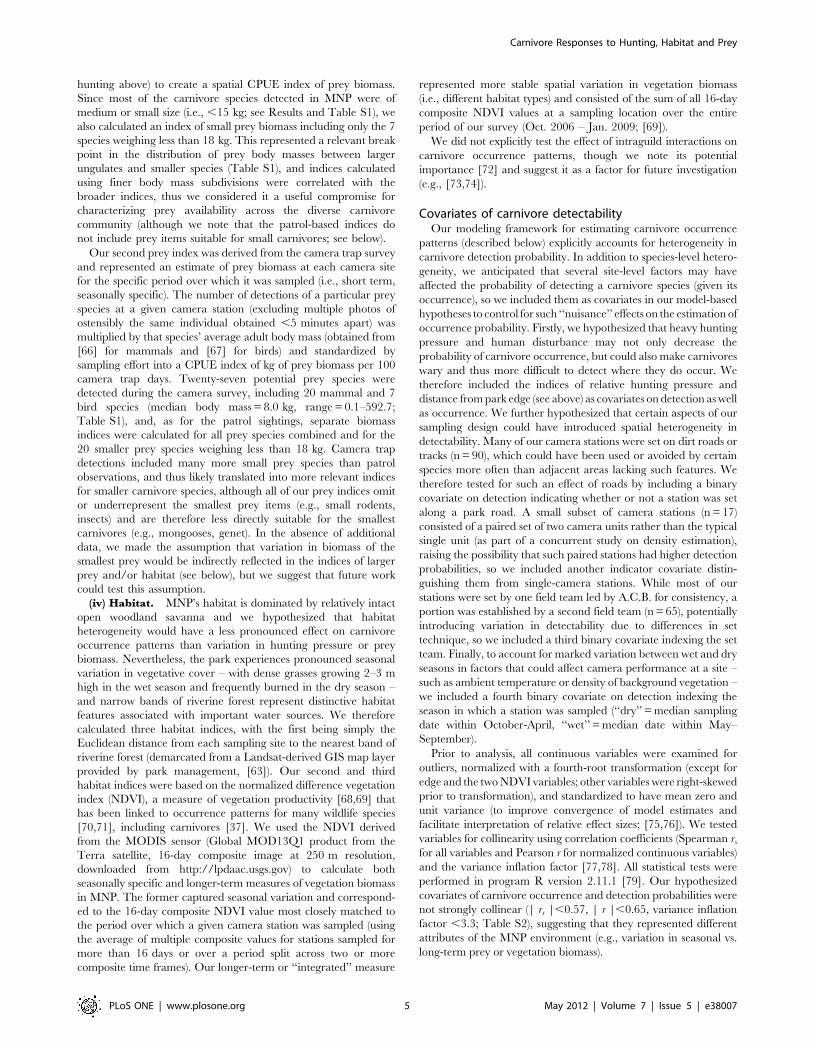
Figure 1. Camera-trap locations (n = 224) and indices of patrol effort, hunting activity, habitat, and prey biomass in Mole NationalPark, Ghana. (A) Index of law enforcement patrol effort (i.e., ‘‘protection’’) calculated as the density of patrol pathways covered between Oct. 2006and May 2008 (also showing the location of villages within 10 km of the park boundary); (B) NDVI, the normalized difference vegetation index (fromMODIS/Terra sensor) summed over the study period (i.e., integrated NDVI, Oct. 2006 – Jan. 2009); (C) Index of illegal hunting activity detected by lawenforcement patrols (observations per unit patrol effort); (D) Patrol-based, multi-season index of biomass for prey species weighing less than 18 kg(standardized by patrol effort). No data were obtained in the white areas within the park boundary.doi:10.1371/journal.pone.0038007.g001
Carnivore Responses to Hunting, Habitat and Prey
PLoS ONE | www.plosone.org 3 May 2012 | Volume 7 | Issue 5 | e38007
Hypothesized predictors of carnivore occurrenceWe hypothesized that spatial patterns of carnivore occurrence
in MNP would be influenced by variation in hunting pressure and
human disturbance, anti-poaching patrol effort, prey biomass and
habitat type (Table 1). To test our hypotheses, we created spatially
explicit indices representing each of these factors and extracted
values for each sampling location (i.e., camera station) from the
camera trap survey. Our intent was to examine general,
management-relevant indices of expected importance across the
carnivore community, given the lack of previous study and
detailed species-specific knowledge for MNP. Analyses were
conducted using ArcMap 9.3.1 (ESRI, CA, USA) and density
surfaces (described below) were created using a kernel density
estimator in the Spatial Analyst ArcMap extension (with a 2 km
search radius and output resolution of 5006500 m).
(i) Hunting pressure and human disturbance. Carnivore
species are often killed in Ghana and elsewhere as a perceived
threat to livestock and human life or for traditional purposes [18].
We therefore hypothesized that carnivores would be less likely to
occur in portions of MNP experiencing heavy hunting pressure.
We used spatially explicit observations of illegal hunting activity in
the park made during law enforcement patrols [65] to construct an
index of hunting pressure (there is no legal hunting within MNP).
Evidence of illegal hunting – ranging from direct sightings and
arrests to indirect signs such as hunting camps, traps or hunter
footprints – were recorded by teams of 3–6 staff during frequent
foot patrols across much of the park (Fig. 1; [64]), with specific
locations determined using handheld GPS units. We used data
from nearly 1,400 patrols conducted between October 2006 and
May 2008 and comprising 688 observations of illegal hunting to
create a density surface of hunting activity across the park. We
then divided this by a similar density surface describing patrol
effort (see below) to derive a spatial index of relative hunting
pressure across the park (equivalent to a catch-per-unit-effort or
CPUE index; cf. [65]). As an alternative measure of human
disturbance in MNP, we calculated the Euclidean distance from
each sampling location to the nearest boundary of the park. This
simple index represents potential edge effect and is often used as a
proxy for hunting pressure (and was highly correlated with
distance to the nearest village, Pearson r = 0.91; Fig. 1).
(ii) Law enforcement protection. Law enforcement (‘‘anti-
poaching’’) patrols are intended to deter illegal hunting activity
and thereby provide protection to park wildlife [29,65]. We
hypothesized that carnivores would be more likely to occur in
areas within MNP that were more effectively protected by a
greater level of patrol effort. We anticipated that this effect might
be distinct from that associated with the amount of hunting activity
detected per unit patrol effort (above), given that hunters could
have been avoiding more heavily patrolled areas and that patrol
routes were influenced by many factors (e.g., access, wildlife
abundance, management zones). Patrol teams recorded their
locations with handheld GPS units at regular intervals along patrol
routes, and we used pathways (i.e., joined locations) from the
,1,400 patrols to construct a density surface of patrol effort across
the park (Fig. 1).
(iii) Prey. The availability of suitable prey species is a key
determinant of the distribution and abundance of carnivore
populations (e.g., [23]). Prey availability may represent a natural
influence on carnivores but could also reflect an indirect
anthropogenic effect if prey are depleted by exploitation [25].
We used two data sources to create indices characterizing longer-
and shorter-term spatial patterns of prey biomass in MNP. First,
we used spatially referenced sightings of potential mammalian prey
species recorded during the October 2006–May 2008 law en-
forcement patrols to create a kernel density surface representing
the longer-term (i.e., multi-season) distribution of prey biomass.
This dataset included approximately 8,600 sightings of nearly
58,000 individuals of 14 ungulate or primate species (median body
mass = 30.5 kg, range = 3.7–592.7 kg; Table S1; see also [64]).
Prey counts were converted to biomass estimates by multiplying
the number of individuals of a particular species counted by the
body mass of that species, using values of estimated average adult
body mass from the PanTHERIA database [66]. The prey
biomass surface was then divided by the patrol effort surface (as for
Table 1. Factors hypothesized to influence patterns of carnivore occurrence in Mole National Park (MNP), with the correspondingindex used, predicted direction of effect (i.e., negative or positive influence on occurrence, or both), source of data, and range ofvalues across sampled sites.
Factor IndexPredictedeffect Source Range of valuesa
Hunting pressure Relative frequency of poachingobservations
2 MNP patrol system 020.20 obs./unit patrol effort
Human disturbance Distance from park edge 2 MNP GIS data layer 0–22.4 km
Patrol protection Relative anti-poaching patrol effort + MNP patrol system 1.3–245.5 units of patrol effort
Prey biomassb Relative biomass of potential prey + MNP patrol system (multi-season) andcamera trap detections (seasonal).
0–1722.1 kg/ unit patrol effort;0–781.4 kg/trap-day
Small prey biomassb Relative biomass of smaller prey(, 18kg)
+ MNP patrol system (multi-season) andcamera trap detections (seasonal)
0–41.0 kg/unit patrol effort;0–69.0 kg/trap-day
Riverine forest Distance from nearest corridorof riverine forest
+/2 GIS data layer derived from Landsatimage (GWD 2005)
0.01–7.2 km
Vegetation productivity NDVIc +/2 MODIS/Terra (MOD13Q1, 250m,lpdaac.usgs.gov)
1882–7720 (seasonal)d 230,608–322,297 (integrated)d
aRange of values for sampled camera stations. Data were normalized and standardized prior to analysis.bPrey species are listed in Table S1. Species average adult body masses were taken from Jones et al. (2009). Total prey biomass was expected to have a greater influenceon larger carnivores given the relative dominance of larger prey species. See Methods for details on the calculation of different indices from patrol and camera-trap data.cNDVI = Normalized Difference Vegetation Index.dSee Methods for details on the seasonal and integrated measures of NDVI.doi:10.1371/journal.pone.0038007.t001
Carnivore Responses to Hunting, Habitat and Prey
PLoS ONE | www.plosone.org 4 May 2012 | Volume 7 | Issue 5 | e38007
hunting above) to create a spatial CPUE index of prey biomass.
Since most of the carnivore species detected in MNP were of
medium or small size (i.e., ,15 kg; see Results and Table S1), we
also calculated an index of small prey biomass including only the 7
species weighing less than 18 kg. This represented a relevant break
point in the distribution of prey body masses between larger
ungulates and smaller species (Table S1), and indices calculated
using finer body mass subdivisions were correlated with the
broader indices, thus we considered it a useful compromise for
characterizing prey availability across the diverse carnivore
community (although we note that the patrol-based indices do
not include prey items suitable for small carnivores; see below).
Our second prey index was derived from the camera trap survey
and represented an estimate of prey biomass at each camera site
for the specific period over which it was sampled (i.e., short term,
seasonally specific). The number of detections of a particular prey
species at a given camera station (excluding multiple photos of
ostensibly the same individual obtained ,5 minutes apart) was
multiplied by that species’ average adult body mass (obtained from
[66] for mammals and [67] for birds) and standardized by
sampling effort into a CPUE index of kg of prey biomass per 100
camera trap days. Twenty-seven potential prey species were
detected during the camera survey, including 20 mammal and 7
bird species (median body mass = 8.0 kg, range = 0.1–592.7;
Table S1), and, as for the patrol sightings, separate biomass
indices were calculated for all prey species combined and for the
20 smaller prey species weighing less than 18 kg. Camera trap
detections included many more small prey species than patrol
observations, and thus likely translated into more relevant indices
for smaller carnivore species, although all of our prey indices omit
or underrepresent the smallest prey items (e.g., small rodents,
insects) and are therefore less directly suitable for the smallest
carnivores (e.g., mongooses, genet). In the absence of additional
data, we made the assumption that variation in biomass of the
smallest prey would be indirectly reflected in the indices of larger
prey and/or habitat (see below), but we suggest that future work
could test this assumption.
(iv) Habitat. MNP’s habitat is dominated by relatively intact
open woodland savanna and we hypothesized that habitat
heterogeneity would have a less pronounced effect on carnivore
occurrence patterns than variation in hunting pressure or prey
biomass. Nevertheless, the park experiences pronounced seasonal
variation in vegetative cover – with dense grasses growing 2–3 m
high in the wet season and frequently burned in the dry season –
and narrow bands of riverine forest represent distinctive habitat
features associated with important water sources. We therefore
calculated three habitat indices, with the first being simply the
Euclidean distance from each sampling site to the nearest band of
riverine forest (demarcated from a Landsat-derived GIS map layer
provided by park management, [63]). Our second and third
habitat indices were based on the normalized difference vegetation
index (NDVI), a measure of vegetation productivity [68,69] that
has been linked to occurrence patterns for many wildlife species
[70,71], including carnivores [37]. We used the NDVI derived
from the MODIS sensor (Global MOD13Q1 product from the
Terra satellite, 16-day composite image at 250 m resolution,
downloaded from http://lpdaac.usgs.gov) to calculate both
seasonally specific and longer-term measures of vegetation biomass
in MNP. The former captured seasonal variation and correspond-
ed to the 16-day composite NDVI value most closely matched to
the period over which a given camera station was sampled (using
the average of multiple composite values for stations sampled for
more than 16 days or over a period split across two or more
composite time frames). Our longer-term or ‘‘integrated’’ measure
represented more stable spatial variation in vegetation biomass
(i.e., different habitat types) and consisted of the sum of all 16-day
composite NDVI values at a sampling location over the entire
period of our survey (Oct. 2006 – Jan. 2009; [69]).
We did not explicitly test the effect of intraguild interactions on
carnivore occurrence patterns, though we note its potential
importance [72] and suggest it as a factor for future investigation
(e.g., [73,74]).
Covariates of carnivore detectabilityOur modeling framework for estimating carnivore occurrence
patterns (described below) explicitly accounts for heterogeneity in
carnivore detection probability. In addition to species-level hetero-
geneity, we anticipated that several site-level factors may have
affected the probability of detecting a carnivore species (given its
occurrence), so we included them as covariates in our model-based
hypotheses to control for such ‘‘nuisance’’ effects on the estimation of
occurrence probability. Firstly, we hypothesized that heavy hunting
pressure and human disturbance may not only decrease the
probability of carnivore occurrence, but could also make carnivores
wary and thus more difficult to detect where they do occur. We
therefore included the indices of relative hunting pressure and
distance from park edge (see above) as covariates on detection as well
as occurrence. We further hypothesized that certain aspects of our
sampling design could have introduced spatial heterogeneity in
detectability. Many of our camera stations were set on dirt roads or
tracks (n = 90), which could have been used or avoided by certain
species more often than adjacent areas lacking such features. We
therefore tested for such an effect of roads by including a binary
covariate on detection indicating whether or not a station was set
along a park road. A small subset of camera stations (n = 17)
consisted of a paired set of two camera units rather than the typical
single unit (as part of a concurrent study on density estimation),
raising the possibility that such paired stations had higher detection
probabilities, so we included another indicator covariate distin-
guishing them from single-camera stations. While most of our
stations were set by one field team led by A.C.B. for consistency, a
portion was established by a second field team (n = 65), potentially
introducing variation in detectability due to differences in set
technique, so we included a third binary covariate indexing the set
team. Finally, to account for marked variation between wet and dry
seasons in factors that could affect camera performance at a site –
such as ambient temperature or density of background vegetation –
we included a fourth binary covariate on detection indexing the
season in which a station was sampled (‘‘dry’’ = median sampling
date within October-April, ‘‘wet’’ = median date within May–
September).
Prior to analysis, all continuous variables were examined for
outliers, normalized with a fourth-root transformation (except for
edge and the two NDVI variables; other variables were right-skewed
prior to transformation), and standardized to have mean zero and
unit variance (to improve convergence of model estimates and
facilitate interpretation of relative effect sizes; [75,76]). We tested
variables for collinearity using correlation coefficients (Spearman rs
for all variables and Pearson r for normalized continuous variables)
and the variance inflation factor [77,78]. All statistical tests were
performed in program R version 2.11.1 [79]. Our hypothesized
covariates of carnivore occurrence and detection probabilities were
not strongly collinear (| rs |,0.57, | r |,0.65, variance inflation
factor ,3.3; Table S2), suggesting that they represented different
attributes of the MNP environment (e.g., variation in seasonal vs.
long-term prey or vegetation biomass).
Carnivore Responses to Hunting, Habitat and Prey
PLoS ONE | www.plosone.org 5 May 2012 | Volume 7 | Issue 5 | e38007

Background on modeling frameworkWe applied a multi-species occupancy modeling framework [54]
to carnivore detection data from our camera trap survey. This
framework represents a hierarchical formulation and extension of
the single-species occupancy modeling approach described by
MacKenzie et al. [80], and is essentially a robust adaptation of the
logistic regression model frequently applied to species ‘‘presence-
absence’’ data [43,50]. A key advantage of the occupancy
modeling approach is the explicit estimation of detection
probability, providing a means to overcome the problematic
assumption of perfect detection (i.e., species always being detected
where they occur). The general framework requires repeated
sampling of a site over a period considered closed to changes in
occupancy status, and uses this temporal replication to estimate
the probability that a species not detected at a site could have in
fact been present (i.e., false absence). We treated consecutive trap
days as repeat surveys at a given camera station and considered
the occurrence of a species at a station equivalent to its use of the
habitat at that site during the sampling period (assuming random
species movement relative to a site rather than considering sites to
be permanently ‘‘occupied’’, and accordingly that detection
probability includes availability for detection; [50]: 105). We also
treated our entire survey period as one ‘‘season’’ in that most sites
were not re-sampled across seasons, the carnivore community was
assumed to be closed (i.e., no species extinctions or colonizations),
and we did not wish to estimate site-specific probabilities of
extinction or colonization over time (cf. [81]).
The multi-species model extends the single-species approach by
capitalizing on additional information contained in multiple
species’ detection histories across a sampled community, simulta-
neously estimating occurrence and detection probabilities for all
species. It assumes that an individual species’ response comes from
a common community-level distribution of responses. Species-
specific parameters are thus treated as random effects governed by
an associated community-level ‘‘hyper-parameter’’ (i.e., the
hierarchical component). In this way, collective data on the entire
carnivore community can improve species-specific estimates of
occurrence, even for those species rarely observed and for which a
single-species approach would likely yield unreliable results [52].
This approach also facilitates robust inference on the aggregate
response of an entire community [40,53].
Model structureOur model assumes that site-specific occurrence for species
i = 1,2, …,N at site j = 1,2,…,J, is an imperfectly observed (latent)
random variable, z(i,j), which is the outcome of a Bernouilli trial, z(i,j)
, Bern(yij), where yij is the probability that species i occurs at site j,
and z(i,j) = 1 if it does occur and zero if it does not. Our observation
data, y(i,j), representing the detection or non-detection of species i at
site j during the camera trap survey, are conditional upon the true
occurrence state, z(i,j), and are also assumed to be Bernouilli random
variables if species i is present (that is if z(i,j) = 1) and are fixed zeros if
species i is absent (i.e., if z(i,j) = 0, then y(i,j) = 0 with probability 1).
This observation model is specified as y(i,j) , Bern(pij ?z(i,j)) for kj
independent trials, where pij is the probability of detecting species i at
site j if it is present, and kj is the number of trap days for which the
camera station at site j was active. We assumed that all species
present in the MNP carnivore community were detected at least
once during the survey, and we therefore did not estimate the
probability of there being additional species that went completely
undetected. Previous work suggests a low probability of additional
carnivore species occurring in the park [18], and we focused our
attention on confirmed species toward which management attention
could be directed (cf. [40,53]).
As noted above, we hypothesized that occurrence and detection
probabilities would vary by species and be affected by anthropo-
genic and natural features of the park (as well as effects of sampling
on detection). We incorporated these effects into the model
linearly using the logit link function, with the general form of
logit(yij) = wi+aj and logit(pij) = gi+bj, where wi and gi are species-
level effects and aj and bj are site-level effects on occurrence and
detection, respectively [52,53,82]. We also modeled a correlation
(r) between occurrence and detection based on the assumption
that both are affected by species abundance, such that more
abundant species would likely be both easier to detect and more
prevalent across the landscape, and vice versa [52,54]. We further
hypothesized that, despite our attempt to achieve independence
among sampled sites (through separation in space or time), the
occurrence of a species at a site might be affected by the
occurrence of that species at neighboring sites, independently of
modeled covariates (i.e., due to unmeasured environmental
features or intrinsic processes such as animal movement behavior;
[56,59]). Preliminary analysis of our camera trap detections also
indicated the potential for some spatial autocorrelation in site
occurrences (Appendix S1). Such spatial autocorrelation could
potentially bias inference, yet common tests of autocorrelation
(e.g., spatial correlograms of model residuals) are difficult to apply
given that our response variable of interest – species occurrence at
a site – was only partially observed. We therefore extended our
model to accommodate the possibility of spatial autocorrelation
among sampling sites using an adaptation of the auto-logistic
model described by Royle and Dorazio ([54]: 314–321; cf.
[56,83]). We defined a spatial neighborhood around each
sampling site as a 5-km radius circle (i.e., an area of approximately
79 km2, assumed to encompass short-term movements of individ-
ual animals) and specified an auto-covariate, autocovj, such that
the occurrence of species i at site j could be influenced by species i’s
occurrence at all g sites within the neighborhood, with the
magnitude of influence inversely proportional to the distance
between the focal station and particular neighboring station
(further details in Appendix S1).
The most general model of occurrence for species i at site j was
therefore specified as:
logit(yij)~Qiza1ipatroljza2ihuntingjza3iNDVI1jz
a4iNDVI2jza5iedgejza6iriverjza7iprey1jz
a8ismallprey1jza9iprey2jza10ismallprey2jzdiautocovj
where Qi is a species-level effect, the coefficients a1i, a2i,…, a10i
represent effects of the associated covariates (Table 1) on species i,
and di is the effect of the autocovariate on species i. Similarly, the full
detection model was specified as:
logit(pij)~gizb1iroadjzb2ipairedjzb3iteamjz
b4ihuntingjzb5iedgejzb6iseasonj
where gi represents the species-level effect on detection and b1i,…,
b6i are effects of the respective covariates on detection (details
above).
Occurrence and detection processes were linked across species
through the additional hierarchical model component in which
species-level parameters were treated as random effects governed
by community-level hyper-parameters. Specifically, we assumed
that for a given effect (e.g., influence of patrol effort on
occurrence), species-level parameters were drawn from a normal
Carnivore Responses to Hunting, Habitat and Prey
PLoS ONE | www.plosone.org 6 May 2012 | Volume 7 | Issue 5 | e38007

distribution described by the community mean (m) and standard
deviation (s) hyper-parameters (e.g., a1i , N(ma1, sa1)). We only
considered additive, linear effects of covariates on occurrence and
detection since we did not have strong a priori reasons for expecting
non-linear or interactive effects and felt the additional model
complexity was unwarranted given the available sample of
observation data.
Model selectionWe considered all possible combinations of covariates to be
candidate models representing competing hypotheses about
significant influences on the MNP carnivore community (or its
assessment in the case of detectability). Our a priori full model
included 10 site-level covariates and an autocovariate for
occurrence probability and 6 covariates for detection probability
(yielding a candidate set with a daunting 217 possible models).
Given that several covariates represented similar features (e.g., 4
different prey indices), we anticipated that this model was likely
overparameterized and therefore implemented a Bayesian ap-
proach to model simplification [84]. Information-theoretic ap-
proaches are commonly used to distinguish among competing
models; for instance, the Akaike Information Criterion (AIC; [85])
or analogous Bayesian Deviance Information Criterion (DIC;
[86]) balance model fit and complexity by ranking models using
deviance and a penalty term weighted by the number of
parameters. However, these criteria are not easily or reliably
calculated for complex hierarchical models with latent variables,
such as our multi-species occupancy model [87,88]. For this
reason, we used an alternative approach to model evaluation. We
assessed the strength of evidence for covariate effects at the
community-level (i.e., across all species) by estimating posterior
model probabilities for the candidate set with a mixture modeling
approach in which each covariate is multiplied by an ‘‘inclusion
parameter’’ ([54]: 72–73, [84]: section 3.2, [89,90]). The inclusion
parameters (wc, for all C covariates in the model) were latent binary
(Bernoulli) variables with uninformative prior probabilities of 0.5
(i.e., equal probability of a given covariate being included or not in
the model). Their posterior probabilities corresponded to the
estimated probability that a particular covariate was included in
the ‘‘best’’ model; that is, the degree of support for an effect of that
covariate across all carnivore species in the community. The
posterior probability of a given candidate model (i.e., combination
of covariate effects) was thus calculated as the probability that
wc = 1 for all coefficients included in that model and wc = 0 for all
coefficients not included. In other words, each of the 217 candidate
models had a corresponding unique vector of inclusion parameter
values, and posterior probabilities for each of these vectors were
calculated from their relative frequency in the posterior sample.
For occurrence and detection parameters (i.e., Qi, gi), posterior
probabilities from the mixture model represented model-averaged
estimates (i.e., averaged across the different models included in the
posterior sample). Model-averaged estimates could also be
obtained for covariate coefficients by averaging across posterior
samples where the corresponding wc = 1 ([54]: 72–73).
Anticipating that different species may not show consistent
responses, we also assessed the importance of covariates on
individual species occurrence and detection probabilities by
inspecting posterior distributions for all parameters from the full
model (i.e., with no inclusion parameters, since these were only
applied at the community-level). Species-level parameters (i.e.,
coefficients a1i, a2i, etc.) with posterior masses concentrated away
from zero were considered indicative of an effect of the
corresponding covariate on that particular species (e.g., zero not
contained within credible intervals at 95%, or less conservatively,
80% probability thresholds).
We implemented all models in program WinBUGS version
1.4.3 [91], using the package R2WinBUGS [92] to interface with
program R. Inference was made from 3,000 samples of the
posterior distribution obtained from 3 chains of 50,000 Markov
Chain Monte Carlo (MCMC) iterations after a burn-in of 50,000
and with a thin rate of 50. We used vague priors and random
initial values, although achieving acceptable convergence in the
MCMC chains required less diffuse prior specifications and other
minor adjustments (sample code in Appendix S2; see also [54,82]).
Convergence was assessed by visual assessment of MCMC chains
and using the Gelman-Rubin statistic (‘‘Rhat’’ in R2WinBUGS,
with values ,1.1 indicating convergence; [76,93]).
Results
We detected nine carnivore species during the camera trap
survey of 224 sites in MNP (Table 2). Spotted hyena (Crocuta
crocuta) was detected at the greatest proportion of sampling sites (a
‘‘naıve’’ measure of occurrence without accounting for detectabil-
ity; [50]), followed by leopard (Panthera pardus) and white-tailed
mongoose (Ichneumia albicauda), whereas Gambian mongoose
(Mungos gambianus) and side-striped jackal (Canis adustus) were
detected at the fewest sites (Table 2). Model-estimated occurrence
probabilities accounting for imperfect detection were higher than
uncorrected estimates, but did not change the order of relative
abundance across species. Species’ occurrence and detection
probabilities were significantly positively correlated (posterior
mean of covariance parameter r= 0.47), suggesting both were
related to underlying patterns of species abundance. The model-
averaged community-level (i.e., across species) probabilities of site
occurrence and per-survey detection were estimated to be 0.22
(posterior SD 0.09) and 0.12 (SD 0.04), respectively (based on the
corresponding hyper-parameter posterior probabilities from the
mixture model).
Community-level covariate effectsParameter estimates from our fully parameterized multi-species
model were generally imprecise, with most posterior probabilities
being widely distributed around their respective means and 95%
CIs broadly overlapping 0 (Table 3, Appendix S3), implying that
there was not a consistent response across the carnivore
community to most site covariates. Posterior distributions for
community-level hyper-parameters from the full model indicated
the most consistent covariate effect on carnivore occurrence was a
positive association with short-term or seasonal small prey
biomass. There was also evidence of a consistent ‘‘observer effect’’
on detection probability (i.e., the ‘‘team’’ covariate), with higher
mean community-level detectability associated with camera
stations set by the primary sampling team (Table 3, Appendix S3).
Posterior probabilities for inclusion parameters on site covari-
ates from the mixture model confirmed that small prey biomass
was an important occurrence covariate for the MNP carnivore
community (having an estimated probability of inclusion in the
best model equal to 1; Table 3). They also highlighted the
important community-level effect of proximity to riverine forest
(mean posterior probability of inclusion, Pr = 1.0; Table 3), which
was not apparent from the diffuse posterior of the full model due to
the varied direction of species responses (Table 2; Fig. 2). There
was some support for a community-wide edge effect on occurrence
(Pr = 0.73, posterior SD = 0.44; Table 3), and weak evidence for a
potential effect of patrol intensity (Pr = 0.22, SD = 0.41). Contrary
to our primary hypothesis, there was little evidence of a consistent
Carnivore Responses to Hunting, Habitat and Prey
PLoS ONE | www.plosone.org 7 May 2012 | Volume 7 | Issue 5 | e38007
effect of hunting activity on carnivore occurrence, nor was there
any indication of significant community-level effects of vegetation
biomass (as measured by NDVI), total prey biomass, or spatial
autocorrelation (Pr ,0.03; Table 3).
With regard to carnivore detectability, the importance of the
‘‘team’’ covariate was strongly supported at the community-level
by the posterior inclusion probability from the mixture model
(Pr = 0.98, SD = 0.15; Table 3). A significant influence of roads
was also indicated (Pr = 0.91, SD = 0.29), and there was limited
support for an edge effect on detection probability (Pr = 0.48,
SD = 0.50). Accordingly, combinations of these occurrence and
detection covariates comprised the candidate models with the
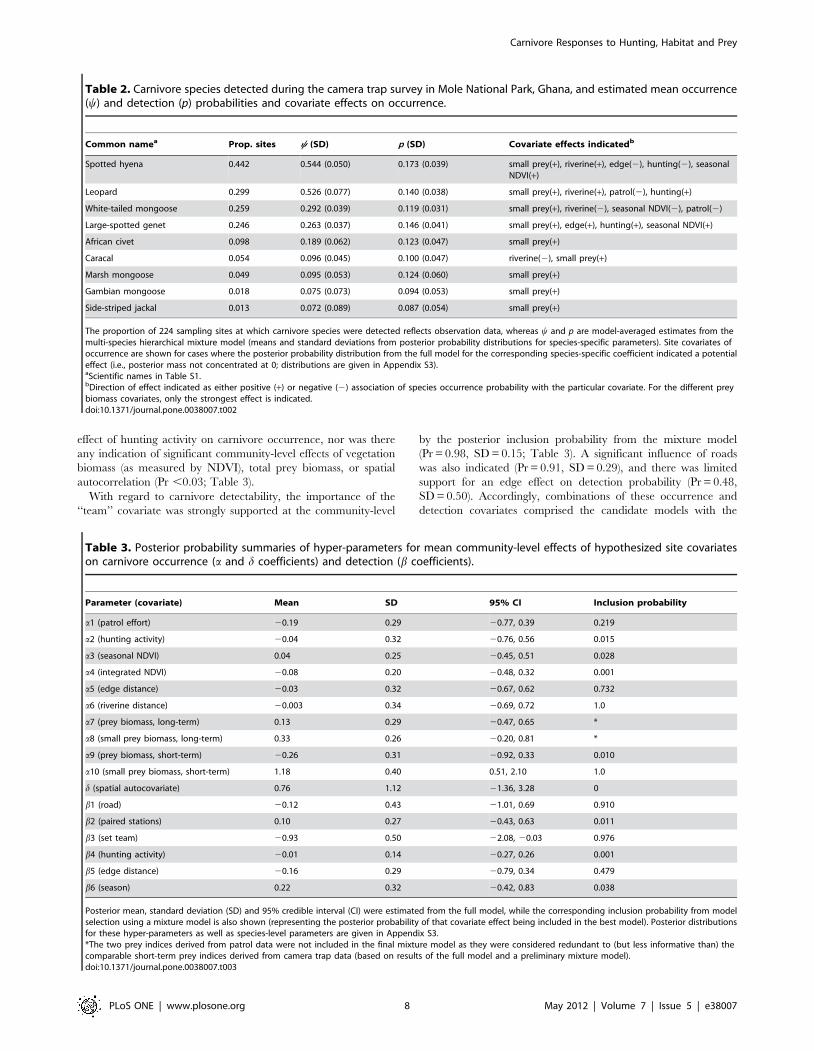
Table 2. Carnivore species detected during the camera trap survey in Mole National Park, Ghana, and estimated mean occurrence(y) and detection (p) probabilities and covariate effects on occurrence.
Common namea Prop. sites y (SD) p (SD) Covariate effects indicatedb
Spotted hyena 0.442 0.544 (0.050) 0.173 (0.039) small prey(+), riverine(+), edge(2), hunting(2), seasonalNDVI(+)
Leopard 0.299 0.526 (0.077) 0.140 (0.038) small prey(+), riverine(+), patrol(2), hunting(+)
White-tailed mongoose 0.259 0.292 (0.039) 0.119 (0.031) small prey(+), riverine(2), seasonal NDVI(2), patrol(2)
Large-spotted genet 0.246 0.263 (0.037) 0.146 (0.041) small prey(+), edge(+), hunting(+), seasonal NDVI(+)
African civet 0.098 0.189 (0.062) 0.123 (0.047) small prey(+)
Caracal 0.054 0.096 (0.045) 0.100 (0.047) riverine(2), small prey(+)
Marsh mongoose 0.049 0.095 (0.053) 0.124 (0.060) small prey(+)
Gambian mongoose 0.018 0.075 (0.073) 0.094 (0.053) small prey(+)
Side-striped jackal 0.013 0.072 (0.089) 0.087 (0.054) small prey(+)
The proportion of 224 sampling sites at which carnivore species were detected reflects observation data, whereas y and p are model-averaged estimates from themulti-species hierarchical mixture model (means and standard deviations from posterior probability distributions for species-specific parameters). Site covariates ofoccurrence are shown for cases where the posterior probability distribution from the full model for the corresponding species-specific coefficient indicated a potentialeffect (i.e., posterior mass not concentrated at 0; distributions are given in Appendix S3).aScientific names in Table S1.bDirection of effect indicated as either positive (+) or negative (2) association of species occurrence probability with the particular covariate. For the different preybiomass covariates, only the strongest effect is indicated.doi:10.1371/journal.pone.0038007.t002
Table 3. Posterior probability summaries of hyper-parameters for mean community-level effects of hypothesized site covariateson carnivore occurrence (a and d coefficients) and detection (b coefficients).
Parameter (covariate) Mean SD 95% CI Inclusion probability
a1 (patrol effort) 20.19 0.29 20.77, 0.39 0.219
a2 (hunting activity) 20.04 0.32 20.76, 0.56 0.015
a3 (seasonal NDVI) 0.04 0.25 20.45, 0.51 0.028
a4 (integrated NDVI) 20.08 0.20 20.48, 0.32 0.001
a5 (edge distance) 20.03 0.32 20.67, 0.62 0.732
a6 (riverine distance) 20.003 0.34 20.69, 0.72 1.0
a7 (prey biomass, long-term) 0.13 0.29 20.47, 0.65 *
a8 (small prey biomass, long-term) 0.33 0.26 20.20, 0.81 *
a9 (prey biomass, short-term) 20.26 0.31 20.92, 0.33 0.010
a10 (small prey biomass, short-term) 1.18 0.40 0.51, 2.10 1.0
d (spatial autocovariate) 0.76 1.12 21.36, 3.28 0
b1 (road) 20.12 0.43 21.01, 0.69 0.910
b2 (paired stations) 0.10 0.27 20.43, 0.63 0.011
b3 (set team) 20.93 0.50 22.08, 20.03 0.976
b4 (hunting activity) 20.01 0.14 20.27, 0.26 0.001
b5 (edge distance) 20.16 0.29 20.79, 0.34 0.479
b6 (season) 0.22 0.32 20.42, 0.83 0.038
Posterior mean, standard deviation (SD) and 95% credible interval (CI) were estimated from the full model, while the corresponding inclusion probability from modelselection using a mixture model is also shown (representing the posterior probability of that covariate effect being included in the best model). Posterior distributionsfor these hyper-parameters as well as species-level parameters are given in Appendix S3.*The two prey indices derived from patrol data were not included in the final mixture model as they were considered redundant to (but less informative than) thecomparable short-term prey indices derived from camera trap data (based on results of the full model and a preliminary mixture model).doi:10.1371/journal.pone.0038007.t003
Carnivore Responses to Hunting, Habitat and Prey
PLoS ONE | www.plosone.org 8 May 2012 | Volume 7 | Issue 5 | e38007

highest posterior model probabilities (Table 4). A total of 64
candidate models appeared in the posterior sample, but the four
highest-ranked models had 70% of the support, and 90% of the
posterior model probability was captured by 11 candidate models
(Table 4). The top-ranked model contained additive effects of
edge, riverine forest and small prey biomass on occurrence, and of
road and team on detection (Pr = 0.335; Table 4). Predicted
occurrence probabilities from the best model indicated significant
heterogeneity among species in the direction and magnitude of
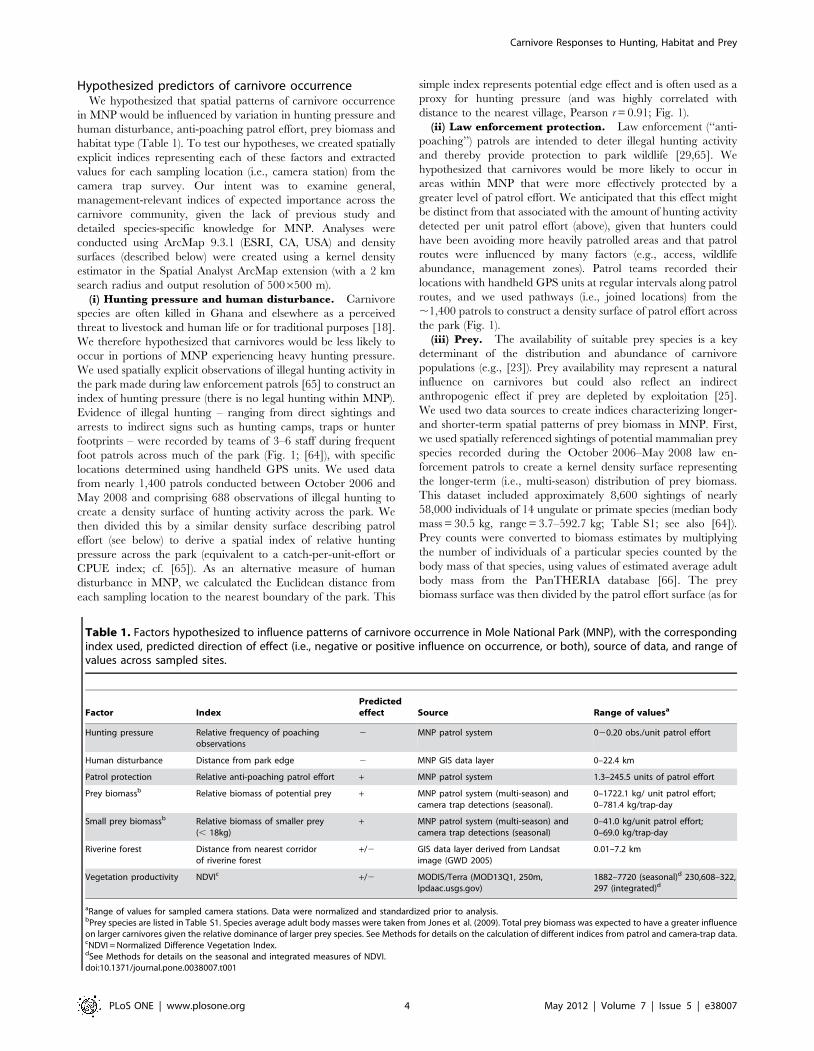
their responses to site covariates (Fig. 2).
Species-level effectsWe examined posterior probability distributions for all species-
level parameters in the full model to identify potential species-
specific effects that might be obscured at the community level.
Posterior means for the effect of seasonal small prey biomass were
positive for all 9 carnivore species, and 95% CIs overlapped 0 for
only spotted hyena and caracal (Caracal caracal; Table 2, Appen-
dix S3). There was weak species-level support for an effect of riverine
forest habitat, both in terms of attraction (higher occurrence
probabilities nearer to riverine forest for spotted hyena and leopard)
and avoidance (lower occurrence probability near riverine forest for
caracal; Fig. 2). The model indicated little evidence of an edge effect
on occurrence probability for most species, although spotted hyena
occurrence probability was marginally higher further away from the
park edge, and the opposite was true for large-spotted genet (Genetta
pardina; Fig. 2). Consistent with community-level estimates, there
was little evidence for significant species-level effects of patrol effort,
poaching activity, or vegetation biomass on carnivore occurrence,
although some potential weak effects were indicated (Table 2,
Appendix S3). In contrast, a signal of spatial autocorrelation in site
occurrence probabilities was indicated for several species (i.e.,
positive posterior estimates of the autocovariate coefficient;
Appendix S3).
In agreement with indications at the community-level, sam-
pling-related heterogeneity in detection probabilities was evident
at the species level. Posterior probabilities suggested most
carnivore species had higher detectabilities at stations set by the
primary sampling team (given occurrence), and that leopard and
white-tailed mongoose were more likely to be detected at camera
stations set on roads, whereas marsh mongoose was less likely to be
detected on roads. Hunting activity and seasonality did not appear
to affect species’ detectabilities, but there was evidence of an edge
effect, with posterior distributions for large-spotted genet, marsh
mongoose (Atilax paludinosus) and spotted hyena suggesting lower
detectability near the park edge, while those for leopard, Gambian
mongoose and caracal indicated higher edge detectability.
Figure 2. Model-predicted carnivore responses to the three site covariates included in the best occurrence model. Predicted marginalprobabilities of carnivore occurrence relative to variation in the index of small prey biomass, distance from riverine forest, and distance from parkedge (all values standardized). Species are: African civet (solid black), caracal (dashed red), Gambian mongoose (dotted green), large-spotted genet(dot-dash blue), leopard (dashed light blue), marsh mongoose (dot-dash purple), side-striped jackal (solid yellow), spotted hyena (dashed grey),white-tailed mongoose (dotted black; scientific names and details of model selection are given in the text).doi:10.1371/journal.pone.0038007.g002
Table 4. Posterior model probabilities for the top 11 modelsthat had 90% of the posterior support across all candidatemodels for community-level effects on carnivore occurrence(y) and detection (p), as estimated from the mixture modelingapproach to model selection (53 additional models appearedin the posterior sample but all with probabilities ,0.01).
ModelPosteriorprobability
y(edge + river + small prey) p(road + team) 0.335
y(river + small prey) p(road + team + edge) 0.139
y(edge + river + small prey) p(road + team + edge) 0.124
y(patrol + edge + river + small prey) p(road + team + edge) 0.103
y(patrol + edge + river + small prey) p(road + team) 0.043
y(river + small prey) p(road + team) 0.040
y(edge + river + small prey) p(team) 0.032
y(patrol + river + small prey) p(road + team + edge) 0.030
y(river + small prey) p(road + edge + season) 0.022
y(patrol + edge + river + small prey) p(team) 0.018
y(edge + river + small prey) p(team + edge) 0.016
doi:10.1371/journal.pone.0038007.t004
Carnivore Responses to Hunting, Habitat and Prey
PLoS ONE | www.plosone.org 9 May 2012 | Volume 7 | Issue 5 | e38007
Discussion
Factors influencing carnivore occurrenceOur results provide insight into the relative influence of
anthropogenic and natural landscape features on the dynamics of
a poorly studied carnivore community. The hierarchical multi-
species modeling approach identified patterns across the entire
community while also highlighting species-specific variation. Our
models indicated that availability of suitable prey had the most
consistent effect on the MNP carnivore community, with carnivore
species’ occurrence probabilities positively linked to the relative
biomass of smaller prey species (particularly at a seasonal scale).
While variation in vegetation biomass (as measured by NDVI) did
not appear to significantly influence carnivore occurrence, our
mixture model identified a key community-level effect of riverine
corridors, reflecting an aggregate of varied species responses to this
natural landscape feature. Contrary to expectation, heterogeneity in
carnivore occurrence patterns was not associated with measured
variation in illegal hunting activity, suggesting that hunting is not a
dominant influence on carnivore species’ use of park habitats (at least
at the spatial and temporal scales examined). Our models did point
to an effect of proximity to park edge on occurrence, implying that
human disturbance may indeed exert influence on the carnivore
community. However, this edge effect was not uniformly negative
but rather highly variable across species (Fig. 2; unrelated to body
mass or home range size), indicating that a simple model of
increasing disturbance at the park edge is not appropriate.
Heterogeneity in species’ responses to extrinsic stressors is to be
expected, and consequently some inconsistency in aggregate
responses interpreted at the community level should be anticipated
(i.e., diffuse posterior distributions for community hyper-param-
eters). Nevertheless, uncertainty in our multi-species model also
reflects the considerable amount of species-level variation in
occurrence patterns unexplained by the spatial covariates we
included (Appendix S3). Inference for rare species will always be
limited by small sample sizes, and parameters were indeed less
precisely estimated for carnivore species with few detections in our
survey (e.g., Gambian mongoose, side-striped jackal; Appen-
dix S3). All the same, the multi-species approach produced useful
estimates of occurrence and detection probabilities for these
species, and it is more powerful than single-species models that
frequently fail to yield reliable estimates for rare species ([52,94];
A.C. Burton unpublished data).
Even with the improved ability to estimate occurrence and
detection probabilities, our modeling identified few effects of
measured landscape covariates for the rarest carnivores in MNP
(although some responses were strongly indicated, such as the
negative association between caracal occurrence and proximity to
riverine forest; Fig. 2). Responses to landscape factors were more
discernible for species with a greater number of detections (e.g.
spotted hyena, large-spotted genet; Appendix S3), and these likely
had a significant influence on community-level inference. Since
little is known about carnivore ecology in MNP, or more generally
across much of West Africa [95], it is difficult to make a
comparative assessment of the patterns of occurrence indicated by
our study (particularly for smaller carnivores). Single-species
studies from other areas agree with some of our findings while
also highlighting the frequently complex relationships between
landscape heterogeneity and carnivore ecology. For example,
Marker and Dickman [96] found leopard abundance to be
correlated with prey biomass (see also [25]), while Balme et al.
[97] reported that leopards hunted preferentially in areas of
intermediate vegetation cover where prey were easier to catch but
not necessarily more abundant. Boydston et al. [98] and Kolowski
and Holekamp [99] found that spotted hyenas selected areas with
dense vegetation and near seasonal streams, but that their
association with higher prey density was influenced by the degree
of human disturbance. Negative edge effects on survival and
behavior were reported for spotted hyenas [100] and leopards
[11], although in the latter case leopards did not avoid edge areas
(consistent with our results and perhaps indicative of an
‘‘ecological trap’’, sensu [101]). There is a need to follow up on
the results of our study with more detailed investigations of
carnivore ecology in MNP (e.g., telemetry-based studies of habitat
selection, survival and reproduction).
Factors influencing carnivore detectabilityOur hierarchical model also provided insight into biases
associated with the sampling process. Firstly, detection probabil-
ities per survey (i.e., per camera trap day) were estimated to be
quite low, and accordingly our ‘‘naıve’’ estimates of occurrence
probability were negatively biased by an average magnitude of
126% across all 9 carnivore species (from 7% for large-spotted
genet to 434% for side-striped jackal, relative to model estimates;
Table 2). This underscores the importance of accounting for
imperfect detection in models of animal occurrence, a point which
has been made previously by many authors (e.g., [50]) and yet has
received relatively little attention in the broader literature on
species distribution modeling [102,103]. Explicit consideration of
detectability is particularly important for rare and elusive species,
such as most carnivores, and the largest estimated bias in our
sample was associated with those species having the fewest
detections (Table 2).
Our model indicated that two aspects of our sampling design
introduced significant spatial heterogeneity to the probability of
detecting a carnivore species given its occurrence. The potential
bias of sampling on roads has been noted elsewhere [104,105].
Yet, given access difficulties, we chose to set many camera stations
at or near park roads (although roads in MNP are dirt tracks with
relatively little vehicle traffic), and the explicit estimation of
detection heterogeneity allowed us to address this sampling effect
within the model. Similarly, despite our use of a standardized
protocol for setting camera traps, we detected an ‘‘observer effect’’,
where detection probabilities differed between camera stations
established by two field teams. Without an analytical method
explicitly accounting for detectability, and recording of the
relevant sampling covariate, this effect may have been erroneously
interpreted as a difference in occurrence probability. The apparent
influence of proximity to the park edge on detectability could be
related to behavioral responses of carnivores to variation in human
disturbance (e.g., increased vigilance in closer proximity to human
settlement), and, if unaccounted for, may have distorted inference
of edge effect on occurrence. Finally, our modeling results suggest
that we adequately achieved independence among camera stations
by separating them in space and time, since inclusion of the spatial
autocovariate term was not supported at the community level.
Nevertheless, posterior probability distributions for the autoco-
variate coefficient were suggestive of spatial autocorrelation in
occurrence probabilities for several species (Appendix S3), so its
potential importance should not be ignored in future work.
Sampling design of future carnivore surveys in MNP (and
elsewhere) will benefit from careful consideration of the detection
biases indicated by our analysis.
Study limitationsLimitations of our study that might affect the strength of
inference must be carefully considered. Due to logistical
constraints, we were unable to access many portions of the park
Carnivore Responses to Hunting, Habitat and Prey
PLoS ONE | www.plosone.org 10 May 2012 | Volume 7 | Issue 5 | e38007
or to implement a random sampling design, so our camera stations
(and resulting detections) may represent a biased sample yielding
incomplete information on carnivore occurrence patterns in
relation to park features. Nevertheless, we were able to sample
across gradients in our hypothesized factors of influence, and we
attempted to control for the effects of spatial and temporal
sampling features, such as roads and season, on detectability. We
infrequently detected several of the carnivore species in MNP, a
common challenge in surveys of rare and elusive species, and
despite advantages of the multi-species modeling approach,
stronger inference is ultimately achieved only by greater sampling
effort (including more targeted, species-specific sampling).
Our indices representing anthropogenic and natural landscape
features of hypothesized importance were generated from the best
available information, but their reliability may be diminished by
associated uncertainty. For instance, our measures of illegal
hunting activity and longer-term prey biomass are dependent on
the reliability of data generated by the patrol monitoring system,
which is subject to an unknown amount of error [64] (see also
[106]). Hunting pressure is particularly difficult to estimate given
that hunters seek to avoid detection by patrols, thus accounting for
hunter detectability is an important area for further research.
Patrol data also underestimated the occurrence and abundance of
smaller prey species ([64]; Table S1), so corresponding biomass
indices are dominated by the larger and better-detected species.
Prey indices derived from our camera-trap survey are subject to
the same sampling limitations noted above for the carnivore data,
and while the camera data included more small prey items
(Table S1), the diet range for several of the smaller carnivores is
poorly represented. Future work focusing more specifically on
these smaller carnivores and their prey is therefore recommended.
Important variation in carnivore habitat quality may not have
been adequately described by NDVI, which might be more tightly
linked to the ecological characteristics of certain herbivores
[70,71]. While such remote sensing products show great promise
for improving ecological understanding across large spatial and
temporal scales [69,107], they are not a substitute for detailed,
field-based assessments of habitat that are largely lacking for MNP.
Even an index as seemingly simple as distance to the park edge is
subject to some uncertainty associated with inconsistent boundary
demarcation [63], and its reliability as a proxy for human
disturbance is affected by spatial variation in population density
and land use around the park (A.C. Burton, unpublished data).
Nevertheless, such limitations are common to many protected
areas, particularly in developing nations like Ghana, and our study
highlights a conservation-relevant approach to characterizing a
park landscape. Future work should seek to test and improve upon
these measures of landscape heterogeneity and address other
important ecological factors (e.g., fire, [108]; competition, [109])
and modeling forms (e.g., interactive and non-linear effects; multi-
scale occupancy for mobile species, cf. [110]).
Conservation implicationsMNP’s historical carnivore community has been heavily
impacted over recent decades, with the decline and potential
extirpation of several species [18]. Assessing and maintaining the
viability of persisting carnivore populations should therefore be of
significant management concern, and our study provides useful
information to that end. While illegal hunting pressure within the
park is significant, we found no evidence that it exerts a direct
influence on current spatial patterns of carnivore occurrence.
Assuming this result to be accurate (i.e., not due to mismeasure-
ment of hunting pressure), it could relate to the elusive nature of
carnivores or the lack of hunter preference for these species. While
there is evidence that many carnivore species are killed for local
consumptive uses [18], MNP enforcement teams rarely report
evidence of carnivore remains confiscated from arrested hunters
(C. Balangtaa, pers. obs.). It is possible that carnivore species
persisting in the park have proven themselves more resilient to
direct human impacts like hunting, having passed through the
‘‘extinction filter’’ that apparently claimed other species [18,111].
Assessing the indirect impacts of human activity on carnivore
populations is more difficult. For instance, the positive association
between carnivore occurrence and prey biomass is expected from
natural predator-prey dynamics, but could also be indirectly
influenced by hunting impacts on prey populations. Nevertheless,
the relative dominance of prey availability on carnivore occur-
rence suggested by our model may be an encouraging reflection of
the prominence of natural influences on the park’s carnivore
populations, and it provides a tangible target for park managers
(i.e., protection of prey populations). Similarly, the lack of a strong
or consistent edge effect on carnivore occurrence suggests that
elevated impacts around the park are not undermining its
effectiveness in protecting carnivore habitat, at least for most
populations that persist (although we note that hunting is not
limited to the park edge; Fig. 1C). Indeed, MNP appears to
effectively protect natural habitats such as the riverine forest
corridors that our modeling indicated to be of importance to
carnivore occurrence patterns.
However, in assessing the effectiveness of MNP’s protection of
carnivore populations, it is important to note the uncertainty
reflected in our results, which ultimately represent a fairly coarse
and preliminary assessment. Several species were rarely detected
in our survey, limiting inference on their dynamics and suggesting
that they could be perilously close to local extinction. Even among
the more frequently detected species, the long-term viability of
their populations has not yet been appraised. In fact, preliminary
mark-recapture estimates of population density for leopard and
spotted hyena – two of the most frequently detected species in our
survey – suggest that they persist at low abundances relative to
conspecific populations (A.C. Burton, unpublished data). A
reliable assessment of carnivore population viability in MNP,
and a better understanding of the nature of human impacts on
these populations, will require continued and detailed monitoring
of species-specific occurrences and demographic rates.
Though further work is needed, our approach provides a
valuable framework for the assessment of wildlife communities
subject to anthropogenic impact. Few studies capitalize on the
powerful information available across entire communities, despite
the fact that many surveys generate data for a range of species. In
particular, a rapidly growing number of camera-trap surveys
produce data on many species, both rare and common, which may
not be fully utilized as attention is typically focused on one or a few
target species [41,49,112]. We have shown how such camera-trap
data are well-suited to a multi-species hierarchical modeling
framework, resulting in robust estimation of occurrence and
detection probabilities across focal communities. We demonstrated
that a community-level approach can facilitate inference on
individual species while providing more comprehensive insight at a
scale relevant to ecosystem-level management. Furthermore, we
showed how data that may be readily available for many protected
areas, such as patrol-based monitoring observations and remotely
sensed vegetation indices, can be used to test hypotheses about
relative influences on protected wildlife populations. This
approach may be particularly valuable for guiding management
efforts in developing nation parks that lack established research
programs but face pressing conservation needs.
Carnivore Responses to Hunting, Habitat and Prey
PLoS ONE | www.plosone.org 11 May 2012 | Volume 7 | Issue 5 | e38007
Supporting Information
Table S1 Scientific names and mean body mass forall species included in the study, with relativeabundance for prey species detected by patrol andcamera-trap surveys in Mole National Park, Ghana(2006–2009).
(PDF)
Table S2 Variance inflation factors and correlationcoefficients for covariates used in models of carnivoreoccurrence and detection probability.
(PDF)
Appendix S1 Further detail on the assessment of spatialautocorrelation in carnivore occurrence patterns.
(PDF)
Appendix S2 Example segments of WinBUGS modelcode for the hierarchical multi-species carnivore occur-rence model.
(PDF)
Appendix S3 Posterior distributions for community-level hyperparameters and species-level parametersfrom the full multi-species occurrence model.(PDF)
Acknowledgments
We thank the Wildlife Division of the Forestry Commission of Ghana,
particularly N. Adu-Nsiah and U. Farouk Dubiere, for permission and
logistical support, and the many dedicated staff from Mole National Park
who contributed to the patrol monitoring program. We gratefully
acknowledge the assistance of E. Buedi, E. Bani, D. Bosu, D. Kpelle, J.
Tahiru, R. Zieche, E. Ashie, R. Dave, P. Elsen, I. Abbeyquaye, S. Hateka,
E. Rubidge, and T. Ayiku (A Rocha Ghana). A. Royle and P. de Valpine
provided statistical advice, and S. Beissinger, C. Kremen, W. Lidicker, M.
Hayward and three anonymous reviewers made helpful comments on
previous versions of the manuscript.
Author Contributions
Conceived and designed the experiments: ACB MKS CB JSB. Performed
the experiments: ACB CB. Analyzed the data: ACB. Contributed
reagents/materials/analysis tools: ACB MKS CB JSB. Wrote the paper:
ACB. Discussed results and provided edits to the manuscript: MKS CB
JSB.
References
1. Ceballos G, Ehrlich PR, Soberon J, Salazar I, Fay JP (2005) Global Mammal
Conservation: What Must We Manage? Science 309: 603–607.
2. Chape S, Harrison J, Spalding M, Lysenko I (2005) Measuring the extent and
effectiveness of protected areas as an indicator for meeting global biodiversity
targets. Philosophical Transactions of The Royal Society B-Biological Sciences
360: 443–455.
3. Newmark WD (1987) A Land-Bridge Island Perspective on Mammalian
Extinctions in Western North American Parks. Nature 325: 430–432.
4. Newmark WD (2008) Isolation of African protected areas. Frontiers in Ecology
and the Environment 6: 321–328.
5. Caro T, Scholte P (2007) When protection falters. African Journal of Ecology
45: 233–235.
6. Gaston KJ, Jackson SE, Cantu-Salazar L, Cruz-Pinon G (2008) The Ecological
Performance of Protected Areas. Annual Review of Ecology Evolution and
Systematics 39: 93–113.
7. DeFries R, Hansen A, Newton AC, Hansen MC (2005) Increasing isolation of
protected areas in tropical forests over the past twenty years. Ecological
Applications 15: 19–26.
8. Wittemyer G, Elsen P, Bean WT, Burton ACO, Brashares JS (2008)
Accelerated Human Population Growth at Protected Area Edges. Science
321: 123–126.
9. Woodroffe R, Ginsberg JR (1998) Edge effects and the extinction of
populations inside protected areas. Science 280: 2126–2128.
10. Inskip C, Zimmermann A (2009) Human-felid conflict: a review of patterns
and priorities worldwide. Oryx 43: 18–34.
11. Balme GA, Slotow R, Hunter LTB (2010) Edge effects and the impact of non-
protected areas in carnivore conservation: leopards in the Phinda-Mkhuze
Complex, South Africa. Animal Conservation 13: 315–323.
12. Carroll C, Noss RE, Paquet PC, Schumaker NH (2004) Extinction debt of
protected areas in developing landscapes. Conservation Biology 18:
1110–1120.
13. Karanth KU, Chellam R (2009) Carnivore conservation at the crossroads.
Oryx 43: 1–2.
14. Terborgh J, Lopez L, Nunez P, Rao M, Shahabuddin G, et al. (2001)
Ecological meltdown in predator-free forest fragments. Science 294:
1923–1926.
15. Soule ME, Estes JA, Berger J, Del Rio CM (2003) Ecological effectiveness:
Conservation goals for interactive species. Conservation Biology 17:
1238–1250.
16. Packer C, Kosmala M, Cooley HS, Brink H, Pintea L, et al. (2009) Sport
Hunting, Predator Control and Conservation of Large Carnivores. PLoS ONE
4: e5941.
17. Colyn M, Dufour S, Conde PC, Van Rompaey H (2004) The importance of
small carnivores in forest bushmeat hunting in the Classified Forest of Diecke,
Guinea. Small Carnivore Conservation 31: 15–18.
18. Burton AC, Sam MK, Kpelle DG, Balangtaa C, Buedi EB, et al. (2011)
Evaluating persistence and its predictors in a West African carnivore
community. Biological Conservation 144: 2344–2353.
19. Treves A, Karanth KU (2003) Human-carnivore conflict and perspectives on
carnivore management worldwide. Conservation Biology 17: 1491–1499.
20. Baker PJ, Boitani L, Harris S, Saunders G, White PCL (2008) Terrestrialcarnivores and human food production: impact and management. Mammal
Review 38: 123–166.
21. Reed SE, Merenlender AM (2008) Quiet, non-consumptive recreation reduces
protected area effectiveness. Conservation Letters 1: 146–154.
22. Van Meter PE, French JA, Dloniak SM, Watts HE, Kolowski JM, et al. (2009)
Fecal glucocorticoids reflect socio-ecological and anthropogenic stressors in the
lives of wild spotted hyenas. Hormones and behavior 55: 329–337.
23. Karanth KU, Nichols JD, Kumar NS, Link WA, Hines JE (2004) Tigers and
their prey: Predicting carnivore densities from prey abundance. Proceedings ofthe National Academy of Sciences of the United States of America 101:
4854–4858.
24. Henschel P, Hunter LTB, Coad L, Abernethy KA, Muehlenberg M (2011)
Leopard prey choice in the Congo Basin rainforest suggests exploitativecompetition with human bushmeat hunters. Journal of zoology 285: 11–20.
25. Hayward MW, O’Brien J, Kerley GIH (2007) Carrying capacity of largeAfrican predators: Predictions and tests. Biological Conservation 139: 219.
26. Crooks KR (2002) Relative sensitivities of mammalian carnivores to habitatfragmentation. Conservation Biology 16: 488–502.
27. Cleaveland S, Mlengeya T, Kaare M, Haydon D, Lembo T, et al. (2007) TheConservation Relevance of Epidemiological Research into Carnivore Viral
Diseases in the Serengeti. Conservation Biology 21: 612–622.
28. Linkie M, Martyr DJ, Holden J, Yanuar A, Hartana AT, et al. (2003) Habitat
destruction and poaching threaten the Sumatran tiger in Kerinci Seblat
National Park, Sumatra. Oryx 37: 41–48.
29. Hilborn R, Arcese P, Borner M, Hando J, Hopcraft G, et al. (2006) Effective
enforcement in a conservation area. Science 314: 1266–1266.
30. Linnell JDC, Nilsen EB, Lande US, Herfindal I, Odden J, et al. (2005) Zoning
as a means of mitigating conflicts with large carnivores: principles and reality.In: Woodroffe R, Thirgood S, Rabinowitz A, eds. People and Wildlife: Conflict
or Co-Existence Cambridge University Press. pp 162–175.
31. Wikramanayake E, McKnight M, Dinerstein E, Joshi A, Gurung B, Smith D
(2004) Designing a conservation landscape for tigers in human-dominatedenvironments. Conserv.Biol. 18, 3, 839–844.
32. Shivik JA (2006) Tools for the Edge: What’s New for Conserving Carnivores.Bioscience 56: 253–259.
33. Woodroffe R, Frank LG, Lindsey PA, Ranah S, Romanach S (2007) Livestockhusbandry as a tool for carnivore conservation in Africa’s community
rangelands: a case-control study. Biodiversity and Conservation 16:
1245–1260.
34. Balme GA, Slotow R, Hunter LTB (2009) Impact of conservation interventions
on the dynamics and persistence of a persecuted leopard (Panthera pardus)population. Biological Conservation 142: 2681–2690.
35. Maclennan SD, Groom RJ, Macdonald DW, Frank LG (2009) Evaluation of acompensation scheme to bring about pastoralist tolerance of lions. Biological
Conservation 142: 2419–2427.
36. Lindsey, P. A, C. J. Tambling, R. Brummer, H. T. Davies-Mostert, M. W.
Hayward, K. A. Marnewick, M. Parker D (2011) Minimum prey and arearequirements of the Vulnerable cheetah Acionyx jubatus: implications for
reintroduction and management of the species in South Africa. Oryx 45:
587–599.
Carnivore Responses to Hunting, Habitat and Prey
PLoS ONE | www.plosone.org 12 May 2012 | Volume 7 | Issue 5 | e38007
37. Carroll C, Noss RF, Paquet PC (2001) Carnivores as focal species for
conservation planning in the Rocky Mountain region. Ecological Applications11: 961–980.
38. Nicholson E, Possingham HP (2006) Objectives for multiple-species conserva-
tion planning. Conservation Biology 20: 871–881.
39. Ritchie EG, Johnson CN (2009) Predator interactions, mesopredator releaseand biodiversity conservation. Ecology Letters 12: 982–998.
40. Russell RE, Royle JA, Saab VA, Lehmkuhl JF, Block WM, et al. (2009)
Modeling the effects of environmental disturbance on wildlife communities:
avian responses to prescribed fire. Ecological Applications 19: 1253–1263.
41. Ahumada JA, Silva CEF, Gajapersad K, Hallam C, Hurtado J, et al. (2011)
Community structure and diversity of tropical forest mammals: data from a
global camera trap network. Philosophical Transactions of the Royal Society B:
Biological Sciences 366: 2703–2711.
42. Long RA, MacKay P, Zielinski WJ, Ray JC (2008) Noninvasive survey
methods for carnivores. Washington: Island Press. 385 p.
43. Guisan A, Zimmermann NE (2000) Predictive habitat distribution models in
ecology. Ecological Modelling 135: 147–186.
44. Thompson WL (2004) Sampling Rare or Elusive Species: Concepts, Designs,
and Techniques for Estimating Population Parameters. Washington: Island
Press. 429 p.
45. Moruzzi TL, Fuller TK, DeGraaf RM, Brooks RT, Li WJ (2002) Assessing
remotely triggered cameras for surveying carnivore distribution. WildlifeSociety Bulletin 30: 380–386.
46. Pettorelli N, Lobora AL, Msuha MJ, Foley C, Durant SM (2010) Carnivore
biodiversity in Tanzania: revealing the distribution patterns of secretive
mammals using camera traps. Animal Conservation 13: 131–139.
47. Karanth KU, Nichols JD (1998) Estimation of tiger densities in India using
photographic captures and recaptures. Ecology 79: 2852–2862.
48. Balme GA, Hunter LTB, Slotow R (2009) Evaluating Methods for Counting
Cryptic Carnivores. Journal of Wildlife Management 73: 433–441.
49. O’Brien TG, Baillie JEM, Krueger L, Cuke M (2010) The Wildlife Picture
Index: monitoring top trophic levels. Animal Conservation 13: 335–343.
50. MacKenzie DI, Nichols JD, Royle JA, Pollock KH, Bailey LL, et al. (2006)
Occupancy estimation and modeling: inferring patterns and dynamics ofspecies occurrence. London: Elsevier Academic Press. 344 p.
51. Royle JA, Stanley TR, Lukacs PM (2008) Statistical modeling and inference
from carnivore survey data. In: Long RA, Mackay P, Zielinski WJ, Ray JC,
eds. Noninvasive survey methods for carnivores. Washington: Island Press. pp
293–312.
52. Zipkin EF, Dewan A, Royle JA (2009) Impacts of forest fragmentation on
species richness: a hierarchical approach to community modelling. Journal of
Applied Ecology 46: 815–822.
53. Zipkin EF, Royle JA, Dawson DK, Bates S (2010) Multi-species occurrencemodels to evaluate the effects of conservation and management actions.
Biological Conservation 143: 479–484.
54. Royle JA, Dorazio RM (2008) Hierarchical modeling and inference in ecology:
the analysis of data from populations, metapopulations and communities.
Oxford, UK: Elsevier Academic Press. 444 p.
55. Cressie N, Calder CA, Clark JS, Hoef JMV, Wikle CK (2009) Accounting for
uncertainty in ecological analysis: the strengths and limitations of hierarchical
statistical modeling. Ecological Applications 19: 553–570.
56. Augustin NH, Mugglestone MA, Buckland ST (1996) An autologistic model for
the spatial distribution of wildlife. Journal of Applied Ecology 33: 339–347.
57. Lichstein JW, Simons TR, Shriner SA, Franzreb KE (2002) Spatial
autocorrelation and autoregressive models in ecology. Ecological Monographs
72: 445–463.
58. Dormann CF, McPherson JM, Araujo MB, Bivand R, Bolliger J, et al. (2007)
Methods to account for spatial autocorrelation in the analysis of species
distributional data: a review. Ecography 30: 609–628.
59. Wintle BA, Bardos DC (2006) Modeling species-habitat relationships withspatially autocorrelated observation data. Ecological Applications 16:
1945–1958.
60. Carroll C, Johnson DS, Dunk JR, Zielinski WJ (2010) Hierarchical Bayesian
Spatial Models for Multispecies Conservation Planning and Monitoring.
Conservation Biology 24: 1538–1548.
61. Brashares JS, Arcese P, Sam MK (2001) Human demography and reserve size
predict wildlife extinction in West Africa. Proceedings of the Royal Society of
London–Series B: Biological Sciences 268: 2473–2478.
62. Bauer H, De Iongh HH, Princee FPG, Ngantou D (2003) Research needs forlion conservation in West and Central Africa. Comptes Rendus Biologies 326:
S112–S118.
63. Wildlife Division of Ghana (2005) Mole National Park Management Plan.
Forestry Commission, Government of Ghana. WDSP Report No 54: 141.
64. Burton AC (2010) Wildlife monitoring and conservation in a West African
protected area [Dissertation/Thesis]. Berkeley: University of California. 149 p.
65. Jachmann H (2008) Illegal wildlife use and protected area management in
Ghana. Biological Conservation 141: 1906–1918.
66. Jones KE, Bielby J, Cardillo M, Fritz SA, O’Dell J, et al. (2009) PanTHERIA:
a species-level database of life history, ecology, and geography of extant and
recently extinct mammals. Ecology 90: 2648–2648.
67. Dunning JB Jr. (2008) CRC Handbook of Avian Body Masses. New York:CRC Press. 655 p.
68. Fensholt R, Sandholt I (2005) Evaluation of MODIS and NOAA AVHRRvegetation indices with in situ measurements in a semi-arid environment.
International Journal of Remote Sensing 26: 2561–2594.
69. Pettorelli N, Vik JO, Mysterud A, Gaillard J-M, Tucker CJ, et al. (2005) Using
the satellite-derived NDVI to assess ecological responses to environmentalchange. Trends in Ecology & Evolution 20: 503–510.
70. Mueller T, Olson KA, Fuller TK, Schaller GB, Murray MG, et al. (2008) In
search of forage: predicting dynamic habitats of Mongolian gazelles usingsatellite-based estimates of vegetation productivity. Journal of Applied Ecology
45: 649–658.
71. Pettorelli N, Bro-Jorgensen J, Durant SM, Blackburn T, Carbone C (2009)
Energy Availability and Density Estimates in African Ungulates. AmericanNaturalist 173: 698–704.
72. Caro TM, Stoner C (2003) The potential for interspecific competition amongAfrican carnivores. Biological Conservation 110: 67–75.
73. MacKenzie DI, Bailey LL, Nichols JD (2004) Investigating species co-occurrence patterns when species are detected imperfectly. J Anim Ecology 73:
546–555.
74. Harmsen BJ, Foster RJ, Silver SC, Ostro LET, Doncaster CP (2009) Spatial
and temporal interactions of sympatric jaguars (Panthera onca) and pumas
(Puma concolor) in a neotropical forest. Journal of Mammalogy 90: 612–620.
75. McCarthy MA (2007) Bayesian Methods for Ecology. Cambridge: Cambridge
University Press. 296 p.
76. Kery M (2010) Introduction to WinBUGS for Ecologists: Bayesian approach to
regression, ANOVA, mixed models and related analyses: Academic Press. 320p.
77. Quinn GP, Keough MJ (2002) Experimental design and data analysis forbiologists. Cambridge, UK: Cambridge University Press. 537 p.
78. Zuur AF, Ieno EN, Walker NJ, Saveliev AA, Smith GM (2009) Mixed effectsmodels and extensions in ecology with R. New York: Springer. 574 p.
79. R Development Core Team (2010) R: A language and environment forstatistical computing. Vienna, Austria: R Foundation for Statistical Computing.
80. MacKenzie DI, Nichols JD, Lachman GB, Droege S, Royle JA, et al. (2002)Estimating site occupancy rates when detection probabilities are less than one.
Ecology 83: 2248–2255.
81. MacKenzie DI, Nichols JD, Hines JE, Knutson MG, Franklin AB (2003)
Estimating site occupancy, colonization, and local extinction when a species is
detected imperfectly. Ecology 84: 2200–2207.
82. Kery M, Royle JA (2009) Inference about species richness and community
structure using species-specific occupancy models in the National SwissBreeding Bird Survey MHB. In: Thomson DL, Cooch EG, Conroy MJ, eds.
Modeling Demographic Processes in Marked Populations. New York:Springer. pp 639–656.
83. Sberze M, Cohn-Haft M, Ferraz G (2010) Old growth and secondary forest siteoccupancy by nocturnal birds in a neotropical landscape. Animal Conservation
13: 3–11.
84. Congdon P (2005) Bayesian models for categorical data. Chichester: JohnWiley & Sons.
85. Burnham KP, Anderson DR (2002) Model Selection and MultimodelInference. New York: Springer. 488 p.
86. Spiegelhalter DJ, Best NG, Carlin BR, van der Linde A (2002) Bayesianmeasures of model complexity and fit. Journal of the Royal Statistical Society
Series B-Statistical Methodology 64: 583–616.
87. Celeux G, Forbes F, Robert CP, Titterington DM (2006) Deviance
Information Criteria for Missing Data Models. Bayesian Analysis 1: 651–673.
88. Millar RB (2009) Comparison of Hierarchical Bayesian Models for Over-
dispersed Count Data using DIC and Bayes’ Factors. Biometrics 65: 962–969.
89. Kuo L, Mallick B (1998) Variable selection for regression models. Sankhya
60B: 65–81.
90. Royle JA (2008) Modeling individual effects in the Cormack-Jolly-Seber model:
A state-space formulation. Biometrics 64: 364–370.
91. Lunn DJ, Thomas A, Best N, Spiegelhalter D (2000) WinBUGS – a Bayesian
modelling framework: concepts, structure, and extensibility. Statistics and
Computing 10: 325–337.
92. Sturtz S, Ligges U, Gelman A (2005) R2WinBUGS: A Package for Running
WinBUGS from R. Journal of Statistical Software 12: 1–16.
93. Gelman A, Carlin JB, Stern HS, Rubin DB (2004) Bayesian Data Analysis.
Boca Raton: Chapman and Hall.
94. McShea WJ, Stewart C, Peterson L, Erb P, Stuebing R, et al. (2009) The
importance of secondary forest blocks for terrestrial mammals within anAcacia/secondary forest matrix in Sarawak, Malaysia. Biological Conservation
142: 3108–3119.
95. Ray JC, Hunter L, Zigouris J (2005) Setting Conservation and Research
Priorities for Larger African Carnivores. New York: Wildlife ConservationSociety. 203 p.
96. Marker LL, Dickman AJ (2005) Factors affecting leopard (Panthera pardus)
spatial ecology, with particular reference to Namibian farmlands. SouthAfrican Journal of Wildlife Research 35: 105–115.
97. Balme G, Hunter L, Slotow R (2007) Feeding habitat selection by huntingleopards Panthera pardus in a woodland savanna: prey catchability versus
abundance. Animal Behaviour 74: 589–598.
98. Boydston EE, Kapheim KM, Watts HE, Szykman M, Holekamp KE (2003)
Altered behaviour in spotted hyenas associated with increased human activity.Animal Conservation 6: 207–219.
Carnivore Responses to Hunting, Habitat and Prey
PLoS ONE | www.plosone.org 13 May 2012 | Volume 7 | Issue 5 | e38007
99. Kolowski JM, Holekamp KE (2009) Ecological and anthropogenic influences
on space use by spotted hyaenas. Journal of zoology 277: 23–36.100. Pangle WM, Holekamp KE (2010) Lethal and nonlethal anthropogenic effects
on spotted hyenas in the Masai Mara National Reserve. Journal of
Mammalogy 91: 154–164.101. Schlaepfer MA, Runge MC, Sherman PW (2002) Ecological and evolutionary
traps. Trends in Ecology & Evolution 17: 474–480.102. Guisan A, Thuiller W (2005) Predicting species distribution: offering more than
simple habitat models. Ecology Letters 8: 993.
103. Elith J, Leathwick JR (2009) Species Distribution Models: EcologicalExplanation and Prediction Across Space and Time. Annual Review of
Ecology Evolution and Systematics 40: 677–697.104. Henschel P, Ray J (2003) Leopards in African Rainforests: Survey and
Monitoring Techniques. Wildlife Conservation Society, Global CarnivoreProgram. 50 p.
105. Larrucea ES, Brussard PF, Jaeger MM, Barrett RH (2007) Cameras, coyotes,
and the assumption of equal detectability. Journal of Wildlife Management 71:1682–1689.
106. Keane A, Jones JPG, Milner-Gulland EJ (2011) Encounter data in resource
management and ecology: pitfalls and possibilities. Journal of Applied Ecology48: 1164–1173.
107. Cohen WB, Goward SN (2004) Landsat’s role in ecological applications of
remote sensing. Bioscience 54: 535–545.108. Klop E, van Goethem J (2008) Savanna fires govern community structure of
ungulates in Benoue National Park, Cameroon. Journal of Tropical Ecology24: 39–47.
109. Durant SM (1998) Competition refuges and coexistence: an example from
Serengeti carnivores. Journal of Animal Ecology 67: 370–386.110. Mordecai RS, Mattsson BJ, Tzilkowski CJ, Cooper RJ (2011) Addressing
challenges when studying mobile or episodic species: hierarchical Bayesestimation of occupancy and use. Journal of Applied Ecology 48: 56–66.
111. Balmford A (1996) Extinction filters and current resilience: The significance ofpast selection pressures for conservation biology. Trends in Ecology &
Evolution 11: 193–196.
112. Rowcliffe JM, Carbone C (2008) Surveys using camera traps: are we looking toa brighter future? Animal Conservation 11: 185–186.
Carnivore Responses to Hunting, Habitat and Prey
PLoS ONE | www.plosone.org 14 May 2012 | Volume 7 | Issue 5 | e38007