hierarchy and tree visualization - personal web … · visible graphical edge from parents to their...
TRANSCRIPT

1
1
Large Scale Information Visualization
Jing YangFall 2007
2
Hierarchy and Tree Visualization

2
3
Hierarchies
DefinitionAn ordering of groups in which larger groups encompass sets of smaller groups.
Data repository in which cases are related to subcases
4
Hierarchies in the WorldFamily histories, ancestriesFile/directory systems on computersOrganization chartsObject-oriented software classes

3
5
Good Hierarchy Visualization
Allow adequate space within nodes to display informationAllow users to understand relationship between a node and its contextAllow to find elements quicklyFit into a bounded regionMuch more
6
Trees
Hierarchies are often represented as treesDirected, acyclic graph
Two major categories of tree visualization techniques:
Node-link diagram Visible graphical edge from parents to their children
Space-filling

4
7
Node-Link Diagrams
8
Node-Link Diagrams
Root at top, leaves at bottom is very common
J. Stasko’s InfoVis class slides

5
9
Microsoft Explorer
What do you like and dislike about it?
10
Organization Chart
A decision tree
The figure is from Barlow and Neville InfoVis 2001

6
11
H-Tree Layout
Work well only for binary trees
Herman, G. Melançon, M.S. Marshall, “Graph Visualizationin Information Visualization: a Survey” In: IEEE Transactionson Visualization and Computer Graphics, 2000, pp. 24-44.
12
A Common Visualization
E. Kleiberg et. al. InfoVis 2001

7
13
Different Styles
Rectangular: Well suited for displaying labeled/scaled trees.
Straight: Works well only on rooted binary trees.
Smooth Edges: Very similar to the rectangular mode
Radial: Works well for visualizing unrooted trees.
http://www.hyphy.org/docs/GUIExamples/treepanel.html
14
A Classical Hierarchical View
Position children “below” their common ancestors
Layout can be top-down, left-to-right and grid like positioning
Fast: linear time
E. Reingold and J. Tilford. Tidier drawing of trees. IEEE Trans. Softw. Eng., SE-7(2):223-- 228, 1981

8
15
Why Put Root at Top (Left)
Root can be at center with levels growing outward tooCan any node be the root?
J. Stasko’s InfoVis class slides
16
Radial View
Recursively position children of a sub-tree into circular wedgesthe central angle of these wedges are proportional to the number of leaves
P. Eades, “Drawing Free Trees”, Bulleting of the Institutefro Combinatorics and its Applications, 1992, pp. 10-36.

9
17
Radial View
Infovis contest 03 Treemap, Radial Tree, and 3D Tree VisualizationsNihar et. al. Indiana University
18
Balloon View
Siblings of sub-trees are included in circles attached to the father node.
Melancon, G., Herman, I.: Circular drawing of rooted trees. Reports ofthe Centre for Mathematics and Computer Sciences (CWI), INSR9817,

10
19
Balloon View
Melancon, G., Herman, I.: Circular drawing of rooted trees. Reports ofthe Centre for Mathematics and Computer Sciences (CWI), INSR9817,
20
The Challenges
Scalability# of nodes increases exponentially Available space increases polynomially(circular case)
Showing more attributes of data cases in hierarchy or focusing on particular applications of treesInteractive exploration

11
21
3D Tree
Tavanti and Lind, InfoVis 01
22
Cone Tree
Key ideas:Add a third dimension into which layout can goCompromise of top-down and centered techniques mentioned earlierChildren of a node are laid out in a cylinder “below” the parentSiblings live in one of the 2D planes
Robertson, Mackinlay, Card CHI ‘91

12
23
Cone Tree
Robertson, Mackinlay, Card CHI ‘91
24
Alternative Views
Robertson, Mackinlay, Card CHI ‘91

13
25
Advantages vs. Limitations
PositiveMore effective area to lay out treeUse of smooth animation to help person track updatesAesthetically pleasing
NegativeAs in all 3D, occlusion obscures some nodesNon-trivial to implement and requires some graphics horsepower
J. Stasko’s InfoVis class slides
26
Hyperbolic Brower
Key idea: Find a space (hyperbolic space) that increases exponentially, lay out the tree on itTransform from the hyperbolic space to 2D Euclidean space
J. Lamping and R. Rao, “The Hyperbolic Browser: A Focus + Context Technique for Visualizing Large Hierarchies”, Journal of Visual Languages and Computing, vol. 7, no. 1, 1995, pp. 33-55.

14
27http://graphics.stanford.edu/~munzner/talks/calgary02
28

15
29
30

16
31
Hyperbolic Brower
R. Spence. Information Visualization
32
Change Focus

17
33
Key Attributes
Natural magnification (fisheye) in centerLayout depends only on 2-3 generations from current nodeSmooth animation for change in focusDon’t draw objects when far enough from root (simplify rendering)
J. Stasko’s InfoVis class slides
34
H3 Browser
Use hyperbolic transformation in 3D space
Demo
Tamara Munzner: H3: laying out large directed graphs in 3D hyperbolic space. INFOVIS 1997: 2-10

18
35
Botanical Tree [E. Kleiberg et. al. InfoVis 2001]
Basic idea: we can easily see the branches, leaves, and their arrangement in a botanical treeInspiration: Strand model of Holton
Strands: internal vascular structure of a botanical tree
Node and link diagram Corresponding strand Model
36
Botanical Tree [E. Kleiberg et. al. InfoVis 2001]
Use strand model to create a 3-d directory tree:
Unsatisfied features: 1. Branching points 2. long and thin branches 3. cluttered leaves

19
37
Botanical Tree [E. Kleiberg et. al. InfoVis 2001]
Improve the first tree:
Adding smooth transition between two cylinders
38
Botanical Tree [E. Kleiberg et. al. InfoVis 2001]
Improve the first tree:
Use a general tree rather than a binary tree

20
39
Botanical Tree [E. Kleiberg et. al. InfoVis 2001]
Improve the first tree:
Phi-ball with one (left) and many (right) files
40
Botanical Tree [E. Kleiberg et. al. InfoVis 2001]
Botanical tree:
Final model with the improvements

21
41
Botanical Tree [E. Kleiberg et. al. InfoVis 2001]
Botanical tree:
The same directory with different settings
42
Collapsible Cylindrical Tree [Dachselt& Ebert Infovis 01]
Basic idea: use a set of nested cylinders according to the telescope metaphorLimitation: one path is visible in onceInteractions: rotation, go down/up

22
43
Collapsible Cylindrical Tree [R. Dachselt, J. Ebert Infovis 01]
Example application: web document browsing
44
Space-Filling Techniques

23
45
Space-Filling Techniques
Each item occupies an areaChildren are “contained” within parent
46
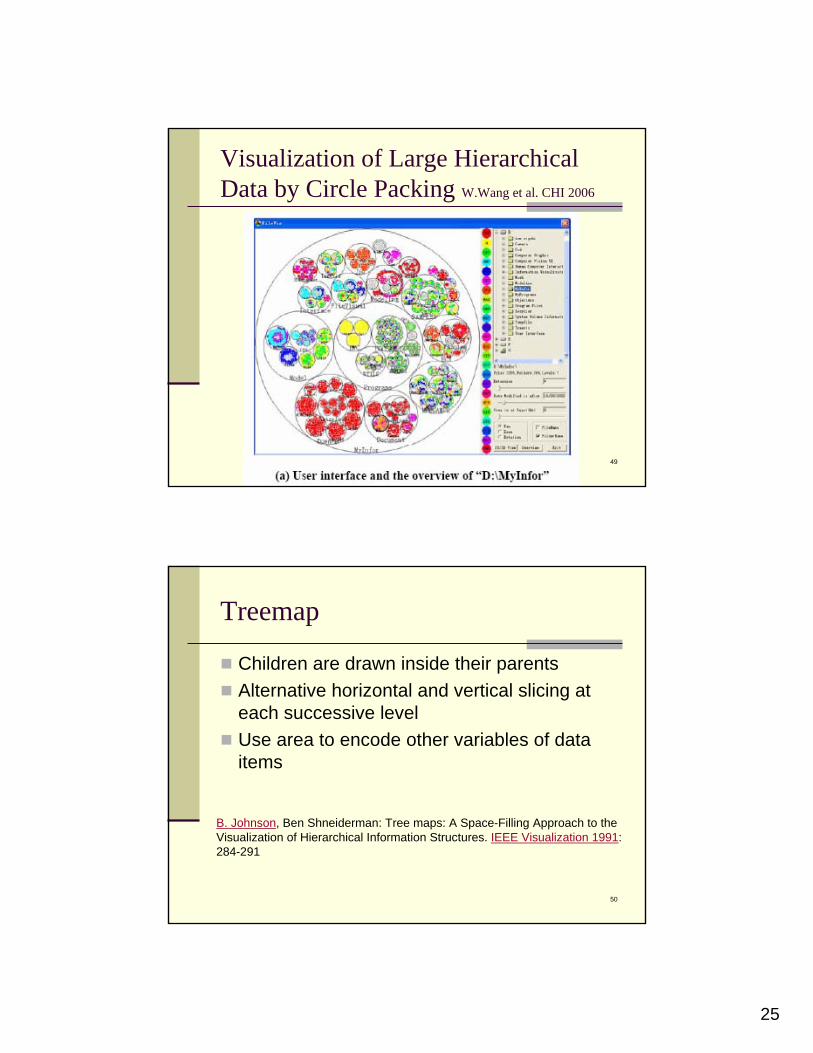
Visualization of Large Hierarchical Data by Circle Packing W.Wang et al. CHI 2006
Key ideas: tree visualization using nested circlesbrother nodes represented by externally tangent circlesnodes at different levels displayed by using 2D nested circles or 3D nested cylinders

24
47
Visualization of Large Hierarchical Data by Circle Packing W.Wang et al. CHI 2006
48
Visualization of Large Hierarchical Data by Circle Packing W.Wang et al. CHI 2006
25
49
Visualization of Large Hierarchical Data by Circle Packing W.Wang et al. CHI 2006
50
Treemap
Children are drawn inside their parentsAlternative horizontal and vertical slicing at each successive levelUse area to encode other variables of data items
B. Johnson, Ben Shneiderman: Tree maps: A Space-Filling Approach to the Visualization of Hierarchical Information Structures. IEEE Visualization 1991: 284-291

26
51
Treemap
Example
J. Stasko’s InfoVis class slides
52
Treemap
Example
J. Stasko’s InfoVis class slides

27
53
Treemap Algorithm
J. Stasko’s InfoVis class slides
Draw(){
Change orientation from parent (horiz/vert)Read all files and directories at this levelMake rectangle for each, scaled to sizeDraw rectangles using appropriate size and colorFor each directory
Make recursive call using its rectangle as focus}
54
Treemap Affordances
It is rectangular!Good representation of two attributes beyond node-link: color and areaNot as good at representing structure
Can get long-thin aspect ratiosWhat happens if it’s a perfectly balanced tree of items all the same size?

28
55
Aspect ratios
J. Stasko’s InfoVis class slides
56
Treemap Variation
Make rectangles more square
Slice-and-dice Cluster Squarified
Pivot-by-middle Pivot-by-size Strip

29
57
Showing Structure
A tree with 698 node (from [Balzer:infovis2005]
How about a perfectly balanced binary tree?
58
Showing Structure
Borderless treemap: hard to discern structure of hierarchy
What happens if it’s a perfectly balanced tree of items all the same size?
Variations:Use borderChange rectangles to other forms

30
59
Nested vs. Non-nested
Non-nested Treemap Nested Treemap
60
Nested Treemap
Borders help on smaller trees, but take up too much area on large, deep ones
http://www.cs.umd.edu/hcil/treemap-history/treemap97.shtml

31
61
Cushion Treemap
Add shading and texture (Van Wijk and Van de Wetering InfoVis’99)
62
Voronoi Treemaps [balzer:infovis05]
Enable subdivisions of and in polygonsFit into areas of arbitrary shape

32
63
Basic Voronoi TessellationsEnable partitioning of m-dimensional space without holes or overlappingsPlanar VT in 2D:
P: = {p1, ..pn} a set of n distinct points –generatorsDivide 2D space into n Voronoi regions V(Pi):
Any point q lies in the region V(Pi) if and only ifdistance(pi, q) < distance(pj,q) for any j != i
64
Weighted Voronoi Tessellations
Basic VT: Additively weighted Voronoi (AW VT:
Additively weighted power voronoi (PW VT):
Left: AW VT
Right: PW VT

33
65
Centroidal Voronoi Tessellations (CVT)
Property of CVT: Each generator is itself center of mass(centroid) of corresponding voronoi region
66
Centroidal Voronoi Tessellations (CVT)
CVT minimize the energy function:
The energy of the CVT is equivalent to the overall aspect ratio of the subareas of the treemap layout

34
67
Voronoi Treemap Algorithm
Size of each Voronoi region should reflect size of the tree nodeArea size is not observed in CVT computationExtension:
Use iterationIn each iteration, adjust the area of regions by their weightsWeights are adjusted according to the size of the nodeIterate until the relative size error is under a threshold
Video
68
Treemap Applications
Software visualizationMultimedia visualizationTennis matchesFile/directory structuresBasketball statisticsStocks and portfolios

35
69
Marketmap
http://www.smartmoney.com/marketmap/
70
Software Visualization
SeeSys (Baker & Eick, AT&T Bell Labs)
New code in this release

36
71
Internet News Groups
Netscan (Fiore & Smith Microsoft)
72
SequoiaView
File visualizater www.win.tue.nl/sequoiaview/

37
73
PhotemesaImage browser (quantum and bubble treemap) http://www.cs.umd.edu/hcil/photomesa/
74
Space-Filling Techniques
Each item occupies an areaChildren are “contained” within (under) parent
One Example

38
75
Icicle Plot
Icicle plot (similar to Kleiner and Hartigan’sconcept of castles)
Node size is proportional to node width
Barlow and Neville InfoVis 2001
76
Radial Space Filing Techniques
InterRing [Yang02]

39
77
Node Link + Space Filling Techniques
78
Elastic Hierarchies: Combining Treemaps and Node-Link Diagrams [zhao:infovis 05]
A hybrid approachDynamic
Video

40
79
Space-Optimized Tree - Motivation
Q. Nguyen and M. Huang Infovis 02
80
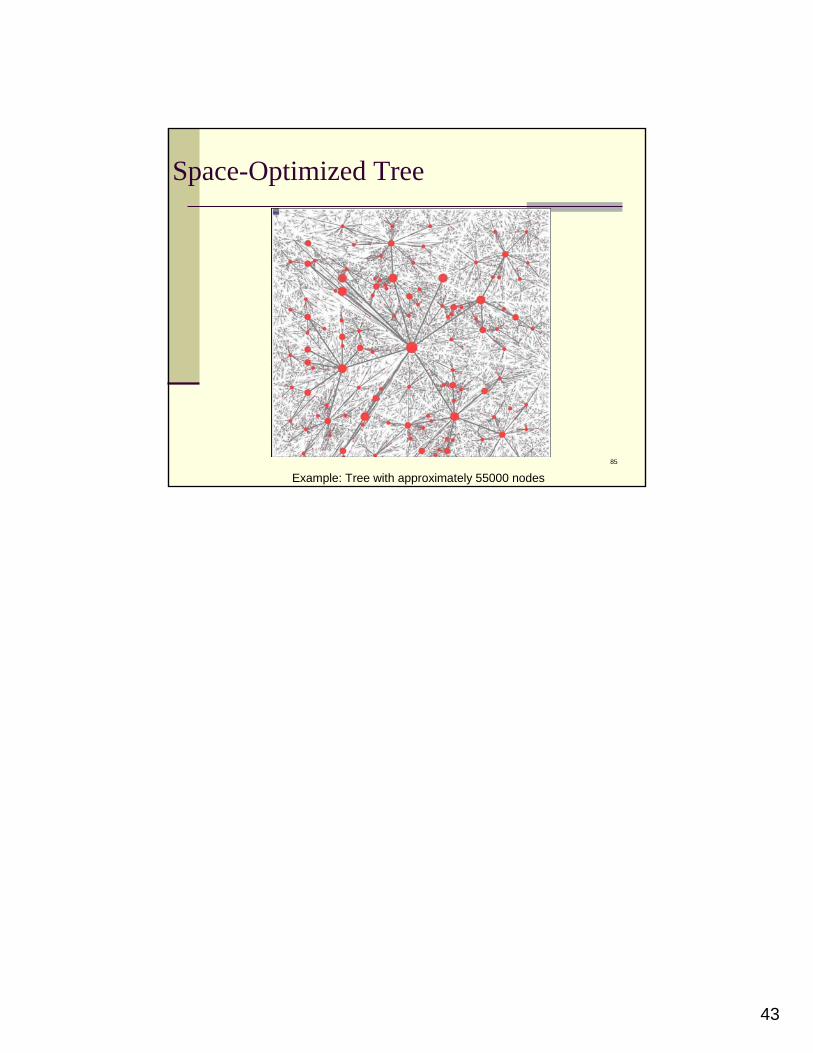
Space-Optimized Tree [Q. Nguyen and M. Huang Infovis 02]
Key idea:Partition display space into a collection of geometrical areas for all nodesUse node-link diagrams to show relational structure
Example: Tree with approximately 55000 nodes
Example: Tree with 150 nodes

41
81
Space-Optimized Tree [Q. Nguyen and M. Huang Infovis 02]
Algorithm for dividing a region:1. weight calculation for each direct child2. wedge calculation for each direct child3. vertex position calculation for each direct child
82
Weight Calculation
Vi: the direct childVl – Vl+k : Direct children of Vi
Constant C: decide difference between vertexes with more descendants and vertexes with fewer descendants.

42
83
Wedge Calculation
Example of dividing the local region of one node
84
Vertex Position Calculation
Area ABCP = Area AEDP
Vertex is the midpoint of line AP
43
85
Space-Optimized Tree
Example: Tree with approximately 55000 nodes