high accuracy temperature measurements using … accuracy temperature measurements using rtd's...
TRANSCRIPT

NASA Technical Memorandum 107416
LJ 2/Y- .J
0 S "I _-" o-. _/
High Accuracy Temperature Measurements
Using RTD's With Current
Loop Conditioning
Gerald M. Hill
Lewis Research Center
Cleveland, Ohio
Prepared for the
43rd International Instrumentation Symposium
sponsored by the Instrument Society of America
Orlando, Florida, May 4-8, 1997
National Aeronautics and
Space Administration
incorporate vlorauon tolerant, iast response sensors in a small package, are now smtame _or lllil_ly Wl[IU
https://ntrs.nasa.gov/search.jsp?R=19970017434 2018-07-02T01:45:20+00:00Z

I excitation
I=0gage --_ Current
RTD l l= :l__..eter Vgage source
Figure1.--Constant current loop.
If the output voltage is sensed by a high impedance voltmeter the effects of the lead wire resistance can
be ignored. A change in the resistance of the wires supplying the current to the gage will not effect the
measurement. Since the current in the loop is held constant, its level is always known through the gage.
The output voltage level is directly related to the change in the gage's resistance. Any drift in the con-
stant current source will result in an error to the temperature measurement. This is considered a percent
of full scale error, therefore it becomes critical to use a stable current source. To meet a 0.1 °F tempera-
ture error requirement, the combined current source accuracy and stability should be within +0.02 % of
current setpoint.
Bias voltage
An inherent problem with using an RTD for high resolution, narrow range, temperature measurements
with this conditioning method is the large bias voltage associated with any resistive sensor, in compari-
son to it's signal level. A typical 100 f_ RTD, excited with 1 mAmp excitation current, will exhibit an
output of 100 mV, at 32 °F. At 200 °F with the same current level, the resistance increases to 137 fl, the
voltage across the gage is 137 mV for a resolution of 0.220 mV/°E
Resoultion - (137.0-100)mV = 0.220 mV/°F
(200-32)°F
Although the voltage delta due to the temperature change was 37 mV, the initial bias of 100 mV would
require an input range of +160 mV range to the facility's 14 bit NEFF 400 A/D, making the resolution
of the measurement 19.53 uV/bit. The conditioned RTD signal equals 0.22mV/°F, for a sensitivity of
0.089 °F/bit. If the bias voltage could be neglected, the same signal level of 37.0 mV over the 168 °F
temperature delta could be used with a NEFF range of +40 mV. This represents a sensitivity of0.022 °F/bit.
One method used to eliminate the bias is to generate a separate bias voltage (in the former example

APPROACH
Voltage difference scheme
An innovative current loop signal conditioning method, developed by Karl Anderson, an Instrumentation
Systems Engineer at NASA's Dryden Flight Research Center, was originally developed to overcome theinherent difficulties associated with the classical Wheatstone bridge circuit for strain gage conditioning. 3
This design conveniently subtracts the bias voltage from the temperature measurement, allowing for a
higher resolution in the measurement. This method was able to satisfy research requirements for a 0.1 °F
measurement accuracy in the NASA Lewis Research Center's 9 x 15 Low Speed Wind Tunnel (9x15
LSWT). Figure 2 illustrates the theory behind the voltage difference measurement scheme.
The RTD is modeled as a combination of the initial resistance RGAGE and the resistance change due to
temperature, All. Wire resistance Rwl - Rw4 is the resistance due to the lead wires. The instrumentation
amplifier which senses the voltage across the sensor has a high enough input impedance that the current
flow through these leads is negligible, and there is no voltage drop across Rw3 or Rw4. RRE F is in series
with the sensor with the same current flowing through both resistors. This develops a voltage VRE F
which is equal to VGAGE when RRE F equals RGAGE, and is subtracted from the sensor voltage.
VOUT = VRTO- VREF
VOU T = (IExcI T )(RGAGE + AR)- (IExcI T)(RRE F)
if RRE F = RGAGE then
VOUT = (IExcIT)(AR)
Rw 1
l excitation R_TD I R gage
Rw 3
Rw 4
V gage
V ref
Figure 2.mVoltage difference measurement scheme.
V out = (lexcit) (AR)
NASA TM-107416 3
The initial slight difference between the sensor resistance and the reference resistor is treated as an offset
which is removed in the data reduction system. This results in an output voltage which is directly pro-
portional to the difference between RRE F and RGAGE.
Circuit description
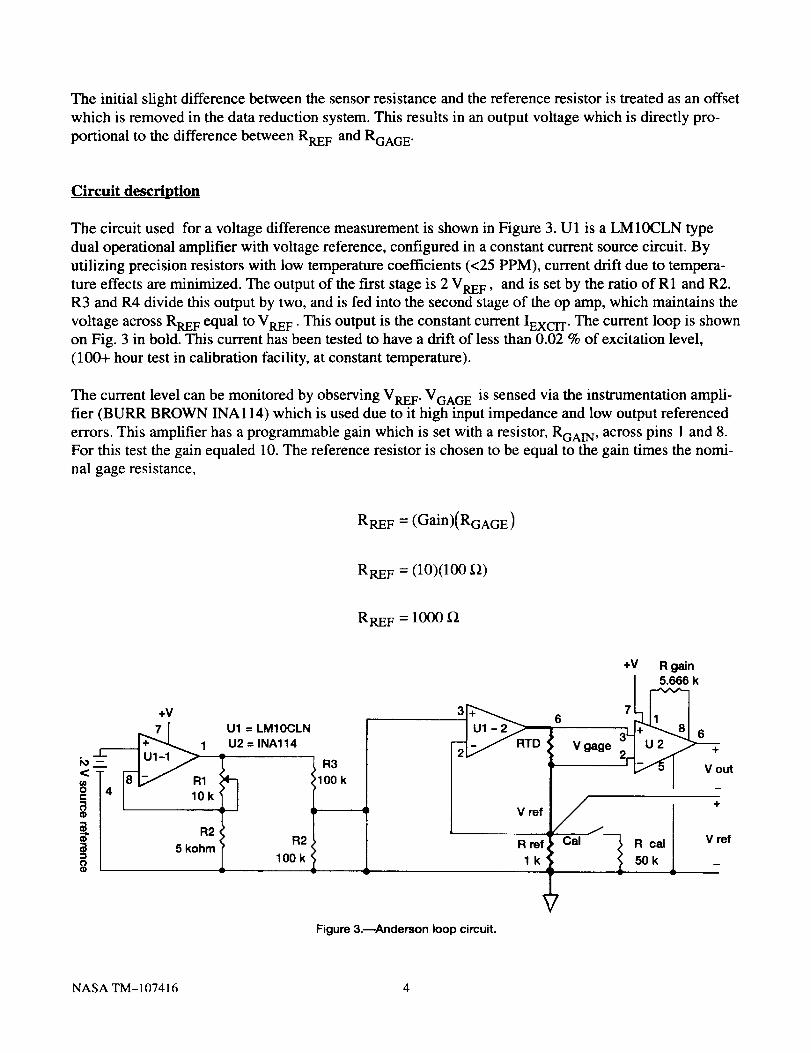
The circuit used for a voltage difference measurement is shown in Figure 3. U1 is a LM10CLN type
dual operational amplifier with voltage reference, configured in a constant current source circuit. By
utilizing precision resistors with low temperature coefficients (<25 PPM), current drift due to tempera-
ture effects axe minimized. The output of the first stage is 2 VRE F , and is set by the ratio of R1 and R2.
R3 and R4 divide this output by two, and is fed into the second stage of the op amp, which maintains the
voltage across RRE F equal to VRE F . This output is the constant current IEXCr r. The current loop is shownon Fig. 3 in bold. This current has been tested to have a drift of less than 0.02 % of excitation level,
(100+ hour test in calibration facility, at constant temperature).
The current level can be monitored by observing VRE F. VGAGE is sensed via the instrumentation ampli-
fier (BURR BROWN INA114) which is used due to it high input impedance and low output referenced
errors. This amplifier has a programmable gain which is set with a resistor, RGA _, across pins 1 and 8.
For this test the gain equaled 10. The reference resistor is chosen to be equal to the gain times the nomi-
nal gage resistance,
RRE F = (Gain)(RGAGE)
RRE F = (lO)(lO0 _)
RRE F = 1000
_.1:
<
-_o,o
-1oO
+v
R2
5 kohm
Ul = LM10CLN
U2 = INAl14
R2
100 k
R3
100k
3-_RTD '
l V ref
R ref
lk
+V R gain
Vgage ' I_ _5 Vout
lCal _ R cal V ref
_ 50k _
Figure 3.--Andereon loop circuit.
NASA TM-107416 4
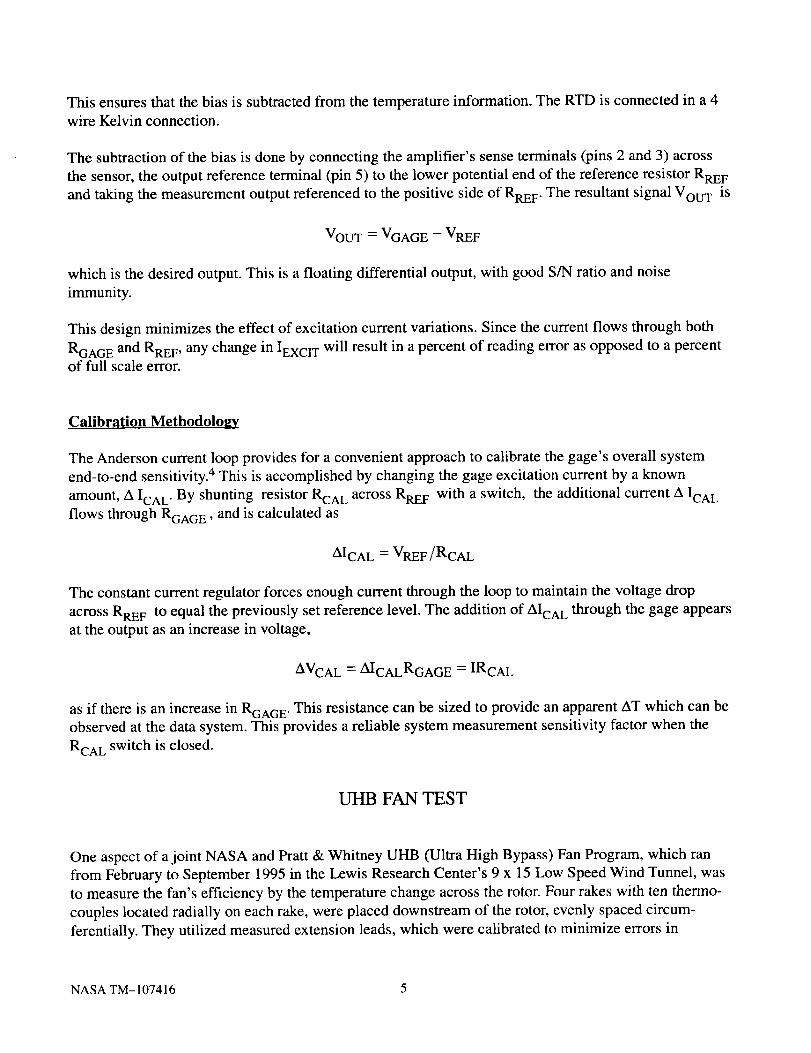
This ensures that the bias is subtracted from the temperature information. The RTD is connected in a 4
wire Kelvin connection.
The subtraction of the bias is done by connecting the amplifier's sense terminals (pins 2 and 3) across
the sensor, the output reference terminal (pin 5) to the lower potential end of the reference resistor RRE F
and taking the measurement output referenced to the positive side of RRE F. The resultant signal VOU T is
VOU T = VGAGE - VRE F
which is the desired output. This is a floating differential output, with good S/N ratio and noise
immunity.
This design minimizes the effect of excitation current variations. Since the current flows through both
RGAGE and RRE F, any change in IEXCI T will result in a percent of reading error as opposed to a percentof full scale error.
Calibration Methodolo2v
The Anderson current loop provides for a convenient approach to calibrate the gage's overall system
end-to-end sensitivity. 4 This is accomplished by changing the gage excitation current by a known
amount, A ICA L. By shunting resistor RCA L across RRE F with a switch, the additional current A ICA L
flows through RGAGE, and is calculated as
AICA L = VRE F/RcAL
The constant current regulator forces enough current through the loop to maintain the voltage drop
across RRE F to equal the previously set reference level. The addition of AIcA L through the gage appears
at the output as an increase in voltage,
AVcA L = AIcALRGAGE = IRcA L
as if there is an increase in RGAGE. This resistance can be sized to provide an apparent AT which can beobserved at the data system. This provides a reliable system measurement sensitivity factor when the
RCA L switch is closed.
UHB FAN TEST
One aspect of a joint NASA and Pratt & Whitney UHB (Ultra High Bypass) Fan Program, which ran
from February to September 1995 in the Lewis Research Center's 9 x 15 Low Speed Wind Tunnel, was
to measure the fan's efficiency by the temperature change across the rotor. Four rakes with ten thermo-
couples located radially on each rake, were placed downstream of the rotor, evenly spaced circum-
ferentially. They utilized measured extension leads, which were calibrated to minimize errors in
NASA TM-107416 5
measurement.An additionalrakeconsistingof ten100f_ platinumRTD's,(PRTDo_= 0.003923)wasincluded.Upstreamof themodel'sbellmouthareferencefreestreamrakewith onethermocoupleplacedat centerline,andfour additionalTCsat a 1foot radiusspacedat 0°, 90°, 180°, 270°, wasinstalledtomeasureupstreamtemperatures.RTD'swerealsoplacedat acloseproximity to theouterradiusthermo-couples.Extensivecalibrationsof thethermocouplesyieldeda0.5°F accuracy.
TheRTD'swereconditionedwith theAndersonconstantcurrentloop methodpreviouslydescribed.Theexcitationlevel,IEXCIT , waschosento be0.5mA to lessenthechanceof selfheatingof thegage.Withatemperaturerangeof 32 to 150°F themeasurementwouldvaryfrom 0 to 128mV whichwassampledwith thefacility's dataacquisitionsystemwith asensitivityof 0.042°F/bit.Therakeswereinitiallyplacedin atemperaturestableovenandanyoffsetswerenormalizedwith areferencestandardRTDprobe(with0.002°F accuracy).Themodelwasoperatedwith thebellmouthanda variablefanexitnozzle(VFEN) atMach0.04.
RESULTS
After allowingthetemperaturetransientsto settle,a scrollingplotwasobtainedfor boththeTC's andtheRTD'son thereferencefreestreamrake.Theresultsof onedatasequencearedisplayedin Fig. 4,whereRTTTOA (RTD's),andRTTROA(TC's) werecalculatedas
RTRROA0_4)= REF RTD(I_4)/REF RTDA
RTTROA(i_5)=REF TC(I_5)/REF TCAvG
whereREFRTDAvG andREFTCAvGwastheaverageof thefour RTD'sor five thermocouplesrespec-tively.While thecalculatedaveragetemperaturebetweenthetwo methodsof temperaturemeasurementarewithin 0.13 °F (75.11°F versus74.98°F), thespreadof thethermocoupleswasgreaterthan0.74°F,andtheRTD spreadwaslessthan0.08°F overthesametime period.
While thereis still work to bedonein optimizingthedesignof theRTD sensorsusedin anaerotestenvironment,suchasthelargeflow recoveriesassociatedwith theRTDsensorasopposedto thermo-couples,calculationsderivedfrom theRTDmeasurementswerecomparableto thoseobtainedwith thecalibratedthermocouples.
LESSONS LEARNED
Single Current Loop
Due to the time restraints imposed by the test, and the unfamiliarity with the possibilities that the Ander-
son loop provides, there are significant improvements possible which could further improve the validity
of the measurement. For the P & W Fan test, all RTD's were conditioned with individual excitation
NASA TM- 107416 6

1.020
1.015
1.01 0
U.
1.005M.o
'_" 1.0000
ff-
_ 0.995
0.990
0.985
0.980
RTDS
1-1"RO = 75.11
19:34:04
1.020
1.015
1.010
,_ 1.005
P
O_ 1.000n-n"I-n- 0.995
0.990
0.985
0.980
4
•
Cycles
Thermocouples
"l-rRO = 74.98
19:38:04
4 4
4 4_44 4 414 V'_ 4 _4 4 4 4
,44-" 1 T4't_i ._4:_4" 4 41 *_ ",. 4- _,74
19:34:42
Cycles
Figure 4._Test data.
19:38:42
NASA TM-107416 7

currents, from separate discrete conditioners. While the stability of the current source was proven at
Lewis's calibration facility to be sufficient for the measurement, any variations between IEXCI T levels
would represent an error in measurement. By wiring all of the RTD's in both rakes into a single loop,
one excitation current flows through all gages. Any variations would be the same in all gages, and it's
associated error therefore minimized. An added benefit of this arrangement is the reduction in overall
wires from 56 to 20. Figure 5 shows this configuration. To alleviate the possibility of having a broken
wire or open gage break the loop and stop current flow in all gages, a silicon diode could be paralleled
across each RTD to shunt the current in case of a failure. By keeping IEXC1T low enough, the voltage
drop across a working gage is far less than the level necessary to turn on the diode. In the event of a
failure, the diode conducts so that the current continues to flow through the other gages. The outputs
would be sensed individually by the facility data acquisition system, where the average temperature
would be calculated and the difference in temperature determined.
I excitation -- m
R gage I
V average = (V1 + V2 + V3 + V4)/4
( + _ Vref V1-Vref=V1 out
[+_R gage 3 k - /
(_*)
R ref
V ref
V ref
V ref
V2 - V ref = V2 out
V3-Vref=V3out
I V4-Vref=V4out
V average = (V1 out + V2 out + V3 out + V4 out)/4
Figure 5._Single loop arrangement for cruciform rake.
NASA TM-107416 8
Analog Computation
Another possible arrangement is to have the measurement averaging done before the data is input to the
acquisition system. Output signals from both the duct and cruciform rake could be added through a
summing amplifier arrangement, divided to find their respective averages, then viewed in series opposi-
tion to determine the difference in temperature measurement. This result would then be the input to the
data system, thereby reducing the errors due to digitizing each gage's signal and the associated post
calculations necessary for a temperature difference measurement.
Multiple Loops With Same Reference Source
Alternatively, two regulators could be driven from the same VRE F source. This would provide for two
current loops, one for each rake, that are referenced to the same level. This modification yields reduced
errors as in the single loop configuration, but simplifies the analog averaging of each respective rake.
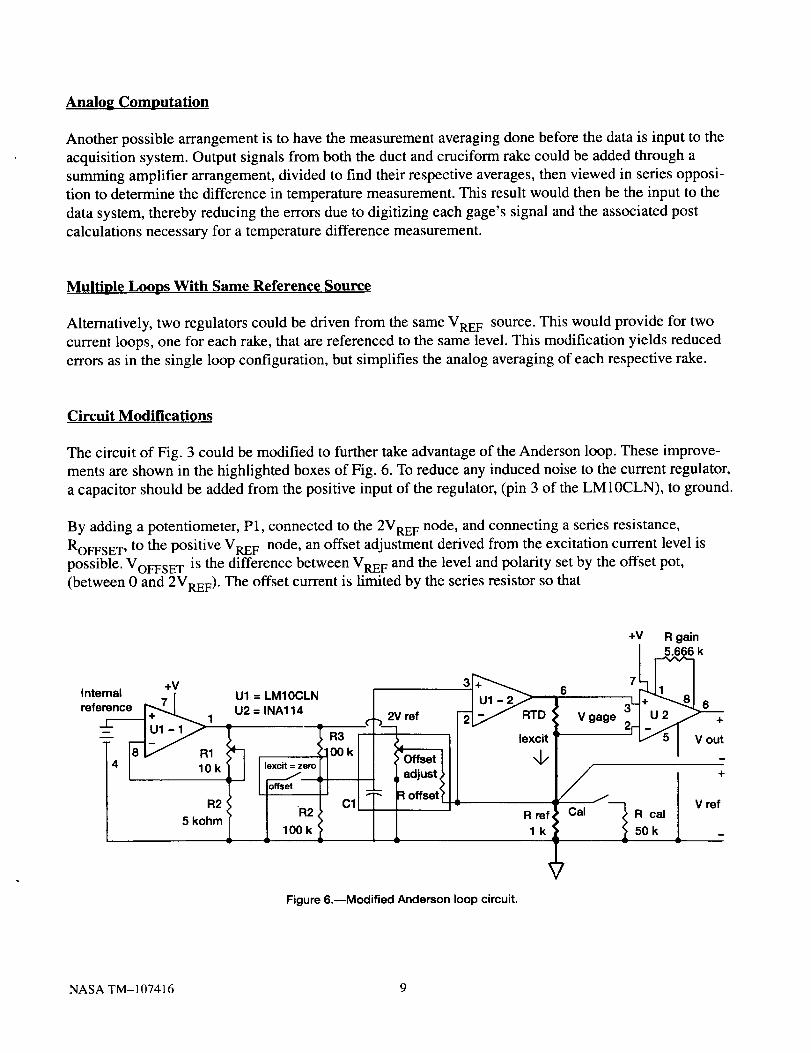
Circuit Modifications
The circuit of Fig. 3 could be modified to further take advantage of the Anderson loop. These improve-
ments are shown in the highlighted boxes of Fig. 6. To reduce any induced noise to the current regulator,
a capacitor should be added from the positive input of the regulator, (pin 3 of the LM10CLN), to ground.
By adding a potentiometer, P1, connected to the 2VRE F node, and connecting a series resistance,
ROFFSET, to the positive VRE F node, an offset adjustment derived from the excitation current level is
possible. VOFFSET is the difference between VRE F and the level and polarity set by the offset pot,
(between 0 and 2VREF). The offset current is limited by the series resistor so that
+VInternal r
reference
4 k
R2
5 kohm
Ul = LM10CLN _ _RTU2 INAl14 2V ref D
1R3 lexeit
00 k
R2 R ref,
100 k _b 1 k
+V R gain
Vgage _ t-_V6ou !
J V refCal <_ R cal
50 kv
Figure 6.--Modified Anderson loop circuit.
NASA TM-107416 9
_IoFFSET = +VoFFSET/ROFFSET
This offset current is summed with the gage current, IEXCITATION, to force the gage voltage, VRT D
to approach VRE F , which is the voltage drop across the reference resistor.
VRTD = (IREF + IOFFSET)RRTD
A switch which shorts out R4 if added to the circuit would cause the excitation current, Iexcitation,
to become zero, providing a means of observing if self generating noise was entering the circuit. Since
the circuit should only react to an impedance change, any output with the switch closed would be from
noise, which adds uncertainty to the measurement.
CONCLUSIONS
By utilizing the Anderson loop to condition RTD's in a wind tunnel environment, it was possible to
achieve temperature measurements of a higher degree of accuracy than that obtained by thermocouples.
The voltage difference method of dealing with the RTD's inherent voltage bias results in a higher
sensitivity in the measurement. Resulting test data confirms that the use of the Anderson current loop to
condition the RTD is an appropriate choice for accurate temperature measurements. The simplicity of
the circuitry allows for easy setup, calibration, and verification of the sensor's signal.
REFERENCES
1. Meyers, C.H.: Coiled Filament Resistance Thermometers, NBS Journal of Research, Vol. 9, 1932.
2. Marsh, R.H., Selecting Thermocouples and Platinum Resistance Temperature Detectors, Journal of
Control Engineering, Vol. 18, No. 11, pp. 76-77, Nov. 1971.
3. Anderson, Karl F.: Current Loop Signal Conditioning Practical Applications, NASA TM-4636, 1995.
4. Anderson, Karl E: A Conversion of Wheatstone Bridge to Current-Loop Signal Conditioning For
Strain Gages, NASA TM-104309, 1995.
NASA TM-107416 10

Form ApprovedREPORT DOCUMENTATION PAGE OMB NO. 0704-0188
Public reporting burden for this collection of information is estimated to average 1 hour per response, including the time for reviewing instructions, searching existing cLata sources.gathering and maintaining the data needed, and completing and reviewing the collection of information. Send comments regarding this burden estimate or any other aspect of thiscollection of information, including suggestions for reducing this burden, to Washington Headquarters Services, Directorate for Information Operations and Reports, 1215 JeffersonDavis Highway, Suite 1204, Artington, VA 22202-4302, and to the Office of Management and Budget, Paperwork Reduction Project (0704o0188), Washington, DC 20503.
1. AGENCY USE ONLY (Leave b/ank) 2. REPORT DATE 3. REPORT TYPE AND DATES COVERED
March 1997 Technical Memorandum
4. TITLE AND SUBTITLE
High Accuracy Temperature Measurements Using RTD's With Current
Loop Conditioning
6. AUTHOR(S)
Gerald M. Hill
7. PERFORMING ORGANIZATION NAME(S) AND ADDRESS(ES)
National Aeronautics and Space Administration
Lewis Research Center
Cleveland, Ohio 44135- 3191
9. SPONSORING/MONITORING AGENCY NAME(S) AND ADDRESS(ES)
National Aeronautics and Space Administration
Washington, DC 20546-0001
5. FUNDING NUMBERS
WU-523-91-93
8. PERFORMING ORGANIZATION
REPORT NUMBER
E-10653
10. SPONSORING/MONITORING
AGENCY REPORTNUMBER
NASA TM-107416
11. SUPPLEMENTARY NOTES
Prepared for the 43rd International Instrumentation Symposium sponsored by the Instrument Society of America, Orlando,
Florida, May 4-8, 1997. Responsible person, Gerald M. Hill, organization code 7545, (216) 433-5692.
12a. DISTRIBUTION/AVAILABILITY STATEMENT 12b. DISTRIBUTION CODE
Unclassified - Unlimited
Subject Category 33
This publication is available from the NASA Center for AeroSpace Information, (301) 621--0390.
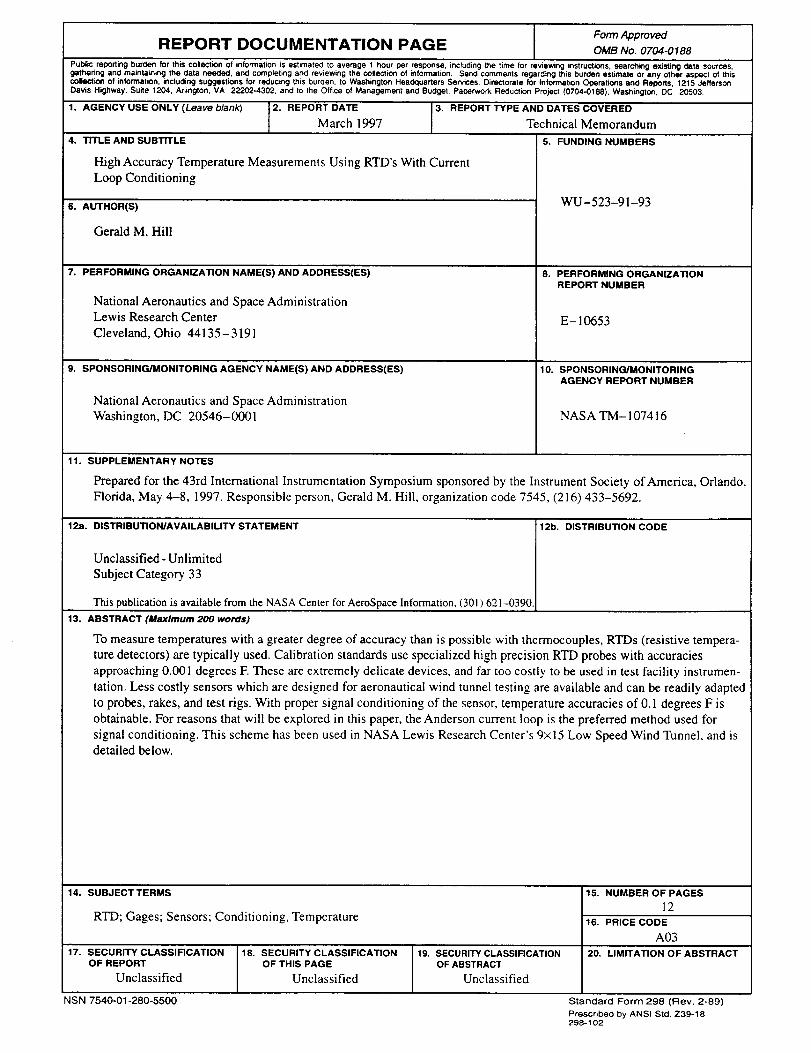
13. ABSTRACT (Maximum 200 words)
To measure temperatures with a greater degree of accuracy than is possible with thermocoupies, RTDs (resistive tempera-
ture detectors) are typically used. Calibration standards use specialized high precision RTD probes with accuracies
approaching 0.001 degrees F. These are extremely delicate devices, and far too costly to be used in test facility instrumen-
tation. Less costly sensors which are designed for aeronautical wind tunnel testing are available and can be readily adapted
to probes, rakes, and test rigs. With proper signal conditioning of the sensor, temperature accuracies of 0.1 degrees F is
obtainable. For reasons that will be explored in this paper, the Anderson current loop is the preferred method used for
signal conditioning. This scheme has been used in NASA Lewis Research Center's 9×i5 Low Speed Wind Tunnel, and is
detailed below.
14. SUBJECT TERMS
RTD; Gages; Sensors; Conditioning, Temperature
17. SECURITY CLASSIFICATION
OF REPORT
Unclassified
NSN 7540-01-280-5500
18. SECURITY CLASSIFICATION
OF THIS PAGE
Unclassified
19. SECURITY CLASSIFICATION
OF ABSTRACT
Unclassified
15. NUMBER OF PAGES
12
16. PRICE CODE
A03
20. LIMITATION OF ABSTRACT
Standard Form 298 (Rev. 2-89)
Prescribed by ANSI Std. Z39-18298-102