high availability in websphere messaging solutions high availability in websphere messaging...
TRANSCRIPT
ibm.com/redbooks
High Availability in WebSphere Messaging Solutions
Bharat BhushanSook Chua
Carolyn ElkinsMark Scicluna
Wei-Dong Yang
Design WebSphere solutions for high availability
Use WebSphere features to increase availability
Use PowerHA clusters to increase availability
Front cover

High Availability in WebSphere Messaging Solutions
April 2010
International Technical Support Organization
SG24-7839-00

© Copyright International Business Machines Corporation 2010. All rights reserved.Note to U.S. Government Users Restricted Rights -- Use, duplication or disclosure restricted by GSA ADPSchedule Contract with IBM Corp.
First Edition (April 2010)
This edition applies to WebSphere Message Broker V7, WebSphere MQ V7, IBM DataPower Appliance XI50 3.8.0.
Note: Before using this information and the product it supports, read the information in “Notices” on page ix.
Contents
Notices . . . . . . . . . . . . . . . . . . . . . . . . . . . . . . . . . . . . . . . . . . . . . . . . . . . . . . . ixTrademarks . . . . . . . . . . . . . . . . . . . . . . . . . . . . . . . . . . . . . . . . . . . . . . . . . . . . x
Preface . . . . . . . . . . . . . . . . . . . . . . . . . . . . . . . . . . . . . . . . . . . . . . . . . . . . . . . xiThe team who wrote this book . . . . . . . . . . . . . . . . . . . . . . . . . . . . . . . . . . . . . . xiNow you can become a published author, too! . . . . . . . . . . . . . . . . . . . . . . . . xiiiComments welcome. . . . . . . . . . . . . . . . . . . . . . . . . . . . . . . . . . . . . . . . . . . . . xiiiStay connected to IBM Redbooks . . . . . . . . . . . . . . . . . . . . . . . . . . . . . . . . . . xiv
Part 1. High availability concepts . . . . . . . . . . . . . . . . . . . . . . . . . . . . . . . . . . . . . . . . . . . . . . 1
Chapter 1. Introduction to availability . . . . . . . . . . . . . . . . . . . . . . . . . . . . . . 31.1 System availability terms and definitions . . . . . . . . . . . . . . . . . . . . . . . . . . 4
1.1.1 Availability . . . . . . . . . . . . . . . . . . . . . . . . . . . . . . . . . . . . . . . . . . . . . . 41.1.2 High availability . . . . . . . . . . . . . . . . . . . . . . . . . . . . . . . . . . . . . . . . . 41.1.3 Continuous availability . . . . . . . . . . . . . . . . . . . . . . . . . . . . . . . . . . . . 4
1.2 Causes of downtime . . . . . . . . . . . . . . . . . . . . . . . . . . . . . . . . . . . . . . . . . . 51.3 Availability classes . . . . . . . . . . . . . . . . . . . . . . . . . . . . . . . . . . . . . . . . . . . 51.4 Redundancy . . . . . . . . . . . . . . . . . . . . . . . . . . . . . . . . . . . . . . . . . . . . . . . . 71.5 Failover strategies . . . . . . . . . . . . . . . . . . . . . . . . . . . . . . . . . . . . . . . . . . . . 81.6 Software clustering . . . . . . . . . . . . . . . . . . . . . . . . . . . . . . . . . . . . . . . . . . . 91.7 Hardware redundancy . . . . . . . . . . . . . . . . . . . . . . . . . . . . . . . . . . . . . . . . 11
1.7.1 Component redundancy . . . . . . . . . . . . . . . . . . . . . . . . . . . . . . . . . . 121.7.2 Storage redundancy . . . . . . . . . . . . . . . . . . . . . . . . . . . . . . . . . . . . . 121.7.3 Server redundancy . . . . . . . . . . . . . . . . . . . . . . . . . . . . . . . . . . . . . . 13
1.8 Cost of high availability . . . . . . . . . . . . . . . . . . . . . . . . . . . . . . . . . . . . . . . 13
Chapter 2. Application design for availability. . . . . . . . . . . . . . . . . . . . . . . 152.1 Introduction . . . . . . . . . . . . . . . . . . . . . . . . . . . . . . . . . . . . . . . . . . . . . . . . 162.2 Message design and high availability . . . . . . . . . . . . . . . . . . . . . . . . . . . . 17
2.2.1 Synchronous versus asynchronous messaging . . . . . . . . . . . . . . . . 172.2.2 Affinity . . . . . . . . . . . . . . . . . . . . . . . . . . . . . . . . . . . . . . . . . . . . . . . . 182.2.3 Sequencing . . . . . . . . . . . . . . . . . . . . . . . . . . . . . . . . . . . . . . . . . . . . 212.2.4 Transactionality . . . . . . . . . . . . . . . . . . . . . . . . . . . . . . . . . . . . . . . . . 23
2.3 Data storage and high availability . . . . . . . . . . . . . . . . . . . . . . . . . . . . . . . 252.4 Cloud computing and high availability . . . . . . . . . . . . . . . . . . . . . . . . . . . . 262.5 Keeping the network available . . . . . . . . . . . . . . . . . . . . . . . . . . . . . . . . . 272.6 Infrastructure patterns . . . . . . . . . . . . . . . . . . . . . . . . . . . . . . . . . . . . . . . . 29
2.6.1 Cluster patterns. . . . . . . . . . . . . . . . . . . . . . . . . . . . . . . . . . . . . . . . . 29
© Copyright IBM Corp. 2010. All rights reserved. iii
2.6.2 Network patterns . . . . . . . . . . . . . . . . . . . . . . . . . . . . . . . . . . . . . . . . 30
Chapter 3. Product technologies for high availability . . . . . . . . . . . . . . . . 333.1 High availability and failover . . . . . . . . . . . . . . . . . . . . . . . . . . . . . . . . . . . 343.2 Hardware clustering . . . . . . . . . . . . . . . . . . . . . . . . . . . . . . . . . . . . . . . . . 34
3.2.1 IBM PowerHA cluster . . . . . . . . . . . . . . . . . . . . . . . . . . . . . . . . . . . . 363.3 Multi-instance queue managers and brokers . . . . . . . . . . . . . . . . . . . . . . 40
3.3.1 Multi-instance queue managers . . . . . . . . . . . . . . . . . . . . . . . . . . . . 413.3.2 Multi-instance brokers . . . . . . . . . . . . . . . . . . . . . . . . . . . . . . . . . . . . 413.3.3 Highly available hardware solutions versus multi-instance
solutions . . . . . . . . . . . . . . . . . . . . . . . . . . . . . . . . . . . . . . . . . . . . . . 413.4 Queue manager cluster. . . . . . . . . . . . . . . . . . . . . . . . . . . . . . . . . . . . . . . 42
3.4.1 Cluster queue managers and repositories . . . . . . . . . . . . . . . . . . . . 423.4.2 Workload balancing. . . . . . . . . . . . . . . . . . . . . . . . . . . . . . . . . . . . . . 43
3.5 Queue-sharing groups. . . . . . . . . . . . . . . . . . . . . . . . . . . . . . . . . . . . . . . . 453.5.1 Benefits of shared message queues. . . . . . . . . . . . . . . . . . . . . . . . . 463.5.2 Benefits of shared channels . . . . . . . . . . . . . . . . . . . . . . . . . . . . . . . 463.5.3 Large messages on shared queues . . . . . . . . . . . . . . . . . . . . . . . . . 47
3.6 MQ clients . . . . . . . . . . . . . . . . . . . . . . . . . . . . . . . . . . . . . . . . . . . . . . . . . 483.6.1 Automatic client reconnection . . . . . . . . . . . . . . . . . . . . . . . . . . . . . . 483.6.2 WebSphere MQ transactional client group unit of recovery . . . . . . . 503.6.3 Client connection balancing . . . . . . . . . . . . . . . . . . . . . . . . . . . . . . . 513.6.4 Network sprayers . . . . . . . . . . . . . . . . . . . . . . . . . . . . . . . . . . . . . . . 53
Chapter 4. Operational considerations . . . . . . . . . . . . . . . . . . . . . . . . . . . . 554.1 Overview . . . . . . . . . . . . . . . . . . . . . . . . . . . . . . . . . . . . . . . . . . . . . . . . . . 564.2 Monitoring and alerting . . . . . . . . . . . . . . . . . . . . . . . . . . . . . . . . . . . . . . . 564.3 Configuration management . . . . . . . . . . . . . . . . . . . . . . . . . . . . . . . . . . . . 58
4.3.1 Deployment scenario 1: The big bang . . . . . . . . . . . . . . . . . . . . . . . 594.3.2 Deployment Scenario 2: Multiple deployment units . . . . . . . . . . . . . 604.3.3 Deciding how to break down the application into deployment
units . . . . . . . . . . . . . . . . . . . . . . . . . . . . . . . . . . . . . . . . . . . . . . . . . 614.4 Capacity planning . . . . . . . . . . . . . . . . . . . . . . . . . . . . . . . . . . . . . . . . . . . 614.5 Hardware reliability . . . . . . . . . . . . . . . . . . . . . . . . . . . . . . . . . . . . . . . . . . 624.6 Managing the application configuration. . . . . . . . . . . . . . . . . . . . . . . . . . . 624.7 General considerations . . . . . . . . . . . . . . . . . . . . . . . . . . . . . . . . . . . . . . . 63
4.7.1 Service support processes . . . . . . . . . . . . . . . . . . . . . . . . . . . . . . . . 634.7.2 Testing . . . . . . . . . . . . . . . . . . . . . . . . . . . . . . . . . . . . . . . . . . . . . . . 634.7.3 Backup and recovery . . . . . . . . . . . . . . . . . . . . . . . . . . . . . . . . . . . . 654.7.4 Security . . . . . . . . . . . . . . . . . . . . . . . . . . . . . . . . . . . . . . . . . . . . . . . 65
Part 2. Scenarios . . . . . . . . . . . . . . . . . . . . . . . . . . . . . . . . . . . . . . . . . . . . . . . . . . . . . . . . . . . 67
Chapter 5. High availability using PowerHA clusters. . . . . . . . . . . . . . . . . 69
iv High Availability in WebSphere Messaging Solutions
5.1 Scenario overview . . . . . . . . . . . . . . . . . . . . . . . . . . . . . . . . . . . . . . . . . . . 705.2 High availability characteristics of the scenario. . . . . . . . . . . . . . . . . . . . . 715.3 PowerHA cluster . . . . . . . . . . . . . . . . . . . . . . . . . . . . . . . . . . . . . . . . . . . . 73
5.3.1 HA cluster topology and configuration . . . . . . . . . . . . . . . . . . . . . . . 735.3.2 Topology and resource group . . . . . . . . . . . . . . . . . . . . . . . . . . . . . . 765.3.3 Creating a cluster . . . . . . . . . . . . . . . . . . . . . . . . . . . . . . . . . . . . . . . 86
5.4 Integration of application components. . . . . . . . . . . . . . . . . . . . . . . . . . . . 915.4.1 A solution using one resource group. . . . . . . . . . . . . . . . . . . . . . . . . 925.4.2 WebSphere MQ . . . . . . . . . . . . . . . . . . . . . . . . . . . . . . . . . . . . . . . . 925.4.3 WebSphere MQ FTE. . . . . . . . . . . . . . . . . . . . . . . . . . . . . . . . . . . . . 945.4.4 Including WebSphere Message Broker. . . . . . . . . . . . . . . . . . . . . . . 97
5.5 Making file transfer highly available . . . . . . . . . . . . . . . . . . . . . . . . . . . . 1005.5.1 Testing the basic cluster functions . . . . . . . . . . . . . . . . . . . . . . . . . 1005.5.2 File transfer tests in the cluster environment . . . . . . . . . . . . . . . . . 1035.5.3 Cluster takeover tests during file transfer . . . . . . . . . . . . . . . . . . . . 104
5.6 Summary . . . . . . . . . . . . . . . . . . . . . . . . . . . . . . . . . . . . . . . . . . . . . . . . . 105
Chapter 6. Using multi-instances queue managers and brokers for high availability . . . . . . . . . . . . . . . . . . . . . . . . . . . . . . . . . . . . . . . . . 107
6.1 Overview . . . . . . . . . . . . . . . . . . . . . . . . . . . . . . . . . . . . . . . . . . . . . . . . . 1086.2 System environment and configuration . . . . . . . . . . . . . . . . . . . . . . . . . . 109
6.2.1 Network plan . . . . . . . . . . . . . . . . . . . . . . . . . . . . . . . . . . . . . . . . . . 1096.2.2 High availability characteristics . . . . . . . . . . . . . . . . . . . . . . . . . . . . 110
6.3 AIX configuration . . . . . . . . . . . . . . . . . . . . . . . . . . . . . . . . . . . . . . . . . . . 1116.3.1 Software installed on the AIX systems . . . . . . . . . . . . . . . . . . . . . . 1126.3.2 Preparing the shared disk on AIX . . . . . . . . . . . . . . . . . . . . . . . . . . 1126.3.3 Exporting the file systems using NFS V4 mount . . . . . . . . . . . . . . . 114
6.4 Configuring the messaging components . . . . . . . . . . . . . . . . . . . . . . . . . 1156.4.1 WebSphere MQ with multi-instances . . . . . . . . . . . . . . . . . . . . . . . 1156.4.2 WebSphere Message Broker with multi-instances . . . . . . . . . . . . . 120
6.5 Publish/subscribe in MQ cluster test environment . . . . . . . . . . . . . . . . . 1226.5.1 Setting up Queue manager cluster . . . . . . . . . . . . . . . . . . . . . . . . . 1246.5.2 Creating the topic . . . . . . . . . . . . . . . . . . . . . . . . . . . . . . . . . . . . . . 1296.5.3 Creating the subscription . . . . . . . . . . . . . . . . . . . . . . . . . . . . . . . . 134
6.6 Testing the topology . . . . . . . . . . . . . . . . . . . . . . . . . . . . . . . . . . . . . . . . 1366.6.1 Testing approach . . . . . . . . . . . . . . . . . . . . . . . . . . . . . . . . . . . . . . 1366.6.2 Verifying the status on the node . . . . . . . . . . . . . . . . . . . . . . . . . . . 1386.6.3 Test cases and results . . . . . . . . . . . . . . . . . . . . . . . . . . . . . . . . . . 139
6.7 Summary . . . . . . . . . . . . . . . . . . . . . . . . . . . . . . . . . . . . . . . . . . . . . . . . . 146
Chapter 7. High availability through redundancy. . . . . . . . . . . . . . . . . . . 1477.1 Overview . . . . . . . . . . . . . . . . . . . . . . . . . . . . . . . . . . . . . . . . . . . . . . . . . 148
7.1.1 Topology . . . . . . . . . . . . . . . . . . . . . . . . . . . . . . . . . . . . . . . . . . . . . 150
Contents v

7.1.2 High availability characteristics and actions . . . . . . . . . . . . . . . . . . 1517.1.3 Recovery . . . . . . . . . . . . . . . . . . . . . . . . . . . . . . . . . . . . . . . . . . . . . 155
7.2 Message Broker message flow design . . . . . . . . . . . . . . . . . . . . . . . . . . 1567.3 WebSphere Message Broker configuration. . . . . . . . . . . . . . . . . . . . . . . 158
7.3.1 Creating the brokers and queue managers. . . . . . . . . . . . . . . . . . . 1597.3.2 Creating the execution groups . . . . . . . . . . . . . . . . . . . . . . . . . . . . 1597.3.3 Deploying the bar file on the server . . . . . . . . . . . . . . . . . . . . . . . . 1607.3.4 Build the second WebSphere Message Broker server . . . . . . . . . . 1627.3.5 Determining the URLs for the deployed Web services . . . . . . . . . . 162
7.4 WebSphere MQ configuration . . . . . . . . . . . . . . . . . . . . . . . . . . . . . . . . . 1637.5 DataPower configuration . . . . . . . . . . . . . . . . . . . . . . . . . . . . . . . . . . . . . 1637.6 Operational considerations . . . . . . . . . . . . . . . . . . . . . . . . . . . . . . . . . . . 174
7.6.1 Capacity planning . . . . . . . . . . . . . . . . . . . . . . . . . . . . . . . . . . . . . . 1747.6.2 Message dependencies . . . . . . . . . . . . . . . . . . . . . . . . . . . . . . . . . 174
7.7 Testing the topology . . . . . . . . . . . . . . . . . . . . . . . . . . . . . . . . . . . . . . . . 1747.7.1 Testing approach . . . . . . . . . . . . . . . . . . . . . . . . . . . . . . . . . . . . . . 1747.7.2 Test cases and results . . . . . . . . . . . . . . . . . . . . . . . . . . . . . . . . . . 175
Chapter 8. Duplexing WebSphere MQ structures . . . . . . . . . . . . . . . . . . 1838.1 Scenario overview . . . . . . . . . . . . . . . . . . . . . . . . . . . . . . . . . . . . . . . . . . 185
8.1.1 Topology . . . . . . . . . . . . . . . . . . . . . . . . . . . . . . . . . . . . . . . . . . . . . 1878.1.2 High availability characteristics and actions . . . . . . . . . . . . . . . . . . 1878.1.3 Recovery . . . . . . . . . . . . . . . . . . . . . . . . . . . . . . . . . . . . . . . . . . . . . 188
8.2 Coupling facility configuration . . . . . . . . . . . . . . . . . . . . . . . . . . . . . . . . . 1888.3 WebSphere Message Broker configuration. . . . . . . . . . . . . . . . . . . . . . . 1918.4 WebSphere MQ configuration . . . . . . . . . . . . . . . . . . . . . . . . . . . . . . . . . 192
8.4.1 Defining the coupling facility structures to WebSphere MQ . . . . . . 1928.4.2 Defining the shared queues . . . . . . . . . . . . . . . . . . . . . . . . . . . . . . 194
8.5 Operational considerations . . . . . . . . . . . . . . . . . . . . . . . . . . . . . . . . . . . 1958.5.1 Backing up WebSphere MQ structures. . . . . . . . . . . . . . . . . . . . . . 1958.5.2 Recovering a WebSphere MQ structure . . . . . . . . . . . . . . . . . . . . . 1968.5.3 DB2 impact for large messages . . . . . . . . . . . . . . . . . . . . . . . . . . . 196
8.6 Testing the topology . . . . . . . . . . . . . . . . . . . . . . . . . . . . . . . . . . . . . . . . 1978.6.1 Testing tools . . . . . . . . . . . . . . . . . . . . . . . . . . . . . . . . . . . . . . . . . . 1978.6.2 Testing approach . . . . . . . . . . . . . . . . . . . . . . . . . . . . . . . . . . . . . . 1978.6.3 Test cases and results . . . . . . . . . . . . . . . . . . . . . . . . . . . . . . . . . . 198
8.7 Summary . . . . . . . . . . . . . . . . . . . . . . . . . . . . . . . . . . . . . . . . . . . . . . . . . 211
Chapter 9. WebSphere MQ shared queues and CICS group attach . . . . 2139.1 Overview . . . . . . . . . . . . . . . . . . . . . . . . . . . . . . . . . . . . . . . . . . . . . . . . . 214
9.1.1 Topology . . . . . . . . . . . . . . . . . . . . . . . . . . . . . . . . . . . . . . . . . . . . . 2159.1.2 High availability characteristics and actions . . . . . . . . . . . . . . . . . . 2159.1.3 Recovery . . . . . . . . . . . . . . . . . . . . . . . . . . . . . . . . . . . . . . . . . . . . . 216
vi High Availability in WebSphere Messaging Solutions
9.2 WebSphere MQ configuration . . . . . . . . . . . . . . . . . . . . . . . . . . . . . . . . . 2169.3 CICS definitions. . . . . . . . . . . . . . . . . . . . . . . . . . . . . . . . . . . . . . . . . . . . 2179.4 Testing the topology . . . . . . . . . . . . . . . . . . . . . . . . . . . . . . . . . . . . . . . . 219
9.4.1 Test cases and results . . . . . . . . . . . . . . . . . . . . . . . . . . . . . . . . . . 2199.4.2 Test case 1: Automatic queue manager switch . . . . . . . . . . . . . . . 2209.4.3 Test case 2: No automatic queue manager switch . . . . . . . . . . . . . 222
Part 3. Appendixes . . . . . . . . . . . . . . . . . . . . . . . . . . . . . . . . . . . . . . . . . . . . . . . . . . . . . . . . 225
Appendix A. QPUB Transaction . . . . . . . . . . . . . . . . . . . . . . . . . . . . . . . . . 227QPUBCBL program . . . . . . . . . . . . . . . . . . . . . . . . . . . . . . . . . . . . . . . . . . . . 228
Trigger message . . . . . . . . . . . . . . . . . . . . . . . . . . . . . . . . . . . . . . . . . . . . 228Publish control message . . . . . . . . . . . . . . . . . . . . . . . . . . . . . . . . . . . . . . 229Status message . . . . . . . . . . . . . . . . . . . . . . . . . . . . . . . . . . . . . . . . . . . . 229QPUBCBL flow . . . . . . . . . . . . . . . . . . . . . . . . . . . . . . . . . . . . . . . . . . . . . 230
CICS definitions . . . . . . . . . . . . . . . . . . . . . . . . . . . . . . . . . . . . . . . . . . . . . . . 230QPUB transaction definition . . . . . . . . . . . . . . . . . . . . . . . . . . . . . . . . . . . 231QPUBCBL program definition . . . . . . . . . . . . . . . . . . . . . . . . . . . . . . . . . . 232Installing the definitions. . . . . . . . . . . . . . . . . . . . . . . . . . . . . . . . . . . . . . . 232
WebSphere MQ definitions . . . . . . . . . . . . . . . . . . . . . . . . . . . . . . . . . . . . . . 233Process definition . . . . . . . . . . . . . . . . . . . . . . . . . . . . . . . . . . . . . . . . . . . 234Queue definitions . . . . . . . . . . . . . . . . . . . . . . . . . . . . . . . . . . . . . . . . . . . 234Topic definitions . . . . . . . . . . . . . . . . . . . . . . . . . . . . . . . . . . . . . . . . . . . . 236
Sample data . . . . . . . . . . . . . . . . . . . . . . . . . . . . . . . . . . . . . . . . . . . . . . . . . . 236QPUBCBL program code . . . . . . . . . . . . . . . . . . . . . . . . . . . . . . . . . . . . . . . . 237
Related publications . . . . . . . . . . . . . . . . . . . . . . . . . . . . . . . . . . . . . . . . . . 247IBM Redbooks . . . . . . . . . . . . . . . . . . . . . . . . . . . . . . . . . . . . . . . . . . . . . . . . 247Other publications . . . . . . . . . . . . . . . . . . . . . . . . . . . . . . . . . . . . . . . . . . . . . 247Online resources . . . . . . . . . . . . . . . . . . . . . . . . . . . . . . . . . . . . . . . . . . . . . . 248How to get Redbooks . . . . . . . . . . . . . . . . . . . . . . . . . . . . . . . . . . . . . . . . . . . 248Help from IBM . . . . . . . . . . . . . . . . . . . . . . . . . . . . . . . . . . . . . . . . . . . . . . . . 248
Contents vii

viii High Availability in WebSphere Messaging Solutions

Notices
This information was developed for products and services offered in the U.S.A.
IBM may not offer the products, services, or features discussed in this document in other countries. Consult your local IBM representative for information on the products and services currently available in your area. Any reference to an IBM product, program, or service is not intended to state or imply that only that IBM product, program, or service may be used. Any functionally equivalent product, program, or service that does not infringe any IBM intellectual property right may be used instead. However, it is the user's responsibility to evaluate and verify the operation of any non-IBM product, program, or service.
IBM may have patents or pending patent applications covering subject matter described in this document. The furnishing of this document does not give you any license to these patents. You can send license inquiries, in writing, to: IBM Director of Licensing, IBM Corporation, North Castle Drive, Armonk, NY 10504-1785 U.S.A.
The following paragraph does not apply to the United Kingdom or any other country where such provisions are inconsistent with local law: INTERNATIONAL BUSINESS MACHINES CORPORATION PROVIDES THIS PUBLICATION "AS IS" WITHOUT WARRANTY OF ANY KIND, EITHER EXPRESS OR IMPLIED, INCLUDING, BUT NOT LIMITED TO, THE IMPLIED WARRANTIES OF NON-INFRINGEMENT, MERCHANTABILITY OR FITNESS FOR A PARTICULAR PURPOSE. Some states do not allow disclaimer of express or implied warranties in certain transactions, therefore, this statement may not apply to you.
This information could include technical inaccuracies or typographical errors. Changes are periodically made to the information herein; these changes will be incorporated in new editions of the publication. IBM may make improvements and/or changes in the product(s) and/or the program(s) described in this publication at any time without notice.
Any references in this information to non-IBM Web sites are provided for convenience only and do not in any manner serve as an endorsement of those Web sites. The materials at those Web sites are not part of the materials for this IBM product and use of those Web sites is at your own risk.
IBM may use or distribute any of the information you supply in any way it believes appropriate without incurring any obligation to you.
Information concerning non-IBM products was obtained from the suppliers of those products, their published announcements or other publicly available sources. IBM has not tested those products and cannot confirm the accuracy of performance, compatibility or any other claims related to non-IBM products. Questions on the capabilities of non-IBM products should be addressed to the suppliers of those products.
This information contains examples of data and reports used in daily business operations. To illustrate them as completely as possible, the examples include the names of individuals, companies, brands, and products. All of these names are fictitious and any similarity to the names and addresses used by an actual business enterprise is entirely coincidental.
COPYRIGHT LICENSE:
This information contains sample application programs in source language, which illustrate programming techniques on various operating platforms. You may copy, modify, and distribute these sample programs in any form without payment to IBM, for the purposes of developing, using, marketing or distributing application programs conforming to the application programming interface for the operating platform for which the sample programs are written. These examples have not been thoroughly tested under all conditions. IBM, therefore, cannot guarantee or imply reliability, serviceability, or function of these programs.
© Copyright IBM Corp. 2010. All rights reserved. ix

Trademarks
IBM, the IBM logo, and ibm.com are trademarks or registered trademarks of International Business Machines Corporation in the United States, other countries, or both. These and other IBM trademarked terms are marked on their first occurrence in this information with the appropriate symbol (® or ™), indicating US registered or common law trademarks owned by IBM at the time this information was published. Such trademarks may also be registered or common law trademarks in other countries. A current list of IBM trademarks is available on the Web at http://www.ibm.com/legal/copytrade.shtml
The following terms are trademarks of the International Business Machines Corporation in the United States, other countries, or both:
AIX®AppScan®CICS Connection®CICS®DataPower device®DataPower®DB2®developerWorks®HACMP™
IBM®OMEGAMON®Parallel Sysplex®PowerHA™POWER®Rational®Redbooks®Redpaper™Redbooks (logo) ®
Solid®System Storage™System z®Tivoli®TotalStorage®WebSphere®z/OS®
The following terms are trademarks of other companies:
ITIL is a registered trademark, and a registered community trademark of the Office of Government Commerce, and is registered in the U.S. Patent and Trademark Office.
Java, and all Java-based trademarks are trademarks of Sun Microsystems, Inc. in the United States, other countries, or both.
Other company, product, or service names may be trademarks or service marks of others.
x High Availability in WebSphere Messaging Solutions
Preface
This IBM® Redbooks® publication is for anyone needing to increase WebSphere® messaging availability, especially people interested in the new capabilities of WebSphere MQ and WebSphere Message Broker. It discusses and demonstrates solutions to provide high availability for WebSphere Messaging solutions. For the distributed platforms, this ranges from the traditional PowerHA™ for AIX® to the new WebSphere MQ multi-instance queue managers and WebSphere Message Broker multi-instance brokers. For the appliance users, we included solutions for WebSphere DataPower®. For enterprises that need continuous availability of WebSphere MQ messages, MQ Queue Sharing Groups and the CICS® Group Attach features are demonstrated.
The book includes guidance on HA options, such as when you might need PowerHA (or a similar solution for your platform), when the multi-instance features work for your applications, and when duplexing the coupling facility structures might be appropriate.
The team who wrote this book
This book was produced by a team of specialists from around the world working at the International Technical Support Organization, Raleigh Center.
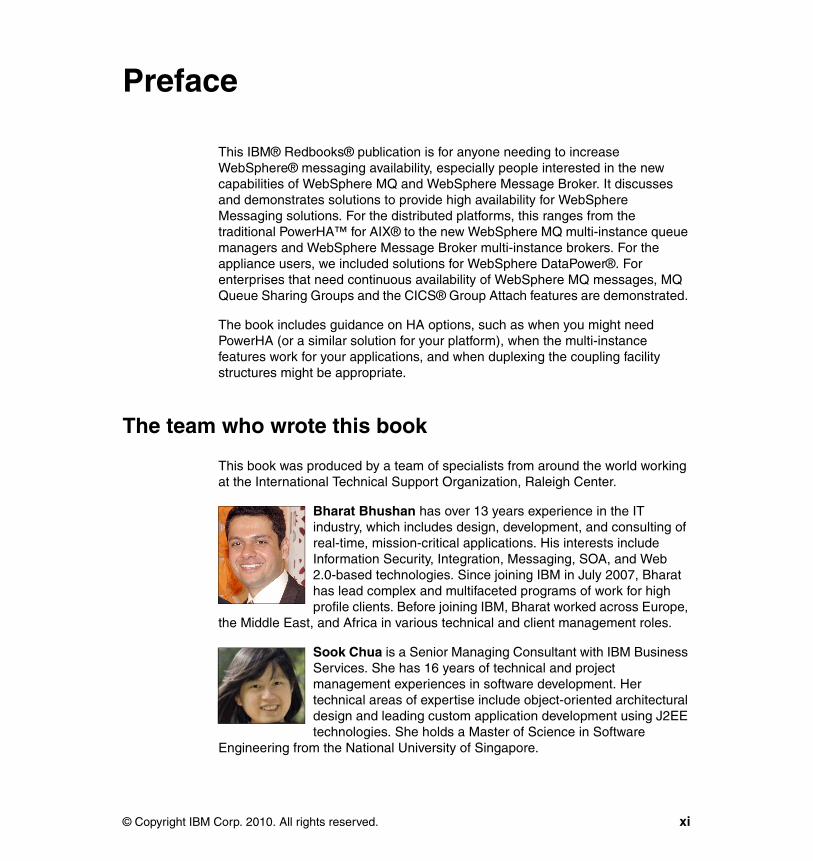
Bharat Bhushan has over 13 years experience in the IT industry, which includes design, development, and consulting of real-time, mission-critical applications. His interests include Information Security, Integration, Messaging, SOA, and Web 2.0-based technologies. Since joining IBM in July 2007, Bharat has lead complex and multifaceted programs of work for high profile clients. Before joining IBM, Bharat worked across Europe,
the Middle East, and Africa in various technical and client management roles.
Sook Chua is a Senior Managing Consultant with IBM Business Services. She has 16 years of technical and project management experiences in software development. Her technical areas of expertise include object-oriented architectural design and leading custom application development using J2EE technologies. She holds a Master of Science in Software
Engineering from the National University of Singapore.
© Copyright IBM Corp. 2010. All rights reserved. xi

Carolyn Elkins is an IT Specialist for Advanced Technical Skills in the United States, with an emphasis on WebSphere MQ. WebSphere Message Broker and WebSphere MQ-FTE on System z® hardware. She has more than 25 years of experience in all phases of software design, development, testing, and operations. Lyn came to IBM as a professional hire, having
experience at other software vendors and production environments. She has a degree in Computer Science from East Tennessee State University.
Mark Scicluna is an IT Specialist in the Application Management Services Practice in Australia. He has 14 years of experience in the analysis, design, and implementation of software solutions, primarily in the integration of distributed systems. He has a broad range of expertise including middleware technologies, Java/J2EE, XML, and Web Services
but is primarily focussed on WebSphere MQ and WebSphere Message Broker. He holds a degree in Mathematical and Computer Science at the University of Adelaide.
Wei-Dong Yang is an IT Integration Architect in Germany. He has worked in the IT industry for more than10 years.Since 2005, he has focused on WebSphere MQ and WebSphere Message Broker. His areas of expertise include solutions design and integration with WebSphere messaging products, HACMP™ in an AIX environment, and system implementation using WebSphere Transformation Extender. He holds a Ph.D. in
Solid® State Physics from the University of Augsburg, Germany.
Thanks to the project leader for this project:
Carla SadtlerInternational Technical Support Organization, Raleigh Center
Thanks to the following people for their contributions to this project:
Margaret TicknorRich ConwayInternational Technical Support Organization, Raleigh Center
Volker DaeschlerHans EisenmannIBM Germany
Rob ConveryTrevor DolbyAnthony O'Dowd
xii High Availability in WebSphere Messaging Solutions

Mark E TaylorAndrew SchofieldJonathan RumseyBrian StewartIBM UK
Now you can become a published author, too!
Here's an opportunity to spotlight your skills, grow your career, and become a published author - all at the same time! Join an ITSO residency project and help write a book in your area of expertise, while honing your experience using leading-edge technologies. Your efforts will help to increase product acceptance and customer satisfaction, as you expand your network of technical contacts and relationships. Residencies run from two to six weeks in length, and you can participate either in person or as a remote resident working from your home base.
Find out more about the residency program, browse the residency index, and apply online at:
ibm.com/redbooks/residencies.html
Comments welcome
Your comments are important to us!
We want our books to be as helpful as possible. Send us your comments about this book or other IBM Redbooks publications in one of the following ways:
� Use the online Contact us review Redbooks form found at:
ibm.com/redbooks
� Send your comments in an e-mail to:
� Mail your comments to:
IBM Corporation, International Technical Support OrganizationDept. HYTD Mail Station P0992455 South RoadPoughkeepsie, NY 12601-5400
Preface xiii
Stay connected to IBM Redbooks
� Find us on Facebook:
http://www.facebook.com/pages/IBM-Redbooks/178023492563?ref=ts
� Follow us on twitter:
http://twitter.com/ibmredbooks
� Look for us on LinkedIn:
http://www.linkedin.com/groups?home=&gid=2130806
� Explore new Redbooks publications, residencies, and workshops with the IBM Redbooks weekly newsletter:
https://www.redbooks.ibm.com/Redbooks.nsf/subscribe?OpenForm
� Stay current on recent Redbooks publications with RSS Feeds:
http://www.redbooks.ibm.com/rss.html
xiv High Availability in WebSphere Messaging Solutions
Part 1 High availability concepts
This part provides information about high availability concepts and includes an overview of techniques and products that can be used to achieve high availability.
Part 1
© Copyright IBM Corp. 2010. All rights reserved. 1

2 High Availability in WebSphere Messaging Solutions
Chapter 1. Introduction to availabilityAt one time or another, most of us have experienced an ATM service not being available to dispense cash or an online service being unavailable for access due to maintenance. Or a time when a customer service representative asks you to call back later because their system is down. Or you click a button and receive a 500 Internal Server Error response.
These scenarios are typical system outages. The ATM and online service examples are typically planned outages intended for maintenance work. These outages are usually scheduled at quiet times with low activity for a predetermined amount of time. The customer service representative (CSR) and transaction error examples, however, are unplanned outages due to hardware or software failures. Occurrences during peak time have significant impacts and serious consequences where critical systems are involved.
As IT becomes more pervasive in businesses and our daily lives, the impact of downtime is increasingly significant. Outages affect productivity, create inconveniences, and result in loss of business. Increased dependence on IT increases needs for highly available systems. Globalization of business places a new demand for systems to be highly available and continuously operational. This 24X7 availability calls for the elimination of unplanned and planned outages.
This chapter begins with definitions of system availability terms followed by causes of unplanned outages. It includes a discussion on high availability measurement, failover strategies, and software and hardware redundancies. The chapter concludes with a discussion on factors to consider in the design of a high availability system.
1
© Copyright IBM Corp. 2010. All rights reserved. 3
1.1 System availability terms and definitions
In this section, we define high availability and continuous availability as well as discussing the differences between these two availability concepts.
This IBM Redbooks publication focuses on high availability for IBM WebSphere Messaging products.
1.1.1 Availability
Availability in this context is a measure of the accessibility of a system or application, not including scheduled downtime. It can be measured as a ratio of expected system up-time relative to the total system time, which includes uptime and recovery time when the system is down. The following formula illustrates this concept:
A = [MTBF/(MTBF + MTTR)] x 100%
The following definitions apply to terms in the this equation:
� MTBF: Mean Time Between Failure. This is the average elapsed time between failures
� MTTR: Mean Time To Recover, This is the average time required to recover from a failure
1.1.2 High availability
High availability refers to the ability of a system or component to be operational and accessible when required for use for a specified period of time. The system or component is equipped to handle faults in an unplanned outage gracefully to continue providing the intended functionality.
1.1.3 Continuous availability
Continuous availability refers to the ability of a system or component to be operational and accessible when required for use at all times. The system or component is designed such that a user experiences zero downtime.
Although high availability compensates for unplanned outages, continuous availability handles both planned and unplanned outages. Therefore, continuous availability extends high availability with continuous operation.
4 High Availability in WebSphere Messaging Solutions
1.2 Causes of downtime
System downtime results from planned or unplanned events. Planned downtime can often account for a significant amount of the total downtime. The optimal situation is for systems to be in continuous operation without scheduled down time for maintenance work. However, a long running system is more prone to failures that result in unplanned outages. Such unplanned outages are costly, with significant impacts. Naturally, a user wants to reduce or eliminate these outages.
Studies show that software failures and human errors are the major causes of unplanned outages. Other causes include hardware or infrastructure failures, site disasters, and natural calamities.
The key to implementing a high availability system is to identify and eliminate single points of failure through redundancies, clustering, and failover mechanisms.
1.3 Availability classes
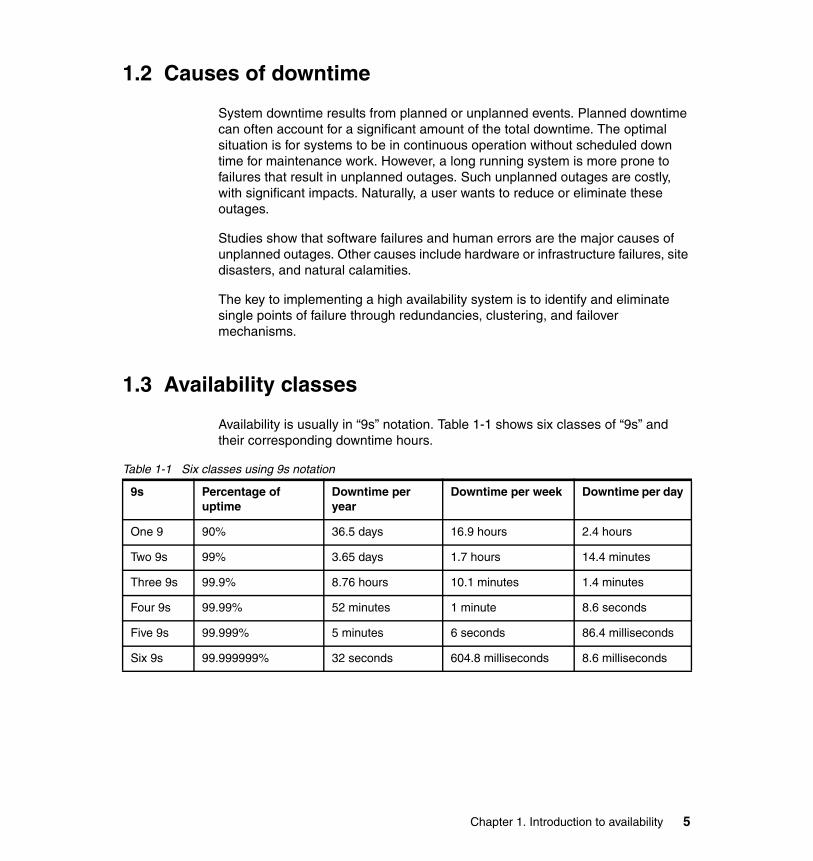
Availability is usually in “9s” notation. Table 1-1 shows six classes of “9s” and their corresponding downtime hours.
Table 1-1 Six classes using 9s notation
9s Percentage of uptime
Downtime per year
Downtime per week Downtime per day
One 9 90% 36.5 days 16.9 hours 2.4 hours
Two 9s 99% 3.65 days 1.7 hours 14.4 minutes
Three 9s 99.9% 8.76 hours 10.1 minutes 1.4 minutes
Four 9s 99.99% 52 minutes 1 minute 8.6 seconds
Five 9s 99.999% 5 minutes 6 seconds 86.4 milliseconds
Six 9s 99.999999% 32 seconds 604.8 milliseconds 8.6 milliseconds
Chapter 1. Introduction to availability 5

A 99% highly available system has a 1% of downtime in its useful life. A more accurate translation of downtime depends upon the system’s scheduled operational hours. For example:
� System A is scheduled for 24 hours per day, 365 days per year. A 1% downtime equals 87.6 hours.
� System B is scheduled for 8 hours per day, 5 days per week. A 1% downtime equals 20.8 hours.
These hours, however, do not indicate system’s maximum downtime at one time and frequency of downtime.
Continuing with these examples, we can calculate the potential downtime in terms of days:
� System A’s 87.6 hours of downtime is equal to 3.65 days of unavailability at one time.
� System B’s 20.8 hours of downtime is equal to 0.87 days of unavailability at one time.
Depending upon the business nature, these maximum downtime durations might not be acceptable.
Another important parameter is the frequency of downtime. Consider System C, which is allowed 2.4 hours downtime per day. If the system is down on average for one minute, this means it can go down 144 times a day. Reliability of this system can be considered questionable. As you can see, high availability does not imply reliability.
Understanding these distinctions is important when designing a system that satisfies agreements reached between clients and providers with regard to availability. As companies move towards a service-oriented architecture (SOA), the availability aspect of these service level agreements becomes critical. The ideal service is available to business processes at all times.
6 High Availability in WebSphere Messaging Solutions
1.4 Redundancy
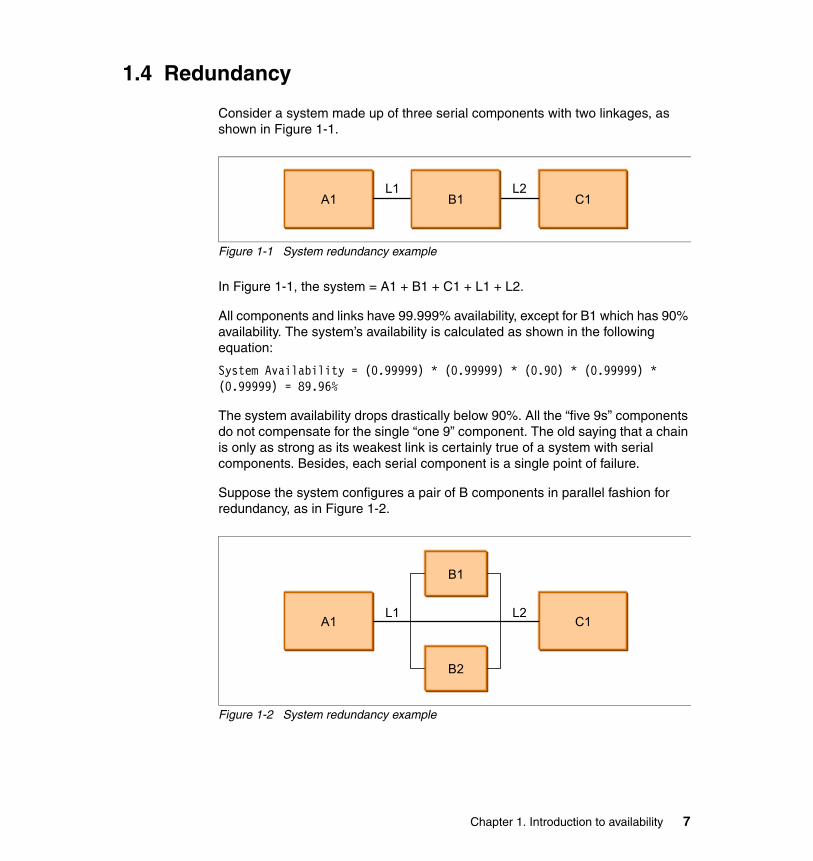
Consider a system made up of three serial components with two linkages, as shown in Figure 1-1.
Figure 1-1 System redundancy example
In Figure 1-1, the system = A1 + B1 + C1 + L1 + L2.
All components and links have 99.999% availability, except for B1 which has 90% availability. The system’s availability is calculated as shown in the following equation:
System Availability = (0.99999) * (0.99999) * (0.90) * (0.99999) * (0.99999) = 89.96%
The system availability drops drastically below 90%. All the “five 9s” components do not compensate for the single “one 9” component. The old saying that a chain is only as strong as its weakest link is certainly true of a system with serial components. Besides, each serial component is a single point of failure.
Suppose the system configures a pair of B components in parallel fashion for redundancy, as in Figure 1-2.
Figure 1-2 System redundancy example
A1L1
C1B1L2
A1L1
C1
B1
L2
B2
Chapter 1. Introduction to availability 7

The availability of this parallel configuration is as shown in the following equation:
Availability of B1/B2 = 1 – [(1-0.90) * (1-0.90)] = 0.99
With the parallel configuration, the system availability is recalculated as shown in the following equation:
System Availability = (0.99999) * (0.99999) * (0.99) * (0.99999) * (0.99999) = 98.99%
Redundancy eliminates single points of failure and increases availability. It is a key design consideration in a highly available system. 1.5, “Failover strategies” on page 8 explores the failover strategies available in redundancy.
1.5 Failover strategies
Redundancies mask system and component failures from users. The transparency of failure masking depends upon the following failover strategies:
� Cold standby
In this failover strategy, the primary component runs actively while the secondary or backup component stays dormant. When the primary component fails, the secondary component is activated to assume an active role. The interruption is visible to users.
� Warm standby
In this failover strategy, the primary component runs actively with the secondary or backup component running without active participation in workload management. The secondary component receives frequent data updates from the primary component, which means that there are times when both components are not synchronized. When the primary component fails, the secondary component assumes an active role. Because the secondary component has been running passively with partial data, the fail over is faster than a cold standby, with minimal interruption to users.
� Hot standby
In this failover strategy, the primary and secondary components are actively running as a single, unified system. Active data replication happens between the primary and secondary components. When the primary component fails, the secondary component continues functioning without interruption to users.
Each of these strategies can be applied to hardware and software clustering.
8 High Availability in WebSphere Messaging Solutions
1.6 Software clustering
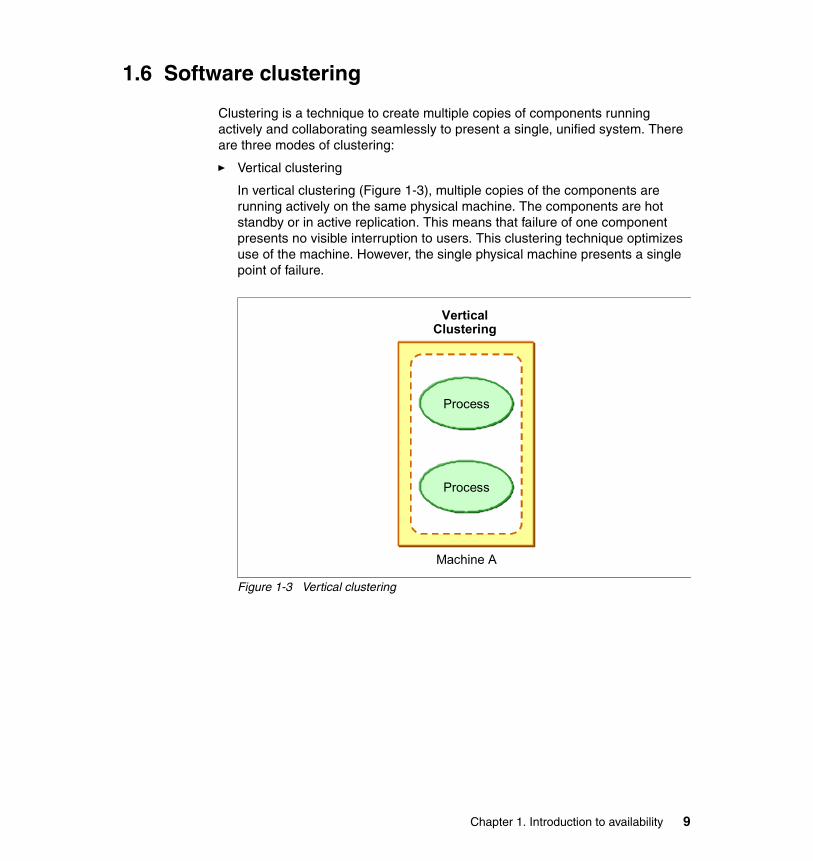
Clustering is a technique to create multiple copies of components running actively and collaborating seamlessly to present a single, unified system. There are three modes of clustering:
� Vertical clustering
In vertical clustering (Figure 1-3), multiple copies of the components are running actively on the same physical machine. The components are hot standby or in active replication. This means that failure of one component presents no visible interruption to users. This clustering technique optimizes use of the machine. However, the single physical machine presents a single point of failure.
Figure 1-3 Vertical clustering
VerticalClustering
Machine A
Process
Process
Chapter 1. Introduction to availability 9

� Horizontal clustering
In horizontal clustering (Figure 1-4), components are created on multiple physical machines. This clustering mode achieves similar software redundancy in vertical clustering with the additional benefit of hardware redundancy.
Figure 1-4 Horizontal clustering
� Vertical and horizontal clustering
Combining vertical and horizontal clustering techniques maximizes use of individual physical machines to achieve high availability, performance throughput and scalability. See Figure 1-5.
Figure 1-5 Vertical and horizontal clustering
HorizontalClustering
Machine A Machine B
Process Process
HorizontalClustering
VerticalClustering
Machine A Machine B
Process Process
Process Process
10 High Availability in WebSphere Messaging Solutions
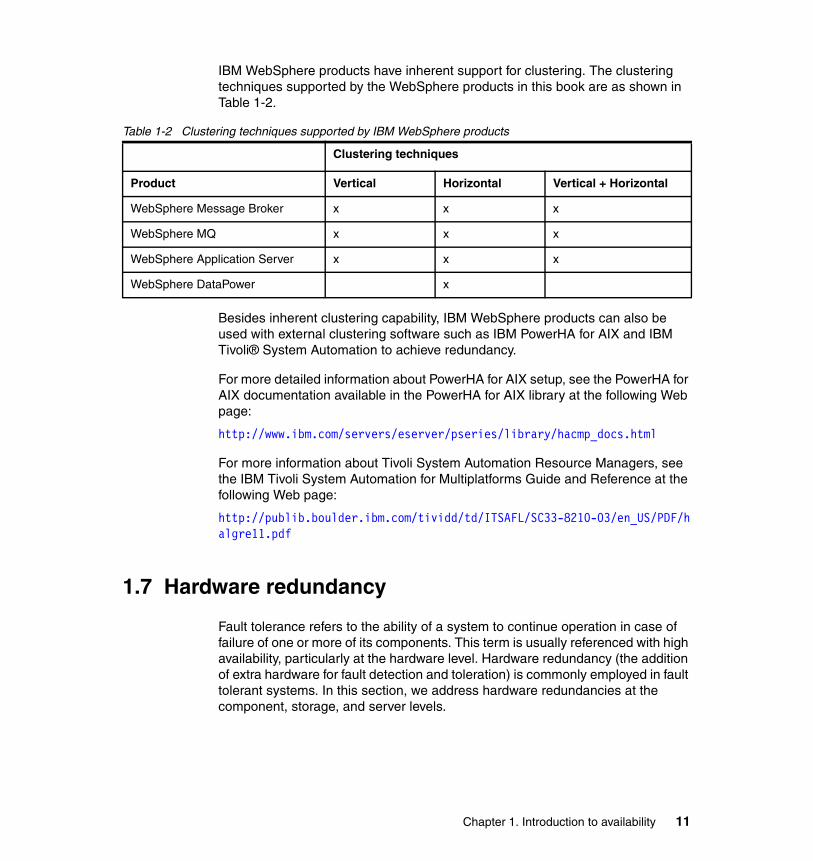
IBM WebSphere products have inherent support for clustering. The clustering techniques supported by the WebSphere products in this book are as shown in Table 1-2.
Table 1-2 Clustering techniques supported by IBM WebSphere products
Besides inherent clustering capability, IBM WebSphere products can also be used with external clustering software such as IBM PowerHA for AIX and IBM Tivoli® System Automation to achieve redundancy.
For more detailed information about PowerHA for AIX setup, see the PowerHA for AIX documentation available in the PowerHA for AIX library at the following Web page:
http://www.ibm.com/servers/eserver/pseries/library/hacmp_docs.html
For more information about Tivoli System Automation Resource Managers, see the IBM Tivoli System Automation for Multiplatforms Guide and Reference at the following Web page:
http://publib.boulder.ibm.com/tividd/td/ITSAFL/SC33-8210-03/en_US/PDF/halgre11.pdf
1.7 Hardware redundancy
Fault tolerance refers to the ability of a system to continue operation in case of failure of one or more of its components. This term is usually referenced with high availability, particularly at the hardware level. Hardware redundancy (the addition of extra hardware for fault detection and toleration) is commonly employed in fault tolerant systems. In this section, we address hardware redundancies at the component, storage, and server levels.
Clustering techniques
Product Vertical Horizontal Vertical + Horizontal
WebSphere Message Broker x x x
WebSphere MQ x x x
WebSphere Application Server x x x
WebSphere DataPower x
Chapter 1. Introduction to availability 11
1.7.1 Component redundancy
Component-level devices include, but are not limited to, processors, power supplies, network equipment, and so forth. The processor is the heart of an IT system and a failure constitutes a “machine stops” situation. Resilience can be achieved through multiple processors (SMP) and advanced coupled systems such as IBM Parallel Sysplex®.
An uninterruptible power supply (UPS) protects a system against power fluctuations and main power failure. It continues to supply power from a few minutes to several hours during a power outage. This increases system availability with minimal disruption to users.
Redundancies for network equipment is made through duplication. A backbone network can also be used to increase protection against hardware failures. The backbone network eliminates single point of failure by providing multiple, alternative traffic paths for communication. A redundant backbone further enhances high availability.
1.7.2 Storage redundancy
A system is rendered unusable without data, though it might be highly available or continuously operational. A comprehensive design for storage redundancy should be considered with the system’s data flows, data components, and data availability.
At a high level, storage redundancy can be achieved through the following approaches:
� Disk mirroring and duplexing � Storage Area Network (SAN)� Redundant Arrays of Inexpensive Disks (RAID) � Duplicate data centers to avoid natural disasters.
IBM products such as IBM TotalStorage®, IBM System Storage™ provide solution offerings to develop resilient and secure infrastructures for data storage.
12 High Availability in WebSphere Messaging Solutions
1.7.3 Server redundancy
Server redundancy through hardware clustering mitigates hardware and operating system-level failures. There are generally two modes of hardware clustering:
� Active/active (also known as high availability clusters or HA clusters)
A HA cluster consists of redundant computer nodes that are used to provide service when the primary system component fails. HA clustering uses heartbeats to monitor the health and status of each computer node in the cluster. When a failure occurs, the application is restarted on the backup node automatically, a process known failover. The failover procedure generally involves reassignment of the failed server IP-Address to the backup server, setting file system access, and synchronization of state with the failed server before restarting the application on the backup server.
There are extensive commercial implementations of HA cluster technologies, (such as IBM PowerHA for AIX) and those that are inherent with IBM Parallel Sysplex.
� Active/passive (also known as load balancing clusters)
In a load balancing cluster, multiple, homogeneous computer nodes are linked to share computational workload. The cluster provides a logical view of a single virtual machine. It behaves like an HA cluster except that all computer nodes in the cluster are actively participating in the system’s workload. When a component fails, there is no failover process. Instead, the request is routed to a node in the cluster.
1.8 Cost of high availability
Enterprises increasingly demand systems and applications be highly available. Globalization of businesses has evolved this need into continuous availability. When enterprises invest in achieving high availability, the focus is on increasing redundancy in the infrastructure. However, component redundancy is only one variable in the equation. As mentioned in 1.2, “Causes of downtime” on page 5, software failures and human errors are the major causes of unplanned downtime. These can be mitigated through a series of IT management processes, such as the following examples:
� Change management
This process improves system quality through better planning, testing, evaluating change impact, coordinating and scheduling of application, and IT infrastructure changes.
Chapter 1. Introduction to availability 13
� Problem management
This process facilitates problem logging, expedites problem identification, isolation, escalation, root cause determination with resolution, and prevention of future occurrence.
� Configuration management
This process is a comprehensive understanding of relationships among IT infrastructure, applications, and business processes. Configuration management allows for a better understanding of a change's impact and facilitates problem identification and resolution.
� Performance management
This process tracks end-to-end system’s health and performance. This knowledge provides faster turnaround time in problem diagnosis and resolution, thus reducing downtime.
� Capacity planning
This process anticipates future IT resource needs to avoid shortages and satisfy its service-level objectives.
� Availability Management
This process collects and correlates information from networks, systems, and applications to be proactive in identifying potential problems and fix them to avoid failures and downtime.
� Help Desk Support system
This process provides a mechanism for users to seek assistance with system usage issues, problem reporting, problem tracking, and issue resolution.
� Training
This process equips IT operational team with the skills and knowledge required to support systems. Operational team members can back up each other. Otherwise, reliance on a single resource constitutes a single point of failure.
Operational considerations are described in greater detail in Chapter 4, “Operational considerations” on page 55.
The costs for highly available systems include component redundancies and IT management processes. The cost increases with higher “9s”. It is important to understand the business needs and the impact of downtime to the business to balance the highly available solution with the investment.
14 High Availability in WebSphere Messaging Solutions
Chapter 2. Application design for availability
This chapter discusses aspects of application and infrastructure design that can affect high availability. The reader can then make an informed judgment on choosing a certain design, configuration, or deployment model to ensure the systems deliver their availability requirements.
2
© Copyright IBM Corp. 2010. All rights reserved. 15

2.1 Introduction
In Chapter 1, “Introduction to availability” on page 3, we introduced availability concepts, defined availability, and looked at the distinction between High Availability and Continuous Availability. In this chapter we expand on these concepts and consider design considerations for availability.
When designing a solution we need to consider the availability requirements of the system. This typically is derived by the business stakeholders after assessing the value of the service to the business, the impact on the business of an outage, legal or statutory requirements, and the impact on customers of an outage or poor quality of service.
Performance, quality, and availability criteria are documented as non-functional requirements (NFRs). NFRs include those attributes of an application other than its core function. The following list details attributes that might affect the availability of an application:
� Security � Performance � Maintainability� Scalability� Compliance
Well-documented non-functional requirements are essential to the availability of the application, because they are key drivers for architecture and design decisions.
If performance or scalability requirements are not clearly understood and well-defined, there is a risk that the solution might not be able to handle the volume of requests. This might result in poor quality of service, slow response, or (in the worst case) an application outage.
In the rest of this chapter we expand on the concepts discussed in Chapter 1, including redundancy, workload balancing, failover, and message design and how these concepts impact high availability.
16 High Availability in WebSphere Messaging Solutions

2.2 Message design and high availability
This section discusses considerations for message design with a focus on high availability. In particular, we discuss the impact of high availability designs on the following concepts:
� Synchronous versus asynchronous messaging. See page 17.� Affinity. See page 18.� Sequencing. See page 21.� Transactionality. See page 23.
2.2.1 Synchronous versus asynchronous messaging
A synchronous request-reply pattern involves services that respond over the same network socket on which the request was received. The receiving application keeps the network socket open while it processes the request and when the request is ready, the receiving application responds using the same network socket.
The calling application might time out if no response is received. In this situation the network socket is closed at each end and might be reused by other processes. Applications must resend the original request as required.
The advantage of synchronous processing is its simplicity, as there is no need to have special programming to handle asynchronous responses. This is shown in Figure 2-1. Requests that receive a response within the timeout period are processed. Any responses received after the timeout must be re-sent.
Figure 2-1 Synchronous messaging
Asynchronous messaging, on the other hand is a mechanism in which a user might submit a request but does not require an immediate response. The recipient system usually acknowledges receipt of the request message with a protocol-level acknowledgement that can be sent synchronously.
Service
User
Synchronous Request – Response pattern
Tim
e
Timeout
Application
Chapter 2. Application design for availability 17
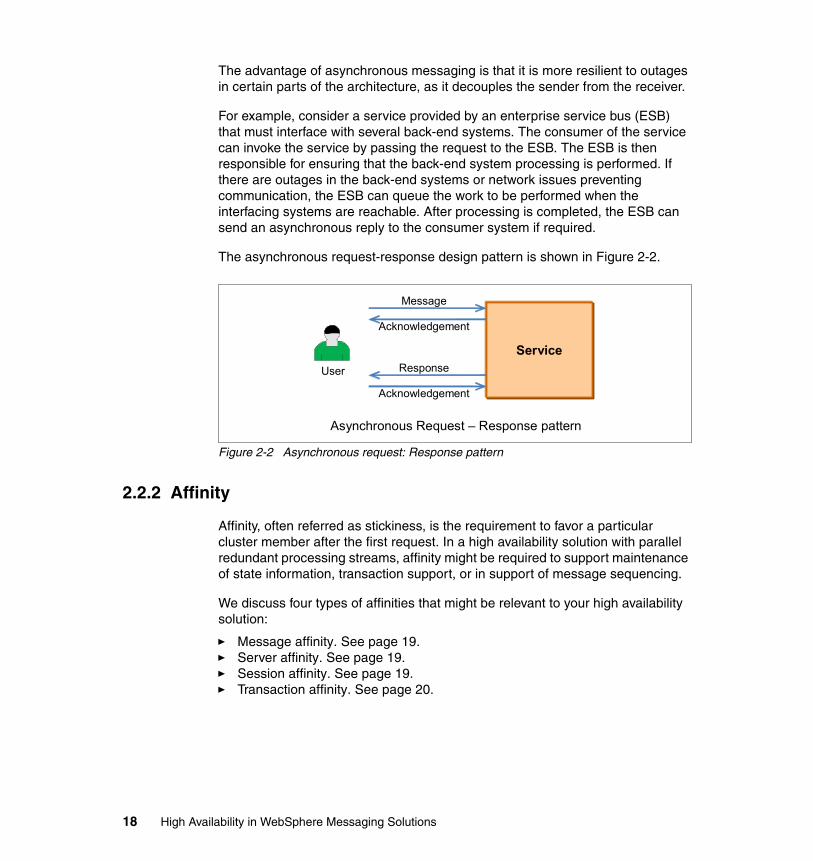
The advantage of asynchronous messaging is that it is more resilient to outages in certain parts of the architecture, as it decouples the sender from the receiver.
For example, consider a service provided by an enterprise service bus (ESB) that must interface with several back-end systems. The consumer of the service can invoke the service by passing the request to the ESB. The ESB is then responsible for ensuring that the back-end system processing is performed. If there are outages in the back-end systems or network issues preventing communication, the ESB can queue the work to be performed when the interfacing systems are reachable. After processing is completed, the ESB can send an asynchronous reply to the consumer system if required.
The asynchronous request-response design pattern is shown in Figure 2-2.
Figure 2-2 Asynchronous request: Response pattern
2.2.2 Affinity
Affinity, often referred as stickiness, is the requirement to favor a particular cluster member after the first request. In a high availability solution with parallel redundant processing streams, affinity might be required to support maintenance of state information, transaction support, or in support of message sequencing.
We discuss four types of affinities that might be relevant to your high availability solution:
� Message affinity. See page 19.� Server affinity. See page 19.� Session affinity. See page 19.� Transaction affinity. See page 20.
Service
User
Message
Acknowledgement
Response
Acknowledgement
Asynchronous Request – Response pattern
18 High Availability in WebSphere Messaging Solutions

Message affinityWhen working with WebSphere MQ clusters with multiple definitions for the same queue manager, it is important to be aware of whether the application has any relationships between the messages that require message affinity. In clustered environments a message can be routed to any queue manager that has an instance of the queue.
Where possible, the application should be altered to remove the reliance on message affinities. This can be done, for example, by passing state information within the message body or by storing state information in persistent storage (such as a relational database). This improves the messaging applications scalability and availability. A group of related messages can lock resources at the destination queue manager until all of the messages have arrived and this has the effect of blocking the applications.
If it is not possible to remove message affinities, there are a number of techniques available in WebSphere MQ that support message affinity:
� Specify the remote queue name and the queue manager on the MQOPEN call.
� Use the reply-to queue manager field to specify the queue manager.
� Specify the MQOO_BIND_ON_OPEN option in the MQOPEN call.
For more information about these options see the WebSphere MQ Information Center at the following Web page:
http://publib.boulder.ibm.com/infocenter/wmqv7/v7r0/index.jsp
Server affinityServer affinity allows a load balancer to remember the server selected for a specific client at the initial request. Subsequent requests are routed to the same server. Although this might sound like it defeats the purpose of a load balancer, server affinity is essential to preserve state across distinct connections from a client (such as a stateful Web application).
To prevent single points of failure, redundancies of hardware load balancers and downstream servers are required. Server affinity configuration in a load balancer must be considered with session affinity for failover.
Session affinitySession affinity is the preference of one server over others, by the load balancing mechanism in recognition of an existing session. Subsequent requests from the same client always get routed to the same server. This is typical of a Web server plug-in that always attempts to route a request that contains session information to the application server that processed the previous requests. If the preferred
Chapter 2. Application design for availability 19
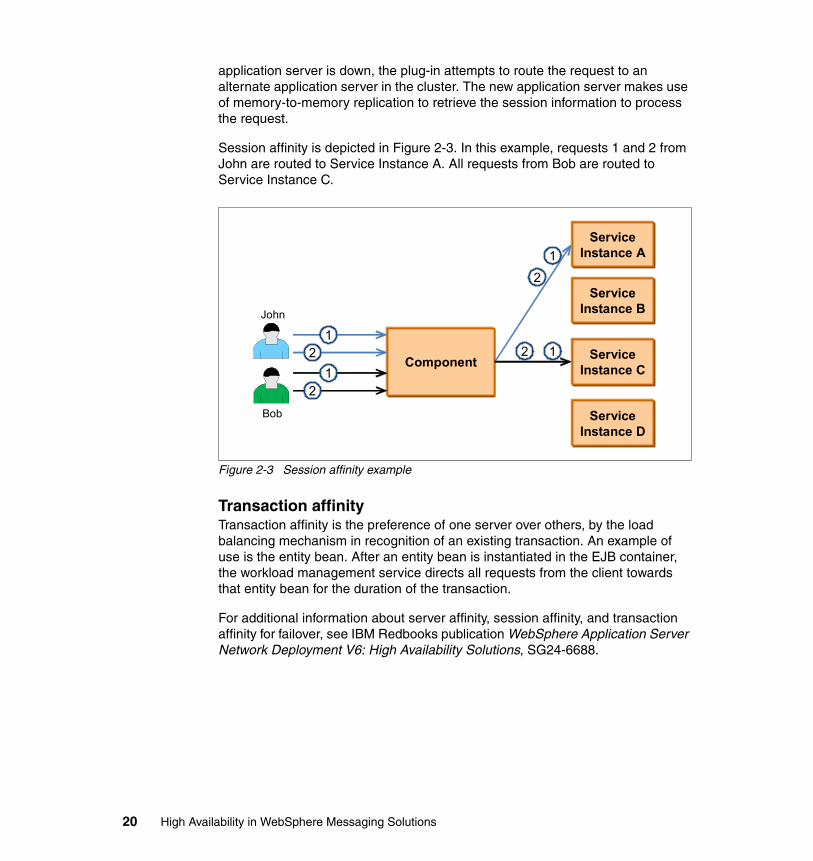
application server is down, the plug-in attempts to route the request to an alternate application server in the cluster. The new application server makes use of memory-to-memory replication to retrieve the session information to process the request.
Session affinity is depicted in Figure 2-3. In this example, requests 1 and 2 from John are routed to Service Instance A. All requests from Bob are routed to Service Instance C.
Figure 2-3 Session affinity example
Transaction affinityTransaction affinity is the preference of one server over others, by the load balancing mechanism in recognition of an existing transaction. An example of use is the entity bean. After an entity bean is instantiated in the EJB container, the workload management service directs all requests from the client towards that entity bean for the duration of the transaction.
For additional information about server affinity, session affinity, and transaction affinity for failover, see IBM Redbooks publication WebSphere Application Server Network Deployment V6: High Availability Solutions, SG24-6688.
Component
ServiceInstance A
ServiceInstance B
ServiceInstance C
ServiceInstance D
1
2
12
John
Bob
21
21
20 High Availability in WebSphere Messaging Solutions
2.2.3 Sequencing
Asynchronous messaging decouples the sender from the recipient. A sender deposits a message and moves on rather than waiting for a response from the recipient. Messages that are assumed to be independent units can be consumed by any application tuned to listen for them. This allows for faster response time, higher throughput, and better scalability.
Certain business applications, however, require messages to arrive in exactly the same order as they were created and sent from the source system. For example, a banking system requires credits and debits from a bank account to arrive in the correct order to avoid the account becoming overdrawn in error.
In the case of a high availability architecture that has multiple parallel streams to process a request, it can be challenging to keep messages in sequence. Every component in the journey can affect the order in which messages arrive at their final destination, or if they arrive at all.
There are various ways to ensure that messages arrive in order. Sequencing can be provided through the messaging infrastructure or by the sending and receiving applications.
Sequencing support within WebSphere MQ Messages from a single application end up in the queue in the order in which they were put. However, messages can arrive out of sequence if they take seperate routes through the network, or if they are placed temporarily on a dead-letter queue. If sequencing is essential, WebSphere MQ provides support through message grouping. The sender application can specify that it is sending messages as part of a group. Within the group, messages are given a sequence number starting at 1. Message grouping can be used to ensure that a whole group of messages is available before processing starts. The receiving application can then read the messages from the queue in the sequence order.
Sequencing support within WebSphere Message BrokerSequencing support has been built into WebSphere Message Broker 7.0 with the introduction of the Sequence node and the Resequence node. The Sequence node provides the ability to add sequence numbers to messages belonging to a group to preserve the order in which the messages arrive. The node property Path to sequence group identifier tells the node where to read the group identifier. All messages arriving with this group identifier are allocated a sequence number, which is stored in the Path to store sequence number node property, for example, the LocalEnvironment, MQRFH2 header or the message body.
Chapter 2. Application design for availability 21
The Resequence node can be used to control the order in which messages are processed. Messages within a sequence group can arrive in any order and are stored by the Resequence node. Messages are then propagated in sequence. If there is a gap in the sequence, the Resequence node waits for the missing messages for a specified period.
To take advantage of this new functionality in a high availability scenario with multiple flow instances spread across multiple brokers, you need to ensure message flow affinity.
Application provided sequencingThe sender and receiver applications can be responsible for message sequencing based on an agreed approach. This might include the sender application placing sequencing information in the message body. The receiving application is then responsible for processing the messages in the correct sequence. Any messages that arrive out of sequence must be buffered until the next message in the sequence is received. In more sophisticated variations on this approach, the sender and receiver might have a set of agreed protocols for handling missing messages including the use of acknowledgements, negative acknowledgements, and requests for a message to be resent.
Error handling and retry mechanisms might result in messages being resent. This can mean that requests are processed more than once. To avoid this, a form of message identification (such as a unique ID) should be built into the message structure. Messages that are resent due to errors retain the same unique identifier. It is the responsibility of the receiving system to monitor the identifiers of messages processed to ensure that messages are not processed twice. The flow of messages in such a design is shown in Figure 2-4 on page 23. In this figure, an intermediate component, Component A, is used to handle message sequencing.
22 High Availability in WebSphere Messaging Solutions
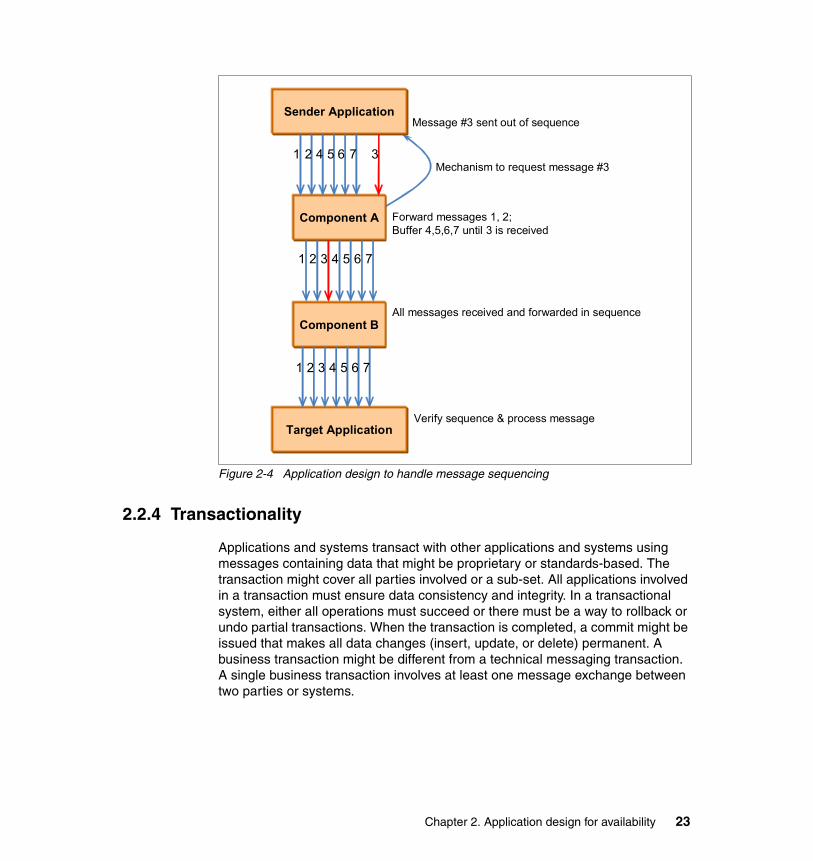
Figure 2-4 Application design to handle message sequencing
2.2.4 Transactionality
Applications and systems transact with other applications and systems using messages containing data that might be proprietary or standards-based. The transaction might cover all parties involved or a sub-set. All applications involved in a transaction must ensure data consistency and integrity. In a transactional system, either all operations must succeed or there must be a way to rollback or undo partial transactions. When the transaction is completed, a commit might be issued that makes all data changes (insert, update, or delete) permanent. A business transaction might be different from a technical messaging transaction. A single business transaction involves at least one message exchange between two parties or systems.
Sender Application
Component A
Target Application
Component B
Forward messages 1, 2; Buffer 4,5,6,7 until 3 is received
Message #3 sent out of sequence
Mechanism to request message #3
All messages received and forwarded in sequence
Verify sequence & process message
1 2 34 5 6 7
1 2 73 4 5 6
1 2 73 4 5 6
Chapter 2. Application design for availability 23
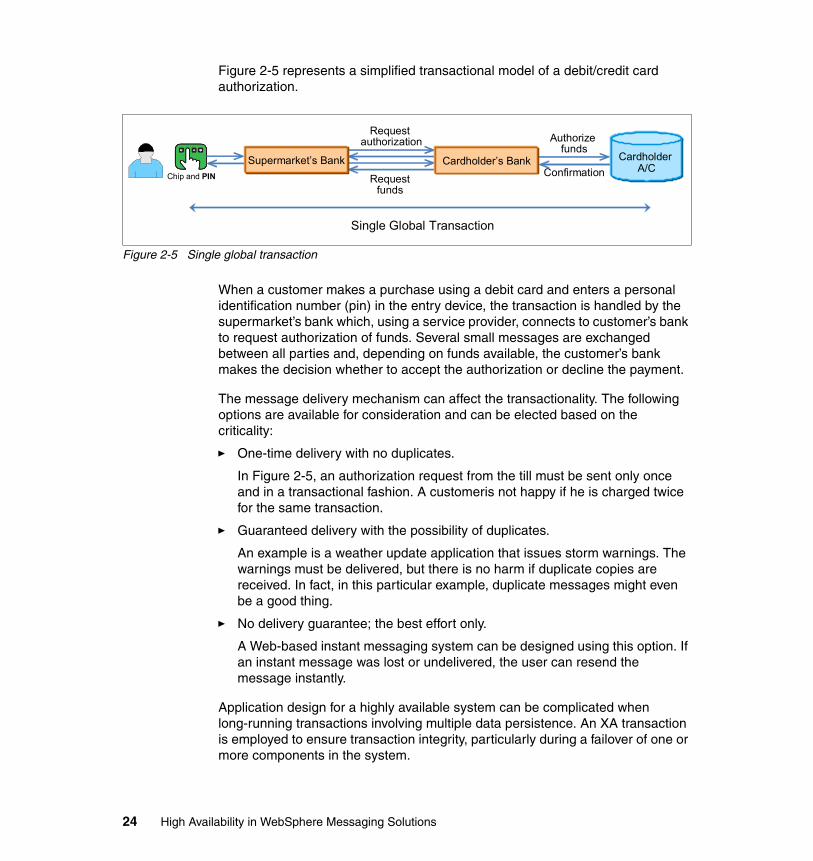
Figure 2-5 represents a simplified transactional model of a debit/credit card authorization.
Figure 2-5 Single global transaction
When a customer makes a purchase using a debit card and enters a personal identification number (pin) in the entry device, the transaction is handled by the supermarket’s bank which, using a service provider, connects to customer’s bank to request authorization of funds. Several small messages are exchanged between all parties and, depending on funds available, the customer’s bank makes the decision whether to accept the authorization or decline the payment.
The message delivery mechanism can affect the transactionality. The following options are available for consideration and can be elected based on the criticality:
� One-time delivery with no duplicates.
In Figure 2-5, an authorization request from the till must be sent only once and in a transactional fashion. A customeris not happy if he is charged twice for the same transaction.
� Guaranteed delivery with the possibility of duplicates.
An example is a weather update application that issues storm warnings. The warnings must be delivered, but there is no harm if duplicate copies are received. In fact, in this particular example, duplicate messages might even be a good thing.
� No delivery guarantee; the best effort only.
A Web-based instant messaging system can be designed using this option. If an instant message was lost or undelivered, the user can resend the message instantly.
Application design for a highly available system can be complicated when long-running transactions involving multiple data persistence. An XA transaction is employed to ensure transaction integrity, particularly during a failover of one or more components in the system.
Single Global Transaction
Authorize funds
Confirmation
Request authorization
Requestfunds
Chip and PIN
Supermarket’s Bank Cardholder A/C
Cardholder’s Bank
24 High Availability in WebSphere Messaging Solutions

Transactions and HA can coexist in a solution. One exception is where two-phase (XA) commit and failover meet. You need to ensure that the transaction manager can contact the queue manager following a failover. It is vital to get the queue manager running again in these situations. Simple redundancy is not enough.
2.3 Data storage and high availability
Data is an integral part of every system, because without data a system’s usefulness diminishes. Many messaging applications make use of data in databases. Consider the availability of the databases as part of your overall high availability solution. In most situations this consists of a highly available database connected to the messaging applications across a network. This is not the only consideration, however. Data can be in-flight, stored on a file system, or stored in a database. In a high-volume, high-concurrency environment, maintaining data consistency and integrity is challenging.
The following list defines three classes of data. We look at ways in which these classes of data can be made highly available. Application data can be broadly classified as follows:
� Static data
Data resides on a disk and is loaded into memory for caching purposes during the system’s operation. Modifications are planned and scheduled. Examples of static data include HTML pages, XSD schema files, and configuration files.
� Transient data
Data is briefly at rest on a disk when the system is running. An example of transient data is a message briefly at rest in a WebSphere MQ queue before the next hop.
� Volatile data
Data with frequent accesses and updates while system is running. This data might reside in memory (for example session data, entity bean data, and in-memory JNDI caches) or reside in a back-end database.
Resilience for static data stored on disk can be provided by the use of shared disks or RAID technology.
Chapter 2. Application design for availability 25
High availability can be provided for volatile in-memory data through memory-to-memory replication to eliminate single point of failure. For further information about memory-to-memory replication see IBM Redbooks publication WebSphere Application Server Network Deployment V6: High Availability Solutions, SG24-6688.
A highly available back-end database is crucial and can be made available through database clustering. Modern database solutions might employ parallel processing or hot standby with active data replication on a horizontal hardware cluster with heartbeat monitoring. The highly available database solution must also preserve transaction integrity during failover.
For details on IBM disk technologies with DB2® database for high availability, see IBM Redbooks publication High Availability and Disaster Recovery Options for DB2 on Linux, UNIX, and Windows, SG24-7363.
2.4 Cloud computing and high availability
Many corporations have a strategy to move towards a cloud computing delivery model. Cloud computing provides a delivery and consumption model for IT services where the IT infrastructure is a managed service somewhere on the Internet (hence the cloud). Resources (including hardware, software, and business and Internet applications) can be dynamically allocated or de-allocated in minutes through virtualized environments based on use and demand. This eliminates the need for an organization to buy, maintain, and refresh expensive IT infrastructures (such as networks and servers).
There are pros and cons for cloud computing that are not debated here. From a high availability perspective, however, you must ensure that you are dealing with a reputable service provider that provides the following skill sets:
� Demonstrates that they have the maturity and organizational mechanisms in place to support the infrastructure properly. This includes back-up and recovery, disaster recovery, and support processes.
� Agrees to your organizations service level requirements.
� Meets your organizations service level requirements.
For further information about IBM’s cloud offering see the following Web page:
http://www.ibm.com/ibm/cloud/
26 High Availability in WebSphere Messaging Solutions
2.5 Keeping the network available
All organizations have layers of networks protecting their key applications, systems, and data. These layers are often labeled as red, yellow. and green zones. These zones depict perimeters of networks, subnetworks, and associated levels of trust on the systems, connections, data, and users in a zone. Zones closer to the edge have lower levels of trust, so all connections and data are scrutinized. As you get closer to the green zone, there is higher level of trust.
In the early 70’s networks were designed as castles; a huge wall (firewall) on the outside and freedom to move anywhere inside. The challenge with this design was that anyone who got past the big wall can do anything they want. They can weaken the wall from inside, steal information, or stay inside the wall and weaken systems and steal information for as long as possible.
Modern networks, however, are designed like airports. There are checks and barriers at various stages of before you are allowed to board the airplane. This concept is illustrated in Figure 2-6 on page 28.
The DMZ (demilitarized zone) is often a part of the network that exposes an organization services to the outside world in such a manner that no one can bypass security policies and can only access exposed services. There are specialty devices (such as firewalls, switches, load balancers, XML firewalls, and anti-virus scanners) that inspect connections and content passing through the connection. Some devices are content-aware and some are stateless devices that check, detect, and stop any potential threats to the protected resources.
Chapter 2. Application design for availability 27
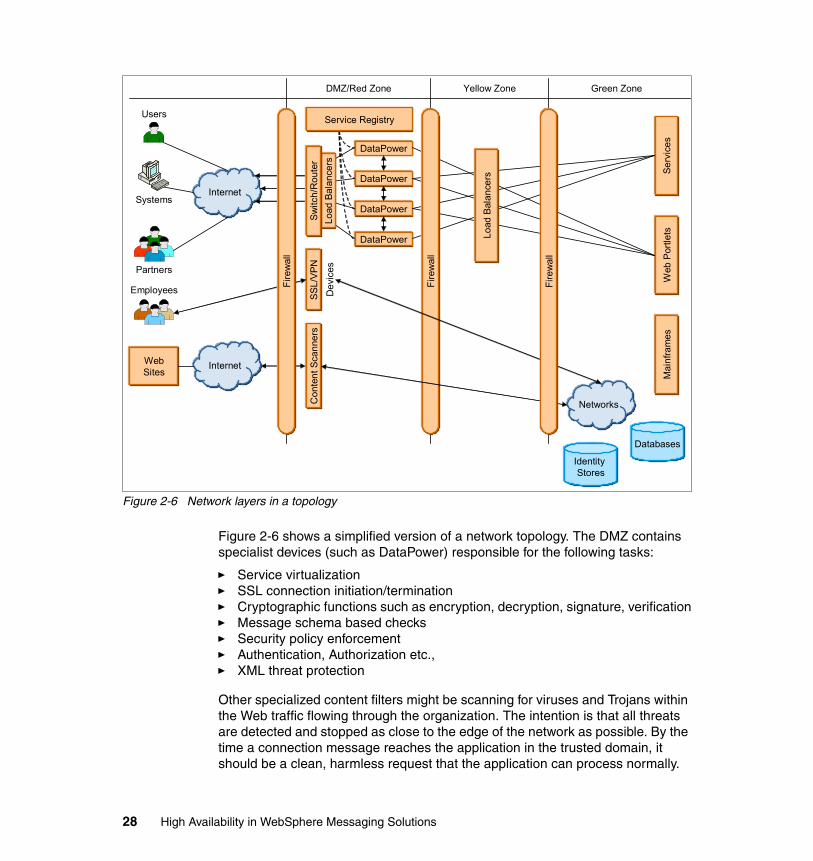
Figure 2-6 Network layers in a topology
Figure 2-6 shows a simplified version of a network topology. The DMZ contains specialist devices (such as DataPower) responsible for the following tasks:
� Service virtualization� SSL connection initiation/termination� Cryptographic functions such as encryption, decryption, signature, verification� Message schema based checks� Security policy enforcement � Authentication, Authorization etc.,� XML threat protection
Other specialized content filters might be scanning for viruses and Trojans within the Web traffic flowing through the organization. The intention is that all threats are detected and stopped as close to the edge of the network as possible. By the time a connection message reaches the application in the trusted domain, it should be a clean, harmless request that the application can process normally.
Co
nte
nt
Sca
nne
rs
DMZ/Red Zone Yellow Zone Green Zone
Identity Stores
Networks
Ma
infr
am
es
Web
Por
tlets
Se
rvic
es
DataPower
DataPower
DataPower
DataPower
Service Registry
SS
L/V
PN
De
vice
s
Internet
Lo
ad B
ala
nce
rs
Sw
itch
/Ro
ute
r
WebSites
Internet
Users
Partners
Employees
Systems
Fir
ew
all
Fir
ew
all
Lo
ad B
ala
nce
rs
Fir
ew
all
Databases
28 High Availability in WebSphere Messaging Solutions
2.6 Infrastructure patterns
Most IT operations teams use design patterns for hardware and software deployment. These patterns are based on industry-accepted practices, individual experiences, project requirements and policy compliance. Sometimes the technologies used might also influence and dictate the pattern in which it is deployed and managed. Every new deployment must go through an exercise of vetting the applicable patterns and making a choice based on cost, risk, and the value of the service being hosted.
In this sections that follow, we examine infrastructure-related design patterns. In particular we look at the following topics:
� “Cluster patterns”� “Network patterns” on page 30
2.6.1 Cluster patterns
Section 1.6, “Software clustering” on page 9 discusses software clustering. Software clustering is an important element in the design for redundancy, fault tolerance, resilience, and high availability. A cluster eliminates single points of failure. An important aspect, however, is whether to share state, context, and data between cluster nodes so that failure of a cluster node is invisible to the client applications and that from their point of view, everything continues as normal.
The following four patterns are found in cluster-based deployment:
� Cluster members have their own data stores and file systems where they operate and the data is not shared with other cluster members.
In this scenario there is a possibility that data might not be recoverable from a failed node. For example, DataPower devices are typically deployed where each device has its own file system. In case of a device failure, all in-flight transactions are lost and any files or data kept on the local file system is also lost.
� Cluster members share common storage (database or file systems) but work as independent nodes.
In this case, both nodes can be configured as active and they continue to use their own resources and use their own data sets. For example, two nodes might share a database but might have their own tables, views, and so forth.
Chapter 2. Application design for availability 29
� Cluster members share common storage and data sets, so two or more nodes might update the same file, database table, or record at the same time.
Appropriate logic needs to be in place to maintain data integrity and avoid file or record locking.
� Cluster members are deployed in geographically dispersed locations to avoid natural or man-made disasters.
The distance between cluster nodes might be from a few miles to thousands of miles. Hardware- or software-level data replication technologies are employed to replicate data across sites.
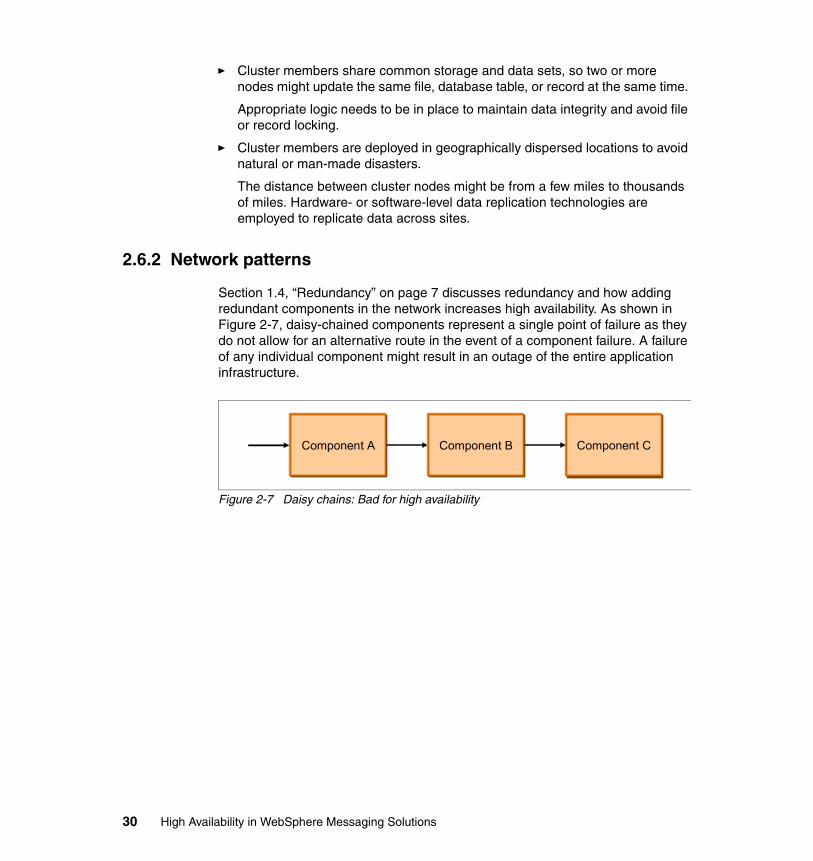
2.6.2 Network patterns
Section 1.4, “Redundancy” on page 7 discusses redundancy and how adding redundant components in the network increases high availability. As shown in Figure 2-7, daisy-chained components represent a single point of failure as they do not allow for an alternative route in the event of a component failure. A failure of any individual component might result in an outage of the entire application infrastructure.
Figure 2-7 Daisy chains: Bad for high availability
Component A Component CComponent B
30 High Availability in WebSphere Messaging Solutions
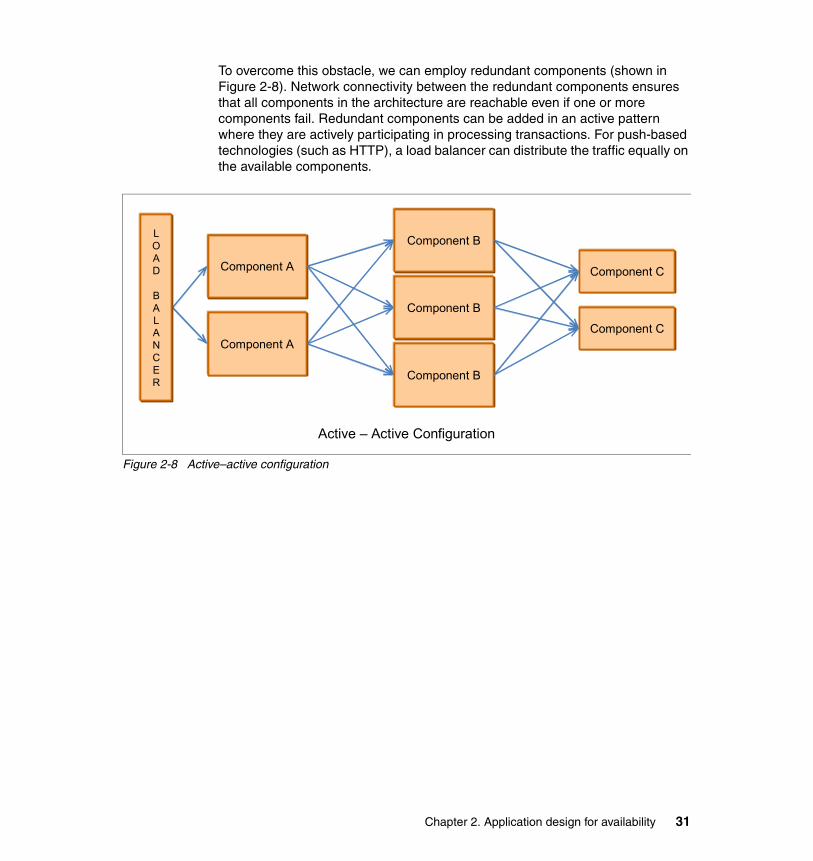
To overcome this obstacle, we can employ redundant components (shown in Figure 2-8). Network connectivity between the redundant components ensures that all components in the architecture are reachable even if one or more components fail. Redundant components can be added in an active pattern where they are actively participating in processing transactions. For push-based technologies (such as HTTP), a load balancer can distribute the traffic equally on the available components.
Figure 2-8 Active–active configuration
Component B
Component CComponent A
Component C
Component B
Component B
Component A
Active – Active Configuration
LOAD
BALANCER
Chapter 2. Application design for availability 31
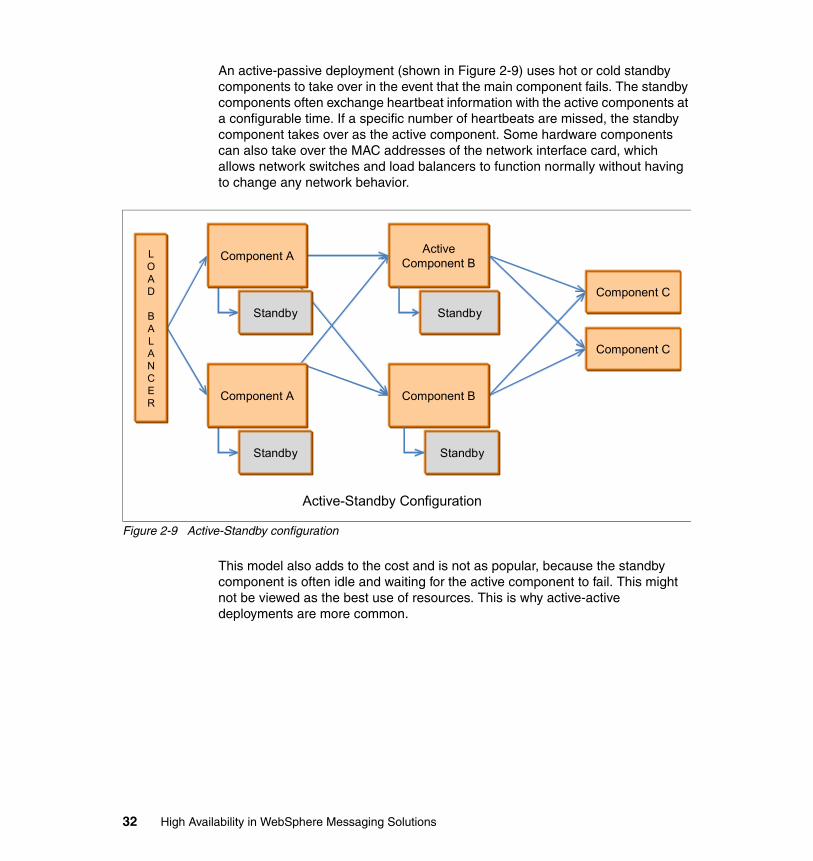
An active-passive deployment (shown in Figure 2-9) uses hot or cold standby components to take over in the event that the main component fails. The standby components often exchange heartbeat information with the active components at a configurable time. If a specific number of heartbeats are missed, the standby component takes over as the active component. Some hardware components can also take over the MAC addresses of the network interface card, which allows network switches and load balancers to function normally without having to change any network behavior.
Figure 2-9 Active-Standby configuration
This model also adds to the cost and is not as popular, because the standby component is often idle and waiting for the active component to fail. This might not be viewed as the best use of resources. This is why active-active deployments are more common.
Component C
Component C
Standby
ActiveComponent B
Active-Standby Configuration
LOAD
BALANCER
Component B
Standby
Standby
Standby
Component A
Component A
32 High Availability in WebSphere Messaging Solutions

Chapter 3. Product technologies for high availability
This chapter describes the product technologies that can be used to build a high availability topology. It discusses hardware clustering concepts and the high availability features of the WebSphere messaging products. This includes multi-instance queue manager and multi-instance broker capabilities, WebSphere MQ clusters, and queue sharing groups on z/OS®.
3
© Copyright IBM Corp. 2010. All rights reserved. 33
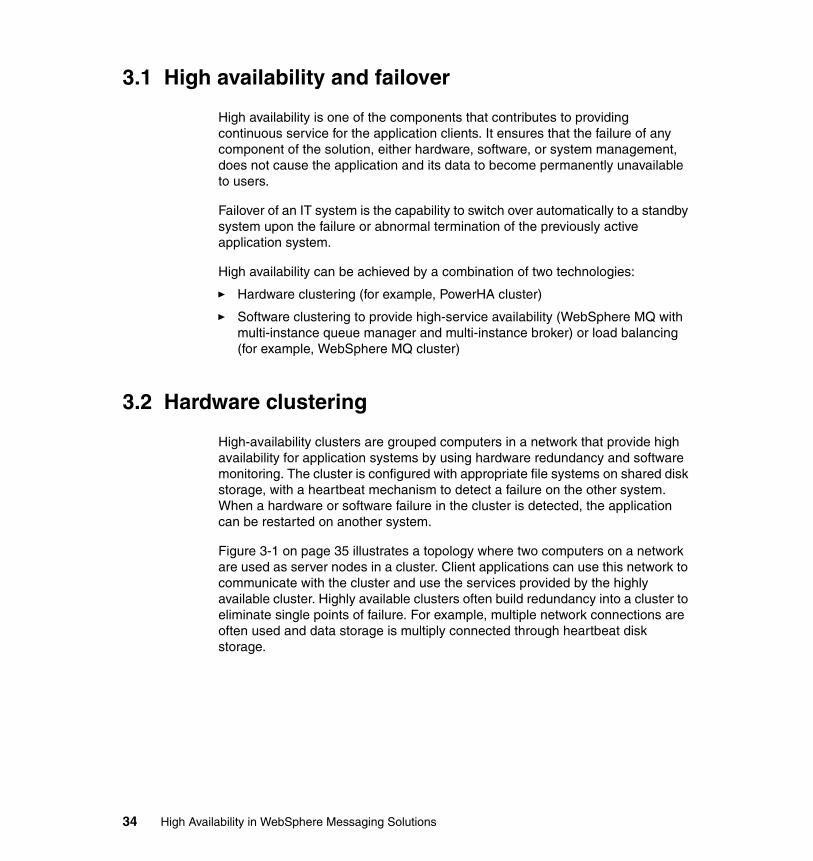
3.1 High availability and failover
High availability is one of the components that contributes to providing continuous service for the application clients. It ensures that the failure of any component of the solution, either hardware, software, or system management, does not cause the application and its data to become permanently unavailable to users.
Failover of an IT system is the capability to switch over automatically to a standby system upon the failure or abnormal termination of the previously active application system.
High availability can be achieved by a combination of two technologies:
� Hardware clustering (for example, PowerHA cluster)
� Software clustering to provide high-service availability (WebSphere MQ with multi-instance queue manager and multi-instance broker) or load balancing (for example, WebSphere MQ cluster)
3.2 Hardware clustering
High-availability clusters are grouped computers in a network that provide high availability for application systems by using hardware redundancy and software monitoring. The cluster is configured with appropriate file systems on shared disk storage, with a heartbeat mechanism to detect a failure on the other system. When a hardware or software failure in the cluster is detected, the application can be restarted on another system.
Figure 3-1 on page 35 illustrates a topology where two computers on a network are used as server nodes in a cluster. Client applications can use this network to communicate with the cluster and use the services provided by the highly available cluster. Highly available clusters often build redundancy into a cluster to eliminate single points of failure. For example, multiple network connections are often used and data storage is multiply connected through heartbeat disk storage.
34 High Availability in WebSphere Messaging Solutions

Figure 3-1 Hardware clustering
Highly available clustering uses the concept of resource groups where applications, services IP labels, and even file systems on disk storage are grouped together. When a failure occurs in one of the applications in the group, the entire group is moved to a standby server by the use of cluster services.
The heartbeat private network connection is an additional non-IP network. This is a key component used by the cluster to monitor the health and status of each node in the cluster.
The most commonly used highly available cluster is a two node cluster. The two common configurations are:
� Active/Active
Traffic intended for the failed node is either passed to an existing node or load balanced across the remaining nodes.
� Active/Passive
Provides a fully redundant instance of each node, which is only brought online when its associated primary node fails.
ActiveNode
StandbyNode
Heartbeat
Disk1 Disk2
Network
Chapter 3. Product technologies for high availability 35
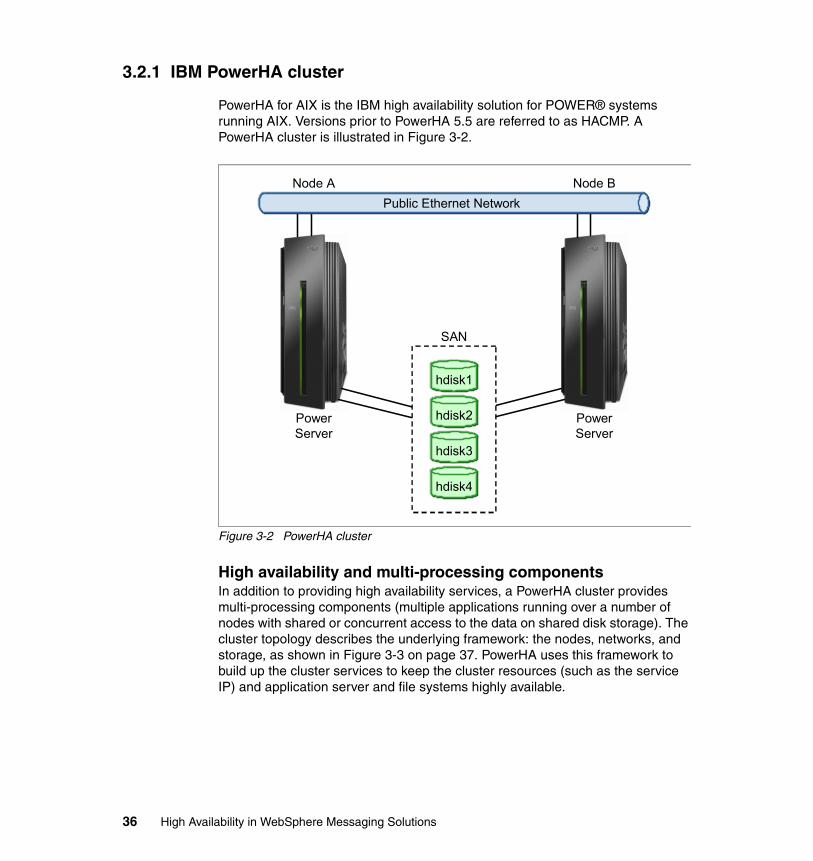
3.2.1 IBM PowerHA cluster
PowerHA for AIX is the IBM high availability solution for POWER® systems running AIX. Versions prior to PowerHA 5.5 are referred to as HACMP. A PowerHA cluster is illustrated in Figure 3-2.
Figure 3-2 PowerHA cluster
High availability and multi-processing componentsIn addition to providing high availability services, a PowerHA cluster provides multi-processing components (multiple applications running over a number of nodes with shared or concurrent access to the data on shared disk storage). The cluster topology describes the underlying framework: the nodes, networks, and storage, as shown in Figure 3-3 on page 37. PowerHA uses this framework to build up the cluster services to keep the cluster resources (such as the service IP) and application server and file systems highly available.
SAN
PowerServer
PowerServer
Node A Node B
hdisk1
hdisk2
hdisk3
hdisk4
Public Ethernet Network
36 High Availability in WebSphere Messaging Solutions

Figure 3-3 Resource Group and Cluster services
The topology represents the physical view of the cluster and how hardware cluster components are connected using networks (IP and non-IP). The components of the topology are as follows:
� PowerHA cluster� Nodes� Sites� Networks� Communication interfaces/devices� Persistent node IP labels/addresses� Network modules� Topology and group services� Clients
Service IPApp. ServerFile System
Failover
SharedDisk
Network
diskhb
Node1 Node2
Cluster Services
Resource Group
Chapter 3. Product technologies for high availability 37
Cluster resources are those components that PowerHA can move from node to node (for example, service IP labels, file systems, and applications). PowerHA uses the underlying topology to ensure that the applications under its control and the resources they require are kept highly available:
� Service IP labels / addresses� Physical disks� Volume groups� Logical volumes� File systems� Network File Systems� Application servers (applications)� Communication adapters and links� Tape resources� Fast connect resources� WLM integration
When the cluster is configured, the cluster topology and resource information is entered on one node, a verification process is run, and the data synchronized out to the other nodes defined in the cluster. PowerHA keeps this data in Object Data Manager (ODM) classes on each node in the cluster.
An active-standby configuration Active-standby clusters include both active and standby nodes. One node is running the applications in a resource group and one node is in the standby state. The standby node monitors the active node by using heartbeats. These are periodic checks by the standby node to ensure that the master node is still responding to requests. The active node also monitors its disks and the processes running on it to ensure that no hardware failure has occurred.
38 High Availability in WebSphere Messaging Solutions
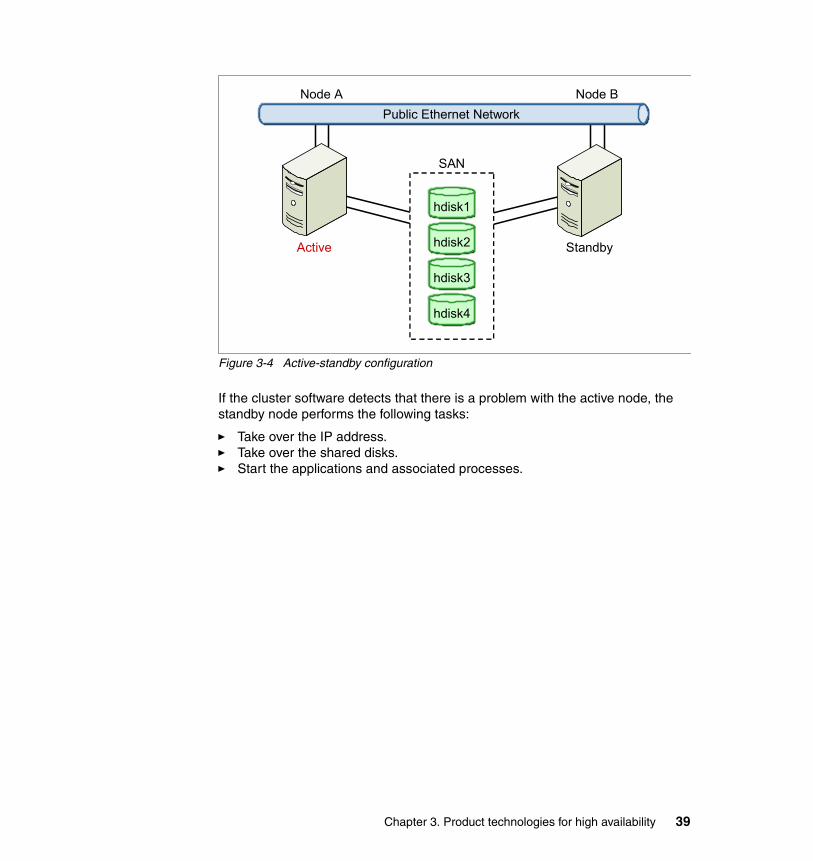
Figure 3-4 Active-standby configuration
If the cluster software detects that there is a problem with the active node, the standby node performs the following tasks:
� Take over the IP address. � Take over the shared disks. � Start the applications and associated processes.
SAN
hdisk1
hdisk2
hdisk3
hdisk4
Node A Node B
Public Ethernet Network
Active Standby
Chapter 3. Product technologies for high availability 39

An active-active configurationIt is possible to run services on the redundant machine in an active-active configuration (Figure 3-5). In this mode, the servers are both actively running programs and acting as backups for each other. If one server fails, the other continues to run its own services. This type of configuration can also provide load balancing for client applications.
Figure 3-5 Active-active configuration
3.3 Multi-instance queue managers and brokers
WebSphere MQ V7.0.1 introduced the ability to configure multi-instance queue managers. This capability allows you to configure multiple instances of a queue manager on separate machines, providing a highly available active-standby solution.
WebSphere Message Broker V7 builds on this feature to add the concept of multi-instance brokers. This feature works in the same way by hosting the broker's configuration on network storage and making the brokers highly available.
SAN
hdisk1
hdisk2
hdisk3
hdisk4
Node A Node B
Public Ethernet Network
Active Active
40 High Availability in WebSphere Messaging Solutions
3.3.1 Multi-instance queue managers
Using a multi-instance queue manager improves availability by automatically switching the queue manager instance to a standby server if the active server fails. The active and standby servers each have an instance of the same queue manager, using the same queue manager data hosted on shared network storage. When the active instance fails, the standby instance automatically takes over the configuration.
A multi-instance queue manager is designed to assist you in configuring for availability. One instance of the queue manager is active at a time. Switching over to a standby instance can take anywhere from seconds to minutes, depending on how the system is configured, loaded, and tuned.
3.3.2 Multi-instance brokers
A multi-instance queue manager can give the appearance of nearly uninterrupted service if used with reconnectable WebSphere MQ clients, which are able to continue processing without the application program being aware of a queue manager outage.
The multi-instance broker feature of WebSphere Message Broker works with WebSphere MQ in one of two ways. Each broker instance is embedded into an MQ service so that when the queue manager switches over to the standby system, the broker is automatically started on the standby node. Alternatively, the standby broker can be continually running in a semi-initialized state, waiting for the associated standby queue manager and shared broker configuration to become available.
3.3.3 Highly available hardware solutions versus multi-instancesolutions
If you only use WebSphere MQ and broker products and want to make your brokers or queue managers highly available, multi-instances can save the administrative overhead of a high-availability solution such as PowerHA. However, the multi-instance brokers feature does not make any connected resources (such as databases) highly available, so in these scenarios another product that provides high availability is still required. For example, you can use Oracle RAC for the database, and you manage the queue managers' and brokers' availability separately either using an HA cluster or multi-instance.
By using hardware clustering such as a PowerHA cluster, other resources, such as databases, can be included into cluster resource groups and made highly
Chapter 3. Product technologies for high availability 41
available. The service IP label is also implemented in a resource group. Furthermore, data high availability is ensured by shared disk storage connected to two servers. The data of a cluster application is located on a shared disk storage. In case of failure, the standby server mounts the shared disk and restarts the applications. This type of solution is complicated to use and has a higher administrative overhead. Furthermore, a combination of PowerHA and multi instances of WebSphere MQ and Broker in the application is not necessary.
One consideration for multi-instance queue managers is that they change IP addresses when they failover, so the network configuration needs to be adjusted to reflect this.
3.4 Queue manager cluster
This section describes the use of a WebSphere MQ queue manager cluster in the network to provide workload balancing and increasing high availability for new messages.
3.4.1 Cluster queue managers and repositories
A queue manager cluster is a logical group of queue managers. The queue managers can be on most of the platforms supported by MQ. When queue managers are grouped in a cluster, each queue manager can make the queues (and other resources it hosts) available to every cluster member. For example, any queue manager can route a message to any other queue manager in the same cluster without explicit channel definitions, remote-queue definitions, or transmission queues for each destination.
The queue manager cluster solution provides a highly available messaging service. It allows messages to be forwarded to any queue manager in the cluster hosting the target queue for application processing. If any queue manager in the cluster fails, new incoming messages continue to be processed by the remaining queue managers as long as at least one of the queue managers hosts an instance of the target queue.
Note: Multi-instance queue managers require network-attached storage that supports lease-based locking and is POSIX compliant. Network File System 4 (NFS-4) fulfills this requirement and was used for the scenarios.
42 High Availability in WebSphere Messaging Solutions
A queue manager cluster has the following components:
� Cluster repository
The cluster-related information, which is maintained in a queue. Usually, two full copies of the repository are used for each cluster.
� Repository queue manager
The queue manager that manages the cluster repository.
� Cluster queue managers
The queue manager members of a cluster.
� Cluster transmission queue
The cluster-specific transmission queue.
Every queue manager in a cluster has a single transmission queue from which it can transmit messages to any other queue manager in the cluster. Each queue manager in a cluster needs to define only the following information:
� One cluster-receiver channel, which tells other members of the cluster how to connect to this queue manager
� One cluster-sender channel, to connect to a repository queue manager
The repository queue managers are the most important members in the cluster. They host a complete set of information about every queue manager in the cluster, and the cluster resources each queue manager owns. The other queue managers in the cluster register with the full repositories, passing information about their cluster resources (queues, topics, and so forth) and build up their own subsets of this information in partial repositories.
A partial repository only contains information about those queue managers and resources that this queue manager has used. If there is a change in the status of any of the resources used, the full repositories notify the partial repositories about the resourcesin which they have expressed an interest previously.
When using queue manager clusters it is possible to have stranded messages. These messages, called orphan messages, were delivered to a cluster queue but cannot be processed because the queue manager hosting it has become unavailable, or the instance of the application processing the queue is not active.
3.4.2 Workload balancing
One of the benefits of queue manager clustering is workload balancing functionality. This algorithm uses the concept of distributed cluster queues. Basically, they are cluster queues that have multiple instances defined in the
Chapter 3. Product technologies for high availability 43

same cluster. More than one queue manager hosts an instance of the same queue. The workload can be spread between queue managers in the cluster.
The following list details the advantages of using clusters:
� Increased availability of queues
Because there are multiple instances of them.
� Faster throughput of messages,
Because messages can be delivered to multiple destinations and processed by multiple applications at the same time.
� More even distribution of workload in your network
The applications need not explicitly name the queue manager when sending messages. The workload management algorithm determines which queue manager handles the message.
In Figure 3-6, an application connected to Qm3 puts a message to a cluster queue. This cluster queue is defined locally on Qm1, Qm4 and Qm6. MQ uses a workload management algorithm to determine the best queue manager to which to route this message. If there is no instance of the queue on the local queue manager, the algorithm determines which destinations are suitable. Suitability is based on the state of the channel (including any priority you might have assigned to the channel), and the availability of the queue manager and queue. The algorithm uses a round-robin approach to finalize its choice between the suitable queue managers.
Figure 3-6 Multiple instances of queue
Node 1 Node 2 Node 3
MQ Cluster
Qm1
Qm2 Qm4
Qm3
Qm6
Qm5
Application
44 High Availability in WebSphere Messaging Solutions
Therefore, one of these queue managers receives the message and processes it. If a queue manager fails, the incoming messages are balanced among the remaining queue managers.
3.5 Queue-sharing groups
On z/OS systems, the coupling facility (CF) technology can be used to group queue managers into queue sharing groups (QSGs). All queue managers in a QSG can access shared message queues for sending and receiving messages through the WebSphere MQ API.
QSGs on WebSphere MQ for z/OS consist of the following components:
� A number of z/OS queue managers (running within a single z/OS sysplex) along with their associated channel initiators
� A coupling facility containing two or more coupling facility structures (CF structures) that are used to hold messages on shared queues
� A shared DB2 database (also known as the DB2 shared repository) used to hold shared object definitions.
Note: Shared queues are only available on WebSphere MQ for z/OS. They rely on z/OS-specific features not available on other platforms.
Chapter 3. Product technologies for high availability 45
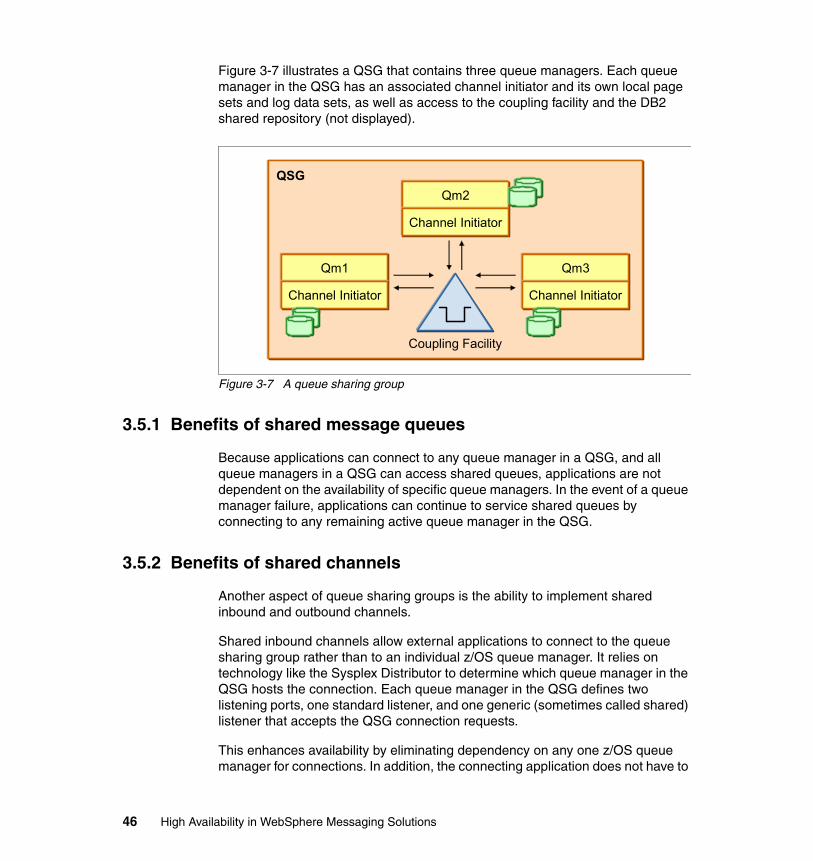
Figure 3-7 illustrates a QSG that contains three queue managers. Each queue manager in the QSG has an associated channel initiator and its own local page sets and log data sets, as well as access to the coupling facility and the DB2 shared repository (not displayed).
Figure 3-7 A queue sharing group
3.5.1 Benefits of shared message queues
Because applications can connect to any queue manager in a QSG, and all queue managers in a QSG can access shared queues, applications are not dependent on the availability of specific queue managers. In the event of a queue manager failure, applications can continue to service shared queues by connecting to any remaining active queue manager in the QSG.
3.5.2 Benefits of shared channels
Another aspect of queue sharing groups is the ability to implement shared inbound and outbound channels.
Shared inbound channels allow external applications to connect to the queue sharing group rather than to an individual z/OS queue manager. It relies on technology like the Sysplex Distributor to determine which queue manager in the QSG hosts the connection. Each queue manager in the QSG defines two listening ports, one standard listener, and one generic (sometimes called shared) listener that accepts the QSG connection requests.
This enhances availability by eliminating dependency on any one z/OS queue manager for connections. In addition, the connecting application does not have to
QSG
Coupling Facility
Qm2
Channel Initiator
Qm3
Channel Initiator
Qm1
Channel Initiator
46 High Availability in WebSphere Messaging Solutions

be concerned about the target queues. Shared queues can be directly accessed by the queue manager where the connection was directed. If the target queues are not shared, the QSG directs the messages to the correct queue manager.
Shared outbound channels allow any channel initiator in the QSG to process outbound messages that are on a shared transmission queue. The availability advantage is that messages can continue to flow if one of the channel initiators in the queue sharing group becomes unavailable. This feature can improve delivery of remote messages, as a shared sender channel normally starts on the least busy channel initiator.
3.5.3 Large messages on shared queues
Prior to WebSphere MQ V6, shared queues had a limit on the length of messages that can be stored on shared queues. This length restriction has now been lifted and messages can be up to 100 Mb in length, which is the same length as private queues.
It is important to understand that although applications do not see any difference when processing long and short messages, the underlying storage mechanism for shared queue messages larger than 63 K is different. This difference can impact application response time and CPU consumption.
Messages shorter than 6 3K are stored in the CF list structures. Messages longer than 63 K use a combination of storage: The message headers are stored in the CF and the message body is stored in a DB2 table in the DB2 data sharing group.
For a comparison of the costs associated with storage of long messages, review the WebSphere MQ for z/OS Performance reports and SupportPac MP16. These can be found at the following Web page:
http://www-01.ibm.com/support/docview.wss?rs=977&uid=swg27007205
Note: Enabling long message support requires that the MQ component of the structure definition (CFSTRUCT) used for MQ queues that contain long messages be set to CFLEVEL(4).
Chapter 3. Product technologies for high availability 47
3.6 MQ clients
Clients also can play a role in high availability. This section discusses considerations for clients.
3.6.1 Automatic client reconnection
The new automatic client reconnect feature was introduced in WebSphere MQ V7.0.1. It provides greater messaging availability by masking network and queue manager outages from client-connected applications through automatic detection of connectivity problems and reconnecting to the same or alternative queue managers. In earlier versions of WebSphere MQ, if no changes were made to existing connections, manual reconnection required the client application to recreate a connection using MQCONN or MQCONNX, and reopen objects.
Automatic reconnection can be enabled administratively with a new parameter of the channels stanza in the mqclient.ini file. The DefRecon parameter has several settings and can perform the following tasks:
� Disable automatic reconnect� Enable reconnect but only to the same queue manager� Allow automatic reconnect� Allow the client code to override this setting
It can also be enabled through the application code itself, using the MQCONNX calls, or with JMS options (see “Using standalone JMS clients” on page 49).
From an application perspective, automatic reconnect can provide an easy availability solution for message processing styles. Fire and forget messaging, where the client is sending messages to an application for processing without expecting a reply is an ideal candidate.
Enabling automatic reconnection to the same queue manager for clients connected to multi-instance queue managers masks switching between the instances for many clients.
Automatic reconnect returns new reason codes for certain types application processing. For example if the client is processing a message group, it requires reconnection to the same queue manager to complete properly. If reconnection is made to a seperate queue manager the application receives the new MQRC_RECONNECT_INCOMPATABLE return code. Reconnection might not be desirable for other application processing, so we suggest examining how an application is using messaging before implementing this feature.
48 High Availability in WebSphere Messaging Solutions

The automatic reconnection functionality of WebSphere MQ V7.0.1 is different from the way high availability environments such as PowerHA work. PowerHA provides a service IP address (IP alias) for the cluster and transfers this IP address to the active server. However, you still need something like client reconnection to mask the failover from the applications, because even with an highly available cluster the client connections break.
The MQ client reconnection does not change or reroute IP addresses. It reconnects to the network addresses, which are defined in channel definitions and client connections.
Using standalone JMS clientsIBM WebSphere MQ classes for Java™ Message Service (JMS) is a set of Java classes that enables the JMS applications to access WebSphere MQ systems. Both the point-to-point and publish-subscribe models of JMS are supported. These Java classes are available as part of the IBM WebSphere MQ client support.
The JMS-administered objects, such as connection factory, topic and queue, are built using a vendor-supplied administration tool and stored on a JNDI namespace. A JMS application can retrieve these objects from the namespace and use them without needing to know which vendor provided the implementation.
When using IBM WebSphere MQ, the JMSAdmin command line tool or WebSphere MQ Explorer GUI tool can be used to create administered objects. These administered objects are specifically for use with WebSphere MQ classes for JMS.
Chapter 3. Product technologies for high availability 49
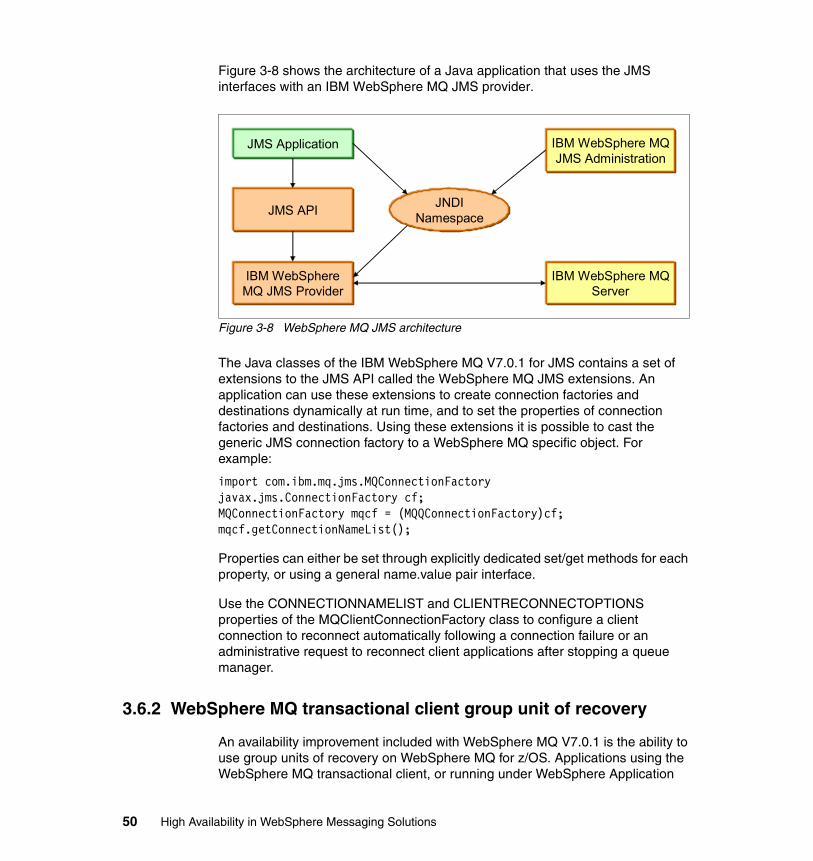
Figure 3-8 shows the architecture of a Java application that uses the JMS interfaces with an IBM WebSphere MQ JMS provider.
Figure 3-8 WebSphere MQ JMS architecture
The Java classes of the IBM WebSphere MQ V7.0.1 for JMS contains a set of extensions to the JMS API called the WebSphere MQ JMS extensions. An application can use these extensions to create connection factories and destinations dynamically at run time, and to set the properties of connection factories and destinations. Using these extensions it is possible to cast the generic JMS connection factory to a WebSphere MQ specific object. For example:
import com.ibm.mq.jms.MQConnectionFactory javax.jms.ConnectionFactory cf;MQConnectionFactory mqcf = (MQQConnectionFactory)cf;mqcf.getConnectionNameList();
Properties can either be set through explicitly dedicated set/get methods for each property, or using a general name.value pair interface.
Use the CONNECTIONNAMELIST and CLIENTRECONNECTOPTIONS properties of the MQClientConnectionFactory class to configure a client connection to reconnect automatically following a connection failure or an administrative request to reconnect client applications after stopping a queue manager.
3.6.2 WebSphere MQ transactional client group unit of recovery
An availability improvement included with WebSphere MQ V7.0.1 is the ability to use group units of recovery on WebSphere MQ for z/OS. Applications using the WebSphere MQ transactional client, or running under WebSphere Application
JMS Application
JMS API
IBM WebSphereMQ JMS Provider
JNDINamespace
IBM WebSphere MQJMS Administration
IBM WebSphere MQServer
50 High Availability in WebSphere Messaging Solutions
Server, connecting to a WebSphere MQ queue sharing group can use this feature. When running under WebSphere Application Server you do not need to purchase or install the WebSphere MQ Transaction Client. The functionality is available for free.
The requirement for group units of recovery arose from the way assignment of the connection queue manager is made when using shared inbound channels. When a transactional client connects to a specific queue manager, the unit of recovery that is built is specifically for that client’s activity and queue manager. Because that client connects to only one queue manager, if an interruption occurs when the client reconnects to the original queue manager, the unit of recovery can be resolved.
With releases prior to WebSphere MQ V7.0.1 if the client chooses to connect to a queue sharing group, any unit of recovery that is built is owned by the queue manager hosting the connection. As long as there is no interruption this works well. The problem arises when an interruption occurs and the client’s reconnection resolves to a seperate queue manager, which can occur if the original queue manager is unavailable or the sysplex distributor determines there is a better host for this connection. The unit of work is unavailable for recovery because it is owned by the original queue manager.
WebSphere MQ V7.0.1 introduced group units of recovery to address this issue. This is implemented in two parts. The simple part is that the client uses the queue sharing group as the queue manager name. The more complicated piece is on the WebSphere MQ for z/OS side. All queue managers eligible for group recovery need to be altered to set a new queue manager property, GROUPUR(ENABLED). The OPMODE must also be set to NEWFUNC at the 701 level or higher. In addition, a new coupling facility list structure named CSQSYSAPPL must be defined, and on that list structure a new queue SYSTEM.QSG.UR.RESOLUTION.QUEUE. The group unit of recovery records are stored in this new queue, and are available to every queue manager in the QSG. In the event of an interruption, the work can be recovered even when the client’s reconnection is directed to a seperate queue manager in the QSG.
3.6.3 Client connection balancing
Load balancing is often used to implement failover, providing high availability. Sometimes, load balancing is performed by having a single device receive all requests and determine which server to which to send the request. In other load balancing mechanisms, the request might be sent to all of the servers and each server determines whether it services the request.
For certain applications, it is desirable that communications from the same client go to the same server. This is sometimes called client affinity or simply, affinity.
Chapter 3. Product technologies for high availability 51

For example, if a server is storing shopping cart information related to a client's order and a request from the client is serviced by another server, the shopping cart information or session state might not be available to the other server. Client affinity becomes more complicated in load balanced systems.
Round-robin balancing and weight-based load balancingA variety of algorithms are used by load balancers to determine which back-end server to which to send a request. Simple algorithms include random choice or round-robin. The round-robin algorithm cycles through a list of server instances in order. Weight-based load balancing improves on the round-robin algorithm by taking into account a pre-assigned weight for each server.
Client affinityApplication request routing provides a client affinity feature that maps a client to a content server behind for the duration of a client session. When this feature is enabled, the load balancing algorithm is applied only for the first request from the client. From that point on, all subsequent requests from the same client are routed to the same content server for the duration of the client session. This feature is useful if the application on the content server is stateful and the client’s requests must be routed to the same content server because the session management is not centralized.
Client affinity is defined between a client connection and a data source. When client affinity is defined, requests from a specified client connection are distributed to a specified data source in a data source pool. The client affinity feature reduces the risk of propagation delay in deployments that use load balancing. Propagation delays can occur when a client makes consecutive requests that target the same entry if those requests are not treated by the same data source. For example, a client might make one request to change an entry and a second request to use the changed entry. If the second request is treated by a data source that has not been updated by the first request, an error occurs.
Client weightThe client weight value can be used to load balance client connections when there are multiple connection options in a client channel definition table (CCDT). The weight value ranges from 00–99, where 00 is a special value indicating that no specific preference is set and the CCDT entries are used in alphabetical order in connection attempts, much like the CCDT was used in prior versions.
The other values (01–99) help weigh the random selection. In the CCDT example in Example 3-1 on page 53, when a connection is attempted a random number between 1 and 31 (the weight totals) is generated.
52 High Availability in WebSphere Messaging Solutions
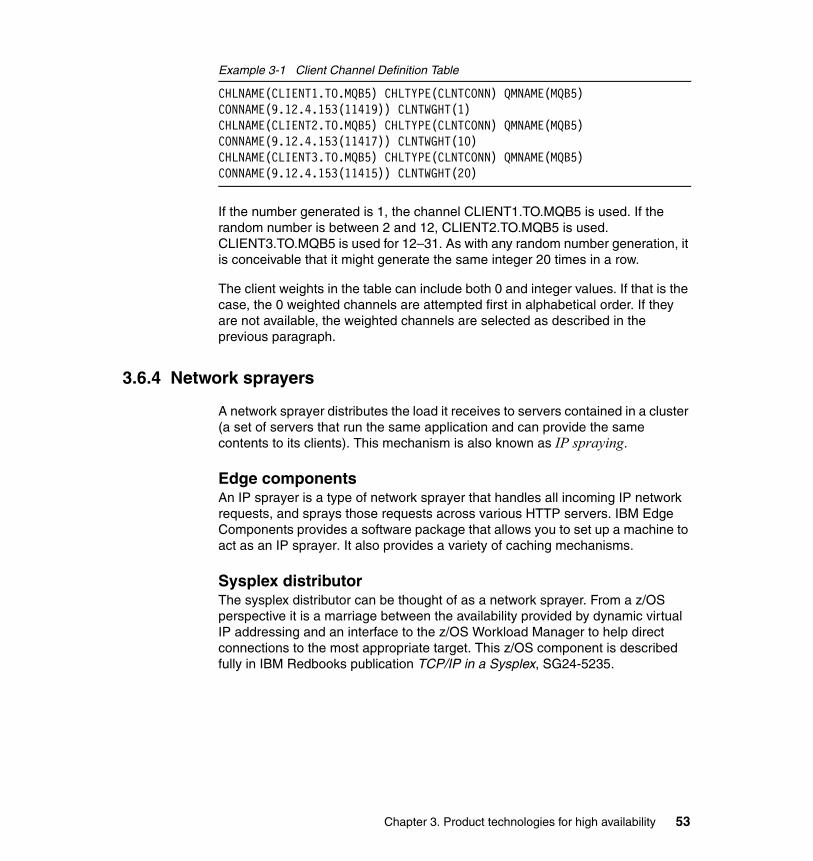
Example 3-1 Client Channel Definition Table
CHLNAME(CLIENT1.TO.MQB5) CHLTYPE(CLNTCONN) QMNAME(MQB5) CONNAME(9.12.4.153(11419)) CLNTWGHT(1) CHLNAME(CLIENT2.TO.MQB5) CHLTYPE(CLNTCONN) QMNAME(MQB5) CONNAME(9.12.4.153(11417)) CLNTWGHT(10)CHLNAME(CLIENT3.TO.MQB5) CHLTYPE(CLNTCONN) QMNAME(MQB5) CONNAME(9.12.4.153(11415)) CLNTWGHT(20)
If the number generated is 1, the channel CLIENT1.TO.MQB5 is used. If the random number is between 2 and 12, CLIENT2.TO.MQB5 is used. CLIENT3.TO.MQB5 is used for 12–31. As with any random number generation, it is conceivable that it might generate the same integer 20 times in a row.
The client weights in the table can include both 0 and integer values. If that is the case, the 0 weighted channels are attempted first in alphabetical order. If they are not available, the weighted channels are selected as described in the previous paragraph.
3.6.4 Network sprayers
A network sprayer distributes the load it receives to servers contained in a cluster (a set of servers that run the same application and can provide the same contents to its clients). This mechanism is also known as IP spraying.
Edge componentsAn IP sprayer is a type of network sprayer that handles all incoming IP network requests, and sprays those requests across various HTTP servers. IBM Edge Components provides a software package that allows you to set up a machine to act as an IP sprayer. It also provides a variety of caching mechanisms.
Sysplex distributorThe sysplex distributor can be thought of as a network sprayer. From a z/OS perspective it is a marriage between the availability provided by dynamic virtual IP addressing and an interface to the z/OS Workload Manager to help direct connections to the most appropriate target. This z/OS component is described fully in IBM Redbooks publication TCP/IP in a Sysplex, SG24-5235.
Chapter 3. Product technologies for high availability 53

54 High Availability in WebSphere Messaging Solutions
Chapter 4. Operational considerations
This chapter describes factors to consider when designing, building, deploying, and managing a highly available messaging application.
4
© Copyright IBM Corp. 2010. All rights reserved. 55
4.1 Overview
When designing a highly available messaging solution, the high availability architecture alone does not guarantee high availability. There are a number of additional considerations to ensure that your application remains stable and that availability requirements can be met:
� Monitoring and alerting� Message dependencies� Configuration management� Capacity planning� Hardware reliability� Managing the application configuration� General considerations
– Service support processes– Testing– Backups– Security
In this chapter we touch on each of these topics and how they influence the availability of your messaging solution.
4.2 Monitoring and alerting
An IT infrastructure has events occurring 24x7. An event can be described as an activity at the hardware or software level and might be software-, application-, or business-related. For example, a power supply failure is a hardware event. An insurance claim arriving in a message queue is a business event. Events can generally be classified into the following types:
� Notification events
For information only, no action is necessary. For example, an audit log being transferred to a remote destination or files being recycled successfully.
� Error events
For conditions that might require an action. For example, an occasional message validation failure or authentication error due to invalid data being sent might not require specific action unless the event occurs repeatedly within a short period of time
� Critical events
For conditions when systems or applications are in a critical state and an immediate action is required. For example, CPU use reaching or exceeding its ceiling, a power supply failure, or a cluster node failure.
56 High Availability in WebSphere Messaging Solutions
Monitoring and alerting is critical to high availability. It allows you to identify potential issues before they arise and to respond quickly to incidents. Monitoring can be as comprehensive or as narrow as needed or desired. Events can be monitored at the hardware, software, and messaging level. For example, a power supply failure of a blade sever, a cluster node crashing, or tracking a transaction from the point it arrives in the infrastructure to the point when it is stored in a file or a database. Events can be correlated for an end-to-end view, tracking, and management.
In an infrastructure, consider monitoring the following components:
� Hardware components
– Edge components such as firewalls and Internet gateways– Networking equipment and connectivity (fiber channels, lease lines and so
forth)– Specialist devices such as content and virus scanners
� Middleware and messaging components
– Messaging infrastructure
For example, WebSphere MQ components such as queue managers and queues. In particular it is essential to monitor the dead letter queue and any application related backout queues if they exist.
– Enterprise service buses at the integration layer
For example, WebSphere Message Broker for components such as brokers, execution groups and flows, DataPower for processing policies, and so forth.
– Application server instances
For example, monitor WebSphere Application Server cells and clusters for server availability and performance. Monitor server pings, CPU usage, memory and swap space, disk space, and log files.
– Databases
Availability, space usage
� Storage systems
– Static and dynamic file systems– SAN, RAID arrays
The monitoring software allows you to define conditions or situations that act as triggers for alerting or invoking remedial actions that rectify the situation. In addition, it allows you to gather statistics and produce reports and graphs to analyze trends and performance.
Chapter 4. Operational considerations 57
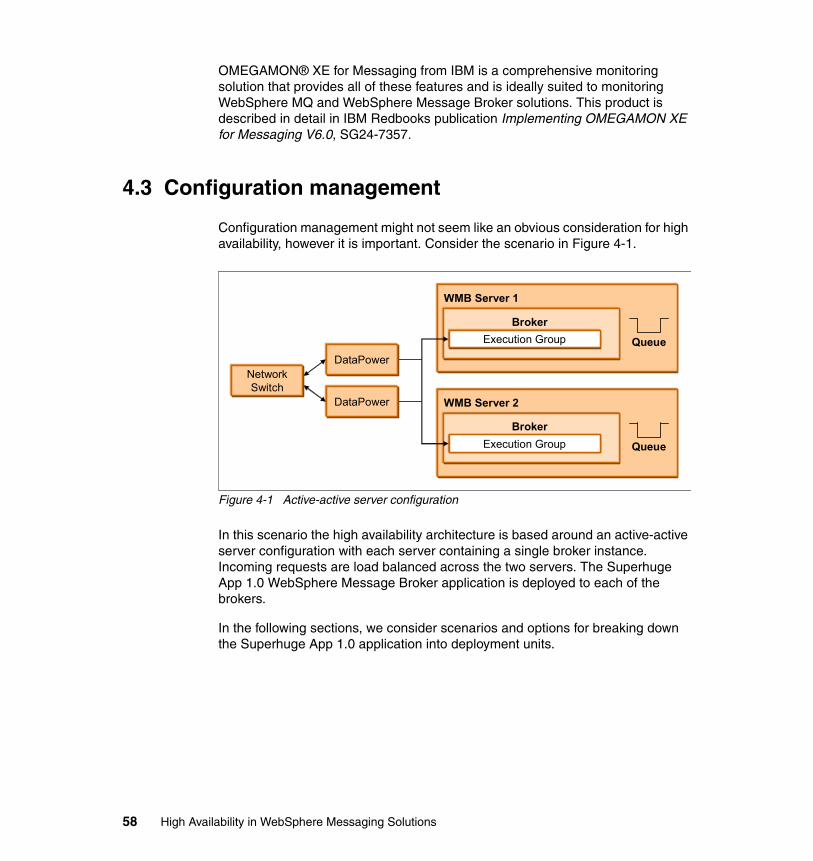
OMEGAMON® XE for Messaging from IBM is a comprehensive monitoring solution that provides all of these features and is ideally suited to monitoring WebSphere MQ and WebSphere Message Broker solutions. This product is described in detail in IBM Redbooks publication Implementing OMEGAMON XE for Messaging V6.0, SG24-7357.
4.3 Configuration management
Configuration management might not seem like an obvious consideration for high availability, however it is important. Consider the scenario in Figure 4-1.
Figure 4-1 Active-active server configuration
In this scenario the high availability architecture is based around an active-active server configuration with each server containing a single broker instance. Incoming requests are load balanced across the two servers. The Superhuge App 1.0 WebSphere Message Broker application is deployed to each of the brokers.
In the following sections, we consider scenarios and options for breaking down the Superhuge App 1.0 application into deployment units.
WMB Server 1
DataPower
DataPower
Broker
Queue
WMB Server 2
Broker
Execution Group Queue
NetworkSwitch
Execution Group
58 High Availability in WebSphere Messaging Solutions

4.3.1 Deployment scenario 1: The big bang
In the big bang scenario our Superhuge App 1.0 application is packaged for deployment in one single bar file for all of the message flows and message sets. This is depicted in Figure 4-2.
Figure 4-2 Sample application in a single BAR file
A minor patch has been made to one of the message flows. Due to the nature of the change, however, all instances of the application must be at the same patch level. That is, we cannot have requests coming into broker 1 that contain the new patch and requests routed to broker 2 that do not contain the patch. This results in data inconsistencies.
To deploy safely this minor patch for Superhuge App 1.0 using a single bar file, as depicted in Figure 4-2 we need an outage of the entire application. This will violate our availability SLAs.
Bar File
Message Set
Message Definition
Asset Message Flows
Message DefinitionMessage Definition
Message Definition
HR Message Flows
Roster Message Flows
Common Message Flows
Chapter 4. Operational considerations 59
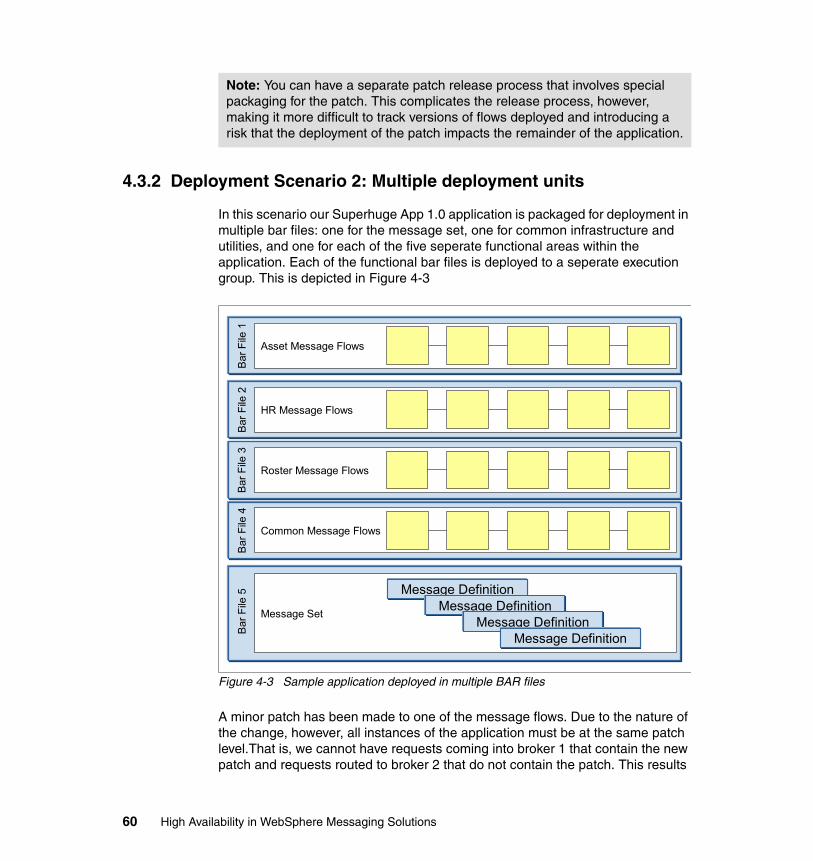
4.3.2 Deployment Scenario 2: Multiple deployment units
In this scenario our Superhuge App 1.0 application is packaged for deployment in multiple bar files: one for the message set, one for common infrastructure and utilities, and one for each of the five seperate functional areas within the application. Each of the functional bar files is deployed to a seperate execution group. This is depicted in Figure 4-3
Figure 4-3 Sample application deployed in multiple BAR files
A minor patch has been made to one of the message flows. Due to the nature of the change, however, all instances of the application must be at the same patch level.That is, we cannot have requests coming into broker 1 that contain the new patch and requests routed to broker 2 that do not contain the patch. This results
Note: You can have a separate patch release process that involves special packaging for the patch. This complicates the release process, however, making it more difficult to track versions of flows deployed and introducing a risk that the deployment of the patch impacts the remainder of the application.
Bar
File
5B
ar F
ile 4
Bar
File
3B
ar F
ile 2
Message Set
Asset Message Flows
HR Message Flows
Roster Message Flows
Common Message Flows
Bar
File
1
Message DefinitionMessage Definition
Message DefinitionMessage Definition
60 High Availability in WebSphere Messaging Solutions
in inconsistencies. In this case, the minor patch is a message flow that has been packaged in bar file 4.
To deploy this minor patch for Superhuge App 1.0 we do not need an outage of the entire application. We can stop execution group 4 on both servers and deploy bar file 4. The use of multiple deployment units means that we have minimized the impact to the users and only a subset of the functions have been impacted. If the functions in bar file 4 are used infrequently, there might be no noticeable impact to users.
4.3.3 Deciding how to break down the application into deploymentunits
Deploying multiple units is a big improvement compared with the big bang option. There are various ways to break down your application into deployment units and each approach has its trade-offs.
Generally speaking a higher number of deployment units equates to more flexibility in terms of deployment. However the trade-off is that there might be additional configuration management effort.
The key message here is to consider the availability impacts when deciding how to break down your messaging application into deployment units.
4.4 Capacity planning
When planning for redundancy it is essential to perform capacity planning to ensure that in the event of an outage the remaining infrastructure can cope with the full load during peak times. Otherwise there can be performance degradation or an inability to process all client requests.
Gather metrics or calculate estimates for the peak number of requests per hour, current and projected disk space requirements, current and projected memory requirements, and growth rates for each of the metrics considered.
Chapter 4. Operational considerations 61
Often this information is difficult to gather, especially for completely new systems, so it is difficult to get specific data. In the absence of specific data you might need to rely on rough estimates. Sources of this data include:
� Subject matter experts
� Analysis of existing systems or existing paper-based processing
� Analysis based on the application functionality/user profiles (for example, the number of message flows, size of messages and the number and type of users)
� Estimating based on educated guesses or industry-wide averages
4.5 Hardware reliability
Use of redundancy to provide high availability is not a replacement for using reliable hardware. With every hardware failure there is a risk that in-flight requests are lost. This impacts the users of the system.
Hardware reliability means the ability of a hardware components to operate correctly over a specified time period. Do not confuse this with fault tolerance, which is the ability to continue operation in the event of failure conditions.
Reliability is measured by the mean time between failures (MTBF) metric, which is calculated as shown in the following equation:
MTBF = (uptime hours) / (number of failures)
When making a hardware selection for servers, external storage, network infrastructure (such as switches or any other hardware components that form part of your solution), take into account the available reliability data. This might include benchmarking or white papers provided by the vendor or by independent third parties.
Use of generic so-called white-box servers at a fraction of the price of vendor products comes with added risk, because their server reliability characteristics are difficult to gauge.
4.6 Managing the application configuration
When designing a solution, plan how the application is to be configured. Avoid hard-coding configuration parameters, as this requires an application coding change and release to implement the change. This situation can require an outage of the application. The common practice is to externalize all configuration
62 High Availability in WebSphere Messaging Solutions
in a properties file so that changes can be made by updating the configuration file. This includes passwords that can be encrypted and stored in an external file.
4.7 General considerations
There are many other aspects of the software development and support processes that must be in place to ensure high availability of your messaging solution. These are of a general nature and apply equally to non-messaging applications.
4.7.1 Service support processes
Poor support processes are a major cause of outages in companies that do not have strict processes in place. Before putting any application into production you must have a robust service support structure in place, which includes the following tactics:
� Documented processes and procedures for change management, incident management, release management, and configuration management.
� A change control board or other organizational structure in place to manage the processes and ensure compliance.
� Tools to support these processes.
� Training for development and support staff.
The industry standard for managing IT services is the Information Technology Infrastructure Library (ITIL®), which is published by the United Kingdom's Office of Government Commerce (OGC). ITIL consists of a comprehensive library of concepts, processes, and practices and encompasses a range of topics for managing IT infrastructure. For more information about ITIL, see the OGC web site:
http://www.ogc.gov.uk/guidance_itil.asp
4.7.2 Testing
Most organizations perform functional testing prior to the release of an application that aims to ensure that baseline functionality works as per the specification. But many cut corners on other essential forms of testing, and this often leads to outages following a software release.
Chapter 4. Operational considerations 63
Performance testingIn addition to functional testing it is essential to perform operability testing before going into production. Operability testing includes performance testing to ensure that the application can handle the expected peak loads plus an allowance for a growth factor or sudden large request bursts.
There are a number of tools available to automate the performance testing process including IBM Rational® Performance Tester. This tool allows you to perform the following tasks:
� Create and execute performance test scripts.� Emulate a high load on the system by multiple users.� Analyze the results to identify performance bottlenecks.� Compare results against non-functional requirements
For more information about performance and quality tools see the following IBM Web site:
http://www-01.ibm.com/software/rational/offerings/quality/performance.html
Security testingSecurity testing is another form of testing that is frequently overlooked but is essential, especially for solutions that expose services externally. There have been numerous high profile denial of service attacks that have resulted in application being unavailable.
Large applications in particular benefit from the use of testing tools that automate security analysis and help scale the testing process for thousands of security vulnerabilities. IBM Rational AppScan® is an industry-leading Web application security testing tool that scans and tests for all common Web application vulnerabilities. For more information about the Rational AppScan family of products, see the following IBM Web site:
http://www-01.ibm.com/software/awdtools/appscan/
The Open Web Application Security Project (OWASP) provides an excellent security testing framework that can be used as a basis for developing security testing plans and test cases. For more information, see the OWASP Web site:
http://www.owasp.org
High availability solution testingWith most large and complex applications that require high availability there are multiple failure points that need to be considered. It is not sufficient to put effort into the design and build of a high availability solution and then perform no testing or to take an ad hoc approach to testing. Your test strategy should
64 High Availability in WebSphere Messaging Solutions
incorporate high availability testing to cover a range of possible failure scenarios that are applicable to your particular solution.
Testing should also encompass the end-to-end solution and be tested under the identical network environment that the solution is to be deployed to in production. This is to ensure that the effects of load balancers, firewalls, network switches, and other hardware devices that might impact the network traffic are factored in to test results.
4.7.3 Backup and recovery
There are two aspects of the backup process that need to be considered with respect to high availability. The first is to design a solution that allows online backups to be performed without impacting the application. You want to avoid, for instance, having to take an entire system offline to perform backups because there is a risk that a failure in the remaining online node (for a two node solution) can result in an outage.
It is worthwhile to note the importance of a documented and tested recovery process. Most applications take backups but companies often do not test this process. When they have to recover after a failure, they learn that the backups did not work or that there is a flaw in the process. There are known cases in which this has occurred and resulted in extended outages or even complete loss of data.
4.7.4 Security
As mentioned in 4.7.2, “Testing” on page 63, when discussing security testing, the risk of attack from malicious users is real and is increasing. Denial of service attacks can cause extended application outages. Malicious attacks can target the application data or the application itself, which can cause service disruptions and loss of data and have a major financial impact on companies.
To mitigate this risk, security should be a key focus of architecture, design, and coding plans and practices. Testing is a final checkpoint to verify that the security measures put in place are effective and provide a degree of comfort that the application is secured. Do not rely on testing alone, however. Security is a fundamental consideration and it is far more cost effective if planned for early in the analysis and design phases.
Chapter 4. Operational considerations 65

66 High Availability in WebSphere Messaging Solutions
Part 2 Scenarios
This part provides scenarios that illustrate different techniques for introducing high availability into your WebSphere solutions.
Part 2
© Copyright IBM Corp. 2010. All rights reserved. 67

68 High Availability in WebSphere Messaging Solutions
Chapter 5. High availability using PowerHA clusters
This chapter presents a scenario that demonstrates the use of a PowerHA cluster to provide a highly available file transfer solution.
5
© Copyright IBM Corp. 2010. All rights reserved. 69
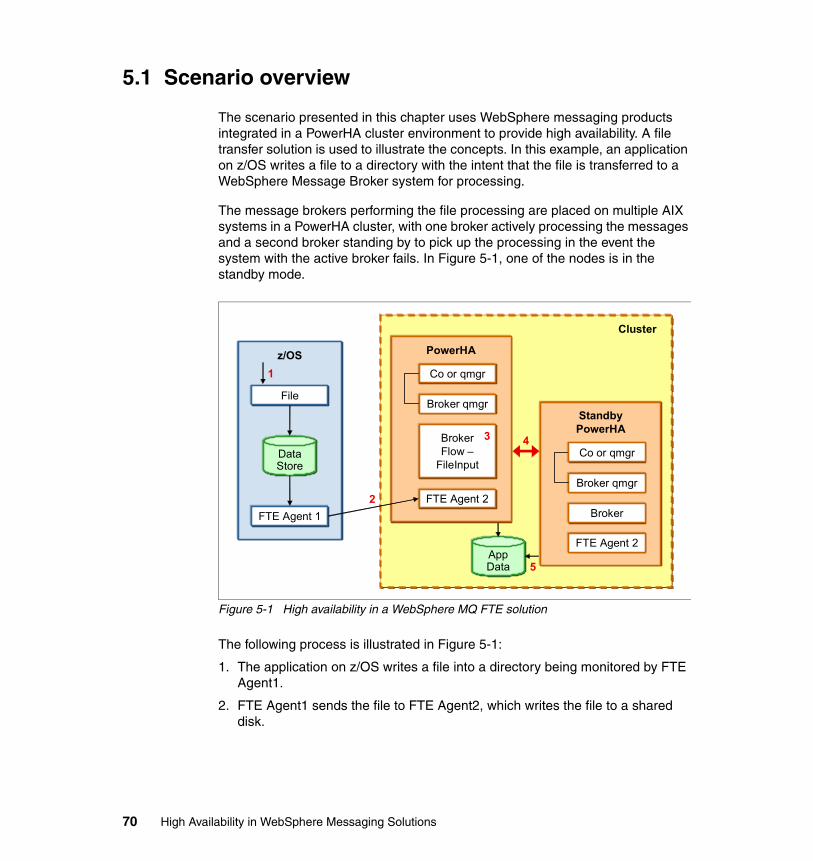
5.1 Scenario overview
The scenario presented in this chapter uses WebSphere messaging products integrated in a PowerHA cluster environment to provide high availability. A file transfer solution is used to illustrate the concepts. In this example, an application on z/OS writes a file to a directory with the intent that the file is transferred to a WebSphere Message Broker system for processing.
The message brokers performing the file processing are placed on multiple AIX systems in a PowerHA cluster, with one broker actively processing the messages and a second broker standing by to pick up the processing in the event the system with the active broker fails. In Figure 5-1, one of the nodes is in the standby mode.
Figure 5-1 High availability in a WebSphere MQ FTE solution
The following process is illustrated in Figure 5-1:
1. The application on z/OS writes a file into a directory being monitored by FTE Agent1.
2. FTE Agent1 sends the file to FTE Agent2, which writes the file to a shared disk.
Cluster
z/OS
FTE Agent 1
File
DataStore
1
2
AppData
StandbyPowerHA
Co or qmgr
Broker qmgr
Broker
FTE Agent 2
PowerHA
Co or qmgr
Broker qmgr
BrokerFlow –
FileInput
FTE Agent 2
5
43
70 High Availability in WebSphere Messaging Solutions

3. A message flow within the broker of the active node processes the file to perform enrichment and transformation activities on the file. The flow uses the FileInput node to receive the file.
4. The heartbeat-using disk feature (diskhb) is used by the PowerHA systems to exchange heartbeat packets or messages between nodes. It allows the cluster managers to continue communicating if the network fails.
5. The MQ data and log files, and the configuration files of broker and FTE are also stored on shared disks that are available to all cluster nodes.
5.2 High availability characteristics of the scenario
In the architectural design of this scenario, we implemented a failover cluster or a standby configuration. The messaging components of MQ, FTE, and Broker provide high availability of file transfer services. The components are configured in one resource group. By using the cluster standby mode configuration, all resources can be redirected to another node in the cluster when a failure occurs on the active cluster node. Two types of failure (implemented in the PowerHA cluster) can be detected during operation:
� In the event of an application component failure, MQ, FTE, or Broker, the resource group can be taken over by a standby node if the monitoring for the PowerHA application server is configured.
� In case of hardware failure (such as of a IP network, node or network interface), the recovery happens for the whole resource group.
This standby configuration of the cluster is more appropriate for batch file transfer and can fulfill the requirements of the proposed application scenario. If a cluster active-active mode is chosen, the coordination of two cluster nodes for input file processing is a big challenge.
The MQ queue managers on AIX node are the key components of this HA solution. They provide the base functionality for FTE file agents. It is essential to configure them as high available components. We briefly explain the standard recovery concepts of WebSphere MQ and how this method is implemented for a standby configuration in a PowerHA cluster.
WebSphere MQ uses a simple mechanism dealing with recovery of message queues after a failure of a queue manager. To recover persistent messages, MQ saves log messages to disk storage during an MQ transaction. In the event of a failure, message data on the disk and the queue manager logs are used to reconstruct the message queues. This restores the queue manager to a consistent state that existed at the time before the failure occurred.
Chapter 5. High availability using PowerHA clusters 71
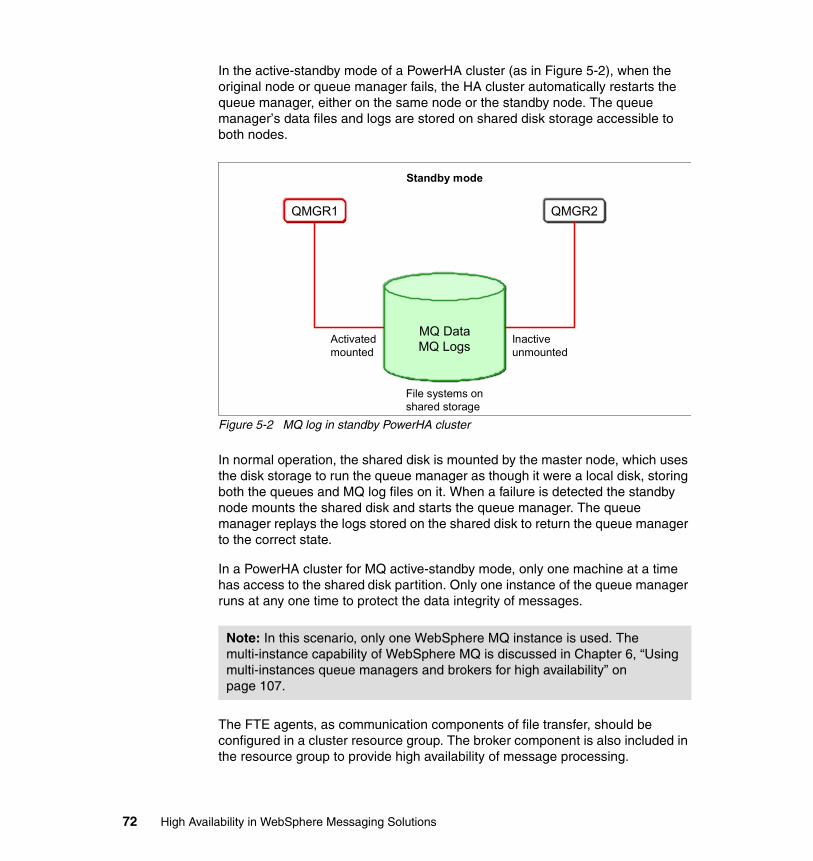
In the active-standby mode of a PowerHA cluster (as in Figure 5-2), when the original node or queue manager fails, the HA cluster automatically restarts the queue manager, either on the same node or the standby node. The queue manager’s data files and logs are stored on shared disk storage accessible to both nodes.
Figure 5-2 MQ log in standby PowerHA cluster
In normal operation, the shared disk is mounted by the master node, which uses the disk storage to run the queue manager as though it were a local disk, storing both the queues and MQ log files on it. When a failure is detected the standby node mounts the shared disk and starts the queue manager. The queue manager replays the logs stored on the shared disk to return the queue manager to the correct state.
In a PowerHA cluster for MQ active-standby mode, only one machine at a time has access to the shared disk partition. Only one instance of the queue manager runs at any one time to protect the data integrity of messages.
The FTE agents, as communication components of file transfer, should be configured in a cluster resource group. The broker component is also included in the resource group to provide high availability of message processing.
Note: In this scenario, only one WebSphere MQ instance is used. The multi-instance capability of WebSphere MQ is discussed in Chapter 6, “Using multi-instances queue managers and brokers for high availability” on page 107.
QMGR1 QMGR2
MQ DataMQ Logs
Standby mode
Activatedmounted
Inactiveunmounted
File systems onshared storage
72 High Availability in WebSphere Messaging Solutions
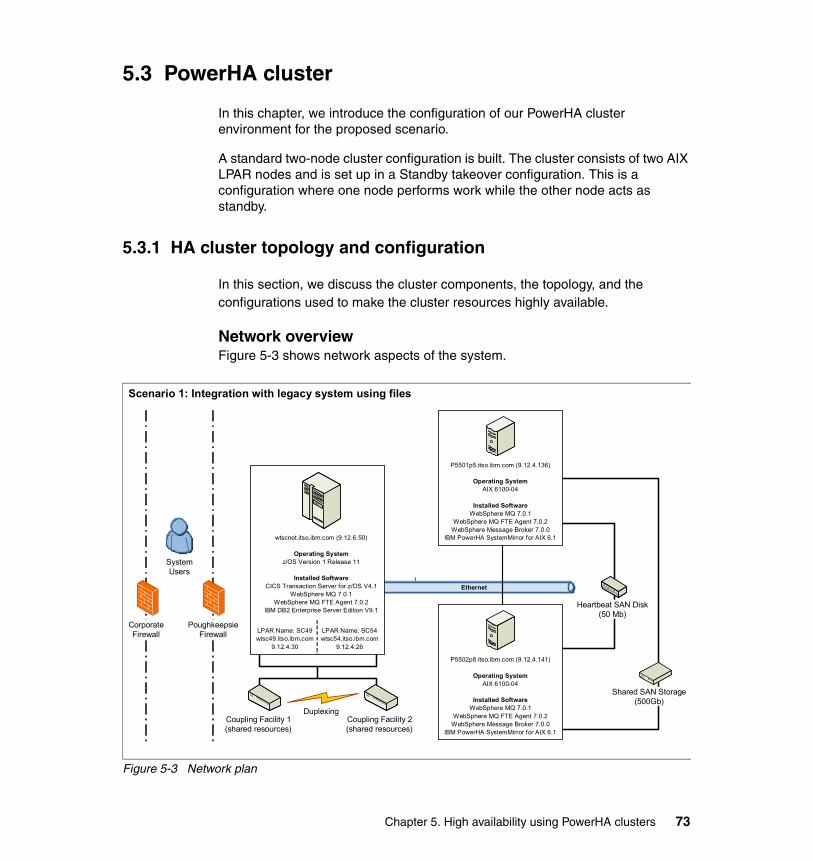
5.3 PowerHA cluster
In this chapter, we introduce the configuration of our PowerHA cluster environment for the proposed scenario.
A standard two-node cluster configuration is built. The cluster consists of two AIX LPAR nodes and is set up in a Standby takeover configuration. This is a configuration where one node performs work while the other node acts as standby.
5.3.1 HA cluster topology and configuration
In this section, we discuss the cluster components, the topology, and the configurations used to make the cluster resources highly available.
Network overviewFigure 5-3 shows network aspects of the system.
Figure 5-3 Network plan
Scenario 1: Integration with legacy system using files
SystemUsers
Ethernet
wtscnet.itso.ibm.com (9.12.6.50)
Operating Systemz/OS Version 1 Release 11
Installed SoftwareCICS Transaction Server for z/OS V4.1
WebSphere MQ 7.0.1WebSphere MQ FTE Agent 7.0.2
IBM DB2 Enterprise Server Edition V9.1
LPAR Name: SC49wtsc49.itso.ibm.com
9.12.4.30
LPAR Name: SC54wtsc54.itso.ibm.com
9.12.4.26
Coupling Facility 1(shared resources)
DuplexingCoupling Facility 2(shared resources)
PoughkeepsieFirewall
CorporateFirewall
Heartbeat SAN Disk(50 Mb)
Shared SAN Storage(500Gb)
P5501p5.itso.ibm.com (9.12.4.136)
Operating SystemAIX 6100-04
Installed SoftwareWebSphere MQ 7.0.1
WebSphere MQ FTE Agent 7.0.2WebSphere Message Broker 7.0.0
IBM PowerHA SystemMirror for AIX 6.1
P5502p8.itso.ibm.com (9.12.4.141)
Operating SystemAIX 6100-04
Installed SoftwareWebSphere MQ 7.0.1
WebSphere MQ FTE Agent 7.0.2WebSphere Message Broker 7.0.0
IBM PowerHA SystemMirror for AIX 6.1
Chapter 5. High availability using PowerHA clusters 73
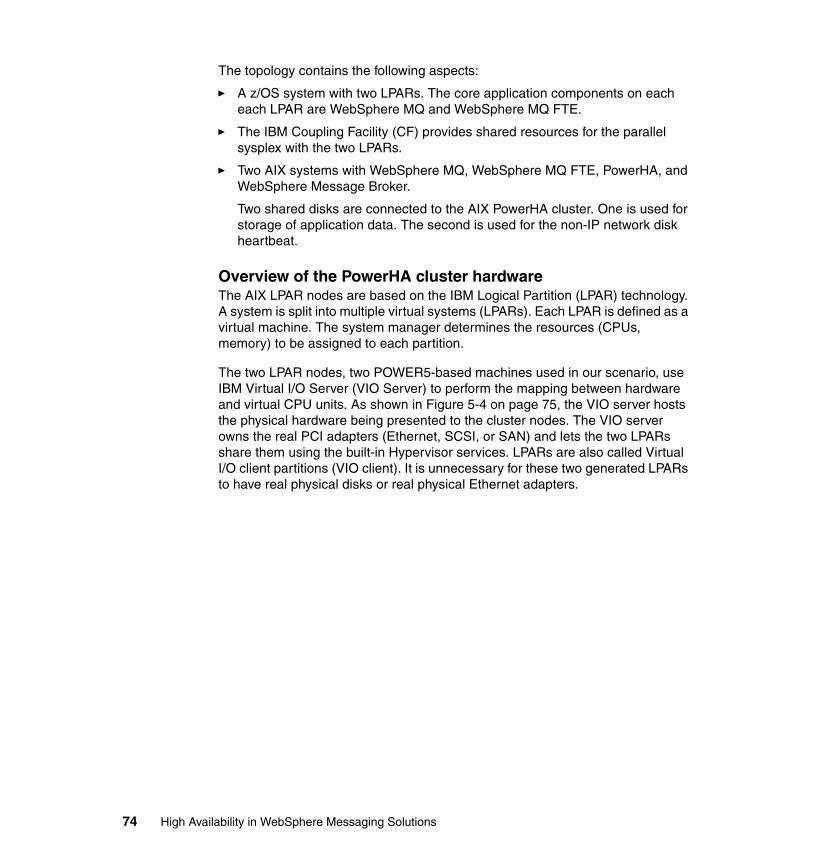
The topology contains the following aspects:
� A z/OS system with two LPARs. The core application components on each each LPAR are WebSphere MQ and WebSphere MQ FTE.
� The IBM Coupling Facility (CF) provides shared resources for the parallel sysplex with the two LPARs.
� Two AIX systems with WebSphere MQ, WebSphere MQ FTE, PowerHA, and WebSphere Message Broker.
Two shared disks are connected to the AIX PowerHA cluster. One is used for storage of application data. The second is used for the non-IP network disk heartbeat.
Overview of the PowerHA cluster hardwareThe AIX LPAR nodes are based on the IBM Logical Partition (LPAR) technology. A system is split into multiple virtual systems (LPARs). Each LPAR is defined as a virtual machine. The system manager determines the resources (CPUs, memory) to be assigned to each partition.
The two LPAR nodes, two POWER5-based machines used in our scenario, use IBM Virtual I/O Server (VIO Server) to perform the mapping between hardware and virtual CPU units. As shown in Figure 5-4 on page 75, the VIO server hosts the physical hardware being presented to the cluster nodes. The VIO server owns the real PCI adapters (Ethernet, SCSI, or SAN) and lets the two LPARs share them using the built-in Hypervisor services. LPARs are also called Virtual I/O client partitions (VIO client). It is unnecessary for these two generated LPARs to have real physical disks or real physical Ethernet adapters.
74 High Availability in WebSphere Messaging Solutions
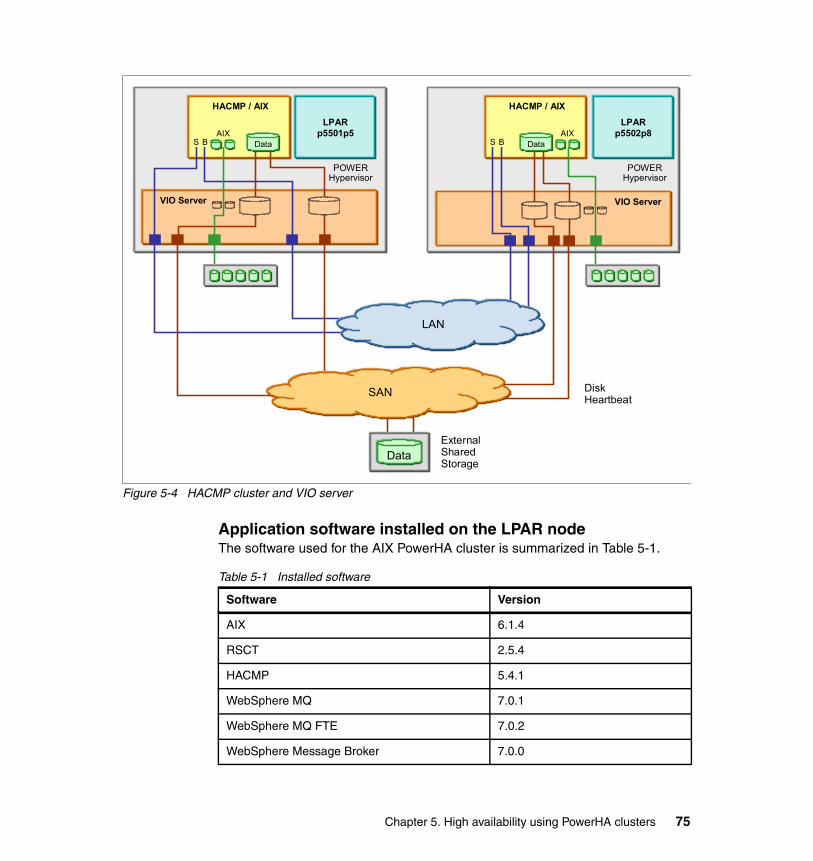
Figure 5-4 HACMP cluster and VIO server
Application software installed on the LPAR nodeThe software used for the AIX PowerHA cluster is summarized in Table 5-1.
Table 5-1 Installed software
HACMP / AIX
ExternalSharedStorage
DiskHeartbeat
VIO Server
POWERHypervisor
AIXS B Data
LPARp5501p5
Data
VIO Server
HACMP / AIX
POWERHypervisor
S B
LPARp5502p8AIX
Data
LAN
SAN
Software Version
AIX 6.1.4
RSCT 2.5.4
HACMP 5.4.1
WebSphere MQ 7.0.1
WebSphere MQ FTE 7.0.2
WebSphere Message Broker 7.0.0
Chapter 5. High availability using PowerHA clusters 75
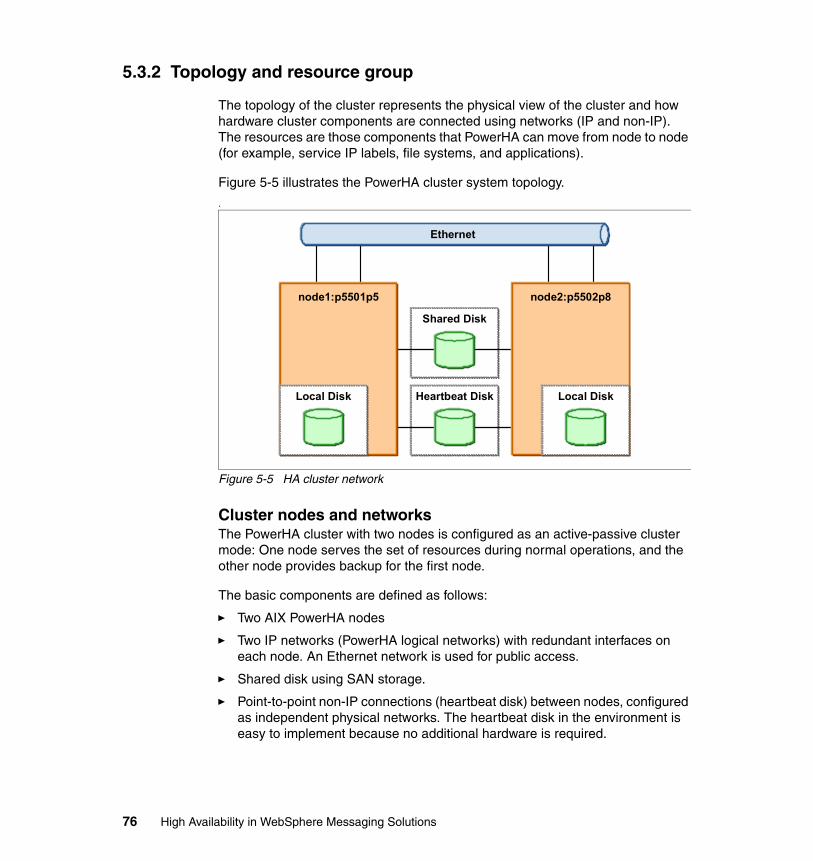
5.3.2 Topology and resource group
The topology of the cluster represents the physical view of the cluster and how hardware cluster components are connected using networks (IP and non-IP). The resources are those components that PowerHA can move from node to node (for example, service IP labels, file systems, and applications).
Figure 5-5 illustrates the PowerHA cluster system topology.
.
Figure 5-5 HA cluster network
Cluster nodes and networksThe PowerHA cluster with two nodes is configured as an active-passive cluster mode: One node serves the set of resources during normal operations, and the other node provides backup for the first node.
The basic components are defined as follows:
� Two AIX PowerHA nodes
� Two IP networks (PowerHA logical networks) with redundant interfaces on each node. An Ethernet network is used for public access.
� Shared disk using SAN storage.
� Point-to-point non-IP connections (heartbeat disk) between nodes, configured as independent physical networks. The heartbeat disk in the environment is easy to implement because no additional hardware is required.
Ethernet
Heartbeat Disk
Shared Disk
node1:p5501p5
Local Disk
node2:p5502p8
Local Disk
76 High Availability in WebSphere Messaging Solutions

The heartbeat network provides an additional path for keep alive (or heartbeat) packets and allows the cluster managers to continue communicating if the network fails. This network is not a TCP/IP network. Having this non-TCP/IP network is a important requirement, because it provides system protection against two single points of failure:
� The failure of the TCP/IP software subsystem� The failure of the single network
IP aliasingAn IP alias is an IP label (address) that is configured onto a network interface card, as an additional method of managing the service IP. The IP alias can be configured through AIX (smitty inetalias) before configuring the HA cluster. Use the persistent alias as the communication path to the node.
Figure 5-6 illustrates the concept of the persistent address. Note that this is another IP address configured on one of the base interfaces.
Figure 5-6 IP Alias
Preparing the shared diskTo prepare the shared disk of the PowerHA cluster, shared volume groups must be created. The file systems reside on the shared disk devices. Our configuration has one volume group: data_vg.
The volume groups, logical volumes, and file systems shared by the two nodes in the cluster are created on one node (in our example, node p5501p5). After that, the volume group is exported. On the other node, all components are imported.
Persistent Aliasnode01
Base Adapternode01a
Base Adapternode01b
Base Adapternode02b
Persistent Aliasnode02
Base Adapternode02a
Network
CommunicationInterfaces(adapters)
node01 node02
Chapter 5. High availability using PowerHA clusters 77
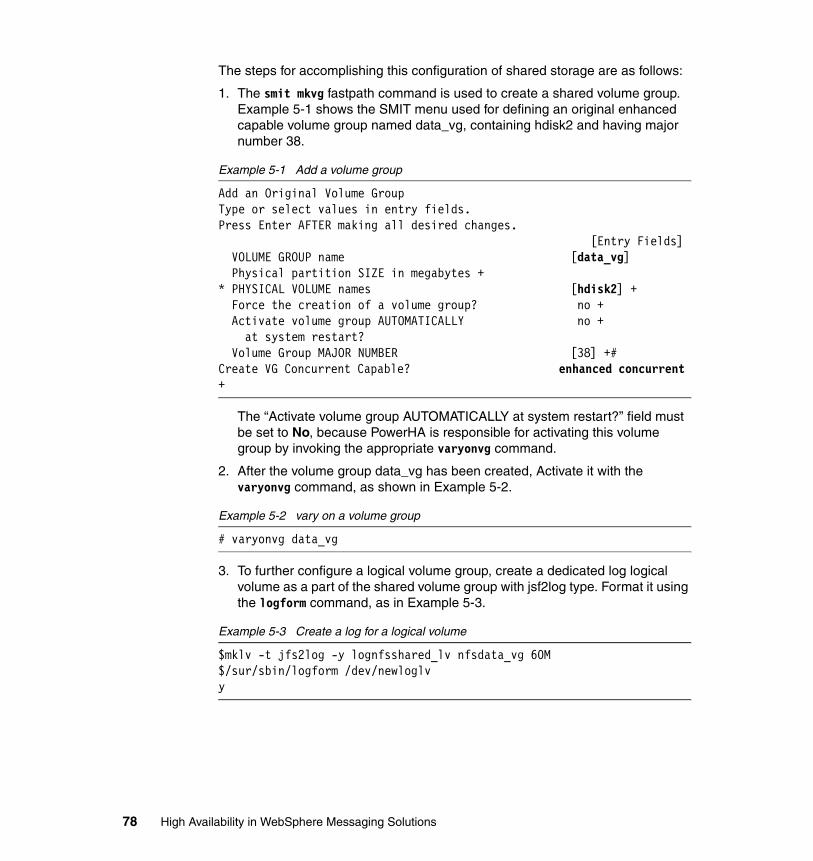
The steps for accomplishing this configuration of shared storage are as follows:
1. The smit mkvg fastpath command is used to create a shared volume group. Example 5-1 shows the SMIT menu used for defining an original enhanced capable volume group named data_vg, containing hdisk2 and having major number 38.
Example 5-1 Add a volume group
Add an Original Volume GroupType or select values in entry fields.Press Enter AFTER making all desired changes. [Entry Fields] VOLUME GROUP name [data_vg] Physical partition SIZE in megabytes +* PHYSICAL VOLUME names [hdisk2] + Force the creation of a volume group? no + Activate volume group AUTOMATICALLY no + at system restart? Volume Group MAJOR NUMBER [38] +#Create VG Concurrent Capable? enhanced concurrent +
The “Activate volume group AUTOMATICALLY at system restart?” field must be set to No, because PowerHA is responsible for activating this volume group by invoking the appropriate varyonvg command.
2. After the volume group data_vg has been created, Activate it with the varyonvg command, as shown in Example 5-2.
Example 5-2 vary on a volume group
# varyonvg data_vg
3. To further configure a logical volume group, create a dedicated log logical volume as a part of the shared volume group with jsf2log type. Format it using the logform command, as in Example 5-3.
Example 5-3 Create a log for a logical volume
$mklv -t jfs2log -y lognfsshared_lv nfsdata_vg 60M$/sur/sbin/logform /dev/newloglvy
78 High Availability in WebSphere Messaging Solutions

As shown in Example 5-4, issuing the smitty mklv command displays the panel for adding a logical volume.
Example 5-4 Add a logical volume on volume group
Add a Logical VolumeType or select values in entry fields.Press Enter AFTER making all desired changes.[TOP] [Entry Fields] Logical volume NAME [shared_lv]* VOLUME GROUP name data_vg* Number of LOGICAL PARTITIONS [20] # PHYSICAL VOLUME names [ ] + Logical volume TYPE [jfs2] + POSITION on physical volume middle + RANGE of physical volumes minimum + MAXIMUM NUMBER of PHYSICAL VOLUMES [] # to use for allocation Number of COPIES of each logical 1 + partition Mirror Write Consistency? active + Allocate each logical partition copy yes + on a SEPARATE physical volume? RELOCATE the logical volume during yes + reorganization? Logical volume LABEL [] MAXIMUM NUMBER of LOGICAL PARTITIONS [512] # Enable BAD BLOCK relocation? yes + SCHEDULING POLICY for writing/reading parallel + logical partition copies Enable WRITE VERIFY? no + File containing ALLOCATION MAP [] Stripe Size? [Not Striped] +Serialize IO? no + Mirror Pool for First Copy + Mirror Pool for Second Copy + Mirror Pool for Third Copy +
Now the file systems on logical volume shared_lv can be defined.
Chapter 5. High availability using PowerHA clusters 79

4. To create the file system, use the SMIT fastpath smitty crfs command at the command line. Use the AIX system administration command, as in Example 5-5.
Example 5-5 Create a file system on logical volume
$crfs -v jfs2 -p rw -d /dev/shared_lv -m /MQHA -A yesOutputFile system created successfully.262135796 kilobytes total disk space.New File System size is 524288000
5. Mount the file systems to check that creation has been successful, as shown in Example 5-6.
Example 5-6 Mount file system
# mount /MQHA
6. Assuming that the file systems mounted without problems, now unmount them. After the shared file systems are unmounted, the shared volume group data_vg can be inactivated off with the command shown in Example 5-7.
Example 5-7 Vary off volume group
# varyoffvg data_vg
7. On the node where the shared volume group is prepared, volume group data_vg is exported at first, as in Example 5-8.
Example 5-8 Export volume group
# exportvg data_vg
8. The exported shared volume group, data_vg, is imported on the other cluster node by using the importvg command, as in Example 5-9.
Example 5-9 Import volume group
# importvg -y data_vg -V 38 hdisk2
9. Mount the file systems to check that import has been successful.
80 High Availability in WebSphere Messaging Solutions
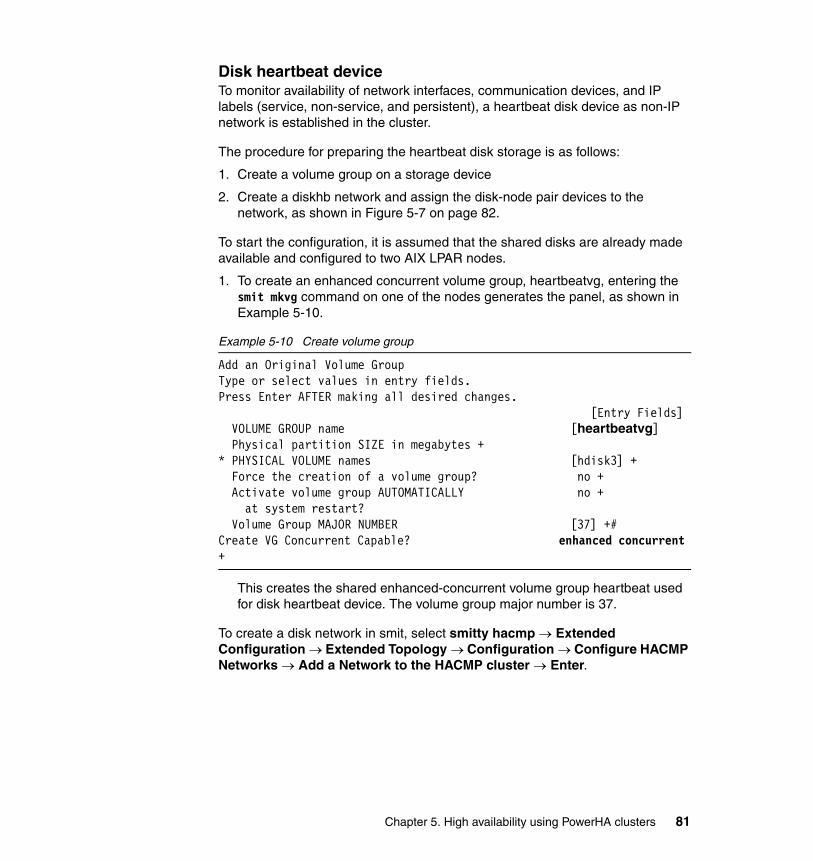
Disk heartbeat deviceTo monitor availability of network interfaces, communication devices, and IP labels (service, non-service, and persistent), a heartbeat disk device as non-IP network is established in the cluster.
The procedure for preparing the heartbeat disk storage is as follows:
1. Create a volume group on a storage device
2. Create a diskhb network and assign the disk-node pair devices to the network, as shown in Figure 5-7 on page 82.
To start the configuration, it is assumed that the shared disks are already made available and configured to two AIX LPAR nodes.
1. To create an enhanced concurrent volume group, heartbeatvg, entering the smit mkvg command on one of the nodes generates the panel, as shown in Example 5-10.
Example 5-10 Create volume group
Add an Original Volume GroupType or select values in entry fields.Press Enter AFTER making all desired changes. [Entry Fields] VOLUME GROUP name [heartbeatvg] Physical partition SIZE in megabytes +* PHYSICAL VOLUME names [hdisk3] + Force the creation of a volume group? no + Activate volume group AUTOMATICALLY no + at system restart? Volume Group MAJOR NUMBER [37] +#Create VG Concurrent Capable? enhanced concurrent +
This creates the shared enhanced-concurrent volume group heartbeat used for disk heartbeat device. The volume group major number is 37.
To create a disk network in smit, select smitty hacmp Extended Configuration Extended Topology Configuration Configure HACMP Networks Add a Network to the HACMP cluster Enter.
Chapter 5. High availability using PowerHA clusters 81

When prompted to select a serial network to add to the cluster, select diskhb, as shown in Example 5-11.
Example 5-11 Add a serial network to cluster
Add a Serial Network to the HACMP ClusterType or select values in entry fields.Press Enter AFTER making all desired changes. [Entry Fields]* Network Name [net_diskhb_01]* Network Type diskhb
The network name is net_diskhb_01 and the type of network is diskhb, as shown in Figure 5-7.
Figure 5-7 Network of Heartbeat Disk
To assign the disk-node pair devices to the network, use smitty hacmp Extended Configuration Extended Topology Configuration Configure HACMP Communication Interfaces/Devices Add Communication Interfaces/Devices Add Pre-Defined Communication Interfaces and Devices Communication Devices Choose your diskhb Network Name, as shown in Example 5-12 on page 83.
P5501p5_hbdisk P5502p8_hbdisk
/dev/heartbeatvg
EnhancedConcurrent
Volume Group
PVID
Network Name: net_diskhb_01Network Type: diskhb
82 High Availability in WebSphere Messaging Solutions

Example 5-12 Assign the devices to the network
Add a Communication DeviceType or select values in entry fields.Press Enter AFTER making all desired changes. [Entry Fields]* Device Name [p5501p5_hbdisk]* Network Type diskhb* Network Name net_diskhb_01* Device Path [/dev/p5501p5_hbdisk]* Node Name [p5501p5 ] +
On the other node, the device name is selected to be p5502p8_hbdisk.
Note: The dhb_read command is used to test the connectivity of the heartbeat device in the HA cluster:
1) Set the first node in receive mode (-r):
# /usr/sbin/rsct/bin/dhb_read -p device_name -r
2) Set the second node to transmit mode (-t):
# /usr/sbin/rsct/bin/dhb_read -p device_name -t
Chapter 5. High availability using PowerHA clusters 83
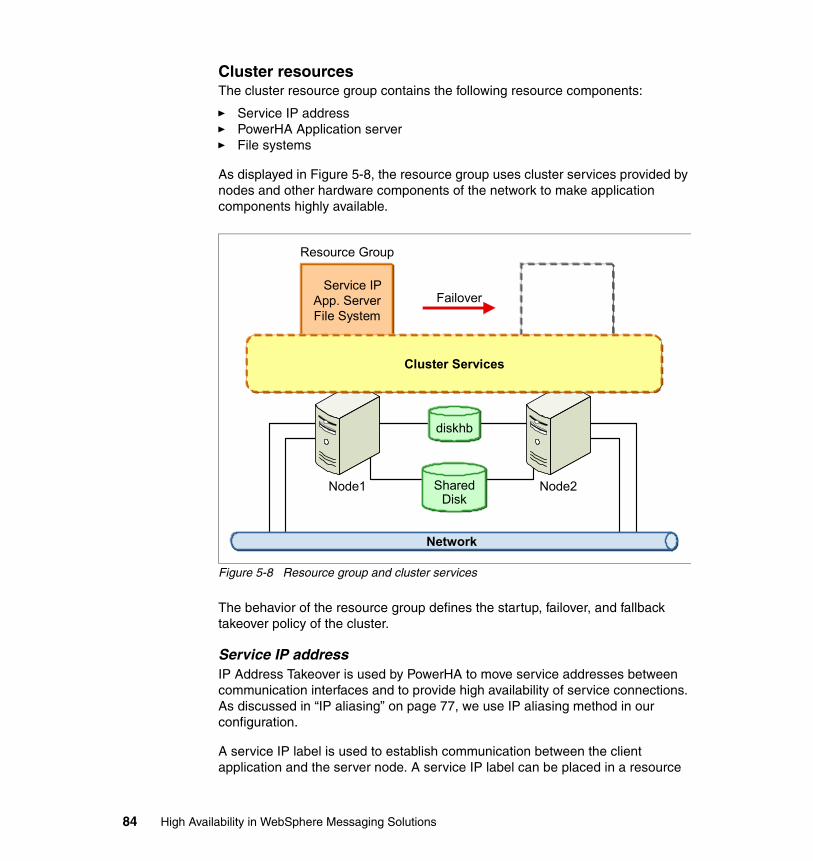
Cluster resourcesThe cluster resource group contains the following resource components:
� Service IP address� PowerHA Application server� File systems
As displayed in Figure 5-8, the resource group uses cluster services provided by nodes and other hardware components of the network to make application components highly available.
Figure 5-8 Resource group and cluster services
The behavior of the resource group defines the startup, failover, and fallback takeover policy of the cluster.
Service IP addressIP Address Takeover is used by PowerHA to move service addresses between communication interfaces and to provide high availability of service connections. As discussed in “IP aliasing” on page 77, we use IP aliasing method in our configuration.
A service IP label is used to establish communication between the client application and the server node. A service IP label can be placed in a resource
Service IPApp. ServerFile System
Failover
SharedDisk
Network
diskhb
Node1 Node2
Cluster Services
Resource Group
84 High Availability in WebSphere Messaging Solutions
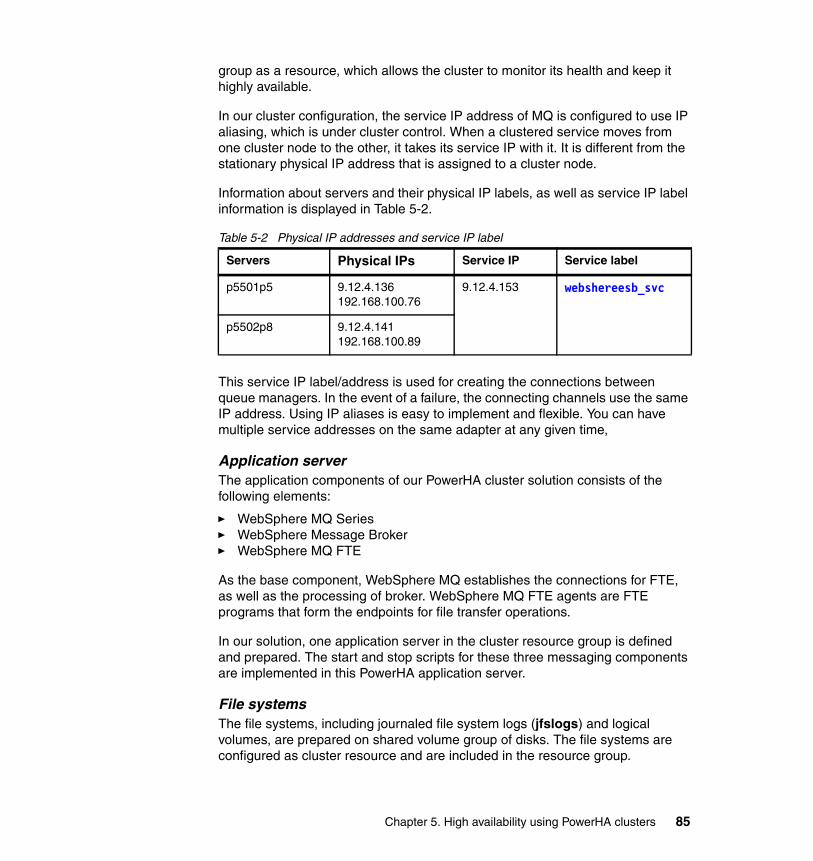
group as a resource, which allows the cluster to monitor its health and keep it highly available.
In our cluster configuration, the service IP address of MQ is configured to use IP aliasing, which is under cluster control. When a clustered service moves from one cluster node to the other, it takes its service IP with it. It is different from the stationary physical IP address that is assigned to a cluster node.
Information about servers and their physical IP labels, as well as service IP label information is displayed in Table 5-2.
Table 5-2 Physical IP addresses and service IP label
This service IP label/address is used for creating the connections between queue managers. In the event of a failure, the connecting channels use the same IP address. Using IP aliases is easy to implement and flexible. You can have multiple service addresses on the same adapter at any given time,
Application serverThe application components of our PowerHA cluster solution consists of the following elements:
� WebSphere MQ Series� WebSphere Message Broker� WebSphere MQ FTE
As the base component, WebSphere MQ establishes the connections for FTE, as well as the processing of broker. WebSphere MQ FTE agents are FTE programs that form the endpoints for file transfer operations.
In our solution, one application server in the cluster resource group is defined and prepared. The start and stop scripts for these three messaging components are implemented in this PowerHA application server.
File systemsThe file systems, including journaled file system logs (jfslogs) and logical volumes, are prepared on shared volume group of disks. The file systems are configured as cluster resource and are included in the resource group.
Servers Physical IPs Service IP Service label
p5501p5 9.12.4.136192.168.100.76
9.12.4.153 webshereesb_svc
p5502p8 9.12.4.141192.168.100.89
Chapter 5. High availability using PowerHA clusters 85
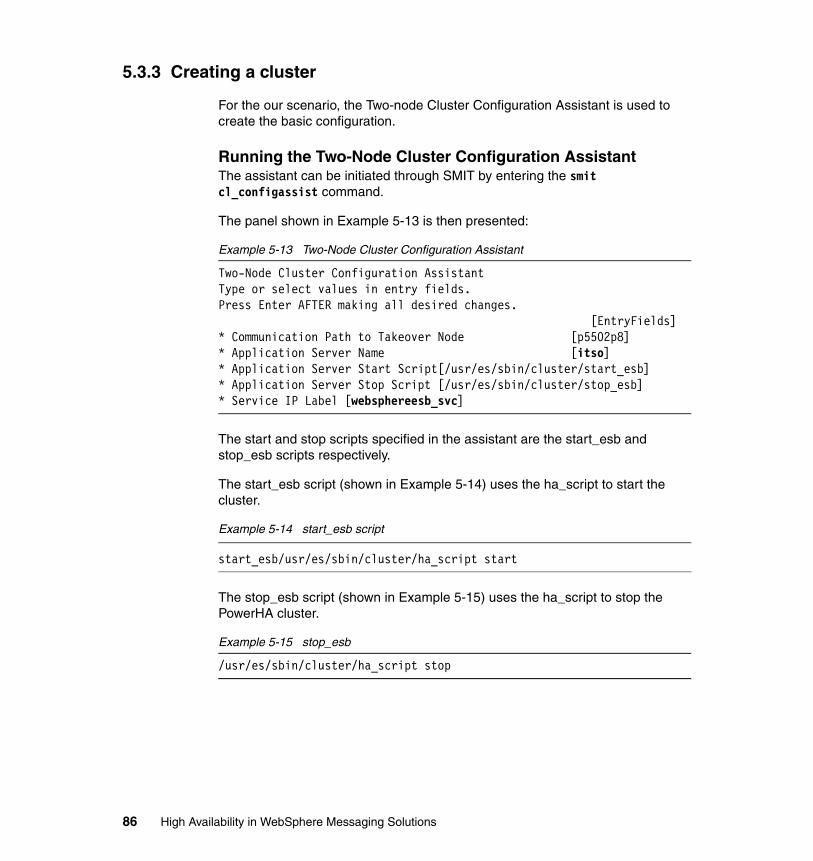
5.3.3 Creating a cluster
For the our scenario, the Two-node Cluster Configuration Assistant is used to create the basic configuration.
Running the Two-Node Cluster Configuration AssistantThe assistant can be initiated through SMIT by entering the smit cl_configassist command.
The panel shown in Example 5-13 is then presented:
Example 5-13 Two-Node Cluster Configuration Assistant
Two-Node Cluster Configuration AssistantType or select values in entry fields.Press Enter AFTER making all desired changes. [EntryFields]* Communication Path to Takeover Node [p5502p8]* Application Server Name [itso]* Application Server Start Script[/usr/es/sbin/cluster/start_esb]* Application Server Stop Script [/usr/es/sbin/cluster/stop_esb]* Service IP Label [websphereesb_svc]
The start and stop scripts specified in the assistant are the start_esb and stop_esb scripts respectively.
The start_esb script (shown in Example 5-14) uses the ha_script to start the cluster.
Example 5-14 start_esb script
start_esb/usr/es/sbin/cluster/ha_script start
The stop_esb script (shown in Example 5-15) uses the ha_script to stop the PowerHA cluster.
Example 5-15 stop_esb
/usr/es/sbin/cluster/ha_script stop
86 High Availability in WebSphere Messaging Solutions

Example 5-16 shows the ha_script.
Example 5-16 the ha_script, used to control PowerHA cluster
#!/bin/ksh
case $1 instart) su - mqm -c "strmqm MQK5" su - mqm -c "strmqm MQB5" su - mqm -c "fteStartAgent AGENT02" su - eaiadmin -c "mqsistart MQWMB" sleep 5 RC=0 ;;stop) su - mqm -c "endmqm MQK5" su - mqm -c "endmqm MQB5" su - mqm -c "fteStopAgent AGENT02" su - eaiadmin -c "mqsistop MQWMB" sleep 5 RC=0 ;;*) RC=255 ;;esacexit $RC
You must provide the name of the takeover node, the application server name, the start and stop scripts for the application server, and the service IP label.
Chapter 5. High availability using PowerHA clusters 87

The results of the assistant for the new resource group are displayed in Example 5-17.
Example 5-17 Results for the new resource group
Change/Show All Resources and Attributes for a Resource GroupResource Group Name itso_group Participating Nodes (Default Node Priority) p5501p5 p5502p8 Startup Policy Online On Home Node Only Fallover Policy Fallover To Next Priority Node In> Fallback Policy Never Fallback Service IP Labels/Addresses [webshereesb_svc]+ Application Servers [itso] + Volume Groups [data_vg heartbeatvg ] + Use forced varyon of volume groups, if necessary false + Automatically Import Volume Groups false + Filesystems (empty is ALL for VGs specified) [ ] + Filesystems Consistency Check fsck + Filesystems Recovery Method sequential + Filesystems mounted before IP configured false + Filesystems/Directories to Export (NFSv2/3) [] + Filesystems/Directories to Export (NFSv4) [] + Stable Storage Path (NFSv4) [] + Filesystems/Directories to NFS Mount [] Network For NFS Mount [] + Tape Resources [] + Raw Disk PVIDs [] + Fast Connect Services [] + Communication Links [] + Primary Workload Manager Class [] + Secondary Workload Manager Class [] + Miscellaneous Data [] WPAR Name [] +
The following list summarizes the main features of the configuration for the resource group:
� The resource group name is itso_group.
� The participating nodes with default node priority are p5501p5 and p5502p8.
� For the shared resource group, we use the following settings:
– Startup policy: Online On HomeNode Only– Fallover policy: Fallover To the Next Priority Node In the list– Fallback policy: Never Fallback
� The Service IP Labels/Addresses is set to websphereesb_svc
88 High Availability in WebSphere Messaging Solutions
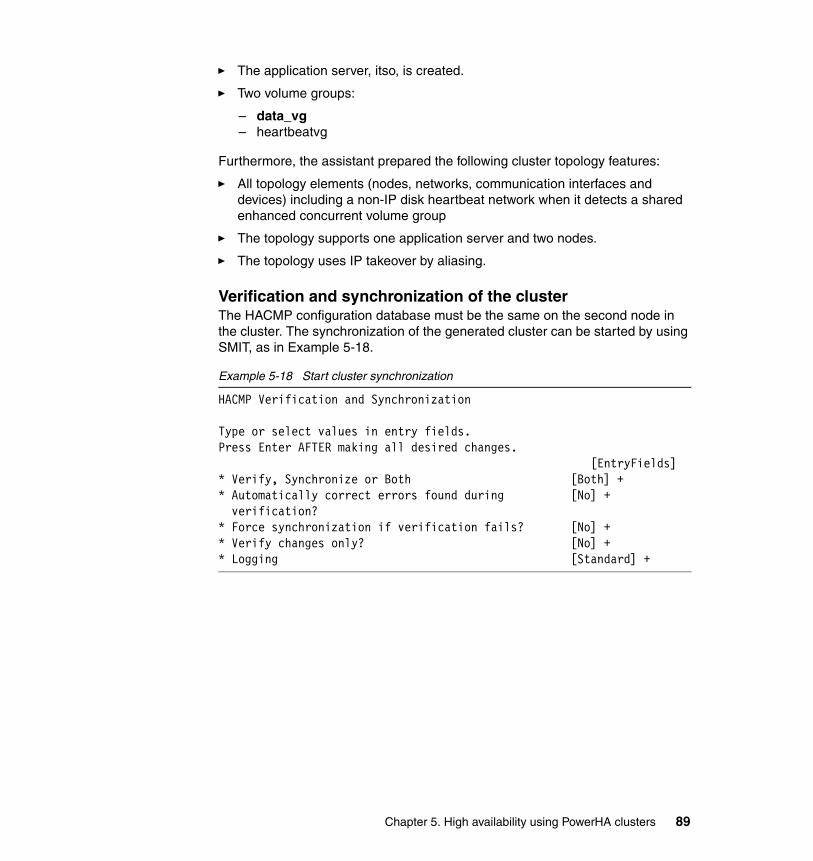
� The application server, itso, is created.
� Two volume groups:
– data_vg – heartbeatvg
Furthermore, the assistant prepared the following cluster topology features:
� All topology elements (nodes, networks, communication interfaces and devices) including a non-IP disk heartbeat network when it detects a shared enhanced concurrent volume group
� The topology supports one application server and two nodes.
� The topology uses IP takeover by aliasing.
Verification and synchronization of the clusterThe HACMP configuration database must be the same on the second node in the cluster. The synchronization of the generated cluster can be started by using SMIT, as in Example 5-18.
Example 5-18 Start cluster synchronization
HACMP Verification and Synchronization
Type or select values in entry fields.Press Enter AFTER making all desired changes. [EntryFields]* Verify, Synchronize or Both [Both] +* Automatically correct errors found during [No] + verification?* Force synchronization if verification fails? [No] +* Verify changes only? [No] +* Logging [Standard] +
Chapter 5. High availability using PowerHA clusters 89

The results of the cluster synchronization is shown in Example 5-19. The command status OK shows that the PowerHA cluster for file transfer has been successfully prepared.
Example 5-19 Cluster synchronization results
COMMAND STATUSCommand: OK stdout: yes stderr: noBefore command completion, additional instructions may appear below.Verification to be performed on the following: Cluster Topology Cluster ResourcesVerification will automatically correct verification errors.Retrieving data from available cluster nodes. This could take a few minutes. Start data collection on node p5502p8 Start data collection on node p5501p5 Collector on node p5502p8 completed Waiting on node p5501p5 data collection, 15 seconds elapsed Collector on node p5501p5 completed Data collection completeVerifying Cluster Topology... Completed 100 percent of the verification checks
90 High Availability in WebSphere Messaging Solutions
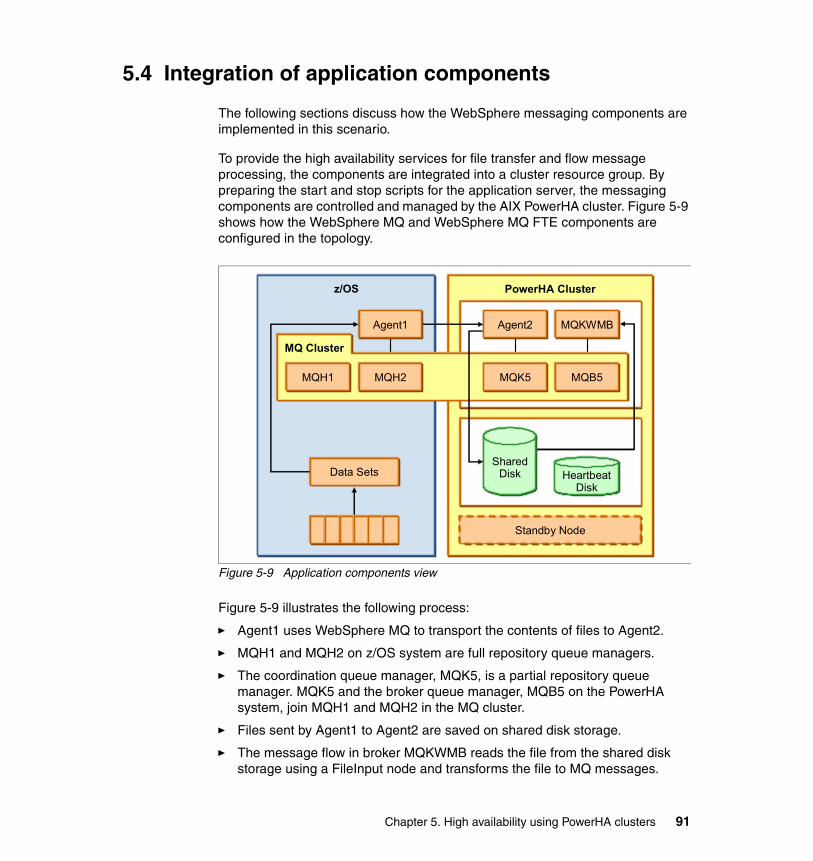
5.4 Integration of application components
The following sections discuss how the WebSphere messaging components are implemented in this scenario.
To provide the high availability services for file transfer and flow message processing, the components are integrated into a cluster resource group. By preparing the start and stop scripts for the application server, the messaging components are controlled and managed by the AIX PowerHA cluster. Figure 5-9 shows how the WebSphere MQ and WebSphere MQ FTE components are configured in the topology.
Figure 5-9 Application components view
Figure 5-9 illustrates the following process:
� Agent1 uses WebSphere MQ to transport the contents of files to Agent2.
� MQH1 and MQH2 on z/OS system are full repository queue managers.
� The coordination queue manager, MQK5, is a partial repository queue manager. MQK5 and the broker queue manager, MQB5 on the PowerHA system, join MQH1 and MQH2 in the MQ cluster.
� Files sent by Agent1 to Agent2 are saved on shared disk storage.
� The message flow in broker MQKWMB reads the file from the shared disk storage using a FileInput node and transforms the file to MQ messages.
PowerHA Clusterz/OS
HeartbeatDisk
SharedDisk
Standby Node
MQKWMB
MQH2MQH1 MQB5MQK5
Agent2
MQ Cluster
Data Sets
Agent1
Chapter 5. High availability using PowerHA clusters 91
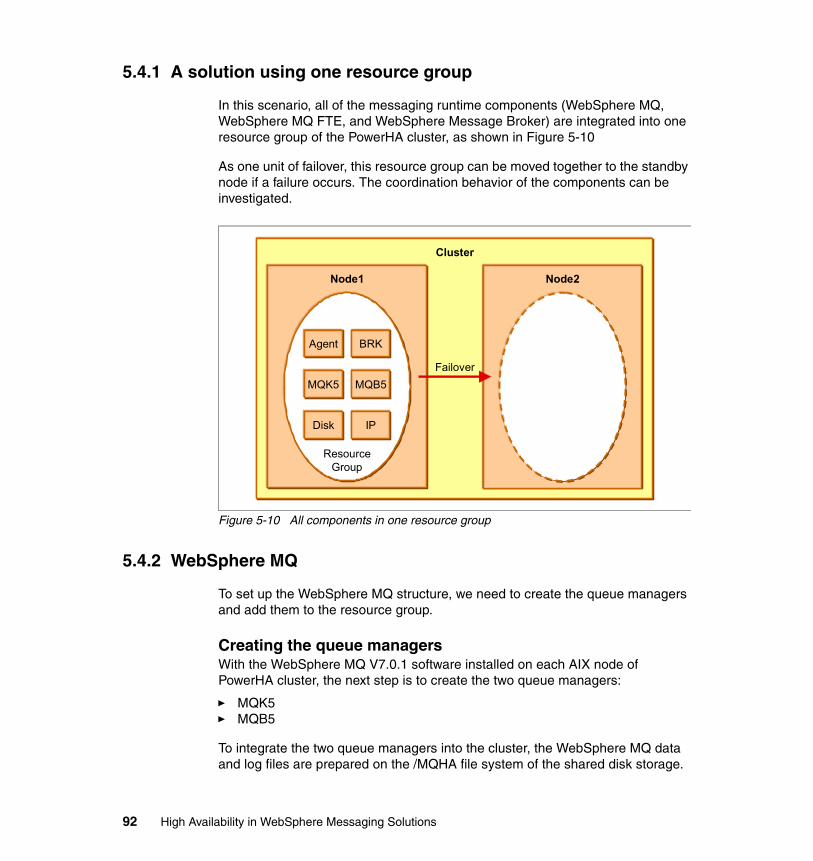
5.4.1 A solution using one resource group
In this scenario, all of the messaging runtime components (WebSphere MQ, WebSphere MQ FTE, and WebSphere Message Broker) are integrated into one resource group of the PowerHA cluster, as shown in Figure 5-10
As one unit of failover, this resource group can be moved together to the standby node if a failure occurs. The coordination behavior of the components can be investigated.
Figure 5-10 All components in one resource group
5.4.2 WebSphere MQ
To set up the WebSphere MQ structure, we need to create the queue managers and add them to the resource group.
Creating the queue managersWith the WebSphere MQ V7.0.1 software installed on each AIX node of PowerHA cluster, the next step is to create the two queue managers:
� MQK5� MQB5
To integrate the two queue managers into the cluster, the WebSphere MQ data and log files are prepared on the /MQHA file system of the shared disk storage.
Cluster
Node1
ResourceGroup
Agent
MQK5
Disk
BRK
MQB5
IP
Node2
Failover
92 High Availability in WebSphere Messaging Solutions
The new features in WebSphere MQ V7.0.1 for creating queue managers simplify this procedure.
1. Select a node on which to create the queue manager and mount the queue manager’s file systems on the selected node.
2. Create the data and logs directories (/MQHA/MQK5/data and /MQHA/MQK5/log) directories. Use the crtmqm command (Example 5-20) to create the MQK5 queue manager on this node.
Example 5-20 Create the queue manager
mkdir -p /MQHA/MQK5/datamkdir -p /MQHA/MQK5/logcrtmqm -md /MQHA/MQK5/data -ld /MQHA/MQK5/log QMK5
The addmqinf command is executed on the same node to add the queue manager configuration data to another instance of the same queue manager.
3. Use the command in Example 5-21 to add the reference files on the other node.
Example 5-21 Create the reference files
addmqinf -s QueueManager -v Name=MQK5 -v Directory=MQK5 -v Prefix=/var/mqm -v DataPath=/MQHA/MQK5/data/MQK5
The same process can be used to create broker queue manager MQB5.
Configuring the two queue managers in the resource groupThe two queue managers are represented in the PowerHA resource group by an application server. In our configuration, the two queue managers (MQK5 and MQB5) are implemented in the same application server of the resource group.
The start and stop scripts for the queue managers are created, as well as the start and stop scripts for the queue manager listeners. To provide the correct routing of channel communications to the queue managers, a seperate queue manager port number for each queue manager is used.
Synchronize the two nodes of the cluster.
Note: In our PowerHA solution, only one queue manager is active at a time. PowerHA is responsible for starting and stopping the queue managers to ensure that a queue manager is active at all times and maintains availability.
Chapter 5. High availability using PowerHA clusters 93
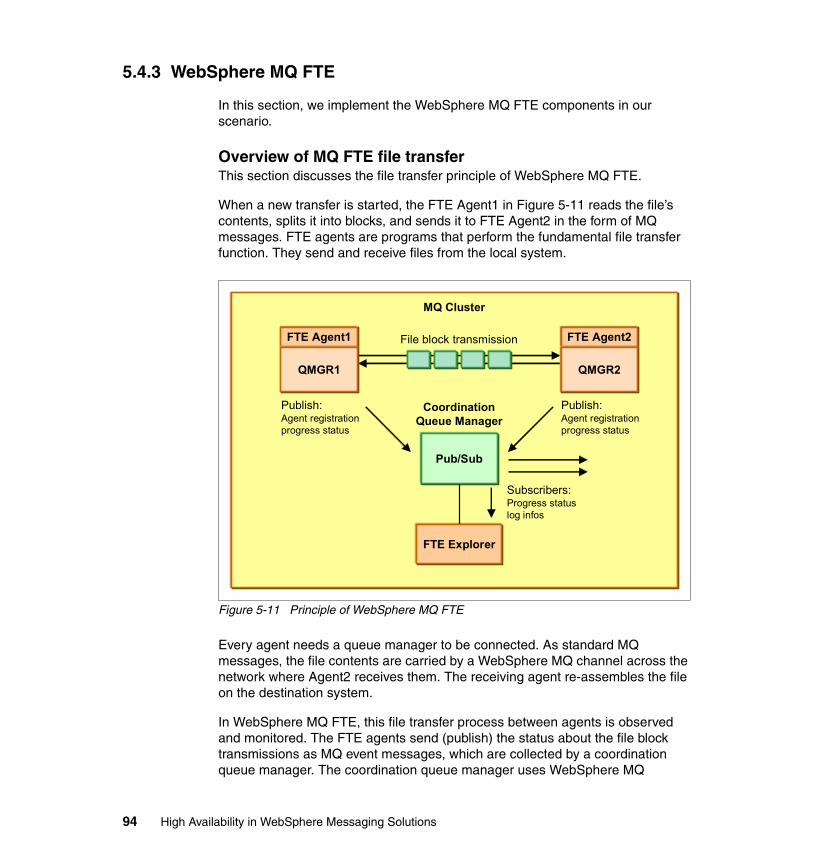
5.4.3 WebSphere MQ FTE
In this section, we implement the WebSphere MQ FTE components in our scenario.
Overview of MQ FTE file transferThis section discusses the file transfer principle of WebSphere MQ FTE.
When a new transfer is started, the FTE Agent1 in Figure 5-11 reads the file’s contents, splits it into blocks, and sends it to FTE Agent2 in the form of MQ messages. FTE agents are programs that perform the fundamental file transfer function. They send and receive files from the local system.
Figure 5-11 Principle of WebSphere MQ FTE
Every agent needs a queue manager to be connected. As standard MQ messages, the file contents are carried by a WebSphere MQ channel across the network where Agent2 receives them. The receiving agent re-assembles the file on the destination system.
In WebSphere MQ FTE, this file transfer process between agents is observed and monitored. The FTE agents send (publish) the status about the file block transmissions as MQ event messages, which are collected by a coordination queue manager. The coordination queue manager uses WebSphere MQ
MQ Cluster
Pub/Sub
Publish:Agent registrationprogress status
CoordinationQueue Manager
Publish:Agent registrationprogress status
Subscribers:Progress statuslog infos
File block transmission
FTE Explorer
FTE Agent1
QMGR1
FTE Agent2
QMGR2
94 High Availability in WebSphere Messaging Solutions
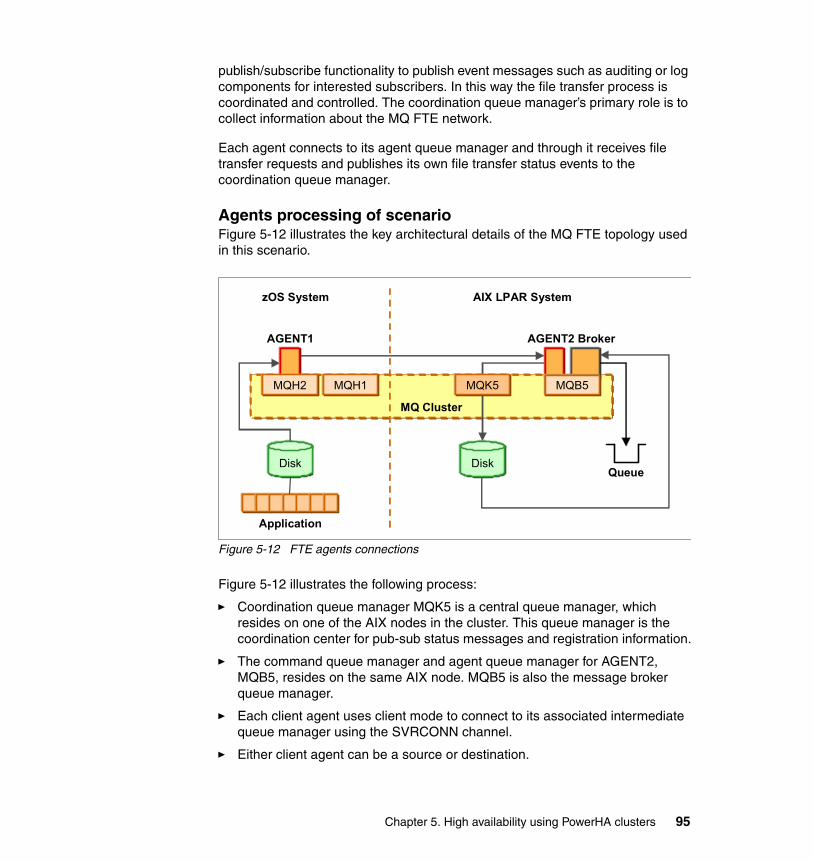
publish/subscribe functionality to publish event messages such as auditing or log components for interested subscribers. In this way the file transfer process is coordinated and controlled. The coordination queue manager’s primary role is to collect information about the MQ FTE network.
Each agent connects to its agent queue manager and through it receives file transfer requests and publishes its own file transfer status events to the coordination queue manager.
Agents processing of scenarioFigure 5-12 illustrates the key architectural details of the MQ FTE topology used in this scenario.
Figure 5-12 FTE agents connections
Figure 5-12 illustrates the following process:
� Coordination queue manager MQK5 is a central queue manager, which resides on one of the AIX nodes in the cluster. This queue manager is the coordination center for pub-sub status messages and registration information.
� The command queue manager and agent queue manager for AGENT2, MQB5, resides on the same AIX node. MQB5 is also the message broker queue manager.
� Each client agent uses client mode to connect to its associated intermediate queue manager using the SVRCONN channel.
� Either client agent can be a source or destination.
MQ Cluster
MQH1
Disk
zOS System AIX LPAR System
AGENT2 BrokerAGENT1
Application
QueueDisk
MQB5MQK5MQH2
Chapter 5. High availability using PowerHA clusters 95
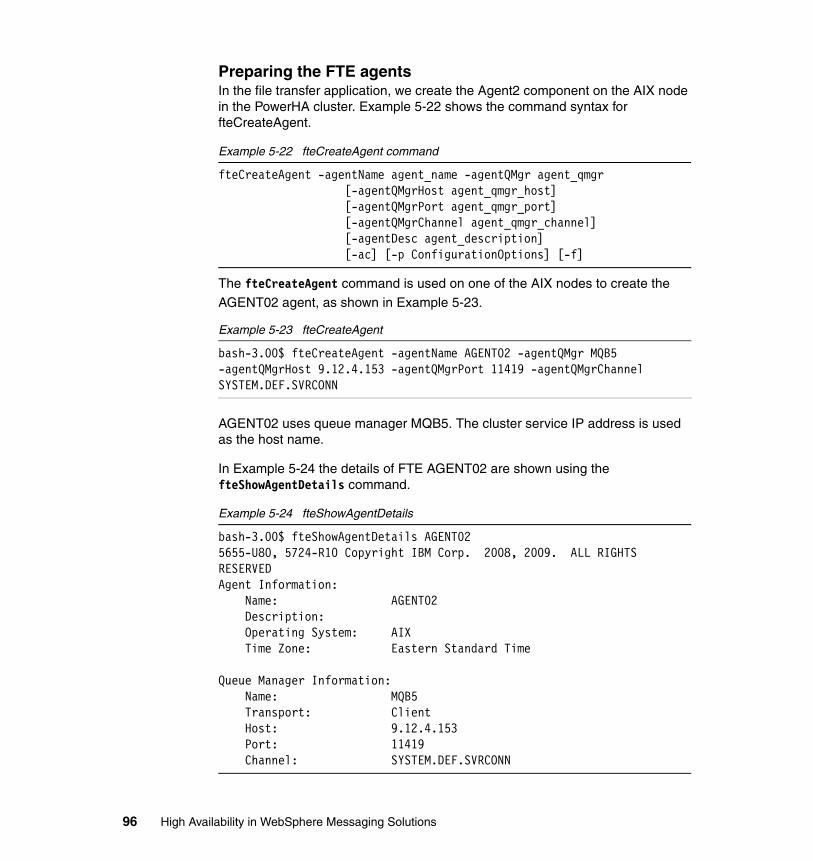
Preparing the FTE agentsIn the file transfer application, we create the Agent2 component on the AIX node in the PowerHA cluster. Example 5-22 shows the command syntax for fteCreateAgent.
Example 5-22 fteCreateAgent command
fteCreateAgent -agentName agent_name -agentQMgr agent_qmgr [-agentQMgrHost agent_qmgr_host] [-agentQMgrPort agent_qmgr_port] [-agentQMgrChannel agent_qmgr_channel] [-agentDesc agent_description] [-ac] [-p ConfigurationOptions] [-f]
The fteCreateAgent command is used on one of the AIX nodes to create the AGENT02 agent, as shown in Example 5-23.
Example 5-23 fteCreateAgent
bash-3.00$ fteCreateAgent -agentName AGENT02 -agentQMgr MQB5 -agentQMgrHost 9.12.4.153 -agentQMgrPort 11419 -agentQMgrChannel SYSTEM.DEF.SVRCONN
AGENT02 uses queue manager MQB5. The cluster service IP address is used as the host name.
In Example 5-24 the details of FTE AGENT02 are shown using the fteShowAgentDetails command.
Example 5-24 fteShowAgentDetails
bash-3.00$ fteShowAgentDetails AGENT025655-U80, 5724-R10 Copyright IBM Corp. 2008, 2009. ALL RIGHTS RESERVEDAgent Information: Name: AGENT02 Description: Operating System: AIX Time Zone: Eastern Standard Time
Queue Manager Information: Name: MQB5 Transport: Client Host: 9.12.4.153 Port: 11419 Channel: SYSTEM.DEF.SVRCONN
96 High Availability in WebSphere Messaging Solutions

The connection of AGENT02 to its queue manger MQB5 is defined using MQ FTE client mode. The parameters of host, port and channels are included.
Example 5-25 shows how fteStartAgent command is used to start the created AGENT02.
Example 5-25 fteStartAgent
bash-3.00$ fteStartAgent AGENT025655-U80, 5724-R10 Copyright IBM Corp. 2008, 2009. ALL RIGHTS RESERVEDBFGCL0030I: The request to start agent 'AGENT02' on this machine has been submitted.BFGCL0031I: Agent log files located at: /MQHA/WMQFTE/config/MQK5/agents/AGENT02bash-3.00$
The verification of the availability of AGENT02 is checked with the ftePingAgent command. The result is displayed in Example 5-26.
Example 5-26 ftePingAgent
bash-3.00$ ftePingAgent AGENT025655-U80, 5724-R10 Copyright IBM Corp. 2008, 2009. ALL RIGHTS RESERVEDBFGCL0212I: Issuing ping request to agent AGENT02BFGCL0213I: agent AGENT02 responded to ping in 0.532 seconds.
5.4.4 Including WebSphere Message Broker
To set up the WebSphere Message Broker components, we need to create the broker, and add it to the resource group.
Chapter 5. High availability using PowerHA clusters 97

Preparing broker componentTo create the broker component, the mqsicreatebroker command is used as shown in Example 5-27. MQB5 is used as the broker queue manager. The file system /MQHA is on the shared storage.
Example 5-27 Create broker
$ mqsicreatebroker MQWMB -q MQB5 -e /MQHA/MQWMBAMQ8110: WebSphere MQ queue manager already exists.WebSphere MQ queue manager 'MQB5' starting.13 log records accessed on queue manager 'MQB5' during the log replay phase.Log replay for queue manager 'MQB5' complete.Transaction manager state recovered for queue manager 'MQB5'.WebSphere MQ queue manager 'MQB5' started.The setmqaut command completed successfully.The setmqaut command completed successfully.The setmqaut command completed successfully.The setmqaut command completed successfully......The setmqaut command completed successfully.The setmqaut command completed successfully.The setmqaut command completed successfully.The setmqaut command completed successfully.BIP8071I: Successful command completion.$
On the other node, the broker instance is added using the commands shown in Example 5-28.
Example 5-28 Add broker instance
$ mqsiaddbrokerinstance MQWMB -e /MQHA/MQWMBAMQ7272: WebSphere MQ configuration information already exists.WebSphere MQ queue manager 'MQB5' starting.5 log records accessed on queue manager 'MQB5' during the log replay phase.Log replay for queue manager 'MQB5' complete.Transaction manager state recovered for queue manager 'MQB5'.WebSphere MQ queue manager 'MQB5' started.BIP8071I: Successful command completion.$
98 High Availability in WebSphere Messaging Solutions

Implementation in the clusterThe integration of broker component into a PowerHA cluster is straightforward. The broker services are included in the cluster application server of the resource group by adding the start and stop scripts. In WebSphere Message Broker V7.0.1, no configuration manager and separate database are used.
A broker runs as a pair of processes called bipservice and bipbroker. The latter process, in turn, creates the execution groups that run message flows. It is this collection of processes that are managed by HA software.
Processing of test message flowFigure 5-13 illustrates a simple test message flow of the scenario. A FileInputNode is used to read the transferred file from the shared storage. Each line of the file contents are processed as single MQ message. The output MQ messages from the file are put into a MQ output queue.
Figure 5-13 Broker message processing
Note: In the PowerHA cluster solution only one broker is active at a time. PowerHA is responsible for starting and stopping the broker to maintain availability.
SharedStorage
Agent2
Broker
FileInput MQOutput
MQ
Chapter 5. High availability using PowerHA clusters 99

5.5 Making file transfer highly available
This section presents the test scenarios and results of the PowerHA solution for file transfer.
Three test scenarios are performed:
� The basic functionality tests for the PowerHA cluster � Big file transfer in the cluster operational environment� A principal take-over test of the PowerHA cluster during the file transfer
processing, by moving the complete resource group from one node to another
5.5.1 Testing the basic cluster functions
The basic cluster functionality tests are as follows:
� Starting and stopping the cluster services� Bringing the resource group online and offline� Moving the resource group to another node.
Example 5-29 shows the cluster services are started on both cluster nodes by using the SMIT fast path smitty clstart.
Example 5-29 Start cluster services
Start Cluster ServicesType or select values in entry fields.Press Enter AFTER making all desired changes. [Entry Fields]* Start now, on system restart or both now + Start Cluster Services on these nodes [p5501p5] +* Manage Resource Groups Manually + BROADCAST message at startup? true + Startup Cluster Information Daemon? false + Ignore verification errors? false + Automatically correct errors found during Interactively + cluster start?
100 High Availability in WebSphere Messaging Solutions

To bring the resource group online, in SMIT, select HACMP Resource Group and Application Management Bring a Resource Group Offline. The picklist appears as in Example 5-30.
Example 5-30 Bring a resource group online
Bring a Resource Group OnlineType or select values in entry fields.Press Enter AFTER making all desired changes. [Entry Fields] Resource Group to Bring Online itso_group Node on Which to Bring Resource Group Online p5501p5
Example 5-31 shows how the resource group of the cluster can be moved to another node (graceful resource group takeover) by using smitty cl_admin HACMP Resource Group and Application Management Move a Resource Group to Another Node:
Example 5-31 Move a resource group
Move Resource Group(s) to Another NodeType or select values in entry fields.Press Enter AFTER making all desired changes. [Entry Fields] Resource Group(s) to be Moved itso_group Destination Node p5502p8
The test results are summarized in Table 5-3.
Table 5-3 Basic cluster function tests
Cluster Test Plan
Test #
Test Description Comments Results
Cluster services
1 Start service on node1. The cluster service on node1 starts
Status: OK
2 Start service on node2. The cluster service on node2 starts
Status: OK
Resource group
Chapter 5. High availability using PowerHA clusters 101

3 Bring the resource group on node1 online
The resource Group on itso_group goes online.
All application components are stared on node1:� Two queue managers and two
MQ listeners for qmgrs� Broker service� FTE agent
4 Move the resource group to node2
The resource group on node1 goes offline.
On node2 goes the resource group online.
All application components are stopped on node1:� Two queue managers and two
listeners for qmgrs� Broker service� FTE agent
All application components are stared on node2:� Two queue managers and two
listeners for qmgrs� Broker service� FTE agent
5 Bring the resource group on node2 offline
The resource Group on itso_group goes offline.
All application components are stopped on node2:� Two queue managers and two
listeners for qmgrs� Broker service� FTE agent
Cluster Test Plan
102 High Availability in WebSphere Messaging Solutions
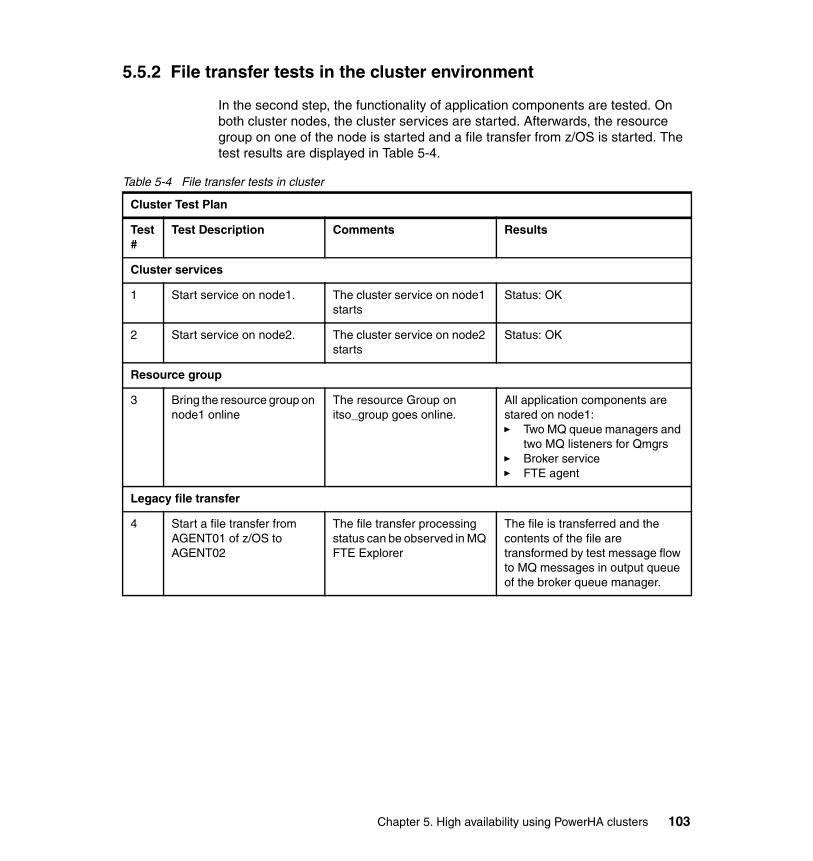
5.5.2 File transfer tests in the cluster environment
In the second step, the functionality of application components are tested. On both cluster nodes, the cluster services are started. Afterwards, the resource group on one of the node is started and a file transfer from z/OS is started. The test results are displayed in Table 5-4.
Table 5-4 File transfer tests in cluster
Cluster Test Plan
Test #
Test Description Comments Results
Cluster services
1 Start service on node1. The cluster service on node1 starts
Status: OK
2 Start service on node2. The cluster service on node2 starts
Status: OK
Resource group
3 Bring the resource group on node1 online
The resource Group on itso_group goes online.
All application components are stared on node1:� Two MQ queue managers and
two MQ listeners for Qmgrs� Broker service� FTE agent
Legacy file transfer
4 Start a file transfer from AGENT01 of z/OS to AGENT02
The file transfer processing status can be observed in MQ FTE Explorer
The file is transferred and the contents of the file are transformed by test message flow to MQ messages in output queue of the broker queue manager.
Chapter 5. High availability using PowerHA clusters 103
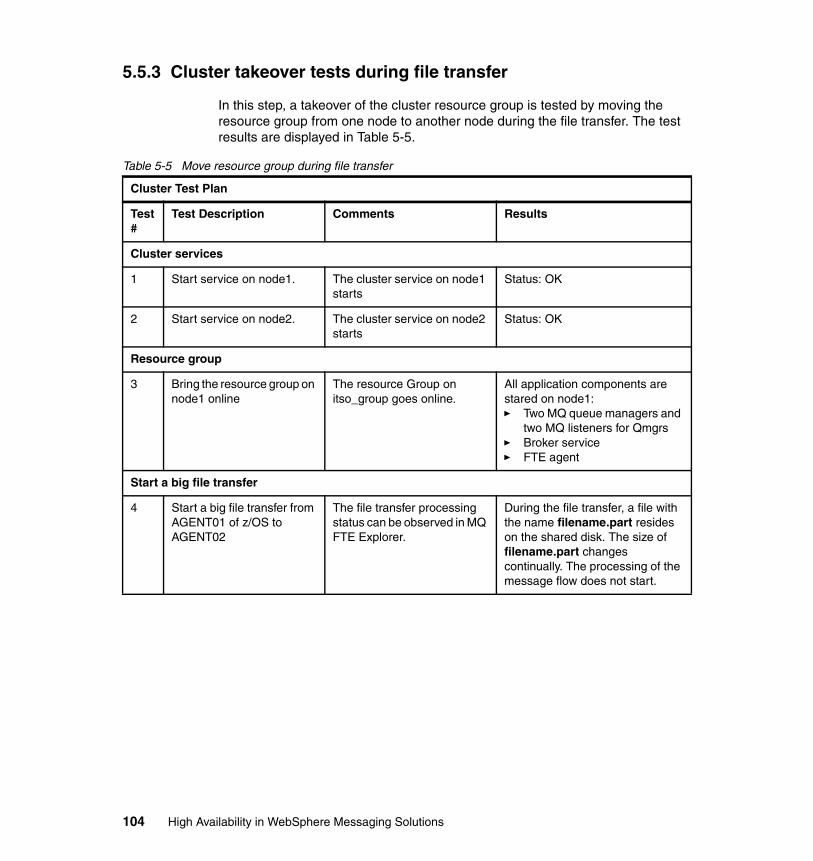
5.5.3 Cluster takeover tests during file transfer
In this step, a takeover of the cluster resource group is tested by moving the resource group from one node to another node during the file transfer. The test results are displayed in Table 5-5.
Table 5-5 Move resource group during file transfer
Cluster Test Plan
Test #
Test Description Comments Results
Cluster services
1 Start service on node1. The cluster service on node1 starts
Status: OK
2 Start service on node2. The cluster service on node2 starts
Status: OK
Resource group
3 Bring the resource group on node1 online
The resource Group on itso_group goes online.
All application components are stared on node1:� Two MQ queue managers and
two MQ listeners for Qmgrs� Broker service� FTE agent
Start a big file transfer
4 Start a big file transfer from AGENT01 of z/OS to AGENT02
The file transfer processing status can be observed in MQ FTE Explorer.
During the file transfer, a file with the name filename.part resides on the shared disk. The size of filename.part changes continually. The processing of the message flow does not start.
104 High Availability in WebSphere Messaging Solutions
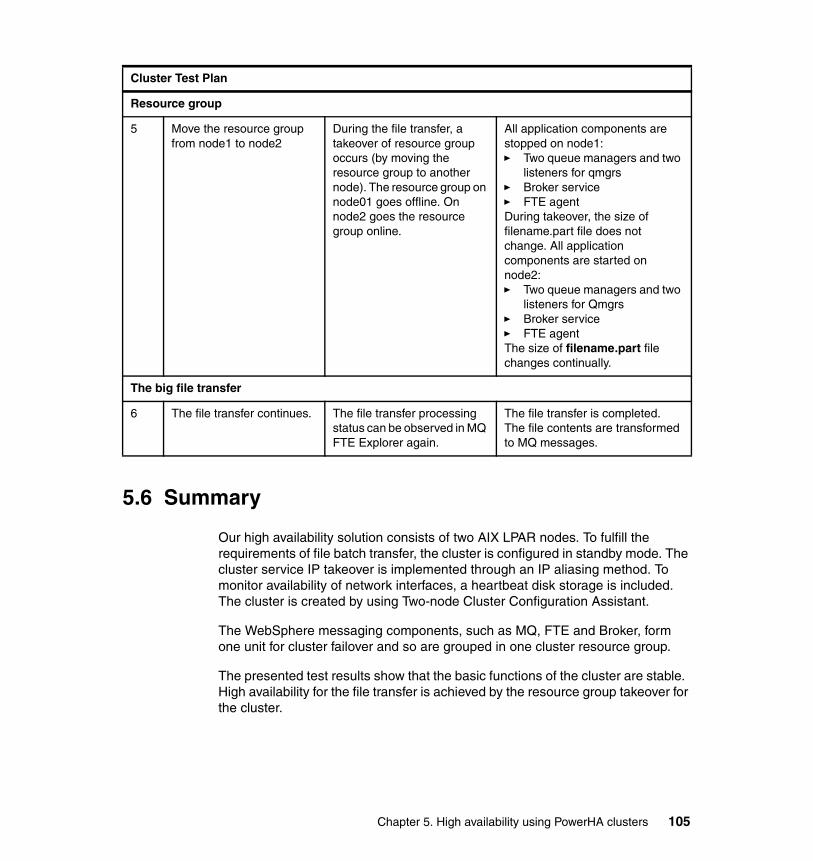
5.6 Summary
Our high availability solution consists of two AIX LPAR nodes. To fulfill the requirements of file batch transfer, the cluster is configured in standby mode. The cluster service IP takeover is implemented through an IP aliasing method. To monitor availability of network interfaces, a heartbeat disk storage is included. The cluster is created by using Two-node Cluster Configuration Assistant.
The WebSphere messaging components, such as MQ, FTE and Broker, form one unit for cluster failover and so are grouped in one cluster resource group.
The presented test results show that the basic functions of the cluster are stable. High availability for the file transfer is achieved by the resource group takeover for the cluster.
Resource group
5 Move the resource group from node1 to node2
During the file transfer, a takeover of resource group occurs (by moving the resource group to another node). The resource group on node01 goes offline. On node2 goes the resource group online.
All application components are stopped on node1:� Two queue managers and two
listeners for qmgrs� Broker service� FTE agentDuring takeover, the size of filename.part file does not change. All application components are started on node2:� Two queue managers and two
listeners for Qmgrs� Broker service� FTE agentThe size of filename.part file changes continually.
The big file transfer
6 The file transfer continues. The file transfer processing status can be observed in MQ FTE Explorer again.
The file transfer is completed.The file contents are transformed to MQ messages.
Cluster Test Plan
Chapter 5. High availability using PowerHA clusters 105

106 High Availability in WebSphere Messaging Solutions
Chapter 6. Using multi-instances queue managers and brokers for high availability
This chapter presents a scenario that describes the use of WebSphere MQ multi-instance queue managers and WebSphere Message Broker multi-instance brokers to provide a high availability messaging solution.
6
© Copyright IBM Corp. 2010. All rights reserved. 107
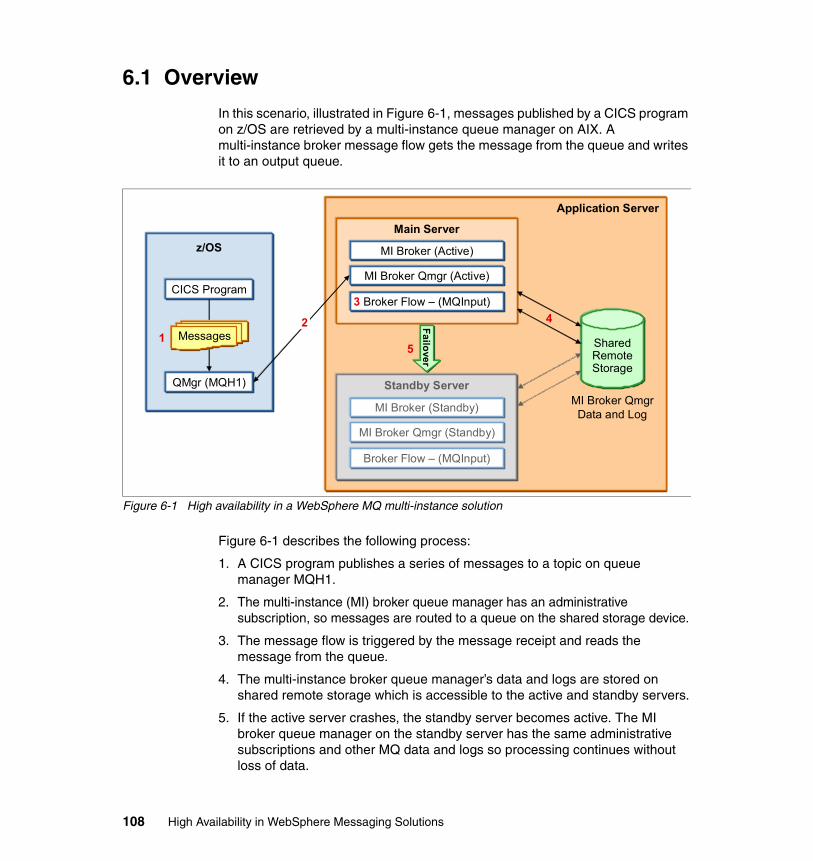
6.1 Overview
In this scenario, illustrated in Figure 6-1, messages published by a CICS program on z/OS are retrieved by a multi-instance queue manager on AIX. A multi-instance broker message flow gets the message from the queue and writes it to an output queue.
Figure 6-1 High availability in a WebSphere MQ multi-instance solution
Figure 6-1 describes the following process:
1. A CICS program publishes a series of messages to a topic on queue manager MQH1.
2. The multi-instance (MI) broker queue manager has an administrative subscription, so messages are routed to a queue on the shared storage device.
3. The message flow is triggered by the message receipt and reads the message from the queue.
4. The multi-instance broker queue manager’s data and logs are stored on shared remote storage which is accessible to the active and standby servers.
5. If the active server crashes, the standby server becomes active. The MI broker queue manager on the standby server has the same administrative subscriptions and other MQ data and logs so processing continues without loss of data.
Application Server
z/OS
QMgr (MQH1)
CICS Program
1 Messages
Fa
ilove
rStandby Server
Main Server
MI Broker (Active)
MI Broker Qmgr (Active)
Broker Flow – (MQInput)3
MI Broker (Standby)
MI Broker Qmgr (Standby)
Broker Flow – (MQInput)
SharedRemoteStorage
2
5
4
MI Broker QmgrData and Log
108 High Availability in WebSphere Messaging Solutions
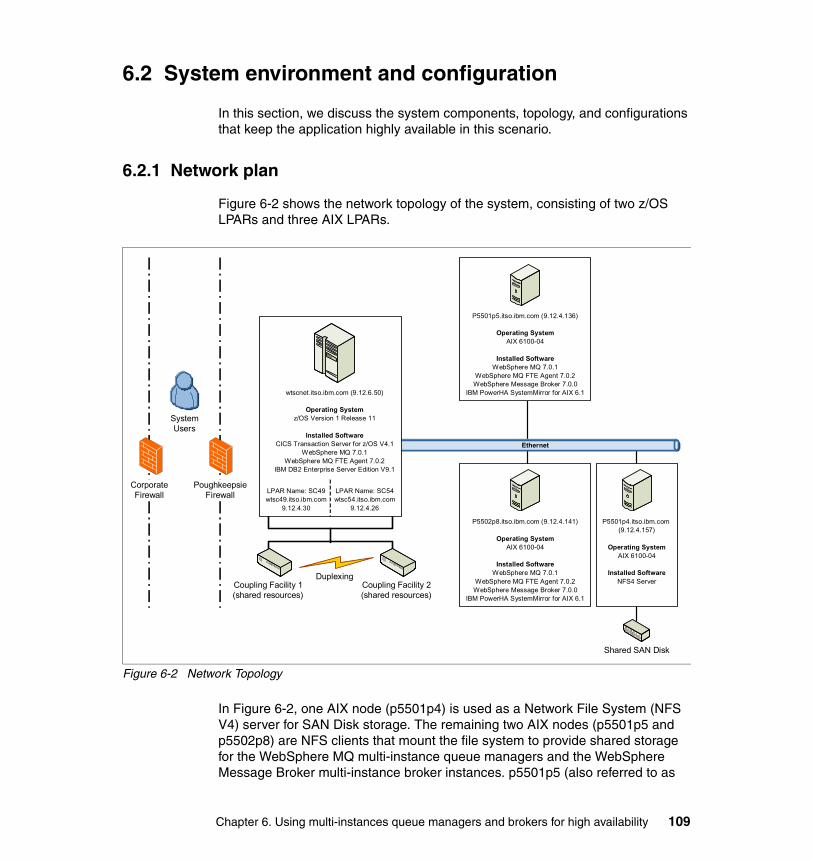
6.2 System environment and configuration
In this section, we discuss the system components, topology, and configurations that keep the application highly available in this scenario.
6.2.1 Network plan
Figure 6-2 shows the network topology of the system, consisting of two z/OS LPARs and three AIX LPARs.
Figure 6-2 Network Topology
In Figure 6-2, one AIX node (p5501p4) is used as a Network File System (NFS V4) server for SAN Disk storage. The remaining two AIX nodes (p5501p5 and p5502p8) are NFS clients that mount the file system to provide shared storage for the WebSphere MQ multi-instance queue managers and the WebSphere Message Broker multi-instance broker instances. p5501p5 (also referred to as
SystemUsers
Ethernet
wtscnet.itso.ibm.com (9.12.6.50)
Operating Systemz/OS Version 1 Release 11
Installed SoftwareCICS Transaction Server for z/OS V4.1
WebSphere MQ 7.0.1WebSphere MQ FTE Agent 7.0.2
IBM DB2 Enterprise Server Edition V9.1
LPAR Name: SC49wtsc49.itso.ibm.com
9.12.4.30
LPAR Name: SC54wtsc54.itso.ibm.com
9.12.4.26
Coupling Facility 1(shared resources)
DuplexingCoupling Facility 2(shared resources)
PoughkeepsieFirewall
CorporateFirewall
Shared SAN Disk
P5501p5.itso.ibm.com (9.12.4.136)
Operating SystemAIX 6100-04
Installed SoftwareWebSphere MQ 7.0.1
WebSphere MQ FTE Agent 7.0.2WebSphere Message Broker 7.0.0
IBM PowerHA SystemMirror for AIX 6.1
P5502p8.itso.ibm.com (9.12.4.141)
Operating SystemAIX 6100-04
Installed SoftwareWebSphere MQ 7.0.1
WebSphere MQ FTE Agent 7.0.2WebSphere Message Broker 7.0.0
IBM PowerHA SystemMirror for AIX 6.1
P5501p4.itso.ibm.com (9.12.4.157)
Operating SystemAIX 6100-04
Installed SoftwareNFS4 Server
Chapter 6. Using multi-instances queue managers and brokers for high availability 109
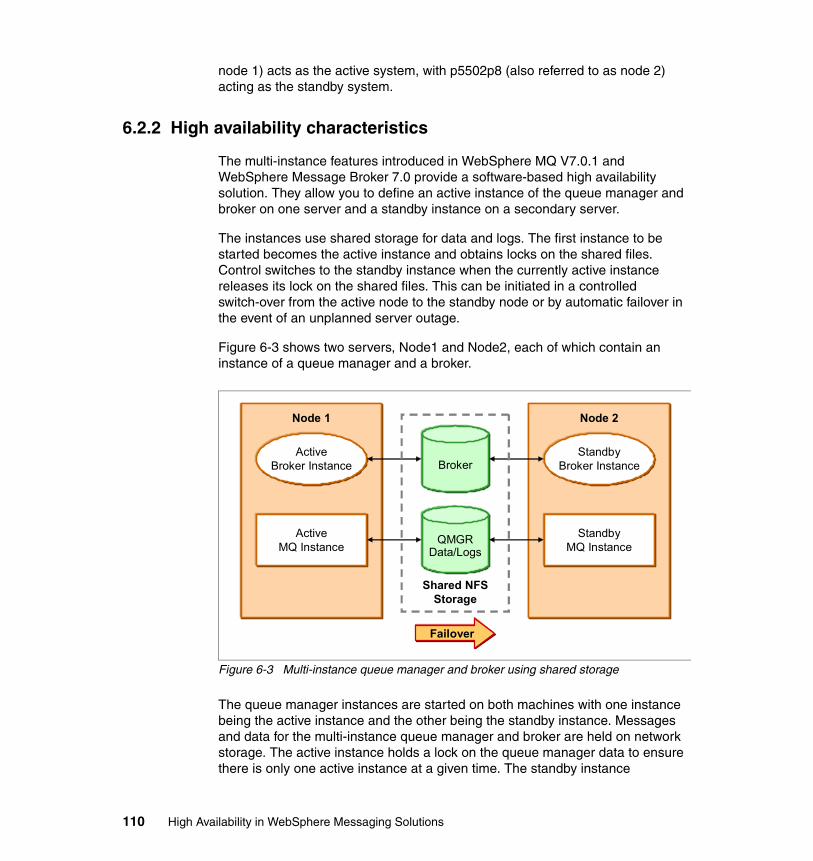
node 1) acts as the active system, with p5502p8 (also referred to as node 2) acting as the standby system.
6.2.2 High availability characteristics
The multi-instance features introduced in WebSphere MQ V7.0.1 and WebSphere Message Broker 7.0 provide a software-based high availability solution. They allow you to define an active instance of the queue manager and broker on one server and a standby instance on a secondary server.
The instances use shared storage for data and logs. The first instance to be started becomes the active instance and obtains locks on the shared files. Control switches to the standby instance when the currently active instance releases its lock on the shared files. This can be initiated in a controlled switch-over from the active node to the standby node or by automatic failover in the event of an unplanned server outage.
Figure 6-3 shows two servers, Node1 and Node2, each of which contain an instance of a queue manager and a broker.
Figure 6-3 Multi-instance queue manager and broker using shared storage
The queue manager instances are started on both machines with one instance being the active instance and the other being the standby instance. Messages and data for the multi-instance queue manager and broker are held on network storage. The active instance holds a lock on the queue manager data to ensure there is only one active instance at a given time. The standby instance
QMGRData/Logs
Node 1
ActiveBroker Instance
ActiveMQ Instance
Broker
Failover
Node 2
StandbyBroker Instance
StandbyMQ Instance
Shared NFSStorage
110 High Availability in WebSphere Messaging Solutions
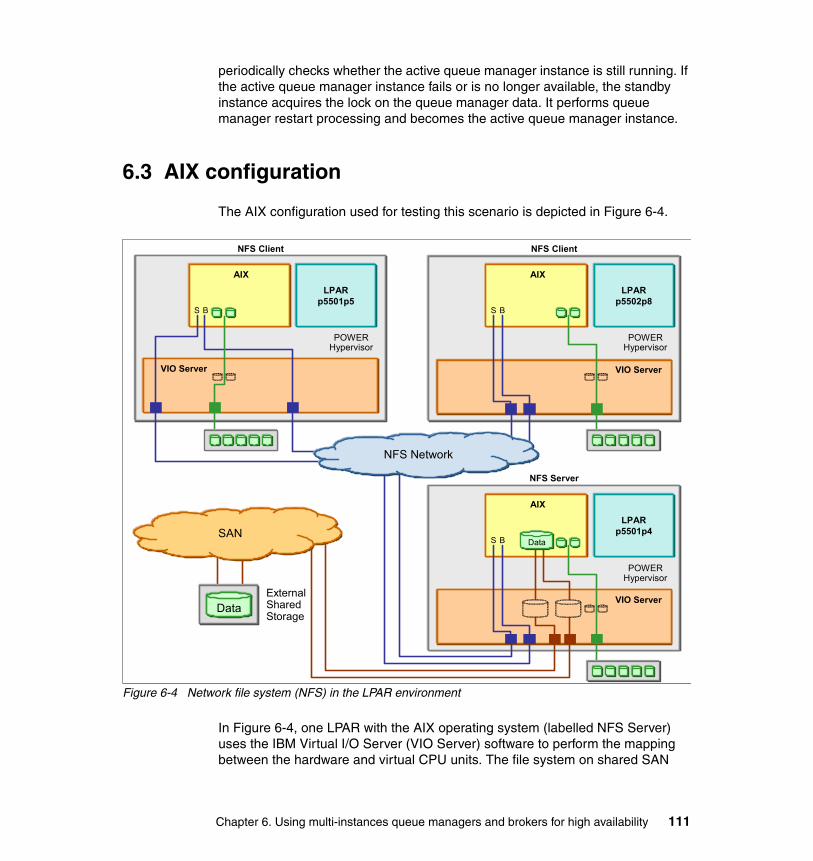
periodically checks whether the active queue manager instance is still running. If the active queue manager instance fails or is no longer available, the standby instance acquires the lock on the queue manager data. It performs queue manager restart processing and becomes the active queue manager instance.
6.3 AIX configuration
The AIX configuration used for testing this scenario is depicted in Figure 6-4.
Figure 6-4 Network file system (NFS) in the LPAR environment
In Figure 6-4, one LPAR with the AIX operating system (labelled NFS Server) uses the IBM Virtual I/O Server (VIO Server) software to perform the mapping between the hardware and virtual CPU units. The file system on shared SAN
AIX
ExternalSharedStorage
VIO Server
POWERHypervisor
S B
LPARp5501p5
Data
VIO Server
AIX
POWERHypervisor
S B
LPARp5502p8
NFS Server
VIO Server
AIX
POWERHypervisor
S B
LPARp5501p4
Data
NFS Client NFS Client
SAN
NFS Network
Chapter 6. Using multi-instances queue managers and brokers for high availability 111
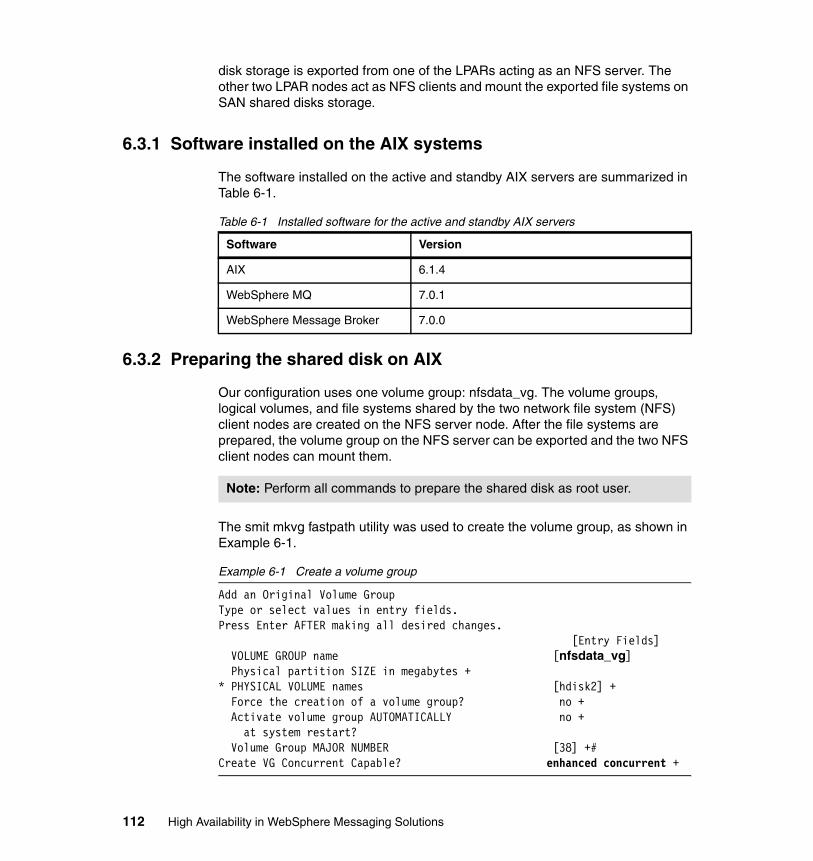
disk storage is exported from one of the LPARs acting as an NFS server. The other two LPAR nodes act as NFS clients and mount the exported file systems on SAN shared disks storage.
6.3.1 Software installed on the AIX systems
The software installed on the active and standby AIX servers are summarized in Table 6-1.
Table 6-1 Installed software for the active and standby AIX servers
6.3.2 Preparing the shared disk on AIX
Our configuration uses one volume group: nfsdata_vg. The volume groups, logical volumes, and file systems shared by the two network file system (NFS) client nodes are created on the NFS server node. After the file systems are prepared, the volume group on the NFS server can be exported and the two NFS client nodes can mount them.
The smit mkvg fastpath utility was used to create the volume group, as shown in Example 6-1.
Example 6-1 Create a volume group
Add an Original Volume GroupType or select values in entry fields.Press Enter AFTER making all desired changes. [Entry Fields] VOLUME GROUP name [nfsdata_vg] Physical partition SIZE in megabytes +* PHYSICAL VOLUME names [hdisk2] + Force the creation of a volume group? no + Activate volume group AUTOMATICALLY no + at system restart? Volume Group MAJOR NUMBER [38] +#Create VG Concurrent Capable? enhanced concurrent +
Software Version
AIX 6.1.4
WebSphere MQ 7.0.1
WebSphere Message Broker 7.0.0
Note: Perform all commands to prepare the shared disk as root user.
112 High Availability in WebSphere Messaging Solutions

In the Example 6-1 on page 112, an original enhanced-capable volume group named nfsdata_vg is defined on the NFS server node. This volume group contains hdisk2 and has major number 38. The available volume group major number 38 is found by using the lvlstmajor command. After the volume group has been created, it must be activated to make it available for use by using the varyonvg command, as shown in Example 6-2.
Example 6-2 Activating the volume group
# varyonvg data_vg
Before the logical volume group can be created, create a log for the logical volume group, as in Example 6-3.
Example 6-3 Creating the log for the logical volume
bash-3.00# mklv -t jfs2log -y lognfsshared_lv nfsdata_vg 600Mlognfsshared_lv
bash-3.00# /usr/sbin/logform /dev/lognfsshared_lvlogform: destroy /dev/rlognfsshared_lv (y)?y
The mklv command is used to create a logical volume named nfsshared_lv with 50 GB of storage space, on volume group nfsdata_vg, as shown in Example 6-4.
Example 6-4 Create logical volume
bash-3.00# mklv -t jfs2 -y nfsshared_lv nfsdata_vg 50Gnfsshared_lv
Next, we use the crfs command to create the file systems on this logical volume. The results is shown in Example 6-5.
Example 6-5 Creating the file system
bash-3.00# crfs -v jfs2 -p rw -d /dev/nfsshared_lv -m /NFSMQHA -A yesFile system created successfully.52426996 kilobytes total disk space.New File System size is 104857600
Finally we mount the file systems to check that we have successfully created the NFS file systems on NFS server node. This is shown in Example 6-6:
Example 6-6 Mount file system
# mount -o vers=4 /NFSMQHA
Chapter 6. Using multi-instances queue managers and brokers for high availability 113
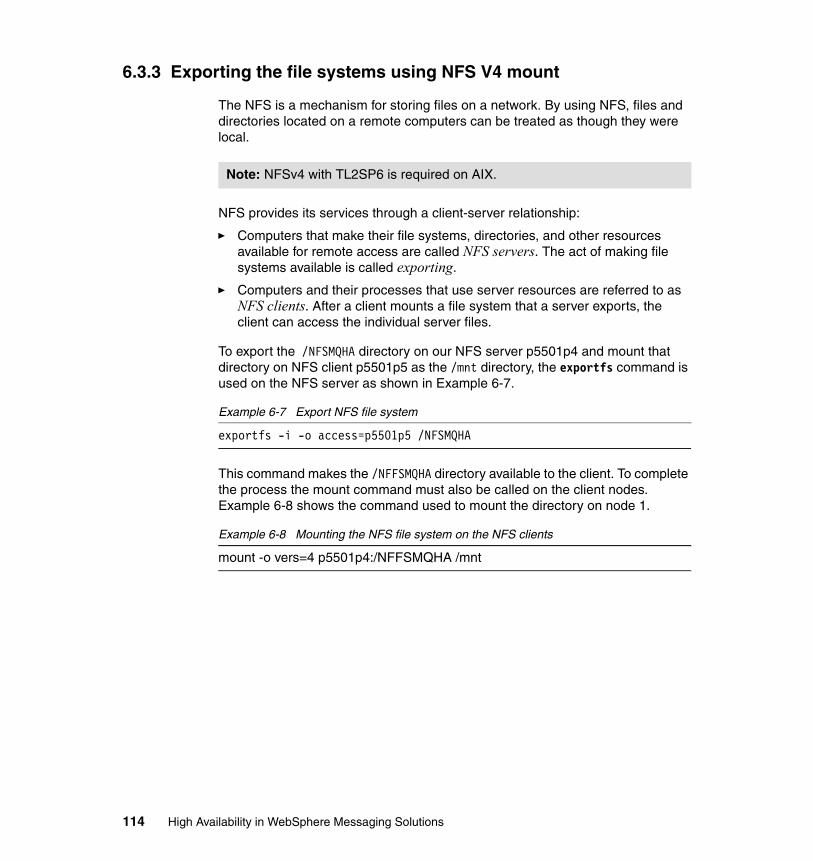
6.3.3 Exporting the file systems using NFS V4 mount
The NFS is a mechanism for storing files on a network. By using NFS, files and directories located on a remote computers can be treated as though they were local.
NFS provides its services through a client-server relationship:
� Computers that make their file systems, directories, and other resources available for remote access are called NFS servers. The act of making file systems available is called exporting.
� Computers and their processes that use server resources are referred to as NFS clients. After a client mounts a file system that a server exports, the client can access the individual server files.
To export the /NFSMQHA directory on our NFS server p5501p4 and mount that directory on NFS client p5501p5 as the /mnt directory, the exportfs command is used on the NFS server as shown in Example 6-7.
Example 6-7 Export NFS file system
exportfs -i -o access=p5501p5 /NFSMQHA
This command makes the /NFFSMQHA directory available to the client. To complete the process the mount command must also be called on the client nodes. Example 6-8 shows the command used to mount the directory on node 1.
Example 6-8 Mounting the NFS file system on the NFS clients
mount -o vers=4 p5501p4:/NFFSMQHA /mnt
Note: NFSv4 with TL2SP6 is required on AIX.
114 High Availability in WebSphere Messaging Solutions

The directories and files in the /NFSMQHA directory on the NFS server appear as the /mnt directory on the NFS clients. This can be checked by using the mount command, as shown in Example 6-9.
Example 6-9 Mount NFS file system results
p5501p5(root)/> mount node mounted mounted over vfs date options-------- --------------- --------------- ------ ------------ --------------- /dev/hd4 / jfs2 Feb 19 23:55 rw,log=/dev/hd8 /dev/hd2 /usr jfs2 Feb 19 23:55 rw,log=/dev/hd8 /dev/hd9var /var jfs2 Feb 19 23:55 rw,log=/dev/hd8 /dev/hd3 /tmp jfs2 Feb 19 23:55 rw,log=/dev/hd8 /dev/hd1 /home jfs2 Feb 19 23:55 rw,log=/dev/hd8 /dev/hd11admin /admin jfs2 Feb 19 23:55 rw,log=/dev/hd8 /proc /proc procfs Feb 19 23:55 rw /dev/hd10opt /opt jfs2 Feb 19 23:55 rw,log=/dev/hd8 /dev/livedump /var/adm/ras/livedump jfs2 Feb 19 23:55 rw,log=/dev/hd8 /dev/download_lv /download jfs2 Feb 19 23:55 rw,log=/dev/hd8 /dev/test_lv /mydir jfs2 Feb 19 23:55 rw,log=/dev/hd8p5501p4 /NFSMQHA /mnt nfs4 Feb 19 23:58 vers=4
This process is repeated to mount the same directory on the second NFS client, p5502p8, as the /mnt directory.
6.4 Configuring the messaging components
In this section we show how to define and implement WebSphere MQ and WebSphere Message Broker in the prepared environment.
6.4.1 WebSphere MQ with multi-instances
First, we create the multi-instance queue manager on the two AIX nodes (the NFS client systems).
Creating the queue manager on node 1
Note: Performm all WebSphere MQ configurations as the mqm user.
Chapter 6. Using multi-instances queue managers and brokers for high availability 115
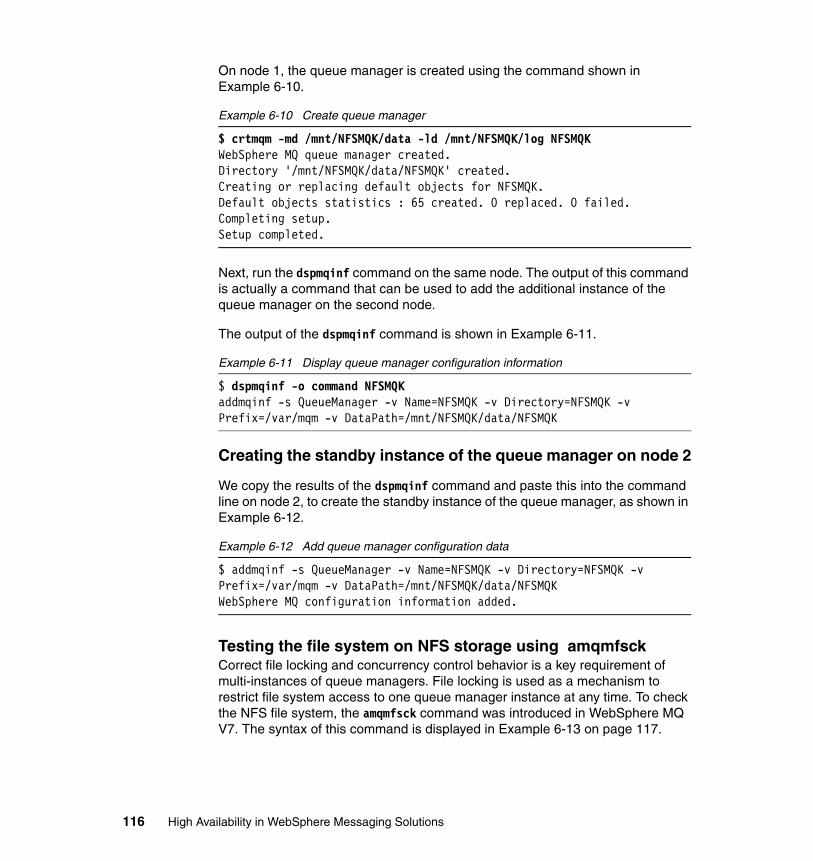
On node 1, the queue manager is created using the command shown in Example 6-10.
Example 6-10 Create queue manager
$ crtmqm -md /mnt/NFSMQK/data -ld /mnt/NFSMQK/log NFSMQKWebSphere MQ queue manager created.Directory '/mnt/NFSMQK/data/NFSMQK' created.Creating or replacing default objects for NFSMQK.Default objects statistics : 65 created. 0 replaced. 0 failed.Completing setup.Setup completed.
Next, run the dspmqinf command on the same node. The output of this command is actually a command that can be used to add the additional instance of the queue manager on the second node.
The output of the dspmqinf command is shown in Example 6-11.
Example 6-11 Display queue manager configuration information
$ dspmqinf -o command NFSMQKaddmqinf -s QueueManager -v Name=NFSMQK -v Directory=NFSMQK -v Prefix=/var/mqm -v DataPath=/mnt/NFSMQK/data/NFSMQK
Creating the standby instance of the queue manager on node 2
We copy the results of the dspmqinf command and paste this into the command line on node 2, to create the standby instance of the queue manager, as shown in Example 6-12.
Example 6-12 Add queue manager configuration data
$ addmqinf -s QueueManager -v Name=NFSMQK -v Directory=NFSMQK -v Prefix=/var/mqm -v DataPath=/mnt/NFSMQK/data/NFSMQKWebSphere MQ configuration information added.
Testing the file system on NFS storage using amqmfsckCorrect file locking and concurrency control behavior is a key requirement of multi-instances of queue managers. File locking is used as a mechanism to restrict file system access to one queue manager instance at any time. To check the NFS file system, the amqmfsck command was introduced in WebSphere MQ V7. The syntax of this command is displayed in Example 6-13 on page 117.
116 High Availability in WebSphere Messaging Solutions
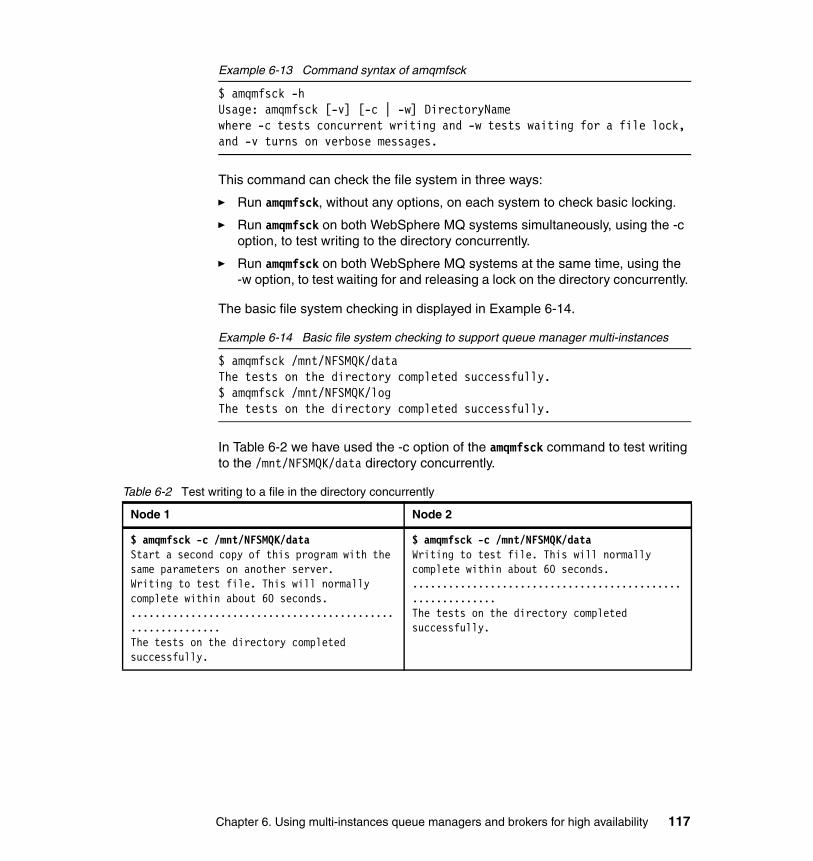
Example 6-13 Command syntax of amqmfsck
$ amqmfsck -hUsage: amqmfsck [-v] [-c | -w] DirectoryNamewhere -c tests concurrent writing and -w tests waiting for a file lock, and -v turns on verbose messages.
This command can check the file system in three ways:
� Run amqmfsck, without any options, on each system to check basic locking.
� Run amqmfsck on both WebSphere MQ systems simultaneously, using the -c option, to test writing to the directory concurrently.
� Run amqmfsck on both WebSphere MQ systems at the same time, using the -w option, to test waiting for and releasing a lock on the directory concurrently.
The basic file system checking in displayed in Example 6-14.
Example 6-14 Basic file system checking to support queue manager multi-instances
$ amqmfsck /mnt/NFSMQK/dataThe tests on the directory completed successfully.$ amqmfsck /mnt/NFSMQK/logThe tests on the directory completed successfully.
In Table 6-2 we have used the -c option of the amqmfsck command to test writing to the /mnt/NFSMQK/data directory concurrently.
Table 6-2 Test writing to a file in the directory concurrently
Node 1 Node 2
$ amqmfsck -c /mnt/NFSMQK/dataStart a second copy of this program with the same parameters on another server.Writing to test file. This will normally complete within about 60 seconds............................................................The tests on the directory completed successfully.
$ amqmfsck -c /mnt/NFSMQK/dataWriting to test file. This will normally complete within about 60 seconds............................................................The tests on the directory completed successfully.
Chapter 6. Using multi-instances queue managers and brokers for high availability 117
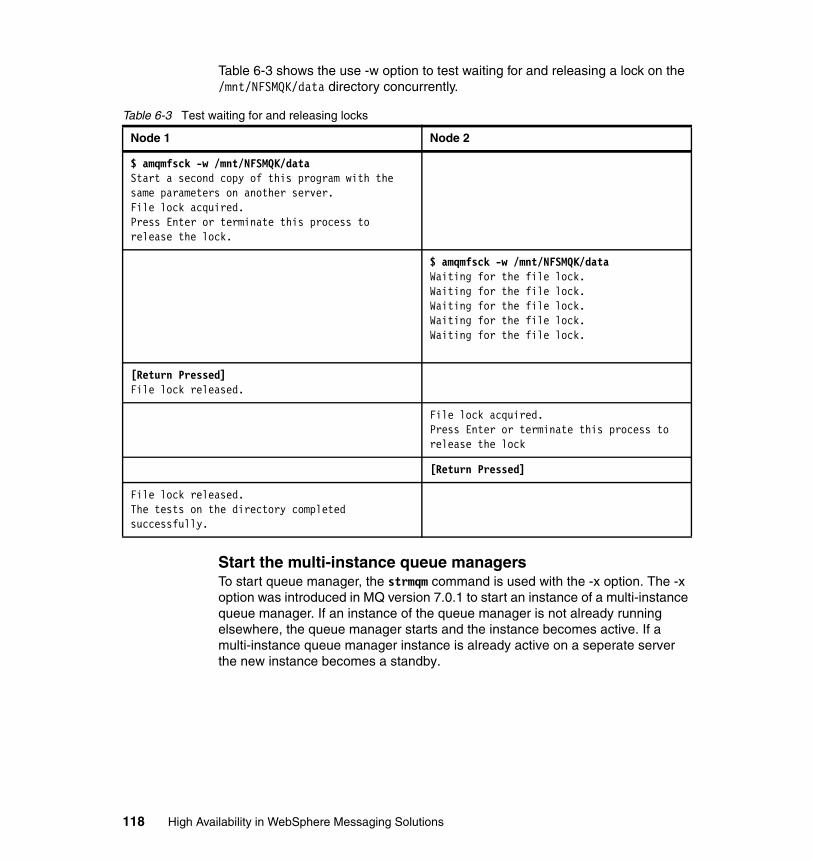
Table 6-3 shows the use -w option to test waiting for and releasing a lock on the /mnt/NFSMQK/data directory concurrently.
Table 6-3 Test waiting for and releasing locks
Start the multi-instance queue managersTo start queue manager, the strmqm command is used with the -x option. The -x option was introduced in MQ version 7.0.1 to start an instance of a multi-instance queue manager. If an instance of the queue manager is not already running elsewhere, the queue manager starts and the instance becomes active. If a multi-instance queue manager instance is already active on a seperate server the new instance becomes a standby.
Node 1 Node 2
$ amqmfsck -w /mnt/NFSMQK/dataStart a second copy of this program with the same parameters on another server.File lock acquired.Press Enter or terminate this process to release the lock.
$ amqmfsck -w /mnt/NFSMQK/dataWaiting for the file lock.Waiting for the file lock.Waiting for the file lock.Waiting for the file lock.Waiting for the file lock.
[Return Pressed]File lock released.
File lock acquired.Press Enter or terminate this process to release the lock
[Return Pressed]
File lock released.The tests on the directory completed successfully.
118 High Availability in WebSphere Messaging Solutions
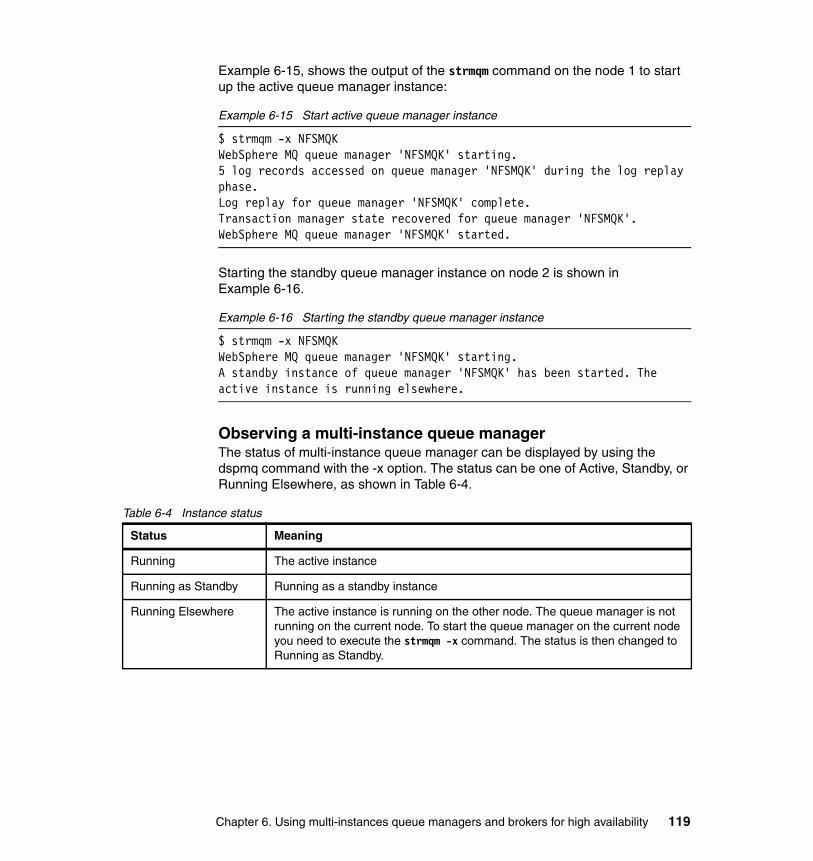
Example 6-15, shows the output of the strmqm command on the node 1 to start up the active queue manager instance:
Example 6-15 Start active queue manager instance
$ strmqm -x NFSMQKWebSphere MQ queue manager 'NFSMQK' starting.5 log records accessed on queue manager 'NFSMQK' during the log replay phase.Log replay for queue manager 'NFSMQK' complete.Transaction manager state recovered for queue manager 'NFSMQK'.WebSphere MQ queue manager 'NFSMQK' started.
Starting the standby queue manager instance on node 2 is shown in Example 6-16.
Example 6-16 Starting the standby queue manager instance
$ strmqm -x NFSMQKWebSphere MQ queue manager 'NFSMQK' starting.A standby instance of queue manager 'NFSMQK' has been started. The active instance is running elsewhere.
Observing a multi-instance queue managerThe status of multi-instance queue manager can be displayed by using the dspmq command with the -x option. The status can be one of Active, Standby, or Running Elsewhere, as shown in Table 6-4.
Table 6-4 Instance status
Status Meaning
Running The active instance
Running as Standby Running as a standby instance
Running Elsewhere The active instance is running on the other node. The queue manager is not running on the current node. To start the queue manager on the current node you need to execute the strmqm -x command. The status is then changed to Running as Standby.
Chapter 6. Using multi-instances queue managers and brokers for high availability 119
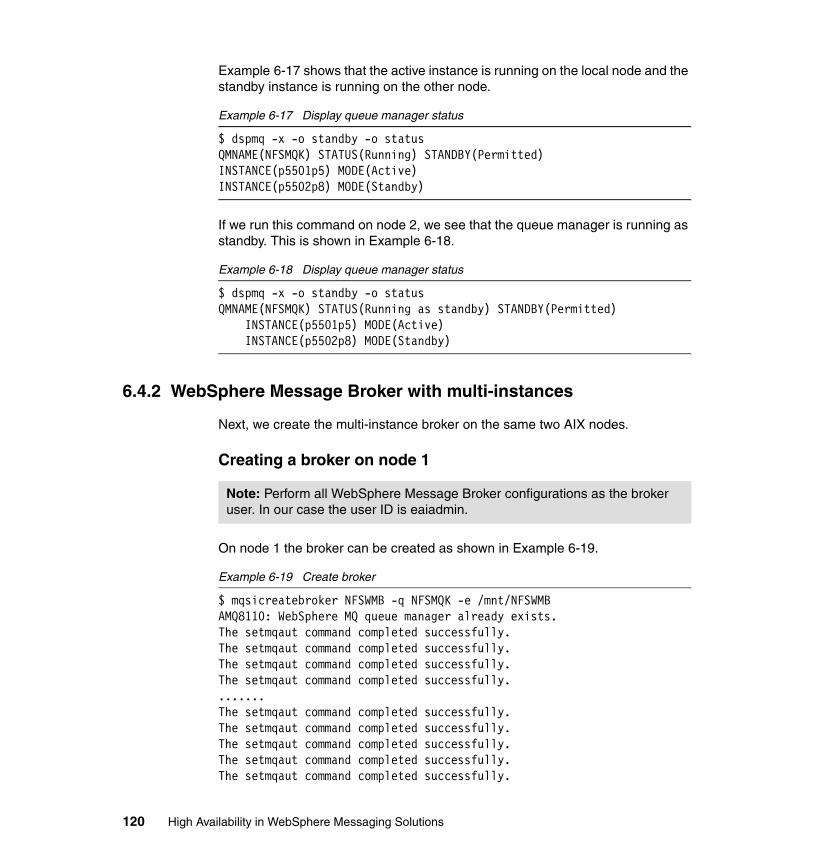
Example 6-17 shows that the active instance is running on the local node and the standby instance is running on the other node.
Example 6-17 Display queue manager status
$ dspmq -x -o standby -o statusQMNAME(NFSMQK) STATUS(Running) STANDBY(Permitted)INSTANCE(p5501p5) MODE(Active)INSTANCE(p5502p8) MODE(Standby)
If we run this command on node 2, we see that the queue manager is running as standby. This is shown in Example 6-18.
Example 6-18 Display queue manager status
$ dspmq -x -o standby -o statusQMNAME(NFSMQK) STATUS(Running as standby) STANDBY(Permitted) INSTANCE(p5501p5) MODE(Active) INSTANCE(p5502p8) MODE(Standby)
6.4.2 WebSphere Message Broker with multi-instances
Next, we create the multi-instance broker on the same two AIX nodes.
Creating a broker on node 1
On node 1 the broker can be created as shown in Example 6-19.
Example 6-19 Create broker
$ mqsicreatebroker NFSWMB -q NFSMQK -e /mnt/NFSWMBAMQ8110: WebSphere MQ queue manager already exists.The setmqaut command completed successfully.The setmqaut command completed successfully.The setmqaut command completed successfully.The setmqaut command completed successfully........The setmqaut command completed successfully.The setmqaut command completed successfully.The setmqaut command completed successfully.The setmqaut command completed successfully.The setmqaut command completed successfully.
Note: Perform all WebSphere Message Broker configurations as the broker user. In our case the user ID is eaiadmin.
120 High Availability in WebSphere Messaging Solutions
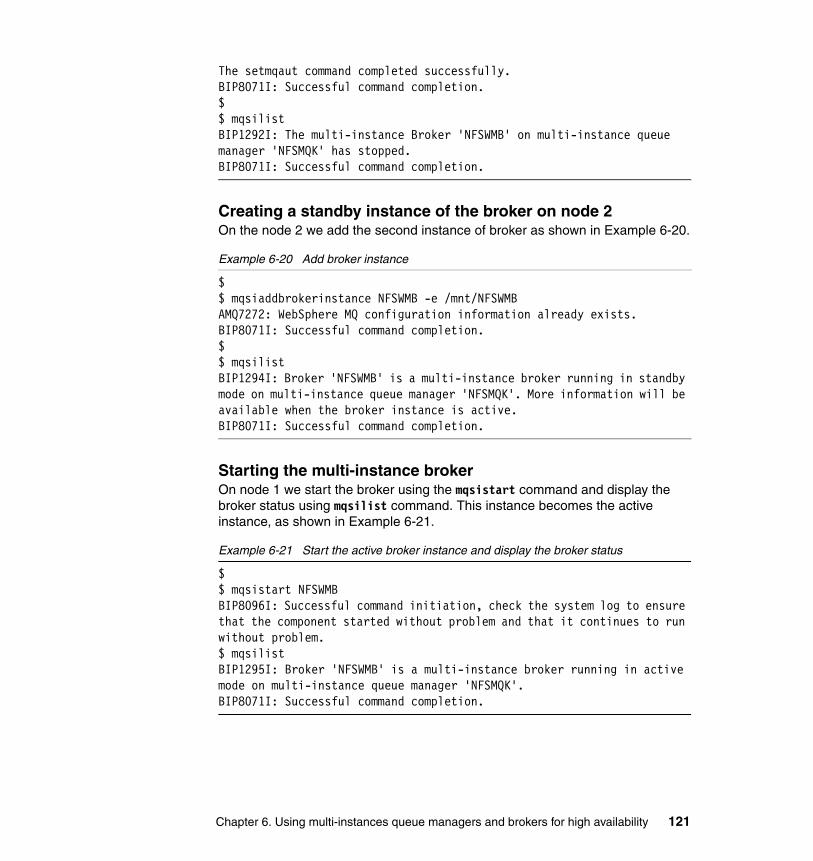
The setmqaut command completed successfully.BIP8071I: Successful command completion.$$ mqsilistBIP1292I: The multi-instance Broker 'NFSWMB' on multi-instance queue manager 'NFSMQK' has stopped.BIP8071I: Successful command completion.
Creating a standby instance of the broker on node 2On the node 2 we add the second instance of broker as shown in Example 6-20.
Example 6-20 Add broker instance
$$ mqsiaddbrokerinstance NFSWMB -e /mnt/NFSWMBAMQ7272: WebSphere MQ configuration information already exists.BIP8071I: Successful command completion.$$ mqsilistBIP1294I: Broker 'NFSWMB' is a multi-instance broker running in standby mode on multi-instance queue manager 'NFSMQK'. More information will be available when the broker instance is active.BIP8071I: Successful command completion.
Starting the multi-instance brokerOn node 1 we start the broker using the mqsistart command and display the broker status using mqsilist command. This instance becomes the active instance, as shown in Example 6-21.
Example 6-21 Start the active broker instance and display the broker status
$$ mqsistart NFSWMBBIP8096I: Successful command initiation, check the system log to ensure that the component started without problem and that it continues to run without problem.$ mqsilistBIP1295I: Broker 'NFSWMB' is a multi-instance broker running in active mode on multi-instance queue manager 'NFSMQK'.BIP8071I: Successful command completion.
Chapter 6. Using multi-instances queue managers and brokers for high availability 121
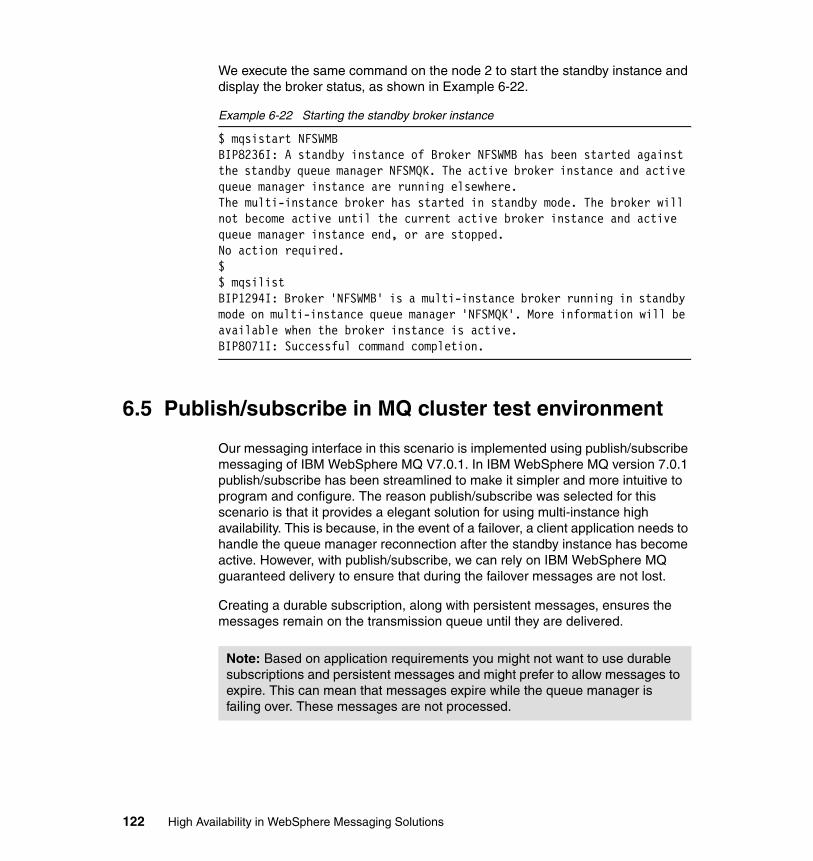
We execute the same command on the node 2 to start the standby instance and display the broker status, as shown in Example 6-22.
Example 6-22 Starting the standby broker instance
$ mqsistart NFSWMBBIP8236I: A standby instance of Broker NFSWMB has been started against the standby queue manager NFSMQK. The active broker instance and active queue manager instance are running elsewhere.The multi-instance broker has started in standby mode. The broker will not become active until the current active broker instance and active queue manager instance end, or are stopped.No action required.$$ mqsilistBIP1294I: Broker 'NFSWMB' is a multi-instance broker running in standby mode on multi-instance queue manager 'NFSMQK'. More information will be available when the broker instance is active.BIP8071I: Successful command completion.
6.5 Publish/subscribe in MQ cluster test environment
Our messaging interface in this scenario is implemented using publish/subscribe messaging of IBM WebSphere MQ V7.0.1. In IBM WebSphere MQ version 7.0.1 publish/subscribe has been streamlined to make it simpler and more intuitive to program and configure. The reason publish/subscribe was selected for this scenario is that it provides a elegant solution for using multi-instance high availability. This is because, in the event of a failover, a client application needs to handle the queue manager reconnection after the standby instance has become active. However, with publish/subscribe, we can rely on IBM WebSphere MQ guaranteed delivery to ensure that during the failover messages are not lost.
Creating a durable subscription, along with persistent messages, ensures the messages remain on the transmission queue until they are delivered.
Note: Based on application requirements you might not want to use durable subscriptions and persistent messages and might prefer to allow messages to expire. This can mean that messages expire while the queue manager is failing over. These messages are not processed.
122 High Availability in WebSphere Messaging Solutions
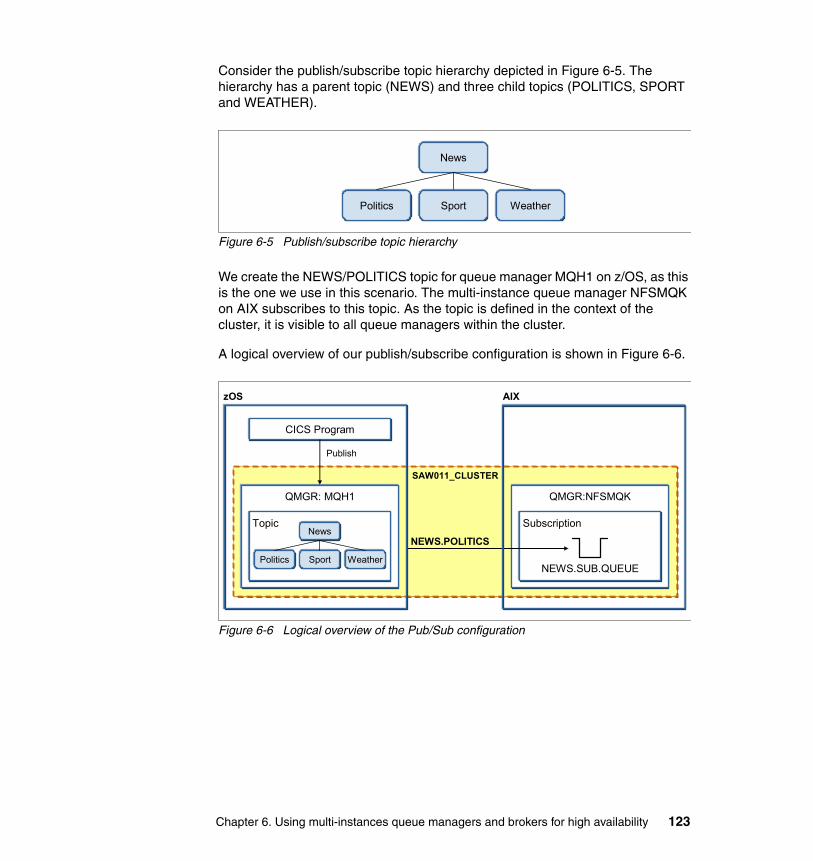
Consider the publish/subscribe topic hierarchy depicted in Figure 6-5. The hierarchy has a parent topic (NEWS) and three child topics (POLITICS, SPORT and WEATHER).
Figure 6-5 Publish/subscribe topic hierarchy
We create the NEWS/POLITICS topic for queue manager MQH1 on z/OS, as this is the one we use in this scenario. The multi-instance queue manager NFSMQK on AIX subscribes to this topic. As the topic is defined in the context of the cluster, it is visible to all queue managers within the cluster.
A logical overview of our publish/subscribe configuration is shown in Figure 6-6.
Figure 6-6 Logical overview of the Pub/Sub configuration
WeatherSportPolitics
News
SAW011_CLUSTER
CICS Program
QMGR: MQH1
Topic
WeatherSportPolitics
News
QMGR:NFSMQK
Subscription
NEWS.SUB.QUEUE
NEWS.POLITICS
Publish
zOS AIX
Chapter 6. Using multi-instances queue managers and brokers for high availability 123
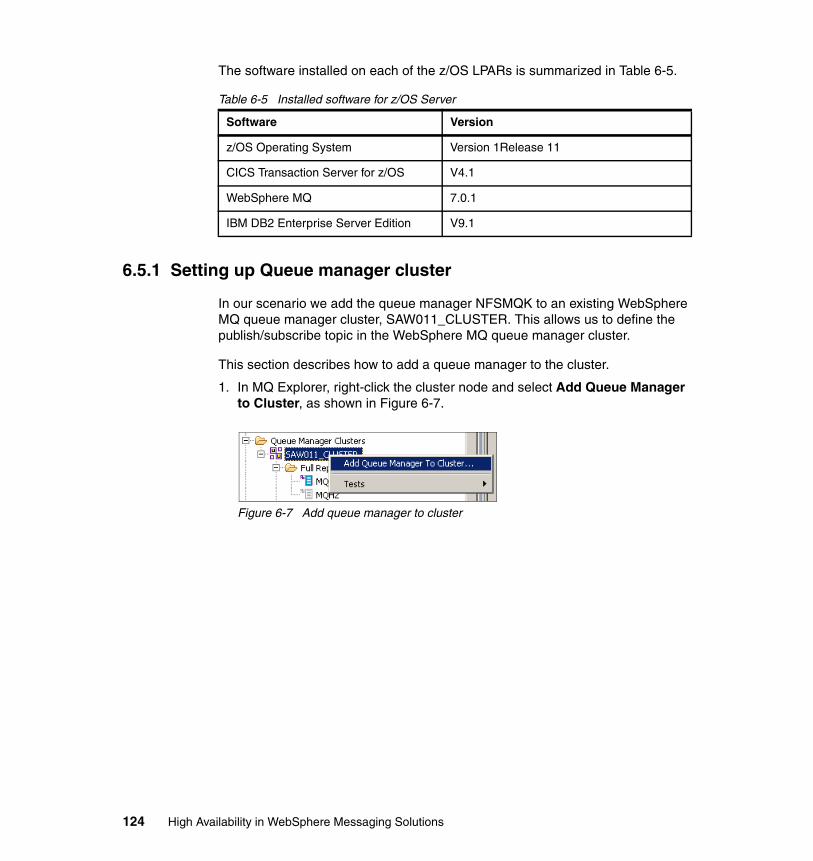
The software installed on each of the z/OS LPARs is summarized in Table 6-5.
Table 6-5 Installed software for z/OS Server
6.5.1 Setting up Queue manager cluster
In our scenario we add the queue manager NFSMQK to an existing WebSphere MQ queue manager cluster, SAW011_CLUSTER. This allows us to define the publish/subscribe topic in the WebSphere MQ queue manager cluster.
This section describes how to add a queue manager to the cluster.
1. In MQ Explorer, right-click the cluster node and select Add Queue Manager to Cluster, as shown in Figure 6-7.
Figure 6-7 Add queue manager to cluster
Software Version
z/OS Operating System Version 1Release 11
CICS Transaction Server for z/OS V4.1
WebSphere MQ 7.0.1
IBM DB2 Enterprise Server Edition V9.1
124 High Availability in WebSphere Messaging Solutions
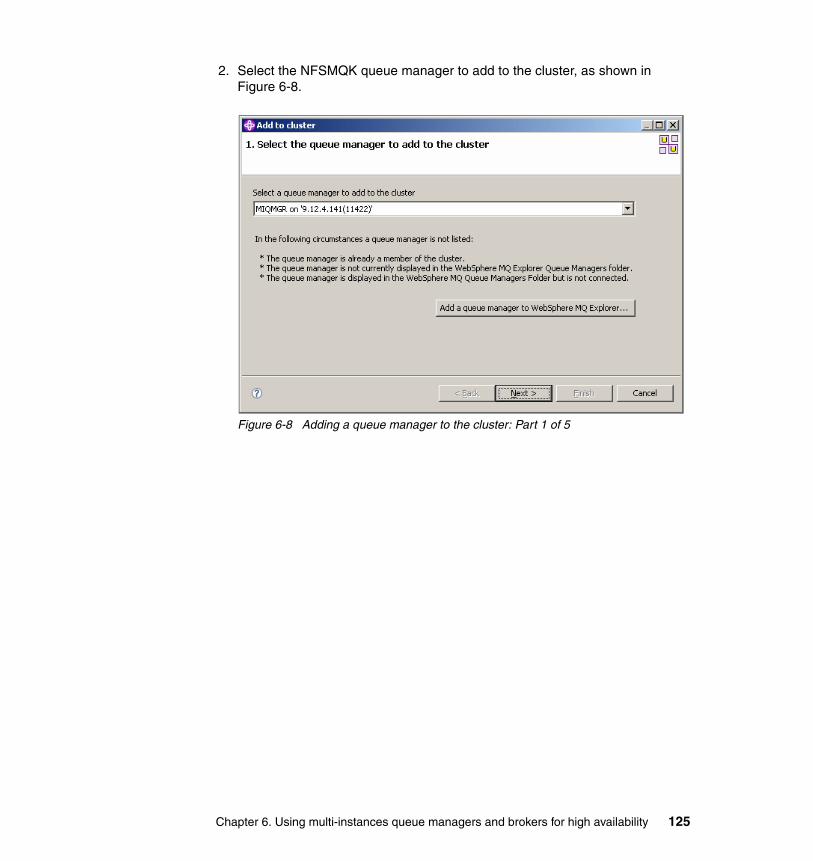
2. Select the NFSMQK queue manager to add to the cluster, as shown in Figure 6-8.
Figure 6-8 Adding a queue manager to the cluster: Part 1 of 5
Chapter 6. Using multi-instances queue managers and brokers for high availability 125
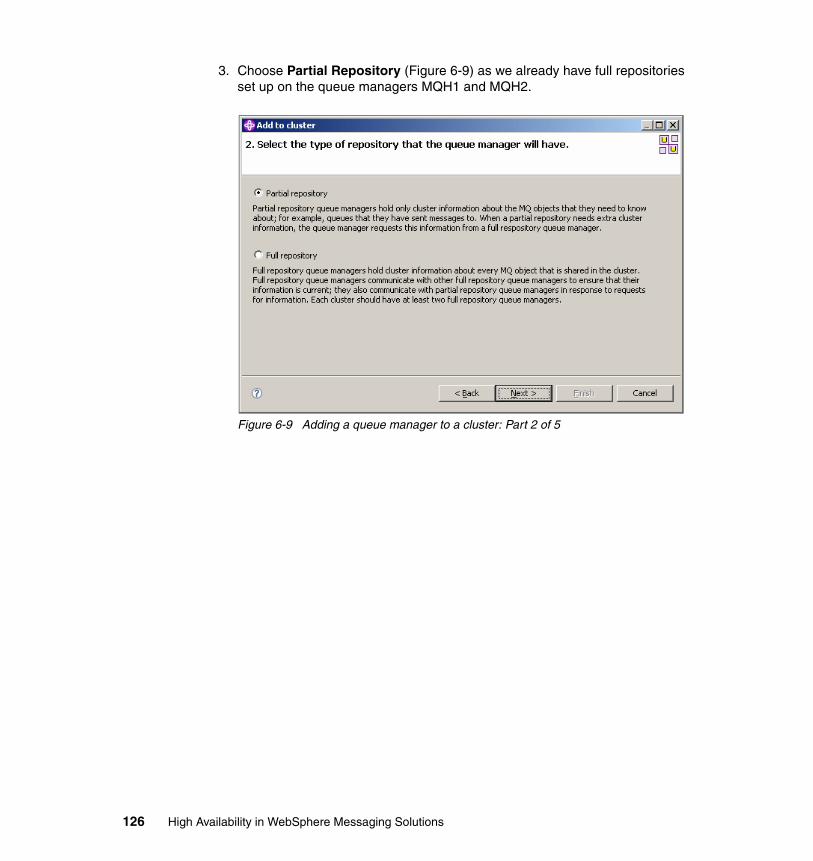
3. Choose Partial Repository (Figure 6-9) as we already have full repositories set up on the queue managers MQH1 and MQH2.
Figure 6-9 Adding a queue manager to a cluster: Part 2 of 5
126 High Availability in WebSphere Messaging Solutions
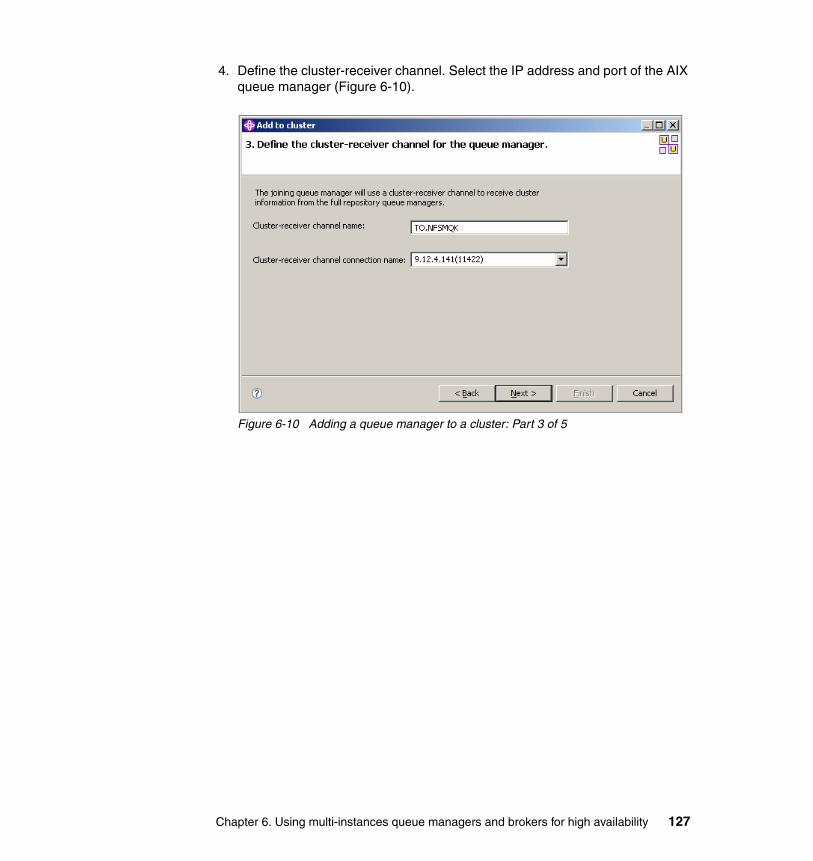
4. Define the cluster-receiver channel. Select the IP address and port of the AIX queue manager (Figure 6-10).
Figure 6-10 Adding a queue manager to a cluster: Part 3 of 5
Chapter 6. Using multi-instances queue managers and brokers for high availability 127

5. Select the full repository queue manager (Figure 6-11).
Figure 6-11 Adding a queue manager to a cluster: Part 4 of 5
128 High Availability in WebSphere Messaging Solutions
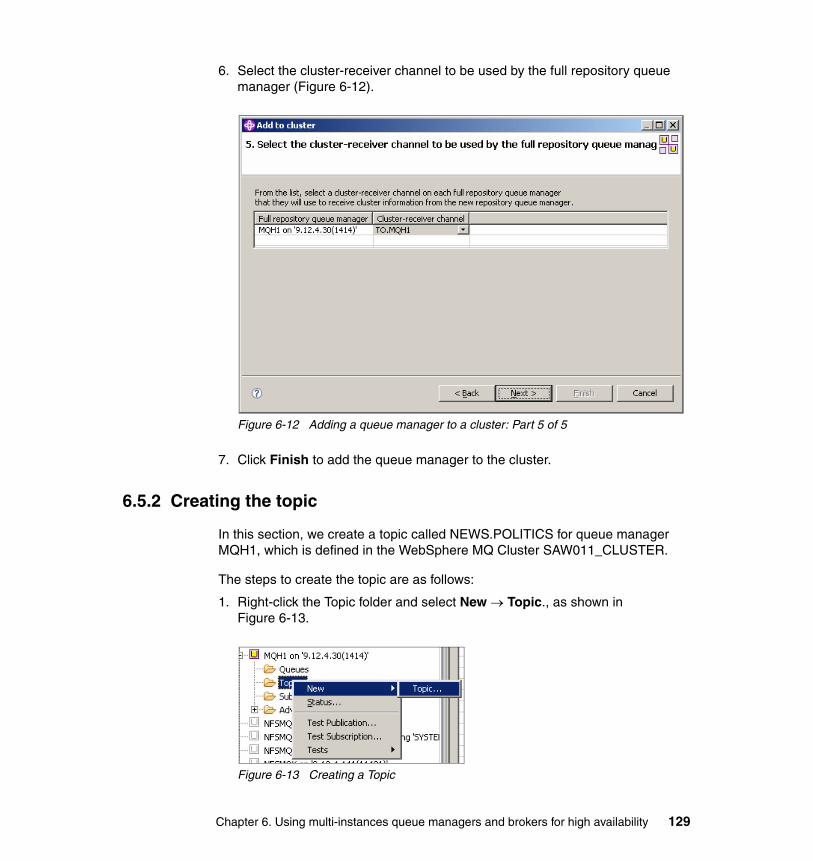
6. Select the cluster-receiver channel to be used by the full repository queue manager (Figure 6-12).
Figure 6-12 Adding a queue manager to a cluster: Part 5 of 5
7. Click Finish to add the queue manager to the cluster.
6.5.2 Creating the topic
In this section, we create a topic called NEWS.POLITICS for queue manager MQH1, which is defined in the WebSphere MQ Cluster SAW011_CLUSTER.
The steps to create the topic are as follows:
1. Right-click the Topic folder and select New Topic., as shown in Figure 6-13.
Figure 6-13 Creating a Topic
Chapter 6. Using multi-instances queue managers and brokers for high availability 129
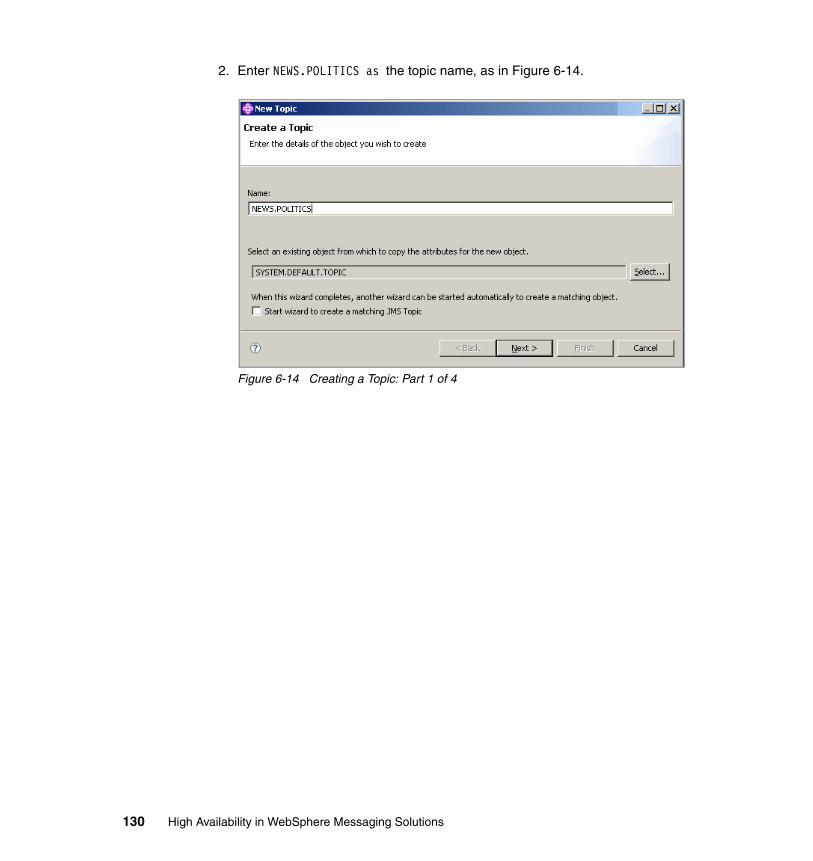
2. Enter NEWS.POLITICS as the topic name, as in Figure 6-14.
Figure 6-14 Creating a Topic: Part 1 of 4
130 High Availability in WebSphere Messaging Solutions
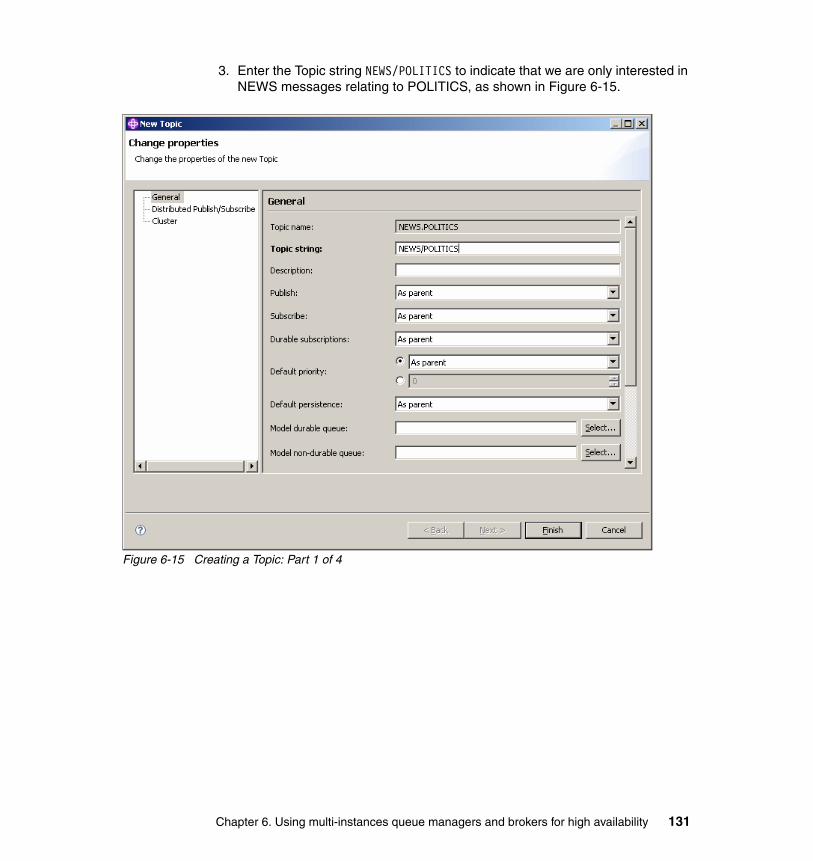
3. Enter the Topic string NEWS/POLITICS to indicate that we are only interested in NEWS messages relating to POLITICS, as shown in Figure 6-15.
Figure 6-15 Creating a Topic: Part 1 of 4
Chapter 6. Using multi-instances queue managers and brokers for high availability 131
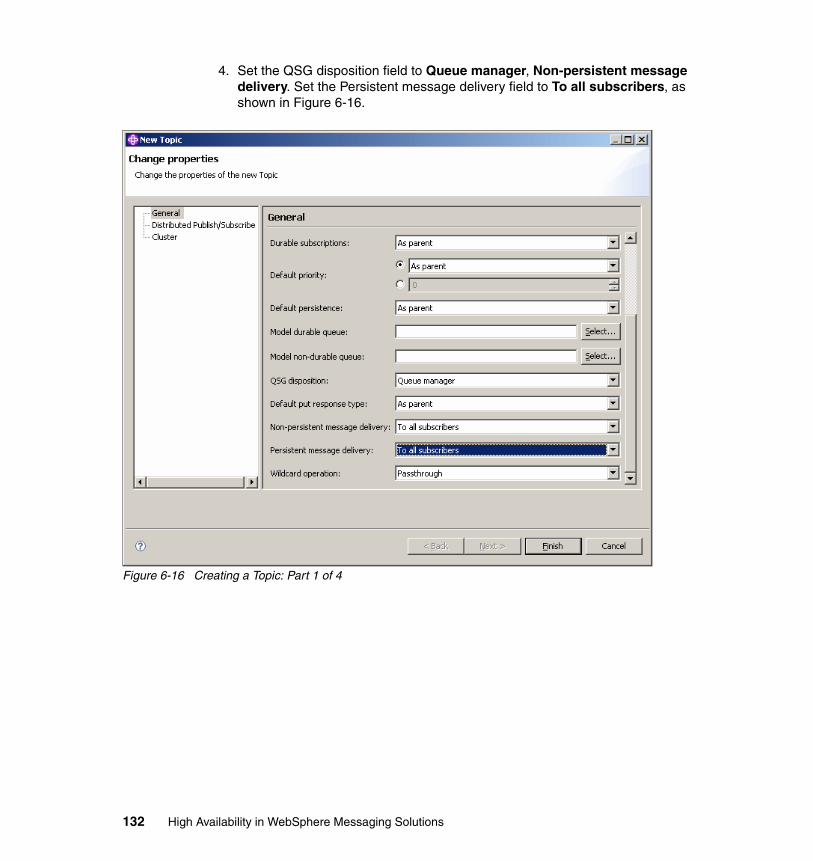
4. Set the QSG disposition field to Queue manager, Non-persistent message delivery. Set the Persistent message delivery field to To all subscribers, as shown in Figure 6-16.
Figure 6-16 Creating a Topic: Part 1 of 4
132 High Availability in WebSphere Messaging Solutions
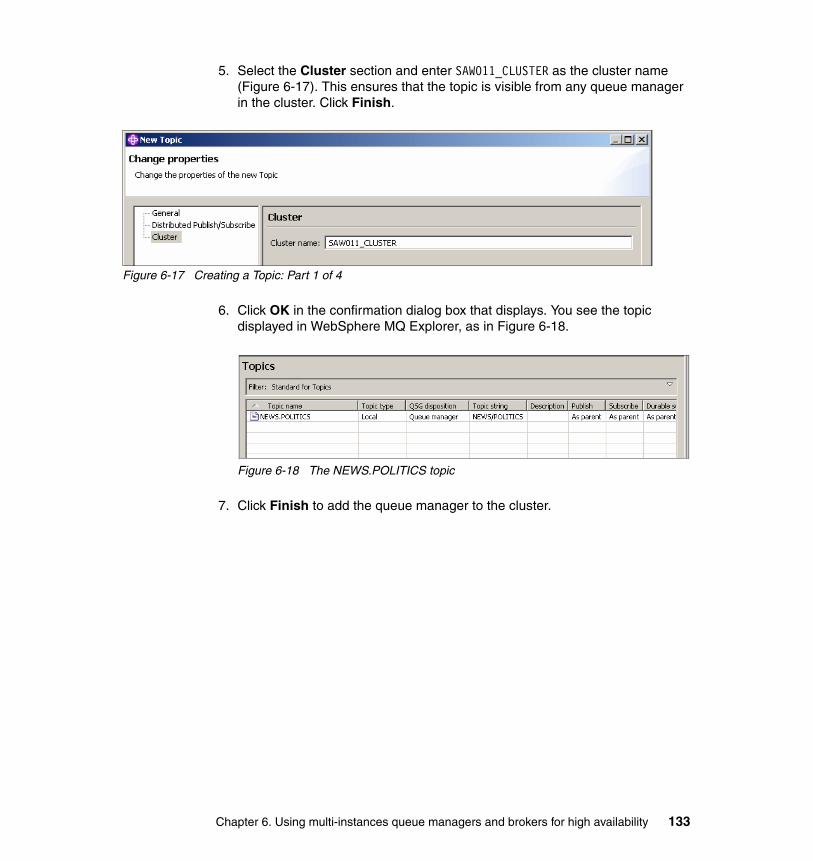
5. Select the Cluster section and enter SAW011_CLUSTER as the cluster name (Figure 6-17). This ensures that the topic is visible from any queue manager in the cluster. Click Finish.
Figure 6-17 Creating a Topic: Part 1 of 4
6. Click OK in the confirmation dialog box that displays. You see the topic displayed in WebSphere MQ Explorer, as in Figure 6-18.
Figure 6-18 The NEWS.POLITICS topic
7. Click Finish to add the queue manager to the cluster.
Chapter 6. Using multi-instances queue managers and brokers for high availability 133
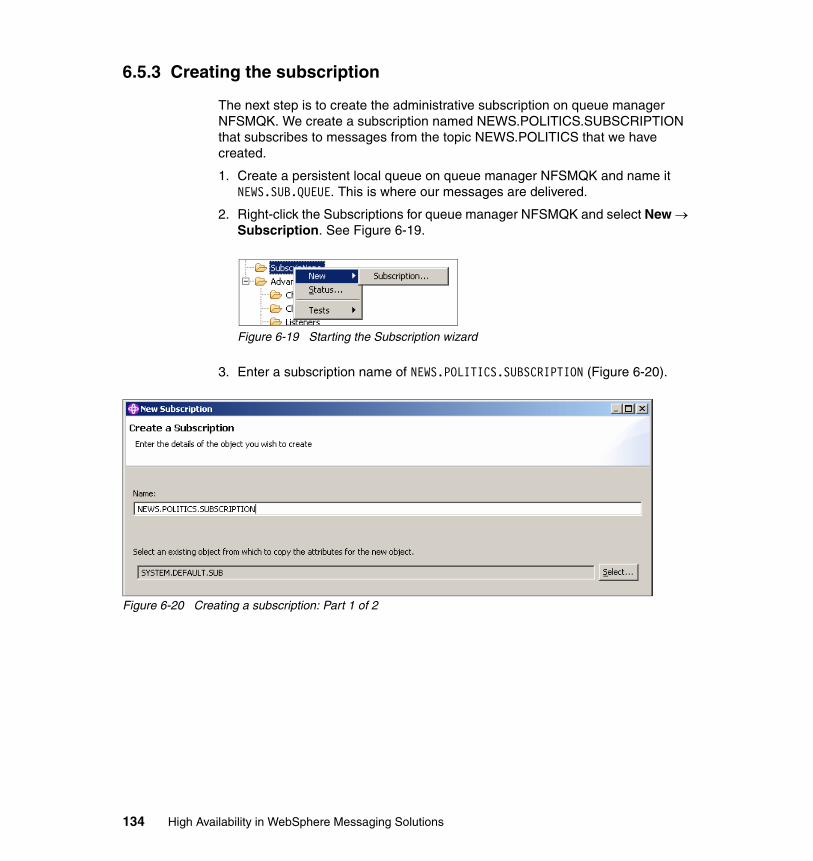
6.5.3 Creating the subscription
The next step is to create the administrative subscription on queue manager NFSMQK. We create a subscription named NEWS.POLITICS.SUBSCRIPTION that subscribes to messages from the topic NEWS.POLITICS that we have created.
1. Create a persistent local queue on queue manager NFSMQK and name it NEWS.SUB.QUEUE. This is where our messages are delivered.
2. Right-click the Subscriptions for queue manager NFSMQK and select New Subscription. See Figure 6-19.
Figure 6-19 Starting the Subscription wizard
3. Enter a subscription name of NEWS.POLITICS.SUBSCRIPTION (Figure 6-20).
Figure 6-20 Creating a subscription: Part 1 of 2
134 High Availability in WebSphere Messaging Solutions
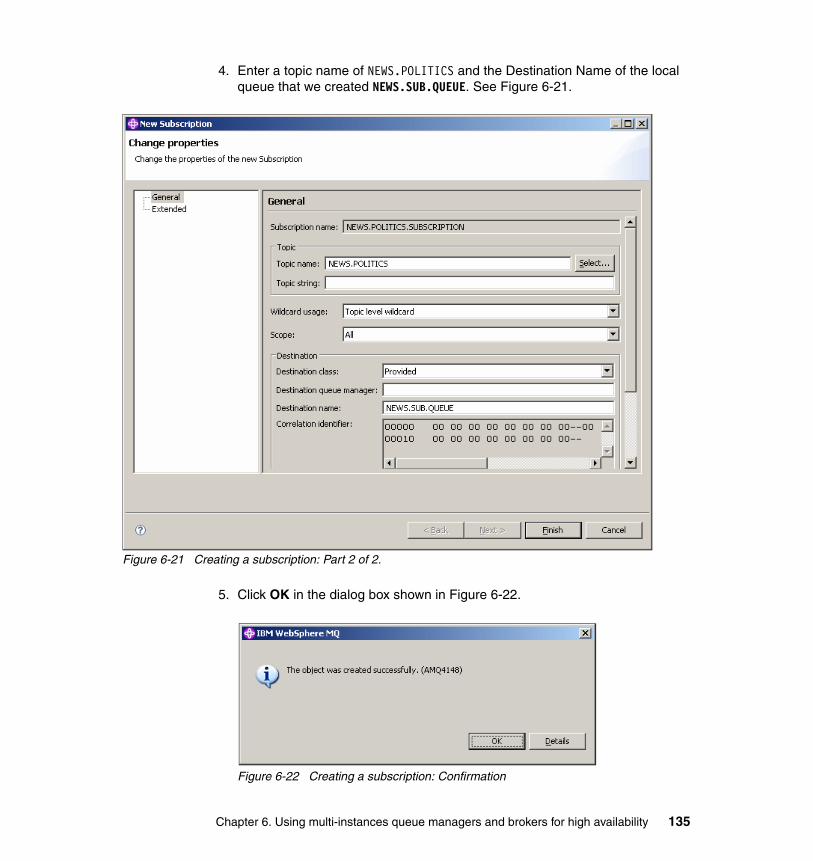
4. Enter a topic name of NEWS.POLITICS and the Destination Name of the local queue that we created NEWS.SUB.QUEUE. See Figure 6-21.
Figure 6-21 Creating a subscription: Part 2 of 2.
5. Click OK in the dialog box shown in Figure 6-22.
Figure 6-22 Creating a subscription: Confirmation
Chapter 6. Using multi-instances queue managers and brokers for high availability 135
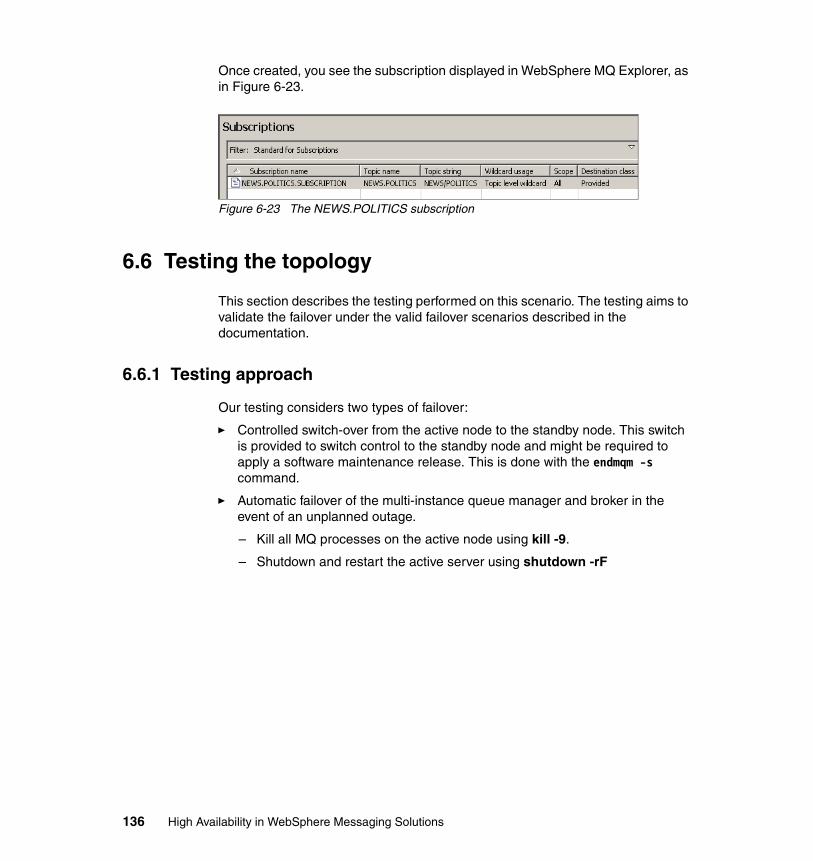
Once created, you see the subscription displayed in WebSphere MQ Explorer, as in Figure 6-23.
Figure 6-23 The NEWS.POLITICS subscription
6.6 Testing the topology
This section describes the testing performed on this scenario. The testing aims to validate the failover under the valid failover scenarios described in the documentation.
6.6.1 Testing approach
Our testing considers two types of failover:
� Controlled switch-over from the active node to the standby node. This switch is provided to switch control to the standby node and might be required to apply a software maintenance release. This is done with the endmqm -s command.
� Automatic failover of the multi-instance queue manager and broker in the event of an unplanned outage.
– Kill all MQ processes on the active node using kill -9.
– Shutdown and restart the active server using shutdown -rF
136 High Availability in WebSphere Messaging Solutions
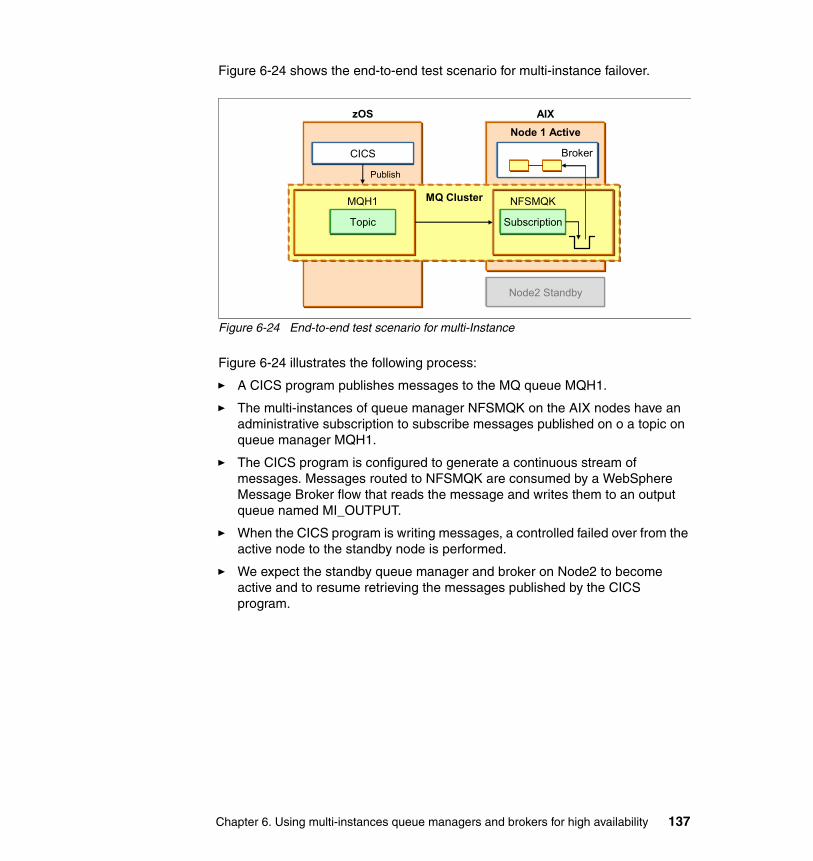
Figure 6-24 shows the end-to-end test scenario for multi-instance failover.
Figure 6-24 End-to-end test scenario for multi-Instance
Figure 6-24 illustrates the following process:
� A CICS program publishes messages to the MQ queue MQH1.
� The multi-instances of queue manager NFSMQK on the AIX nodes have an administrative subscription to subscribe messages published on o a topic on queue manager MQH1.
� The CICS program is configured to generate a continuous stream of messages. Messages routed to NFSMQK are consumed by a WebSphere Message Broker flow that reads the message and writes them to an output queue named MI_OUTPUT.
� When the CICS program is writing messages, a controlled failed over from the active node to the standby node is performed.
� We expect the standby queue manager and broker on Node2 to become active and to resume retrieving the messages published by the CICS program.
Node 1 Active
MQ ClusterMQH1
Topic
Node2 Standby
Broker
Subscription
NFSMQK
AIX
CICS
Publish
zOS
Chapter 6. Using multi-instances queue managers and brokers for high availability 137
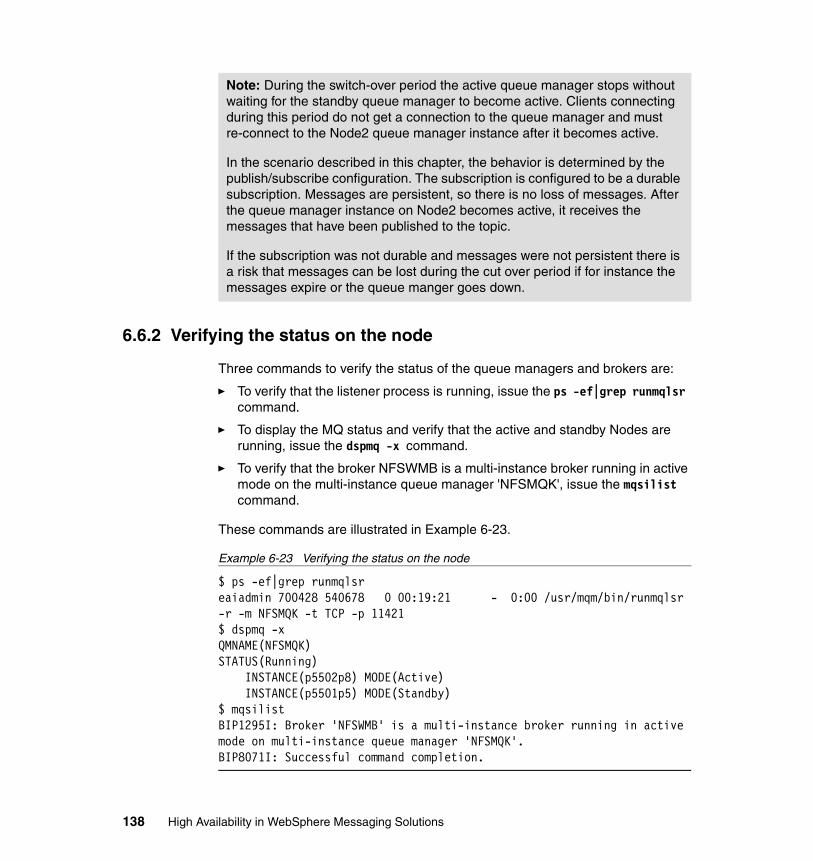
6.6.2 Verifying the status on the node
Three commands to verify the status of the queue managers and brokers are:
� To verify that the listener process is running, issue the ps -ef|grep runmqlsr command.
� To display the MQ status and verify that the active and standby Nodes are running, issue the dspmq -x command.
� To verify that the broker NFSWMB is a multi-instance broker running in active mode on the multi-instance queue manager 'NFSMQK', issue the mqsilist command.
These commands are illustrated in Example 6-23.
Example 6-23 Verifying the status on the node
$ ps -ef|grep runmqlsreaiadmin 700428 540678 0 00:19:21 - 0:00 /usr/mqm/bin/runmqlsr -r -m NFSMQK -t TCP -p 11421$ dspmq -xQMNAME(NFSMQK) STATUS(Running) INSTANCE(p5502p8) MODE(Active) INSTANCE(p5501p5) MODE(Standby)$ mqsilistBIP1295I: Broker 'NFSWMB' is a multi-instance broker running in active mode on multi-instance queue manager 'NFSMQK'.BIP8071I: Successful command completion.
Note: During the switch-over period the active queue manager stops without waiting for the standby queue manager to become active. Clients connecting during this period do not get a connection to the queue manager and must re-connect to the Node2 queue manager instance after it becomes active.
In the scenario described in this chapter, the behavior is determined by the publish/subscribe configuration. The subscription is configured to be a durable subscription. Messages are persistent, so there is no loss of messages. After the queue manager instance on Node2 becomes active, it receives the messages that have been published to the topic.
If the subscription was not durable and messages were not persistent there is a risk that messages can be lost during the cut over period if for instance the messages expire or the queue manger goes down.
138 High Availability in WebSphere Messaging Solutions
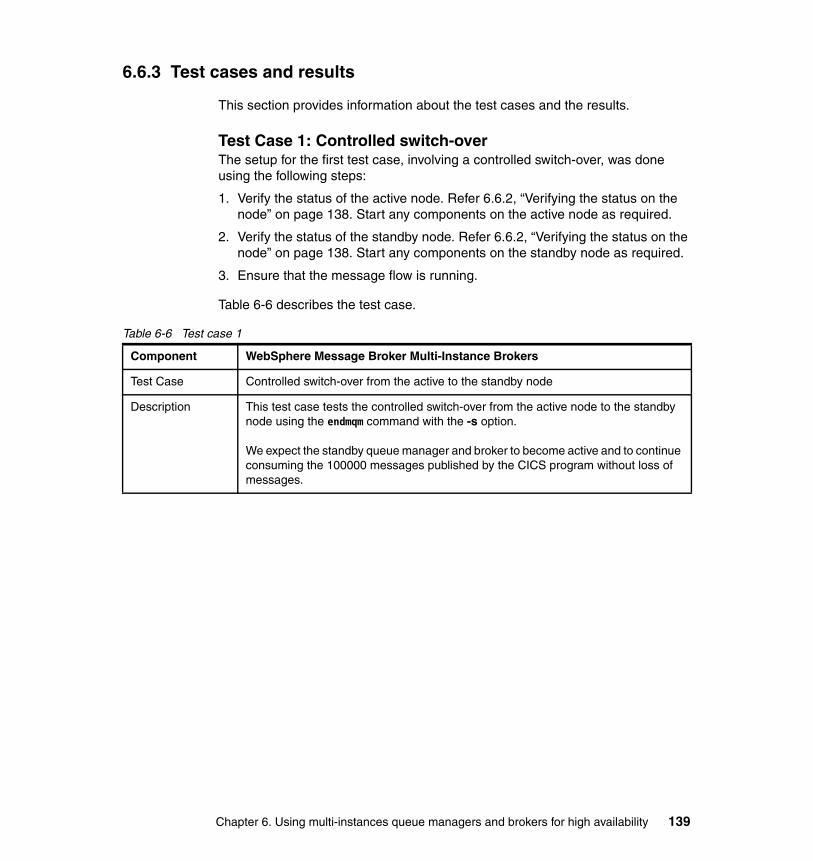
6.6.3 Test cases and results
This section provides information about the test cases and the results.
Test Case 1: Controlled switch-overThe setup for the first test case, involving a controlled switch-over, was done using the following steps:
1. Verify the status of the active node. Refer 6.6.2, “Verifying the status on the node” on page 138. Start any components on the active node as required.
2. Verify the status of the standby node. Refer 6.6.2, “Verifying the status on the node” on page 138. Start any components on the standby node as required.
3. Ensure that the message flow is running.
Table 6-6 describes the test case.
Table 6-6 Test case 1
Component WebSphere Message Broker Multi-Instance Brokers
Test Case Controlled switch-over from the active to the standby node
Description This test case tests the controlled switch-over from the active node to the standby node using the endmqm command with the -s option.
We expect the standby queue manager and broker to become active and to continue consuming the 100000 messages published by the CICS program without loss of messages.
Chapter 6. Using multi-instances queue managers and brokers for high availability 139

Table 6-7 describes the steps executed in the test case and the results.
Table 6-7 Test steps
Step Description Pass/Fail
1 Invoke the CICS program to publish messages to the NEWS.POLITICS topic on z/OS queue manager MQH1.
See Appendix A, “QPUB Transaction” on page 227 for details of the CICS program and how to invoke it.
Results:The messages are published to the NEWS.POLITICS topic on z/OS queue manager MQH1 and go to the MI_INPUT queue on queue manager NFSMQK.
Pass
2 Monitor the output queue MI_OUTPUT on the active node through MQ Explorer. After approximately 15000 messages have been processed perform a controlled switch from the active node to the standby node by issuing the endmq -s command on the active node.
If you are monitoring the queue depth in MQ Explorer you lose connection to the active node instance of the queue manager on Node1 as it stops and switches control to the standby instance on Node2. After Node2 becomes active you must re-connect to the queue manager instance on Node2 to check the queue depth of the output queue.
Results:$ endmqm -s NFSMQKWaiting for queue manager 'NFSMQK' to end.Quiesce request accepted. The queue manager will stop when all outstanding workis complete, permitting switch-over to a standby instance.$This shows that the queue manager on Node1 is about to stop and has handed control to the standby instance on Node2.
Pass
140 High Availability in WebSphere Messaging Solutions
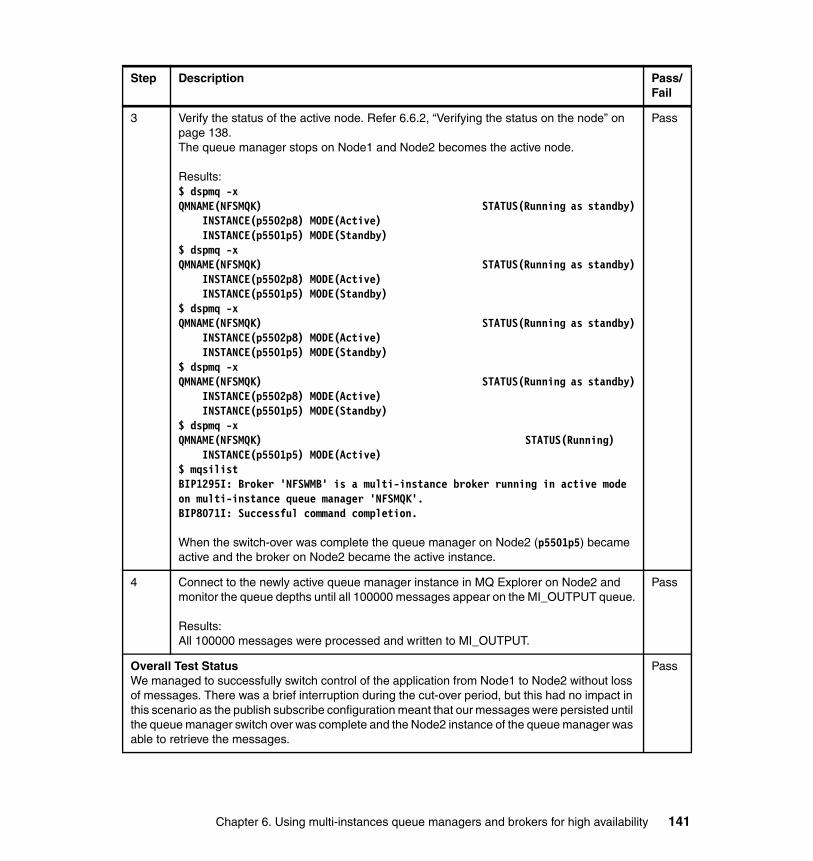
3 Verify the status of the active node. Refer 6.6.2, “Verifying the status on the node” on page 138.The queue manager stops on Node1 and Node2 becomes the active node.
Results:$ dspmq -xQMNAME(NFSMQK) STATUS(Running as standby) INSTANCE(p5502p8) MODE(Active) INSTANCE(p5501p5) MODE(Standby)$ dspmq -xQMNAME(NFSMQK) STATUS(Running as standby) INSTANCE(p5502p8) MODE(Active) INSTANCE(p5501p5) MODE(Standby)$ dspmq -xQMNAME(NFSMQK) STATUS(Running as standby) INSTANCE(p5502p8) MODE(Active) INSTANCE(p5501p5) MODE(Standby)$ dspmq -xQMNAME(NFSMQK) STATUS(Running as standby) INSTANCE(p5502p8) MODE(Active) INSTANCE(p5501p5) MODE(Standby)$ dspmq -xQMNAME(NFSMQK) STATUS(Running) INSTANCE(p5501p5) MODE(Active)$ mqsilistBIP1295I: Broker 'NFSWMB' is a multi-instance broker running in active mode on multi-instance queue manager 'NFSMQK'.BIP8071I: Successful command completion.
When the switch-over was complete the queue manager on Node2 (p5501p5) became active and the broker on Node2 became the active instance.
Pass
4 Connect to the newly active queue manager instance in MQ Explorer on Node2 and monitor the queue depths until all 100000 messages appear on the MI_OUTPUT queue.
Results:All 100000 messages were processed and written to MI_OUTPUT.
Pass
Overall Test StatusWe managed to successfully switch control of the application from Node1 to Node2 without loss of messages. There was a brief interruption during the cut-over period, but this had no impact in this scenario as the publish subscribe configuration meant that our messages were persisted until the queue manager switch over was complete and the Node2 instance of the queue manager was able to retrieve the messages.
Pass
Step Description Pass/Fail
Chapter 6. Using multi-instances queue managers and brokers for high availability 141
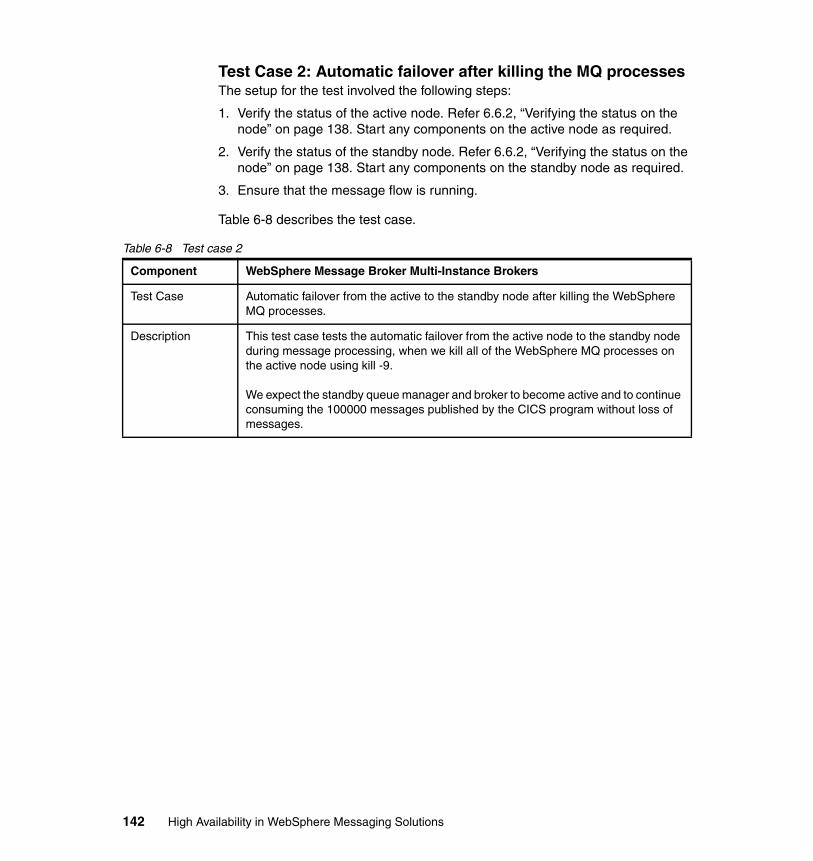
Test Case 2: Automatic failover after killing the MQ processesThe setup for the test involved the following steps:
1. Verify the status of the active node. Refer 6.6.2, “Verifying the status on the node” on page 138. Start any components on the active node as required.
2. Verify the status of the standby node. Refer 6.6.2, “Verifying the status on the node” on page 138. Start any components on the standby node as required.
3. Ensure that the message flow is running.
Table 6-8 describes the test case.
Table 6-8 Test case 2
Component WebSphere Message Broker Multi-Instance Brokers
Test Case Automatic failover from the active to the standby node after killing the WebSphere MQ processes.
Description This test case tests the automatic failover from the active node to the standby node during message processing, when we kill all of the WebSphere MQ processes on the active node using kill -9.
We expect the standby queue manager and broker to become active and to continue consuming the 100000 messages published by the CICS program without loss of messages.
142 High Availability in WebSphere Messaging Solutions
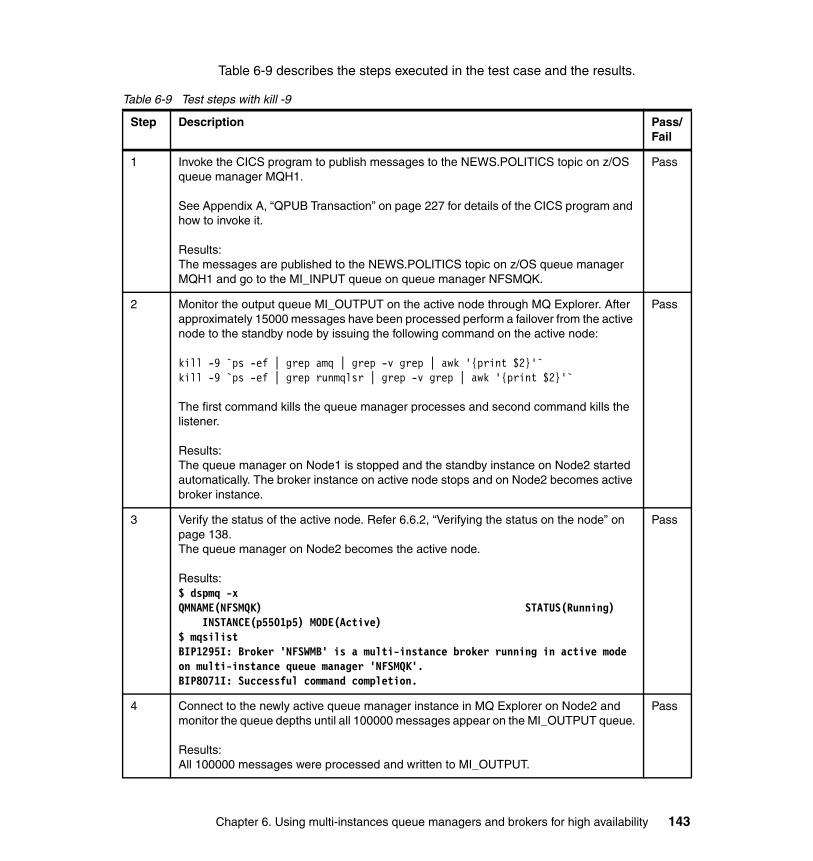
Table 6-9 describes the steps executed in the test case and the results.
Table 6-9 Test steps with kill -9
Step Description Pass/Fail
1 Invoke the CICS program to publish messages to the NEWS.POLITICS topic on z/OS queue manager MQH1.
See Appendix A, “QPUB Transaction” on page 227 for details of the CICS program and how to invoke it.
Results:The messages are published to the NEWS.POLITICS topic on z/OS queue manager MQH1 and go to the MI_INPUT queue on queue manager NFSMQK.
Pass
2 Monitor the output queue MI_OUTPUT on the active node through MQ Explorer. After approximately 15000 messages have been processed perform a failover from the active node to the standby node by issuing the following command on the active node:
kill -9 `ps -ef | grep amq | grep -v grep | awk '{print $2}'`kill -9 `ps -ef | grep runmqlsr | grep -v grep | awk '{print $2}'`
The first command kills the queue manager processes and second command kills the listener.
Results:The queue manager on Node1 is stopped and the standby instance on Node2 started automatically. The broker instance on active node stops and on Node2 becomes active broker instance.
Pass
3 Verify the status of the active node. Refer 6.6.2, “Verifying the status on the node” on page 138. The queue manager on Node2 becomes the active node.
Results:$ dspmq -xQMNAME(NFSMQK) STATUS(Running) INSTANCE(p5501p5) MODE(Active)$ mqsilistBIP1295I: Broker 'NFSWMB' is a multi-instance broker running in active mode on multi-instance queue manager 'NFSMQK'.BIP8071I: Successful command completion.
Pass
4 Connect to the newly active queue manager instance in MQ Explorer on Node2 and monitor the queue depths until all 100000 messages appear on the MI_OUTPUT queue.
Results:All 100000 messages were processed and written to MI_OUTPUT.
Pass
Chapter 6. Using multi-instances queue managers and brokers for high availability 143
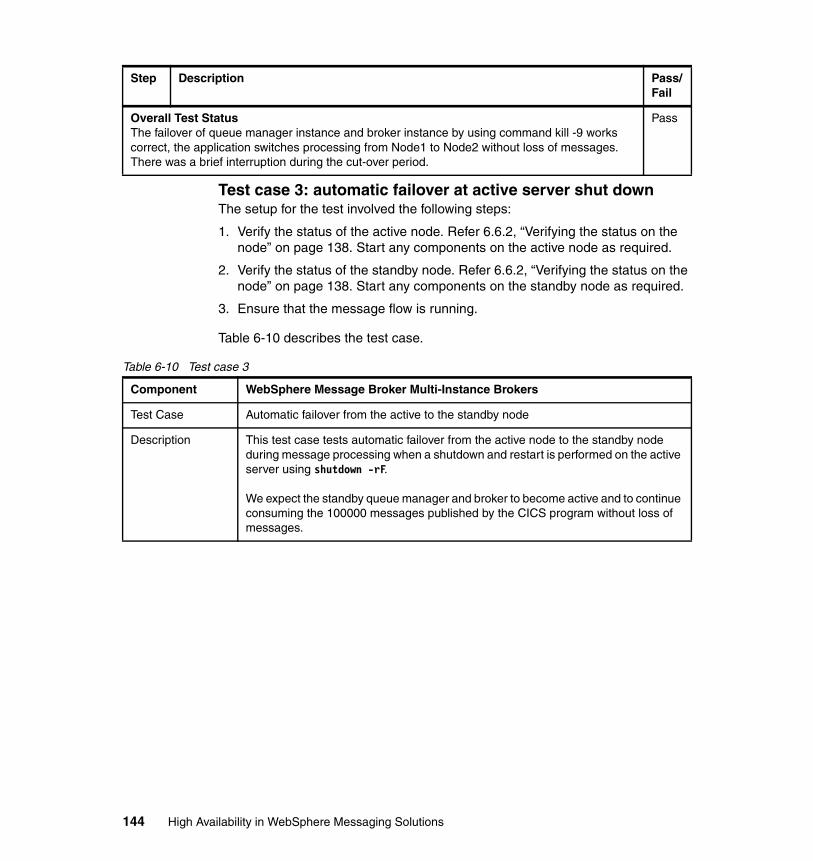
Test case 3: automatic failover at active server shut downThe setup for the test involved the following steps:
1. Verify the status of the active node. Refer 6.6.2, “Verifying the status on the node” on page 138. Start any components on the active node as required.
2. Verify the status of the standby node. Refer 6.6.2, “Verifying the status on the node” on page 138. Start any components on the standby node as required.
3. Ensure that the message flow is running.
Table 6-10 describes the test case.
Table 6-10 Test case 3
Overall Test StatusThe failover of queue manager instance and broker instance by using command kill -9 works correct, the application switches processing from Node1 to Node2 without loss of messages. There was a brief interruption during the cut-over period.
Pass
Step Description Pass/Fail
Component WebSphere Message Broker Multi-Instance Brokers
Test Case Automatic failover from the active to the standby node
Description This test case tests automatic failover from the active node to the standby node during message processing when a shutdown and restart is performed on the active server using shutdown -rF.
We expect the standby queue manager and broker to become active and to continue consuming the 100000 messages published by the CICS program without loss of messages.
144 High Availability in WebSphere Messaging Solutions
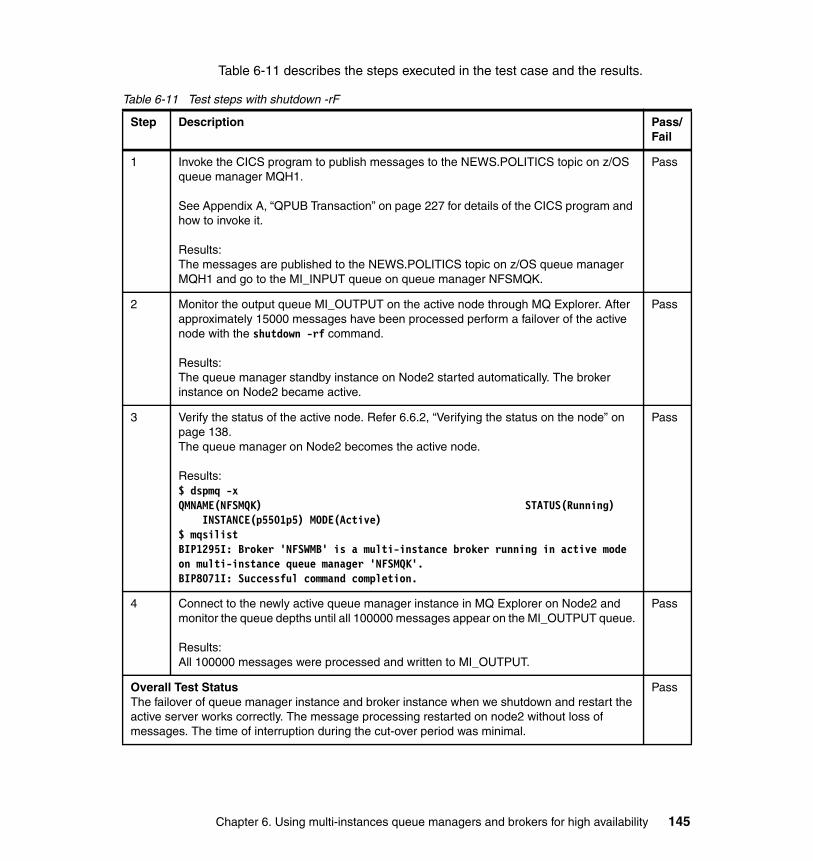
Table 6-11 describes the steps executed in the test case and the results.
Table 6-11 Test steps with shutdown -rF
Step Description Pass/Fail
1 Invoke the CICS program to publish messages to the NEWS.POLITICS topic on z/OS queue manager MQH1.
See Appendix A, “QPUB Transaction” on page 227 for details of the CICS program and how to invoke it.
Results:The messages are published to the NEWS.POLITICS topic on z/OS queue manager MQH1 and go to the MI_INPUT queue on queue manager NFSMQK.
Pass
2 Monitor the output queue MI_OUTPUT on the active node through MQ Explorer. After approximately 15000 messages have been processed perform a failover of the active node with the shutdown -rf command.
Results:The queue manager standby instance on Node2 started automatically. The broker instance on Node2 became active.
Pass
3 Verify the status of the active node. Refer 6.6.2, “Verifying the status on the node” on page 138. The queue manager on Node2 becomes the active node.
Results:$ dspmq -xQMNAME(NFSMQK) STATUS(Running) INSTANCE(p5501p5) MODE(Active)$ mqsilistBIP1295I: Broker 'NFSWMB' is a multi-instance broker running in active mode on multi-instance queue manager 'NFSMQK'.BIP8071I: Successful command completion.
Pass
4 Connect to the newly active queue manager instance in MQ Explorer on Node2 and monitor the queue depths until all 100000 messages appear on the MI_OUTPUT queue.
Results:All 100000 messages were processed and written to MI_OUTPUT.
Pass
Overall Test StatusThe failover of queue manager instance and broker instance when we shutdown and restart the active server works correctly. The message processing restarted on node2 without loss of messages. The time of interruption during the cut-over period was minimal.
Pass
Chapter 6. Using multi-instances queue managers and brokers for high availability 145
6.7 Summary
In this scenario we were able to demonstrate successfully the use of WebSphere MQ and WebSphere Message Broker multi-instance features to provide a high availability solution.
Our testing showed that the controlled switch-over can be used to change the active instance to allow maintenance of the active node. In addition we looked at two failover scenarios and verified the automatic switch-over from the active node to the standby node in the event of a failure.
The multi-instance features performed well and provided an effective high availability solution.
146 High Availability in WebSphere Messaging Solutions

Chapter 7. High availability through redundancy
This chapter presents a scenario that demonstrates the use of redundancy to provide high availability.
Redundancy is employed at multiple levels:
� Multiple DataPower appliances� Multiple WebSphere Message Broker Servers� Multiple WebSphere Message Broker brokers within each server� Multiple execution groups within each broker
7
© Copyright IBM Corp. 2010. All rights reserved. 147
7.1 Overview
In this scenario a network load balancer is used to spread traffic across two DataPower XI50 appliances. Both devices are configured as active. DataPower receives SOAP/HTTP requests that are routed by DataPower to a pair of equivalent WebSphere Message Broker servers configured in an active-active configuration. Each request is handled by a message flow that exposes a Web service to receive messages. The flow performs a transformation of the request message and puts it to a WebSphere MQ queue.
Messages placed on the queue might undergo further processing. For example, the message can be consumed by a message-driven bean (MDB) connected to WebSphere MQ using client bindings or through the IBM WebSphere Application Server default messaging provider. To provide end-to-end high availability, the MDB can be deployed into a WebSphere Application Server cluster. Figure 7-1 on page 149 describes this scenario.
Note: The scope of testing for this scenario does not include the WebSphere Application Server cluster and MDB. These components are shown in Figure 7-1 on page 149 for completeness.
148 High Availability in WebSphere Messaging Solutions
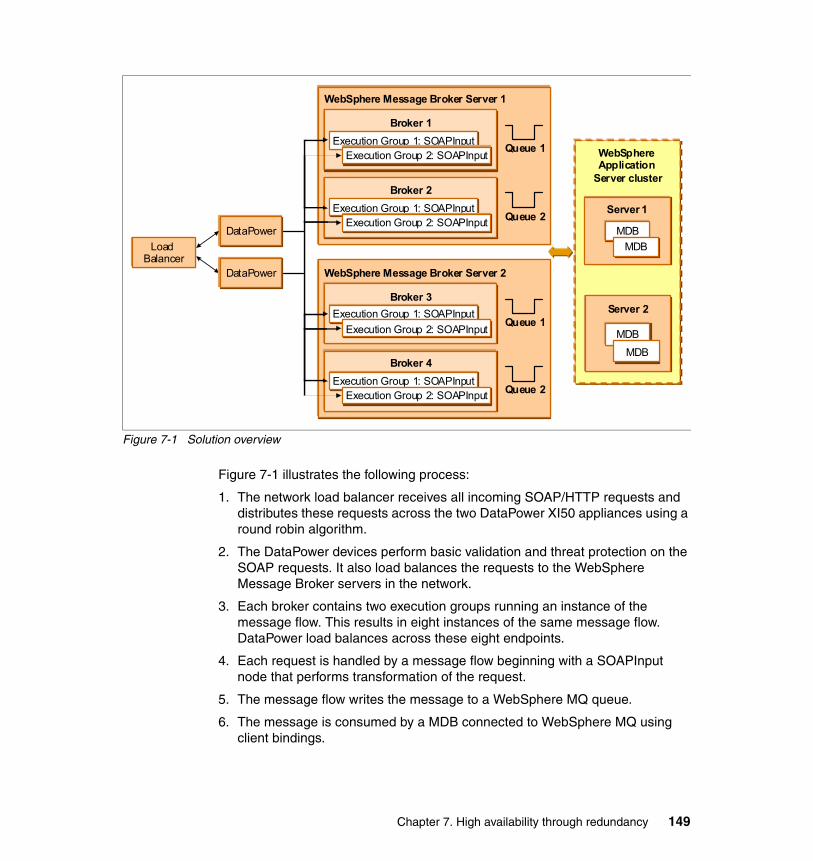
Figure 7-1 Solution overview
Figure 7-1 illustrates the following process:
1. The network load balancer receives all incoming SOAP/HTTP requests and distributes these requests across the two DataPower XI50 appliances using a round robin algorithm.
2. The DataPower devices perform basic validation and threat protection on the SOAP requests. It also load balances the requests to the WebSphere Message Broker servers in the network.
3. Each broker contains two execution groups running an instance of the message flow. This results in eight instances of the same message flow. DataPower load balances across these eight endpoints.
4. Each request is handled by a message flow beginning with a SOAPInput node that performs transformation of the request.
5. The message flow writes the message to a WebSphere MQ queue.
6. The message is consumed by a MDB connected to WebSphere MQ using client bindings.
WebSphere Message Broker Server 1
Load Balancer
DataPower
DataPower
WebSphere Application
Server cluster
Server 1
MDB
MDB
Server 2
MDB
MDB
Broker 1
Execution Group 1: SOAPInputExecution Group 2: SOAPInput
Queue 1
Broker 2
Execution Group 1: SOAPInputExecution Group 2: SOAPInput Queue 2
WebSphere Message Broker Server 2
Broker 3
Execution Group 1: SOAPInput
Execution Group 2: SOAPInputQueue 1
Broker 4
Execution Group 1: SOAPInputExecution Group 2: SOAPInput Queue 2
Chapter 7. High availability through redundancy 149
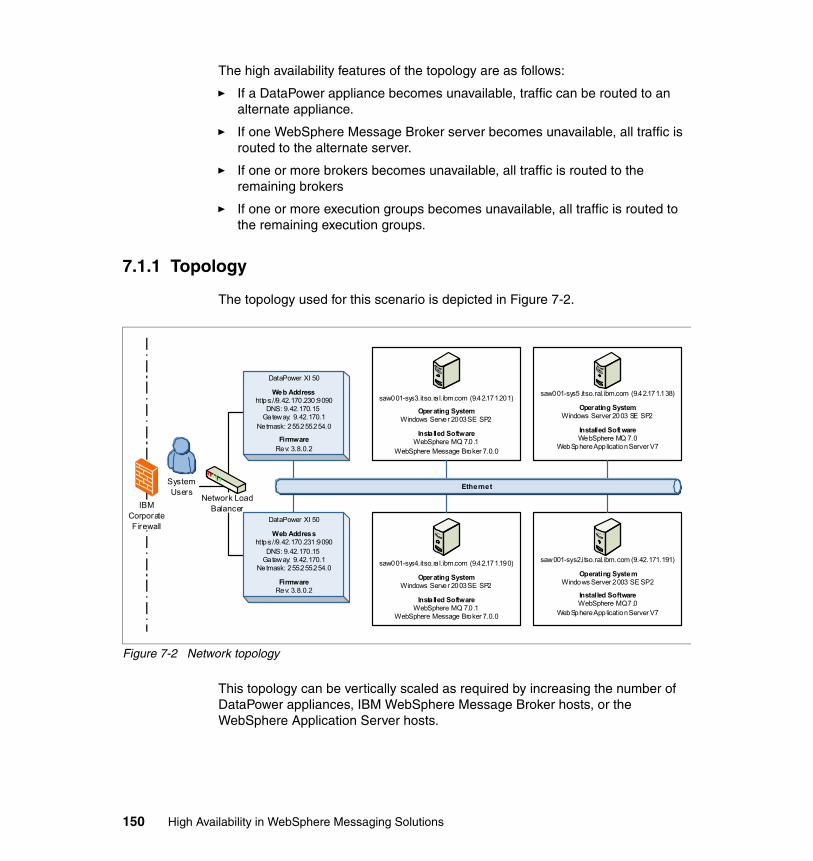
The high availability features of the topology are as follows:
� If a DataPower appliance becomes unavailable, traffic can be routed to an alternate appliance.
� If one WebSphere Message Broker server becomes unavailable, all traffic is routed to the alternate server.
� If one or more brokers becomes unavailable, all traffic is routed to the remaining brokers
� If one or more execution groups becomes unavailable, all traffic is routed to the remaining execution groups.
7.1.1 Topology
The topology used for this scenario is depicted in Figure 7-2.
Figure 7-2 Network topology
This topology can be vertically scaled as required by increasing the number of DataPower appliances, IBM WebSphere Message Broker hosts, or the WebSphere Application Server hosts.
SystemUsers
IBMCorporateFirewall
saw001-sys4.itso.ra l.ibm.com (9.42.171.190)
Operating SystemWindows Server 2003 SE SP2
Installed SoftwareWebSphere MQ 7.0.1
WebSphere Message Broker 7.0.0
saw001-sys2.i tso.ral.ibm.com (9.42.171.191)
Operating SystemWindows Server 2003 SE SP2
Installed SoftwareWebSphere MQ 7.0
WebSphere Application Server V7
saw001-sys3.itso.ra l.ibm.com (9.42.171.201)
Operating SystemWindows Server 2003 SE SP2
Installed SoftwareWebSphere MQ 7.0.1
WebSphere Message Broker 7.0.0
saw001-sys5.itso.ral.ibm.com (9.42.171.138)
Operating SystemWindows Server 2003 SE SP2
Installed Soft wareWebSphere MQ 7.0
WebSphere Application Server V7
Network LoadBalancer
Ethernet
DataPower XI 50
Web Addresshttps://9.42.170.230:9090
DNS: 9.42.170.15 Gateway: 9.42.170.1
Netmask: 255.255.254.0
FirmwareRev: 3.8.0.2
DataPower XI 50
Web Addresshttps://9.42.170.231:9090
DNS: 9.42.170.15 Gateway: 9.42.170.1
Netmask: 255.255.254.0
FirmwareRev: 3.8.0.2
150 High Availability in WebSphere Messaging Solutions

Each component in our topology is described in Table 7-1.
Table 7-1 Topology components
7.1.2 High availability characteristics and actions
In this scenario, we consider a number of possible failure scenarios. This includes the failure of the following elements:
� DataPower appliance� Single execution group� Individual broker� WebSphere Message Broker server
DataPower Appliance outageIf any of the DataPower appliances experiences a failure, the network load balancer detects that a device is unavailable and removes the failed device from its active list of devices. It checks for its availability periodically. During the failover, all traffic is redirected to the remaining active appliances in the environment. A device failure causes all in-flight transactions to be lost. Client applications might be required to re-submit the request in case of HTTP-based requests.
Component Description
Network load balancer The network load balancer intercepts all inbound requests and load balances them to the available DataPower devices using a round robin algorithm.
DataPower XI50 Appliances DataPower XI50 appliances are configured as Web services gateways to proxy Web services to the consuming application using SOAP/HTTP. For application-level load balancing to the service endpoint, Load Balancer Group objects are used to route inbound requests dynamically to the WebSphere Message Broker servers. This provides seamless transition of requests to any of the available back-end endpoints.
WebSphere Message Broker servers (saw001-sys3 and saw001-sys4)
These two servers host the WebSphere Message Broker message flows. In this scenario there is a single message flow that exposes a Web service using a SOAPInput node. WebSphere Message Broker is configured with two brokers on each of the application servers making a total of four brokers. Each broker contains two execution groups. Our message flow is deployed to each of these execution groups making a total of eight instances of the message flow.
WebSphere Application Server servers (saw001-sys2 and saw001-sys5)
These two servers host WebSphere Application Server. A cluster of application servers, one on each host, have been defined. The message driven bean is deployed to the cluster.
Chapter 7. High availability through redundancy 151
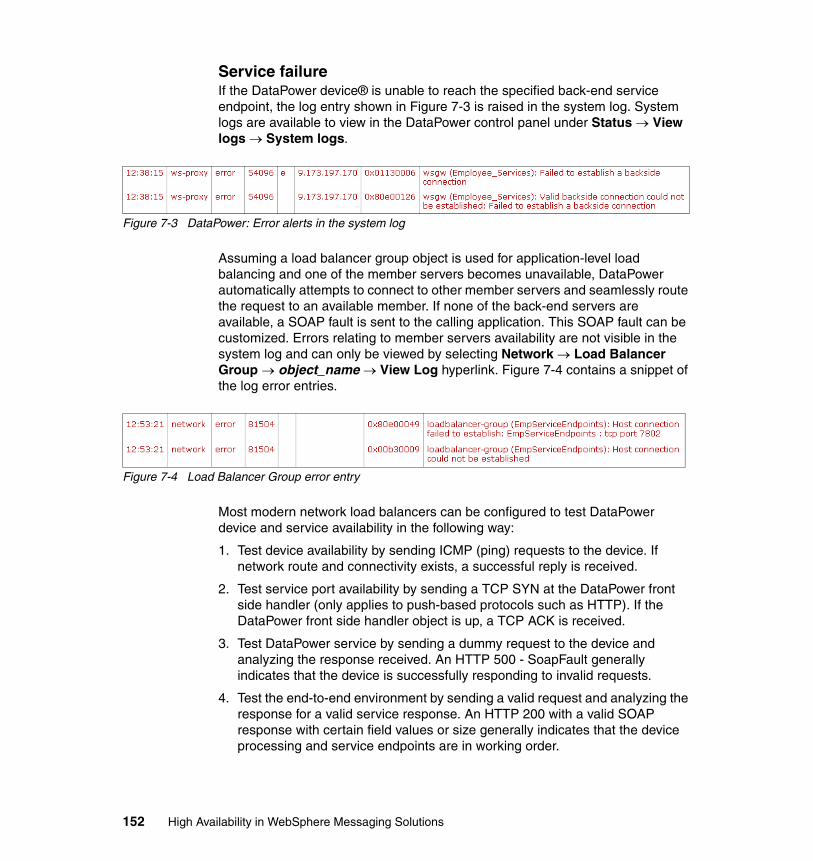
Service failureIf the DataPower device® is unable to reach the specified back-end service endpoint, the log entry shown in Figure 7-3 is raised in the system log. System logs are available to view in the DataPower control panel under Status View logs System logs.
Figure 7-3 DataPower: Error alerts in the system log
Assuming a load balancer group object is used for application-level load balancing and one of the member servers becomes unavailable, DataPower automatically attempts to connect to other member servers and seamlessly route the request to an available member. If none of the back-end servers are available, a SOAP fault is sent to the calling application. This SOAP fault can be customized. Errors relating to member servers availability are not visible in the system log and can only be viewed by selecting Network Load Balancer Group object_name View Log hyperlink. Figure 7-4 contains a snippet of the log error entries.
Figure 7-4 Load Balancer Group error entry
Most modern network load balancers can be configured to test DataPower device and service availability in the following way:
1. Test device availability by sending ICMP (ping) requests to the device. If network route and connectivity exists, a successful reply is received.
2. Test service port availability by sending a TCP SYN at the DataPower front side handler (only applies to push-based protocols such as HTTP). If the DataPower front side handler object is up, a TCP ACK is received.
3. Test DataPower service by sending a dummy request to the device and analyzing the response received. An HTTP 500 - SoapFault generally indicates that the device is successfully responding to invalid requests.
4. Test the end-to-end environment by sending a valid request and analyzing the response for a valid service response. An HTTP 200 with a valid SOAP response with certain field values or size generally indicates that the device processing and service endpoints are in working order.
152 High Availability in WebSphere Messaging Solutions
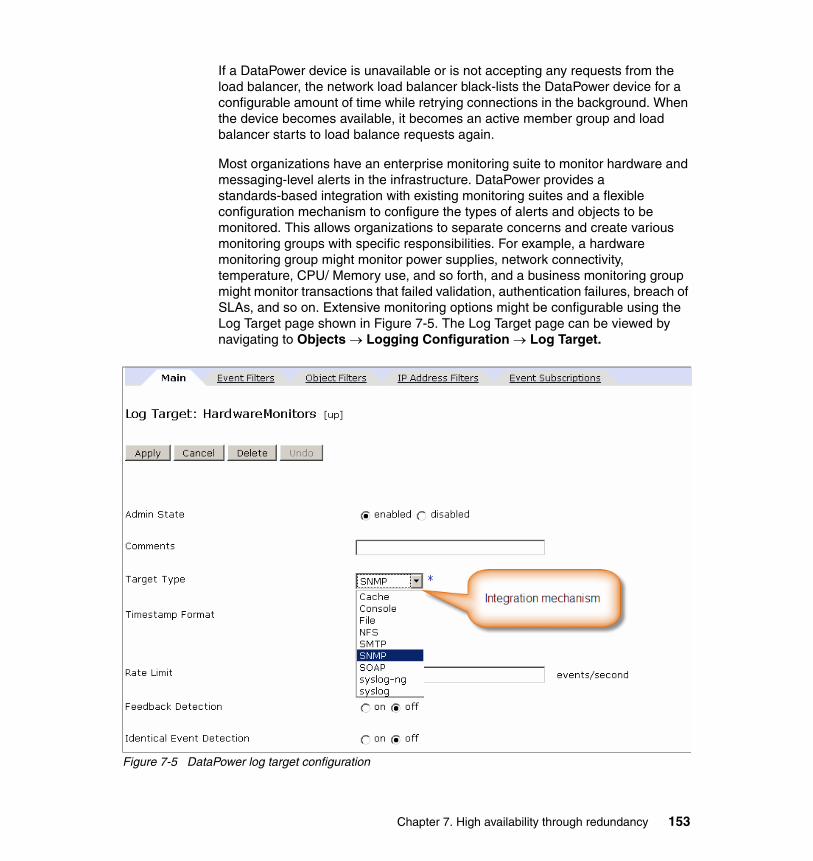
If a DataPower device is unavailable or is not accepting any requests from the load balancer, the network load balancer black-lists the DataPower device for a configurable amount of time while retrying connections in the background. When the device becomes available, it becomes an active member group and load balancer starts to load balance requests again.
Most organizations have an enterprise monitoring suite to monitor hardware and messaging-level alerts in the infrastructure. DataPower provides a standards-based integration with existing monitoring suites and a flexible configuration mechanism to configure the types of alerts and objects to be monitored. This allows organizations to separate concerns and create various monitoring groups with specific responsibilities. For example, a hardware monitoring group might monitor power supplies, network connectivity, temperature, CPU/ Memory use, and so forth, and a business monitoring group might monitor transactions that failed validation, authentication failures, breach of SLAs, and so on. Extensive monitoring options might be configurable using the Log Target page shown in Figure 7-5. The Log Target page can be viewed by navigating to Objects Logging Configuration Log Target.
Figure 7-5 DataPower log target configuration
Chapter 7. High availability through redundancy 153

The Target Type list offers mechanism to integrate with the target monitoring system. Depending on the option selected, the user sees further options to configure the remote target. Figure 7-6 illustrates the point that certain targets can choose the type of alerts they receive. For example, the Event Filters tab allows the user to subscribe or suppress certain types of events. As a hardware monitoring target, this configuration sends alerts to the remote system of any critical hardware failures using SNMP.
Figure 7-6 Configuring DataPower Log Target
This configuration can be further optimized, tuned for specific errors, and set priorities and objects that raise alerts in other tabs available on this page.
Execution group not responsiveIf one of the execution groups stops responding either due to an application error or for another reason, the DataPower appliance does not receive a SOAP Reply in the maximum timeout wait period. DataPower therefore blacklists this endpoint and routes traffic to the remaining execution groups (URL s).
DataPower periodically polls the endpoints performing a health check. If they are available they are removed from the blacklist.
154 High Availability in WebSphere Messaging Solutions
Broker is unavailableIf one of the brokers is shutdown or stops responding, the DataPower appliance does not receive a SOAP Reply within the maximum timeout wait period. DataPower therefore blacklists the endpoints for the broker and routes traffic to the endpoints of the remaining brokers.
DataPower periodically polls the endpoints performing a health check. If they are available they are removed from the blacklist.
The Message Broker Server is unavailableIf one of the servers is down or un-reachable, the DataPower appliance detects this and blacklists the endpoints of the server. All traffic is routed to the endpoints of the remaining server.
DataPower periodically checks to see if the server is back up. If the server comes back online and the endpoints are available they are removed from the blacklist.
7.1.3 Recovery
If there is an outage the redundant components can continue processing incoming requests with little or no impact to the clients. The outage can be due to any number of causes (including disk failures, CPU failures, message flow coding defects, network problems and power supply failures). The recovery actions to remedy the outage depend upon the cause of the outage and might require manual intervention. If an outage to a server, broker, or execution group is resolved and the service is restored, DataPower detects this and removes the affected services from the blacklist.
Chapter 7. High availability through redundancy 155
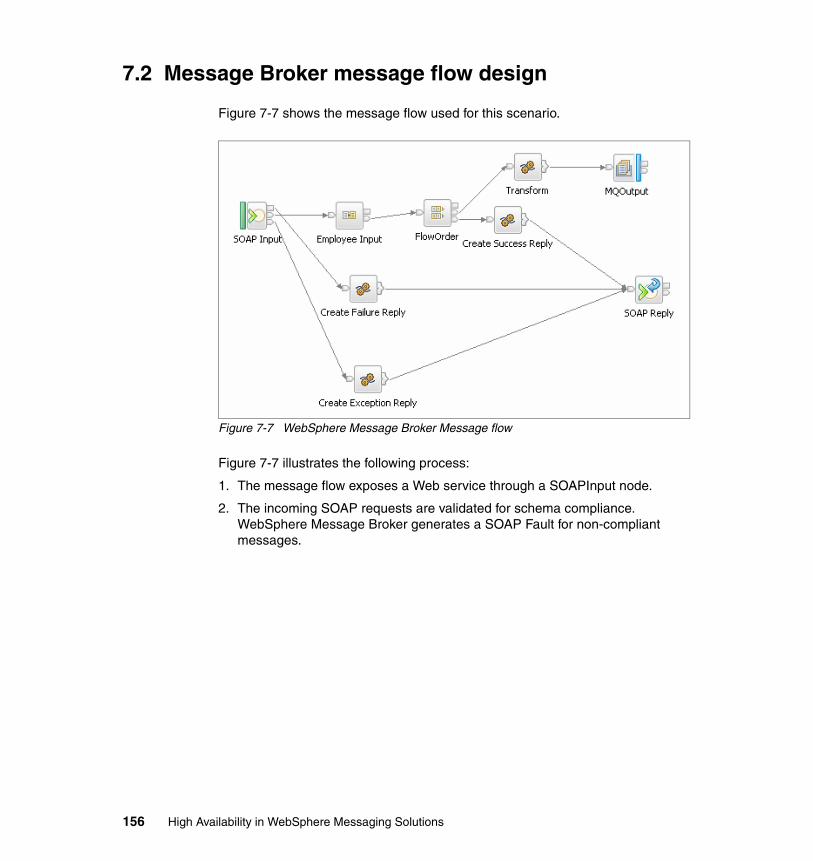
7.2 Message Broker message flow design
Figure 7-7 shows the message flow used for this scenario.
Figure 7-7 WebSphere Message Broker Message flow
Figure 7-7 illustrates the following process:
1. The message flow exposes a Web service through a SOAPInput node.
2. The incoming SOAP requests are validated for schema compliance. WebSphere Message Broker generates a SOAP Fault for non-compliant messages.
156 High Availability in WebSphere Messaging Solutions

3. Valid messages flow through to the EmployeeInput node, which removes the SOAP Envelope from the message, leaving an Employee message. This is shown in Figure 7-8.
Figure 7-8 Employee message example
4. The message passes through a FlowOrder node to the Transform compute node. This node transforms the incoming Employee.xml message to the outgoing EmployeeDetails.xml format as shown in Figure 7-9.
Figure 7-9 Outgoing EmployeeDetails message example
5. The transformed message is written to the SAW001_EXPORT_EMPLOYEE output queue with an MQOutput node.
6. Control passes to the next step of the flow order node. A reply message is generated in the Create Success Reply compute node, which is passed to the SOAP Reply Node.
7. The message is consumed by a MDB connected to WebSphere MQ using client bindings.
In this scenario we use a fire and forget paradigm: after the flow has put the message to the message queue it sends the SOAP Reply to the client indicating
<?xml version="1.0" encoding="UTF-8"?><Employee xmlns:xsi="http://www.w3.org/2001/XMLSchema-instance" xsi:noNamespaceSchemaLocation="Employee.xsd">
<EmployeeNumber>19092817</EmployeeNumber><FirstName>John</FirstName><LastName>Citizen</LastName><Phone>919-867-9876</Phone><Mobile>0418764519</Mobile><Email>[email protected]</Email>
</Employee>
<?xml version="1.0" encoding="UTF-8"?><EmployeeDetails xmlns:xsi="http://www.w3.org/2001/XMLSchema-instance" xsi:noNamespaceSchemaLocation="EmployeeDetails.xsd">
<Empnum>19092817</Empnum><Name>John Citizen</Name>
<ContactDetails>Ph: 919-867-9876, Mob:0418764519, Email:[email protected]</ContactDetails></EmployeeDetails>
Chapter 7. High availability through redundancy 157
success. This is suitable in situations where the client is not interested in the eventual success or failure of the message in the consumer system and is suitable for the purposes of demonstrating this high availability scenario.
The MQOutput node is configured for transactional behavior. If there is an exception (For example, trying to write to the queue), the flow rolls back to the SOAP Input Node. Failures and exceptions result in a fault response being returned in the SOAP Reply.
7.3 WebSphere Message Broker configuration
This section describes how to configure WebSphere Message Broker to provide redundancy for brokers and execution groups.
Two IBM WebSphere Message Broker servers are set up with an almost identical configuration. The following procedure describes the process for one of these servers. You need to repeat the process on the other server.
To configure the topology for the message flow application, perform the following steps:
1. Create the brokers and queue managers on each of the two WebSphere Message Broker servers.
2. Create two execution groups on each broker for a total of four execution groups per server and eight overall.
3. Create the queues required for the message flow application on each qmgr.
4. Deploy the message flow to all eight execution groups.
Note: Based on your requirements you might want to alter the flow to invoke the target application before replying to the client. This can be done synchronously within the same message flow, or asynchronously by using a request flow that receives the SOAP/HTTP request and writes the message to a queue. A second flow reads the response and writes the SOAP Reply.
In the latter case, the MQ Correlation ID must be saved in the request. These scenarios are described more thoroughly in the developerWorks® article SOAP nodes in IBM WebSphere Message Broker V6.1, Part 1: SOAP node basics, available at the following Web page:
http://www.ibm.com/developerworks/webservices/library/ws-soapnode/
158 High Availability in WebSphere Messaging Solutions
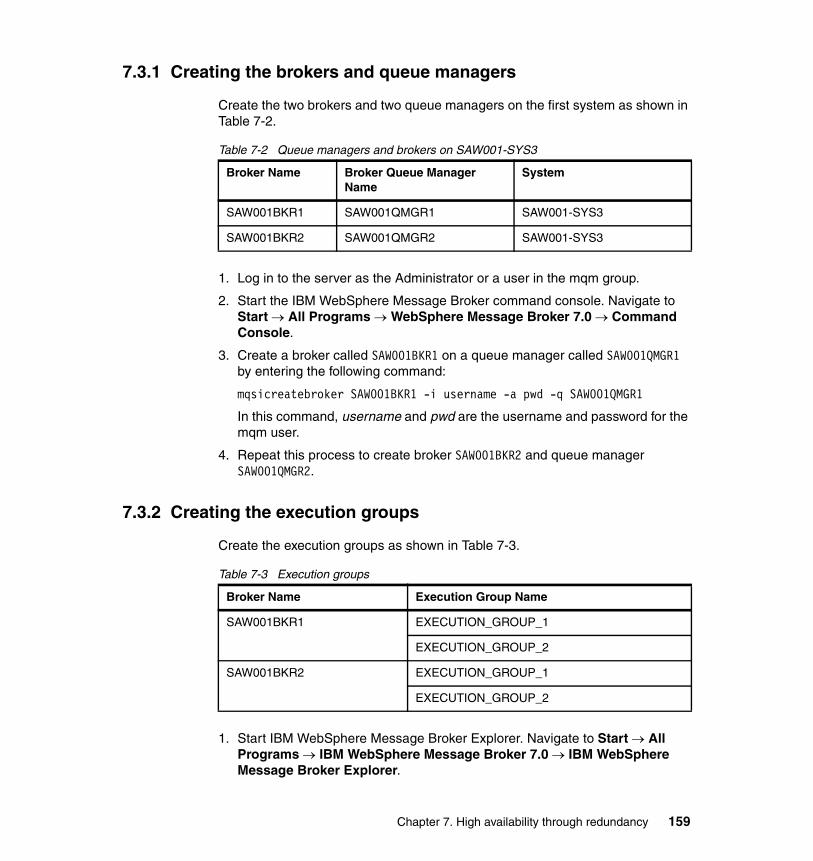
7.3.1 Creating the brokers and queue managers
Create the two brokers and two queue managers on the first system as shown in Table 7-2.
Table 7-2 Queue managers and brokers on SAW001-SYS3
1. Log in to the server as the Administrator or a user in the mqm group.
2. Start the IBM WebSphere Message Broker command console. Navigate to Start All Programs WebSphere Message Broker 7.0 Command Console.
3. Create a broker called SAW001BKR1 on a queue manager called SAW001QMGR1 by entering the following command:
mqsicreatebroker SAW001BKR1 -i username -a pwd -q SAW001QMGR1
In this command, username and pwd are the username and password for the mqm user.
4. Repeat this process to create broker SAW001BKR2 and queue manager SAW001QMGR2.
7.3.2 Creating the execution groups
Create the execution groups as shown in Table 7-3.
Table 7-3 Execution groups
1. Start IBM WebSphere Message Broker Explorer. Navigate to Start All Programs IBM WebSphere Message Broker 7.0 IBM WebSphere Message Broker Explorer.
Broker Name Broker Queue Manager Name
System
SAW001BKR1 SAW001QMGR1 SAW001-SYS3
SAW001BKR2 SAW001QMGR2 SAW001-SYS3
Broker Name Execution Group Name
SAW001BKR1 EXECUTION_GROUP_1
EXECUTION_GROUP_2
SAW001BKR2 EXECUTION_GROUP_1
EXECUTION_GROUP_2
Chapter 7. High availability through redundancy 159
2. In the MQ Explorer window under Brokers right-click broker SAW001BKR1 and select New Execution Group.
3. Enter EXECUTION_GROUP_ 1 as the name for the execution group and click OK.
4. Repeat this process to create the remaining three execution groups.
7.3.3 Deploying the bar file on the server
Deploy the bar file containing the message flow to each of the execution groups.
1. Copy the bar file to a temporary location on the server.
2. In the WebSphere Message Broker Explorer right-click the execution group by selecting Brokers SAW001BKR1 EXECUTION_GROUP_1 and choose Deploy.
3. Click Browse for additional Broker Archives.
4. Browse to the bar file you saved to the temporary location, select the bar file and click Open.
5. Select the bar file in the Deploy Wizard and click Finish.
6. Repeat this process for the remaining three execution groups.
When completed, your IBM WebSphere Message Broker Explorer window look like to Figure 7-10 on page 161.
160 High Availability in WebSphere Messaging Solutions
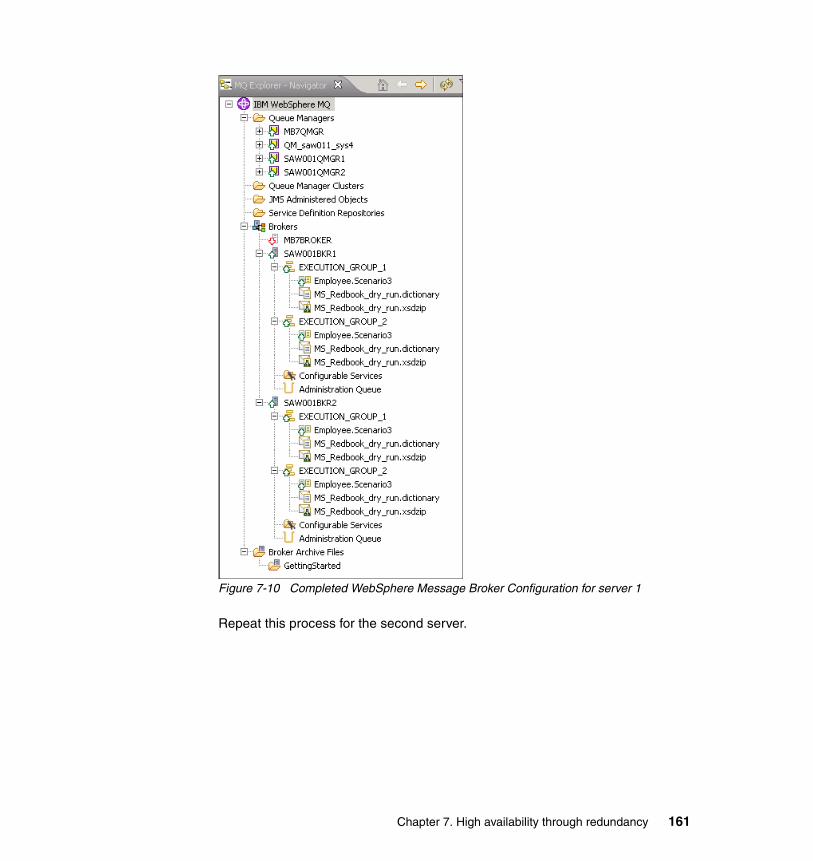
Figure 7-10 Completed WebSphere Message Broker Configuration for server 1
Repeat this process for the second server.
Chapter 7. High availability through redundancy 161
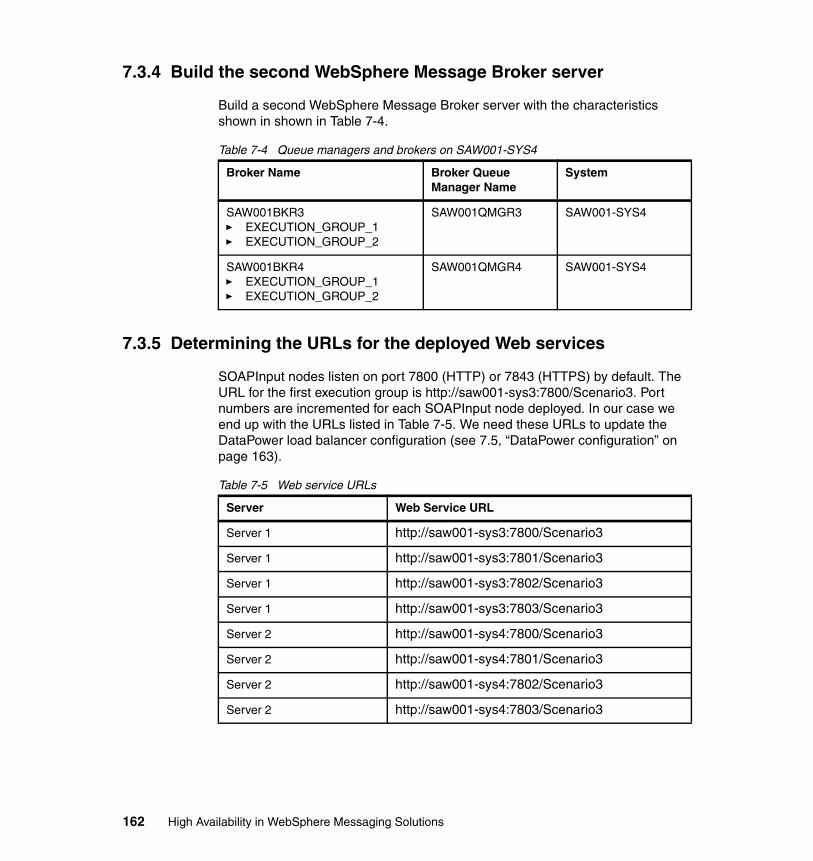
7.3.4 Build the second WebSphere Message Broker server
Build a second WebSphere Message Broker server with the characteristics shown in shown in Table 7-4.
Table 7-4 Queue managers and brokers on SAW001-SYS4
7.3.5 Determining the URLs for the deployed Web services
SOAPInput nodes listen on port 7800 (HTTP) or 7843 (HTTPS) by default. The URL for the first execution group is http://saw001-sys3:7800/Scenario3. Port numbers are incremented for each SOAPInput node deployed. In our case we end up with the URLs listed in Table 7-5. We need these URLs to update the DataPower load balancer configuration (see 7.5, “DataPower configuration” on page 163).
Table 7-5 Web service URLs
Broker Name Broker Queue Manager Name
System
SAW001BKR3� EXECUTION_GROUP_1� EXECUTION_GROUP_2
SAW001QMGR3 SAW001-SYS4
SAW001BKR4� EXECUTION_GROUP_1� EXECUTION_GROUP_2
SAW001QMGR4 SAW001-SYS4
Server Web Service URL
Server 1 http://saw001-sys3:7800/Scenario3
Server 1 http://saw001-sys3:7801/Scenario3
Server 1 http://saw001-sys3:7802/Scenario3
Server 1 http://saw001-sys3:7803/Scenario3
Server 2 http://saw001-sys4:7800/Scenario3
Server 2 http://saw001-sys4:7801/Scenario3
Server 2 http://saw001-sys4:7802/Scenario3
Server 2 http://saw001-sys4:7803/Scenario3
162 High Availability in WebSphere Messaging Solutions
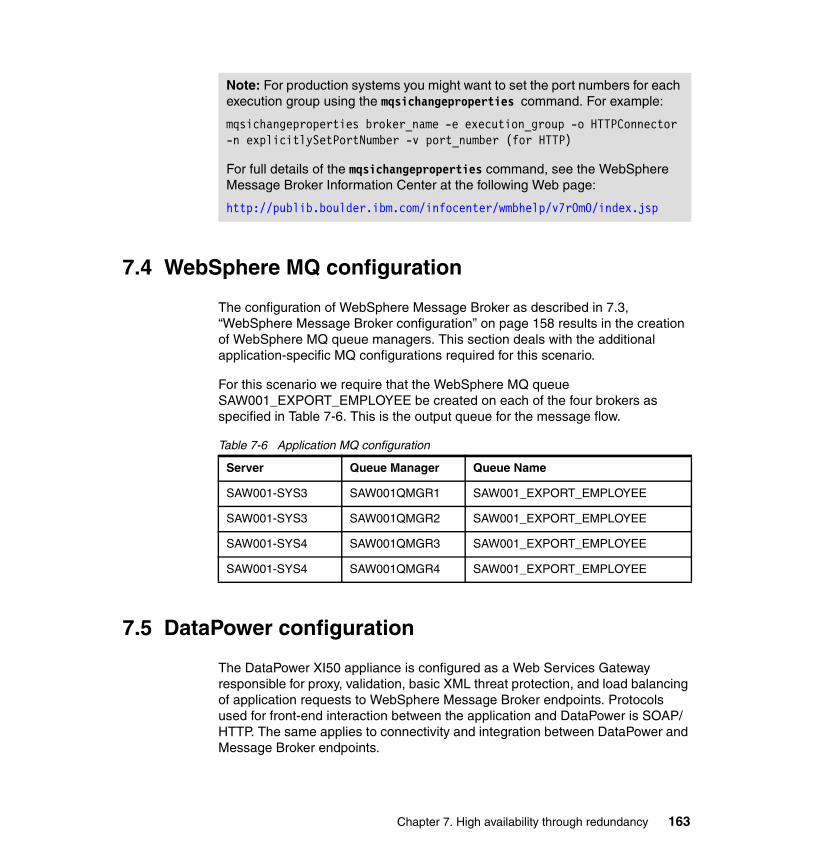
7.4 WebSphere MQ configuration
The configuration of WebSphere Message Broker as described in 7.3, “WebSphere Message Broker configuration” on page 158 results in the creation of WebSphere MQ queue managers. This section deals with the additional application-specific MQ configurations required for this scenario.
For this scenario we require that the WebSphere MQ queue SAW001_EXPORT_EMPLOYEE be created on each of the four brokers as specified in Table 7-6. This is the output queue for the message flow.
Table 7-6 Application MQ configuration
7.5 DataPower configuration
The DataPower XI50 appliance is configured as a Web Services Gateway responsible for proxy, validation, basic XML threat protection, and load balancing of application requests to WebSphere Message Broker endpoints. Protocols used for front-end interaction between the application and DataPower is SOAP/ HTTP. The same applies to connectivity and integration between DataPower and Message Broker endpoints.
Note: For production systems you might want to set the port numbers for each execution group using the mqsichangeproperties command. For example:
mqsichangeproperties broker_name -e execution_group -o HTTPConnector -n explicitlySetPortNumber -v port_number (for HTTP)
For full details of the mqsichangeproperties command, see the WebSphere Message Broker Information Center at the following Web page:
http://publib.boulder.ibm.com/infocenter/wmbhelp/v7r0m0/index.jsp
Server Queue Manager Queue Name
SAW001-SYS3 SAW001QMGR1 SAW001_EXPORT_EMPLOYEE
SAW001-SYS3 SAW001QMGR2 SAW001_EXPORT_EMPLOYEE
SAW001-SYS4 SAW001QMGR3 SAW001_EXPORT_EMPLOYEE
SAW001-SYS4 SAW001QMGR4 SAW001_EXPORT_EMPLOYEE
Chapter 7. High availability through redundancy 163
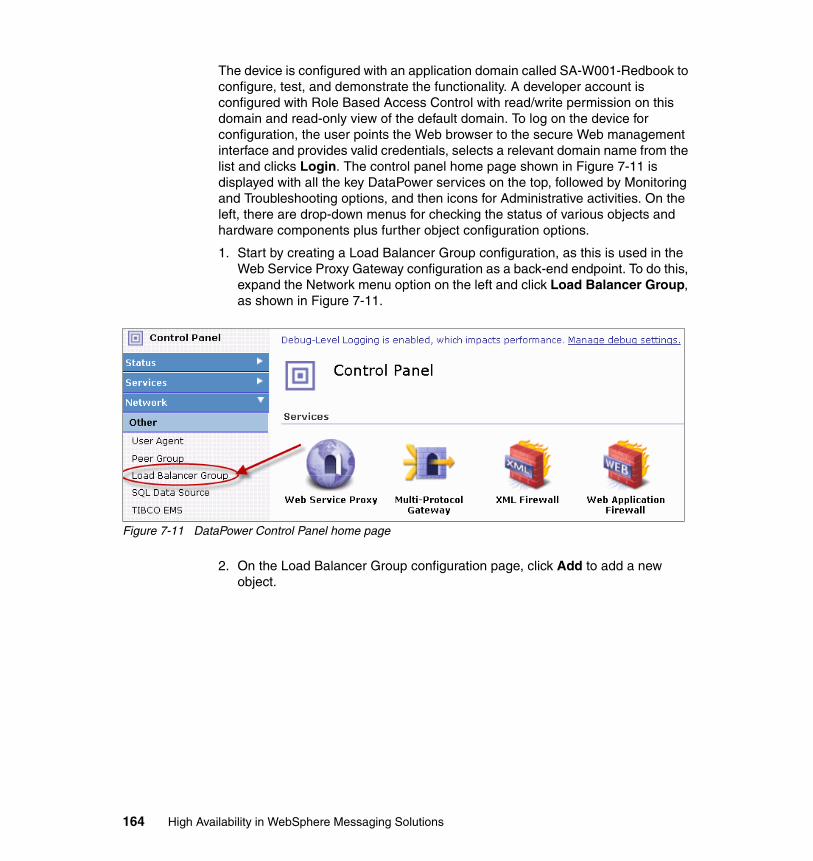
The device is configured with an application domain called SA-W001-Redbook to configure, test, and demonstrate the functionality. A developer account is configured with Role Based Access Control with read/write permission on this domain and read-only view of the default domain. To log on the device for configuration, the user points the Web browser to the secure Web management interface and provides valid credentials, selects a relevant domain name from the list and clicks Login. The control panel home page shown in Figure 7-11 is displayed with all the key DataPower services on the top, followed by Monitoring and Troubleshooting options, and then icons for Administrative activities. On the left, there are drop-down menus for checking the status of various objects and hardware components plus further object configuration options.
1. Start by creating a Load Balancer Group configuration, as this is used in the Web Service Proxy Gateway configuration as a back-end endpoint. To do this, expand the Network menu option on the left and click Load Balancer Group, as shown in Figure 7-11.
Figure 7-11 DataPower Control Panel home page
2. On the Load Balancer Group configuration page, click Add to add a new object.
164 High Availability in WebSphere Messaging Solutions

3. Figure 7-12 shows the configuration options available. Specify the object name, algorithm for load balancing, damp time, and so forth. Damp time specifies the time in seconds for which a member server can be disabled or black-listed if a health check fails.
Figure 7-12 Load Balancer Group object configuration
Chapter 7. High availability through redundancy 165

4. Click the Health tab to configure the configurable health check options, as shown in Figure 7-13.
Figure 7-13 Load Balancer Group: Health check configuration
These configuration settings allow users to specify the SOAP request, frequency, and timeout settings while checking for the health of the configured members. The response received for this call can be parsed and analyzed by providing a custom XSL stylesheet.
166 High Availability in WebSphere Messaging Solutions
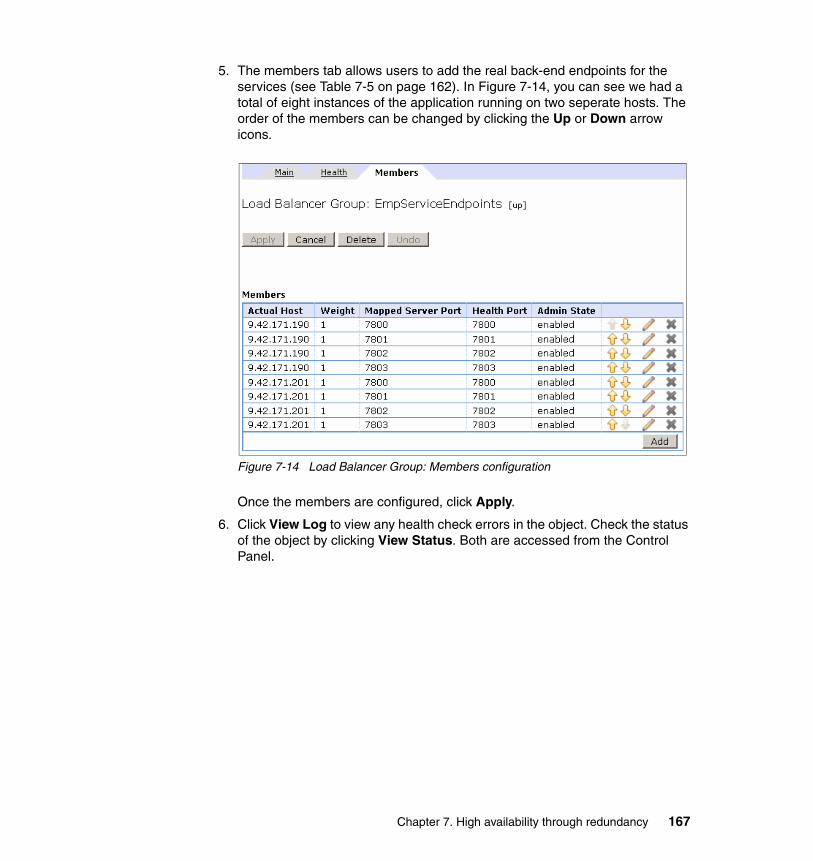
5. The members tab allows users to add the real back-end endpoints for the services (see Table 7-5 on page 162). In Figure 7-14, you can see we had a total of eight instances of the application running on two seperate hosts. The order of the members can be changed by clicking the Up or Down arrow icons.
Figure 7-14 Load Balancer Group: Members configuration
Once the members are configured, click Apply.
6. Click View Log to view any health check errors in the object. Check the status of the object by clicking View Status. Both are accessed from the Control Panel.
Chapter 7. High availability through redundancy 167
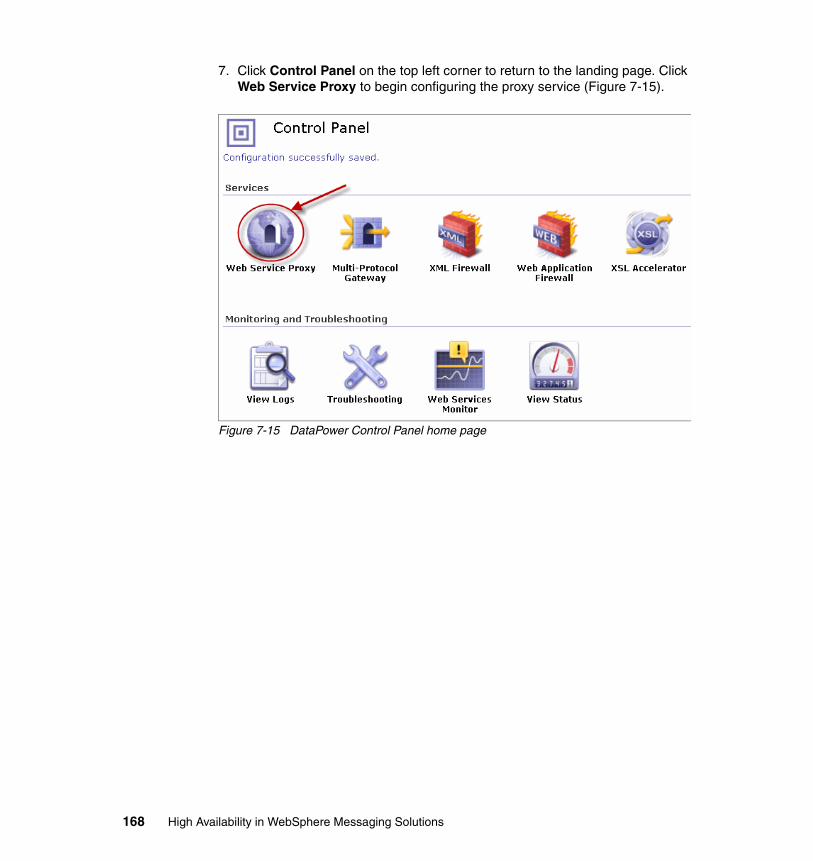
7. Click Control Panel on the top left corner to return to the landing page. Click Web Service Proxy to begin configuring the proxy service (Figure 7-15).
Figure 7-15 DataPower Control Panel home page
168 High Availability in WebSphere Messaging Solutions
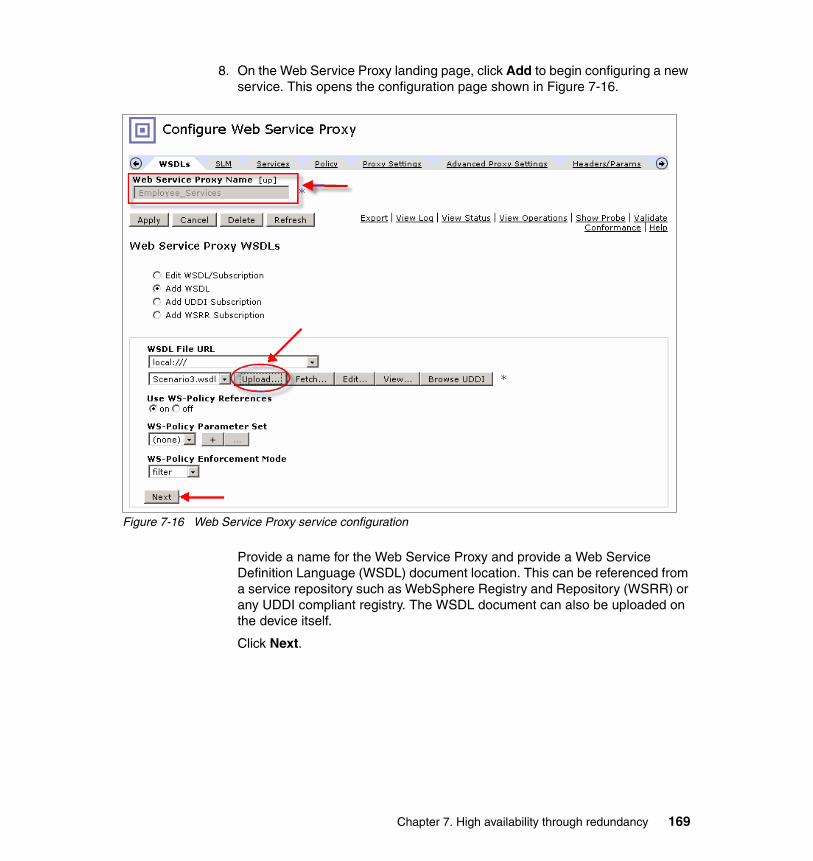
8. On the Web Service Proxy landing page, click Add to begin configuring a new service. This opens the configuration page shown in Figure 7-16.
Figure 7-16 Web Service Proxy service configuration
Provide a name for the Web Service Proxy and provide a Web Service Definition Language (WSDL) document location. This can be referenced from a service repository such as WebSphere Registry and Repository (WSRR) or any UDDI compliant registry. The WSDL document can also be uploaded on the device itself.
Click Next.
Chapter 7. High availability through redundancy 169
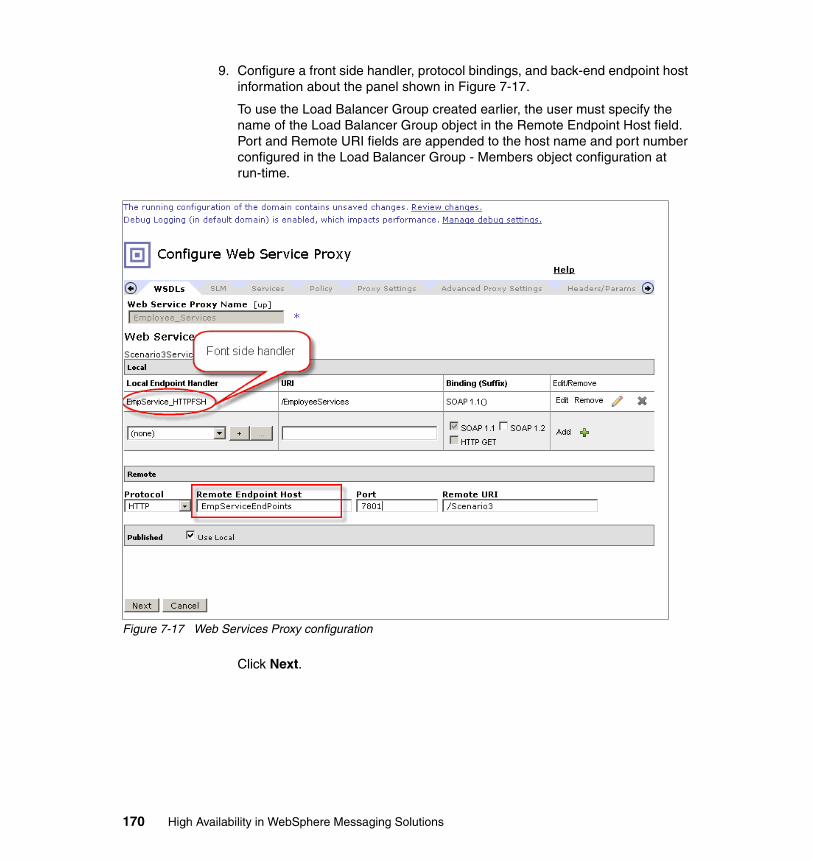
9. Configure a front side handler, protocol bindings, and back-end endpoint host information about the panel shown in Figure 7-17.
To use the Load Balancer Group created earlier, the user must specify the name of the Load Balancer Group object in the Remote Endpoint Host field. Port and Remote URI fields are appended to the host name and port number configured in the Load Balancer Group - Members object configuration at run-time.
Figure 7-17 Web Services Proxy configuration
Click Next.
170 High Availability in WebSphere Messaging Solutions
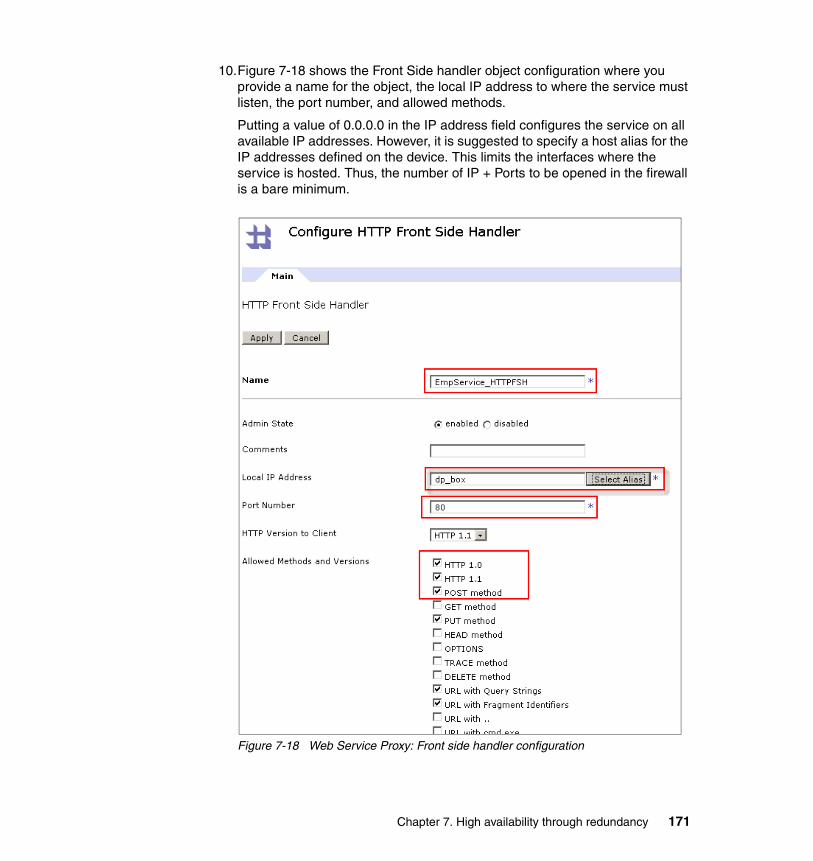
10.Figure 7-18 shows the Front Side handler object configuration where you provide a name for the object, the local IP address to where the service must listen, the port number, and allowed methods.
Putting a value of 0.0.0.0 in the IP address field configures the service on all available IP addresses. However, it is suggested to specify a host alias for the IP addresses defined on the device. This limits the interfaces where the service is hosted. Thus, the number of IP + Ports to be opened in the firewall is a bare minimum.
Figure 7-18 Web Service Proxy: Front side handler configuration
Chapter 7. High availability through redundancy 171
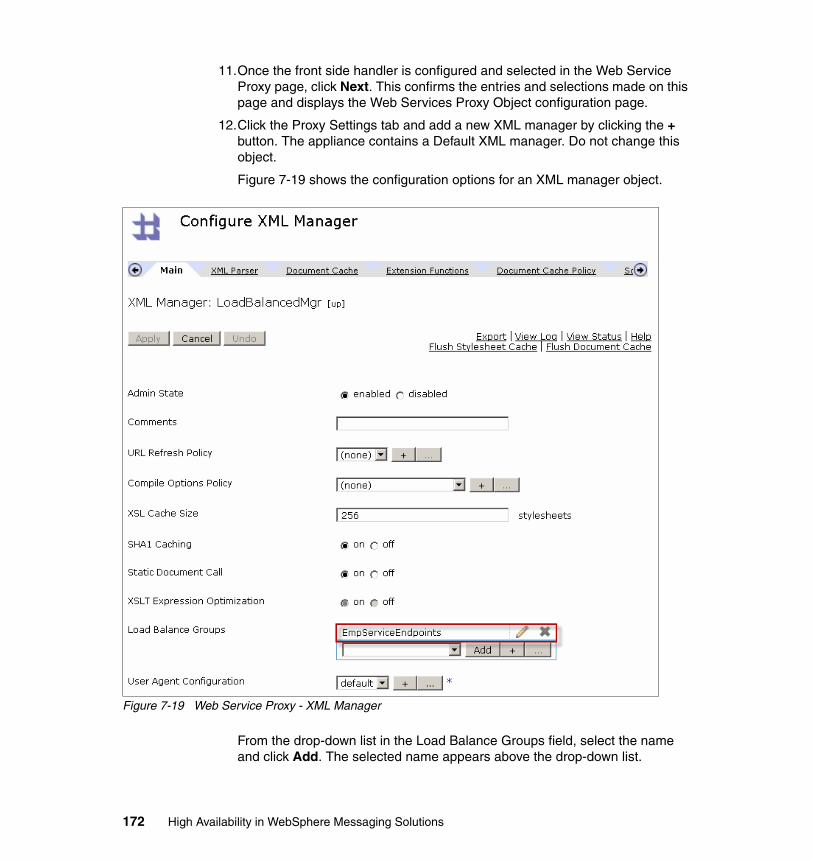
11.Once the front side handler is configured and selected in the Web Service Proxy page, click Next. This confirms the entries and selections made on this page and displays the Web Services Proxy Object configuration page.
12.Click the Proxy Settings tab and add a new XML manager by clicking the + button. The appliance contains a Default XML manager. Do not change this object.
Figure 7-19 shows the configuration options for an XML manager object.
Figure 7-19 Web Service Proxy - XML Manager
From the drop-down list in the Load Balance Groups field, select the name and click Add. The selected name appears above the drop-down list.
172 High Availability in WebSphere Messaging Solutions
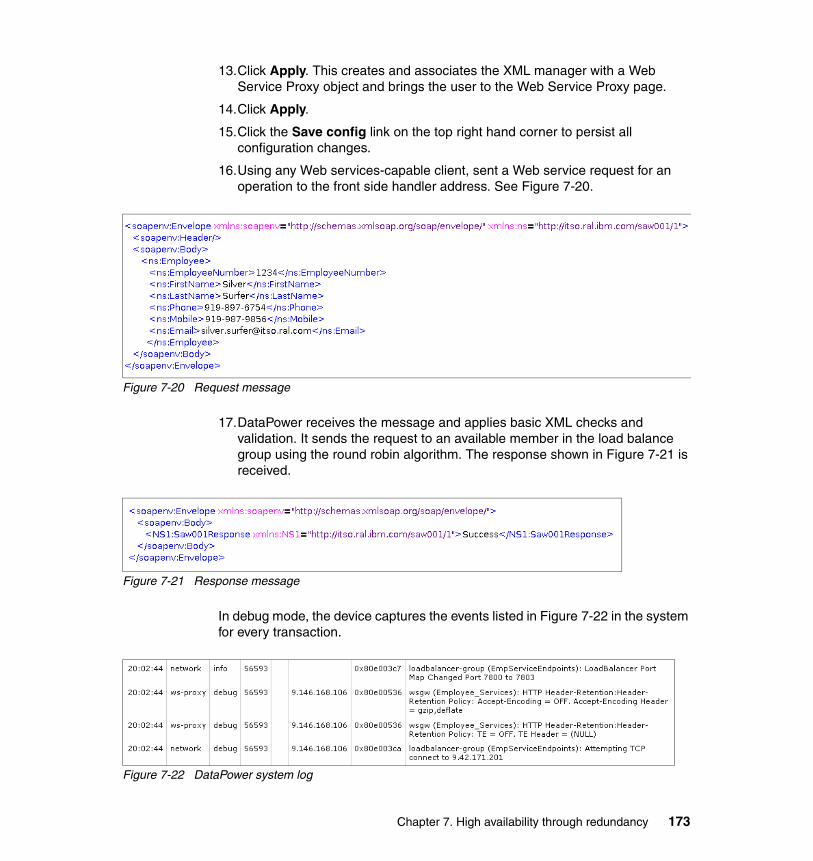
13.Click Apply. This creates and associates the XML manager with a Web Service Proxy object and brings the user to the Web Service Proxy page.
14.Click Apply.
15.Click the Save config link on the top right hand corner to persist all configuration changes.
16.Using any Web services-capable client, sent a Web service request for an operation to the front side handler address. See Figure 7-20.
Figure 7-20 Request message
17.DataPower receives the message and applies basic XML checks and validation. It sends the request to an available member in the load balance group using the round robin algorithm. The response shown in Figure 7-21 is received.
Figure 7-21 Response message
In debug mode, the device captures the events listed in Figure 7-22 in the system for every transaction.
Figure 7-22 DataPower system log
Chapter 7. High availability through redundancy 173
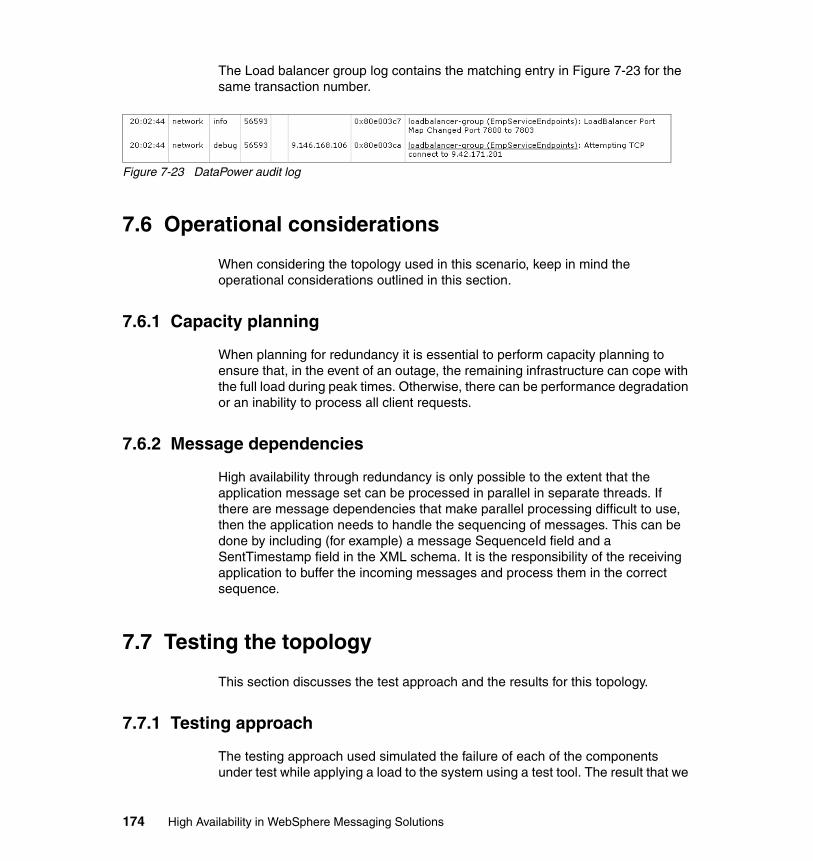
The Load balancer group log contains the matching entry in Figure 7-23 for the same transaction number.
Figure 7-23 DataPower audit log
7.6 Operational considerations
When considering the topology used in this scenario, keep in mind the operational considerations outlined in this section.
7.6.1 Capacity planning
When planning for redundancy it is essential to perform capacity planning to ensure that, in the event of an outage, the remaining infrastructure can cope with the full load during peak times. Otherwise, there can be performance degradation or an inability to process all client requests.
7.6.2 Message dependencies
High availability through redundancy is only possible to the extent that the application message set can be processed in parallel in separate threads. If there are message dependencies that make parallel processing difficult to use, then the application needs to handle the sequencing of messages. This can be done by including (for example) a message SequenceId field and a SentTimestamp field in the XML schema. It is the responsibility of the receiving application to buffer the incoming messages and process them in the correct sequence.
7.7 Testing the topology
This section discusses the test approach and the results for this topology.
7.7.1 Testing approach
The testing approach used simulated the failure of each of the components under test while applying a load to the system using a test tool. The result that we
174 High Availability in WebSphere Messaging Solutions

expect for each of the tests is that during the component outage, all new messages continue to be processed. It is possible that the component outage causes the in-flight request to be lost, but all new messages are processed.
The components under test are as follows:
� Single execution group� Individual broker� WebSphere Message Broker server� DataPower appliance
WebSphere Message Broker Explorer was used to start and stop brokers and execution groups and to view the queue depths.
7.7.2 Test cases and results
This section shows each test case and the results.
Test case 1: Outage of individual execution groupsTable 7-7 describes the test case for the loss of an execution group.
Table 7-7 Test case 1
Note: We are not performing performance testing to show that there is no impact to the message through-put rate. This is a consideration for production systems and it is essential to ensure that the redundant components can function at peak load without significant impact on performance.
Component WebSphere Message Broker Execution Group
Test Case Outage of individual execution groups
Description In this test case we verify that an outage of one or more individual execution groups has no impact on availability. We expect that DataPower detects that the execution groups are down or not responding and blacklists the endpoints corresponding to these execution groups during the outage period. Route all new messages to the available execution groups during the outage.
Chapter 7. High availability through redundancy 175
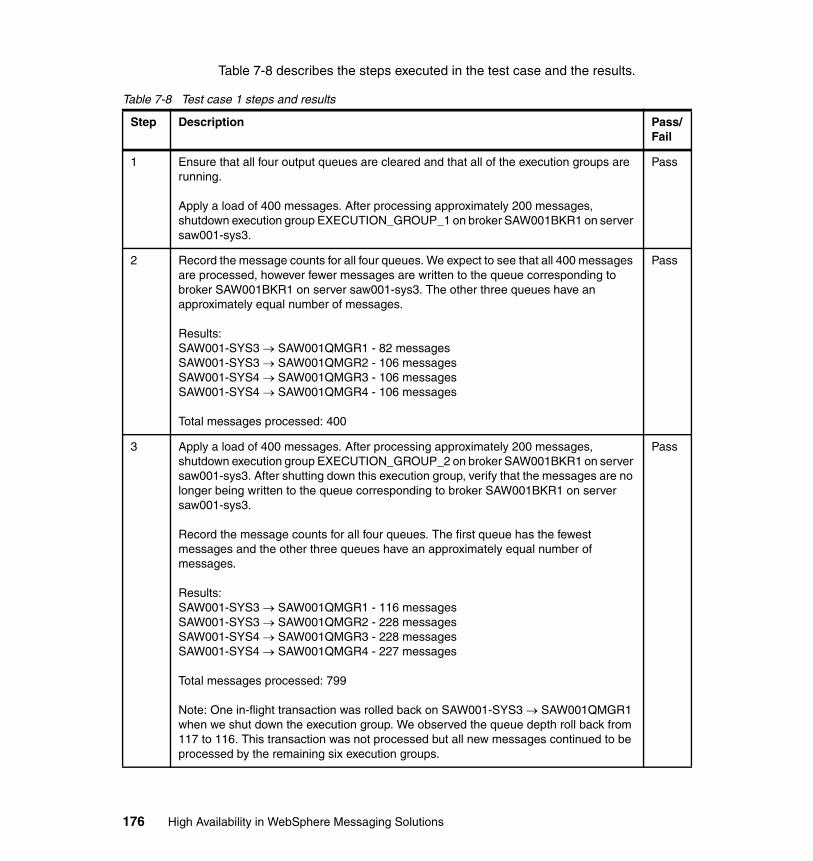
Table 7-8 describes the steps executed in the test case and the results.
Table 7-8 Test case 1 steps and results
Step Description Pass/Fail
1 Ensure that all four output queues are cleared and that all of the execution groups are running.
Apply a load of 400 messages. After processing approximately 200 messages, shutdown execution group EXECUTION_GROUP_1 on broker SAW001BKR1 on server saw001-sys3.
Pass
2 Record the message counts for all four queues. We expect to see that all 400 messages are processed, however fewer messages are written to the queue corresponding to broker SAW001BKR1 on server saw001-sys3. The other three queues have an approximately equal number of messages.
Results: SAW001-SYS3 SAW001QMGR1 - 82 messagesSAW001-SYS3 SAW001QMGR2 - 106 messagesSAW001-SYS4 SAW001QMGR3 - 106 messagesSAW001-SYS4 SAW001QMGR4 - 106 messages
Total messages processed: 400
Pass
3 Apply a load of 400 messages. After processing approximately 200 messages, shutdown execution group EXECUTION_GROUP_2 on broker SAW001BKR1 on server saw001-sys3. After shutting down this execution group, verify that the messages are no longer being written to the queue corresponding to broker SAW001BKR1 on server saw001-sys3.
Record the message counts for all four queues. The first queue has the fewest messages and the other three queues have an approximately equal number of messages.
Results: SAW001-SYS3 SAW001QMGR1 - 116 messagesSAW001-SYS3 SAW001QMGR2 - 228 messagesSAW001-SYS4 SAW001QMGR3 - 228 messagesSAW001-SYS4 SAW001QMGR4 - 227 messages
Total messages processed: 799
Note: One in-flight transaction was rolled back on SAW001-SYS3 SAW001QMGR1 when we shut down the execution group. We observed the queue depth roll back from 117 to 116. This transaction was not processed but all new messages continued to be processed by the remaining six execution groups.
Pass
176 High Availability in WebSphere Messaging Solutions
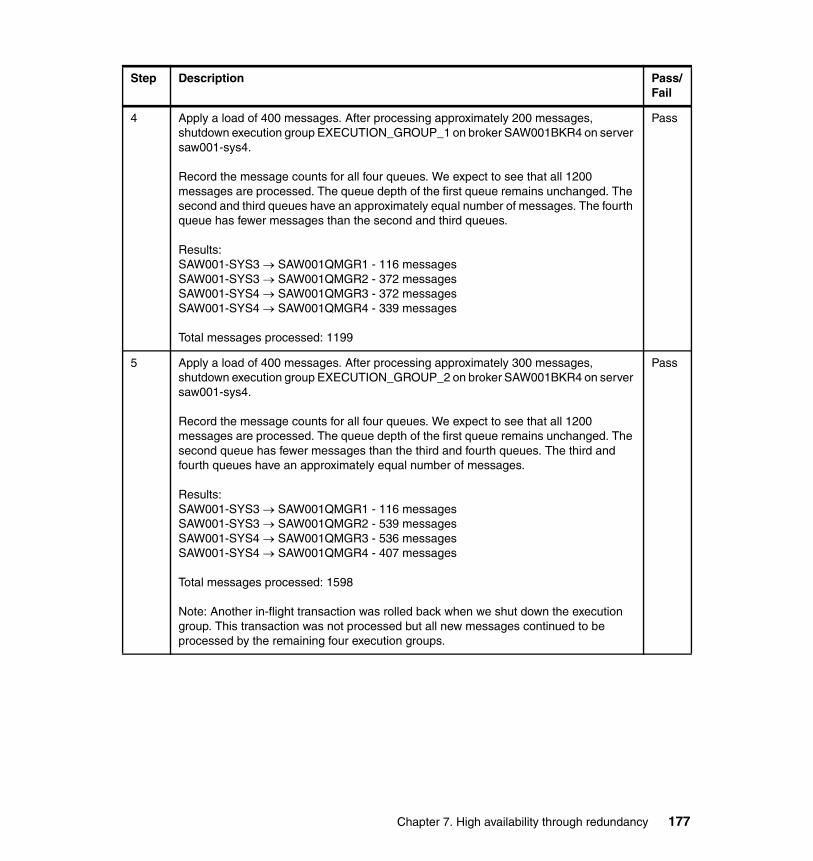
4 Apply a load of 400 messages. After processing approximately 200 messages, shutdown execution group EXECUTION_GROUP_1 on broker SAW001BKR4 on server saw001-sys4.
Record the message counts for all four queues. We expect to see that all 1200 messages are processed. The queue depth of the first queue remains unchanged. The second and third queues have an approximately equal number of messages. The fourth queue has fewer messages than the second and third queues.
Results: SAW001-SYS3 SAW001QMGR1 - 116 messagesSAW001-SYS3 SAW001QMGR2 - 372 messagesSAW001-SYS4 SAW001QMGR3 - 372 messagesSAW001-SYS4 SAW001QMGR4 - 339 messages
Total messages processed: 1199
Pass
5 Apply a load of 400 messages. After processing approximately 300 messages, shutdown execution group EXECUTION_GROUP_2 on broker SAW001BKR4 on server saw001-sys4.
Record the message counts for all four queues. We expect to see that all 1200 messages are processed. The queue depth of the first queue remains unchanged. The second queue has fewer messages than the third and fourth queues. The third and fourth queues have an approximately equal number of messages.
Results: SAW001-SYS3 SAW001QMGR1 - 116 messagesSAW001-SYS3 SAW001QMGR2 - 539 messagesSAW001-SYS4 SAW001QMGR3 - 536 messagesSAW001-SYS4 SAW001QMGR4 - 407 messages
Total messages processed: 1598
Note: Another in-flight transaction was rolled back when we shut down the execution group. This transaction was not processed but all new messages continued to be processed by the remaining four execution groups.
Pass
Step Description Pass/Fail
Chapter 7. High availability through redundancy 177
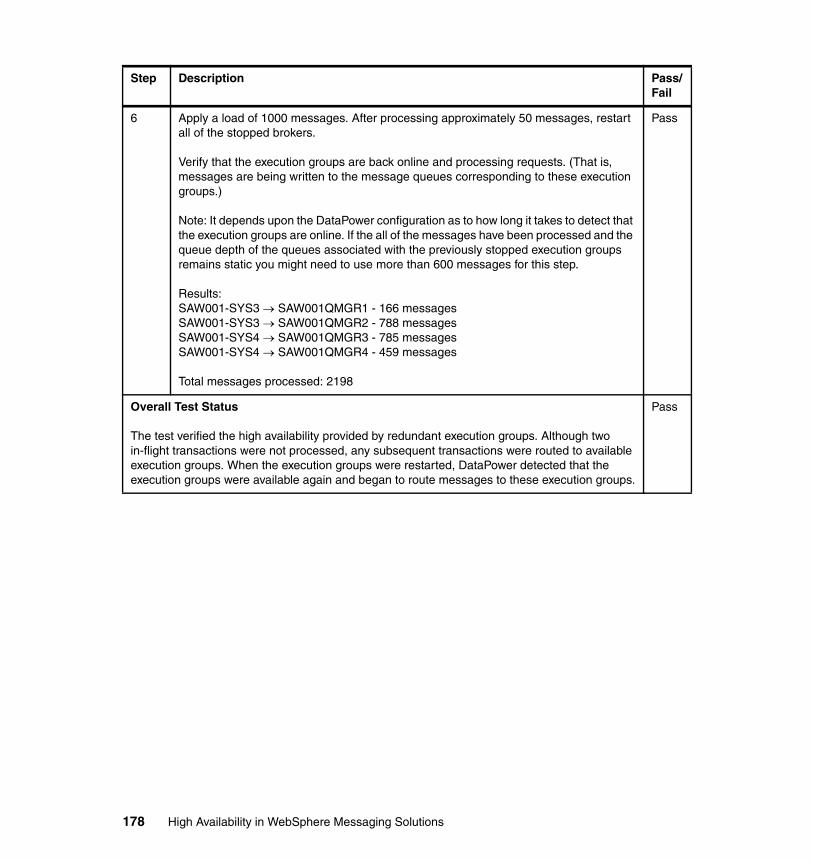
6 Apply a load of 1000 messages. After processing approximately 50 messages, restart all of the stopped brokers.
Verify that the execution groups are back online and processing requests. (That is, messages are being written to the message queues corresponding to these execution groups.)
Note: It depends upon the DataPower configuration as to how long it takes to detect that the execution groups are online. If the all of the messages have been processed and the queue depth of the queues associated with the previously stopped execution groups remains static you might need to use more than 600 messages for this step.
Results: SAW001-SYS3 SAW001QMGR1 - 166 messagesSAW001-SYS3 SAW001QMGR2 - 788 messagesSAW001-SYS4 SAW001QMGR3 - 785 messagesSAW001-SYS4 SAW001QMGR4 - 459 messages
Total messages processed: 2198
Pass
Overall Test Status
The test verified the high availability provided by redundant execution groups. Although two in-flight transactions were not processed, any subsequent transactions were routed to available execution groups. When the execution groups were restarted, DataPower detected that the execution groups were available again and began to route messages to these execution groups.
Pass
Step Description Pass/Fail
178 High Availability in WebSphere Messaging Solutions

Test case 2: Outage of a brokerTable 7-9 describes the test case for the loss of a broker.
Table 7-9 Test case 2
Table 7-10 describes the steps executed in the test case and the results.
Table 7-10 Test case 2 steps and results
Component WebSphere Message Broker broker
Test Case Outage of a WebSphere Message Broker brokers
Description In our test scenario we have four WebSphere Message Broker brokers. In this test case we verify that an outage of two of these brokers has no impact on availability. We expect that DataPower detects that the broker is down or not responding and blacklists the endpoints corresponding to the brokers that are down during the outage period, and that all new messages are routed to the available endpoints during the outage.
Step Description Pass/Fail
1 Make sure that all four output queues are cleared and that all of the brokers/execution groups are running. Apply a load of 200 messages. After processing approximately 100 messages, cleanly shutdown broker SAW001BKR2 on server saw001-sys3.
Verify that the messages are no longer being written to the queue corresponding to broker SAW001BKR2.
Results:SAW001-SYS3 SAW001QMGR1 - 57 messagesSAW001-SYS3 SAW001QMGR2 - 28 messagesSAW001-SYS4 SAW001QMGR3 - 57 messagesSAW001-SYS4 SAW001QMGR4 - 58 messages
Total messages processed: 200
Pass
Chapter 7. High availability through redundancy 179

2 Apply a load of 200 messages. After processing approximately 100 messages, perform an immediate shutdown of broker SAW001BKR3 on server saw001-sys4.
Verify that the messages are no longer being written to the queue corresponding to broker SAW001BKR3.
Results:SAW001-SYS3 SAW001QMGR1 - 137 messagesSAW001-SYS3 SAW001QMGR2 - 28 messagesSAW001-SYS4 SAW001QMGR3 - 97 messagesSAW001-SYS4 SAW001QMGR4 - 138 messages
Total messages processed: 400
Pass
3 Apply a load of 1000 messages. After processing approximately 100 messages, re-tart the stopped brokers.
Verify that the brokers are back online and processing requests. (That is, messages are being written to the message queue corresponding to these brokers.)
Note: It depends upon the DataPower configuration as to how long it takes to detect the execution groups are back online. If the all of the messages have been processed and the queue depth of the queues associated with the previously stopped execution groups remains static you might need to use more than 600 messages for this step.
Results:SAW001-SYS3 SAW001QMGR1 - 486 messagesSAW001-SYS3 SAW001QMGR2 - 180 messagesSAW001-SYS4 SAW001QMGR3 - 248 messagesSAW001-SYS4 SAW001QMGR4 - 486 messages
Total messages processed: 1400
Pass
Overall Test Status
The test verified the high availability provided by redundant brokers. As the two brokers were shutdown DataPower routed all new messages to the remaining online brokers. When the brokers were restarted, DataPower detected that the brokers were available again and began to route messages to these execution groups. There was a delay in which approximately 500 messages were processed before DataPower detected that the brokers had been restarted and automatically began to route messages to these brokers again. No in-flight messages were lost during the test and all 1400 messages were processed.
Pass
Step Description Pass/Fail
180 High Availability in WebSphere Messaging Solutions
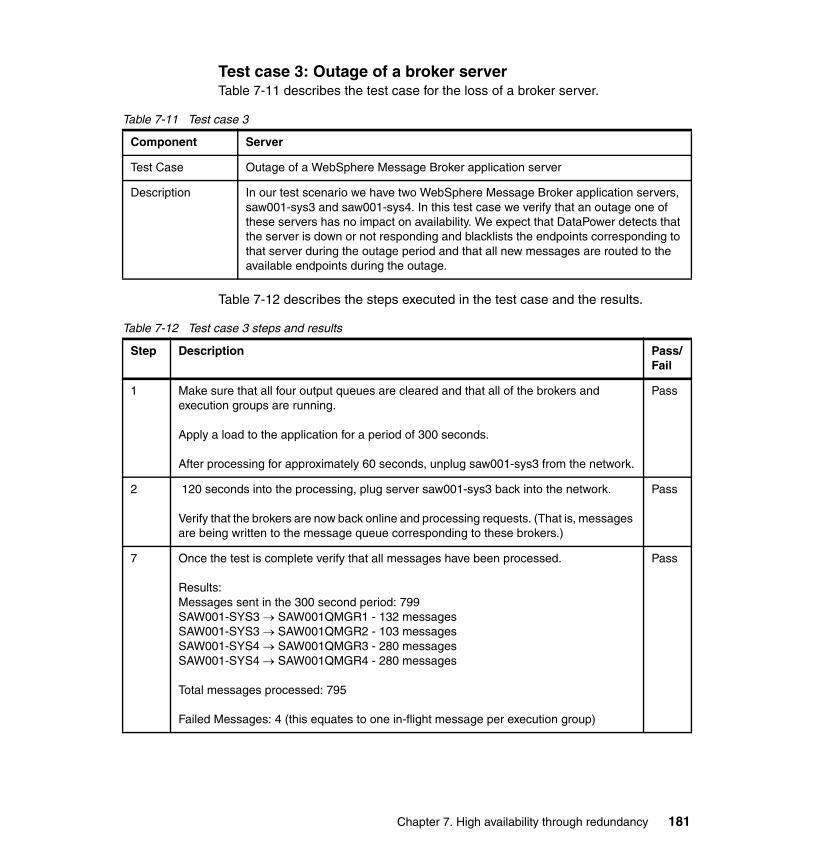
Test case 3: Outage of a broker serverTable 7-11 describes the test case for the loss of a broker server.
Table 7-11 Test case 3
Table 7-12 describes the steps executed in the test case and the results.
Table 7-12 Test case 3 steps and results
Component Server
Test Case Outage of a WebSphere Message Broker application server
Description In our test scenario we have two WebSphere Message Broker application servers, saw001-sys3 and saw001-sys4. In this test case we verify that an outage one of these servers has no impact on availability. We expect that DataPower detects that the server is down or not responding and blacklists the endpoints corresponding to that server during the outage period and that all new messages are routed to the available endpoints during the outage.
Step Description Pass/Fail
1 Make sure that all four output queues are cleared and that all of the brokers and execution groups are running.
Apply a load to the application for a period of 300 seconds.
After processing for approximately 60 seconds, unplug saw001-sys3 from the network.
Pass
2 120 seconds into the processing, plug server saw001-sys3 back into the network.
Verify that the brokers are now back online and processing requests. (That is, messages are being written to the message queue corresponding to these brokers.)
Pass
7 Once the test is complete verify that all messages have been processed.
Results:Messages sent in the 300 second period: 799SAW001-SYS3 SAW001QMGR1 - 132 messagesSAW001-SYS3 SAW001QMGR2 - 103 messagesSAW001-SYS4 SAW001QMGR3 - 280 messagesSAW001-SYS4 SAW001QMGR4 - 280 messages
Total messages processed: 795
Failed Messages: 4 (this equates to one in-flight message per execution group)
Pass
Chapter 7. High availability through redundancy 181
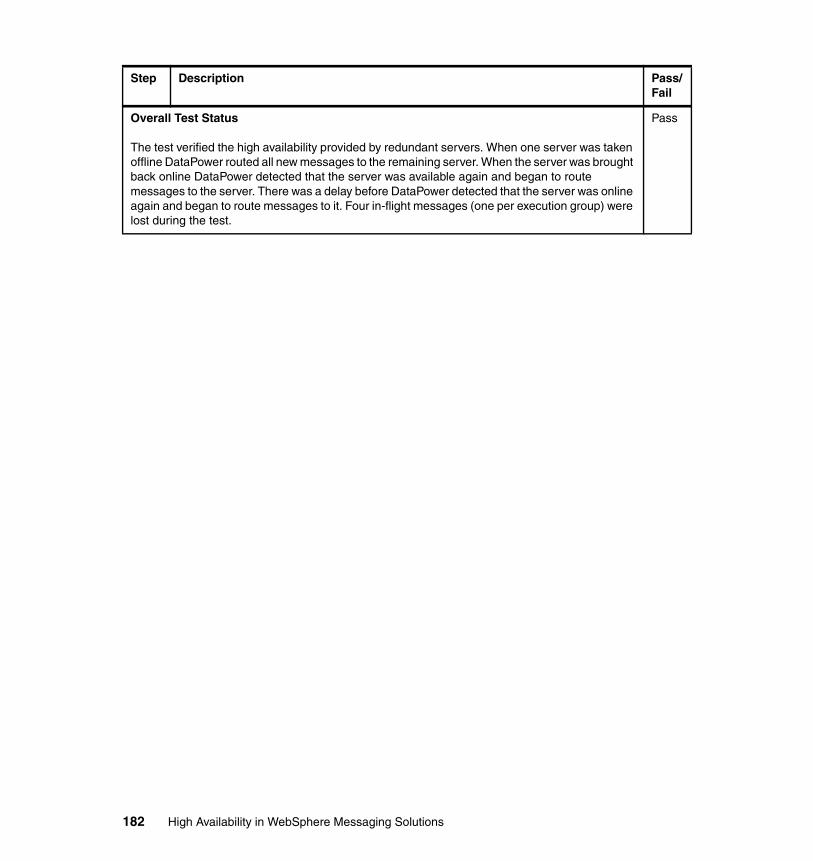
Overall Test Status
The test verified the high availability provided by redundant servers. When one server was taken offline DataPower routed all new messages to the remaining server. When the server was brought back online DataPower detected that the server was available again and began to route messages to the server. There was a delay before DataPower detected that the server was online again and began to route messages to it. Four in-flight messages (one per execution group) were lost during the test.
Pass
Step Description Pass/Fail
182 High Availability in WebSphere Messaging Solutions
Chapter 8. Duplexing WebSphere MQ structures
WebSphere MQ on z/OS provides a greater degree of availability for messages than any other platform through the implementation of queue sharing groups (QSGs). QSGs make use of the z/OS Coupling Facility (CF), which is a hardware and software tool unique to z/OS providing and managing shared resources to any z/OS system defined in the Parallel Sysplex. A Sysplex is a logical and physical group of z/OS images or LPARs that are connected to the CF using special links.
The availability advantages provided by shared queues has been well documented, in particular in IBM Redbooks publication Parallel Sysplex Application Considerations, SG24-6523 and IBM Redpaper™ High Availability z/OS Solutions for WebSphere Business Integration Message Broker V5, REDP-3894.
There have been a number of improvements to shared queues, including removing the message size limitation (63 K had been the limit) that prevented applications from taking advantage of the capability. As of WebSphere MQ V6, shared queues can hold message up to 100 Mb, like any other WebSphere MQ queue. In addition, there have been improvements made to the coupling facility code and the underlying hardware that have enhanced the use of shared queues.
8
© Copyright IBM Corp. 2010. All rights reserved. 183

It is not the intention of this Redbooks publication to re-invent the material from prior IBM Redbooks publications, but to extend the available information with additional examples.
This chapter presents a scenario that illustrates the use of queue sharing groups and duplexed structures in a z/OS environment to achieve high availability.
184 High Availability in WebSphere Messaging Solutions
8.1 Scenario overview
The coupling facility supports three types of structures:
� Cache� Lock � List
MQ shared queues are implemented on list structures, and require a minimum of two structures, although most environments have more. The first list structure is the required administration structure. It has a fixed name xxxxCSQ_ADMIN, where the xxxx is the queue-sharing group name. This structure holds information about the QSG and its members. With WebSphere MQ V7.0.1, a second structure, that we think of as administrative, has been added to support group units of recovery. It is optional, and has a fixed name of xxxxCSQSYSAPPL.
The application structure or structures are where the queues are defined. In most environments there are at least two application list structures, and often there are more to support varying application needs. The application structures are much like the pagesets and buffer pools used for private queues, in that they supply the storage for the messages.
There are many reasons to define multiple application structures:
� Historical reasons
� Application requirements (for example only this application needs large message support)
� Application isolation requirements
This scenario demonstrates the message availability provided by system-managed duplexing WebSphere MQ structures. The coupling facility, especially when configured externally to the application LPARs and with a separate power supply, is extremely robust. If a failure occurs, the WebSphere MQ structures, and the persistent messages, are recovered from the WebSphere MQ logs.
Recovering an application structure from the logs is much like recovering persistent messages after a queue manager outage. The logs are read from the last point of consistency and persistent messages are restored to the queues from those logs. Unlike a single queue manager recovery operation, when an application structure is recovered, the logs from each queue manager in the QSG might need to be read to recover the persistent messages. The length of time it takes to recover a structure varies based on how long it has been since a point of consistency, usually from where the BACKUP CFSTRUCT command
Chapter 8. Duplexing WebSphere MQ structures 185

was issued and completed. The number of log files and records that have to be read is also a factor.
For applications with strict service level agreements, the potential of even a slight delay while a structure is recovered is not acceptable. For those applications, using system-managed duplexing provides a greater level of availability. System-managed duplexing essentially makes two copies of the structure and all updates to the structure so that if one fails, the other image continues to process. In addition, the CF code automatically rebuilds the structure that failed from the good copy as soon as the structure is capable.
All WebSphere MQ structures, including the administration structure, might be duplexed. There can be a mix of duplexed and non-duplexed structures in a QSG. It is often recommended that if the coupling facilities are internal (meaning they are defined on the same physical machines as the application queue managers and workload), the structures be duplexed. This is particularly important for the administration structure and any structures that have queues used by applications with stringent service level agreements and persistent messages.
When using duplexed structures, all changes (like putting a message to a queue) are made to both copies. In the event of a structure failure the working copy is used while the other is being rebuilt. As with any mirrored solution, this causes throughput degradation as there must be a response from both structures before control returns to WebSphere MQ and then to the application. There is a greater CPU, coupling facility storage and CF CPU cost for duplexed requests.
In this scenario, two WebSphere MQ application structures are used.
� PERSISTENT
This is defined as a recoverable structure, meaning that it can hold both persistent and nonpersistent messages. This structure can experience an outage, but no persistent messages are lost.
� DUPLEXED
This is both recoverable and duplexed. This structure should not experience an outage. An outage only happens if both coupling facilities were lost.
The scenario is artificial, as the testing is batch driven and the need for continuous message availability is usually driven by services and real time processing. This method of testing, while artificial, was chosen because it highlights the functional differences between the structure types.
The scenario uses an active-active topology, as shown in Figure 8-1 on page 187.
186 High Availability in WebSphere Messaging Solutions
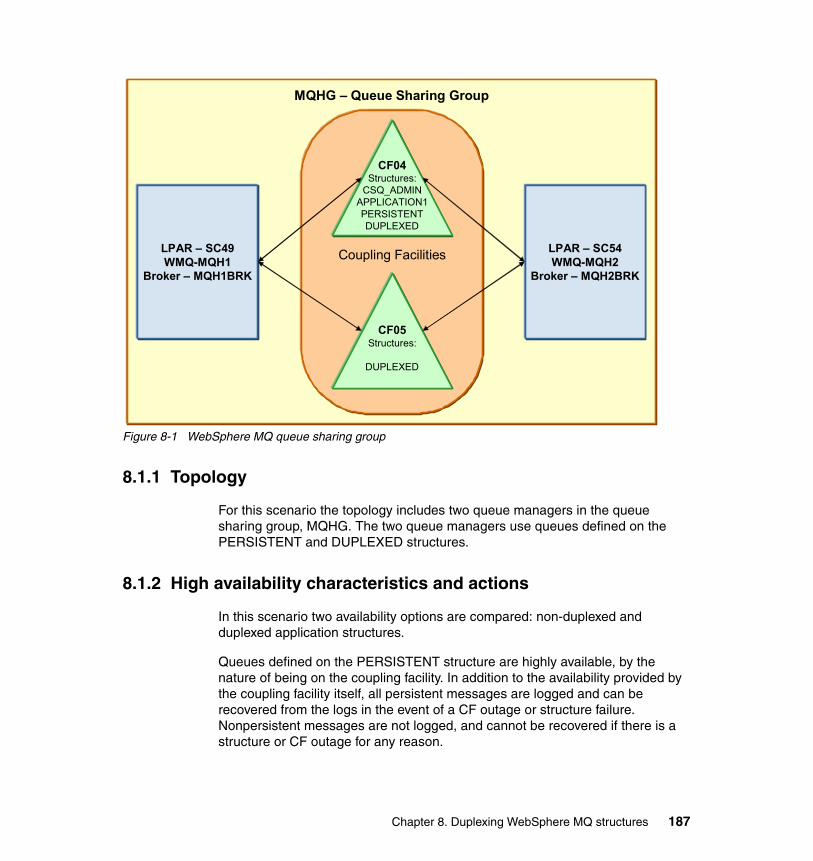
Figure 8-1 WebSphere MQ queue sharing group
8.1.1 Topology
For this scenario the topology includes two queue managers in the queue sharing group, MQHG. The two queue managers use queues defined on the PERSISTENT and DUPLEXED structures.
8.1.2 High availability characteristics and actions
In this scenario two availability options are compared: non-duplexed and duplexed application structures.
Queues defined on the PERSISTENT structure are highly available, by the nature of being on the coupling facility. In addition to the availability provided by the coupling facility itself, all persistent messages are logged and can be recovered from the logs in the event of a CF outage or structure failure. Nonpersistent messages are not logged, and cannot be recovered if there is a structure or CF outage for any reason.
MQHG – Queue Sharing Group
LPAR – SC49WMQ-MQH1
Broker – MQH1BRK
LPAR – SC54WMQ-MQH2
Broker – MQH2BRK
Coupling Facilities
CF04Structures:
CSQ_ADMINAPPLICATION1PERSISTENTDUPLEXED
CF05Structures:
DUPLEXED
Chapter 8. Duplexing WebSphere MQ structures 187

Queues defined on the DUPLEXED structure are considered to be continuously available. The only outage is if both coupling facilities hosting the structure were unavailable at the same time. If one structure or CF experiences an outage, the second copy is used and all messages both persistent and nonpersistent continue to be available. In the event that both CFs experience an outage, all persistent messages can be recovered from the queue manager logs.
8.1.3 Recovery
Recovery for the non-duplexed structure is done with the WebSphere MQ RECOVER CFSTRUCT command. The duplexed structure recovery is handled by the CF itself.
8.2 Coupling facility configuration
The coupling facility structures are normally built by the z/OS system administrator. The samples are those used in the ITSO environment, and were input in the coupling facility resource manager (CFRM) administrative utility called IXCMIAPU. For additional information about the set-up required, see MVS Setting Up a Sysplex, SA22-7625.
The hardware configuration for the WebSphere MQ for z/OS environment is shown in Figure 8-2 on page 189.
188 High Availability in WebSphere Messaging Solutions
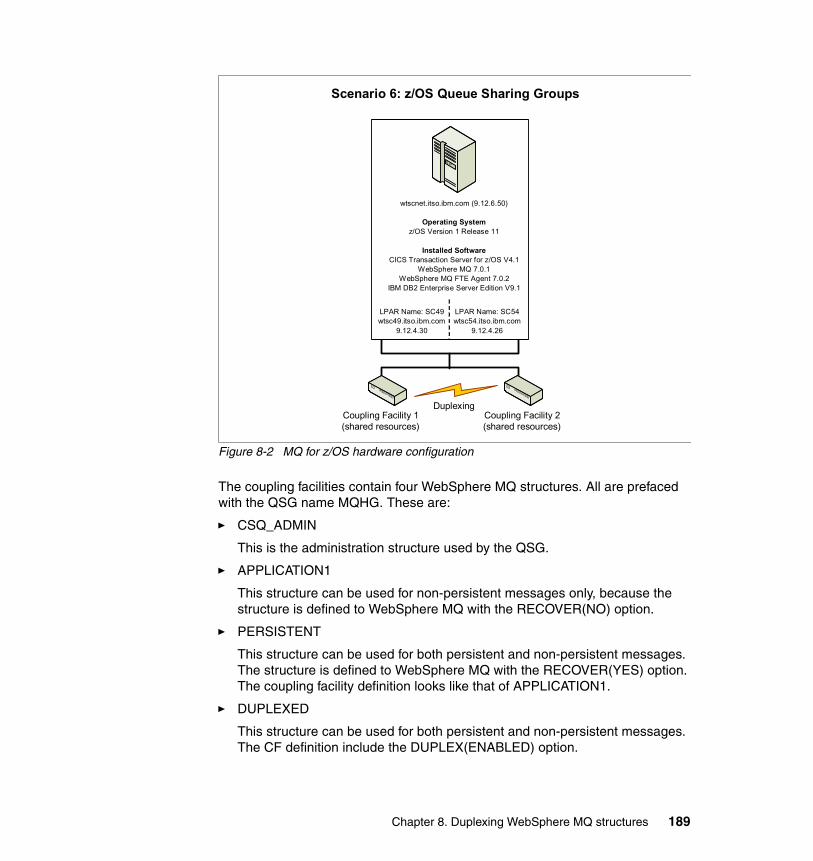
Figure 8-2 MQ for z/OS hardware configuration
The coupling facilities contain four WebSphere MQ structures. All are prefaced with the QSG name MQHG. These are:
� CSQ_ADMIN
This is the administration structure used by the QSG.
� APPLICATION1
This structure can be used for non-persistent messages only, because the structure is defined to WebSphere MQ with the RECOVER(NO) option.
� PERSISTENT
This structure can be used for both persistent and non-persistent messages. The structure is defined to WebSphere MQ with the RECOVER(YES) option. The coupling facility definition looks like that of APPLICATION1.
� DUPLEXED
This structure can be used for both persistent and non-persistent messages. The CF definition include the DUPLEX(ENABLED) option.
wtscnet.itso.ibm.com (9.12.6.50)
Operating Systemz/OS Version 1 Release 11
Installed SoftwareCICS Transaction Server for z/OS V4.1
WebSphere MQ 7.0.1WebSphere MQ FTE Agent 7.0.2
IBM DB2 Enterprise Server Edition V9.1
LPAR Name: SC49wtsc49.itso.ibm.com
9.12.4.30
LPAR Name: SC54wtsc54.itso.ibm.com
9.12.4.26
Coupling Facility 1(shared resources)
DuplexingCoupling Facility 2(shared resources)
Scenario 6: z/OS Queue Sharing Groups
Chapter 8. Duplexing WebSphere MQ structures 189
Example 8-1 shows the MQHG structure definitions used as input to the CFRM utility IXCMIAPU.MQHG structure definitions.
Example 8-1 MQHG structure definitions
/*-----------------------------------------------------*/ /* MQHG STRUCTURES SC49/SC54 */ /*-----------------------------------------------------*/ STRUCTURE NAME(MQHGCSQ_ADMIN) INITSIZE(20480) SIZE(50000) PREFLIST(CF04,CF05) REBUILDPERCENT(5) FULLTHRESHOLD(85) STRUCTURE NAME(MQHGPERSISTENT) INITSIZE(20480) SIZE(50000) PREFLIST(CF04,CF05) REBUILDPERCENT(5) FULLTHRESHOLD(85) STRUCTURE NAME(MQHGDUPLEXED) INITSIZE(20480) SIZE(50000) PREFLIST(CF04,CF05) REBUILDPERCENT(5) FULLTHRESHOLD(85) DUPLEX(ENABLED) STRUCTURE NAME(MQHGAPPLICATION1) INITSIZE(20480) SIZE(50000) PREFLIST(CF04,CF05) REBUILDPERCENT(5) FULLTHRESHOLD(85)
All the structures are defined with a preference list (PREFLIST), showing CF04 and CF05. This list provides flexibility to the system when the structure is defined. For example, if the first structure in the list does not have enough storage, the system tries the next one in the list (the list is not limited to two structures, but our environment is). For our duplexed structure, storage must exist on both CFs at allocation time because a copy of the structure is allocated on each.
190 High Availability in WebSphere Messaging Solutions
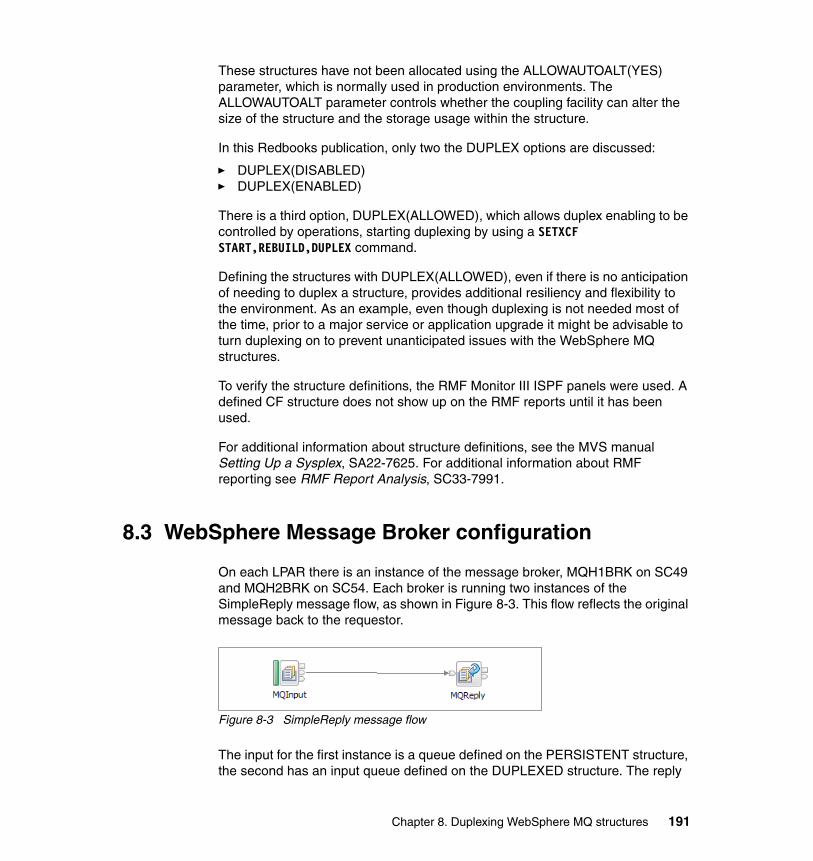
These structures have not been allocated using the ALLOWAUTOALT(YES) parameter, which is normally used in production environments. The ALLOWAUTOALT parameter controls whether the coupling facility can alter the size of the structure and the storage usage within the structure.
In this Redbooks publication, only two the DUPLEX options are discussed:
� DUPLEX(DISABLED) � DUPLEX(ENABLED)
There is a third option, DUPLEX(ALLOWED), which allows duplex enabling to be controlled by operations, starting duplexing by using a SETXCF START,REBUILD,DUPLEX command.
Defining the structures with DUPLEX(ALLOWED), even if there is no anticipation of needing to duplex a structure, provides additional resiliency and flexibility to the environment. As an example, even though duplexing is not needed most of the time, prior to a major service or application upgrade it might be advisable to turn duplexing on to prevent unanticipated issues with the WebSphere MQ structures.
To verify the structure definitions, the RMF Monitor III ISPF panels were used. A defined CF structure does not show up on the RMF reports until it has been used.
For additional information about structure definitions, see the MVS manual Setting Up a Sysplex, SA22-7625. For additional information about RMF reporting see RMF Report Analysis, SC33-7991.
8.3 WebSphere Message Broker configuration
On each LPAR there is an instance of the message broker, MQH1BRK on SC49 and MQH2BRK on SC54. Each broker is running two instances of the SimpleReply message flow, as shown in Figure 8-3. This flow reflects the original message back to the requestor.
Figure 8-3 SimpleReply message flow
The input for the first instance is a queue defined on the PERSISTENT structure, the second has an input queue defined on the DUPLEXED structure. The reply
Chapter 8. Duplexing WebSphere MQ structures 191
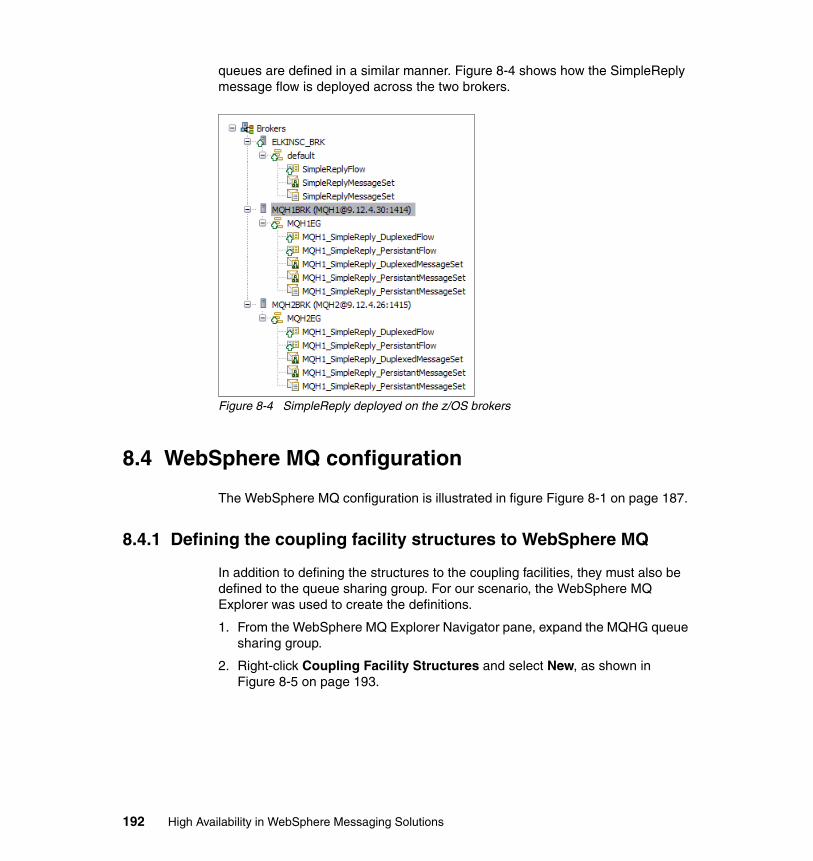
queues are defined in a similar manner. Figure 8-4 shows how the SimpleReply message flow is deployed across the two brokers.
Figure 8-4 SimpleReply deployed on the z/OS brokers
8.4 WebSphere MQ configuration
The WebSphere MQ configuration is illustrated in figure Figure 8-1 on page 187.
8.4.1 Defining the coupling facility structures to WebSphere MQ
In addition to defining the structures to the coupling facilities, they must also be defined to the queue sharing group. For our scenario, the WebSphere MQ Explorer was used to create the definitions.
1. From the WebSphere MQ Explorer Navigator pane, expand the MQHG queue sharing group.
2. Right-click Coupling Facility Structures and select New, as shown in Figure 8-5 on page 193.
192 High Availability in WebSphere Messaging Solutions
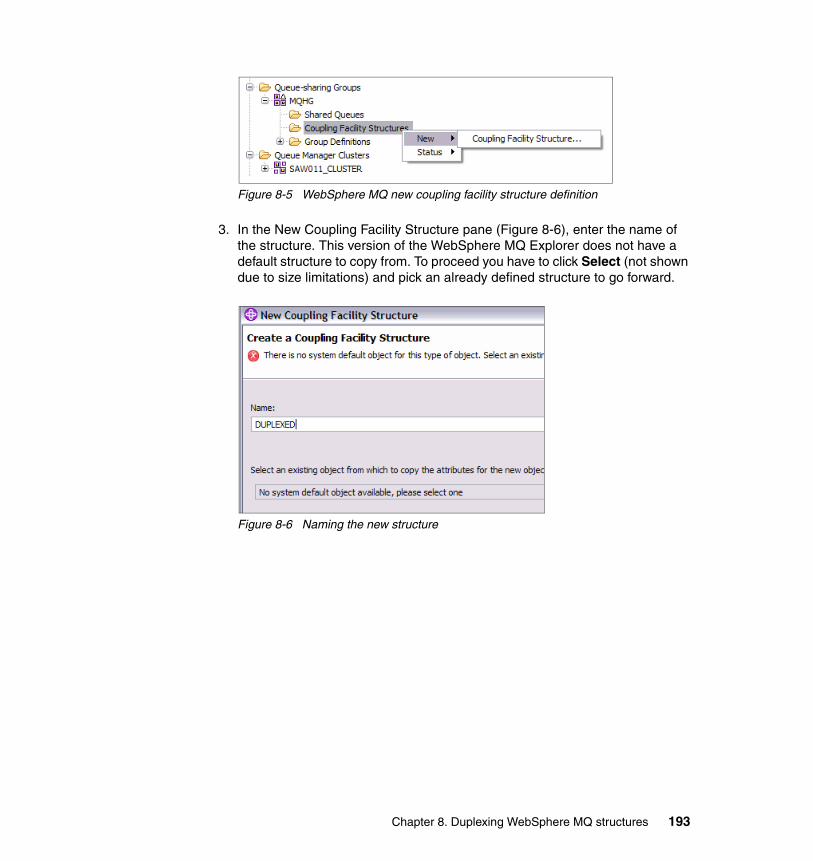
Figure 8-5 WebSphere MQ new coupling facility structure definition
3. In the New Coupling Facility Structure pane (Figure 8-6), enter the name of the structure. This version of the WebSphere MQ Explorer does not have a default structure to copy from. To proceed you have to click Select (not shown due to size limitations) and pick an already defined structure to go forward.
Figure 8-6 Naming the new structure
Chapter 8. Duplexing WebSphere MQ structures 193
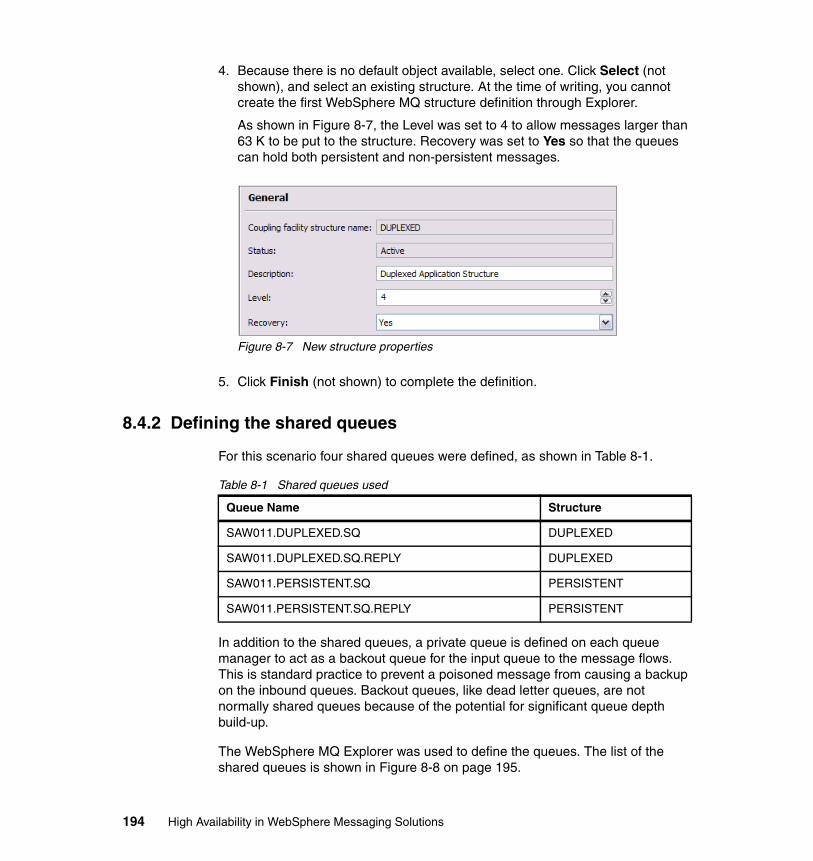
4. Because there is no default object available, select one. Click Select (not shown), and select an existing structure. At the time of writing, you cannot create the first WebSphere MQ structure definition through Explorer.
As shown in Figure 8-7, the Level was set to 4 to allow messages larger than 63 K to be put to the structure. Recovery was set to Yes so that the queues can hold both persistent and non-persistent messages.
Figure 8-7 New structure properties
5. Click Finish (not shown) to complete the definition.
8.4.2 Defining the shared queues
For this scenario four shared queues were defined, as shown in Table 8-1.
Table 8-1 Shared queues used
In addition to the shared queues, a private queue is defined on each queue manager to act as a backout queue for the input queue to the message flows. This is standard practice to prevent a poisoned message from causing a backup on the inbound queues. Backout queues, like dead letter queues, are not normally shared queues because of the potential for significant queue depth build-up.
The WebSphere MQ Explorer was used to define the queues. The list of the shared queues is shown in Figure 8-8 on page 195.
Queue Name Structure
SAW011.DUPLEXED.SQ DUPLEXED
SAW011.DUPLEXED.SQ.REPLY DUPLEXED
SAW011.PERSISTENT.SQ PERSISTENT
SAW011.PERSISTENT.SQ.REPLY PERSISTENT
194 High Availability in WebSphere Messaging Solutions
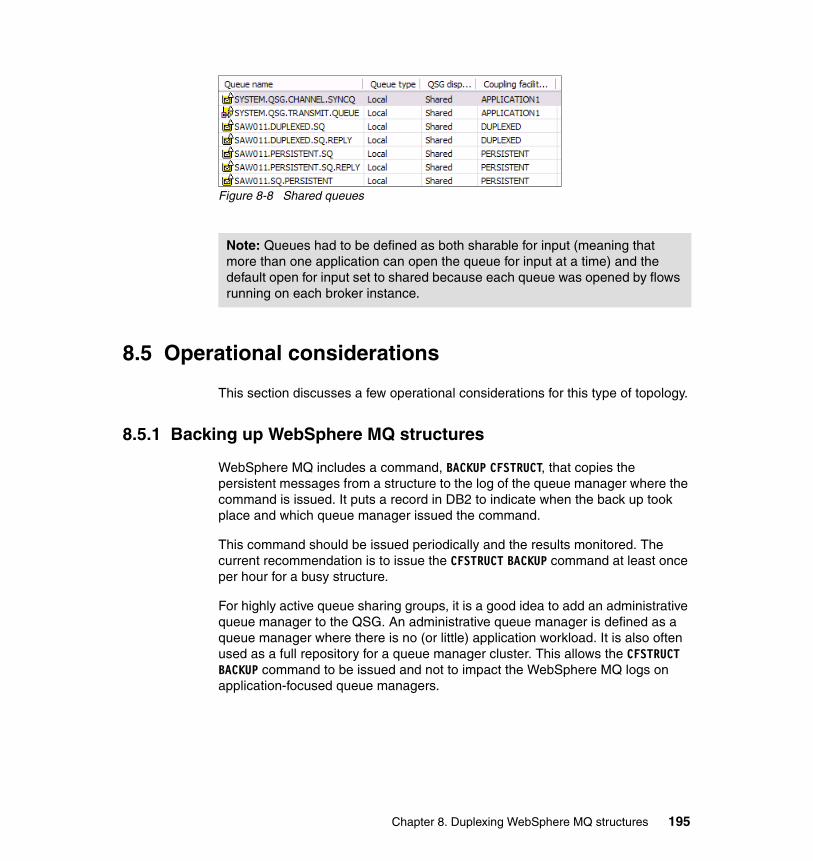
Figure 8-8 Shared queues
8.5 Operational considerations
This section discusses a few operational considerations for this type of topology.
8.5.1 Backing up WebSphere MQ structures
WebSphere MQ includes a command, BACKUP CFSTRUCT, that copies the persistent messages from a structure to the log of the queue manager where the command is issued. It puts a record in DB2 to indicate when the back up took place and which queue manager issued the command.
This command should be issued periodically and the results monitored. The current recommendation is to issue the CFSTRUCT BACKUP command at least once per hour for a busy structure.
For highly active queue sharing groups, it is a good idea to add an administrative queue manager to the QSG. An administrative queue manager is defined as a queue manager where there is no (or little) application workload. It is also often used as a full repository for a queue manager cluster. This allows the CFSTRUCT BACKUP command to be issued and not to impact the WebSphere MQ logs on application-focused queue managers.
Note: Queues had to be defined as both sharable for input (meaning that more than one application can open the queue for input at a time) and the default open for input set to shared because each queue was opened by flows running on each broker instance.
Chapter 8. Duplexing WebSphere MQ structures 195
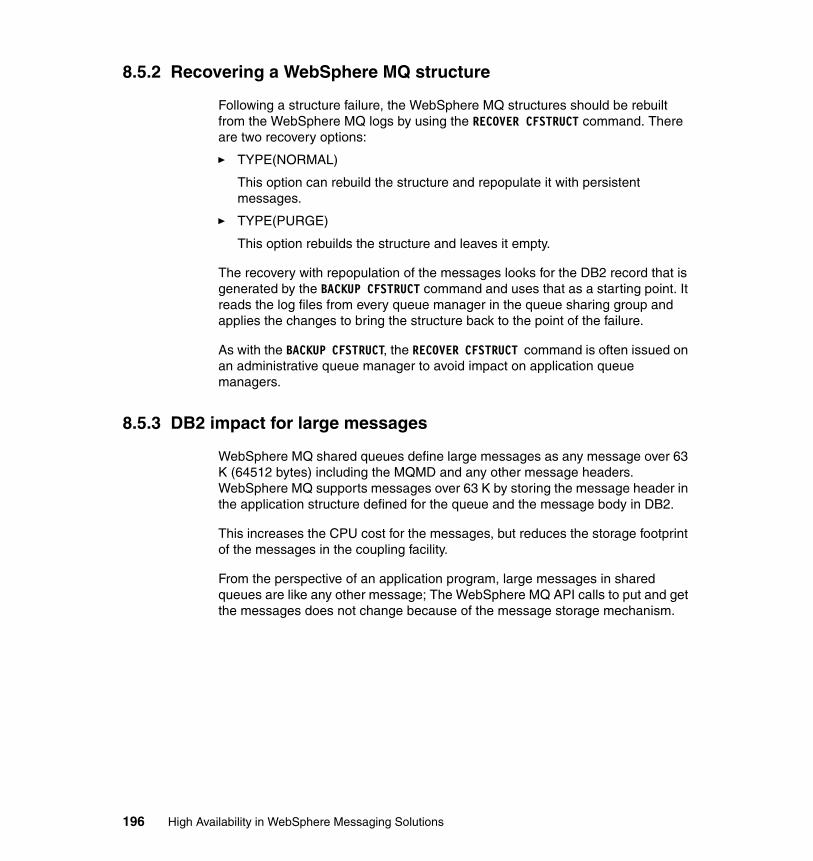
8.5.2 Recovering a WebSphere MQ structure
Following a structure failure, the WebSphere MQ structures should be rebuilt from the WebSphere MQ logs by using the RECOVER CFSTRUCT command. There are two recovery options:
� TYPE(NORMAL)
This option can rebuild the structure and repopulate it with persistent messages.
� TYPE(PURGE)
This option rebuilds the structure and leaves it empty.
The recovery with repopulation of the messages looks for the DB2 record that is generated by the BACKUP CFSTRUCT command and uses that as a starting point. It reads the log files from every queue manager in the queue sharing group and applies the changes to bring the structure back to the point of the failure.
As with the BACKUP CFSTRUCT, the RECOVER CFSTRUCT command is often issued on an administrative queue manager to avoid impact on application queue managers.
8.5.3 DB2 impact for large messages
WebSphere MQ shared queues define large messages as any message over 63 K (64512 bytes) including the MQMD and any other message headers. WebSphere MQ supports messages over 63 K by storing the message header in the application structure defined for the queue and the message body in DB2.
This increases the CPU cost for the messages, but reduces the storage footprint of the messages in the coupling facility.
From the perspective of an application program, large messages in shared queues are like any other message; The WebSphere MQ API calls to put and get the messages does not change because of the message storage mechanism.
196 High Availability in WebSphere Messaging Solutions
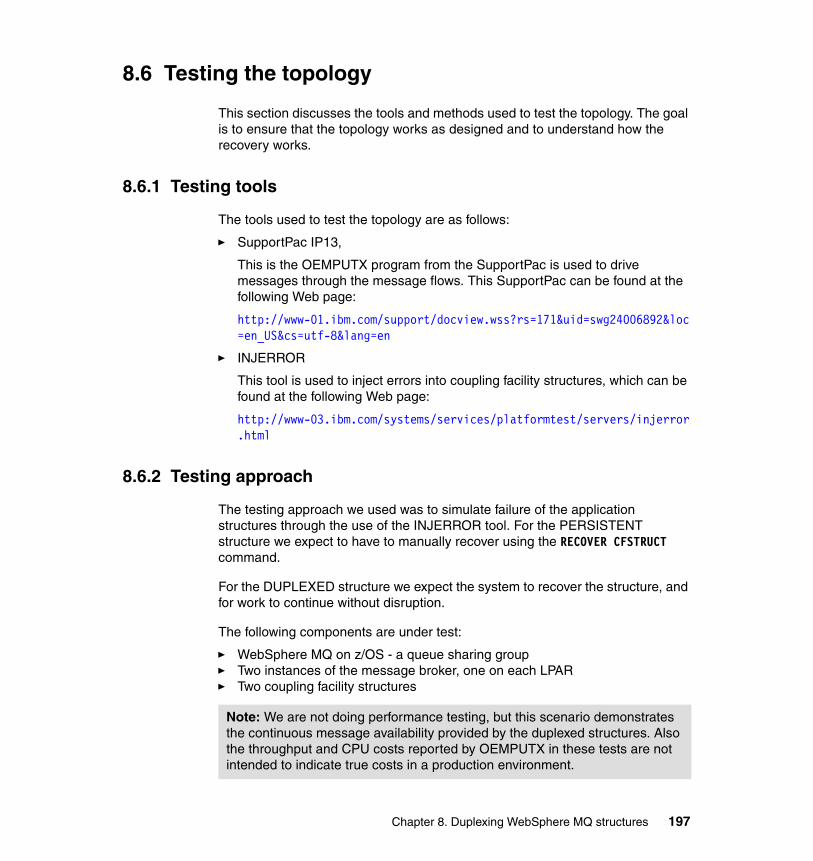
8.6 Testing the topology
This section discusses the tools and methods used to test the topology. The goal is to ensure that the topology works as designed and to understand how the recovery works.
8.6.1 Testing tools
The tools used to test the topology are as follows:
� SupportPac IP13,
This is the OEMPUTX program from the SupportPac is used to drive messages through the message flows. This SupportPac can be found at the following Web page:
http://www-01.ibm.com/support/docview.wss?rs=171&uid=swg24006892&loc=en_US&cs=utf-8&lang=en
� INJERROR
This tool is used to inject errors into coupling facility structures, which can be found at the following Web page:
http://www-03.ibm.com/systems/services/platformtest/servers/injerror.html
8.6.2 Testing approach
The testing approach we used was to simulate failure of the application structures through the use of the INJERROR tool. For the PERSISTENT structure we expect to have to manually recover using the RECOVER CFSTRUCT command.
For the DUPLEXED structure we expect the system to recover the structure, and for work to continue without disruption.
The following components are under test:
� WebSphere MQ on z/OS - a queue sharing group� Two instances of the message broker, one on each LPAR� Two coupling facility structures
Note: We are not doing performance testing, but this scenario demonstrates the continuous message availability provided by the duplexed structures. Also the throughput and CPU costs reported by OEMPUTX in these tests are not intended to indicate true costs in a production environment.
Chapter 8. Duplexing WebSphere MQ structures 197
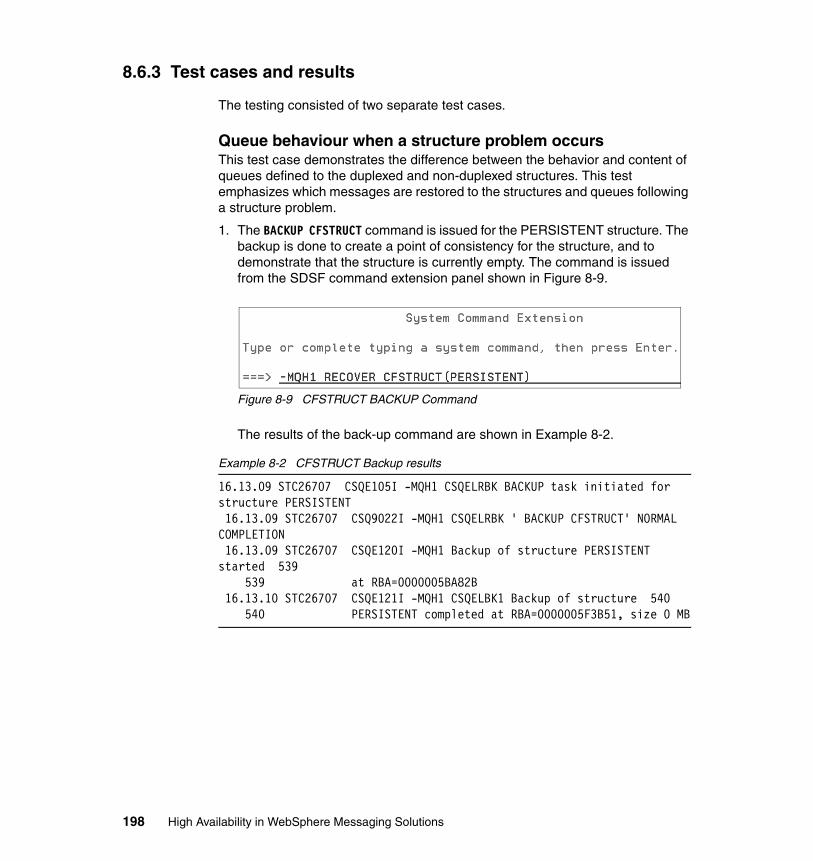
8.6.3 Test cases and results
The testing consisted of two separate test cases.
Queue behaviour when a structure problem occursThis test case demonstrates the difference between the behavior and content of queues defined to the duplexed and non-duplexed structures. This test emphasizes which messages are restored to the structures and queues following a structure problem.
1. The BACKUP CFSTRUCT command is issued for the PERSISTENT structure. The backup is done to create a point of consistency for the structure, and to demonstrate that the structure is currently empty. The command is issued from the SDSF command extension panel shown in Figure 8-9.
Figure 8-9 CFSTRUCT BACKUP Command
The results of the back-up command are shown in Example 8-2.
Example 8-2 CFSTRUCT Backup results
16.13.09 STC26707 CSQE105I -MQH1 CSQELRBK BACKUP task initiated for structure PERSISTENT 16.13.09 STC26707 CSQ9022I -MQH1 CSQELRBK ' BACKUP CFSTRUCT' NORMAL COMPLETION 16.13.09 STC26707 CSQE120I -MQH1 Backup of structure PERSISTENT started 539 539 at RBA=0000005BA82B 16.13.10 STC26707 CSQE121I -MQH1 CSQELBK1 Backup of structure 540 540 PERSISTENT completed at RBA=0000005F3B51, size 0 MB
198 High Availability in WebSphere Messaging Solutions

2. Each reply queue is populated with 400 persistent and 400 nonpersistent messages. You can see the queue message depth from the MQ Explorer queues display shown in Figure 8-10.
Figure 8-10 Messages on shared queues
3. The messages on each queue are browsed to make sure there is a mixture of persistent and nonpersistent messages.
Figure 8-11 shows the messages on the persistent structure.
Figure 8-11 Messages on the persistent structure
Chapter 8. Duplexing WebSphere MQ structures 199
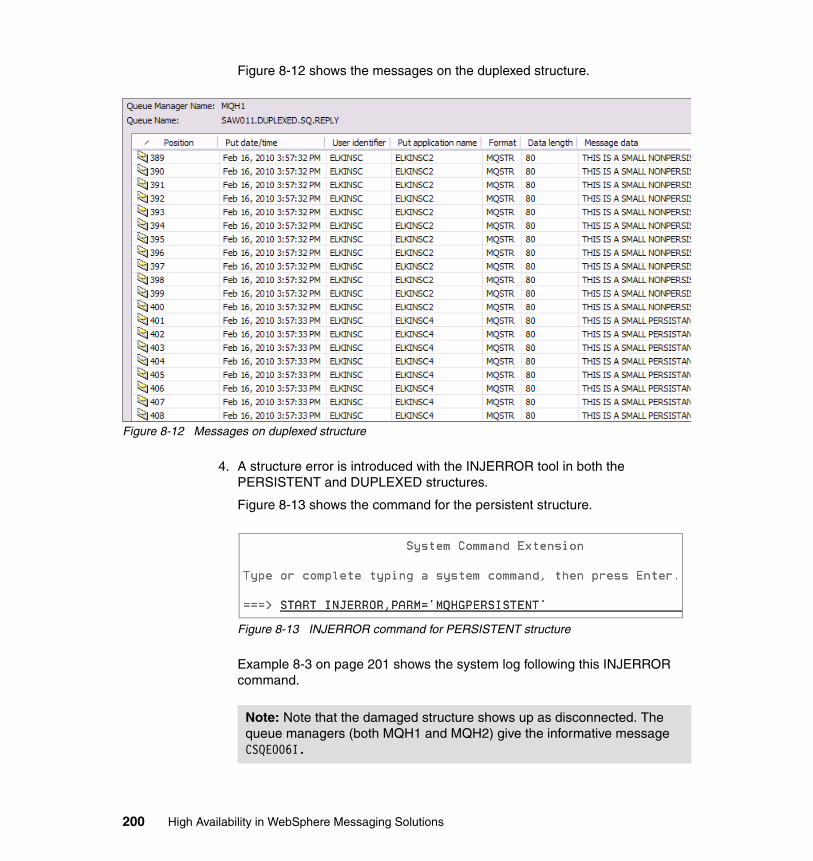
Figure 8-12 shows the messages on the duplexed structure.
Figure 8-12 Messages on duplexed structure
4. A structure error is introduced with the INJERROR tool in both the PERSISTENT and DUPLEXED structures.
Figure 8-13 shows the command for the persistent structure.
Figure 8-13 INJERROR command for PERSISTENT structure
Example 8-3 on page 201 shows the system log following this INJERROR command.
Note: Note that the damaged structure shows up as disconnected. The queue managers (both MQH1 and MQH2) give the informative message CSQE006I.
200 High Availability in WebSphere Messaging Solutions

Example 8-3 System log following INJERROR command
SDSF OPERLOG PRINT DATE 02/16/2010 PAGE 1IXC579I PENDING DEALLOCATION FOR STRUCTURE MQHGPERSISTENT IN 860 COUPLING FACILITY 002097.IBM.02.00000001DE50 PARTITION: 0D CPCID: 00 HAS BEEN COMPLETED.PHYSICAL STRUCTURE VERSION: C58CE2E3 36393A8AINFO116: 13572B00 01 6A00 00000025TRACE THREAD: 00325E85.CSQE006I -MQH2 Structure PERSISTENT connection name 861CSQEMQHGMQH202 disconnectedCSQE006I -MQH1 Structure PERSISTENT connection name 570CSQEMQHGMQH101 disconnected
Figure 8-14 shows the command for the duplexed structure.
Figure 8-14 INJERROR command for DUPLEXED structure
Example 8-4 shows the system log following the INJERROR command for the duplexed structure.
Example 8-4 Systems log after DUPLEXED INJERROR and structure rebuild
$HASP373 INJERROR STARTED INJERROR: PROCESSING STARTED - VERSION 3.1 - 09/16/02 INJERROR: INPUT RECEIVED - STR=MQHGDUPLEXED , STRTYPE=N/A INJERROR: STR FAILURE INITIATED AGAINST STR=MQHGDUPLEXED , STRTYPE=N/A INJERROR: PROCESSING COMPLETE
Note: For DUPLEXED the structure is never disconnected so the WMQ activities never stop. In the messages shown in Example 8-4, you can see that system-managed duplexing is initially stopped, the structure is switched to CF05, and the CF04 version of the duplexed structure is reallocated, DUPLEXED on CF04 is rebuilt from the in-use copy on CF05, and system-managed duplexing is restarted. This was done without manual intervention.
Chapter 8. Duplexing WebSphere MQ structures 201

- --TIMINGS (MINS.)-- ----PAGING COUNTS--- -JOBNAME STEPNAME PROCSTEP RC EXCP CPU SRB CLOCK SERV PG PAGE SWAP VIO SWAPS -INJERROR INJERROR 00 8 .00 .00 .0 161 0 0 0 0 0 -INJERROR ENDED. NAME- TOTAL CPU TIME= .00 TOTAL ELAPSED TIME= .0 IXC522I SYSTEM-MANAGED DUPLEXING REBUILD FOR STRUCTURE 291 MQHGDUPLEXED IS BEING STOPPED TO SWITCH TO THE NEW STRUCTURE DUE TO FAILURE OF THE OLD STRUCTURE IXC571I SYSTEM-MANAGED DUPLEXING REBUILD FOR STRUCTURE 292 MQHGDUPLEXED HAS COMPLETED THE DUPLEX ESTABLISHED PHASE AND IS ENTERING THE SWITCH PHASE. TIME: 02/16/2010 16:26:59.496703 AUTO VERSION: C586F91F BE7FC589 IXC571I SYSTEM-MANAGED DUPLEXING REBUILD FOR STRUCTURE 597 MQHGDUPLEXED HAS COMPLETED THE SWITCH PHASE AND IS ENTERING THE CLEANUP PHASE. TIME: 02/16/2010 16:26:59.715080 AUTO VERSION: C586F91F BE7FC589 IXC577I SYSTEM-MANAGED DUPLEXING REBUILD HAS 598 BEEN COMPLETED FOR STRUCTURE MQHGDUPLEXED STRUCTURE NOW IN COUPLING FACILITY CF05 PHYSICAL STRUCTURE VERSION: C586F920 0850A583 LOGICAL STRUCTURE VERSION: C5855AFC 93C6A684 AUTO VERSION: C586F91F BE7FC589 IXC579I PENDING DEALLOCATION FOR STRUCTURE MQHGDUPLEXED IN 599 COUPLING FACILITY 002097.IBM.02.00000001DE50 PARTITION: 0D CPCID: 00 HAS BEEN COMPLETED. PHYSICAL STRUCTURE VERSION: C586AF16 DE8ABA84 INFO116: 13088068 01 6A00 00000029 TRACE THREAD: 0035DE9E. IXC536I DUPLEXING REBUILD OF STRUCTURE MQHGDUPLEXED 600 INITIATED. REASON: PREVIOUS REBUILD PROCESS COMPLETED IXC570I SYSTEM-MANAGED DUPLEXING REBUILD STARTED FOR STRUCTURE 601 MQHGDUPLEXED IN COUPLING FACILITY CF05 PHYSICAL STRUCTURE VERSION: C586F920 0850A583 LOGICAL STRUCTURE VERSION: C5855AFC 93C6A684 START REASON: POLICY-INITIATED AUTO VERSION: C58CEADA 2D10980A IXC571I SYSTEM-MANAGED DUPLEXING REBUILD FOR STRUCTURE 602
202 High Availability in WebSphere Messaging Solutions

PAGE 2 MQHGDUPLEXED HAS COMPLETED THE STARTUP PHASE AND IS ENTERING THE QUIESCE PHASE. TIME: 02/16/2010 16:27:00.320121 AUTO VERSION: C58CEADA 2D10980A IXC571I SYSTEM-MANAGED DUPLEXING REBUILD FOR STRUCTURE 603 MQHGDUPLEXED HAS COMPLETED THE QUIESCE PHASE AND IS ENTERING THE ALLOCATION PHASE. TIME: 02/16/2010 16:27:00.433907 AUTO VERSION: C58CEADA 2D10980A IXC578I SYSTEM-MANAGED DUPLEXING REBUILD SUCCESSFULLY ALLOCATED 604 STRUCTURE MQHGDUPLEXED. OLD COUPLING FACILITY: CF05 OLD PHYSICAL STRUCTURE VERSION: C586F920 0850A583 NEW COUPLING FACILITY: CF04 NEW PHYSICAL STRUCTURE VERSION: C58CEADA 7AE3AD80 LOGICAL STRUCTURE VERSION: C5855AFC 93C6A684 AUTO VERSION: C58CEADA 2D10980A IXC582I STRUCTURE MQHGDUPLEXED ALLOCATED BY COUNTS. 605 PHYSICAL STRUCTURE VERSION: C58CEADA 7AE3AD80 STRUCTURE TYPE: SERIALIZED LIST CFNAME: CF04 ALLOCATION SIZE: 21504 K POLICY SIZE: 50000 K POLICY INITSIZE: 20480 K POLICY MINSIZE: 0 K IXLCONN STRSIZE: 0 K ENTRY COUNT: 3934 ELEMENT COUNT: 22950 EMC COUNT: 7882 LOCKS: 1024 ENTRY:ELEMENT RATIO: 1 : 6 EMC STORAGE PERCENTAGE: 5.00 % ALLOCATION SIZE EXCEEDS CFRM POLICY DEFINITIONS IXC574I ALLOCATION INFORMATION FOR SYSTEM-MANAGED DUPLEXING REBUILD OF STRUCTURE MQHGDUPLEXED AUTO VERSION: C58CEADA 2D10980A CFNAME STATUS/FAILURE REASON -------- --------------------- CF05 RESTRICTED BY REBUILD OTHER CF04 STRUCTURE ALLOCATED INFO110: 00000014 CC000800 00000000 IXC571I SYSTEM-MANAGED DUPLEXING REBUILD FOR STRUCTURE 607 MQHGDUPLEXED HAS COMPLETED THE ALLOCATION PHASE AND IS ENTERING THE ATTACH PHASE.
Chapter 8. Duplexing WebSphere MQ structures 203

TIME: 02/16/2010 16:27:00.580301 AUTO VERSION: C58CEADA 2D10980A IXC571I SYSTEM-MANAGED DUPLEXING REBUILD FOR STRUCTURE 608 MQHGDUPLEXED HAS COMPLETED THE ATTACH PHASE AND IS ENTERING THE COPY PHASE. TIME: 02/16/2010 16:27:00.645031 AUTO VERSION: C58CEADA 2D10980A IXC572I SYSTEM-MANAGED DUPLEXING REBUILD FOR STRUCTURE 870 PAGE 3 MQHGDUPLEXED HAS COMPLETED THE INITIALIZATION SUBPHASE OF THE COPY PHASE AND IS ENTERING THE ATTACH SUBPHASE. TIME: 02/16/2010 16:27:00.686837 AUTO VERSION: C58CEADA 2D10980A IXC572I SYSTEM-MANAGED DUPLEXING REBUILD FOR STRUCTURE 871 MQHGDUPLEXED HAS COMPLETED THE ATTACH SUBPHASE OF THE COPY PHASE AND IS ENTERING THE LIST SUBPHASE. TIME: 02/16/2010 16:27:00.688005 AUTO VERSION: C58CEADA 2D10980A IXC572I SYSTEM-MANAGED DUPLEXING REBUILD FOR STRUCTURE 258 MQHGDUPLEXED HAS COMPLETED THE LIST SUBPHASE OF THE COPY PHASE AND IS ENTERING THE EVENT QUEUE SUBPHASE. TIME: 02/16/2010 16:27:00.796617 AUTO VERSION: C58CEADA 2D10980A IXC572I SYSTEM-MANAGED DUPLEXING REBUILD FOR STRUCTURE 259 MQHGDUPLEXED HAS COMPLETED THE EVENT QUEUE SUBPHASE OF THE COPY PHASE AND IS ENTERING THE EXIT SUBPHASE. TIME: 02/16/2010 16:27:00.798687 AUTO VERSION: C58CEADA 2D10980A IXC571I SYSTEM-MANAGED DUPLEXING REBUILD FOR STRUCTURE 541 MQHGDUPLEXED HAS COMPLETED THE COPY PHASE AND IS ENTERING THE DUPLEX ESTABLISHED PHASE. TIME: 02/16/2010 16:27:01.129676 AUTO VERSION: C58CEADA 2D10980A IXC577I SYSTEM-MANAGED DUPLEXING REBUILD HAS 542 REACHED THE DUPLEX ESTABLISHED PHASE FOR STRUCTURE MQHGDUPLEXED STRUCTURE IS DUPLEXED OLD PHYSICAL STRUCTURE VERSION: C586F920 0850A583 NEW PHYSICAL STRUCTURE VERSION: C58CEADA 7AE3AD80 LOGICAL STRUCTURE VERSION: C5855AFC 93C6A684
204 High Availability in WebSphere Messaging Solutions
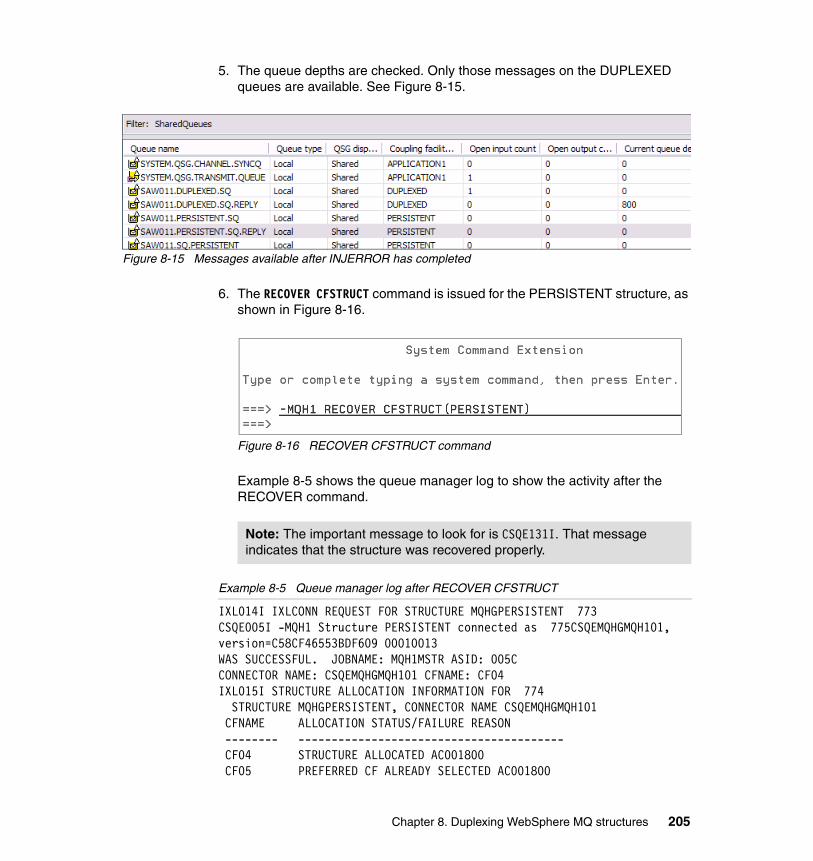
5. The queue depths are checked. Only those messages on the DUPLEXED queues are available. See Figure 8-15.
Figure 8-15 Messages available after INJERROR has completed
6. The RECOVER CFSTRUCT command is issued for the PERSISTENT structure, as shown in Figure 8-16.
Figure 8-16 RECOVER CFSTRUCT command
Example 8-5 shows the queue manager log to show the activity after the RECOVER command.
Example 8-5 Queue manager log after RECOVER CFSTRUCT
IXL014I IXLCONN REQUEST FOR STRUCTURE MQHGPERSISTENT 773CSQE005I -MQH1 Structure PERSISTENT connected as 775CSQEMQHGMQH101, version=C58CF46553BDF609 00010013WAS SUCCESSFUL. JOBNAME: MQH1MSTR ASID: 005CCONNECTOR NAME: CSQEMQHGMQH101 CFNAME: CF04IXL015I STRUCTURE ALLOCATION INFORMATION FOR 774 STRUCTURE MQHGPERSISTENT, CONNECTOR NAME CSQEMQHGMQH101 CFNAME ALLOCATION STATUS/FAILURE REASON -------- ---------------------------------------- CF04 STRUCTURE ALLOCATED AC001800 CF05 PREFERRED CF ALREADY SELECTED AC001800
Note: The important message to look for is CSQE131I. That message indicates that the structure was recovered properly.
Chapter 8. Duplexing WebSphere MQ structures 205
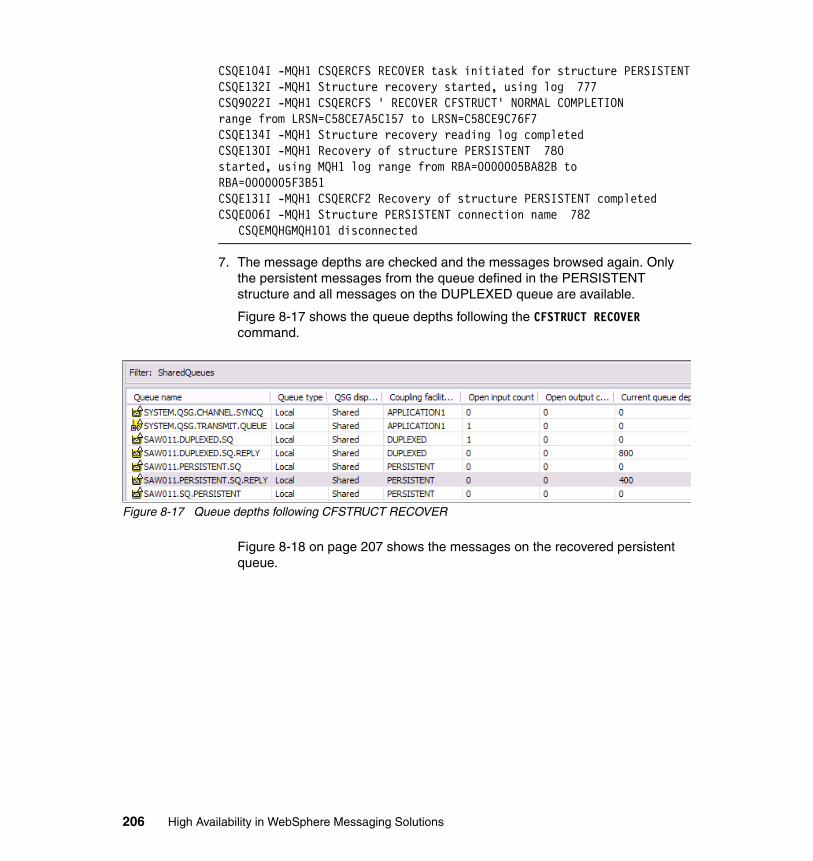
CSQE104I -MQH1 CSQERCFS RECOVER task initiated for structure PERSISTENTCSQE132I -MQH1 Structure recovery started, using log 777CSQ9022I -MQH1 CSQERCFS ' RECOVER CFSTRUCT' NORMAL COMPLETIONrange from LRSN=C58CE7A5C157 to LRSN=C58CE9C76F7CSQE134I -MQH1 Structure recovery reading log completedCSQE130I -MQH1 Recovery of structure PERSISTENT 780started, using MQH1 log range from RBA=0000005BA82B toRBA=0000005F3B51CSQE131I -MQH1 CSQERCF2 Recovery of structure PERSISTENT completedCSQE006I -MQH1 Structure PERSISTENT connection name 782 CSQEMQHGMQH101 disconnected
7. The message depths are checked and the messages browsed again. Only the persistent messages from the queue defined in the PERSISTENT structure and all messages on the DUPLEXED queue are available.
Figure 8-17 shows the queue depths following the CFSTRUCT RECOVER command.
Figure 8-17 Queue depths following CFSTRUCT RECOVER
Figure 8-18 on page 207 shows the messages on the recovered persistent queue.
206 High Availability in WebSphere Messaging Solutions
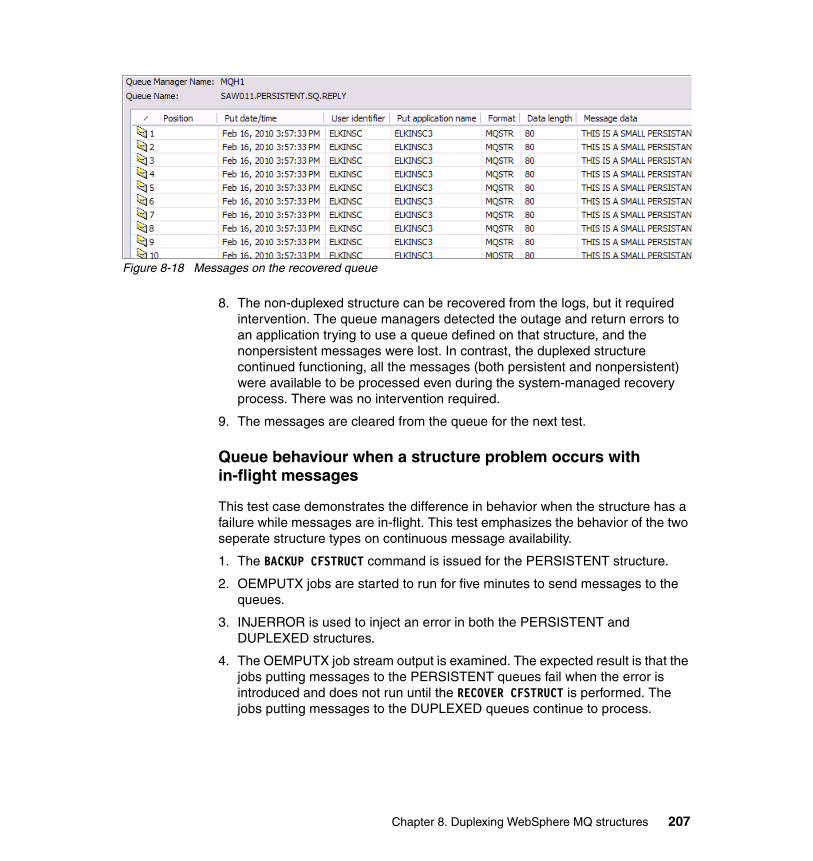
Figure 8-18 Messages on the recovered queue
8. The non-duplexed structure can be recovered from the logs, but it required intervention. The queue managers detected the outage and return errors to an application trying to use a queue defined on that structure, and the nonpersistent messages were lost. In contrast, the duplexed structure continued functioning, all the messages (both persistent and nonpersistent) were available to be processed even during the system-managed recovery process. There was no intervention required.
9. The messages are cleared from the queue for the next test.
Queue behaviour when a structure problem occurs with in-flight messages
This test case demonstrates the difference in behavior when the structure has a failure while messages are in-flight. This test emphasizes the behavior of the two seperate structure types on continuous message availability.
1. The BACKUP CFSTRUCT command is issued for the PERSISTENT structure.
2. OEMPUTX jobs are started to run for five minutes to send messages to the queues.
3. INJERROR is used to inject an error in both the PERSISTENT and DUPLEXED structures.
4. The OEMPUTX job stream output is examined. The expected result is that the jobs putting messages to the PERSISTENT queues fail when the error is introduced and does not run until the RECOVER CFSTRUCT is performed. The jobs putting messages to the DUPLEXED queues continue to process.
Chapter 8. Duplexing WebSphere MQ structures 207
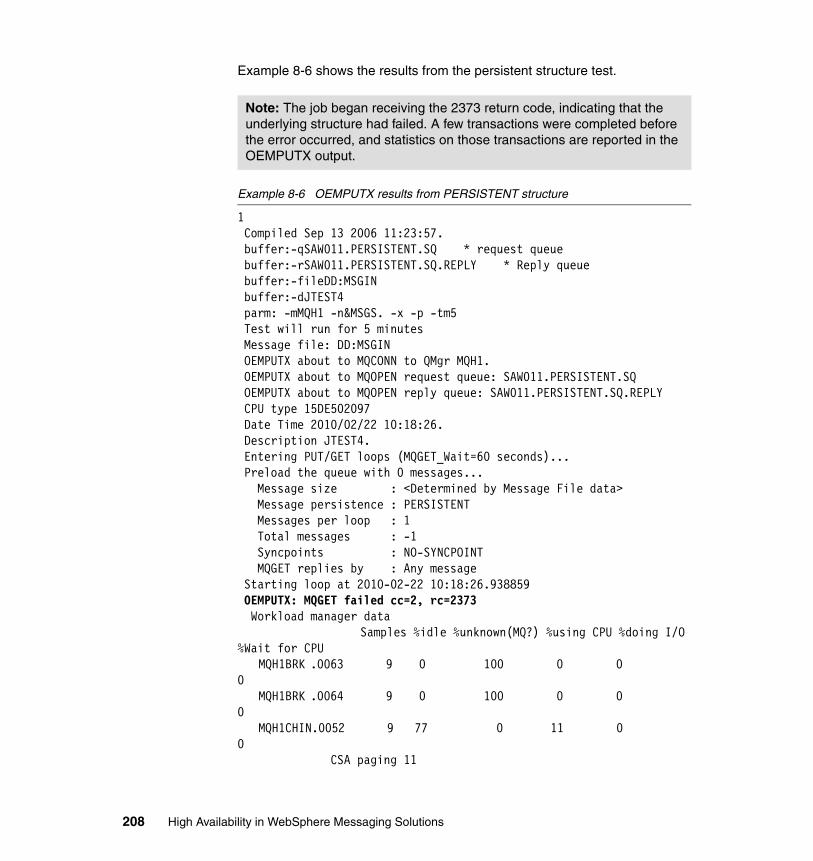
Example 8-6 shows the results from the persistent structure test.
Example 8-6 OEMPUTX results from PERSISTENT structure
1 Compiled Sep 13 2006 11:23:57. buffer:-qSAW011.PERSISTENT.SQ * request queue buffer:-rSAW011.PERSISTENT.SQ.REPLY * Reply queue buffer:-fileDD:MSGIN buffer:-dJTEST4 parm: -mMQH1 -n&MSGS. -x -p -tm5 Test will run for 5 minutes Message file: DD:MSGIN OEMPUTX about to MQCONN to QMgr MQH1. OEMPUTX about to MQOPEN request queue: SAW011.PERSISTENT.SQ OEMPUTX about to MQOPEN reply queue: SAW011.PERSISTENT.SQ.REPLY CPU type 15DE502097 Date Time 2010/02/22 10:18:26. Description JTEST4. Entering PUT/GET loops (MQGET_Wait=60 seconds)... Preload the queue with 0 messages... Message size : <Determined by Message File data> Message persistence : PERSISTENT Messages per loop : 1 Total messages : -1 Syncpoints : NO-SYNCPOINT MQGET replies by : Any message Starting loop at 2010-02-22 10:18:26.938859 OEMPUTX: MQGET failed cc=2, rc=2373 Workload manager data Samples %idle %unknown(MQ?) %using CPU %doing I/O %Wait for CPU MQH1BRK .0063 9 0 100 0 0 0 MQH1BRK .0064 9 0 100 0 0 0 MQH1CHIN.0052 9 77 0 11 0 0 CSA paging 11
Note: The job began receiving the 2373 return code, indicating that the underlying structure had failed. A few transactions were completed before the error occurred, and statistics on those transactions are reported in the OEMPUTX output.
208 High Availability in WebSphere Messaging Solutions

MQH1MSTR.006C 11 0 0 54 0 0 CSA paging 45 ------------------------------------------------------- Total Transactions : 408 Elapsed Time : 3.757 seconds Application CPU Time: 0.114 seconds (3.0%) Transaction Rate : 108.600 trans/sec ------------------------------------------------------- Round trip per msg : 9208 microseconds Avg App CPU per msg : 279 microseconds ------------------------------------------------------- Jobname.ASID TCB(uS) SRB(uS) Tot(uS) (%) /tran /tran /tran ------------- -------- -------- -------- ---- MQH1MSTR.006C 00000003 00000758 00000761 8.3 MQH1CHIN.0052 00000658 00000033 00000691 7.5 MQH1BRK .0064 00000005 00000000 00000006 0.1 MQH1BRK .0063 00000762 00000011 00000774 8.4 MQH1BRK* 00000768 00000011 00000780 8.5 Total CPUmicrosecs/tran 2233 ------------------------------------------------------- Ending loop at 2010-02-22 10:18:30.701071 OEMPUTX Normal Exit: End of program Exiting at 2010-02-22 10:18:30.703484
Chapter 8. Duplexing WebSphere MQ structures 209

Example 8-7 shows the results from the duplexed structure.
Example 8-7 OEMPUTX result for DUPLEXED structure
1 Compiled Sep 13 2006 11:23:57. buffer:-qSAW011.DUPLEXED.SQ * request queue buffer:-rSAW011.DUPLEXED.SQ.REPLY * Reply queue buffer:-fileDD:MSGIN buffer:-dJTEST4 parm: -mMQH1 -n&MSGS. -x -p -tm5 Test will run for 5 minutes Message file: DD:MSGIN OEMPUTX about to MQCONN to QMgr MQH1. OEMPUTX about to MQOPEN request queue: SAW011.DUPLEXED.SQ OEMPUTX about to MQOPEN reply queue: SAW011.DUPLEXED.SQ.REPLY CPU type 15DE502097 Date Time 2010/02/22 10:18:26. Description JTEST4. Entering PUT/GET loops (MQGET_Wait=60 seconds)... Preload the queue with 0 messages... Message size : <Determined by Message File data> Message persistence : PERSISTENT Messages per loop : 1 Total messages : -1 Syncpoints : NO-SYNCPOINT MQGET replies by : Any message Starting loop at 2010-02-22 10:18:26.939449 Workload manager data Samples %idle %unknown(MQ?) %using CPU %doing I/O %Wait for CPU MQH1BRK .0063 34 0 88 11 0 0 MQH1BRK .0064 34 0 97 2 0 0 MQH1CHIN.0052 36 75 0 11 0 0 CSA paging 13 MQH1MSTR.006C 30 3 0 53 23 0 CSA paging 13 Enclave private area paging delay 6
Note: The queues using the DUPLEXED structure did not have an outage, all five minutes of the test run were completed.
210 High Availability in WebSphere Messaging Solutions
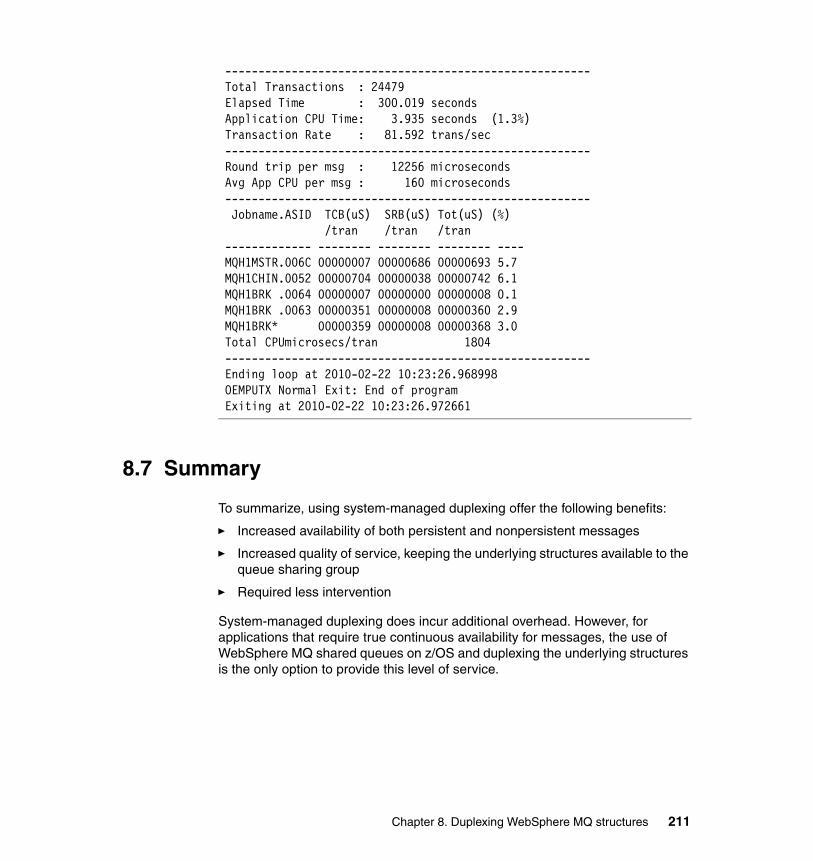
------------------------------------------------------- Total Transactions : 24479 Elapsed Time : 300.019 seconds Application CPU Time: 3.935 seconds (1.3%) Transaction Rate : 81.592 trans/sec ------------------------------------------------------- Round trip per msg : 12256 microseconds Avg App CPU per msg : 160 microseconds ------------------------------------------------------- Jobname.ASID TCB(uS) SRB(uS) Tot(uS) (%) /tran /tran /tran ------------- -------- -------- -------- ---- MQH1MSTR.006C 00000007 00000686 00000693 5.7 MQH1CHIN.0052 00000704 00000038 00000742 6.1 MQH1BRK .0064 00000007 00000000 00000008 0.1 MQH1BRK .0063 00000351 00000008 00000360 2.9 MQH1BRK* 00000359 00000008 00000368 3.0 Total CPUmicrosecs/tran 1804 ------------------------------------------------------- Ending loop at 2010-02-22 10:23:26.968998 OEMPUTX Normal Exit: End of program Exiting at 2010-02-22 10:23:26.972661
8.7 Summary
To summarize, using system-managed duplexing offer the following benefits:
� Increased availability of both persistent and nonpersistent messages
� Increased quality of service, keeping the underlying structures available to the queue sharing group
� Required less intervention
System-managed duplexing does incur additional overhead. However, for applications that require true continuous availability for messages, the use of WebSphere MQ shared queues on z/OS and duplexing the underlying structures is the only option to provide this level of service.
Chapter 8. Duplexing WebSphere MQ structures 211

212 High Availability in WebSphere Messaging Solutions

Chapter 9. WebSphere MQ shared queues and CICS group attach
In many enterprises CICS is a component of most business transactions. In the past 15 years many of these transactions have been initiated by or use WebSphere MQ to fulfill the service requests. The loss of a queue manager can have far reaching effects on availability.
This chapter presents a scenario that demonstrates the WebSphere MQ group attach feature of CICS 4.1. This feature allows a CICS region to attach to any local queue manager (on the same LPAR) in a Queue Sharing Group (QSG).
9
© Copyright IBM Corp. 2010. All rights reserved. 213
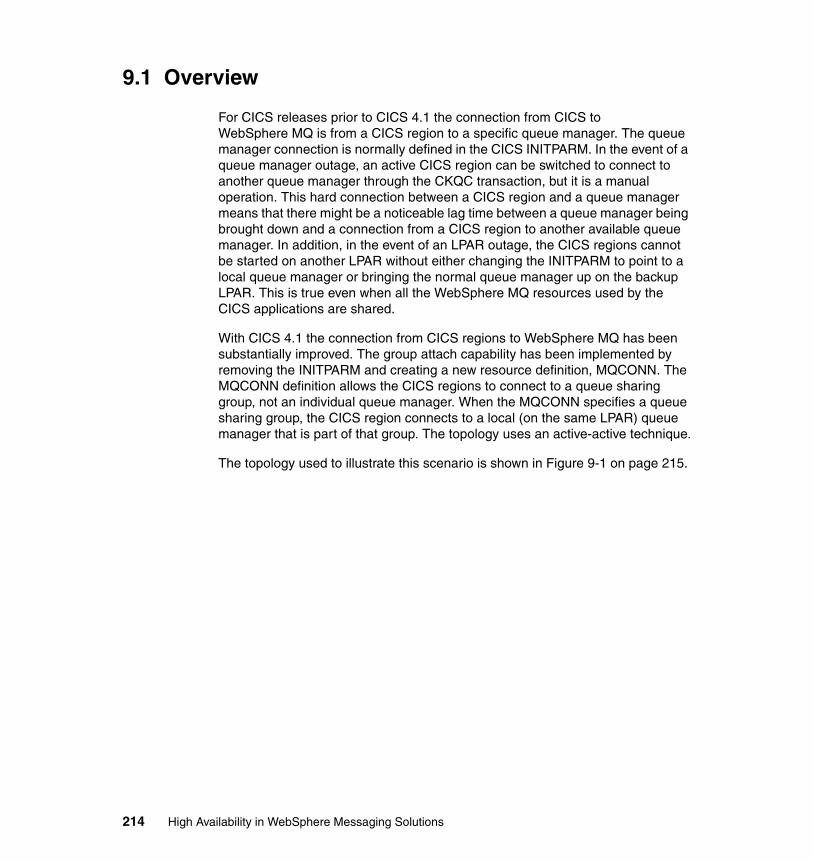
9.1 Overview
For CICS releases prior to CICS 4.1 the connection from CICS to WebSphere MQ is from a CICS region to a specific queue manager. The queue manager connection is normally defined in the CICS INITPARM. In the event of a queue manager outage, an active CICS region can be switched to connect to another queue manager through the CKQC transaction, but it is a manual operation. This hard connection between a CICS region and a queue manager means that there might be a noticeable lag time between a queue manager being brought down and a connection from a CICS region to another available queue manager. In addition, in the event of an LPAR outage, the CICS regions cannot be started on another LPAR without either changing the INITPARM to point to a local queue manager or bringing the normal queue manager up on the backup LPAR. This is true even when all the WebSphere MQ resources used by the CICS applications are shared.
With CICS 4.1 the connection from CICS regions to WebSphere MQ has been substantially improved. The group attach capability has been implemented by removing the INITPARM and creating a new resource definition, MQCONN. The MQCONN definition allows the CICS regions to connect to a queue sharing group, not an individual queue manager. When the MQCONN specifies a queue sharing group, the CICS region connects to a local (on the same LPAR) queue manager that is part of that group. The topology uses an active-active technique.
The topology used to illustrate this scenario is shown in Figure 9-1 on page 215.
214 High Availability in WebSphere Messaging Solutions
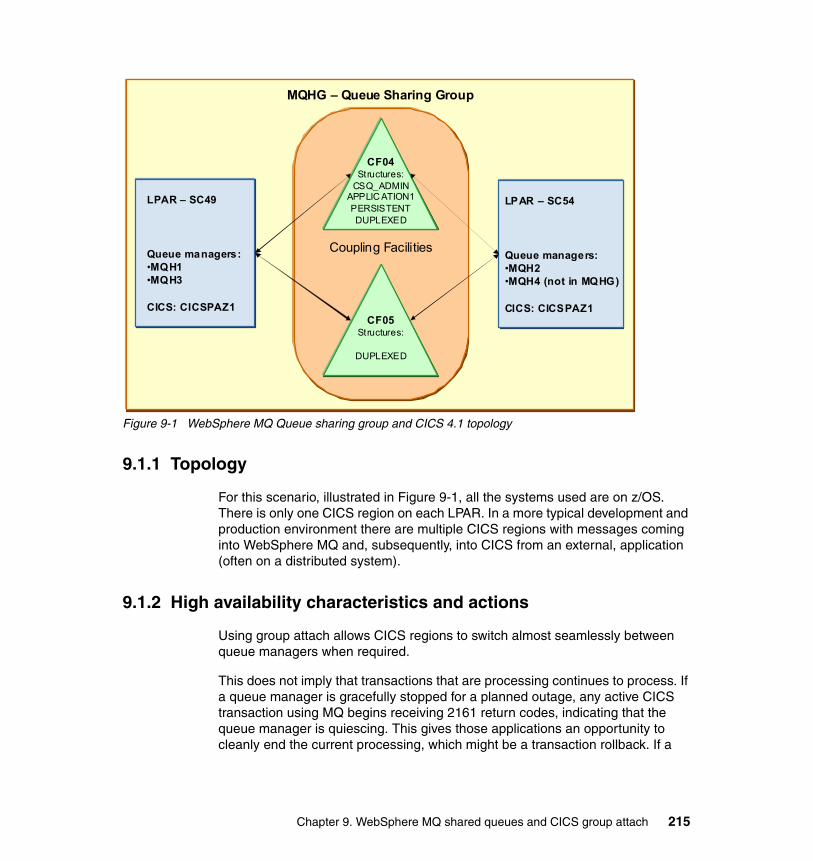
Figure 9-1 WebSphere MQ Queue sharing group and CICS 4.1 topology
9.1.1 Topology
For this scenario, illustrated in Figure 9-1, all the systems used are on z/OS. There is only one CICS region on each LPAR. In a more typical development and production environment there are multiple CICS regions with messages coming into WebSphere MQ and, subsequently, into CICS from an external, application (often on a distributed system).
9.1.2 High availability characteristics and actions
Using group attach allows CICS regions to switch almost seamlessly between queue managers when required.
This does not imply that transactions that are processing continues to process. If a queue manager is gracefully stopped for a planned outage, any active CICS transaction using MQ begins receiving 2161 return codes, indicating that the queue manager is quiescing. This gives those applications an opportunity to cleanly end the current processing, which might be a transaction rollback. If a
MQHG – Queue Sharing Group
LPAR – SC49
Queue managers: •MQH1•MQH3
CICS: CICSPAZ1
LPAR – SC54
Queue managers:•MQH2•MQH4 (not in MQHG)
CICS: CICSPAZ1
Coupling Facilities
CF04Structures:
CSQ_ADMINAPPLIC ATION1PERSISTENTDUPLEXED
CF05Structures:
DUPLEXED
Chapter 9. WebSphere MQ shared queues and CICS group attach 215
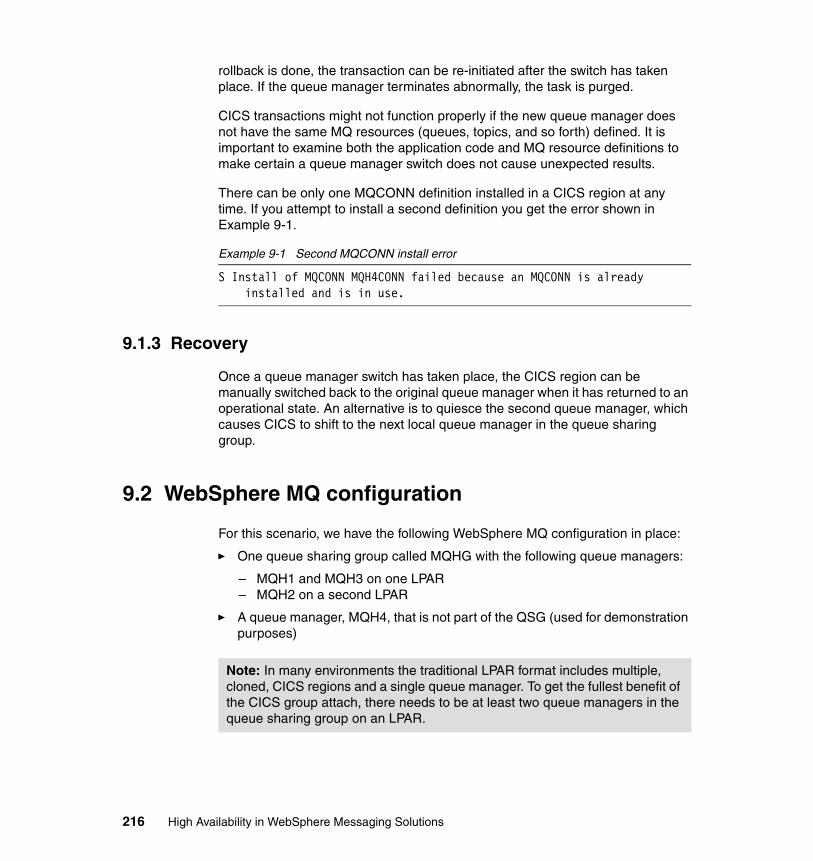
rollback is done, the transaction can be re-initiated after the switch has taken place. If the queue manager terminates abnormally, the task is purged.
CICS transactions might not function properly if the new queue manager does not have the same MQ resources (queues, topics, and so forth) defined. It is important to examine both the application code and MQ resource definitions to make certain a queue manager switch does not cause unexpected results.
There can be only one MQCONN definition installed in a CICS region at any time. If you attempt to install a second definition you get the error shown in Example 9-1.
Example 9-1 Second MQCONN install error
S Install of MQCONN MQH4CONN failed because an MQCONN is already installed and is in use.
9.1.3 Recovery
Once a queue manager switch has taken place, the CICS region can be manually switched back to the original queue manager when it has returned to an operational state. An alternative is to quiesce the second queue manager, which causes CICS to shift to the next local queue manager in the queue sharing group.
9.2 WebSphere MQ configuration
For this scenario, we have the following WebSphere MQ configuration in place:
� One queue sharing group called MQHG with the following queue managers:
– MQH1 and MQH3 on one LPAR– MQH2 on a second LPAR
� A queue manager, MQH4, that is not part of the QSG (used for demonstration purposes)
Note: In many environments the traditional LPAR format includes multiple, cloned, CICS regions and a single queue manager. To get the fullest benefit of the CICS group attach, there needs to be at least two queue managers in the queue sharing group on an LPAR.
216 High Availability in WebSphere Messaging Solutions

9.3 CICS definitions
For both CICS regions an MQCONN definition to the QSG was created using the standard CEDA transaction.
1. The definition is started by entering the CEDA DEFINE GROUP(SAW011) MQCONN command.
2. The specific connection information is entered as shown in Figure 9-2.
For both CICS regions, the QSG name, MQHG, was specified. On LPAR SC49 there are two queue managers that are part of the QSG, MQH1 and MQH3. On LPAR SC54 there are two queue managers, but only one, MQH2, is part of the QSG.
Figure 9-2 shows the MQCONN definition.
Figure 9-2 MQCONN definition
3. The new group, SAW011, is installed, using CEDA. This is shown in Figure 9-3.
Figure 9-3 Installing the MQHGCONN MQCONN
Chapter 9. WebSphere MQ shared queues and CICS group attach 217
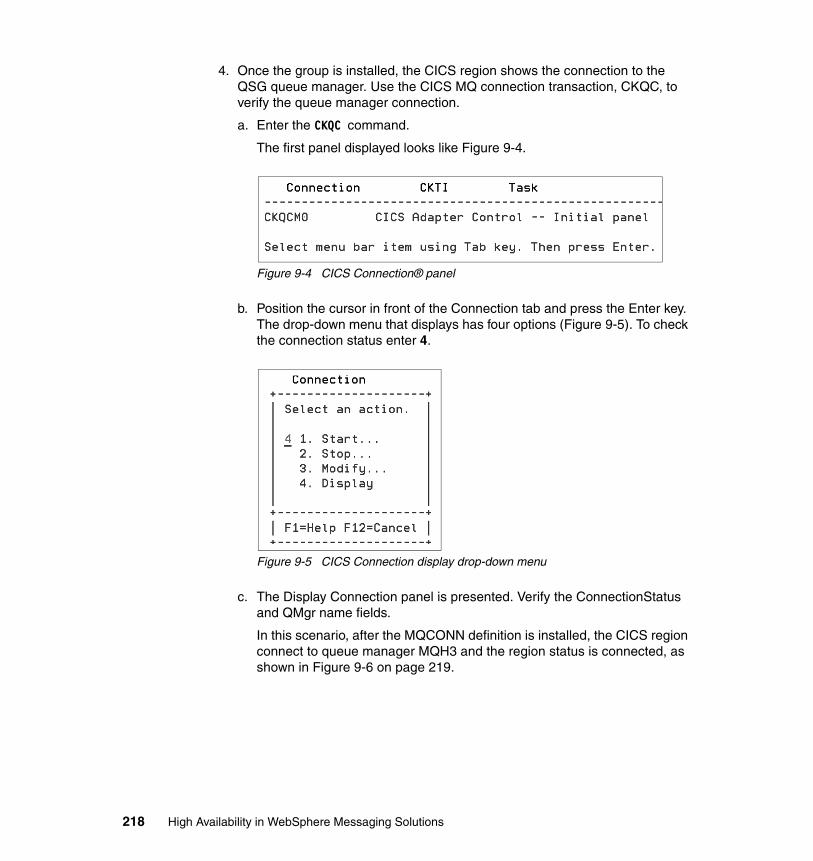
4. Once the group is installed, the CICS region shows the connection to the QSG queue manager. Use the CICS MQ connection transaction, CKQC, to verify the queue manager connection.
a. Enter the CKQC command.
The first panel displayed looks like Figure 9-4.
Figure 9-4 CICS Connection® panel
b. Position the cursor in front of the Connection tab and press the Enter key. The drop-down menu that displays has four options (Figure 9-5). To check the connection status enter 4.
Figure 9-5 CICS Connection display drop-down menu
c. The Display Connection panel is presented. Verify the ConnectionStatus and QMgr name fields.
In this scenario, after the MQCONN definition is installed, the CICS region connect to queue manager MQH3 and the region status is connected, as shown in Figure 9-6 on page 219.
218 High Availability in WebSphere Messaging Solutions
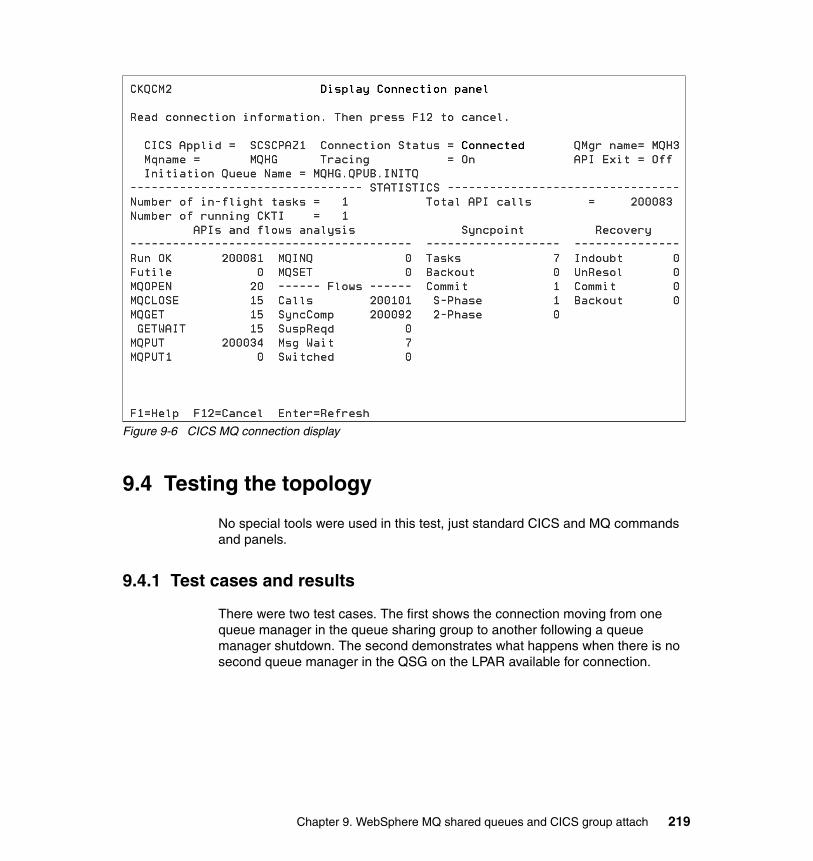
Figure 9-6 CICS MQ connection display
9.4 Testing the topology
No special tools were used in this test, just standard CICS and MQ commands and panels.
9.4.1 Test cases and results
There were two test cases. The first shows the connection moving from one queue manager in the queue sharing group to another following a queue manager shutdown. The second demonstrates what happens when there is no second queue manager in the QSG on the LPAR available for connection.
Chapter 9. WebSphere MQ shared queues and CICS group attach 219
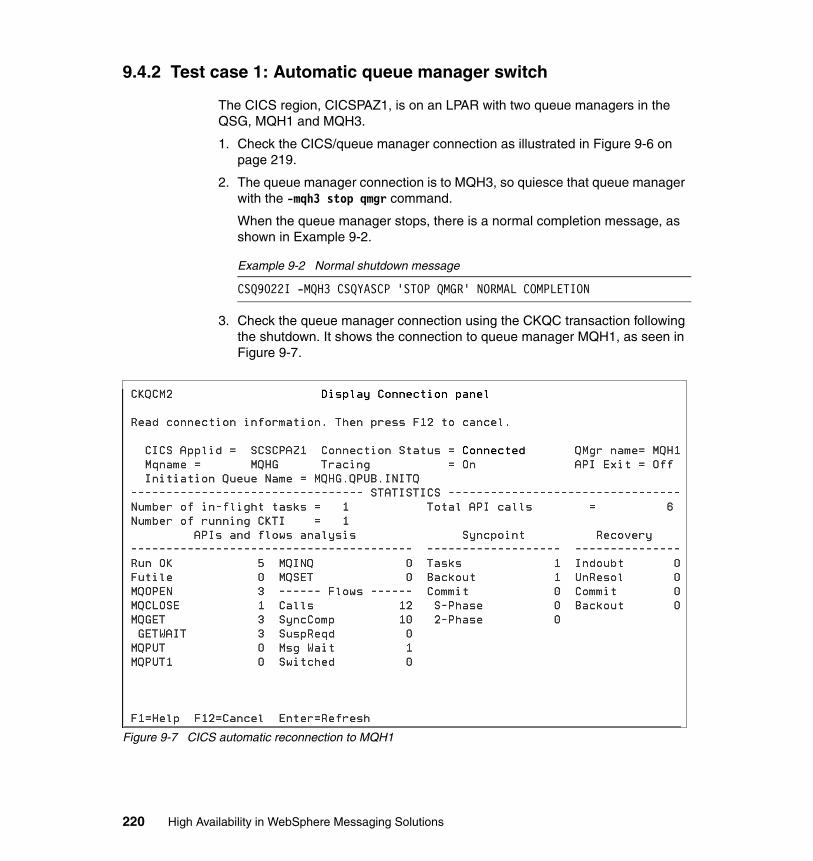
9.4.2 Test case 1: Automatic queue manager switch
The CICS region, CICSPAZ1, is on an LPAR with two queue managers in the QSG, MQH1 and MQH3.
1. Check the CICS/queue manager connection as illustrated in Figure 9-6 on page 219.
2. The queue manager connection is to MQH3, so quiesce that queue manager with the -mqh3 stop qmgr command.
When the queue manager stops, there is a normal completion message, as shown in Example 9-2.
Example 9-2 Normal shutdown message
CSQ9022I -MQH3 CSQYASCP 'STOP QMGR' NORMAL COMPLETION
3. Check the queue manager connection using the CKQC transaction following the shutdown. It shows the connection to queue manager MQH1, as seen in Figure 9-7.
Figure 9-7 CICS automatic reconnection to MQH1
220 High Availability in WebSphere Messaging Solutions

4. During the queue manager quiesce, CICS reports on the status in the MSGUSR file it creates as a part of its normal processing. As shown in Example 9-3, the CICS alert monitor detects the WebSphere MQ stop and issues the connect. That connection request is resolved to MQH1.
Example 9-3 CICS messages during the queue manager switch
STOP requested by alert monitor CKAM. A request to end CKTI has been received. CKTI ended. Adapter shutdown successful. CONNECT received from alert monitor. Unable to LOAD API exit CSQCAPX. Program is disabled. Successful connection to queue manager MQH1 release 0701 group MQHG
Chapter 9. WebSphere MQ shared queues and CICS group attach 221
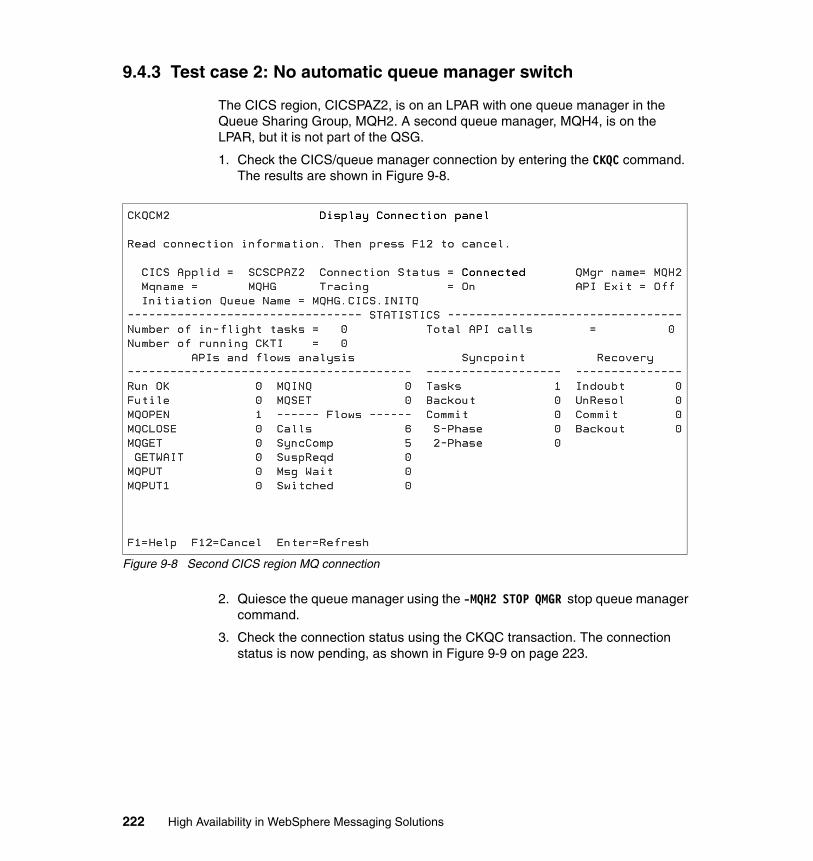
9.4.3 Test case 2: No automatic queue manager switch
The CICS region, CICSPAZ2, is on an LPAR with one queue manager in the Queue Sharing Group, MQH2. A second queue manager, MQH4, is on the LPAR, but it is not part of the QSG.
1. Check the CICS/queue manager connection by entering the CKQC command. The results are shown in Figure 9-8.
Figure 9-8 Second CICS region MQ connection
2. Quiesce the queue manager using the -MQH2 STOP QMGR stop queue manager command.
3. Check the connection status using the CKQC transaction. The connection status is now pending, as shown in Figure 9-9 on page 223.
222 High Availability in WebSphere Messaging Solutions

Figure 9-9 CICS region 2 in pending status
4. The queue manager is started with the standard start command, -MQH2 START QMGR
Chapter 9. WebSphere MQ shared queues and CICS group attach 223
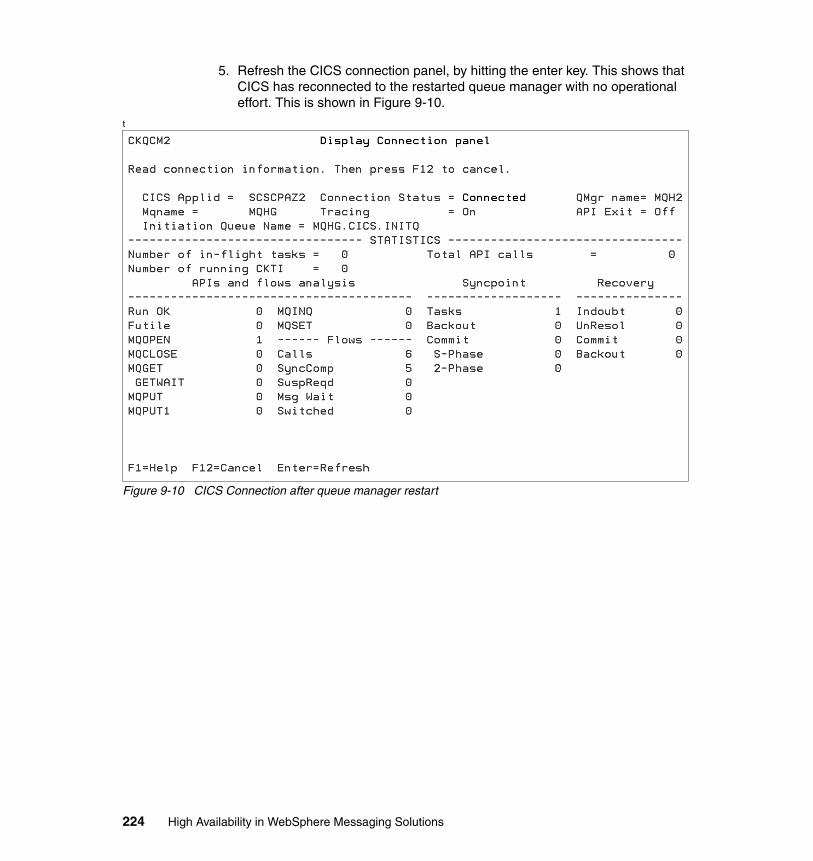
5. Refresh the CICS connection panel, by hitting the enter key. This shows that CICS has reconnected to the restarted queue manager with no operational effort. This is shown in Figure 9-10.
t
Figure 9-10 CICS Connection after queue manager restart
224 High Availability in WebSphere Messaging Solutions
Part 3 Appendixes
The appendixes contain supplemental information to explain processes and sample applications used in this book.
Part 3
© Copyright IBM Corp. 2010. All rights reserved. 225

226 High Availability in WebSphere Messaging Solutions
Appendix A. QPUB Transaction
This appendix describes a sample CICS MQ-enabled transaction, called QPUB, which is used for testing scenarios in this book. The description is broken into sections.
� QPUBCBL
A description of the COBOL program
� CICS administration
A description of the CICS definitions needed to enable the program and transaction
� WebSphere MQ administration
A description of the WebSphere MQ definitions needed
� Test data
The format of the data used to initiate the transaction
A
© Copyright IBM Corp. 2010. All rights reserved. 227
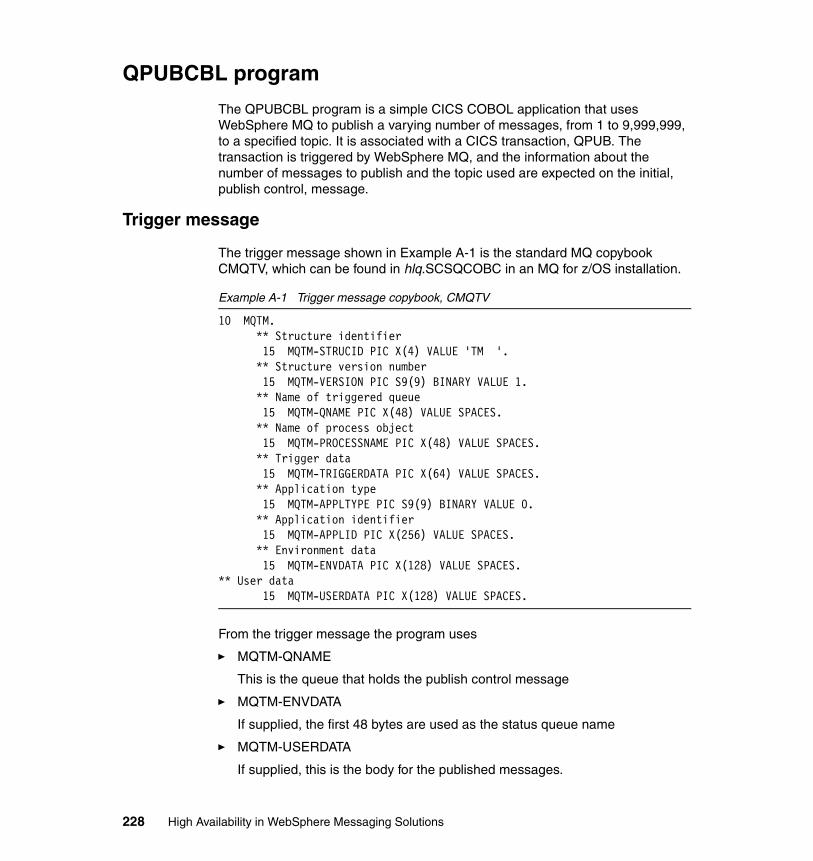
QPUBCBL program
The QPUBCBL program is a simple CICS COBOL application that uses WebSphere MQ to publish a varying number of messages, from 1 to 9,999,999, to a specified topic. It is associated with a CICS transaction, QPUB. The transaction is triggered by WebSphere MQ, and the information about the number of messages to publish and the topic used are expected on the initial, publish control, message.
Trigger message
The trigger message shown in Example A-1 is the standard MQ copybook CMQTV, which can be found in hlq.SCSQCOBC in an MQ for z/OS installation.
Example A-1 Trigger message copybook, CMQTV
10 MQTM. ** Structure identifier 15 MQTM-STRUCID PIC X(4) VALUE 'TM '. ** Structure version number 15 MQTM-VERSION PIC S9(9) BINARY VALUE 1. ** Name of triggered queue 15 MQTM-QNAME PIC X(48) VALUE SPACES. ** Name of process object 15 MQTM-PROCESSNAME PIC X(48) VALUE SPACES. ** Trigger data 15 MQTM-TRIGGERDATA PIC X(64) VALUE SPACES. ** Application type 15 MQTM-APPLTYPE PIC S9(9) BINARY VALUE 0. ** Application identifier 15 MQTM-APPLID PIC X(256) VALUE SPACES. ** Environment data 15 MQTM-ENVDATA PIC X(128) VALUE SPACES. ** User data 15 MQTM-USERDATA PIC X(128) VALUE SPACES.
From the trigger message the program uses
� MQTM-QNAME
This is the queue that holds the publish control message
� MQTM-ENVDATA
If supplied, the first 48 bytes are used as the status queue name
� MQTM-USERDATA
If supplied, this is the body for the published messages.
228 High Availability in WebSphere Messaging Solutions
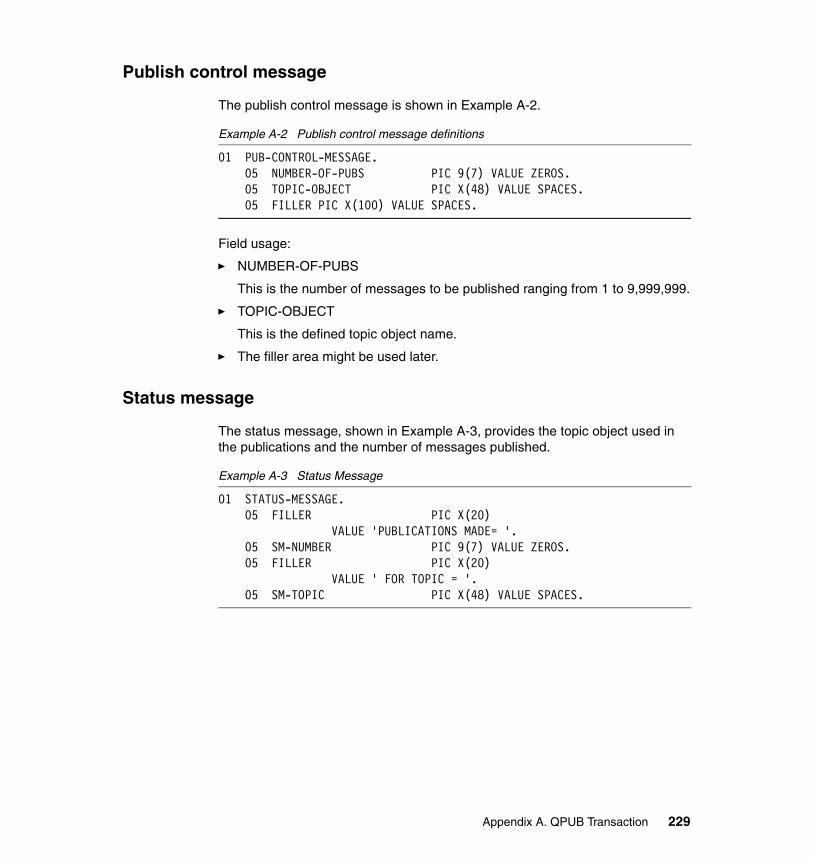
Publish control message
The publish control message is shown in Example A-2.
Example A-2 Publish control message definitions
01 PUB-CONTROL-MESSAGE. 05 NUMBER-OF-PUBS PIC 9(7) VALUE ZEROS. 05 TOPIC-OBJECT PIC X(48) VALUE SPACES. 05 FILLER PIC X(100) VALUE SPACES.
Field usage:
� NUMBER-OF-PUBS
This is the number of messages to be published ranging from 1 to 9,999,999.
� TOPIC-OBJECT
This is the defined topic object name.
� The filler area might be used later.
Status message
The status message, shown in Example A-3, provides the topic object used in the publications and the number of messages published.
Example A-3 Status Message
01 STATUS-MESSAGE. 05 FILLER PIC X(20) VALUE 'PUBLICATIONS MADE= '. 05 SM-NUMBER PIC 9(7) VALUE ZEROS. 05 FILLER PIC X(20) VALUE ' FOR TOPIC = '. 05 SM-TOPIC PIC X(48) VALUE SPACES.
Appendix A. QPUB Transaction 229
QPUBCBL flow
The complete COBOL program is provided in “QPUBCBL program code” on page 237. The following process is an outline of the processing.
1. Store trigger information.2. Open input queue and get the publish control message.3. Setup publication and control values.4. Open the topic specified in the control message.5. Publish the messages.6. Open the status queue.7. Format and put the status message.8. Close the topic.9. Close the queues.10.Return control to CICS.
CICS definitions
Two CICS resource definitions were required to support the QPUB sample, one transaction and one program definition. We used QPUB as the transaction name. This can be any four characters.
230 High Availability in WebSphere Messaging Solutions
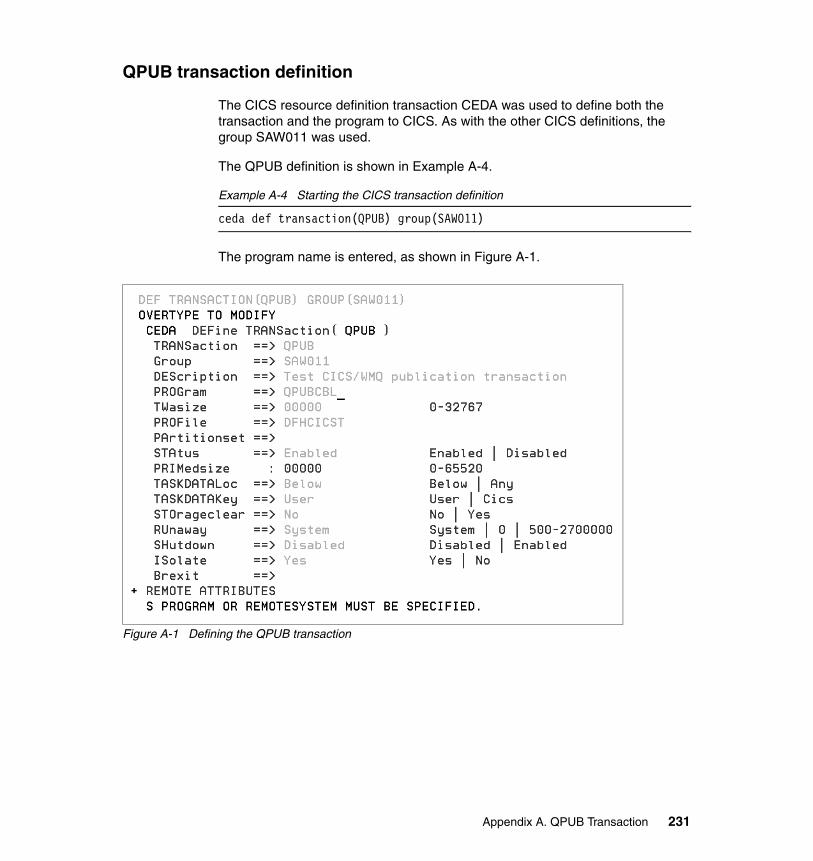
QPUB transaction definition
The CICS resource definition transaction CEDA was used to define both the transaction and the program to CICS. As with the other CICS definitions, the group SAW011 was used.
The QPUB definition is shown in Example A-4.
Example A-4 Starting the CICS transaction definition
ceda def transaction(QPUB) group(SAW011)
The program name is entered, as shown in Figure A-1.
Figure A-1 Defining the QPUB transaction
Appendix A. QPUB Transaction 231
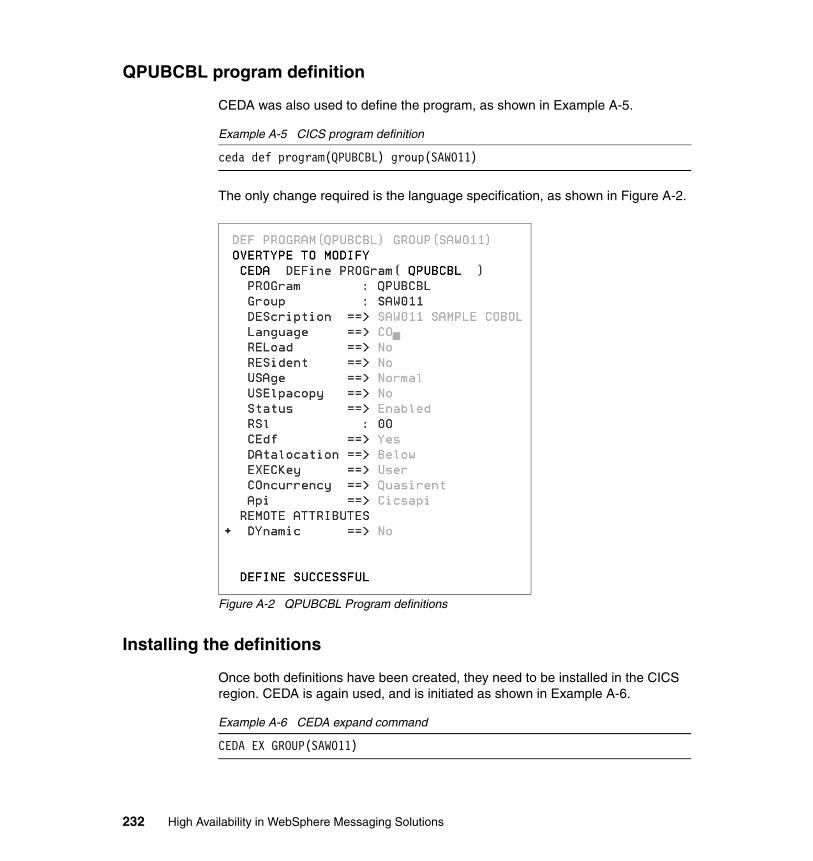
QPUBCBL program definition
CEDA was also used to define the program, as shown in Example A-5.
Example A-5 CICS program definition
ceda def program(QPUBCBL) group(SAW011)
The only change required is the language specification, as shown in Figure A-2.
Figure A-2 QPUBCBL Program definitions
Installing the definitions
Once both definitions have been created, they need to be installed in the CICS region. CEDA is again used, and is initiated as shown in Example A-6.
Example A-6 CEDA expand command
CEDA EX GROUP(SAW011)
232 High Availability in WebSphere Messaging Solutions
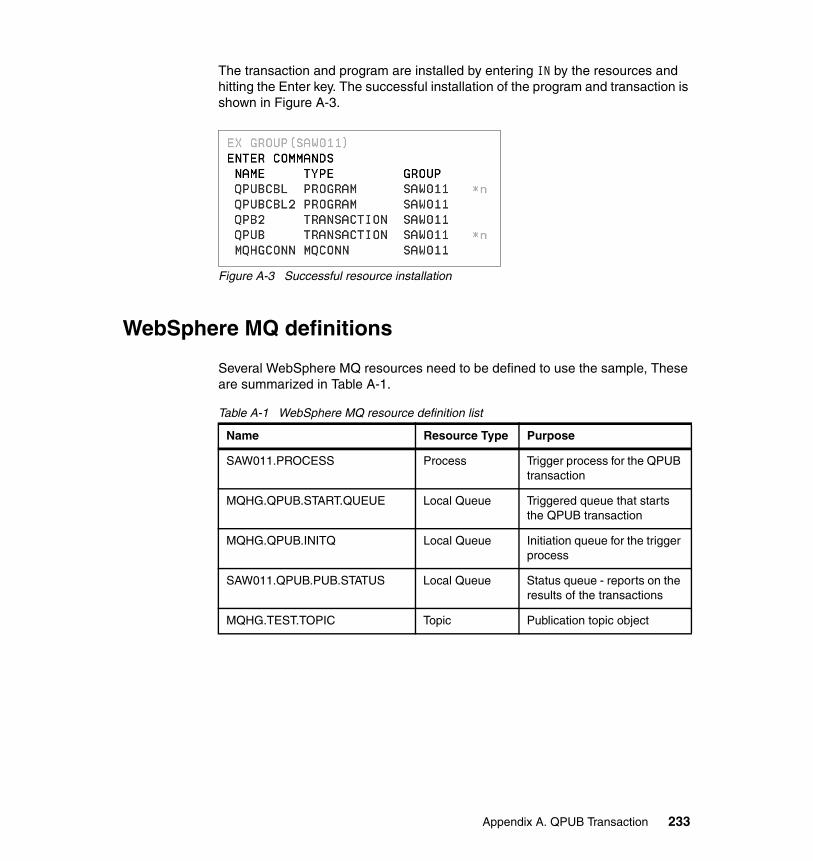
The transaction and program are installed by entering IN by the resources and hitting the Enter key. The successful installation of the program and transaction is shown in Figure A-3.
Figure A-3 Successful resource installation
WebSphere MQ definitions
Several WebSphere MQ resources need to be defined to use the sample, These are summarized in Table A-1.
Table A-1 WebSphere MQ resource definition list
Name Resource Type Purpose
SAW011.PROCESS Process Trigger process for the QPUB transaction
MQHG.QPUB.START.QUEUE Local Queue Triggered queue that starts the QPUB transaction
MQHG.QPUB.INITQ Local Queue Initiation queue for the trigger process
SAW011.QPUB.PUB.STATUS Local Queue Status queue - reports on the results of the transactions
MQHG.TEST.TOPIC Topic Publication topic object
Appendix A. QPUB Transaction 233

Process definition
The WebSphere MQ process definition, shown in Example A-7, tells the queue manager about the transaction to be started and provides operational data used by the transaction. The optional information is in the userdata and the environment data fields. The userdata field defines the content of the published message. The environment data field is used to provide the status queue.
Example A-7 Sample Process definition
DEFINE NOREPLACE PROCESS('SAW011.PROCESS') QSGDISP(COPY) DESCR(' ') APPLTYPE(CICS) APPLICID('QPUB') USERDATA('REPORT BACK WHEN IT MAKES SENSE') ENVRDATA('SAW011.QPUB.PUB.STATUS')
Queue definitions
The first queue defined (Example A-8) is the triggered queue that starts the transaction. The message put to this queue sets the number of publications and the publication topic. This definition sample is for a shared queue, but the queue can be private. All queue properties that are not specified were allowed to default.
Example A-8 Start queue example definition
QLOCAL('MQHG.QPUB.START.QUEUE') QSGDISP(SHARED) STGCLASS('DEFAULT') CFSTRUCT('PERSISTENT') PUT(ENABLED) PROCESS('SAW011.PROCESS') TRIGGER INITQ('MQHG.QPUB.INITQ') TRIGTYPE(EVERY) TRIGDPTH(1) TRIGMPRI(0) TRIGDATA(' ')
234 High Availability in WebSphere Messaging Solutions

The second queue is the initiation queue (Example A-9) used by WebSphere MQ and the CICS trigger monitor. When a message arrives on a triggered queue that meets the triggering criteria, the queue manager automatically puts an initiation message on the initiation queue. The CICS trigger monitor has been set to listen on the initiation queue and accept the transaction identified in the process definition. In many environments the initiation queue for CICS is left as the default CICS01.INITQ.
The initiation queue is defined as a shared queue for this IBM Redbooks publication. This is so that any CICS region to which it is connected can initiate the transactions if needed. All queue information that is not specified has been allowed to default.
Example A-9 Initiation queue definition
DEFINE NOREPLACE QLOCAL('MQHG.QPUB.INITQ') QSGDISP(SHARED) STGCLASS('DEFAULT') CFSTRUCT('PERSISTENT')
The status queue (Example A-10) contains information about the number of publications made and the topic used. For the examples in this book, it as been defined as a private queue. All queue information that is not specified in this example have been allowed to default.
Example A-10 Status queue definition
DEFINE NOREPLACE QLOCAL('SAW011.QPUB.PUB.STATUS') QSGDISP(QMGR) STGCLASS('DEFAULT')
Appendix A. QPUB Transaction 235

Topic definitions
The definitions shown in Example A-11 were used in testing the scenario environment. They define the topic string used by the subscribing applications. For the scenario, the topics were defined as in the QSG and as part of the cluster.
Example A-11 Topic definitions
DEFINE NOREPLACE TOPIC('MQHG.TEST.TOPIC') QSGDISP(COPY) CLUSTER('SAW011_CLUSTER') TOPICSTR( 'QPUB.STRING' ) DEFINE NOREPLACE TOPIC('NEWS.POLITICS') QSGDISP(COPY) CLUSTER('SAW011_CLUSTER') TOPICSTR( 'NEWS/POLITICS' )
Sample data
The sample data shows the format of the message used to trigger the transaction and start the message publication. It is defined as the publish control message shown in “Publish control message” on page 229. The sample data shown in Example A-12 causes the publication of 10,000 messages to the MQHG.TEST.TOPIC. The other characters are ignored.
Example A-12 Sample QPUB data
0010000MQHG.TEST.TOPIC PUB
236 High Availability in WebSphere Messaging Solutions
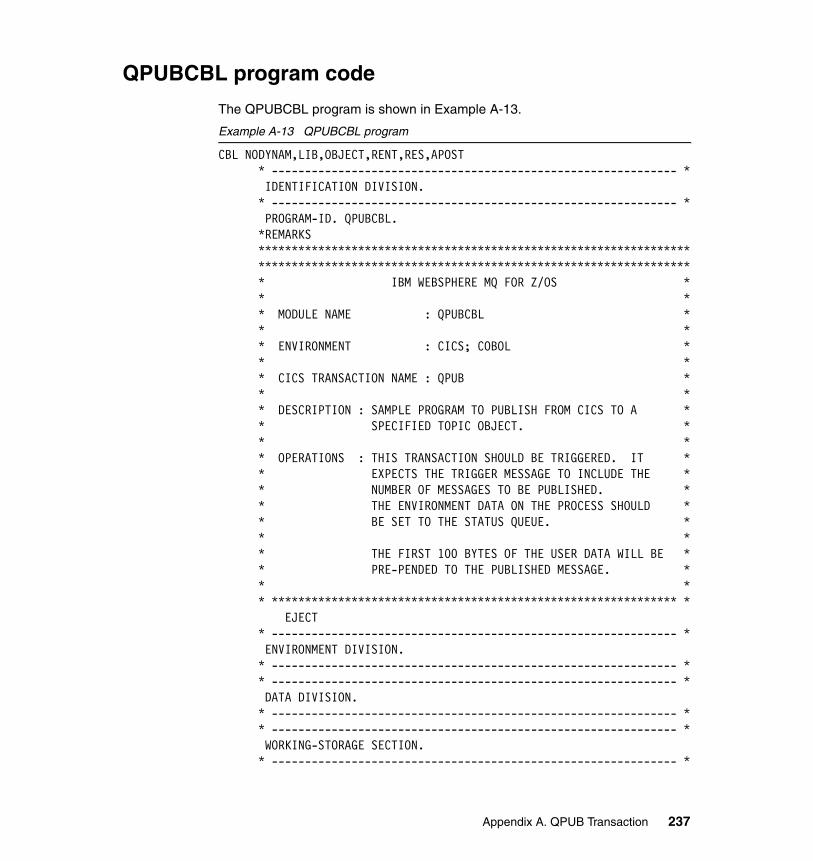
QPUBCBL program code
The QPUBCBL program is shown in Example A-13.
Example A-13 QPUBCBL program
CBL NODYNAM,LIB,OBJECT,RENT,RES,APOST * ------------------------------------------------------------- * IDENTIFICATION DIVISION. * ------------------------------------------------------------- * PROGRAM-ID. QPUBCBL. *REMARKS ***************************************************************** ***************************************************************** * IBM WEBSPHERE MQ FOR Z/OS * * * * MODULE NAME : QPUBCBL * * * * ENVIRONMENT : CICS; COBOL * * * * CICS TRANSACTION NAME : QPUB * * * * DESCRIPTION : SAMPLE PROGRAM TO PUBLISH FROM CICS TO A * * SPECIFIED TOPIC OBJECT. * * * * OPERATIONS : THIS TRANSACTION SHOULD BE TRIGGERED. IT * * EXPECTS THE TRIGGER MESSAGE TO INCLUDE THE * * NUMBER OF MESSAGES TO BE PUBLISHED. * * THE ENVIRONMENT DATA ON THE PROCESS SHOULD * * BE SET TO THE STATUS QUEUE. * * * * THE FIRST 100 BYTES OF THE USER DATA WILL BE * * PRE-PENDED TO THE PUBLISHED MESSAGE. * * * * ************************************************************* * EJECT * ------------------------------------------------------------- * ENVIRONMENT DIVISION. * ------------------------------------------------------------- * * ------------------------------------------------------------- * DATA DIVISION. * ------------------------------------------------------------- * * ------------------------------------------------------------- * WORKING-STORAGE SECTION. * ------------------------------------------------------------- *
Appendix A. QPUB Transaction 237

* 01 WSAREA PIC X(20) VALUE 'START OF WS '. 01 HCONN PIC S9(9) BINARY VALUE ZERO. 01 HOBJ-PUB-CONTROL PIC S9(9) BINARY VALUE ZERO. 01 HOBJ-PUB-MSGS PIC S9(9) BINARY VALUE ZERO. 01 HOBJ-PUB-STATUS PIC S9(9) BINARY VALUE ZERO. 01 WAIT-INTERVAL PIC S9(9) BINARY VALUE 30000. 01 OPENOPTIONS-PC PIC S9(9) BINARY. 01 OPENOPTIONS-STATUS PIC S9(9) BINARY. 01 OPENOPTIONS-PUBLISH PIC S9(9) BINARY. 01 GET-OPTIONS-PC PIC S9(9) BINARY. 01 PUT-OPTIONS-STATUS PIC S9(9) BINARY. 01 PUB-OPTIONS PIC S9(9) BINARY. 01 COMPCODE PIC S9(9) BINARY. 01 REASON PIC S9(9) BINARY. 01 DATALEN PIC S9(9) BINARY. 01 BUFFLEN PIC S9(9) BINARY. 01 NUMPUBS-HDR PIC X(20) VALUE 'NUMBER PUBS = '. 01 NUMPUBS PIC S9(9) BINARY VALUE 0. 01 PUB-LOOP-CONTROL-HDR PIC X(20) VALUE 'PUB LOOP CONTROL= '. 01 PUB-LOOP-CONTROL PIC S9(9) BINARY VALUE 0. 01 ERROR-MESSAGE PIC X(48) VALUE SPACES. 01 ABEND-CODE PIC X(04) VALUE SPACES. 01 TOPIC-NAME PIC X(48) VALUE SPACES. 01 TOPIC-STR PIC X(100) VALUE SPACES. 01 PC-MESSAGE PIC X(20) VALUE 'PUB CNTL MESSAGE = '. 01 PUB-CONTROL-MESSAGE. 05 NUMBER-OF-PUBS PIC 9(7) VALUE ZEROS. 05 TOPIC-OBJECT PIC X(48) VALUE SPACES. 05 TOPIC-STRING PIC X(100) VALUE SPACES. 01 PUBLISH-MESSAGE. 05 PM-USER-DATA PIC X(100) VALUE SPACES. 05 PM-NUMBER PIC 9(7) VALUE ZEROS. 05 PM-TOPIC PIC X(48) VALUE SPACES. 01 STATUS-MESSAGE. 05 FILLER PIC X(20) VALUE 'PUBLICATIONS MADE= '. 05 SM-NUMBER PIC 9(7) VALUE ZEROS. 05 FILLER PIC X(20) VALUE ' FOR TOPIC = '. 05 SM-TOPIC PIC X(48) VALUE SPACES.
238 High Availability in WebSphere Messaging Solutions

01 MQMARKER PIC X(20) VALUE 'START OF MQ STUFF'. 01 STATUS-QUEUE-NAME PIC X(48) VALUE 'QPUB.PUB.STATUS'. 01 PUB-START-QUEUE PIC X(48) VALUE 'QPUB.PUB.MESSAGE'. 01 WORK-ERROR-MSG. 05 ERR-FILLER1 PIC X(24) VALUE 'ERROR IN PROCESSING '. 05 ERROR-REQUEST PIC X(5). 05 ERR-FILLER2 PIC X(24) VALUE ', RETURN CODE = '. 05 ERR-RC PIC 9(04). 05 FILLER PIC X(55). * * MQ WORK FIELDS * 01 FILLER PIC X(30) VALUE 'TRIGGER MESSAGE = '. 01 MQM-TRIGGER-MESSAGE. COPY CMQTMV. 01 MQM-OBJECT-DESCRIPTOR. COPY CMQODV. 01 MQM-MESSAGE-DESCRIPTOR. COPY CMQMDV. 01 MQM-PUT-MESSAGE-OPTIONS. COPY CMQPMOV. 01 MQM-GET-MESSAGE-OPTIONS. COPY CMQGMOV. 01 MQM-CONSTANTS. COPY CMQV. * * DFHAID CONTAINS THE CONSTANTS USED FOR CHECKING FOR * ATTENTION IDENTIFIERS * COPY DFHAID SUPPRESS. * * ------------------------------------------------------------- * LINKAGE SECTION. 01 DFHCOMMAREA PIC X(600). * ------------------------------------------------------------- * * EJECT * ------------------------------------------------------------- * PROCEDURE DIVISION.
Appendix A. QPUB Transaction 239

* ------------------------------------------------------------- * * ------------------------------------------------------------- * A-MAIN SECTION. * ------------------------------------------------------------- * * * * THIS SECTION INITIALIZES AND CONTROLS THE PROGRAM FLOW * * * * 1) OPEN INPUT QUEUE AND RETRIEVE PUB CONTROL MESSAGE * * 2) SETUP CONTROL VALUES * * 3) OPEN OUTPUT STATUS QUEUE * * 4) OPEN TOPIC SPECIFIED IN CONTROL MESSAGE * * 5) PUBLISH MESSAGES * * 6) FORMAT AND WRITE STATUS MESSAGE * * 7) CLOSE TOPIC * * 8) CLOSE QUEUES * * 9) RETURN TO CICS * * * * ------------------------------------------------------------ * * * READ MESSAGE FROM THE PUBLICATION CONTROL QUEUE * * RETRIEVE THE TRIGGER MESSAGE TO GET QUEUE NAME * * EXEC CICS RETRIEVE INTO(MQTM) END-EXEC. * * OPEN THE QUEUE * MOVE MQOT-Q TO MQOD-OBJECTTYPE. MOVE MQTM-QNAME TO MQOD-OBJECTNAME. IF MQOD-OBJECTNAME IS EQUAL TO SPACES THEN MOVE PUB-START-QUEUE TO MQOD-OBJECTNAME. IF MQTM-ENVDATA IS EQUAL TO SPACES OR LOW-VALUES THEN NEXT SENTENCE ELSE MOVE MQTM-ENVDATA TO STATUS-QUEUE-NAME. IF MQTM-USERDATA IS EQUAL TO SPACES OR LOW-VALUES THEN MOVE 'NO USER DATA PROVIDED' TO PM-USER-DATA ELSE MOVE MQTM-USERDATA TO PM-USER-DATA END-IF. * * INITIALIZE OPTIONS AND OPEN THE INPUT QUEUE * COMPUTE OPENOPTIONS-PC = MQOO-INPUT-SHARED +
240 High Availability in WebSphere Messaging Solutions

MQOO-FAIL-IF-QUIESCING. * CALL 'MQOPEN' USING HCONN MQOD OPENOPTIONS-PC HOBJ-PUB-CONTROL COMPCODE REASON. * * TEST THE OUTPUT FROM THE OPEN, IF * NOT OK THEN EXIT PROGRAM * IF COMPCODE NOT = MQCC-OK THEN GO TO OPEN-PC-ERROR-EXIT. * * GET THE PUBLISH CONTROL RECORD * * COMPUTE MQGMO-OPTIONS = MQGMO-NO-SYNCPOINT + MQGMO-CONVERT + MQGMO-WAIT + MQGMO-FAIL-IF-QUIESCING. MOVE WAIT-INTERVAL TO MQGMO-WAITINTERVAL. * * SET CORRELID IN MD TO MESSAGE ID FROM MQPUT * MOVE MQMD-MSGID TO MQMD-CORRELID. MOVE MQCI-NONE TO MQMD-MSGID. MOVE LENGTH OF PUB-CONTROL-MESSAGE TO BUFFLEN. * CALL 'MQGET' USING HCONN, HOBJ-PUB-CONTROL, MQMD, MQGMO, BUFFLEN, PUB-CONTROL-MESSAGE, DATALEN, COMPCODE, REASON. * IF (COMPCODE NOT = MQCC-OK) THEN MOVE 'MQGET' TO ERROR-REQUEST MOVE REASON TO ERR-RC * MOVE WORK-ERROR-MSG TO OUTPUT-MSG GO TO MQGET-PC-ERROR-EXIT
Appendix A. QPUB Transaction 241

END-IF. * IF NUMBER-OF-PUBS = ZERO MOVE +1 TO PUB-LOOP-CONTROL ELSE MOVE NUMBER-OF-PUBS TO PUB-LOOP-CONTROL END-IF.
MOVE TOPIC-OBJECT TO TOPIC-NAME. IF TOPIC-NAME = SPACES MOVE 'SYSTEM.DEFAULT.TOPIC' TO TOPIC-NAME END-IF. MOVE TOPIC-STRING TO TOPIC-STR. * * OPEN THE TOPIC * MOVE MQOT-TOPIC TO MQOD-OBJECTTYPE. * * FIRST TEST - ONLY TOPIC OBJECT IS SPECIFIED * MOVE TOPIC-NAME TO MQOD-OBJECTNAME. * * INITIALIZE OPTIONS AND OPEN THE INPUT QUEUE * COMPUTE OPENOPTIONS-PUBLISH = MQOO-OUTPUT + MQOO-FAIL-IF-QUIESCING. * CALL 'MQOPEN' USING HCONN MQOD OPENOPTIONS-PUBLISH HOBJ-PUB-MSGS COMPCODE REASON. * * TEST THE OUTPUT FROM THE OPEN, IF * NOT OK THEN EXIT PROGRAM * IF COMPCODE NOT = MQCC-OK THEN GO TO OPEN-TOPIC-ERROR-EXIT.
MOVE MQMI-NONE TO MQMD-MSGID. MOVE MQCI-NONE TO MQMD-CORRELID. MOVE MQPER-PERSISTENT TO MQMD-PERSISTENCE. COMPUTE MQPMO-OPTIONS = MQPMO-NO-SYNCPOINT + MQPMO-NEW-MSG-ID +
242 High Availability in WebSphere Messaging Solutions

MQPMO-NEW-CORREL-ID + MQPMO-FAIL-IF-QUIESCING. MOVE LENGTH OF PUBLISH-MESSAGE TO BUFFLEN. MOVE TOPIC-NAME TO PM-TOPIC. PERFORM PUBLISH-LOOP THRU PUBLISH-LOOP-EXIT UNTIL NUMPUBS IS EQUAL TO PUB-LOOP-CONTROL. * * * OPEN THE STATUS QUEUE * MOVE MQOT-Q TO MQOD-OBJECTTYPE. MOVE STATUS-QUEUE-NAME TO MQOD-OBJECTNAME. * COMPUTE OPENOPTIONS-STATUS = MQOO-OUTPUT + MQOO-FAIL-IF-QUIESCING. * CALL 'MQOPEN' USING HCONN MQOD OPENOPTIONS-STATUS HOBJ-PUB-STATUS COMPCODE REASON. * * TEST THE OUTPUT FROM THE OPEN, IF * NOT OK THEN EXIT PROGRAM * IF COMPCODE NOT = MQCC-OK THEN GO TO OPEN-STAT-ERROR-EXIT. MOVE MQMI-NONE TO MQMD-MSGID. MOVE MQCI-NONE TO MQMD-CORRELID. COMPUTE MQPMO-OPTIONS = MQPMO-NO-SYNCPOINT + MQPMO-NEW-MSG-ID + MQPMO-NEW-CORREL-ID + MQPMO-FAIL-IF-QUIESCING. COMPUTE SM-NUMBER = PUB-LOOP-CONTROL. MOVE TOPIC-NAME TO SM-TOPIC. MOVE LENGTH OF STATUS-MESSAGE TO BUFFLEN. CALL 'MQPUT' USING HCONN HOBJ-PUB-STATUS MQMD MQPMO BUFFLEN STATUS-MESSAGE COMPCODE REASON.
Appendix A. QPUB Transaction 243

GO TO A-CLOSE-QUEUE. * OPEN-PC-ERROR-EXIT. MOVE 'QPU1' TO ABEND-CODE. GO TO ALL-ABENDS. OPEN-TOPIC-ERROR-EXIT. MOVE 'QPU2' TO ABEND-CODE. GO TO ALL-ABENDS. MQGET-PC-ERROR-EXIT. MOVE 'QPU3' TO ABEND-CODE. GO TO ALL-ABENDS. OPEN-STAT-ERROR-EXIT. MOVE 'QPU4' TO ABEND-CODE. GO TO ALL-ABENDS. ALL-ABENDS. EXEC CICS ABEND ABCODE(ABEND-CODE) NODUMP END-EXEC. GO TO A-MAIN-EXIT. A-CLOSE-QUEUE. PERFORM CLOSE-QUEUES. A-MAIN-EXIT. * * RETURN TO CICS * EXEC CICS RETURN END-EXEC. * GOBACK. EJECT PUBLISH-LOOP SECTION. * ADD +1 TO NUMPUBS. COMPUTE PM-NUMBER = NUMPUBS. CALL 'MQPUT' USING HCONN HOBJ-PUB-MSGS MQMD MQPMO BUFFLEN PUBLISH-MESSAGE COMPCODE REASON. PUBLISH-LOOP-EXIT. EXIT. * * RETURN TO PERFORMING SECTION *
244 High Availability in WebSphere Messaging Solutions

EJECT CLOSE-QUEUES SECTION. * ------------------------------------------------------------- * * * * THIS SECTION CLOSES THE OUTPUT AND INPUT QUEUES * * * * ------------------------------------------------------------ * * CALL 'MQCLOSE' USING HCONN HOBJ-PUB-CONTROL MQCO-NONE COMPCODE REASON. * CALL 'MQCLOSE' USING HCONN HOBJ-PUB-MSGS MQCO-NONE COMPCODE * CALL 'MQCLOSE' USING HCONN HOBJ-PUB-STATUS MQCO-NONE COMPCODE REASON. * CLOSE-QUEUES-EXIT. EXIT. * * RETURN TO PERFORMING SECTION * EJECT * * ------------------------------------------------------------- * MQ-ERROR SECTION. * MQ-ERROR-EXIT. * * RETURN TO PERFORMING SECTION * EXIT. EJECT * * ------------------------------------------------------------- * * * ------------------------------------------------------------- * * END OF PROGRAM * * ------------------------------------------------------------- *
Appendix A. QPUB Transaction 245

246 High Availability in WebSphere Messaging Solutions

Related publications
The publications listed in this section are considered particularly suitable for a more detailed discussion of the topics covered in this book.
IBM Redbooks
For information about ordering these publications, see “How to get Redbooks” on page 248. Note that a few of the documents referenced here might be available in softcopy only.
� Parallel Sysplex Application Considerations, SG24-6523
� High Availability z/OS Solutions for WebSphere Business Integration Message Broker V5, REDP-3894
� TCP/IP in a Sysplex, SG24-5235
� WebSphere Application Server Network Deployment V6: High Availability Solutions, SG24-6688
Other publications
These publications are also relevant as further information sources:
� Setting Up a Sysplex, SA22-7625� RMF Report Analysis, SC33-7991.
© Copyright IBM Corp. 2010. All rights reserved. 247
Online resources
These Web sites are also relevant as further information sources:
� HACMP library
http://www.ibm.com/servers/eserver/pseries/library/hacmp_docs.html
� IBM Tivoli System Automation for Multiplatforms Guide and Reference
http://publib.boulder.ibm.com/tividd/td/ITSAFL/SC33-8210-03/en_US/PDF/halgre11.pdf
� IBM Smart Business: Cloud Computing
http://www.ibm.com/ibm/cloud/
� SOAP nodes in IBM WebSphere Message Broker V6.1, Part 1: SOAP node basics
http://www.ibm.com/developerworks/webservices/library/ws-soapnode/
How to get Redbooks
You can search for, view, or download Redbooks, Redpapers, Technotes, draft publications and Additional materials, as well as order hardcopy Redbooks publications, at this Web site:
ibm.com/redbooks
Help from IBM
IBM Support and downloads
ibm.com/support
IBM Global Services
ibm.com/services
248 High Availability in WebSphere Messaging Solutions

(0.2”spine)0.17”<
->0.473”
90<->
249 pages
High Availability in WebSphere M
essaging Solutions


®
SG24-7839-00 0738434264
INTERNATIONAL TECHNICALSUPPORTORGANIZATION
BUILDING TECHNICALINFORMATION BASED ONPRACTICAL EXPERIENCE
IBM Redbooks are developed by the IBM International Technical Support Organization. Experts from IBM, Customers and Partners from around the world create timely technical information based on realistic scenarios. Specific recommendations are provided to help you implement IT solutions more effectively in your environment.
For more information:ibm.com/redbooks
®
High Availability in WebSphere Messaging Solutions
Design solutions for high availability
Use WebSphere features to increase availability
Use PowerHA clusters to increase availability
This IBM Redbooks publication is for anyone needing to increase WebSphere messaging availability, especially people interested in the new capabilities of WebSphere MQ and WebSphere Message Broker. It discusses and demonstrates solutions to provide high availability for WebSphere Messaging solutions. For the distributed platforms, this ranges from the traditional PowerHA for AIX to the new WebSphere MQ multi-instance queue managers and WebSphere Message Broker multi-instance brokers. For the appliance users, we included solutions for WebSphere DataPower. For enterprises that need continuous availability of WebSphere MQ messages, MQ Queue Sharing Groups and the CICS Group Attach features are demonstrated.
The book includes guidance on HA options, such as when you might need PowerHA (or a similar solution for your platform), when the multi-instance features work for your applications, and when duplexing the coupling facility structures might be appropriate.
Back cover