high co levels cause skeletal muscle atrophy via ampk, … · high co2 levels cause skeletal muscle...
TRANSCRIPT
Hypercapnia leads to skeletal muscle atrophy
1
High CO2 levels cause skeletal muscle atrophy via AMPK, FoxO3a and muscle-specific ring finger protein1 (MuRF1)
Ariel Jaitovich1*, Martín Angulo1,2*, Emilia Lecuona1*, Laura A. Dada1, Lynn C. Welch1, Yuan Cheng1,
Galina Gusarova1#, Ermelinda Ceco1, Chang Liu3, Masahiko Shigemura1, Esther Barreiro4,5, Cam Patterson6, Gustavo A. Nader3, and Jacob I. Sznajder1∞.
Authors affiliations: 1Division of Pulmonary and Critical Care Medicine, Northwestern University, Chicago, IL,
USA; 2Departamento de Fisiopatología, Facultad de Medicina, Universidad de la República, Montevideo, Uruguay; 3Department of Physiology and Pharmacology, Karolinska Institute, Stockholm, Sweden; 4Pulmonology
Department-URMAR, IMIM-Hospital del Mar-IMIM, CEXS, Universitat Pompeu Fabra, PRBB, Barcelona, Spain and 5Centro de Investigación en Red de Enfermedades Respiratorias (CIBERES), Instituto de Salud Carlos
III (ISCIII), Madrid, Spain; 6McAllister Heart Institute, University of North Carolina, Chapel Hill, NC, USA.
*Authors contributed equally to this work.
#Present Address: Lung Biology Laboratory, Division of Pulmonary, Allergy and Critical Care Medicine, Columbia University Medical Center, New York, NY, USA.
Running title: Hypercapnia leads to skeletal muscle atrophy
∞To whom the correspondence should be addressed: Jacob I. Sznajder, M.D. Division of Pulmonary and Critical Care Medicine, Northwestern University, Chicago, IL, USA, Phone (312) 908-7737; Fax (312) 908-4650; email: [email protected] Keywords: Carbon dioxide (CO2); AMP‐activated kinase (AMPK), FoxO3a, muscle atrophy, ubiquitin ligase, hypercapnia, MuRF1. Background: CO2 retention and skeletal muscle atrophy occur in patients with lung diseases and are associated with poor clinical outcomes. Results: Hypercapnia leads to AMPK/FoxO3a/MuRF1-dependent muscle fiber size reduction. Conclusion: Hypercapnia activates a signaling pathway leading to skeletal muscle atrophy. Significance: High CO2 levels directly activate a proteolytic program of skeletal muscle atrophy which is of relevance to patients with lung diseases.
ABSTRACT: Patients with chronic obstructive pulmonary disease (COPD), acute lung injury and critical care illness may develop hypercapnia. Many of these patients often have muscle dysfunction which increases morbidity and impairs their quality of life. Here, we investigated whether hypercapnia leads to skeletal muscle atrophy. Mice exposed to high CO2 had decreased skeletal muscle wet weight, fiber diameter, and strength. Cultured myotubes
exposed to high CO2 had reduced fiber diameter, protein/DNA ratio and anabolic capacity. High CO2 induced the expression of MuRF1 in vivo and in vitro, while MuRF1-/- mice exposed to high CO2 did not develop muscle atrophy. AMPK, a metabolic sensor, was activated in myotubes exposed to high CO2 and loss-of-function studies showed that AMPK-α2 isoform is necessary for MuRF1 up-regulation and myofiber size reduction. High CO2 induced AMPK-α2 activation, triggering the phosphorylation and nuclear translocation of FoxO3a, and leading to an increase in MuRF1 expression and myotube atrophy. Accordingly, we provide evidence that high CO2 activates skeletal muscle atrophy via AMPKα2-FoxO3a-MuRF1, which is of biological and potentially clinical significance in patients with lung diseases and hypercapnia. Hypercapnia, or elevation of blood CO2 levels, occurs in patients with respiratory diseases such as
http://www.jbc.org/cgi/doi/10.1074/jbc.M114.625715The latest version is at JBC Papers in Press. Published on February 17, 2015 as Manuscript M114.625715
Copyright 2015 by The American Society for Biochemistry and Molecular Biology, Inc.
by guest on Novem
ber 9, 2018http://w
ww
.jbc.org/D
ownloaded from

Hypercapnia leads to skeletal muscle atrophy
2
chronic obstructive pulmonary disease (COPD), where it is associated with worse clinical outcomes (1-4). Recent reports suggest that high CO2 levels can activate signaling pathways that, independently of pH, have deleterious effects on the lung, impair innate immune response and the ability to fight infectious processes (5-11). Patients with respiratory diseases develop muscle atrophy, which negatively affects their quality of life (12-14). During muscle atrophy, proteolytic systems are activated, and contractile proteins and organelles are degraded causing shrinkage of muscle fibers (15-17). The increased expression of the muscle-specific ubiquitin-E3 ligases muscle RING finger 1 (MuRF1) and the muscle atrophy F-box (atrogin-1/MAFbx) have been described in several models of muscle atrophy (18,19), and their inactivation in mice attenuates muscle atrophy induced by denervation and dexamethasone (20-22). AMP-activated protein kinase (AMPK) is a metabolic sensor that is activated in response to cellular stress (23). The mammalian AMPK is a heterotrimeric enzyme complex with a catalytic subunit (α) and regulatory subunits (β and ɣ). The phosphorylation by upstream kinases of a conserved threonine residue (Thr172) within the kinase domain of the α-catalytic subunit is required for AMPK activation (23). Recently AMPK has been implicated in the control of muscle mass by increasing protein degradation through the ubiquitin proteasome system and autophagy (24). AMPK activation was reported to regulate myofibrillar protein degradation through the transcription factor FoxO (25). Here we describe that hypercapnia, by activating AMPK, leads to phosphorylation and nuclear translocation of FoxO3a and MuRF1 up-regulation, which results in skeletal muscle atrophy. EXPERIMENTAL PROCEDURES Reagents-All cell culture reagents were from Corning Life Sciences (Tewksbury, MA). HRP-conjugated goat anti-mouse secondary antibody was from Bio-Rad (Hercules, CA), and GAPDH and HRP-conjugated goat anti-rabbit antibody were from Cell Signaling Technology (Danvers, MA). All other chemicals were purchased from EMD Millipore (Billerica, MA) or Sigma-Aldrich (St. Louis, MO). Reagents for production of cDNA and quantitative real time PCR (qPCR) were from Bio-Rad and Life Technologies (Carlsbad, CA). The DNA and mRNA isolation kits were from Qiagen (Germantown, MD). Primers were purchased from Integrated DNA Technologies
(Coralville, IA). Restriction endonucleases were obtained from Promega (Madison, WI). Animals-Adult (14-16 weeks old) male C57Bl/6 mice were obtained from the Jackson Laboratories (Bar Harbor, ME), and age-matched male MuRF1-/- mice and wild-type littermates (MuRF1+/+) on a 129S/C57Bl/6 background have been described elsewhere (20,26). For arterial blood gases measurements, C57BL/6 mice with a common carotid artery catheter were purchased from Charles Rivers Laboratories (Wilmington, MA). All animals were provided with food and water ad libitum, maintained on a 14-h light/10-h dark cycle, and handled according to NIH guidelines. All of the procedures involving animals were approved by the Northwestern University Institutional Animal Care and Use Committee. For high CO2 exposure, animals were maintained in a hypercapnia chamber (BioSpherix Ltd., Lacona, NY) for 3, 7, 14, or 21 days. The chamber’s atmosphere was continuously monitored and adjusted with ProOx/ProCO2 controllers (BioSpherix Ltd) in order to maintain 10% CO2 and 21% O2, with a temperature of 20-26°C and a relative humidity between 40% and 50%. These settings resulted in an arterial partial pressure of carbon dioxide (PaCO2) of ~75 mmHg and arterial partial pressure of oxygen (PaO2) of ~100 mmHg, whereas in animals maintained in room air paCO2 was ~40 mmHg and paO2 was ~100 mmHg (7,27). None of the animals developed appreciable distress. At selected time-points animals were anesthetized with Euthasol (pentobarbital sodium/phenytoin sodium), soleus, gastrocnemius and tibialis anterior muscles were excised, blotted dry and weighed. Muscles were then either frozen in liquid nitrogen-cooled isopentane for cryosectioning or snap-frozen in liquid nitrogen for protein, RNA or DNA extraction. Arterial Blood Gases-Arterial blood gases (ABGs) were obtained from unanesthetized, restrained mice with surgically implanted carotid artery catheters. Mice were allowed to adapt for 1 to 2 days after shipping before being placed in the hypercapnia chamber and before any ABGs were drawn. Arterial blood was analyzed for pH, PaCO2, PaO2, and HCO3-, using a pHOx Plus Blood Gas Analyzer (Nova Biomedical, Waltham, MA) that was calibrated daily. Immunohistochemistry, and fiber size and type assessment-Soleus, gastrocnemius and tibialis anterior serial transverse cryosections (8 μm) were obtained and mounted on glass slides. Sections were fixed in 4% formaldehyde, permeabilized, and blocked.
by guest on Novem
ber 9, 2018http://w
ww
.jbc.org/D
ownloaded from

Hypercapnia leads to skeletal muscle atrophy
3
Immunostaining was performed with laminin primary antibody (1:50 dilution; Sigma) followed by Alexa Fluor 568-conjugated secondary antibody (1:200 dilution; Life Technologies). Type I fibers were stained with anti-type I myosin heavy chain (A4.840, 1:50 dilution, DSHB, Iowa City, IA), and type II were stained with anti-myosin (Skeletal, Fast)-Alkaline Phosphatase (Sigma). Images were acquired with a Zeiss LSM 510 confocal microscope using a 40X objective (Center for Advanced Microscopy, Northwestern University) and analyzed using Zeiss LSM5 Image Browser software. Fiber size was studied by measuring the fibers’ minimal inner diameter (at least 100 fibers per muscle), defined as the minimum diameter from inner border to inner border, passing through the center of the muscle fiber. This parameter has been shown to be very insensitive to deviations from the ‘optimal’ cross-sectioning profile, as compared to direct measure of fiber cross-sectional area (28). CSA was calculated using this diameter, and results were expressed as mean CSA ± SEM and as percentage of fibers distributed by size. Grip strength test-Forelimb skeletal muscle strength was assessed using a digital grip strength meter (Columbus Instruments, Columbus, OH), as described (29). Grip strength was measured in each animal 6 successive times, and the average of the highest 4 values for each mouse was used. Cell culture, adenoviral infection, and myotube analysis-C2C12 mouse myoblasts (ATCC, CRL1772) were cultured and differentiated as described elsewhere (30). In brief, cells were allowed to grow in p60 plates until they reach ~90-95% confluence and then culture media was changed to pre-warmed 2% horse serum DMEM (differentiation media). The differentiation media was renewed every 18-24h and cells were allowed to differentiate for 4-6 days. The FoxO3 mutant bearing six serine-to-alanine mutations on AMPK phosphorylation sites was generously provided by Dr. Anne Brunet (Department of Genetics, Stanford University, CA) (31). The sequence was confirmed by traditional sequencing and the construct was incorporated into an adenoviral vector (Ad-FoxO3a-6A, Vector BioLabs, Malvern, PA). Commercially available wild-type FoxO3-containing adenovirus vector (Ad-FoxO3a-WT, Vector BioLabs) was used as a control. For infection, myotubes were incubated with the corresponding adenovirus at six plaque-forming units per cell for 24 h. Images were acquired using a Nikon Eclipse TE2000-U inverted scope with a 40X objective. Myotube diameters were
quantified by measuring ~160 tube diameters (5-10 measurements per fiber) from five random fields using MetaMorph Software (Molecular Devices, Sunnyvale, CA). CO2 Medium and CO2 Exposure-For the different experimental conditions, initial solutions were prepared with DMEM/F-12/Tris base/MOPS (3:1:0.25:0.25) containing 2% horse serum, 100 units/ml penicillin, and 100 µg/ml streptomycin. The buffering capacity of the medium was modified by changing its initial pH with Tris base and MOPS to obtain a pH of 7.4 at the various CO2 levels (pCO2 40, 60, and 120 mm Hg). The desired CO2 and pH levels were achieved by equilibrating the medium overnight in a humidified chamber (C-Chamber, BioSpherix Ltd.). The atmosphere of the C-Chamber was controlled with a ProCO2 carbon dioxide controller (BioSpherix Ltd.). In this chamber, cells were exposed to the desired pCO2 while maintaining 21% O2 balanced with N2. Prior to and after CO2 exposure, pH, pCO2, and pO2 levels in the medium were measured using a Stat Profile pHOx blood gas analyzer (Nova Biomedical Corporation). Experiments were started by replacing the culture medium with the CO2-equilibrated medium and incubating in the C-Chamber for the desired time. Transfection of C2C12 cells with siRNA-After three days of differentiation, media was removed from C2C12 cells and replaced with antibiotic-free-differentiation media and transfection was performed after 12h. Before transfection, C2C12 myotubes were washed twice with DMEM and transfected with mouse AMPK α1 and 2, FoxO3a and MuRF1 siRNA duplexes (100 pmol) from Santa Cruz Biotechnology (Santa Cruz, CA), by using Lipofectamine RNAiMAX (Life Technologies) according to the manufacturer’s recommended protocol. Cells were incubated with the RNA-Lipofectamine complexes for 4-6 h at 37°C. After this period, the transfection complex was supplemented with differentiation media up to 3 ml, and experiments were performed 48 h later. A scrambled siRNA was used as a control (Life Technologies). Western Blot Analysis-C2C12 myotubes were homogenized in Lysis Buffer (Cell Signaling Technology). Muscle samples were homogenized on ice with cold lysis buffer, in a 10-fold (wt/wt) excess of lysis buffer (pH 7.6) that contained 8.7 mM NaH2PO4, 58 mM Na2HPO4, 144 mM NaCl, 1% NP-40, 0.5% sodium deoxycholate, 0.1% SDS, and 1× protease inhibitor cocktail (Roche, Basel, Switzerland)
by guest on Novem
ber 9, 2018http://w
ww
.jbc.org/D
ownloaded from

Hypercapnia leads to skeletal muscle atrophy
4
as previously described (32), using a Polytron PT 10-35 homogenizer (Thermo Scientific, Waltham, MA). Samples were centrifuged at 22,000 g for 10 minutes at 4°C, and after 2 spins the final supernatant was collected. Protein concentrations were determined by the BCA assay (Thermo Scientific Pierce Protein Biology Products, Rockford, IL). Proteins were separated by SDS-PAGE, transferred to nitrocellulose membranes, immunoblotted and visualized by chemiluminescence following the manufacturer’s instructions (Perkin Elmer Life Sciences, Waltham, MA). The following commercially available antibodies and dilutions were used for Western blotting: rabbit anti-pAMPKα (T172), anti-AMPKα, anti-pACC (S79), anti-ACC, anti-GAPDH and anti-FoxO3a were from Cell Signaling Technology and used at 1:1,000; rabbit anti-actin (1:2000) was from Sigma-Aldrich; rabbit anti-MuRF1 (1:1000) was from ECM Biosciences (Versailles, KY); rabbit anti AMPKα1 (1:1000) was from EMD Millipore; rabbit AMPKα2 (1:1000) was from Novus Biologicals (Littleton, CO) and rabbit anti-Pol II (1:200) was from Santa Cruz Biotechnology. Rabbit anti pFoxO3 (S-588) was generously gifted by Dr. Anne Brunet and used at a dilution of 1:500. Primary antibodies were detected with horseradish peroxidase-conjugated secondary antibodies. Quantification of protein levels was performed by densitometric scanning with ImageJ 1.29X (NIH). Immunoprecipitation-C2C12 cells were differentiated for 4 days and then transfected with Ad-Foxo3a-6A mutant or with wild-type FoxO3a-containing adenovirus. Cell lysates were prepared and aliquots containing 1000 µg of protein were rotated overnight at 4°C with FoxO3a antibody (1:200) or control IgG in the presence of 40 µl protein A/G agarose beads (Santa Cruz Biotechnology). Samples were then centrifuged and the beads were resuspended in SDS-loading buffer and separated in a 10% polyacrylamide gel. RNA extraction, cDNA synthesis, and quantitative RT-PCR-Quantification of ribosomal DNA transcription was done as previously described (33). Muscle RNA was extracted using Trizol reagent (Life Technologies). Total RNA determined spectrophotometrically using a Nanodrop ND-1000 (Saveen & Werner, Limhamnsvägen, Sweden) at 260 nm, and quality assessed visually using agarose gel electrophoresis. cDNA was synthesized using Superscript VILO cDNA synthesis kit (Life Technologies). Quantitative RT-PCR was performed
using GoTaq qPCR Master Mix (Promega) on a CFX384 Real-Time PCR Detection System (Bio-Rad). The primers used were: Forward: 5'-CCA AGT GTT CAT GCC ACG TG-3'; and Reverse: 5'-CGA GCG ACT GCC ACA AAA A-3'. Each sample was run in triplicate and relative expression levels of transcripts of interest were calculated using the comparative Ct (ΔΔCt) method with glyceraldehyde-3-phosphate dehydrogenase as housekeeping gene. Data was analyzed using the Bio-Rad CFX manager software (version 2.0). Centralized nuclei analysis-Eight µm frozen soleus muscle sections were stained with hematoxylin and eosin (H&E) and histological images were acquired at 40X magnification, using the Zeiss Axioskop upright brightfield microscope with CRi NUANCE spectral camera. Low magnification (10X) images that captured the entire soleus muscle in cross-section were used to count the centralized/internal nuclei. The total number of fibers counted in each cross section was between 600 -700. The total number of myofibers counted was similar between all the mice analyzed. Evaluation of FoxO3 nuclear translocation-C2C12 myotubes were harvested and then nuclear/cytosol-fractionation was performed with a commercially available kit (BioVision, Milpitas, CA), according to the manufacturer’s instructions. The nuclear fraction was then sampled and proteins were separated by sodium dodecyl sulfate polyacrylamide gel electrophoresis (SDS-PAGE), transferred to nitrocellulose membranes, and immunoblotted with anti-FoxO3a antibody. To assess the phosphorylation of FoxO3a in the nuclear fraction, we transfected C2C12 with Ad-FoxO3a-WT and after 24h cells were exposed to high CO2 for 4h and the nuclear fractions isolated. FoxO3a was immunoprecipitated from the nuclear fraction and phosphorylation was assessed by Western blot with the phospho-Ser-588 antibody. Protein/DNA ratio determination-C2C12 myotubes were exposed to high CO2 levels for 24h, and then samples were homogenized by sonication (Branson Sonifier 250). The total amount of protein was measured with a Bradford assay and total DNA was measured with the fluorochrome Hoechst 33258, both from Bio-Rad, in a Fluoroskan Ascent FL Microplate Fluorometer (Thermo Scientific). Statistics-Data are expressed as mean ± SEM. When comparisons were performed between two groups, significance was evaluated by the Student t test, and when more than two groups were compared, ANOVA was used followed by the Dunnett test, using
by guest on Novem
ber 9, 2018http://w
ww
.jbc.org/D
ownloaded from
Hypercapnia leads to skeletal muscle atrophy
5
GraphPad Prism software. Results were considered significant when p<0.05. RESULTS Hypercapnia causes skeletal muscle atrophy in mice. To investigate whether high CO2 causes muscle atrophy, mice were exposed to 10% CO2 and 21% O2
(hypercapnia) or to room air (normocapnia) and skeletal muscle wet weight, fibers CSA, and grip strength were assessed; and arterial blood gases were measured (Table 1). Also, mice breathing high CO2 had decreased soleus muscle wet weight as compared with room air-breathing mice (Fig. 1A). Figure 1B (upper panel) shows images of laminin-stained soleus cryosections which quantitative analysis indicated a decrease in CSA during hypercapnia (Fig 1C). In agreement with these findings, Figure 1B lower panel shows a leftward shift in the size distribution histogram indicating a predominance of thinner fibers in muscles from hypercapnic mice. Muscle strength was also decreased in mice exposed to high CO2, as assessed by the grip strength method (Fig. 1D). Soleus muscles are composed by muscle fiber type I and II. We did not observe a change in the soleus’ fiber composition or a predominant fiber’s type atrophy with both type of fibers decreasing their CSA by approximately 20-25% which is consistent with the data in Fig. 1C (Fig.1E and 1F). The atrophic effect induced by hypercapnia on the soleus muscle was also observed in the gastrocnemius and tibialis anterior (Fig. 2A and B) from mice exposed to CO2 for 14 and 21 days, suggesting that the decrease in fiber’s size caused by hypercapnia is a generalized effect. Also, soleus muscle from hypercapnic mice displayed a time-dependent increase in myonuclear centralization respective to the total number of fibers (Fig. 3), likely representing tissue response to injury (34). Moreover, the data show that at 21 days there was a significant increase in the percentage of fibers with centralized nuclei (1.007±.227 vs 3.007±.009 p≤0.01 n=3). High CO2 leads to decreased myotube diameter, protein abundance and down-regulation of anabolic genes. C2C12 myotubes exposed to increasing levels of CO2 became progressively thinner (Fig. 4A), with significant differences observed after 24 h of exposure (Fig. 4B). Therefore, all the subsequent in vitro experiments were performed at 24 h and 120 mmHg (designated as “hypercapnia”) as we observed the highest effect at this level. To further explore the effect of hypercapnia on myotube diameter, we
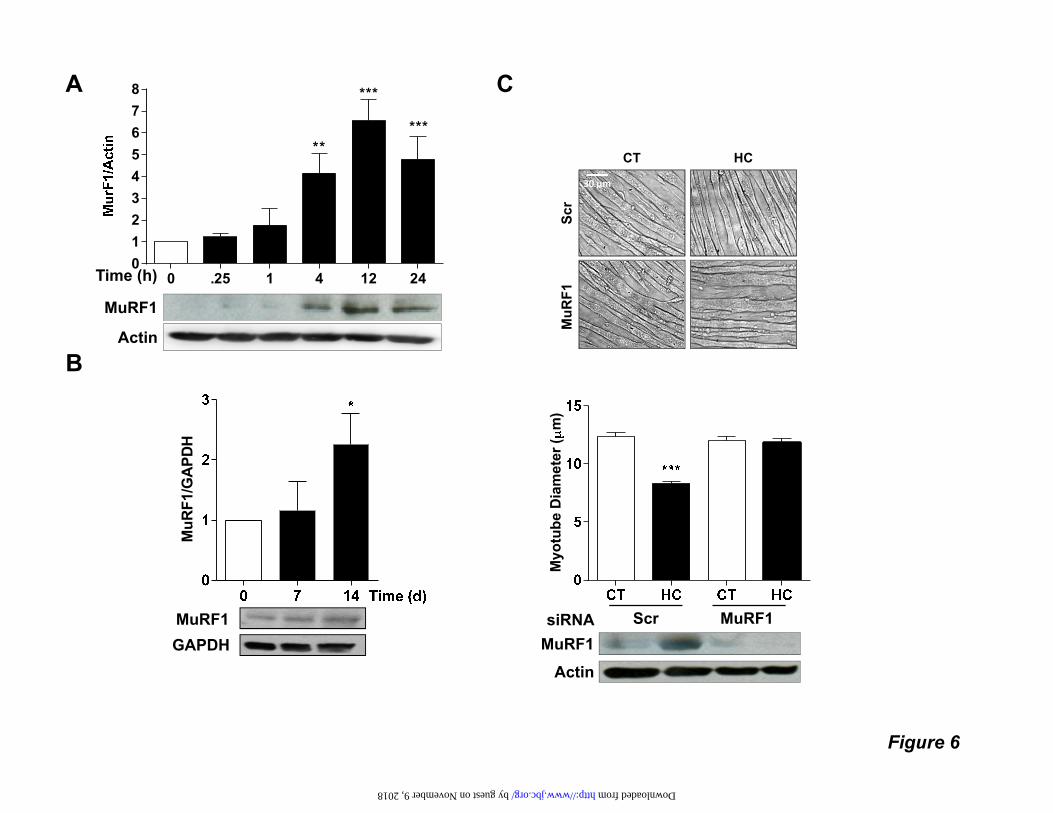
measured total protein content (protein/DNA ratio) and observed that myotubes exposed to hypercapnia had lower protein content at 24 h (Fig. 4C). We also found a time-dependent decrease in the expression of the 45S pre-rRNA transcripts, a marker of de novo RNA synthesis (Fig. 4D). MuRF1 mediates the high CO2-induced myotube atrophy. To determine whether the ubiquitin proteasome system was involved in high CO2-induced skeletal muscle atrophy, we treated myotubes with the proteasome inhibitor MG-132 (10 µM for 12 h) or the ubiquitin-conjugating enzyme inhibitor (UBE1; 10 µM for 12 h) and exposed them to hypercapnia. Dexamethasone (10 µM) was used as a positive control of UPS-mediated muscle atrophy (21). As shown in Fig 5, MG-132 and UBE1 prevented the hypercapnia-induced reduction in myotube diameter and the effect of dexamethasone (a positive control) was prevented with MG-132. We assessed MuRF1 expression in myotubes and soleus muscle from mice exposed to hypercapnia and found significant increases in MuRF1 expression in myotubes (Fig. 6A) and in soleus muscle (Fig. 6B). To determine whether MuRF1 is required for hypercapnia-induced myotube atrophy, we transfected differentiated myotubes with MuRF1 small interfering RNA (siRNA) and found that silencing MuRF1 had a protective effect against hypercapnia-induced myotube atrophy (Fig. 6C). To validate these findings and assess the role of MuRF1 in vivo, we exposed MuRF1-/- mice to high CO2 for 21 days and found that the absence of MuRF1 prevented the reduction in muscle strength (Fig. 7A), decrease in soleus mean fiber CSA (Fig. 7B), and the leftward shift in fiber size distribution observed in MuRF1+/+mice (Fig. 7C). Hypercapnia causes muscle atrophy via AMPK-dependent pathway. Exposure of myotubes to hypercapnia led to an increase in both AMPK and its target acetyl-CoA carboxylase (ACC) phosphorylation, which occurred as early as 15 min and lasted for at least 24 h (Fig. 8A). AMPK has recently been shown to mediate skeletal muscle protein degradation via atrogin-1 and MuRF1 (25,35). To determine whether AMPK is a necessary mediator of high CO2-induced muscle atrophy, myotubes were transfected with scrambled or specific AMPKα1 or α2 siRNA. We found that AMPKα2, but not AMPKα1, was necessary for CO2-induced decrease in myotube diameter (Fig. 8B). Furthermore, we also found that high CO2-driven up-regulation of MuRF1 is mediated by AMPKα2, as MuRF1 induction was abrogated in
by guest on Novem
ber 9, 2018http://w
ww
.jbc.org/D
ownloaded from

Hypercapnia leads to skeletal muscle atrophy
6
high CO2-exposed cells transfected with AMPKα2 siRNA (Fig. 8C). Hypercapnia causes AMPKα2-dependent FoxO3a nuclear translocation, which is needed for MuRF1 up-regulation and reduction in myotube diameter. As shown in Fig. 9A, hypercapnia led to FoxO3a nuclear translocation, which was prevented by silencing AMPKα2 but not AMPKα1 (Fig. 9B). Moreover, transfection of myotubes with scrambled or specific FoxO3a siRNA revealed that silencing FoxO3a prevented the high CO2-induced up-regulation of MuRF1 and the decrease in myotube diameter (Fig. 9C and 9D). AMPK phosphorylates FoxO3a which regulates MuRF1 during hypercapnia-induced reduction in myotube diameter. It has been reported that AMPK regulates FoxO3a phosphorylation (31,36) and that it directly phosphorylates FoxO3a and that mutation of Thr-179, Ser-399, Ser-413, Ser-555, Ser-588, and Ser-626 to alanine (FoxO3a-6A) results in a reduction of AMPK-dependent phosphorylation of FoxO3a (31). To assess whether hypercapnia leads to AMPK-dependent phosphorylation of FoxO3a, myotubes were transfected with an adenovirus coding for FoxO3a wild type (Ad-FoxO3a-WT) or mutated at the six AMPK phosphorylation sites. After FoxO3a immunoprecipitation, Western blots probed with an antibody that specifically recognizes pSer-588, but does not recognize the non-phosphorylated form (31), showed that high CO2 levels increased Ser-588 phosphorylation only in FoxO3a-WT (Fig. 10A).Moreover, the phosphorylated form of FoxO3a is present in the nuclei (Fig. 10B). Overexpression of Ad-FoxO3a-6A prevented the high CO2-induced up-regulation of MuRF1 (Fig. 10C) and the decrease in myotube diameter (Fig. 10D), indicating that hypercapnia leads to AMPK-dependent phosphorylation of FoxO3a, which is necessary to up-regulate MuRF1 expression and decrease myotube diameter. DISCUSSION Muscle atrophy is being increasingly recognized as a major contributor to worse clinical outcomes in patients with pulmonary diseases (4,37,38), and indeed recovery of lower limbs muscle mass of COPD patients in the setting of pulmonary rehabilitation has proven to be beneficial (39). Muscle atrophy is characterized by a decrease in muscle fiber diameter, protein content and force production (24). We report here that hypercapnia, which occurs in patients with
chronic respiratory diseases, causes skeletal muscle atrophy. It has been reported that tobacco smoke, which is rich in CO2 and causes COPD, is also associated to muscle dysfunction even in early stages of lung disease (40).We observed that animals exposed to high CO2 had high PaCO2 and also, with time, higher bicarbonate values (Table 1), reflecting renal compensation of the respiratory acidosis. We found that exposing mice to high CO2 levels similar to those observed in hypercapnic patients with COPD (41) leads to muscle atrophy as evidenced by a progressive decrease in muscle mass, fibers cross-sectional area, and limb grip strength. Hypercapnia did not cause selective fiber type atrophy in the soleus muscle nor a switch from slow-twitch to fast-twitch fibers, however, the antibody used in the study does not distinguish among the different type II fibers, thus, a switch from type IIa to IIb cannot be excluded (see Fig.1E and 1F). We show that high CO2 results in more centralized nuclei in the soleus muscle (Fig. 3), which represents a tissue response to myofiber injury (34). Although skeletal muscle atrophy has not classically been associated to cellular damage and repair but to an imbalance of protein turnover, a recent study shows that cancer-associated muscle atrophy is characterized by cellular injury and repair with activation and proliferation of satellite cells (42). Therefore, our finding of nuclear centralization could similarly suggest myofibers’ response to high CO2-mediated injury. Cultured myotubes exposed to high CO2 levels undergo a dose- and time-dependent atrophy which was prevented by MG-132 and UBE1, suggesting a role for the UPS in this process. The UPS has been described to regulate skeletal muscle atrophy in patients with chronic lung diseases (43-46). In addition, there have been reports of skeletal muscle atrophy via the UPS during acute lung injury and in patients with pulmonary vascular disease (47-49). Our data suggest a direct link between hypercapnia and muscle atrophy via the UPS in this process. Moreover, we found that hypercapnia in vivo and in vitro increases the expression of MuRF1 (Fig 6A and 6B), while we did not find an increase in Atrogin-1 (data not shown). AMPK has been reported to play a role in skeletal muscle atrophy (23). We observed that the hypercapnia-dependent activation of AMPK in cultured myotubes occurs very early during high CO2 exposure and persists for at least 24 h. Previous evidence suggest that AMPK mediates muscle
by guest on Novem
ber 9, 2018http://w
ww
.jbc.org/D
ownloaded from

Hypercapnia leads to skeletal muscle atrophy
7
catabolism through increased expression of FoxO transcription factors (50), and AICAR-induced AMPK activation of atrogin-1 and MuRF1 (25). Also, up-regulation of AMPK, along with an increase ubiquitin-protein conjugates and MuRF1 gene transcription has been reported in skeletal muscles of patients with COPD (51). We found that hypercapnia-driven muscle atrophy is mediated by AMPKα2, which is the major catalytic subunit isoform in muscle (23). Previous evidence from lung alveolar epithelial cells suggest that CO2-mediated AMPKα1 phosphorylation occurs through Ca2+/calmodulin-dependent kinase kinase-beta (CaMKK-β) (27) making this pathway a possible activator of AMPK in the present model. Alternatively, given that CO2 exposure was found to cause mitochondrial dysfunction, decreased O2 consumption and ATP production in fibroblasts and alveolar epithelial cells (52), AMPK activation could also occur via LKB1. Interestingly, it has been reported that AMPKα2 activity is more dependent on high AMP levels than the α1 isoform (53), making CO2-driven mitochondrial dysfunction an interesting potential upstream activator of AMPK, which should be further addressed in future works. Other mechanisms such as inhibition of protein phosphatases or activation of a different upstream kinase could also be relevant in the present model (54). We also found that hypercapnia decreased the expression of 45S pre-rRNA, which is the precursor of the ribosomal RNA components 28S, 18S and 5.8S. Increased transcription of the 45S pre-rRNA is one of the earliest events in muscle hypertrophy (33,55) and its expression is rapidly down-regulated in atrophying skeletal muscle, indicating a reduction in the anabolic capacity of the muscle during catabolic stress (56). AMPK is known to down-regulate rRNA synthesis by phosphorylating the RNA polymerase I (Pol I)-associated transcription factor TIF-IA (57) preventing the assembly of functional transcription initiation complexes. Thus, it appears that in addition to regulating the expression of MuRF1 and muscle
catabolism, hypercapnia exposure also leads to the attenuation of the anabolic capacity of muscle cells. A recent study showed that acute lung injury associated muscle atrophy requires the activation of the NF-κB for MuRF1 to be induced, whereas our findings suggest that high CO2 triggers muscle catabolism through FoxO3a and MuRF1 regulation (49). FoxO regulation in response to external stimuli is mostly determined by changes in its phosphorylation state and subcellular localization, which modulates its access to nuclear DNA (58). Different kinases, including Akt, MAP kinases, and AMPK, have been shown to regulate FoxO activation (59) and Greer et al (31) have described that AMPK directly phosphorylates FoxO3a and that AMPK is necessary and sufficient for the phosphorylation of FoxO3a. We found that high CO2 levels cause AMPK-dependent phosphorylation of FoxO3a, and that when FoxO3a-6A mutant is over-expressed, the phosphorylation of the AMPK-targeted site Ser-588 is prevented. Hypercapnia leads to AMPKα2-dependent nuclear translocation of FoxO3a, which regulates MuRF1 expression leading to muscle atrophy. Although AMPK has been shown to modulate FoxO3a expression through a PGC-1α-dependent mechanism (60), we did not find changes in total cellular FoxO3a abundance during high CO2 exposure (see Fig. 9 C and D). AMPK phosphorylates FOXO3a at amino-acids that are different from the sites described for other kinases. (Akt, SGK, CK1,DYRK1, JNK, IKK-, and MST1)(31). Interestingly, like AMPK, Akt also controls protein synthesis and protein degradation (16). FoxO3a is one of the intersection points between both pathways as activation of Akt phosphorylates FoxOs which exclude them from the nuclei preventing their functions as transcription factors (16,58). In summary, we report that hypercapnia triggers skeletal muscle atrophy though a pathway that involves the activation of AMPKα2, phosphorylation of FoxO3a, and induction of MuRF1 (Figure 11). This pathway is of pathophysiological relevance to patients with hypercapnic respiratory diseases.
References
1. Belkin, R. A., Henig, N. R., Singer, L. G., Chaparro, C., Rubenstein, R. C., Xie, S. X., Yee, J. Y., Kotloff, R. M., Lipson, D. A., and Bunin, G. R. (2006) Risk factors for death of patients with cystic fibrosis awaiting lung transplantation. Am J Respir Crit Care Med 173, 659-666
2. Weinberger, S. E., Schwartzstein, R. M., and Weiss, J. W. (1989) Hypercapnia. N Engl J Med 321, 1223-1231
by guest on Novem
ber 9, 2018http://w
ww
.jbc.org/D
ownloaded from

Hypercapnia leads to skeletal muscle atrophy
8
3. Vadasz, I., Hubmayr, R. D., Nin, N., Sporn, P. H., and Sznajder, J. I. (2012) Hypercapnia: a nonpermissive environment for the lung. Am J Respir Cell Mol Biol 46, 417-421
4. Schols, A. M., Slangen, J., Volovics, L., and Wouters, E. F. (1998) Weight loss is a reversible factor in the prognosis of chronic obstructive pulmonary disease. Am J Respir Crit Care Med 157, 1791-1797
5. Wang, N., Gates, K. L., Trejo, H., Favoreto, S., Jr., Schleimer, R. P., Sznajder, J. I., Beitel, G. J., and Sporn, P. H. (2010) Elevated CO2 selectively inhibits interleukin-6 and tumor necrosis factor expression and decreases phagocytosis in the macrophage. FASEB J 24, 2178-2190
6. Helenius, I. T., Krupinski, T., Turnbull, D. W., Gruenbaum, Y., Silverman, N., Johnson, E. A., Sporn, P. H., Sznajder, J. I., and Beitel, G. J. (2009) Elevated CO2 suppresses specific Drosophila innate immune responses and resistance to bacterial infection. Proc Natl Acad Sci U S A 106, 18710-18715
7. Gates, K. L., Howell, H. A., Nair, A., Vohwinkel, C. U., Welch, L. C., Beitel, G. J., Hauser, A. R., Sznajder, J. I., and Sporn, P. H. (2013) Hypercapnia impairs lung neutrophil function and increases mortality in murine pseudomonas pneumonia. Am J Respir Cell Mol Biol 49, 821-828
8. Caples, S. M., Rasmussen, D. L., Lee, W. Y., Wolfert, M. Z., and Hubmayr, R. D. (2009) Impact of buffering hypercapnic acidosis on cell wounding in ventilator-injured rat lungs. Am J Physiol Lung Cell Mol Physiol 296, L140-144
9. Doerr, C. H., Gajic, O., Berrios, J. C., Caples, S., Abdel, M., Lymp, J. F., and Hubmayr, R. D. (2005) Hypercapnic acidosis impairs plasma membrane wound resealing in ventilator-injured lungs. Am J Respir Crit Care Med 171, 1371-1377
10. Gajic, O., Lee, J., Doerr, C. H., Berrios, J. C., Myers, J. L., and Hubmayr, R. D. (2003) Ventilator-induced cell wounding and repair in the intact lung. Am J Respir Crit Care Med 167, 1057-1063
11. Cummins, E. P., Selfridge, A. C., Sporn, P. H., Sznajder, J. I., and Taylor, C. T. (2014) Carbon dioxide-sensing in organisms and its implications for human disease. Cell Mol Life Sci 71, 831-845
12. Engelen, M. P., Schols, A. M., Baken, W. C., Wesseling, G. J., and Wouters, E. F. (1994) Nutritional depletion in relation to respiratory and peripheral skeletal muscle function in out-patients with COPD. Eur Respir J 7, 1793-1797
13. Barreiro, E., and Sieck, G. (2013) Muscle dysfunction in COPD. J Appl Physiol (1985) 114, 1220-1221 14. Barreiro, E., de la Puente, B., Minguella, J., Corominas, J. M., Serrano, S., Hussain, S. N., and Gea, J.
(2005) Oxidative stress and respiratory muscle dysfunction in severe chronic obstructive pulmonary disease. Am J Respir Crit Care Med 171, 1116-1124
15. Glass, D. J. (2003) Signalling pathways that mediate skeletal muscle hypertrophy and atrophy. Nat Cell Biol 5, 87-90
16. Bonaldo, P., and Sandri, M. (2013) Cellular and molecular mechanisms of muscle atrophy. Dis Model Mech 6, 25-39
17. Lecker, S. H., Goldberg, A. L., and Mitch, W. E. (2006) Protein degradation by the ubiquitin-proteasome pathway in normal and disease states. J Am Soc Nephrol 17, 1807-1819
18. Sandri, M. (2013) Protein breakdown in muscle wasting: role of autophagy-lysosome and ubiquitin-proteasome. Int J Biochem Cell Biol 45, 2121-2129
19. Glass, D. J. (2005) Skeletal muscle hypertrophy and atrophy signaling pathways. Int J Biochem Cell Biol 37, 1974-1984
20. Bodine, S. C., Latres, E., Baumhueter, S., Lai, V. K., Nunez, L., Clarke, B. A., Poueymirou, W. T., Panaro, F. J., Na, E., Dharmarajan, K., Pan, Z. Q., Valenzuela, D. M., DeChiara, T. M., Stitt, T. N., Yancopoulos, G. D., and Glass, D. J. (2001) Identification of ubiquitin ligases required for skeletal muscle atrophy. Science 294, 1704-1708
21. Baehr, L. M., Furlow, J. D., and Bodine, S. C. (2011) Muscle sparing in muscle RING finger 1 null mice: response to synthetic glucocorticoids. J Physiol 589, 4759-4776
22. Clarke, B. A., Drujan, D., Willis, M. S., Murphy, L. O., Corpina, R. A., Burova, E., Rakhilin, S. V., Stitt, T. N., Patterson, C., Latres, E., and Glass, D. J. (2007) The E3 Ligase MuRF1 degrades myosin heavy chain protein in dexamethasone-treated skeletal muscle. Cell Metab 6, 376-385
23. Hardie, D. G., Ross, F. A., and Hawley, S. A. (2012) AMPK: a nutrient and energy sensor that maintains energy homeostasis. Nat Rev Mol Cell Biol 13, 251-262
by guest on Novem
ber 9, 2018http://w
ww
.jbc.org/D
ownloaded from
Hypercapnia leads to skeletal muscle atrophy
9
24. Schiaffino, S., Dyar, K. A., Ciciliot, S., Blaauw, B., and Sandri, M. (2013) Mechanisms regulating skeletal muscle growth and atrophy. FEBS J 280, 4294-4314
25. Nakashima, K., and Yakabe, Y. (2007) AMPK activation stimulates myofibrillar protein degradation and expression of atrophy-related ubiquitin ligases by increasing FOXO transcription factors in C2C12 myotubes. Biosci Biotechnol Biochem 71, 1650-1656
26. Willis, M. S., Ike, C., Li, L., Wang, D. Z., Glass, D. J., and Patterson, C. (2007) Muscle ring finger 1, but not muscle ring finger 2, regulates cardiac hypertrophy in vivo. Circ Res 100, 456-459
27. Vadasz, I., Dada, L. A., Briva, A., Trejo, H. E., Welch, L. C., Chen, J., Toth, P. T., Lecuona, E., Witters, L. A., Schumacker, P. T., Chandel, N. S., Seeger, W., and Sznajder, J. I. (2008) AMP-activated protein kinase regulates CO2-induced alveolar epithelial dysfunction in rats and human cells by promoting Na,K-ATPase endocytosis. J Clin Invest 118, 752-762
28. Briguet, A., Courdier-Fruh, I., Foster, M., Meier, T., and Magyar, J. P. (2004) Histological parameters for the quantitative assessment of muscular dystrophy in the mdx-mouse. Neuromuscul Disord 14, 675-682
29. Meyer, O. A., Tilson, H. A., Byrd, W. C., and Riley, M. T. (1979) A method for the routine assessment of fore- and hindlimb grip strength of rats and mice. Neurobehav Toxicol 1, 233-236
30. Sandri, M., Sandri, C., Gilbert, A., Skurk, C., Calabria, E., Picard, A., Walsh, K., Schiaffino, S., Lecker, S. H., and Goldberg, A. L. (2004) Foxo transcription factors induce the atrophy-related ubiquitin ligase atrogin-1 and cause skeletal muscle atrophy. Cell 117, 399-412
31. Greer, E. L., Oskoui, P. R., Banko, M. R., Maniar, J. M., Gygi, M. P., Gygi, S. P., and Brunet, A. (2007) The energy sensor AMP-activated protein kinase directly regulates the mammalian FOXO3 transcription factor. J Biol Chem 282, 30107-30119
32. Hayward, L. J., Kim, J. S., Lee, M. Y., Zhou, H., Kim, J. W., Misra, K., Salajegheh, M., Wu, F. F., Matsuda, C., Reid, V., Cros, D., Hoffman, E. P., Renaud, J. M., Cannon, S. C., and Brown, R. H., Jr. (2008) Targeted mutation of mouse skeletal muscle sodium channel produces myotonia and potassium-sensitive weakness. J Clin Invest 118, 1437-1449
33. von Walden, F., Casagrande, V., Ostlund Farrants, A. K., and Nader, G. A. (2012) Mechanical loading induces the expression of a Pol I regulon at the onset of skeletal muscle hypertrophy. Am J Physiol Cell Physiol 302, C1523-1530
34. Ceco, E., and McNally, E. M. (2013) Modifying muscular dystrophy through transforming growth factor-beta. FEBS J 280, 4198-4209
35. Nystrom, G. J., and Lang, C. H. (2008) Sepsis and AMPK Activation by AICAR Differentially Regulate FoxO-1, -3 and -4 mRNA in Striated Muscle. Int J Clin Exp Med 1, 50-63
36. Romanello, V., Guadagnin, E., Gomes, L., Roder, I., Sandri, C., Petersen, Y., Milan, G., Masiero, E., Del Piccolo, P., Foretz, M., Scorrano, L., Rudolf, R., and Sandri, M. (2010) Mitochondrial fission and remodelling contributes to muscle atrophy. EMBO J 29, 1774-1785
37. Celli, B. R., Cote, C. G., Marin, J. M., Casanova, C., Montes de Oca, M., Mendez, R. A., Pinto Plata, V., and Cabral, H. J. (2004) The body-mass index, airflow obstruction, dyspnea, and exercise capacity index in chronic obstructive pulmonary disease. N Engl J Med 350, 1005-1012
38. Landbo, C., Prescott, E., Lange, P., Vestbo, J., and Almdal, T. P. (1999) Prognostic value of nutritional status in chronic obstructive pulmonary disease. Am J Respir Crit Care Med 160, 1856-1861
39. Puhan, M. A., Gimeno-Santos, E., Scharplatz, M., Troosters, T., Walters, E. H., and Steurer, J. (2011) Pulmonary rehabilitation following exacerbations of chronic obstructive pulmonary disease. Cochrane Database Syst Rev 10, CD005305
40. Kok, M. O., Hoekstra, T., and Twisk, J. W. (2012) The longitudinal relation between smoking and muscle strength in healthy adults. Eur Addict Res 18, 70-75
41. Dick, C. R., Liu, Z., Sassoon, C. S., Berry, R. B., and Mahutte, C. K. (1997) O2-induced change in ventilation and ventilatory drive in COPD. Am J Respir Crit Care Med 155, 609-614
42. He, W. A., Berardi, E., Cardillo, V. M., Acharyya, S., Aulino, P., Thomas-Ahner, J., Wang, J., Bloomston, M., Muscarella, P., Nau, P., Shah, N., Butchbach, M. E., Ladner, K., Adamo, S., Rudnicki, M. A., Keller, C., Coletti, D., Montanaro, F., and Guttridge, D. C. (2013) NF-kappaB-mediated Pax7 dysregulation in the muscle microenvironment promotes cancer cachexia. J Clin Invest 123, 4821-4835
by guest on Novem
ber 9, 2018http://w
ww
.jbc.org/D
ownloaded from

Hypercapnia leads to skeletal muscle atrophy
10
43. Fermoselle, C., Rabinovich, R., Ausin, P., Puig-Vilanova, E., Coronell, C., Sanchez, F., Roca, J., Gea, J., and Barreiro, E. (2012) Does oxidative stress modulate limb muscle atrophy in severe COPD patients? Eur Respir J 40, 851-862
44. Doucet, M., Russell, A. P., Leger, B., Debigare, R., Joanisse, D. R., Caron, M. A., LeBlanc, P., and Maltais, F. (2007) Muscle atrophy and hypertrophy signaling in patients with chronic obstructive pulmonary disease. Am J Respir Crit Care Med 176, 261-269
45. Plant, P. J., Brooks, D., Faughnan, M., Bayley, T., Bain, J., Singer, L., Correa, J., Pearce, D., Binnie, M., and Batt, J. (2010) Cellular markers of muscle atrophy in chronic obstructive pulmonary disease. Am J Respir Cell Mol Biol 42, 461-471
46. Weathington, N. M., Sznajder, J. I., and Mallampalli, R. K. (2013) The emerging role of the ubiquitin proteasome in pulmonary biology and disease. Am J Respir Crit Care Med 188, 530-537
47. Batt, J., dos Santos, C. C., Cameron, J. I., and Herridge, M. S. (2013) Intensive care unit-acquired weakness: clinical phenotypes and molecular mechanisms. Am J Respir Crit Care Med 187, 238-246
48. Batt, J., Ahmed, S. S., Correa, J., Bain, A., and Granton, J. (2014) Skeletal muscle dysfunction in idiopathic pulmonary arterial hypertension. Am J Respir Cell Mol Biol 50, 74-86
49. Files, D. C., D'Alessio, F. R., Johnston, L. F., Kesari, P., Aggarwal, N. R., Garibaldi, B. T., Mock, J. R., Simmers, J. L., DeGorordo, A., Murdoch, J., Willis, M. S., Patterson, C., Tankersley, C. G., Messi, M. L., Liu, C., Delbono, O., Furlow, J. D., Bodine, S. C., Cohn, R. D., King, L. S., and Crow, M. T. (2012) A critical role for muscle ring finger-1 in acute lung injury-associated skeletal muscle wasting. Am J Respir Crit Care Med 185, 825-834
50. Nystrom, G., Pruznak, A., Huber, D., Frost, R. A., and Lang, C. H. (2009) Local insulin-like growth factor I prevents sepsis-induced muscle atrophy. Metabolism 58, 787-797
51. Guo, Y., Gosker, H. R., Schols, A. M., Kapchinsky, S., Bourbeau, J., Sandri, M., Jagoe, R. T., Debigare, R., Maltais, F., Taivassalo, T., and Hussain, S. N. (2013) Autophagy in locomotor muscles of patients with chronic obstructive pulmonary disease. Am J Respir Crit Care Med 188, 1313-1320
52. Vohwinkel, C. U., Lecuona, E., Sun, H., Sommer, N., Vadasz, I., Chandel, N. S., and Sznajder, J. I. (2011) Elevated CO(2) levels cause mitochondrial dysfunction and impair cell proliferation. J Biol Chem 286, 37067-37076
53. Salt, I., Celler, J. W., Hawley, S. A., Prescott, A., Woods, A., Carling, D., and Hardie, D. G. (1998) AMP-activated protein kinase: greater AMP dependence, and preferential nuclear localization, of complexes containing the alpha2 isoform. Biochem J 334 ( Pt 1), 177-187
54. Gowans, G. J., and Hardie, D. G. (2014) AMPK: a cellular energy sensor primarily regulated by AMP. Biochem Soc Trans 42, 71-75
55. Moss, T., and Stefanovsky, V. Y. (1995) Promotion and regulation of ribosomal transcription in eukaryotes by RNA polymerase I. Prog Nucleic Acid Res Mol Biol 50, 25-66
56. Machida, M., Takeda, K., Yokono, H., Ikemune, S., Taniguchi, Y., Kiyosawa, H., and Takemasa, T. (2012) Reduction of ribosome biogenesis with activation of the mTOR pathway in denervated atrophic muscle. J Cell Physiol 227, 1569-1576
57. Hoppe, S., Bierhoff, H., Cado, I., Weber, A., Tiebe, M., Grummt, I., and Voit, R. (2009) AMP-activated protein kinase adapts rRNA synthesis to cellular energy supply. Proc Natl Acad Sci U S A 106, 17781-17786
58. Calnan, D. R., and Brunet, A. (2008) The FoxO code. Oncogene 27, 2276-2288 59. Hedrick, S. M., Hess Michelini, R., Doedens, A. L., Goldrath, A. W., and Stone, E. L. (2012) FOXO
transcription factors throughout T cell biology. Nat Rev Immunol 12, 649-661 60. Williamson, D. L., Butler, D. C., and Alway, S. E. (2009) AMPK inhibits myoblast differentiation
through a PGC-1alpha-dependent mechanism. Am J Physiol Endocrinol Metab 297, E304-314
by guest on Novem
ber 9, 2018http://w
ww
.jbc.org/D
ownloaded from

Hypercapnia leads to skeletal muscle atrophy
11
Acknowledgements: This work was supported by Northwestern University's Center for Advanced Microscopy and a Cancer Center Support Grant (NCI CA060553) and by the Northwestern University Genomics Core and a Cancer Center Support Grant (NCI CA060553).
FOOTNOTES: This work was supported in part by NIH grants HL-85534, HL-71643, and HL-T32 HL-76139, and FIS 11/02029; FIS 12/02534; SAF-2011-26908 (Spain).
Author contributions: JIS, LAD, AJ and GAN designed the experiments; AJ, MA, LCW, EL, MS, EC, CL, YC and GG performed the experiments, JIS, LAD, GAN, AJ, CP, EL and EB analyzed the data and wrote the article and all authors reviewed it before submission.
Conflicts of interest: The authors declare that they have no conflict of interest
FIGURE LEGENDS
TABLE 1. Exposure to high CO2 causes normoxic hypercapnia. C57Bl/6 mice were exposed to control conditions at room air (CT, n=7), or high CO2/hypercapnia for different time points (HC-3days; n=6, HC-5days; n=3, HC-7days; n=3). Samples were analyzed with a pHOx Plus Blood Gas Analyzer, as described in Materials and Methods.
FIGURE 1. Hypercapnia causes muscle atrophy in mice without changes in metabolic phenotype. C57Bl/6 mice were exposed to 10% CO2 for 7, 14, and 21 days or maintained in room air, and soleus muscles were excised, frozen and cryosectioned (8 µm thickness). (A) Soleus muscles wet weight (n≥7). (B) Upper panel shows soleus muscle cross-sections immunostained with laminin antibody. Scale bars 50 µm. (n≥4). Lower panel shows histogram of fiber size distribution. (C) Fiber cross-sectional area (CSA) from soleus muscle of mice exposed to room air (CT) or 10% CO2 for 14, and 21 days (D) Muscle force assessed via the grip strength test (n≥10). Results are represented normalizing the average grip of each mouse by the body weight at the corresponding day. (E) Percentage of Type I and Type II fibers in soleus muscle of mice exposed to room air (CT) or 10% CO2 for 14, and 21 days (n≥6). (F) Fiber cross-sectional area (CSA) from Type I and Type II fibers from soleus muscle of mice exposed to room air (CT) or 10% CO2 for 14, and 21 days (n≥6). *p < 0.05, **p < 0.01.
FIGURE 2. Hypercapnia causes muscle atrophy in gastrocnemius and tibialis anterior. C57Bl/6 mice were exposed to 10% CO2 for 14 and 21 days or maintained in room air, and gastrocnemius and tibialis anterior muscles were excised, frozen and cryosectioned (8 µm thickness). Muscle cross-sections immunostained with laminin antibody are shown. Scale bars 50 µm. (A) Tibialis anterior. (B) Gastrocnemius. (n≥4) *p < 0.05
FIGURE 3. High CO2 exposure causes a time-dependent increase in nuclear centralization in myofibers. Histological analysis of myofibers from soleus muscle sections with hematoxylin and eosin (H & E) staining from mice exposed to room air or high CO2 levels for 7, 14, and 21 days. Graph represents the number of centralized nuclei normalized by the number of fibers. Scale bars 100 µm. (n=3). Arrows indicate centralized nuclei. Representative images were taken at 60X. *p<0.05
FIGURE 4. High CO2 exposure causes reduction in myotube diameter associated with a decrease in total protein content and down-regulation of anabolic genes. (A) Representative images of C2C12 myotubes exposed to 40, 60 and 120 mmHg CO2 and graph depicts average myotubes diameter (n=3). Scale bars 30 µm. (B) Representative images of C2C12 myotubes exposed to 0 (CT), 6, 24 and 48h CO2 (n=3). (C) Protein/DNA ratio of C2C12 myotubes exposed to hypercapnia for 24h, as measured with the fluorochrome Hoechst 33258 (n=3). (D) Activation of the anabolic 45S pre-rRNA gene as measured with rtPCR using specific primers (n=5). **p < 0.01, ***p < 0.001.
FIGURE 5. Ubiquitin-proteasome system mediates CO2-induced myotube atrophy. Representative graph and images of C2C12 myotubes treated with vehicle, MG-132 and E1-inhibitor UBE1 exposed to high CO2 for 24
by guest on Novem
ber 9, 2018http://w
ww
.jbc.org/D
ownloaded from
Hypercapnia leads to skeletal muscle atrophy
12
hours or pretreatment with MG-132 or vehicle (V) and exposed to dexamethasone for 12 hours (Dexa 10 µM) (n=3). Scale bars 30 µm. ***p<0.001.
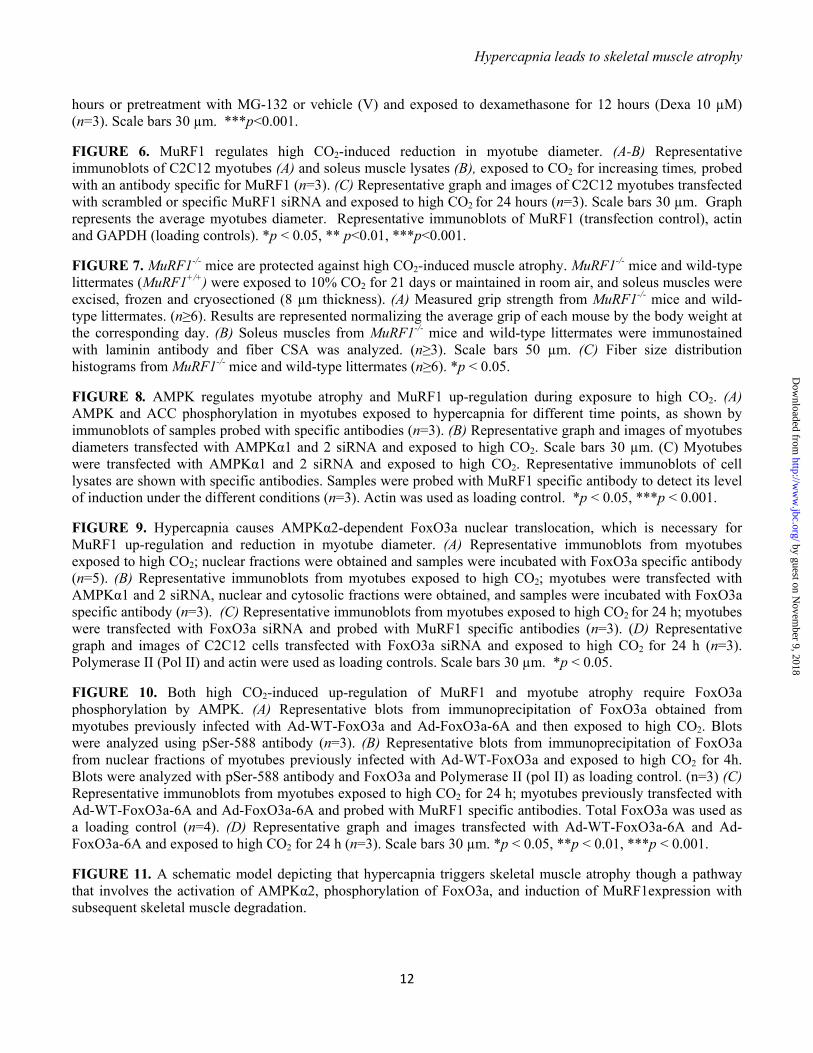
FIGURE 6. MuRF1 regulates high CO2-induced reduction in myotube diameter. (A-B) Representative immunoblots of C2C12 myotubes (A) and soleus muscle lysates (B), exposed to CO2 for increasing times, probed with an antibody specific for MuRF1 (n=3). (C) Representative graph and images of C2C12 myotubes transfected with scrambled or specific MuRF1 siRNA and exposed to high CO2 for 24 hours (n=3). Scale bars 30 µm. Graph represents the average myotubes diameter. Representative immunoblots of MuRF1 (transfection control), actin and GAPDH (loading controls). *p < 0.05, ** p<0.01, ***p<0.001.
FIGURE 7. MuRF1-/- mice are protected against high CO2-induced muscle atrophy. MuRF1-/- mice and wild-type littermates (MuRF1+/+) were exposed to 10% CO2 for 21 days or maintained in room air, and soleus muscles were excised, frozen and cryosectioned (8 µm thickness). (A) Measured grip strength from MuRF1-/- mice and wild-type littermates. (n≥6). Results are represented normalizing the average grip of each mouse by the body weight at the corresponding day. (B) Soleus muscles from MuRF1-/- mice and wild-type littermates were immunostained with laminin antibody and fiber CSA was analyzed. (n≥3). Scale bars 50 µm. (C) Fiber size distribution histograms from MuRF1-/- mice and wild-type littermates (n≥6). *p < 0.05.
FIGURE 8. AMPK regulates myotube atrophy and MuRF1 up-regulation during exposure to high CO2. (A) AMPK and ACC phosphorylation in myotubes exposed to hypercapnia for different time points, as shown by immunoblots of samples probed with specific antibodies (n=3). (B) Representative graph and images of myotubes diameters transfected with AMPKα1 and 2 siRNA and exposed to high CO2. Scale bars 30 µm. (C) Myotubes were transfected with AMPKα1 and 2 siRNA and exposed to high CO2. Representative immunoblots of cell lysates are shown with specific antibodies. Samples were probed with MuRF1 specific antibody to detect its level of induction under the different conditions (n=3). Actin was used as loading control. *p < 0.05, ***p < 0.001.
FIGURE 9. Hypercapnia causes AMPKα2-dependent FoxO3a nuclear translocation, which is necessary for MuRF1 up-regulation and reduction in myotube diameter. (A) Representative immunoblots from myotubes exposed to high CO2; nuclear fractions were obtained and samples were incubated with FoxO3a specific antibody (n=5). (B) Representative immunoblots from myotubes exposed to high CO2; myotubes were transfected with AMPKα1 and 2 siRNA, nuclear and cytosolic fractions were obtained, and samples were incubated with FoxO3a specific antibody (n=3). (C) Representative immunoblots from myotubes exposed to high CO2 for 24 h; myotubes were transfected with FoxO3a siRNA and probed with MuRF1 specific antibodies (n=3). (D) Representative graph and images of C2C12 cells transfected with FoxO3a siRNA and exposed to high CO2 for 24 h (n=3). Polymerase II (Pol II) and actin were used as loading controls. Scale bars 30 µm. *p < 0.05.
FIGURE 10. Both high CO2-induced up-regulation of MuRF1 and myotube atrophy require FoxO3a phosphorylation by AMPK. (A) Representative blots from immunoprecipitation of FoxO3a obtained from myotubes previously infected with Ad-WT-FoxO3a and Ad-FoxO3a-6A and then exposed to high CO2. Blots were analyzed using pSer-588 antibody (n=3). (B) Representative blots from immunoprecipitation of FoxO3a from nuclear fractions of myotubes previously infected with Ad-WT-FoxO3a and exposed to high CO2 for 4h. Blots were analyzed with pSer-588 antibody and FoxO3a and Polymerase II (pol II) as loading control. (n=3) (C) Representative immunoblots from myotubes exposed to high CO2 for 24 h; myotubes previously transfected with Ad-WT-FoxO3a-6A and Ad-FoxO3a-6A and probed with MuRF1 specific antibodies. Total FoxO3a was used as a loading control (n=4). (D) Representative graph and images transfected with Ad-WT-FoxO3a-6A and Ad-FoxO3a-6A and exposed to high CO2 for 24 h (n=3). Scale bars 30 µm. *p < 0.05, **p < 0.01, ***p < 0.001.
FIGURE 11. A schematic model depicting that hypercapnia triggers skeletal muscle atrophy though a pathway that involves the activation of AMPKα2, phosphorylation of FoxO3a, and induction of MuRF1expression with subsequent skeletal muscle degradation.
by guest on Novem
ber 9, 2018http://w
ww
.jbc.org/D
ownloaded from
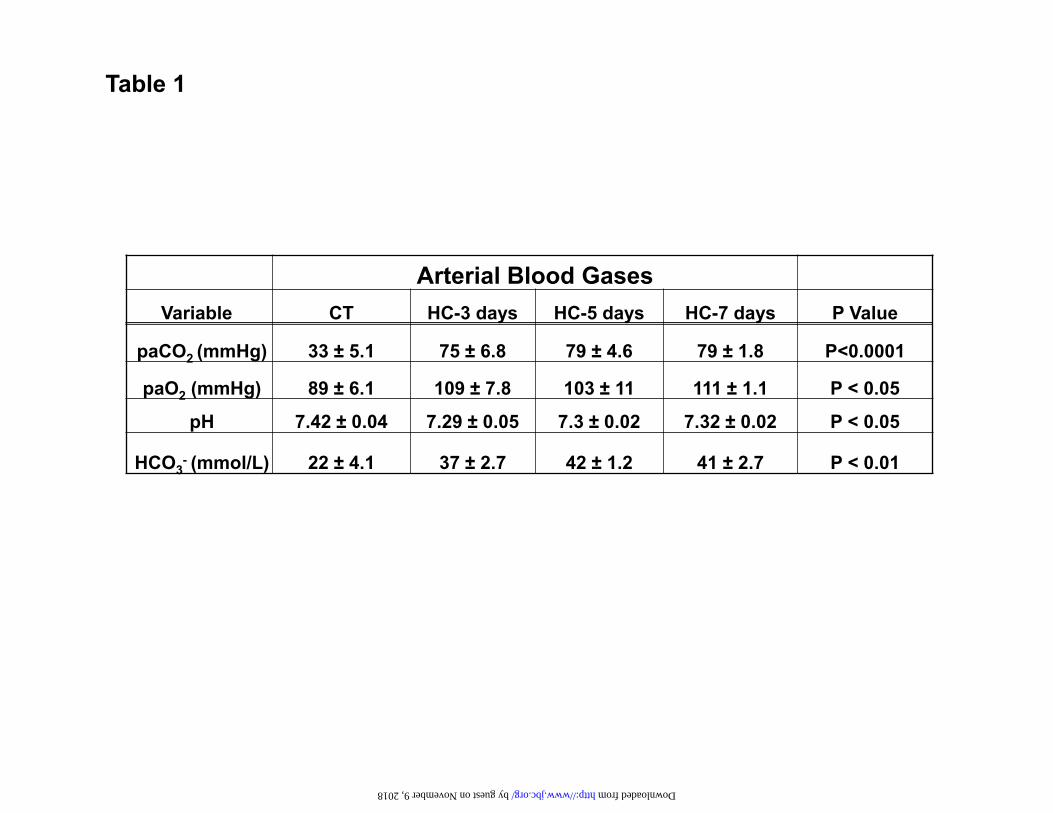
Arterial Blood GasesVariable CT HC-3 days HC-5 days HC-7 days P Value
paCO2 (mmHg) 33 ± 5.1 75 ± 6.8 79 ± 4.6 79 ± 1.8 P<0.0001
paO2 (mmHg) 89 ± 6.1 109 ± 7.8 103 ± 11 111 ± 1.1 P < 0.05
pH 7.42 ± 0.04 7.29 ± 0.05 7.3 ± 0.02 7.32 ± 0.02 P < 0.05
HCO3- (mmol/L) 22 ± 4.1 37 ± 2.7 42 ± 1.2 41 ± 2.7 P < 0.01
Table 1
by guest on November 9, 2018 http://www.jbc.org/ Downloaded from
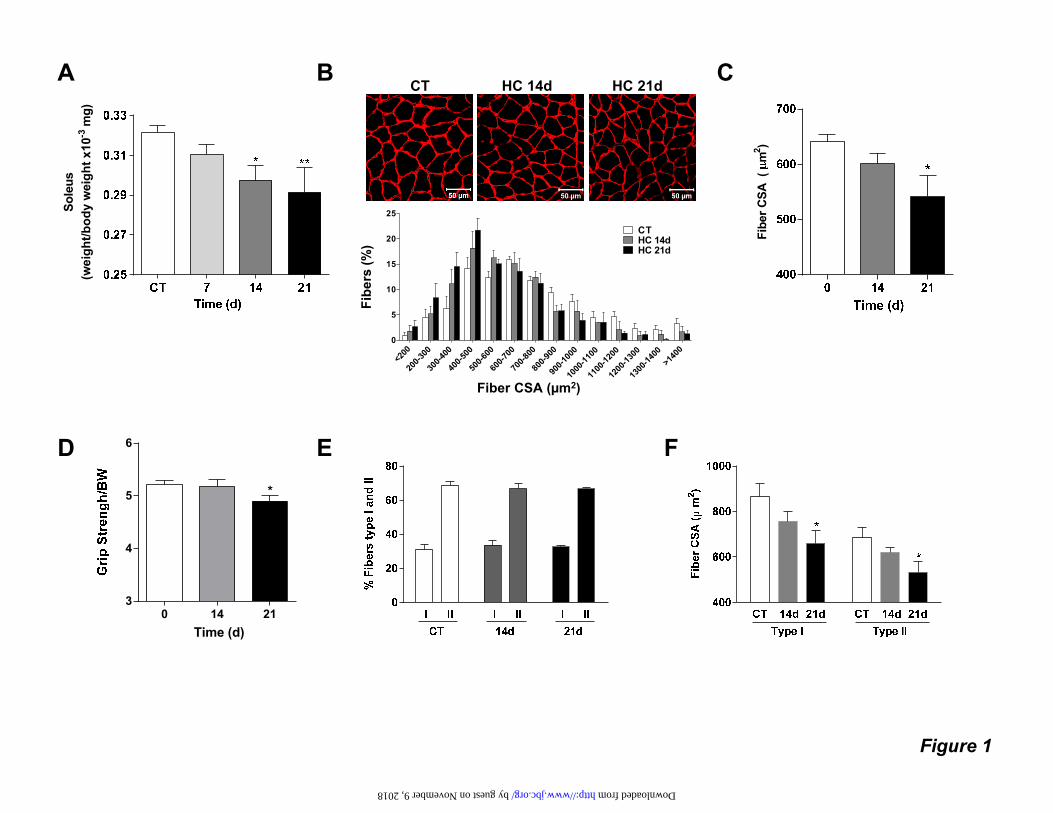
Figure 1
A B
D
CT HC 14d HC 21d C
FE
<200
200-3
0030
0-400
400-5
0050
0-600
600-7
0070
0-800
800-9
0090
0-100
010
00-11
0011
00-12
0012
00-13
0013
00-14
00>1
400
0
5
10
15
20
25
CTHC 14dHC 21d
Fiber CSA (µm2)Fi
bers
(%)
0 14 213
4
5
6
*
Time (d)
Sole
us(w
eigh
t/bod
y w
eigh
t x10
-3m
g)
Fibe
r CSA
(m
2 )
by guest on November 9, 2018 http://www.jbc.org/ Downloaded from

Figure 2
A B
Fibe
r CSA
(m
2 )
CT HC 14d HC 21d HC 21dHC 14dCT
50µm 50µm 50µm 50µm50µm 50µm
by guest on November 9, 2018 http://www.jbc.org/ Downloaded from
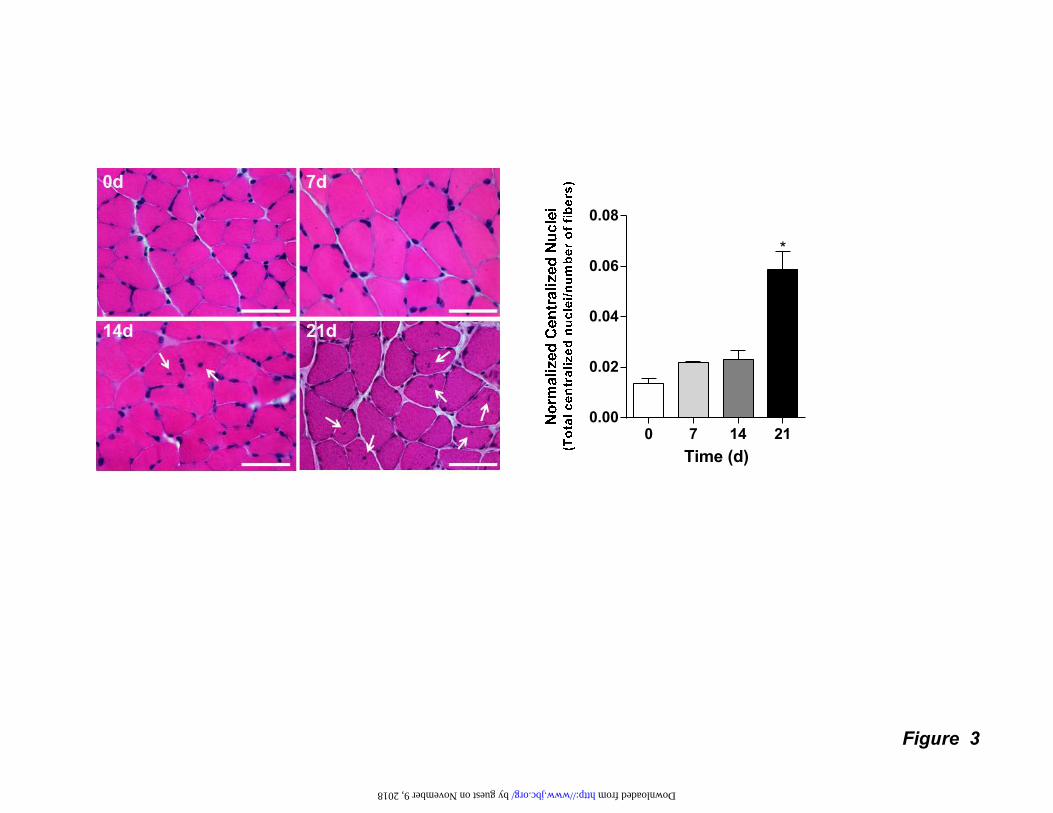
Figure 3
0 7 14 210.00
0.02
0.04
0.06
0.08
Time (d)
*
by guest on November 9, 2018 http://www.jbc.org/ Downloaded from

Figure 4
C
A B30 µm
D
CT 24h6h 48h
30 µm
40 mmHg 120 mmHg60 mmHg
30 µm
Prot
ein/
DN
A R
atio
45 S
pre-
rRN
A/G
APD
H
40 60 1200.0
2.5
5.0
7.5
10.0
12.5
****
CO2 (mmHg)
Myo
tube
Dia
met
er (
m)
by guest on November 9, 2018 http://www.jbc.org/ Downloaded from
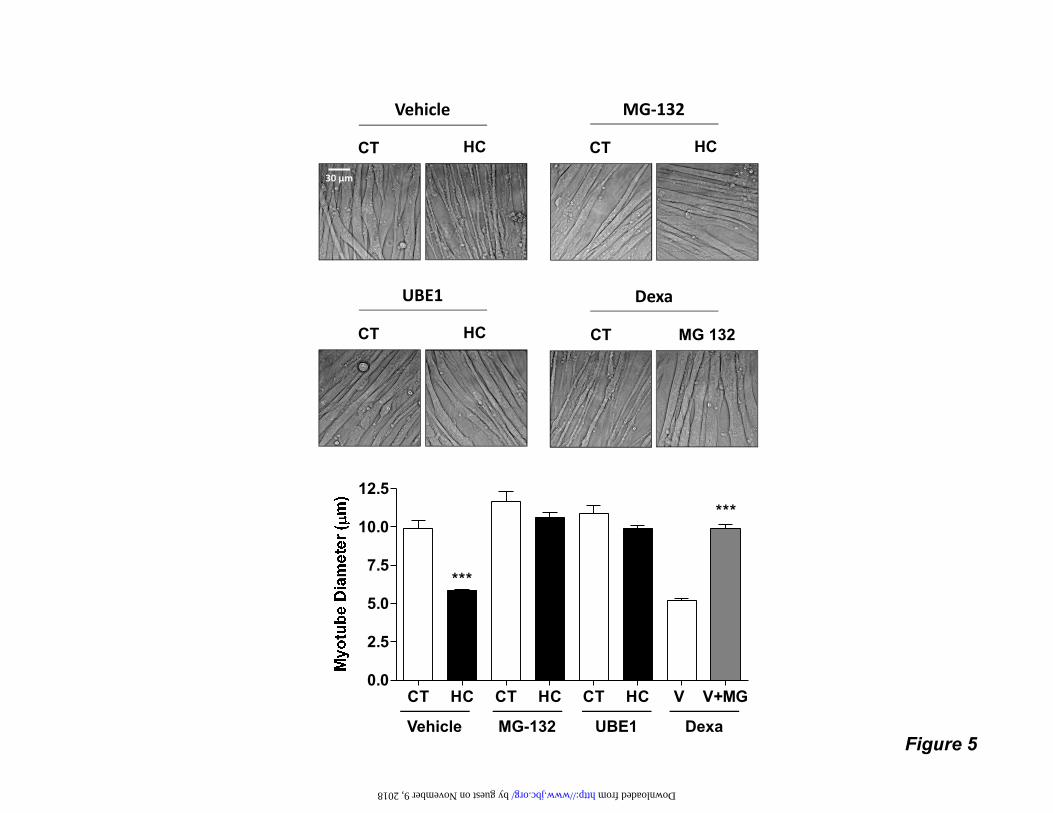
Figure 5
CT HC
UBE1
CT HC
MG‐132Vehicle
CT HC
CT MG 132
Dexa
30 µm
CT HC CT HC CT HC V V+MG0.0
2.5
5.0
7.5
10.0
12.5
***
***
Vehicle MG-132 UBE1 Dexa
by guest on November 9, 2018 http://www.jbc.org/ Downloaded from
A
B
C
Scr
MuR
F1
CT HC
30 µm
Figure 6
MuRF1GAPDH
MuR
F1/G
APD
H
Myo
tube
Dia
met
er (
m)
siRNA Scr MuRF1 MuRF1
Actin
0 .25 1 4 12 24012345678
**
***
***
MuRF1
Actin
Time (h)
by guest on November 9, 2018 http://www.jbc.org/ Downloaded from
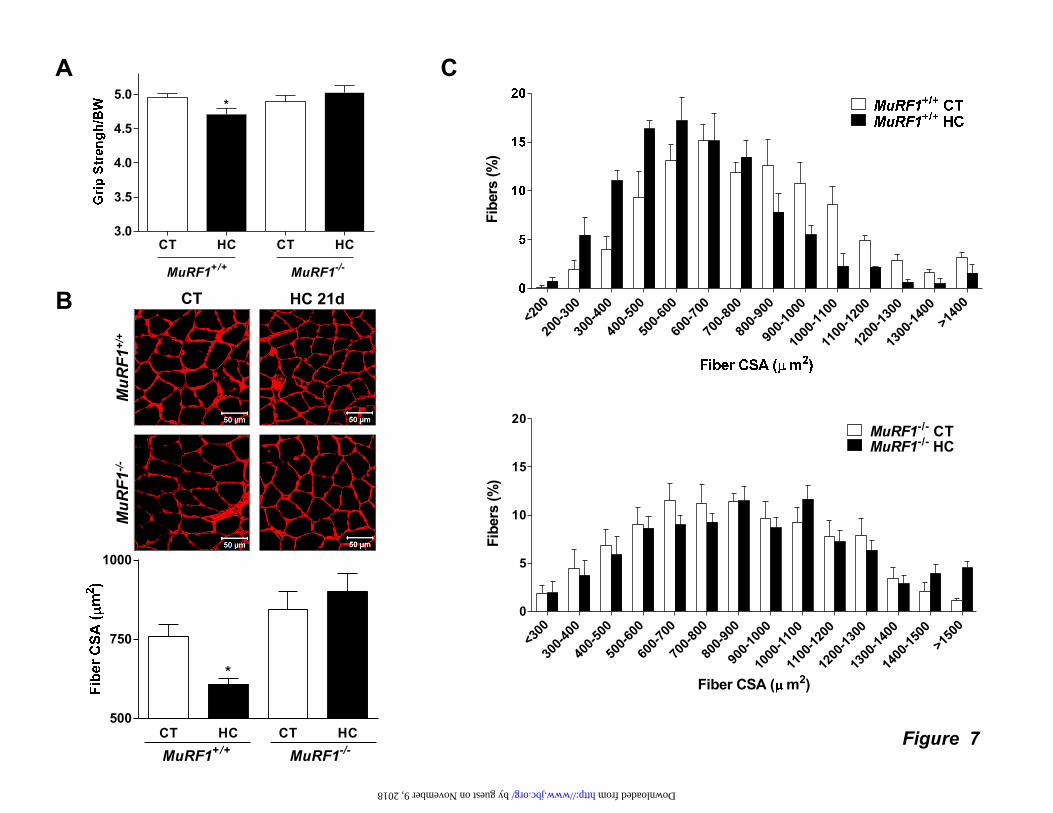
Figure 7
C
B CT
MuR
F1+/
+
HC 21d
MuR
F1-/-
A
CT HC CT HC3.0
3.5
4.0
4.5
5.0*
MuRF1+/+ MuRF1-/-
<300
300-4
0040
0-500
500-6
0060
0-700
700-8
0080
0-900
900-1
000
1000
-1100
1100
-1200
1200
-1300
1300
-1400
1400
-1500
>150
0
0
5
10
15
20MuRF1-/- CTMuRF1-/- HC
Fiber CSA ( m2)
Fibe
rs (%
)
<200
200-3
0030
0-400
400-5
0050
0-600
600-7
0070
0-800
800-9
0090
0-100
010
00-11
0011
00-12
0012
00-13
0013
00-14
00>1
400
Fibe
rs (%
)
CT HC CT HC500
750
1000
MuRF1-/-MuRF1+/+
*
by guest on November 9, 2018 http://www.jbc.org/ Downloaded from

Figure 8
C
MuRF1
AMPKα1Actin
AMPKα2
Scr AMPKα1 AMPKα2siRNA
A
pAMPK
AMPK
pACC
AMPK
BCT
Scr
AM
PK α
1 A
MPK
α2
HC 30 µm
Scr AMPKα1 AMPKα2siRNA
Myo
tube
Dia
met
er (
m)
0
5
10
15 ***
CT 0.25 241241
AMPKACC
Time (h)
MuR
F1/ A
ctin
by guest on November 9, 2018 http://www.jbc.org/ Downloaded from

Figure 9
MuRF1FoxO3a
Actin
ScrsiRNA FoxO3a
C
B
Nuclear Fraction
Cytosolic Fraction
FoxO3a
Pol II
AMPKα1
AMPKα2
Actin
siRNA Scr AMPKα1 AMPKα2
A
D
FoxO3a
Actin
ScrsiRNA FoxO3a
Scr
FoxO
3a
CT HC
30 µm
FoxO3a
Pol IINuclear Fraction
CT 0.5 1 2 40
1
2
3
4
**
Time (h)
CT HC CT HC0
5
10
15
*
CT HC CT HC0.0
2.5
5.0
7.5 *
Fold
MuR
F1/ A
ctin
by guest on November 9, 2018 http://www.jbc.org/ Downloaded from
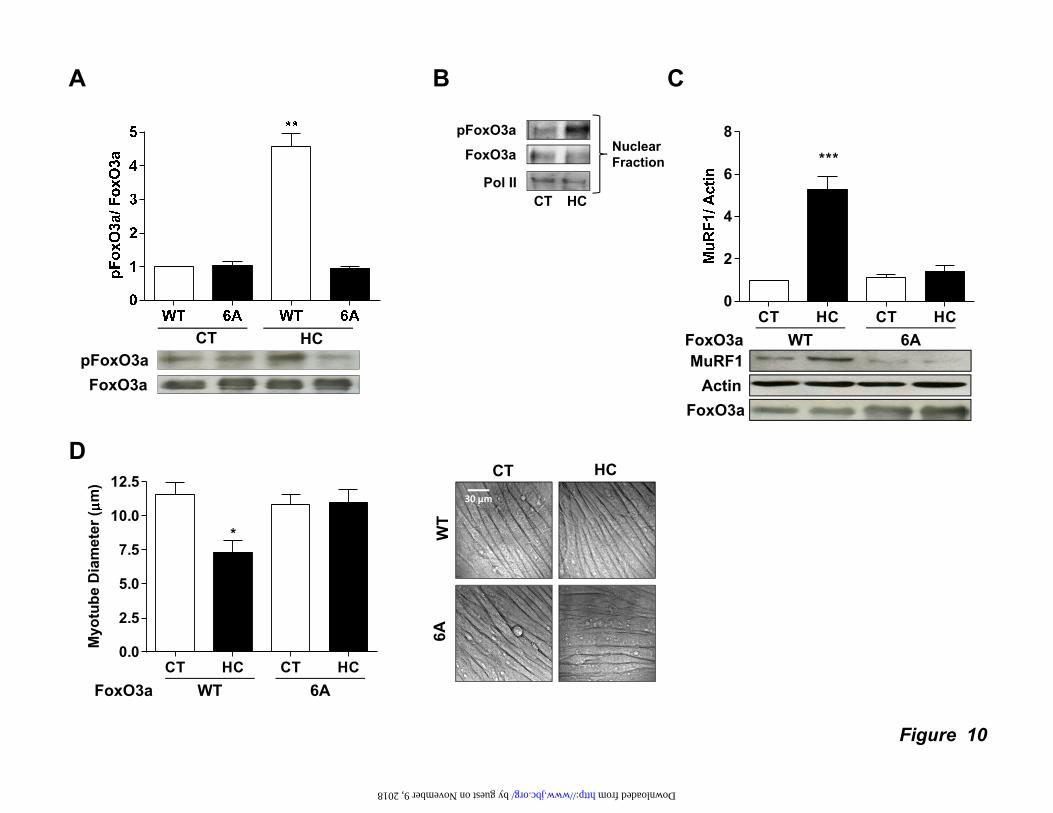
Figure 10
A B
DW
T6A
CT HC 30 µm
C
pFoxO3a
FoxO3a
CT HC
Nuclear Fraction
Pol II
pFoxO3aFoxO3a
CT HC
CT HC CT HC0.0
2.5
5.0
7.5
10.0
12.5
*
Myo
tube
Dia
met
er (
m)
WT 6AFoxO3a
CT HC CT HC0
2
4
6
8
***
MuRF1Actin
FoxO3a
WT 6AFoxO3a
by guest on November 9, 2018 http://www.jbc.org/ Downloaded from
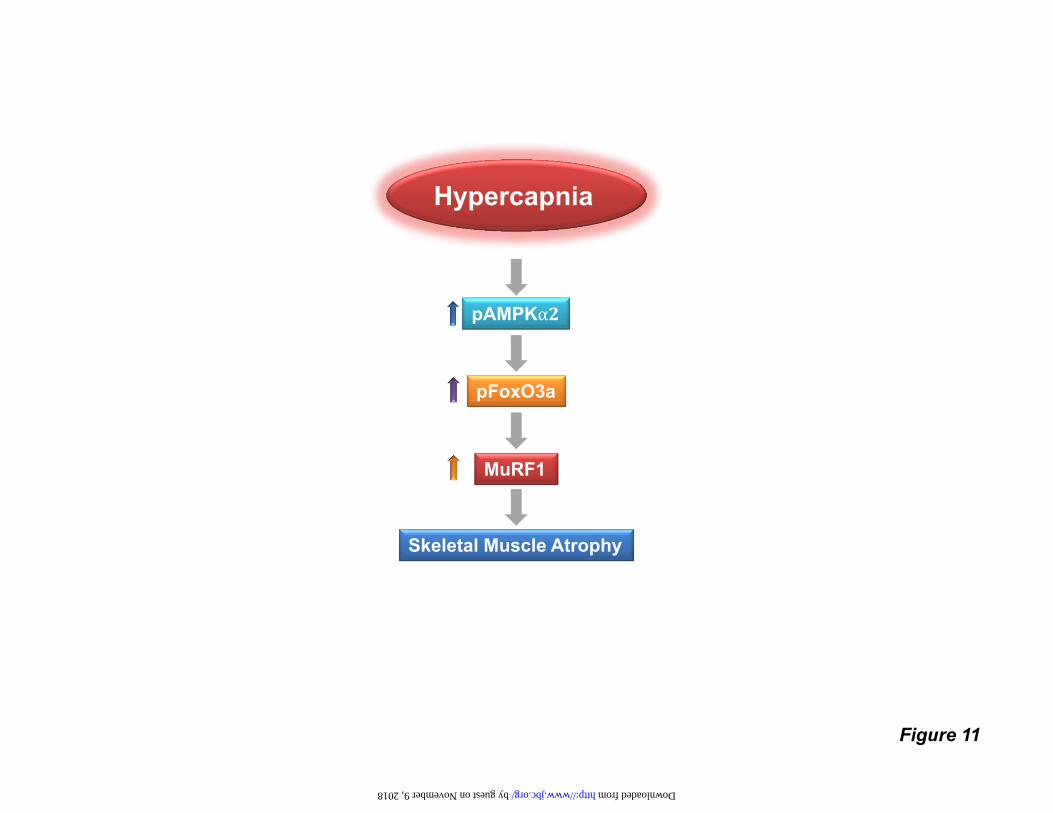
Figure 11
pAMPKα
Skeletal Muscle Atrophy
pFoxO3a
MuRF1
Hypercapnia
by guest on November 9, 2018 http://www.jbc.org/ Downloaded from

Barreiro, Cam Patterson, Gustavo A. Nader and Jacob I. SznajderCheng, Galina Gusarova, Ermelinda Ceco, Chang Liu, Masahiko Shigemura, Esther
Ariel Jaitovich, Martín Angulo, Emilia Lecuona, Laura A. Dada, Lynn C. Welch, Yuanmuscle-specific ring finger protein1 (MuRF1)
levels cause skeletal muscle atrophy via AMPK, FoxO3a and2High CO
published online February 17, 2015J. Biol. Chem.
10.1074/jbc.M114.625715Access the most updated version of this article at doi:
Alerts:
When a correction for this article is posted•
When this article is cited•
to choose from all of JBC's e-mail alertsClick here
by guest on Novem
ber 9, 2018http://w
ww
.jbc.org/D
ownloaded from