high - iene concrete buttres gravity, ... while keeping in a high degree the safety of the dams, ......
TRANSCRIPT

Ioannis Argyrakis Director Hydroelectric Generation Department
1
HYDROELECTRIC PRODUCTION OF PPC S.A.
HIGH
• AVAILABILITY • RELIABILITY • FLEXIBILITY
A
GENERAL INFORMATION FOR HPP’s of PPC SA
2

HPPs location
3

The Hydroelectric development from 1950 up to date
Hellas is an over 80 % mountainous country with a complicated rugged relief and a variety of climates Hydroelectric Power Plants are situated in the northwestern part, where most of the mountains are located
4

1950-1975
8 large Hydroelectric Power Plants, totalling 1.410 MW, were built. Among them the 3 biggest ones : Agras,
Ladhon, Louros, Tavropos,
Kremasta, Kastraki,
Edessaios, Polyphyto
5

1976 up to date
9 large & 5 small Hydroelectric Power Plants, totalling 1.800,2 MW, were built. Among them the two pump storage plants: Pournari I & II, Sfikia, Assomata, Stratos I, Stratos II, Pighai Aoos, Thissavros, Platanovryssi, Ghiona, Makrochori, Aghia Varvara, Ilarion HPP, Ilarion SHPP
6

HYDROELECTRIC POWER PLANTS of PPC S.A.
IN OPERATION
7
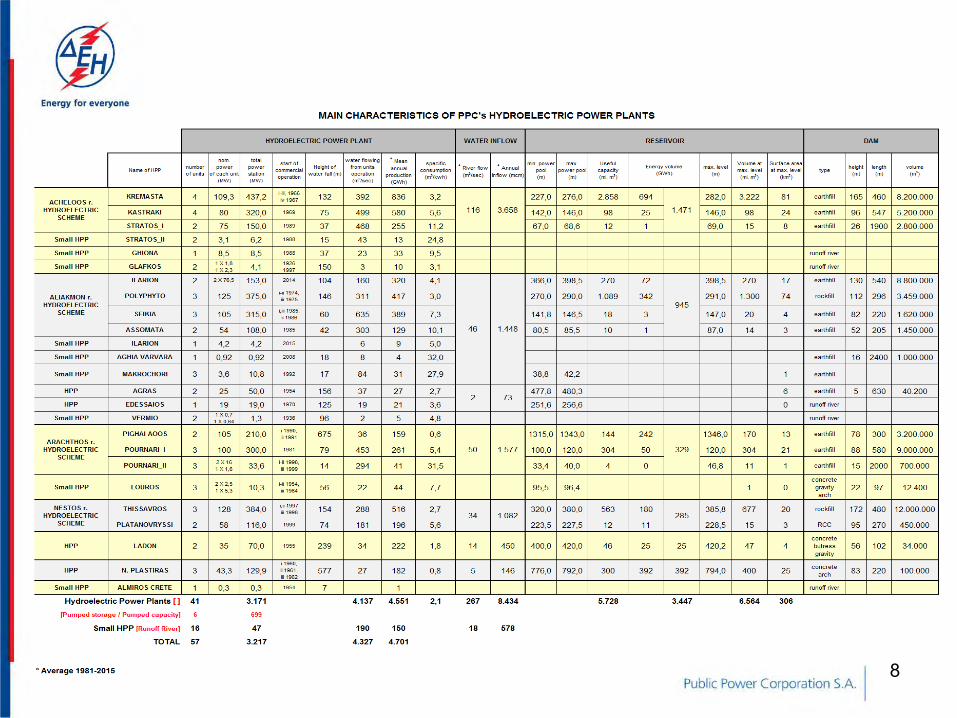
8

The actual situation of PPC Hydroelectric Power Plants - Acheloos r. Hydro Scheme (Kremasta, Kastraki, Stratos-I): 907,2 MW - Aliakmon r. Hydro Scheme (Ilarion, Polyphyto, Sfikia, Assomata / Agras,
Edessaios): 1020,0 MW - Arachthos r. Hydro Scheme (Pournari-I, Pournari-II / Aoos): 543,6 MW - Nestos r. Hydro Scheme (Thissavros-Platanovryssi): 500 MW - N. Plastiras HPP (Tavropos r.): 129,9 MW - Ladon HPP (Ladon r.): 70 MW - Small HPP: 46,7 MW
TOTAL: 3.217,4 MW
9

Small Hydroelectric Power Plants - SHPP Stratos II on Acheloos river in Western Greece: Capacity 6.2 MW
- SHPP Giona on Mornos river in Central Greece: Capacity 8.5 MW
- SHPP Glafkos on Glafkos river in South-Western Greece: Capacity 4.1 MW
- SHPP Ilarion on Aliakmon river in North-Western Greece: Capacity 4.2 MW - SHPP Aghia Varvara on Aliakmon river in North Greece: Capacity 0.92 MW
- SHPP Makrochori on Aliakmon river in North Greece: Capacity 10.8 MW
- SHPP Vermio on Tripotamos river in North Greece: Capacity 1.34 MW
- SHPP Louros on Louros river in Western Greece: Capacity 10.3 MW
- SHPP Almiros on Almiros river on Crete island: Capacity 0.3 MW
TOTAL: 46.7 MW
10
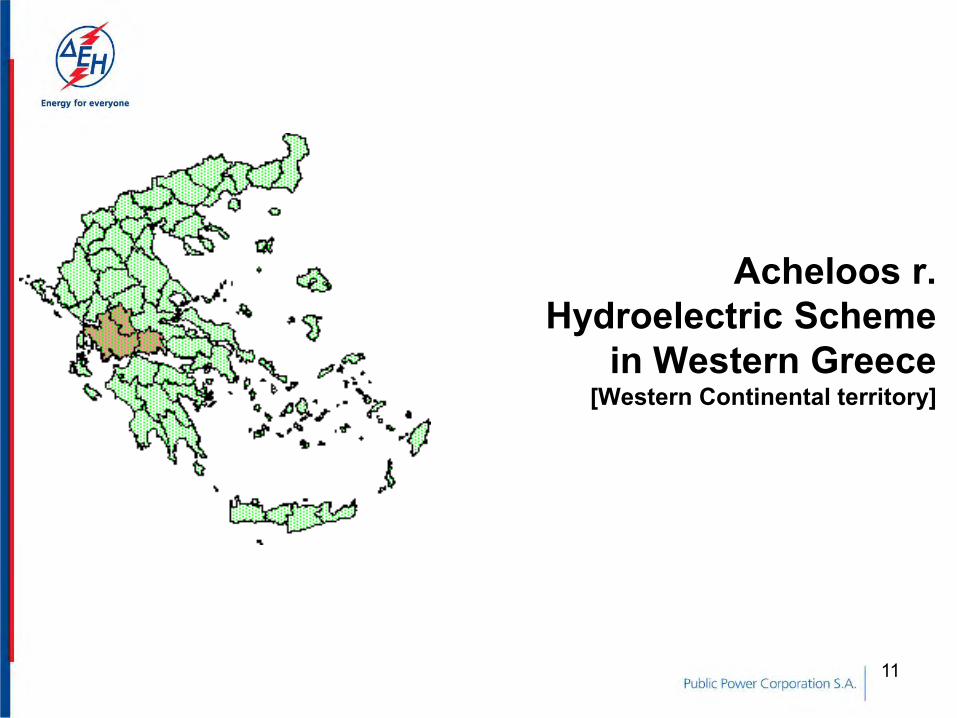
Acheloos r. Hydroelectric Scheme
in Western Greece [Western Continental territory]
11
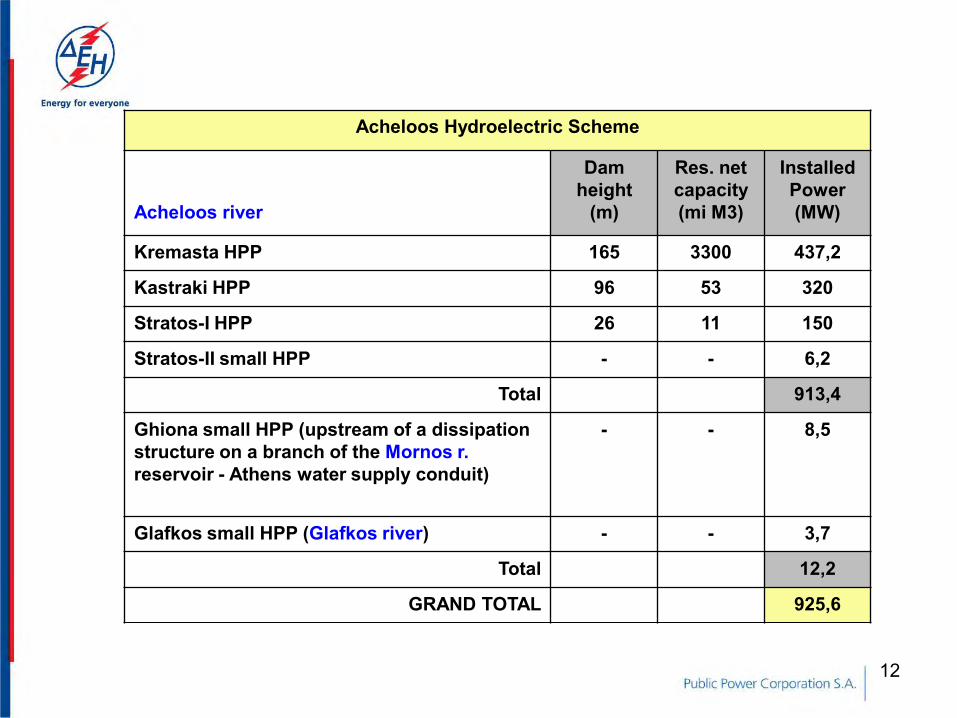
Acheloos Hydroelectric Scheme
Acheloos river
Dam height
(m)
Res. net capacity (mi M3)
Installed Power (MW)
Kremasta HPP 165 3300 437,2
Kastraki HPP 96 53 320
Stratos-I HPP 26 11 150
Stratos-II small HPP - - 6,2
Total 913,4
Ghiona small HPP (upstream of a dissipation structure on a branch of the Mornos r. reservoir - Athens water supply conduit)
- - 8,5
Glafkos small HPP (Glafkos river) - - 3,7
Total 12,2
GRAND TOTAL 925,6
12
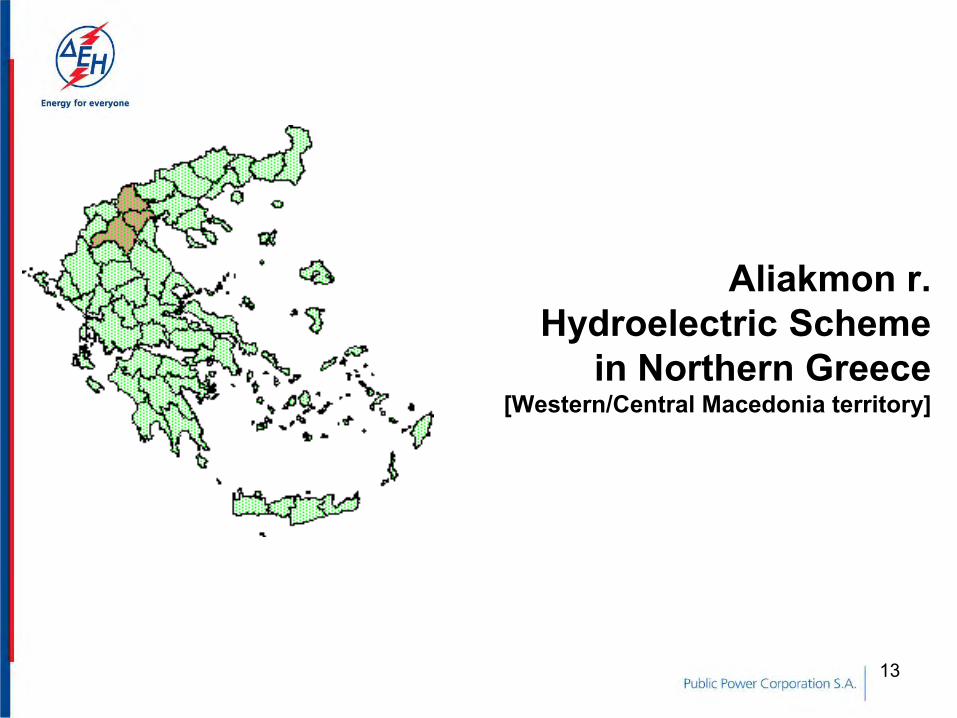
Aliakmon r. Hydroelectric Scheme
in Northern Greece [Western/Central Macedonia territory]
13

Aliakmon Hydroelectric Scheme Aliakmon river
Dam height (m)
Res. net capacity (mi
M3)
Installed Power (MW)
Ilarion HPP 130 270 153
Ilarion Small HPP 4,2
Polyphyto HPP 112 1220 375
Sfikia HPP (pump-storage) 82 18 315
Assomata HPP 52 10 108
Aghia Varvara Small HPP 0,9
Makrochori Small HPP - - 10,8
Total 966,9
Aliakmon tributaries
Vermio small HPP (Tripotamos r.) - - 1,34
Agras HPP (Vodas r.) - - 50
Edessaios HPP (Vodas r.) - - 19
Total 70,3
GRAND TOTAL 1037,3
14

Arachthos r. Hydroelectric Scheme
in Northwestern Greece [Epirus territory]
15

Arachthos Hydroelectric Scheme
Springs of Aoos river
Dam height (m)
Res. net capacity (mi
M3)
Installed Power (MW)
Pighai Aoos HPP 78 144,3 210
Arachthos river
Pournari_I HPP 87 303 300
Pournari_II HPP 15 4 33,6
Louros river
Louros small HPP 22 0,37 10,3
TOTAL 553,9
16
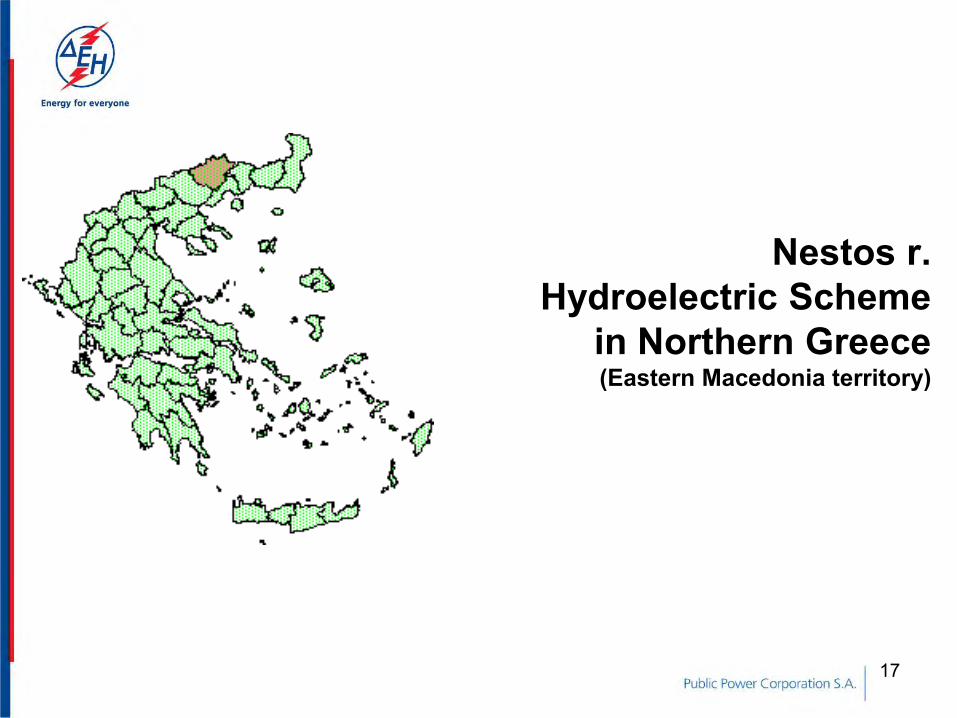
Nestos r. Hydroelectric Scheme
in Northern Greece (Eastern Macedonia territory)
17

Nestos Hydroelectric Scheme
Nestos river
Dam height (m)
Res. net capacity (mi M3)
Installed Power (MW)
Thissavros HPP (pump-storage) 172 565 384
Platanovryssi HPP 95 57 116
TOTAL 500
18

Ladon hydroelectric
power plant in Southern Greece
[Peloponnese territory]
19

Ladon Hydroelectric Power Plant (Ladon river) Location: Central Peloponnese, Arcadia prefecture Purpose: hydropower, water supply Commercial operat.: 1955 Installed power: 70 ΜW (2x35) Francis type turbines Mean an. Product.: 260 GWH Dam: concrete buttres gravity, 56 m height Reserv. net cap.: 46,2 m.c.m.
20

N. Plastiras hydroelectric plant
in Central Greece [Thessalia territory]
21

N. Plastiras Hydroelectric Power Plant (Tavropos river) Location: Thessaly, Karditsa prefecture Purpose: hydropower, irrigation water supply Commercial operat.: 1962 Installed power: 129,9 ΜW (3x43,3) Francis type turbines Mean an. Product.: 198 GWH Dam: concrete arch, 83 m height Reserv. net cap.: 300 m.c.m.
22

The multiple role of HPP
• Produce “clear” renewable energy, cover peak load demands and offer ancillary services to the Grid
• Flood control • Retain water flows and use during draught • Irrigation & Cities Water supply • Water supply for cooling PPC’s Thermal Plant units and other industry
needs • Fishing, maritime sports, alternative tourism, etc • Road construction and other substructures in the local region • In general, hydropower plants upgrade the environment by providing
ecological flow into the river beds and constituting water habitats of unique beauty for the local aquatic fauna
23

24

25
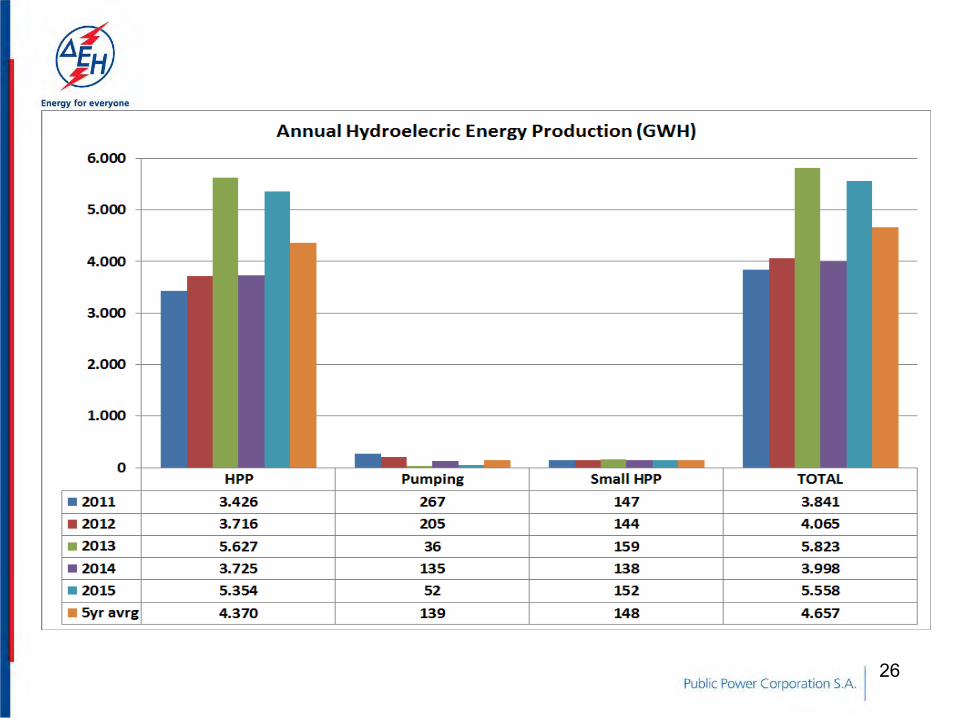
26

27
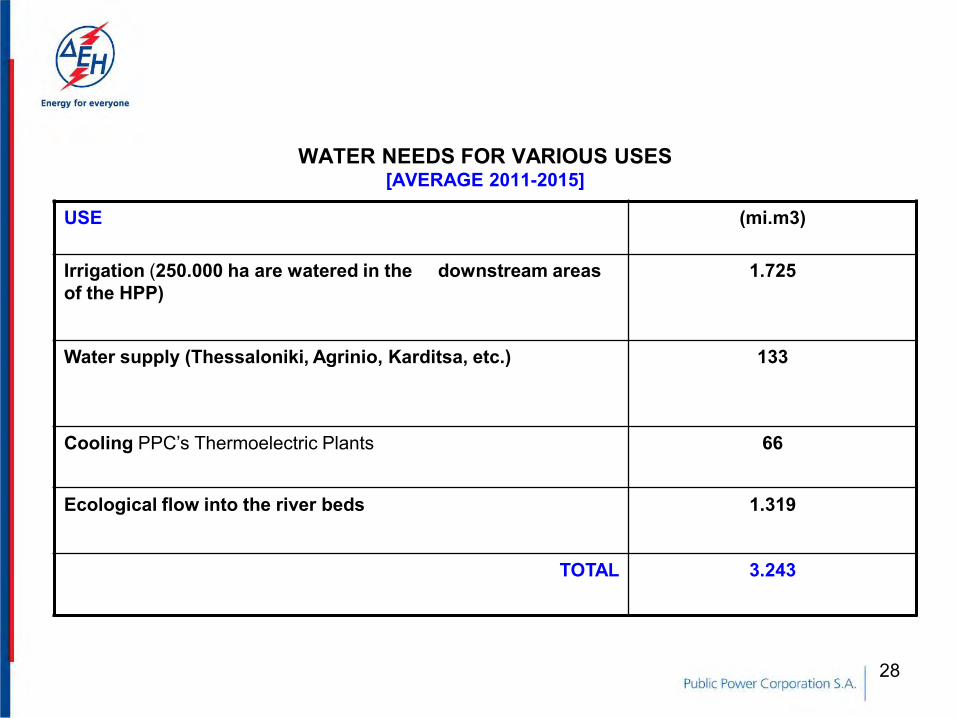
WATER NEEDS FOR VARIOUS USES [AVERAGE 2011-2015]
USE (mi.m3)
Irrigation (250.000 ha are watered in the downstream areas of the HPP)
1.725
Water supply (Thessaloniki, Agrinio, Karditsa, etc.) 133
Cooling PPC’s Thermoelectric Plants 66
Ecological flow into the river beds 1.319
TOTAL 3.243
28

29

PPC’s NEW HYDROELECTRIC PROJECTS
30

PPC’ s NEW HYDROELECTRIC PROJECTS
UNDER CONSTRUCTION • MESSOCHORA HEP • IKARIA HYBRID POWER PROJECT • METSOVITIKO HEP RESENTLY FINISHED • PAPADIA DAM • AG. VARVARA REREGULATING PROJECT • ILARION HEP
31

B
OPERATION OF HPPs OF PPC SA AND THEIR CONTRIBUTION IN WATER MANAGEMENT
32

1. GENERAL
• HPPs OF PPC SA manage a great portion of water reserves in Greece ,and as multipurpose schemes provide additional services and water uses for third parties( flood control, irrigation, water supply, recreation etc ).
• Mean annual water quantity that PPS SA manages is about 8 billion cu. Meters.
• Net actual storage capacity of PPC΄s reservoirs is about 5,73 bill.cub meters ,corresponding to 3350 Gwh (max)
33

2. STRATEGIC TARGET IN HPP’s EXPLOITATION • As a General Target related to the HPPs exploitation strategy , is to optimize the
value of water inflows not only from the energy production point of view but also by covering the needs of water to third parties , while keeping in a high degree the safety of the dams, avoiding as much as it is possible water spilling.
• Maximizing the energy potential, we have to keep the reservoir’s level higher and operate the hydro units at the best efficiency load.
• Operation in peak loads contributes in maximizing the value of energy produced by a certain quantity of water
34
Maximizing the value of Water Inflows and securing water reserves for covering water demand means:
• High level in reservoirs • Peak operation Risks to be taken: • Water spilling • Decreased flood control capability • Dam safety
3. CONSTRAINS IN HPPs OPERATION ( 1)
35
Meteorological forecasts are stochastic especially for long period so the methodology for water management is based on:
• Statistic data for 20 years • Technical data of the installations • Water needs • Energy demand • Constrains in the exploitation procedure (limits in water discharges down stream ) • Experience
3. CONSTRAINS IN HPPs OPERATION ( 2)
36
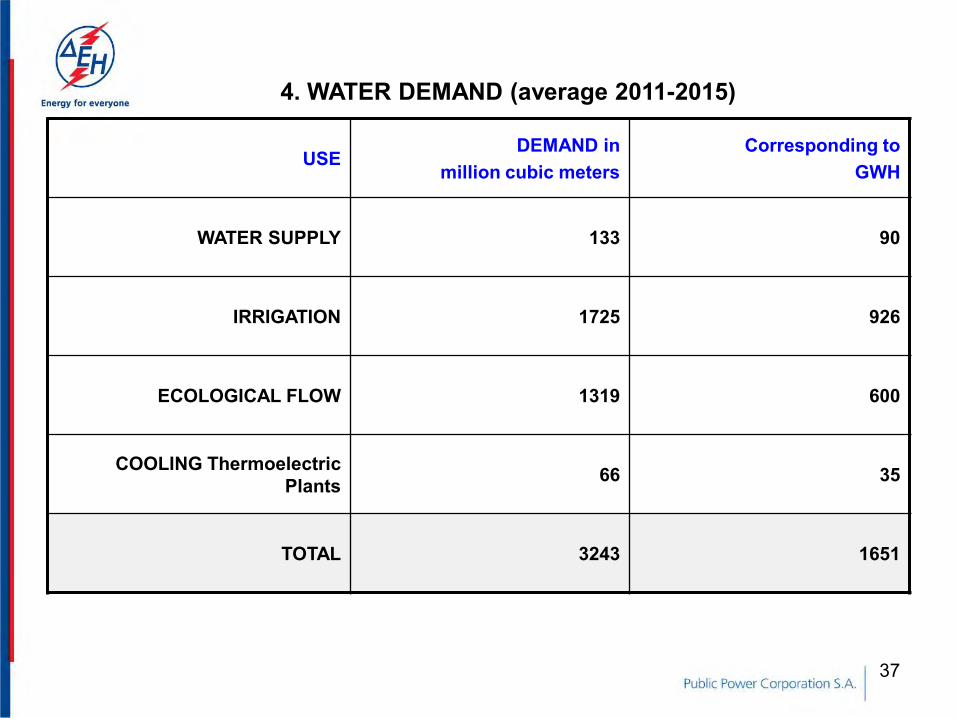
USE DEMAND in
million cubic meters Corresponding to
GWH
WATER SUPPLY 133 90
IRRIGATION 1725 926
ECOLOGICAL FLOW 1319 600
COOLING Thermoelectric Plants 66 35
TOTAL 3243 1651
4. WATER DEMAND (average 2011-2015)
37

5. WATER MANAGEMENT
WATER RESERVES DEVELOPMENT TARGET:END OF MAY WATER RESERVES……..2650-3130 Gwh
• OCTOBER …………………………..1650 – 1850 (average 1750) Gwh
• DECEMBER ………………………... 1750 – 2050 (average 1900) Gwh
• MARCH …………………………... 2210– 2625 (average 2420) Gwh
• MAY ( END ) ………………………... 2650 – 3130 (average 2880) Gwh
38

39

40

41

42
43

44

45

46

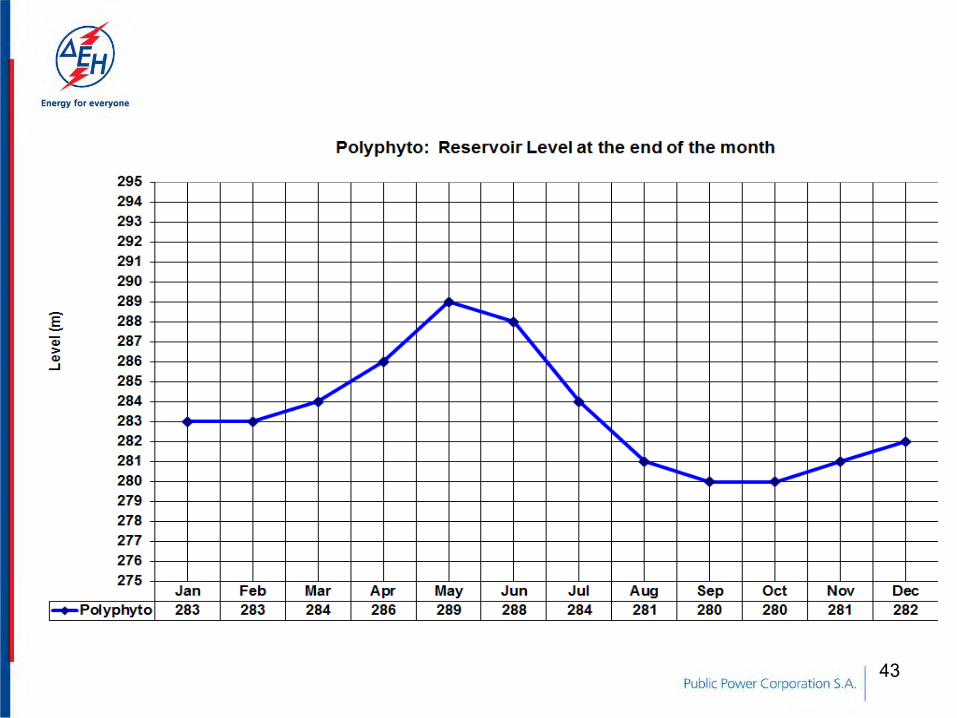
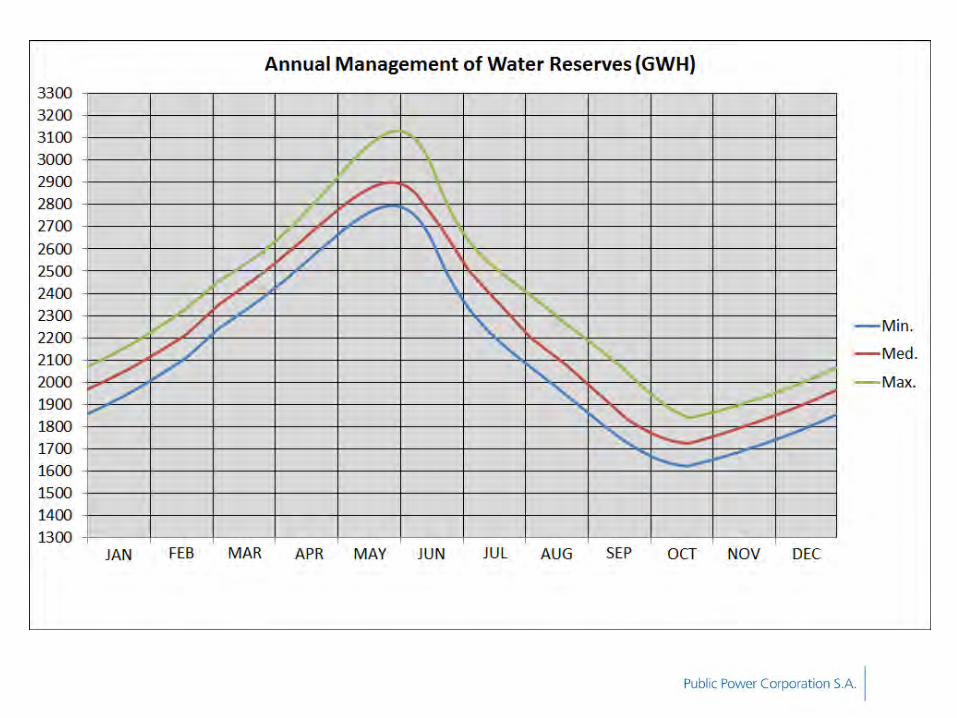
STATISTICAL CURVES FOR WATER RESERVES FOR EACH MONTH
47
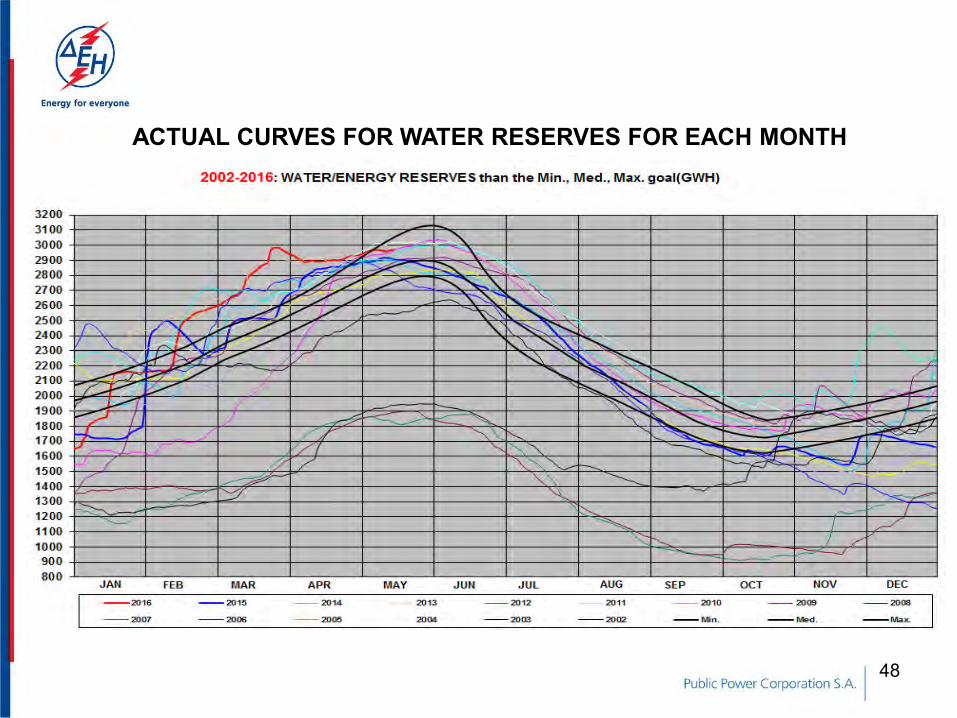
ACTUAL CURVES FOR WATER RESERVES FOR EACH MONTH
48

49

50

C
CAPACITY AVAILABILITY
51

1. BASED ON SCHEDULING
52

The water reserve formed practically at 8 main reservoirs (Kremasta, Ilarion, Polyphyto, Thissavros, Pournari, Ladon, Plastiras, Aoos). For each main reservoir there is "guide curve" with temporal variation of water level corresponding to the optimal statistics storage compared to the safety of the dam, the water available to third parties, the volume of water that can be diverted to the riverbed, avoiding overflow, etc. The “water level guide curve" (tries to be followed in each reservoir management) can be expressed as a curve varying water reserve and thus as an energy inventory change curve for each reservoir. The composition of 8 "guide curves" originates the best guide curve for three storage zones (max., med., min.) for optimal utilization of water reserve.
53

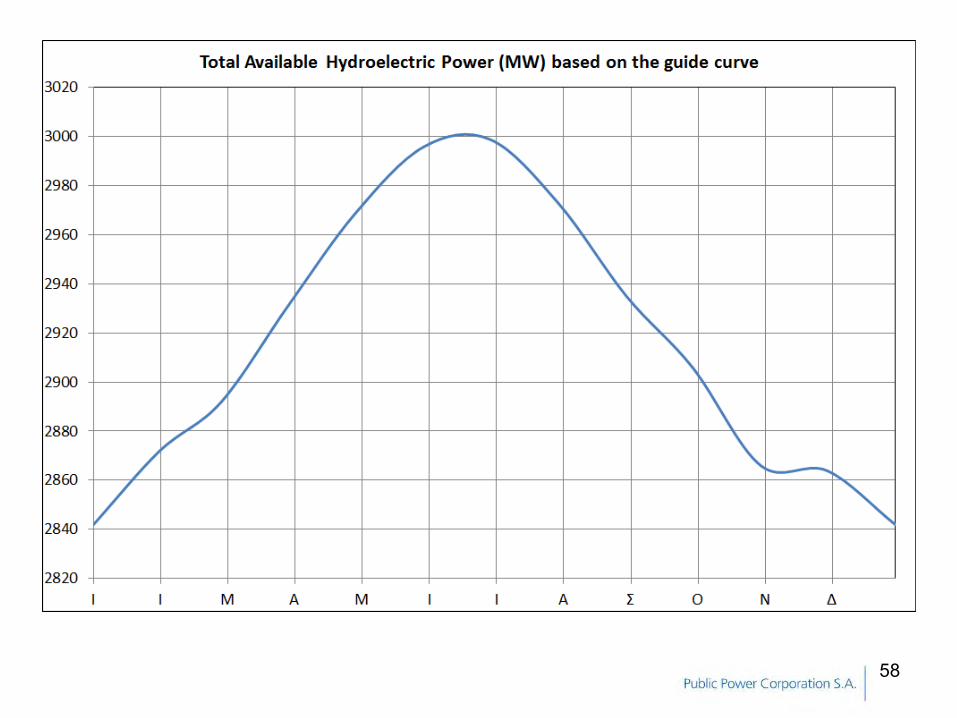
Varying the level of Principal Reservoir, it has a very small impact on the power units supplied by them, while the intermediate reservoirs maintain practically constant level and thus stable power units of HPP which feed.
If by assigning varying the power of the HPP Units as described above are affected by the change in level of the respective reservoirs shows the graph of the change in the total power of HPP corresponding to the desired storage area.
Of the total available power curve we conclude that the minimum available hydro power is ~ 2840 MW at certain period (So available power ≥2840 MW).
54
55

56

57
58

2. ACTUAL RESULTS
59

60

Since actual data for the years 2000 ~ 2014 demonstrated that the desired storage area not only maintained but increased risk taking and certain times of year, the storage is maintained at higher levels. (This corresponds to the maximum of the individual curved guides). Declared availabilities per HPP unit also obtained and the total declared availability of HPP.
61

62

63

64

Reported actual data fully confirm the details of our programming (Cap. 1), namely: 1.The total declared availability of HPP (which we never had problems deviations), has never fallen below 2800 MW.
2.The maximum available power is around 2950MW, and almost as much as the installed capacity of large HPPs (Not including small HPPs).
3.The average power available for the period under examination amounts to 2868 MW.
4.The actual available power, declared for the indicated time at 61% of the time than the average volume of 2868MW and only 39% of the time just short ie just 2.3% of the average.
65

CONCLUSIONS – COMMENTARY • The above document effortlessly that the available power of HPPs is
always more than 2800 MW, and the average annual power available is
superior (2868 MW).
• The reliability of HPP on the availability of Hydro Units exceeds 93%.
• The Hydro Units have rapid response in order to take cargo and
flexibility to meet the system requirements.
• For all these endeavors impairment capacity availability of HPPs of said
technically unsubstantiated and unjust offset the contribution of HPPs
in the National Interconnected System.
66

Thank you!