high efficiency, low emission refrigeration system · high efficiency, low emission refrigeration...
TRANSCRIPT
ORNL/TM-2016/363 CRADA/NFE-11-03296
High Efficiency, Low Emission Refrigeration System
Brian A. Fricke Vishaldeep Sharma
August 2016
Approved for public release. Distribution is unlimited.
DOCUMENT AVAILABILITY
Reports produced after January 1, 1996, are generally available free via US Department of Energy (DOE) SciTech Connect. Website http://www.osti.gov/scitech/ Reports produced before January 1, 1996, may be purchased by members of the public from the following source: National Technical Information Service 5285 Port Royal Road Springfield, VA 22161 Telephone 703-605-6000 (1-800-553-6847) TDD 703-487-4639 Fax 703-605-6900 E-mail [email protected] Website http://www.ntis.gov/help/ordermethods.aspx Reports are available to DOE employees, DOE contractors, Energy Technology Data Exchange representatives, and International Nuclear Information System representatives from the following source: Office of Scientific and Technical Information PO Box 62 Oak Ridge, TN 37831 Telephone 865-576-8401 Fax 865-576-5728 E-mail [email protected] Website http://www.osti.gov/contact.html
This report was prepared as an account of work sponsored by an agency of the United States Government. Neither the United States Government nor any agency thereof, nor any of their employees, makes any warranty, express or implied, or assumes any legal liability or responsibility for the accuracy, completeness, or usefulness of any information, apparatus, product, or process disclosed, or represents that its use would not infringe privately owned rights. Reference herein to any specific commercial product, process, or service by trade name, trademark, manufacturer, or otherwise, does not necessarily constitute or imply its endorsement, recommendation, or favoring by the United States Government or any agency thereof. The views and opinions of authors expressed herein do not necessarily state or reflect those of the United States Government or any agency thereof.
ORNL/TM-2016/363
CRADA/NFE-11-03296
Building Technologies Research and Integration Center
HIGH EFFICIENCY, LOW EMISSION REFRIGERATION SYSTEM
Brian A. Fricke
Vishaldeep Sharma
Date Published: August 2016
Prepared by
OAK RIDGE NATIONAL LABORATORY
Oak Ridge, Tennessee 37831-6283
managed by
UT-BATTELLE, LLC
for the
US DEPARTMENT OF ENERGY
under contract DE-AC05-00OR22725
Approved for Public Release

iii
CONTENTS
Page
CONTENTS ................................................................................................................................................. iii LIST OF FIGURES ...................................................................................................................................... v LIST OF TABLES ...................................................................................................................................... vii ACRONYMS ............................................................................................................................................... ix ACKNOWLEDGMENTS ........................................................................................................................... xi ABSTRACT ............................................................................................................................................... xiii 1. INTRODUCTION ................................................................................................................................ 1
1.1 PROJECT OBJECTIVES ........................................................................................................... 2 1.2 MOTIVATION ........................................................................................................................... 2 1.3 CURRENT PRACTICE .............................................................................................................. 2 1.4 OUTLINE OF THIS REPORT ................................................................................................... 3
2. ANALYSIS OF REFRIGERATION SYSTEMS AND REFRIGERANT OPTIONS ......................... 5 2.1 LIFE CYCLE CLIMATE PERFORMANCE (LCCP) ............................................................... 5 2.2 ENERGY MODELING .............................................................................................................. 6 2.3 REFRIGERATION SYSTEMS .................................................................................................. 6
2.3.1 Refrigerated Display Cases and Walk-Ins ..................................................................... 7 2.3.2 Refrigeration Systems .................................................................................................... 8
2.4 RESULTS AND DISCUSSION ................................................................................................. 8 2.4.1 Energy Consumption ..................................................................................................... 8 2.4.2 Life Cycle Climate Performance.................................................................................. 10
2.5 SUMMARY .............................................................................................................................. 12 3. FURTHER ANALYSIS OF CO2 BASED REFRIGERATION SYSTEMS ...................................... 13
3.1 DESCRIPTION OF CO2 BASED REFRIGERATION SYSTEMS ......................................... 13 3.1.1 Secondary Loop and Cascade Systems ........................................................................ 13 3.1.2 Transcritical CO2 Booster Systems .............................................................................. 17
3.2 SYSTEM ANALYSIS .............................................................................................................. 18 3.3 METHODOLOGY ................................................................................................................... 18
3.3.1 Baseline Parameters ..................................................................................................... 18 3.3.2 System Operating Assumptions ................................................................................... 19
3.4 RESULTS AND DISCUSSION ............................................................................................... 21 3.4.1 Cascade and Secondary Loop Systems ........................................................................ 21 3.4.2 Transcritical Booster Systems ...................................................................................... 23 3.4.3 Comparison of CO2-based Refrigeration Systems with the Baseline System.............. 25 3.4.4 Climate Zones .............................................................................................................. 25
3.5 SUMMARY .............................................................................................................................. 26 4. LABORATORY-SCALE HIGH-EFFICIENCY, LOW-EMISSION REFRIGERATION
SYSTEM............................................................................................................................................. 27 4.1 COMPRESSOR RACK ............................................................................................................ 28 4.2 REFRIGERATED DISPLAY CASES AND FALSE LOADS ................................................ 28 4.3 AIR-COOLED GAS COOLER/CONDENSER ....................................................................... 29 4.4 REFRIGERATION SYSTEM CONROLS............................................................................... 29 4.5 INSTRUMENTATION ............................................................................................................ 30
5. EVALUATION OF HIGH EFFICIENCY, LOW EMISSION REFRIGERATION SYSTEM ......... 31 5.1 LABORATORY PERFORMANCE DATA ............................................................................. 31 5.2 DISCUSSION ........................................................................................................................... 36
6. FUTURE WORK ................................................................................................................................ 37
iv
6.1 FIELD EVALUATION ............................................................................................................ 37 6.1.1 General Plan ................................................................................................................. 37 6.1.2 Data Acquisition .......................................................................................................... 37 6.1.3 Field Evaluation Report ............................................................................................... 38 6.1.4 Progress-to-Date .......................................................................................................... 38
6.2 SYSTEM MODIFICATIONS .................................................................................................. 38 6.2.1 Ejectors ........................................................................................................................ 39 6.2.2 Parallel Compression ................................................................................................... 39 6.2.3 Adiabatic Gas Cooler ................................................................................................... 39 6.2.4 Mechanical Subcooler .................................................................................................. 39
6.3 SUMMARY .............................................................................................................................. 40 7. CONCLUSIONS ................................................................................................................................ 41 8. REFERENCES ................................................................................................................................... 43 APPENDIX A. MEASUREMENT POINTS FOR LABORATORY-SCALE TRANSCRITICAL
CO2 REFRIGERATION SYSTEM ...................................................................................................... 1 APPENDIX A. MEASUREMENT POINTS FOR LABORATORY-SCALE TRANSCRITICAL
CO2 REFRIGERATION SYSTEM ...................................................................................................... 3
v
LIST OF FIGURES
Figure Page
Figure 1. Schematic of multiplex direct expansion (DX) supermarket refrigeration system........................ 1 Figure. 2. Annual electrical energy consumption of the various refrigeration systems in the seven
climate zones of the continental United States, relative to the baseline R-404A DX
system in Miami, FL. ................................................................................................................ 9 Figure 3. Carbon dioxide equivalent emissions of the various refrigeration systems in the seven
climate zones of the continental United States, relative to the baseline R-404A DX
system in Miami, FL. .............................................................................................................. 10 Figure 4. Average direct and indirect carbon dioxide equivalent emissions for the various
refrigeration systems. .............................................................................................................. 11 Figure 5. Cycle schematic and pressure-enthalpy (p-h) diagram for the baseline multiplex direct
expansion (DX) refrigeration system. ..................................................................................... 14 Figure 6. Cycle schematic and pressure-enthalpy (p-h) diagram for the CO2 secondary coolant (SC)
refrigeration system. ................................................................................................................ 14 Figure 7. Cycle schematic and pressure-enthalpy (p-h) diagram for the CO2 direct expansion
cascade (DEC) refrigeration system. ....................................................................................... 15 Figure 8. Cycle schematic and pressure-enthalpy (p-h) diagram for the combined CO2
secondary/cascade (CSC) refrigeration system. ...................................................................... 16 Figure 9. Cycle schematic and pressure-enthalpy (p-h) diagram for the combined glycol
secondary/CO2 Cascade (CSC-G) refrigeration system. ......................................................... 16 Figure 10. Cycle schematic and pressure-enthalpy (p-h) diagram for the standard transcritical CO2
booster refrigeration system (STBS). ...................................................................................... 17 Figure 11. Cycle schematic and pressure-enthalpy (p-h) diagram for the transcritical CO2 booster
refrigeration system with bypass compressor (TBS-BC). ....................................................... 18 Figure 12. COP and work ratio vs. ambient temperature with CR = 1.5 for Combined System 1. ............ 21 Figure 13. COP vs. ambient temperature with TLT = 9 R (5 K) for the CSC system (System 4). ............ 22 Figure 14. Performance of the STBS system (System 6) for ƐSLHX = 0.4 and ΔT = 9 R (5 K).
(a) System COP and work ratios, (b) Mass flow ratio............................................................. 23 Figure 15. Mass flow ratio vs. ambient temperature with ΔT = 9 R (5 K) for the STBS (System 6). ........ 24 Figure 16. System COP vs. ambient temperature at ƐSLHX = 0.4, ΔT = 9 R (5 K) and CR = 1.5.
(a) Transcritical booster systems, (b) Cascade/secondary systems. ........................................ 25 Figure 17. Schematic of the laboratory-scale transcritical CO2 booster refrigeration system. ................... 27 Figure 18. Average medium-temperature (MT) and low-temperature (LT) refrigeration loads for the
transcritical CO2 refrigeration system. .................................................................................... 32 Figure 19. Average total compressor power for the transcritical CO2 refrigeration system. ...................... 33 Figure 20. Coefficient of performance (COP) for the transcritical CO2 refrigeration system. ................... 33 Figure 21. Gas cooler inlet pressure for the transcritical CO2 refrigeration system. .................................. 34 Figure 22. Medium-temperature (MT) compressor discharge temperature, and gas cooler inlet and
outlet temperatures. ................................................................................................................. 35 Figure 23. Comparison of COP for R-404A multiplex DX and transcritical CO2 booster
refrigeration systems. .............................................................................................................. 36

vii
LIST OF TABLES
Table Page
Table 1. U.S. climate zones and cities used in energy simulations ............................................................... 6 Table 2. Rated load of standard- and high-efficiency refrigerated display cases ......................................... 7 Table 3. Global warming potential (GWP) values for selected refrigerants (ASHRAE, 2009; Spatz
and Minor, 2008) ....................................................................................................................... 8 Table 4. Average percent reduction in CO2eq emissions relative to the baseline standard-efficiency
R-404A multiplex DX system ................................................................................................. 11 Table 5. Refrigeration capacity and required power ................................................................................... 19 Table 6. Parameters and their ranges .......................................................................................................... 19 Table 7. Baseline parameters of refrigeration systems ............................................................................... 20 Table 8. U.S. climate zones, cities and annual average COP for several CO2-based refrigeration
systems .................................................................................................................................... 26 Table 9. Compressor specifications ............................................................................................................ 28 Table 10. Compressor rack capacity ........................................................................................................... 28 Table 11. Refrigerated display case specifications ..................................................................................... 29 Table 12. Specifications of instrumentation ............................................................................................... 30 Table 13. Refrigeration system parameters ................................................................................................. 35

ix
ACRONYMS
ACRONYMS
BTO U.S. Department of Energy Building Technolgies Office
CFC clorofluorocarbon
COP coefficient of performance
CR circulation ratio
CRADA cooperative research and development agreement
CSC combined CO2 secondary/cascade system
CSC-G combined glycol secondary/CO2 cascade system
DEC direct expansion cascade system
DOE U.S. Department of Energy
DX direct expansion
EC electronically commutated
EEV electronic expansion valve
EPA U.S. Environmental Protection Agency
GC gas cooler
GWP global warming potential
HC hydrocarbon
HCFC hydroclorofluorocarbon
HFC hydrofluorocarbon
HVAC heating, ventilating and air-conditioning
LCCP life cycle climate performance
LED light emitting diode
LT low temperature
MT medium temperature
ODP ozone depletion potential
ORNL Oak Ridge National Laboratory
PNNL Pacific Northwest National Laboratory
PSC permanent split capacitor
RH relative humidity
SC secondary coolant system
SLHX suction line heat exchanger
STBS standard transcritical booster system
TBS-BC transcritical booster system with bypass compressor
TBS-UX transcritical booster system with upstream expansion valve
VARIABLES
h enthalpy
E carbon dioxide equivalent emissions
�̇� mass flow rate
MR refrigerant mass flow ratio
P pressure
�̇� rate of heat transfer
T temperature
ΔT evaporator superheat
�̇� power
WR compressor work ratio
x
Greek Symbols
Ɛ heat exchanger effectiveness
Subscripts
amb ambient
app approach
BP bypass
circ refrigerant circuit
comp compressor
cond condensing
direct direct emissions
energy emissions associated with production and distribution of electricity
EOL emissions associated with refrigerant release at end-of-life
GC gas cooler
HP high-pressure
indirect indirect emissions
int intermediate
leakage emissions due to refrigerant leakage
LP low-pressure
LT low temperature
manuf emissions associated with the manufacture of refrigerants and refrigeration systems
MT medium temperature
pump pump
recycle emissions associated with the energy to recycle refrigeration systems at end-of-life
ref refrigerating capacity
service emissions associated with refrigerant release during service events
STBS standard transcritical booster system
TBS-BC transcritical booster system with bypass compressor
TBS-UX transcritical booster system with upstream expansion valve
total sum around refrigeration cycle
xi
ACKNOWLEDGMENTS
This report and the work described were sponsored by the Emerging Technologies Program within the
Building Technologies Office (BTO) of the US Department of Energy (DOE) Office of Energy Efficiency
and Renewable Energy. The authors wish to acknowledge the support of Antonio Bouza in guiding this
work. A special debt of gratitude is due to Shitong Zha and Jeff Newel of Hillphoenix, for without their
major contributions, this project would not have been a success. In addition, the authors would like to
recognize the generous contributions of Danfoss, who provided refrigeration system controls and Luvata,
who provided the gas cooler for the prototype transcritical CO2 refrigeration system evaluated in this
project. Finally, this work would not have been possible without the excellent technical support provided
by Dewayne Beeler, Randy Linkous, Geoffrey Ormston, and Jeffrey Taylor.

xiii
ABSTRACT
Supermarket refrigeration systems account for approximately 50% of supermarket energy use,
placing this class of equipment among the highest energy consumers in the commercial building domain.
In addition, the commonly used refrigeration system in supermarket applications is the multiplex direct
expansion (DX) system, which is prone to refrigerant leaks due to its long lengths of refrigerant piping.
This leakage reduces the efficiency of the system and increases the impact of the system on the
environment. The high Global Warming Potential (GWP) of the hydrofluorocarbon (HFC) refrigerants
commonly used in these systems, coupled with the large refrigerant charge and the high refrigerant
leakage rates leads to significant direct emissions of greenhouse gases into the atmosphere. Methods for
reducing refrigerant leakage and energy consumption are available, but underutilized. Further work needs
to be done to reduce costs of advanced system designs to improve market utilization. In addition,
refrigeration system retrofits that result in reduced energy consumption are needed since the majority of
applications address retrofits rather than new stores. The retrofit market is also of most concern since it
involves large-volume refrigerant systems with high leak rates. Finally, alternative refrigerants for new
and retrofit applications are needed to reduce emissions and reduce the impact on the environment.
The objective of this Collaborative Research and Development Agreement (CRADA) between the
Oak Ridge National Laboratory and Hill Phoenix is to develop a supermarket refrigeration system that
reduces greenhouse gas emissions and has 25 to 30 percent lower energy consumption than existing
systems. The outcomes of this project will include the design of a low emission, high efficiency
commercial refrigeration system suitable for use in current U.S. supermarkets. In addition, a prototype
low emission, high efficiency supermarket refrigeration system will be produced for laboratory and field
testing. Laboratory and field testing will demonstrate the high energy efficiency and low environmental
impact of the refrigeration system developed in this project.
Energy and life cycle climate performance (LCCP) analyses were performed for a variety of
refrigeration system designs and refrigerant options, with the goal of identifying a system configuration
and a refrigerant option which reduces both energy consumption and carbon dioxide equivalent
emissions. Based on this analysis, a transcritical CO2 booster refrigeration system was identified as
having the potential to reduce energy consumption and emissions as compared to the baseline multiplex
DX system using R-404A. The analysis showed that a transcritical CO2 booster refrigeration system,
coupled with high-efficiency display cases and walk-ins, can achieve average energy reductions of 39%
compared to the standard-efficiency R-404A multiplex DX system, with 76% lower emissions and hence
is a potential low emission, high-efficiency alternative to the current baseline R-404A multiplex DX
systems in use.
Based on the results of the energy and emissions analyses, a laboratory-scale transcritical CO2 booster
refrigeration system was fabricated and installed in the environmental test chambers at the Oak Ridge
National Laboratory (ORNL). This system consisted of a transcritical CO2 compressor rack, an air-
cooled gas cooler/condenser, medium-temperature (MT) and low-temperature (LT) refrigerated display
cases, and MT and LT “false” loads. The laboratory-scale refrigeration system has a low-temperature
cooling capacity of approximately 2.5 tons at a saturated evaporating temperature of −22°F (9.1 kW at
−30°C) and a medium-temperature cooling capacity of approximately 9.6 tons at a saturated evaporating
temperature of 20°F (34 kW at −6.7°C). The air-cooled gas cooler/condenser was installed in a
temperature and humidity controlled “outdoor” environmental chamber while the compressor rack and
refrigerated display cases were installed in a separate temperature and humidity controlled “indoor”
environmental chamber.
The performance of the transcritical CO2 booster refrigeration system was determined at four outdoor
ambient temperature conditions, nominally 60°F (16°C), 70°F (21°C), 80°F (27°C) and 90°F (32°C).
Over the outdoor ambient temperature range of 60°F to 90°F (16°C to 32°C), the total load on the system
was found to remain relatively constant. In addition, the compressor power was found to increase by
approximately 78% over this same temperature range. Thus, the resulting coefficient of performance
xiv
(COP) of the system was found to vary from 2.2 at an outdoor ambient temperature of 90°F (32°C) to 4.1
at an outdoor ambient temperature of 60°F (16°C). In addition, the coefficients of performance of both the
transcritical CO2 booster and an HFC-based refrigeration systems were compared, and it was found that
over the outdoor ambient temperature range of 60°F (16ºC) to approximately 88°F (31ºC), the COP of the
transcritical CO2 booster system was on average 15% greater than that of the HFC system. Based on the
laboratory evaluation, the transcritical CO2 booster refrigeration system demonstrates promise as a low
emission, high efficiency alternative to the traditional multiplex DX systems currently in use.
Future efforts related to this project include completing a field evaluation of the transcritical CO2
booster refrigeration system in third-party supermarkets, as well as performing system modifications to
enhance the efficiency of the CO2 refrigeration system, particularly in warm climates. The main objective
of the field evaluation is to determine the energy consumption of a transcritical CO2 commercial
refrigeration system in an actual, operating supermarket, thereby providing motivation to supermarket
owners and operators to implement these low emission refrigeration systems. Hillphoenix and ORNL are
currently negotiating the site selection and logistics for the field evaluation of the transcritical CO2
booster refrigeration system with two major food retailers. Installation of instrumented transcritical CO2
booster refrigeration systems at these test sites are planned for the Summer and Fall of 2016, with results
to be published in 2017. Furthermore, at high ambient temperatures, the efficiency of the transcritical CO2
booster refrigeration system is low, compared to the traditional HFC-based multiplex DX system. To
increase the efficiency of the CO2 refrigeration system, particularly in warm climates, a number of
modifications will be made to the laboratory-scale refrigeration system, including the use of ejectors,
parallel compression, adiabatic gas cooling and mechanical subcooling.
Motivated by the exceptional energy and environmental performance of the transcritical CO2 booster
refrigeration system, the CRADA partner, Hillphoenix has commercialized the system for supermarket
refrigeration applications. To date, Hillphoenix has over 130 installations of transcritical CO2 booster
refrigeration system in the U.S.
1
1. INTRODUCTION
According to the Food Marketing Institute, there were nearly 38,000 supermarkets in the United
States in 2014, where a supermarket is defined to be a food retailer with annual sales of $2 million or
greater (Food Marketing Institute (FMI) 2016). The median size of these supermarkets is reported to be
46,000 ft2 (4,300 m
2). Within the commercial buildings sector, supermarkets are one of the most energy-
intensive building types. Approximately half of the electrical energy consumption of a supermarket is
devoted to the refrigeration system. In the US, the electrical energy consumption of a typical supermarket
is in the range of 100,000 to 1.5 million kWh or more per year (ICF Consulting 2005).
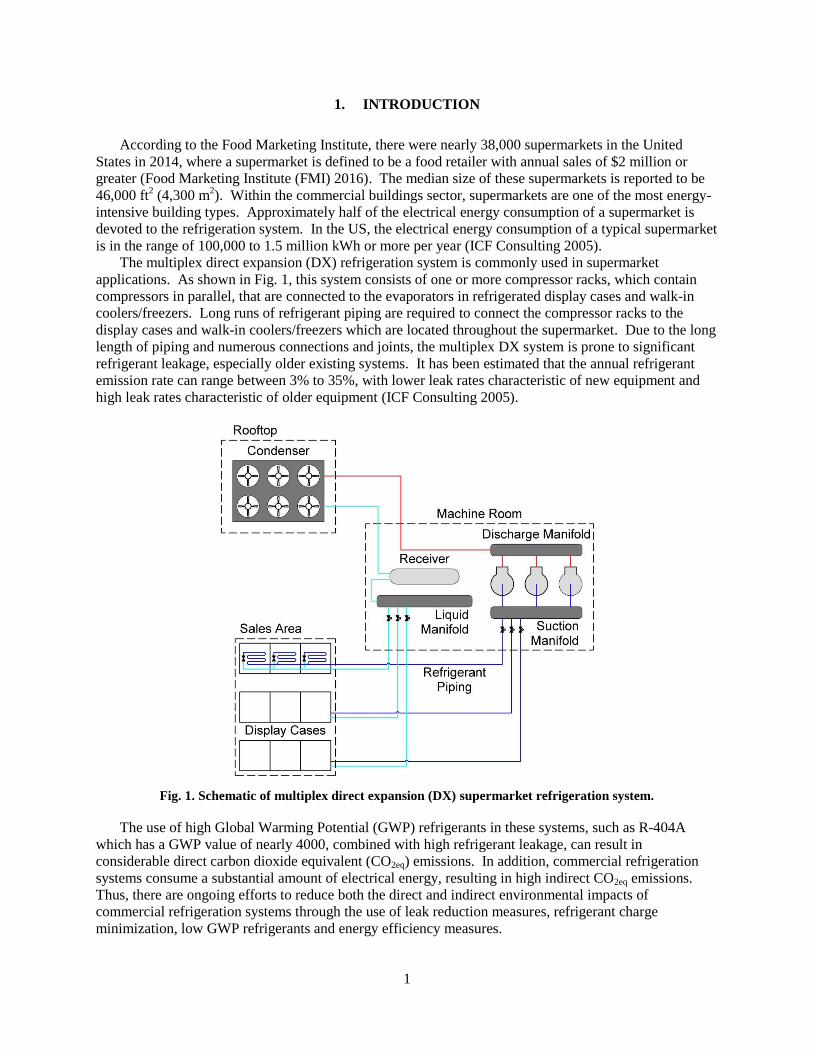
The multiplex direct expansion (DX) refrigeration system is commonly used in supermarket
applications. As shown in Fig. 1, this system consists of one or more compressor racks, which contain
compressors in parallel, that are connected to the evaporators in refrigerated display cases and walk-in
coolers/freezers. Long runs of refrigerant piping are required to connect the compressor racks to the
display cases and walk-in coolers/freezers which are located throughout the supermarket. Due to the long
length of piping and numerous connections and joints, the multiplex DX system is prone to significant
refrigerant leakage, especially older existing systems. It has been estimated that the annual refrigerant
emission rate can range between 3% to 35%, with lower leak rates characteristic of new equipment and
high leak rates characteristic of older equipment (ICF Consulting 2005).
Fig. 1. Schematic of multiplex direct expansion (DX) supermarket refrigeration system.
The use of high Global Warming Potential (GWP) refrigerants in these systems, such as R-404A
which has a GWP value of nearly 4000, combined with high refrigerant leakage, can result in
considerable direct carbon dioxide equivalent (CO2eq) emissions. In addition, commercial refrigeration
systems consume a substantial amount of electrical energy, resulting in high indirect CO2eq emissions.
Thus, there are ongoing efforts to reduce both the direct and indirect environmental impacts of
commercial refrigeration systems through the use of leak reduction measures, refrigerant charge
minimization, low GWP refrigerants and energy efficiency measures.
2
1.1 PROJECT OBJECTIVES
The objective of this Collaborative Research and Development Agreement (CRADA) between the
Oak Ridge National Laboratory and Hill Phoenix is to develop a supermarket refrigeration system that
reduces greenhouse gas emissions and has 25 to 30 percent lower energy consumption than existing
systems. The challenges of this project will be to design a system that will achieve refrigerant leak rates
of less than 5% while significantly reducing energy consumption and refrigerant charge size. In addition,
the refrigeration system design may include the safe use of a low Global Warming Potential (GWP)
flammable refrigerant.
The outcomes of this project will include the design of a low emission, high efficiency commercial
refrigeration system suitable for use in current U.S. supermarkets. In addition, a prototype low emission,
high efficiency supermarket refrigeration system will be produced for laboratory and field testing.
Laboratory and field testing will demonstrate the high energy efficiency and low environmental impact of
the refrigeration system developed in this project.
1.2 MOTIVATION
The Department of Energy’s (DOE) Building Technologies Office (BTO) has as its long term goal to
create marketable technologies and design approaches that address energy consumption in existing and
new buildings. The current vision that BTO has for achieving this goal involves reducing the energy and
carbon emissions used by the energy service equipment (equipment providing space heating and cooling,
refrigeration, etc.) by 50% compared to today’s best common practice. Refrigeration systems in the
supermarket sub-sector of commercial buildings account for approximately 50% of supermarket energy
use, placing this class of equipment among the highest energy consumers in the commercial building
domain. Technology areas of interest, such as secondary loop systems, waste heat reclaim, alternative
refrigerants, advanced vapor compression, and hybrid ground source condensers have the potential to
significantly reduce energy consumption for refrigeration equipment and aid progress towards DOE goals
to improve energy performance.
The commonly used refrigeration system in supermarket applications is the multiplex direct
expansion (DX) system, which is prone to refrigerant leaks due to its long lengths of refrigerant piping.
This leakage reduces the efficiency of the system and increases the impact of the system on the
environment. Methods for reducing refrigerant leakage and energy consumption are available, but
underutilized. Further work needs to be done to reduce costs of advanced system designs to improve
market utilization. In addition, refrigeration system retrofits that result in reduced energy consumption
are needed since the majority of applications address retrofits rather than new stores. The retrofit market
is also of most concern since it involves large-volume refrigerant systems with high leak rates. Finally,
alternative refrigerants for new and retrofit applications are needed to reduce emissions and reduce the
impact on the environment.
1.3 CURRENT PRACTICE
Supermarkets and other large food retail stores commonly utilize multiplex direct expansion (DX)
refrigeration systems in conjunction with synthetic refrigerants such as R-22, R-404A and R-507. The
annual refrigerant leakage from these systems is reported to be as high as 35% (ICF Consulting 2005).
The high Global Warming Potential (GWP) of the hydrofluorocarbon (HFC) refrigerants commonly used
in these systems, coupled with the large refrigerant charge and the high refrigerant leakage rates leads to
significant direct emissions of greenhouse gases into the atmosphere. Hence, these multiplex
refrigeration systems can directly contribute to the increase in global warming.
Furthermore, the operation of multiplex DX refrigeration systems also contributes to global warming
indirectly. For a typical supermarket in the US, the refrigeration system accounts for approximately 50%
of the supermarket’s total energy consumption (Westphalen et al. 1996). On an annual basis, the
3
refrigeration system of a typical supermarket may consume 1 million kWh or more (Zhang 2006). Thus,
the indirect impact on the environment results from the release of greenhouse gases (mainly CO2)
associated with the generation and transmission of the electrical energy used by the refrigeration system.
The direct environmental impact of the refrigeration system can be reduced by using refrigerants with
lower GWP. Refrigerants such as R-32, R-134a, R-717, R-744, R-290, R-600a and R-1234yf could be
potential alternative refrigerants. However, due to toxicity and/or flammability, some of these refrigerant
options may not be permissible under various municipal safety codes. Cascade systems and secondary
loop systems (discussed later in Chapters 2 and 3) using CO2 as a refrigerant can be used to reduce the
direct impact on the environment due to their lower HFC refrigerant charge.
The indirect environmental impact of the refrigeration system can be reduced by increasing the
energy efficiency of the system. One option for increasing energy efficiency is to reduce the load on the
refrigeration system. This can be done by replacing open display cases with doored display cases.
Several studies have shown that doored display cases can reduce refrigeration system energy consumption
by up to 50% when combined with high efficiency display case components such as LED lighting,
demand defrost, electronically commutated evaporator fan motors and humidity controlled anti-sweat
heaters (Rauss, Mitchell, and Faramarzi 2008; Fricke and Becker 2010). Other energy efficiency
measures that can be utilized include variable speed drives for compressors and condenser fan motors, as
well as floating condensing and suction pressure controls.
Carbon dioxide has recently received considerable attention as an alternative to the commonly used
synthetic refrigerants in supermarket refrigeration systems, in an effort to develop systems with lower
environmental impact (Bansal 2012; Getu and Bansal 2008). Although CO2 has a high critical pressure
(1070 psia or 7.38 MPa) and a low critical temperature (87.9°F or 31.1°C), its high operating pressure
leads to a high vapor density and thus a high volumetric refrigerating capacity. The volumetric
refrigerating capacity of CO2 (605.1 Btu/ft3 at 32°F or 22,545 kJ/m
3 at 0°C) is 3 to 10 times larger than
chlorofluorocarbon (CFC), hydrochlorofluorocarbon (HCFC), hydrofluorocarbon (HFC) and hydrocarbon
(HC) refrigerants (Kim, Pettersen, and Bullard 2004). In addition, carbon dioxide has no Ozone
Depletion Potential (ODP); a GWP of one; and is nontoxic, nonflammable and inexpensive – all attractive
characteristics when compared to synthetic refrigerants.
Carbon dioxide has successfully been used as a refrigerant in the low-temperature circuit of cascade
systems, in secondary loop systems, and in transcritical systems (Bansal 2012; Girotto, Minetto, and
Nekså 2004; Hinde and Zha 2009). However, transcritical CO2 systems tend to be more popular in
moderate climates such as Northern Europe where the refrigeration system operates a majority of the time
in the more efficient subcritical mode (Denecke et al. 2012; Sawalha and Palm 2003).
1.4 OUTLINE OF THIS REPORT
The structure of this report is as follows:
Chapter 2 presents energy and emissions analyses performed for a variety of refrigeration
system designs and refrigerant options, with the goal of identifying a system configuration
and a refrigerant option which reduces both energy consumption and carbon dioxide
equivalent emissions. Based on the analysis presented in Chapter 2, a transcritical CO2
booster refrigeration system was identified as having the potential to reduce energy
consumption and emissions as compared to the baseline multiplex DX system.
Chapter 3 presents further analysis of various configurations of CO2-based refrigeration
systems. Based on this analysis, Hillphoenix and ORNL agreed that a transcritical CO2
booster refrigeration system warranted further investigation.
Chapter 4 describes in detail the laboratory-scale transcritical CO2 booster refrigeration
system which was developed for evaluation in ORNL’s environmental chambers.
Chapter 5 presents the results of the laboratory evaluation of the transcritical CO2 booster
refrigeration system.
4
Chapter 6 describes future work to be performed, including field evaluations of the
transcritical CO2 booster refrigeration system and the development of a system applicable to
warm climates.
Finally, Chapter 7 provides concluding remarks.
5
2. ANALYSIS OF REFRIGERATION SYSTEMS AND REFRIGERANT OPTIONS
To meet the objective of developing a high efficiency, low emission commercial refrigeration system,
an evaluation of various refrigeration system designs and refrigerant options was performed. Some of the
key features in selecting an appropriate refrigeration system and/or refrigerant include the global warming
potential (GWP) of the refrigerant, the energy consumption of the refrigeration system over its operating
lifetime, and the refrigerant leakage over the system lifetime. Therefore, energy and life cycle climate
performance (LCCP) analyses were performed on a variety of supermarket refrigeration systems to
identify those designs and refrigerant selections which exhibit both low environmental impact and high
energy efficiency. Based on the most promising system design and refrigerant selection, a high
efficiency, low emission refrigeration system will be developed and evaluated.
The whole-building energy modeling tool, EnergyPlus, was used to model refrigeration systems in a
variety of climate zones across the United States. The refrigeration systems that were modeled include
the traditional multiplex direct expansion (DX) system, cascade systems with secondary loops and the
transcritical CO2 system. Furthermore, a variety of refrigerants were investigated, including R-32, R-
134a, R-404A, R-1234yf, R-717, and R-744. LCCP analysis was used to determine the direct and
indirect carbon dioxide emissions resulting from the operation of the various refrigeration systems over
their lifetimes.
The following sections in Chapter 2 describe the details of the LCCP methodology, the energy
modeling (including the specifications of a conceptual supermarket), and the various refrigeration systems
which were investigated. Finally, the results of the LCCP and energy analyses are presented.
2.1 LIFE CYCLE CLIMATE PERFORMANCE (LCCP)
Life Cycle Climate Performance (LCCP) is a methodology used to determine the environmental
impact of a refrigeration system design, its performance and use of a specific refrigerant. The
environmental impact of a refrigeration system is measured by estimating the system’s greenhouse gas
emissions in terms of carbon dioxide equivalent emissions, i.e., the quantity of carbon dioxide that would
have the same global warming potential (GWP) as the greenhouse gas emissions of the refrigeration
system under consideration (Hafner, Nekså, and Pettersen 2004; Horie et al. 2010; Johnson 2004;
Papasavva, Hill, and Andersen 2010; Spatz and Motta 2004; Zhang et al. 2011). LCCP represents the
total carbon dioxide equivalent (CO2eq) emissions, including both the direct and indirect emissions of the
refrigeration system as follows:
𝐿𝐶𝐶𝑃 = ∑(𝐸𝑑𝑖𝑟𝑒𝑐𝑡 + 𝐸𝑖𝑛𝑑𝑖𝑟𝑒𝑐𝑡) (1)
where Edirect is the direct emissions and Eindirect is the indirect emissions.
Direct emissions, Edirect, include those related to the direct release of refrigerant from the system,
including annual leakage, loss at the end-of-life of the system and loss during service events, and can be
calculated as follows:
𝐸𝑑𝑖𝑟𝑒𝑐𝑡 = 𝐸𝑙𝑒𝑎𝑘𝑎𝑔𝑒 + 𝐸𝐸𝑂𝐿 + 𝐸𝑠𝑒𝑟𝑣𝑖𝑐𝑒 (2)
where Eleakage is the CO2eq of the total leakage of refrigerant from the system over its operating lifetime,
EEOL is the CO2eq of the refrigerant released at the end of the system life due to inefficiencies in refrigerant
recovery, and Eservice is the CO2eq of the total refrigerant release occurring during all refrigeration system
service events over the system operating lifetime.
The indirect emissions, Eindirect, include those associated with the production and distribution of the
energy required to operate the refrigeration system over its lifetime as well as emissions associated with
6
the manufacturing, end-of-life decommissioning, and recycling of the refrigeration system, and can be
calculated as follows:
𝐸𝑖𝑛𝑑𝑖𝑟𝑒𝑐𝑡 = 𝐸𝑒𝑛𝑒𝑟𝑔𝑦 + 𝐸𝑚𝑎𝑛𝑢𝑓 + 𝐸𝑟𝑒𝑐𝑦𝑐𝑙𝑒 (3)
where Eenergy is the CO2eq emissions associated with the production and distribution of the energy required
to operate the refrigeration system over its lifetime, Emanuf is the CO2eq emissions associated with the
energy required to manufacture both the refrigerant and the refrigeration system, and Erecycle is the CO2eq
emissions associated with the energy of recycling of the refrigeration system at the end of its operating
lifetime.
Emissions factors related to the production and distribution of electricity as well as for the production
of the refrigerant and refrigerating equipment were obtained from Deru and Torcellini (2007) and
Papasavva et al. (2010).
2.2 ENERGY MODELING
EnergyPlus was selected to model the hourly energy consumption of supermarket refrigeration
systems in a variety of climate zones across the United States for a one-year period (US Department of
Energy (DOE) 2012). This tool is capable of modeling the building envelope, heating and cooling loads,
and HVAC and refrigeration system performance based on detailed weather data and building
construction data. A conceptual supermarket design was developed for use in the EnergyPlus simulations.
This design consists of a single-story supermarket with a floor area of approximately 38,600 ft2
(3,590 m2), divided into four zones (vestibule, deli, main sales, and back room). The internal loads for
each of these zones consist of lighting, people, electric and gas loads. Exterior wall construction for the
conceptual design consists of stucco, concrete block, insulation, and gypsum board (from the exterior to
the interior). HVAC is provided by packaged constant volume units with gas heat and electric cooling.
Using the conceptual supermarket design, energy simulations were performed for seven cities, shown
in Table 1, which are representative of the seven climate zones in the continental United States (Pacific
Northwest National Laboratory (PNNL) 2010). Hourly weather data from the seven cities was used in the
simulations to determine refrigeration system performance in the seven climate zones.
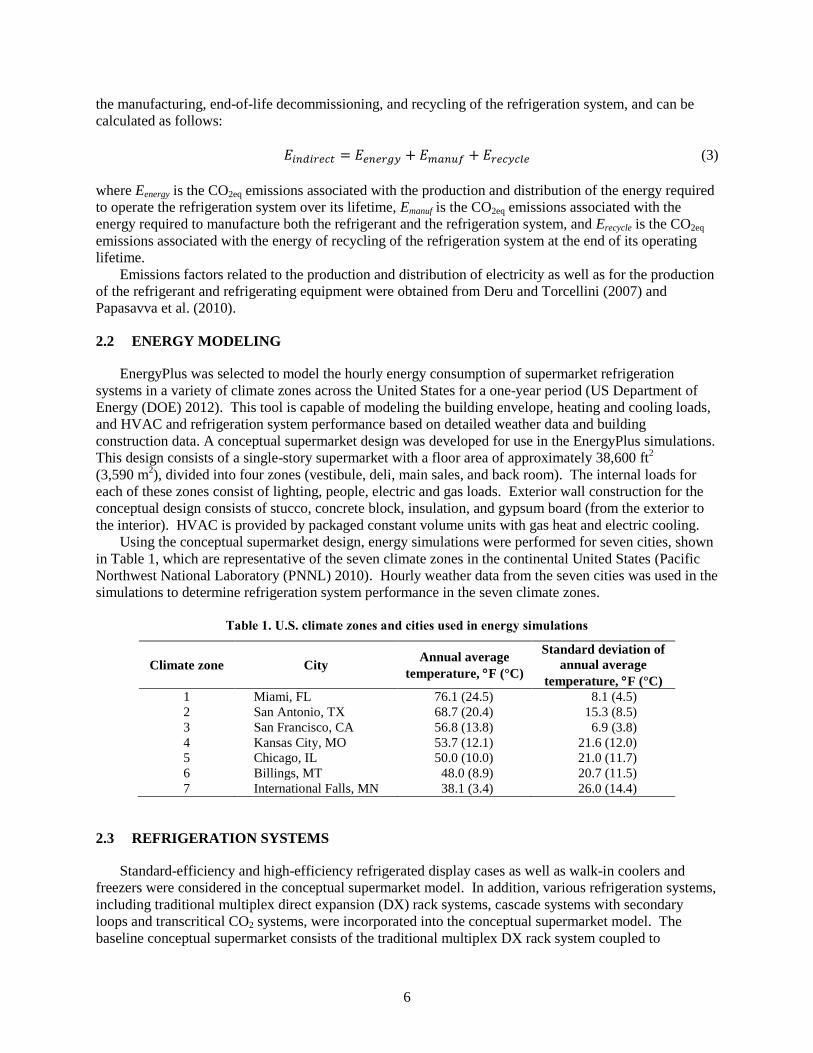
Table 1. U.S. climate zones and cities used in energy simulations
Climate zone City Annual average
temperature, F (°C)
Standard deviation of
annual average
temperature, F (°C)
1 Miami, FL 76.1 (24.5) 8.1 (4.5)
2 San Antonio, TX 68.7 (20.4) 15.3 (8.5)
3 San Francisco, CA 56.8 (13.8) 6.9 (3.8)
4 Kansas City, MO 53.7 (12.1) 21.6 (12.0)
5 Chicago, IL 50.0 (10.0) 21.0 (11.7)
6 Billings, MT 48.0 (8.9) 20.7 (11.5)
7 International Falls, MN 38.1 (3.4) 26.0 (14.4)
2.3 REFRIGERATION SYSTEMS
Standard-efficiency and high-efficiency refrigerated display cases as well as walk-in coolers and
freezers were considered in the conceptual supermarket model. In addition, various refrigeration systems,
including traditional multiplex direct expansion (DX) rack systems, cascade systems with secondary
loops and transcritical CO2 systems, were incorporated into the conceptual supermarket model. The
baseline conceptual supermarket consists of the traditional multiplex DX rack system coupled to
7
standard-efficiency display cases and walk-ins. High-efficiency systems consist of the various
refrigeration systems coupled to high-efficiency display cases and walk-ins.
2.3.1 Refrigerated Display Cases and Walk-Ins
The standard-efficiency refrigerated display cases in the baseline conceptual supermarket contain
standard-efficiency components, such as fluorescent lighting, permanent split capacitor (PSC) fan motors,
and constant-power anti-condensate heaters. In addition, most of the baseline medium-temperature
display cases are of the open, vertical multi-deck design. The high-efficiency refrigerated display cases
contain high-efficiency components, such as LED lighting, electronically commutated fan motors, and
humidity-controlled anti-condensate heaters. In addition, many of the high-efficiency medium-
temperature display cases are of the doored, vertical multi-deck design. A summary of the standard- and
high-efficiency, medium- and low-temperature display cases is given in Table 2.
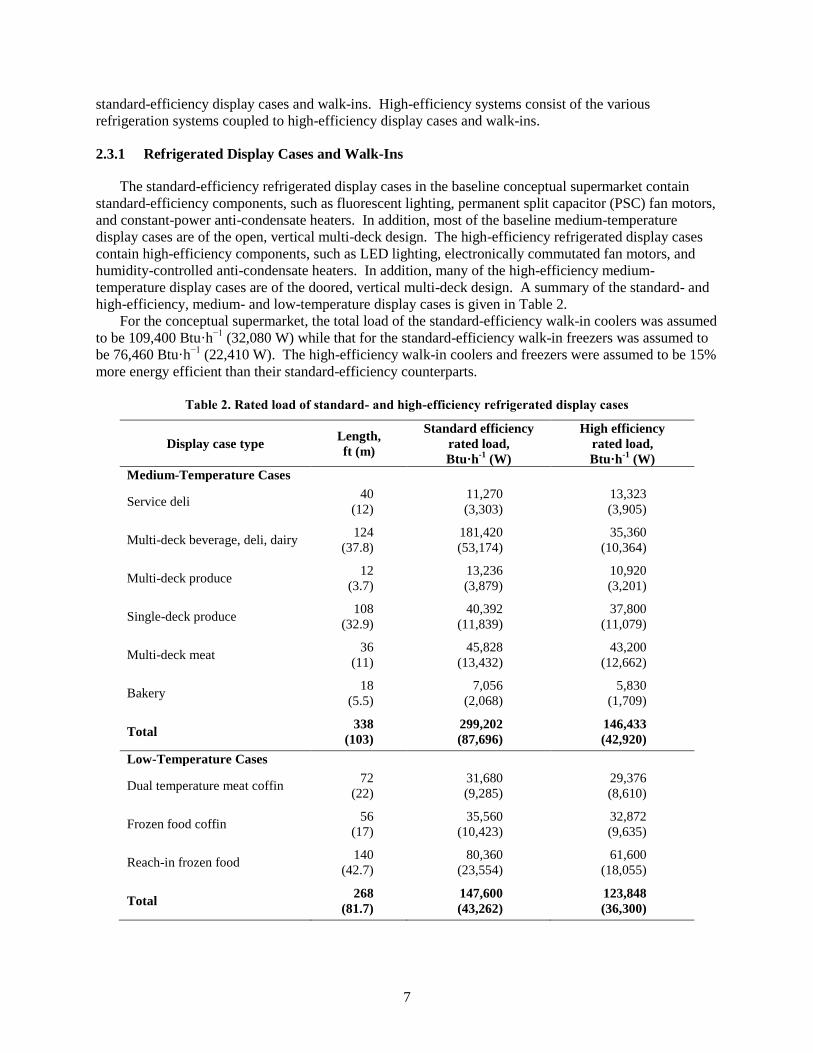
For the conceptual supermarket, the total load of the standard-efficiency walk-in coolers was assumed
to be 109,400 Btu·h−1
(32,080 W) while that for the standard-efficiency walk-in freezers was assumed to
be 76,460 Btu·h−1
(22,410 W). The high-efficiency walk-in coolers and freezers were assumed to be 15%
more energy efficient than their standard-efficiency counterparts.
Table 2. Rated load of standard- and high-efficiency refrigerated display cases
Display case type Length,
ft (m)
Standard efficiency
rated load,
Btu·h-1
(W)
High efficiency
rated load,
Btu·h-1
(W)
Medium-Temperature Cases
Service deli 40
(12)
11,270
(3,303)
13,323
(3,905)
Multi-deck beverage, deli, dairy 124
(37.8)
181,420
(53,174)
35,360
(10,364)
Multi-deck produce 12
(3.7)
13,236
(3,879)
10,920
(3,201)
Single-deck produce 108
(32.9)
40,392
(11,839)
37,800
(11,079)
Multi-deck meat 36
(11)
45,828
(13,432)
43,200
(12,662)
Bakery 18
(5.5)
7,056
(2,068)
5,830
(1,709)
Total 338
(103)
299,202
(87,696)
146,433
(42,920)
Low-Temperature Cases
Dual temperature meat coffin 72
(22)
31,680
(9,285)
29,376
(8,610)
Frozen food coffin 56
(17)
35,560
(10,423)
32,872
(9,635)
Reach-in frozen food 140
(42.7)
80,360
(23,554)
61,600
(18,055)
Total 268
(81.7)
147,600
(43,262)
123,848
(36,300)
8
2.3.2 Refrigeration Systems
The conceptual supermarket was modeled with the following refrigeration systems and their features
are briefly described below:
Multiplex DX system consisting of a medium-temperature (MT) compressor rack and a low-
temperature (LT) rack. The refrigerant modeled in each rack was R-404A. The R-404A
multiplex DX system coupled to standard-efficiency display cases and walk-ins was
considered to be the baseline system by which the other refrigeration systems would be
compared.
Cascade refrigeration system with a primary R-404A DX system, a LT CO2 DX system and
a MT glycol secondary loop. The MT loads were cooled with a 30% propylene glycol
secondary loop while the LT loads were cooled by the low-temperature CO2 DX system.
Cascade refrigeration system with a primary DX system (using a variety of refrigerants), a
LT CO2 DX system and a MT CO2 secondary loop. The MT loads were cooled with a
pumped CO2 secondary loop while the LT loads were cooled by the LT CO2 DX system.
The primary refrigerants considered included R-404A, R-134a, R-32, R-1234yf and
ammonia (R-717).
Transcritical CO2 booster system. Both the MT and LT loads were served by direct
expansion of CO2. The heat rejection from the system occurs either supercritically or
subcritically, depending upon the outdoor ambient temperature.
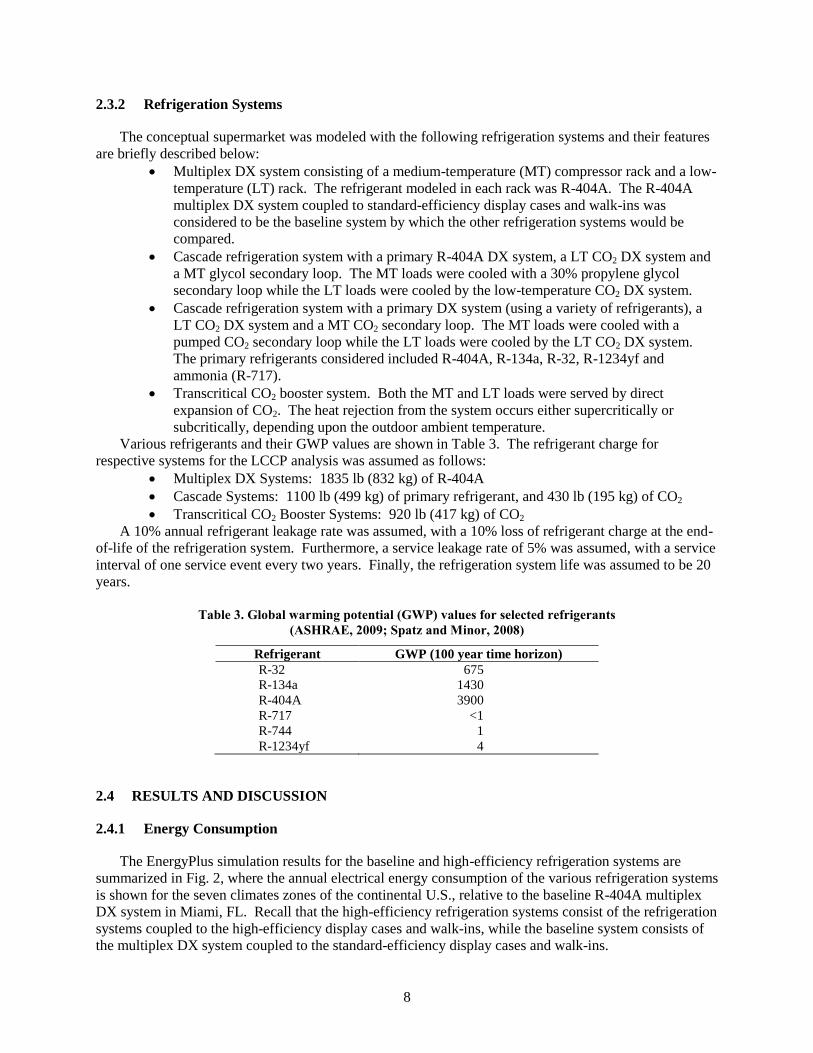
Various refrigerants and their GWP values are shown in Table 3. The refrigerant charge for
respective systems for the LCCP analysis was assumed as follows:
Multiplex DX Systems: 1835 lb (832 kg) of R-404A
Cascade Systems: 1100 lb (499 kg) of primary refrigerant, and 430 lb (195 kg) of CO2
Transcritical CO2 Booster Systems: 920 lb (417 kg) of CO2
A 10% annual refrigerant leakage rate was assumed, with a 10% loss of refrigerant charge at the end-
of-life of the refrigeration system. Furthermore, a service leakage rate of 5% was assumed, with a service
interval of one service event every two years. Finally, the refrigeration system life was assumed to be 20
years.
Table 3. Global warming potential (GWP) values for selected refrigerants
(ASHRAE, 2009; Spatz and Minor, 2008)
Refrigerant GWP (100 year time horizon)
R-32 675
R-134a 1430
R-404A 3900
R-717 <1
R-744 1
R-1234yf 4
2.4 RESULTS AND DISCUSSION
2.4.1 Energy Consumption
The EnergyPlus simulation results for the baseline and high-efficiency refrigeration systems are
summarized in Fig. 2, where the annual electrical energy consumption of the various refrigeration systems
is shown for the seven climates zones of the continental U.S., relative to the baseline R-404A multiplex
DX system in Miami, FL. Recall that the high-efficiency refrigeration systems consist of the refrigeration
systems coupled to the high-efficiency display cases and walk-ins, while the baseline system consists of
the multiplex DX system coupled to the standard-efficiency display cases and walk-ins.
9
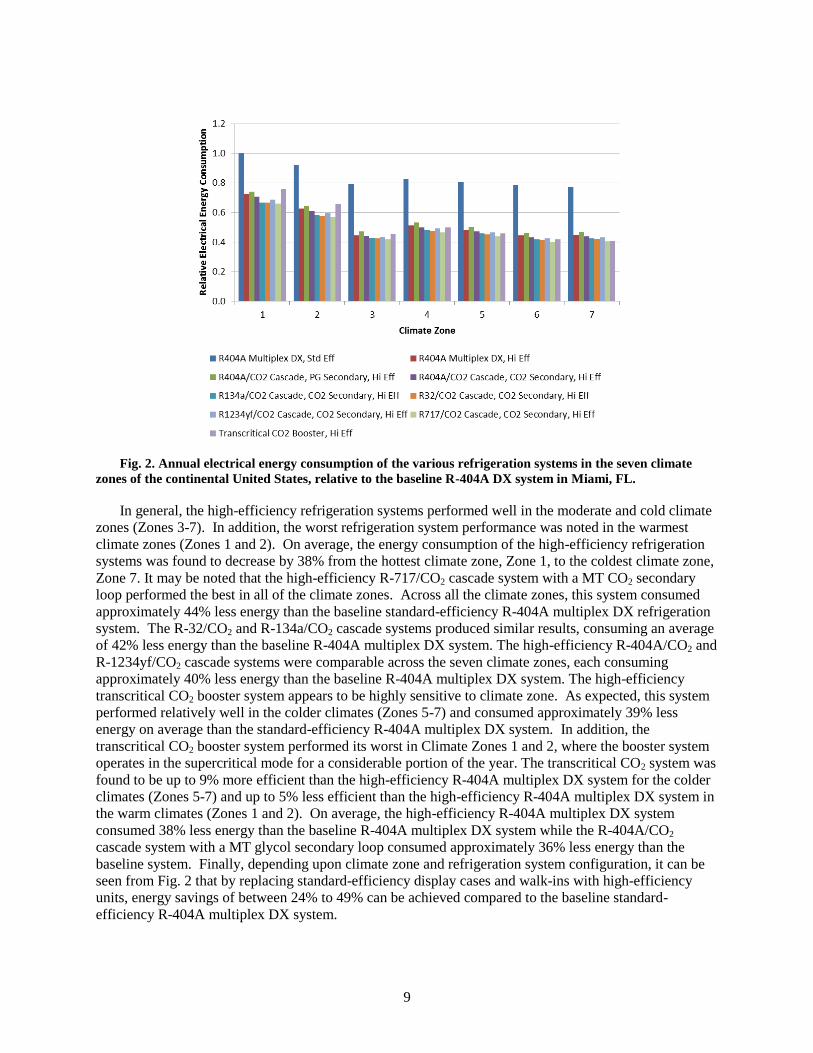
Fig. 2. Annual electrical energy consumption of the various refrigeration systems in the seven climate
zones of the continental United States, relative to the baseline R-404A DX system in Miami, FL.
In general, the high-efficiency refrigeration systems performed well in the moderate and cold climate
zones (Zones 3-7). In addition, the worst refrigeration system performance was noted in the warmest
climate zones (Zones 1 and 2). On average, the energy consumption of the high-efficiency refrigeration
systems was found to decrease by 38% from the hottest climate zone, Zone 1, to the coldest climate zone,
Zone 7. It may be noted that the high-efficiency R-717/CO2 cascade system with a MT CO2 secondary
loop performed the best in all of the climate zones. Across all the climate zones, this system consumed
approximately 44% less energy than the baseline standard-efficiency R-404A multiplex DX refrigeration
system. The R-32/CO2 and R-134a/CO2 cascade systems produced similar results, consuming an average
of 42% less energy than the baseline R-404A multiplex DX system. The high-efficiency R-404A/CO2 and
R-1234yf/CO2 cascade systems were comparable across the seven climate zones, each consuming
approximately 40% less energy than the baseline R-404A multiplex DX system. The high-efficiency
transcritical CO2 booster system appears to be highly sensitive to climate zone. As expected, this system
performed relatively well in the colder climates (Zones 5-7) and consumed approximately 39% less
energy on average than the standard-efficiency R-404A multiplex DX system. In addition, the
transcritical CO2 booster system performed its worst in Climate Zones 1 and 2, where the booster system
operates in the supercritical mode for a considerable portion of the year. The transcritical CO2 system was
found to be up to 9% more efficient than the high-efficiency R-404A multiplex DX system for the colder
climates (Zones 5-7) and up to 5% less efficient than the high-efficiency R-404A multiplex DX system in
the warm climates (Zones 1 and 2). On average, the high-efficiency R-404A multiplex DX system
consumed 38% less energy than the baseline R-404A multiplex DX system while the R-404A/CO2
cascade system with a MT glycol secondary loop consumed approximately 36% less energy than the
baseline system. Finally, depending upon climate zone and refrigeration system configuration, it can be
seen from Fig. 2 that by replacing standard-efficiency display cases and walk-ins with high-efficiency
units, energy savings of between 24% to 49% can be achieved compared to the baseline standard-
efficiency R-404A multiplex DX system.
10
2.4.2 Life Cycle Climate Performance
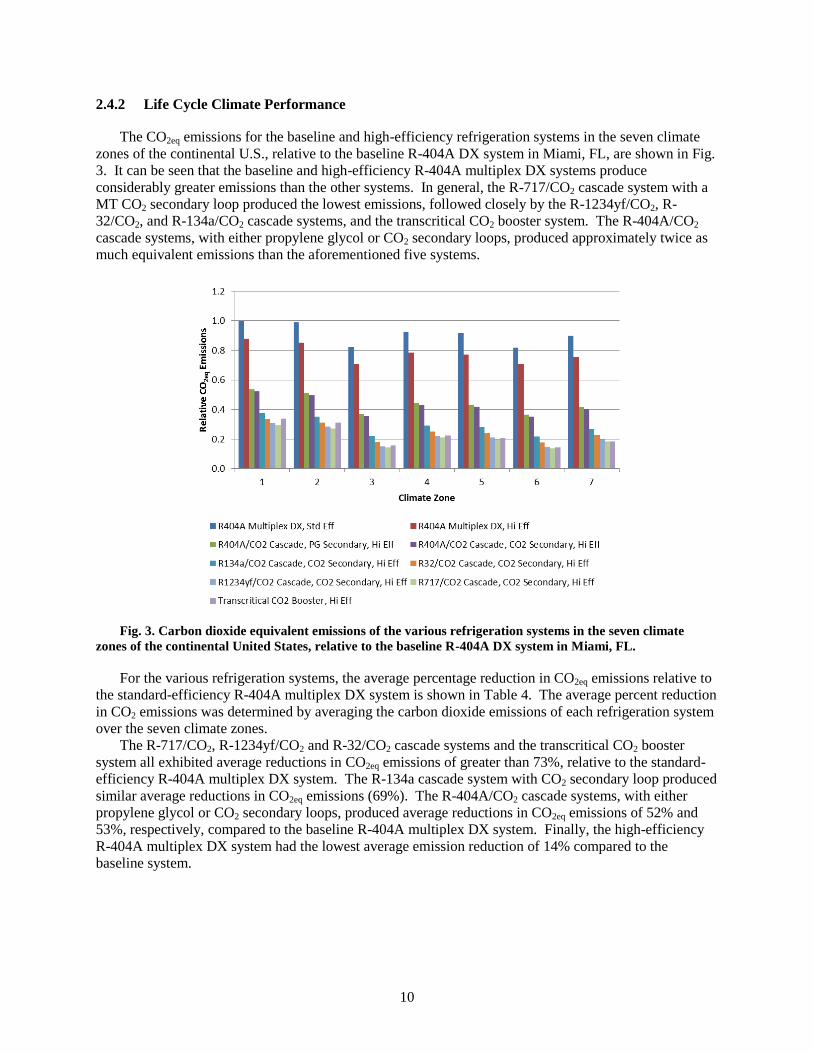
The CO2eq emissions for the baseline and high-efficiency refrigeration systems in the seven climate
zones of the continental U.S., relative to the baseline R-404A DX system in Miami, FL, are shown in Fig.
3. It can be seen that the baseline and high-efficiency R-404A multiplex DX systems produce
considerably greater emissions than the other systems. In general, the R-717/CO2 cascade system with a
MT CO2 secondary loop produced the lowest emissions, followed closely by the R-1234yf/CO2, R-
32/CO2, and R-134a/CO2 cascade systems, and the transcritical CO2 booster system. The R-404A/CO2
cascade systems, with either propylene glycol or CO2 secondary loops, produced approximately twice as
much equivalent emissions than the aforementioned five systems.
Fig. 3. Carbon dioxide equivalent emissions of the various refrigeration systems in the seven climate
zones of the continental United States, relative to the baseline R-404A DX system in Miami, FL.
For the various refrigeration systems, the average percentage reduction in CO2eq emissions relative to
the standard-efficiency R-404A multiplex DX system is shown in Table 4. The average percent reduction
in CO2 emissions was determined by averaging the carbon dioxide emissions of each refrigeration system
over the seven climate zones.
The R-717/CO2, R-1234yf/CO2 and R-32/CO2 cascade systems and the transcritical CO2 booster
system all exhibited average reductions in CO2eq emissions of greater than 73%, relative to the standard-
efficiency R-404A multiplex DX system. The R-134a cascade system with CO2 secondary loop produced
similar average reductions in CO2eq emissions (69%). The R-404A/CO2 cascade systems, with either
propylene glycol or CO2 secondary loops, produced average reductions in CO2eq emissions of 52% and
53%, respectively, compared to the baseline R-404A multiplex DX system. Finally, the high-efficiency
R-404A multiplex DX system had the lowest average emission reduction of 14% compared to the
baseline system.
11
Table 4. Average percent reduction in CO2eq emissions relative to the baseline
standard-efficiency R-404A multiplex DX system
Refrigeration system Emissions reduction relative to baseline
R-404A multiplex DX system, %
R-404A Multiplex DX, Hi Eff 14.4
R-404A/CO2 Cascade, PG Secondary, Hi Eff 51.9
R-404A/CO2 Cascade, CO2 Secondary, Hi Eff 53.4
R-134a/CO2 Cascade, CO2 Secondary, Hi Eff 68.7
R-32/CO2 Cascade, CO2 Secondary, Hi Eff 73.2
R-1234yf/CO2 Cascade, CO2 Secondary, Hi Eff 76.5
R-717/CO2 Cascade, CO2 Secondary, Hi Eff 77.7
Transcritical CO2 Booster, Hi Eff 75.8
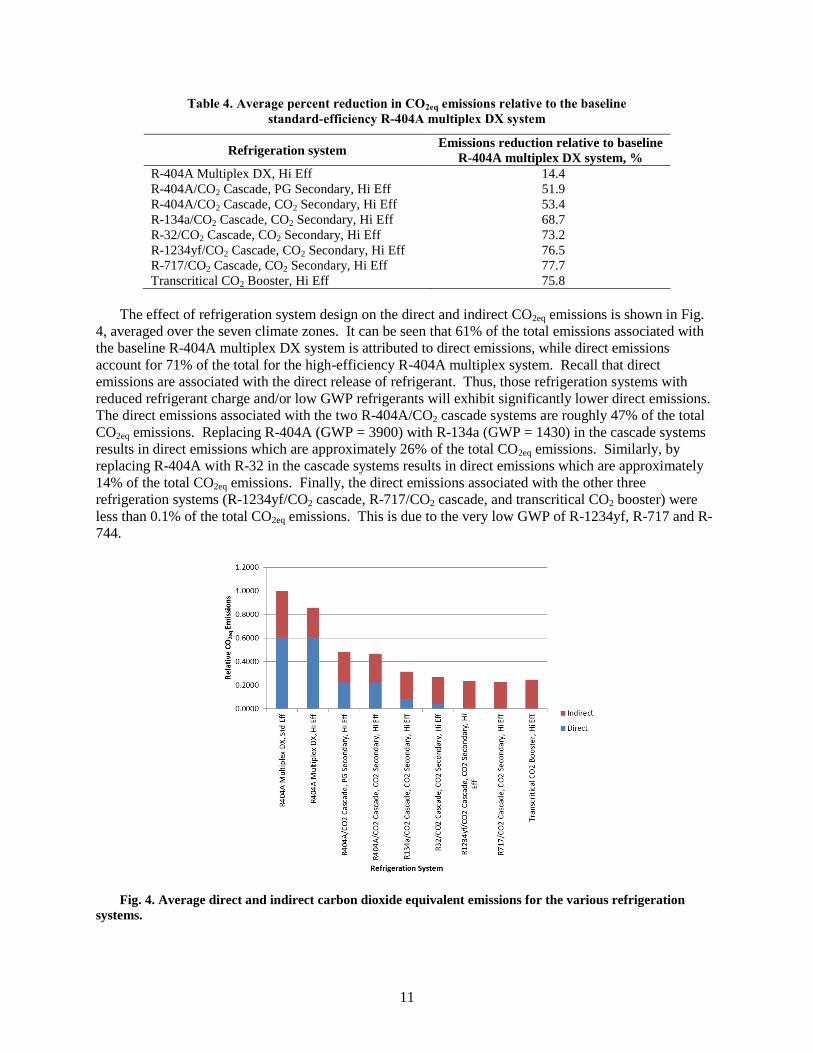
The effect of refrigeration system design on the direct and indirect CO2eq emissions is shown in Fig.
4, averaged over the seven climate zones. It can be seen that 61% of the total emissions associated with
the baseline R-404A multiplex DX system is attributed to direct emissions, while direct emissions
account for 71% of the total for the high-efficiency R-404A multiplex system. Recall that direct
emissions are associated with the direct release of refrigerant. Thus, those refrigeration systems with
reduced refrigerant charge and/or low GWP refrigerants will exhibit significantly lower direct emissions.
The direct emissions associated with the two R-404A/CO2 cascade systems are roughly 47% of the total
CO2eq emissions. Replacing R-404A (GWP = 3900) with R-134a (GWP = 1430) in the cascade systems
results in direct emissions which are approximately 26% of the total CO2eq emissions. Similarly, by
replacing R-404A with R-32 in the cascade systems results in direct emissions which are approximately
14% of the total CO2eq emissions. Finally, the direct emissions associated with the other three
refrigeration systems (R-1234yf/CO2 cascade, R-717/CO2 cascade, and transcritical CO2 booster) were
less than 0.1% of the total CO2eq emissions. This is due to the very low GWP of R-1234yf, R-717 and R-
744.
Fig. 4. Average direct and indirect carbon dioxide equivalent emissions for the various refrigeration
systems.
12
2.5 SUMMARY
In all the climate zones, the high-efficiency R-717/CO2 cascade refrigeration system with a medium-
temperature CO2 secondary loop consumed the least amount of energy, using an average of 44% less
energy compared to the baseline standard-efficiency R-404A multiplex DX system. In addition, the high-
efficiency R-134a/CO2, R-32/CO2, and R-1234yf/CO2 cascade refrigeration systems with medium-
temperature CO2 secondary loops performed well in each of the climate zones, using an average of 42%
less energy compared to the baseline system. Finally, the high-efficiency transcritical CO2 booster system
performed its best in the colder climate zones (Zones 5-7), and, overall, used an average of 39% less
energy compared to the baseline system.
The energy consumption of the refrigeration systems could be reduced by 24% to 49% by replacing
standard-efficiency display cases and walk-ins with high-efficiency units. These energy reduction
measures can significantly reduce the refrigeration system’s indirect carbon dioxide emissions associated
with electrical energy use, thereby reducing the system’s impact upon the environment.
The high-efficiency refrigeration systems utilizing low GWP refrigerants, including R-1234yf, R-717,
and R-744, can drastically reduce carbon dioxide emissions as compared to the baseline R-404A
multiplex DX refrigeration system. Emissions reductions of up to 78% are estimated for refrigeration
systems that utilize low GWP refrigerants.
A transcritical CO2 booster refrigeration system, coupled with high-efficiency display cases and walk-
ins, can achieve average energy reductions of 39% compared to the standard-efficiency R-404A multiplex
DX system, with 76% lower emissions and hence is a potential low emission, high-efficiency alternative
to the current baseline R-404A multiplex DX systems in use.
13
3. FURTHER ANALYSIS OF CO2 BASED REFRIGERATION SYSTEMS
As shown in the analysis presented in Chapter 2, a transcritical CO2 booster refrigeration system,
coupled with high-efficiency display cases and walk-ins, can achieve average energy reductions of up to
39% compared to the standard-efficiency R-404A multiplex DX system, with 76% lower emissions and
hence is a potential low emission, high-efficiency alternative to the current baseline R-404A multiplex
DX systems currently in use. Thus, CO2-based refrigeration systems can potentially meet the project
objectives of reduced energy consumption and reduced greenhouse gas emissions.
In order to optimize the operating parameters of CO2-based refrigeration systems, further analysis is
presented in this chapter of various CO2 transcritical and cascade/secondary loop refrigeration systems for
supermarket applications. In addition, the performance of selected CO2-based refrigeration systems is
compared to the baseline R-404A multiplex direct expansion system using bin analyses in the eight
climate zones of the United States.
In an effort to increase the efficiency of the transcritical CO2 system and to make it applicable to
warmer climates, several researchers have investigated the energy efficiency of various configurations of
the transcritical refrigeration system (Bell 2004; Ferrandi and Orlandi 2012; Ge and Tassou 2009, 2010;
Mazzola, Toffolo, and Orlandi 2012; Sarkar and Agrawal 2010; Sawalha 2007; Winter and Murin 2012).
However, these studies focused on a particular system only and lacked any system performance
comparison with various other possible CO2 system configurations. Also, these studies did not optimize
the design parameters such as the evaporator superheat (ΔT), the suction line heat exchanger (SLHX)
effectiveness and the secondary loop circulation ratio (CR), in order to maximize the system coefficient of
performance (COP). A comprehensive analysis is presented of seven CO2-based refrigeration system
configurations that are currently being used in the supermarket refrigeration industry and the performance
of the more energy-efficient CO2-based refrigeration systems is compared with that of a baseline R-404A
multiplex DX system using bin analyses in sixteen cities from eight climate zones of the United States.
3.1 DESCRIPTION OF CO2 BASED REFRIGERATION SYSTEMS
The CO2-based refrigeration systems investigated in this study include cascade and secondary loop
systems as well as transcritical systems. These systems are briefly described in the following section,
along with the performance comparison of the CO2-based refrigeration systems with the baseline R-404A
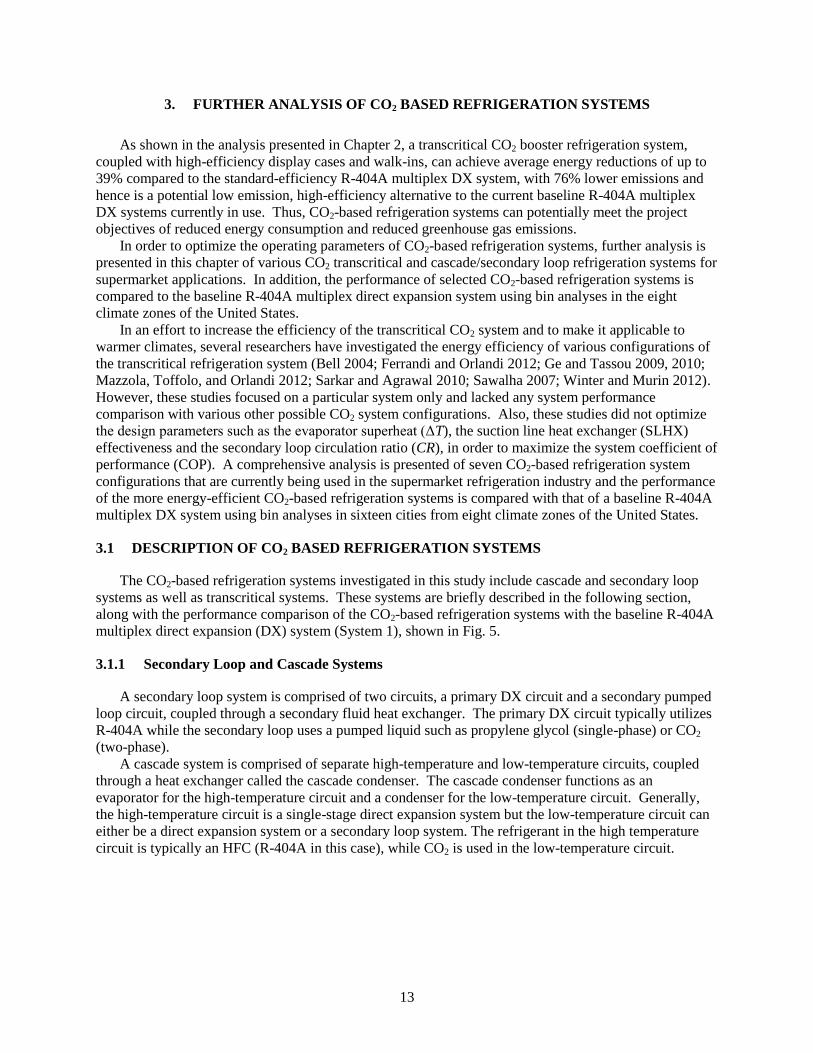
multiplex direct expansion (DX) system (System 1), shown in Fig. 5.
3.1.1 Secondary Loop and Cascade Systems
A secondary loop system is comprised of two circuits, a primary DX circuit and a secondary pumped
loop circuit, coupled through a secondary fluid heat exchanger. The primary DX circuit typically utilizes
R-404A while the secondary loop uses a pumped liquid such as propylene glycol (single-phase) or CO2
(two-phase).
A cascade system is comprised of separate high-temperature and low-temperature circuits, coupled
through a heat exchanger called the cascade condenser. The cascade condenser functions as an
evaporator for the high-temperature circuit and a condenser for the low-temperature circuit. Generally,
the high-temperature circuit is a single-stage direct expansion system but the low-temperature circuit can
either be a direct expansion system or a secondary loop system. The refrigerant in the high temperature
circuit is typically an HFC (R-404A in this case), while CO2 is used in the low-temperature circuit.
14
Fig. 5. Cycle schematic and pressure-enthalpy (p-h) diagram for the baseline multiplex direct expansion
(DX) refrigeration system.
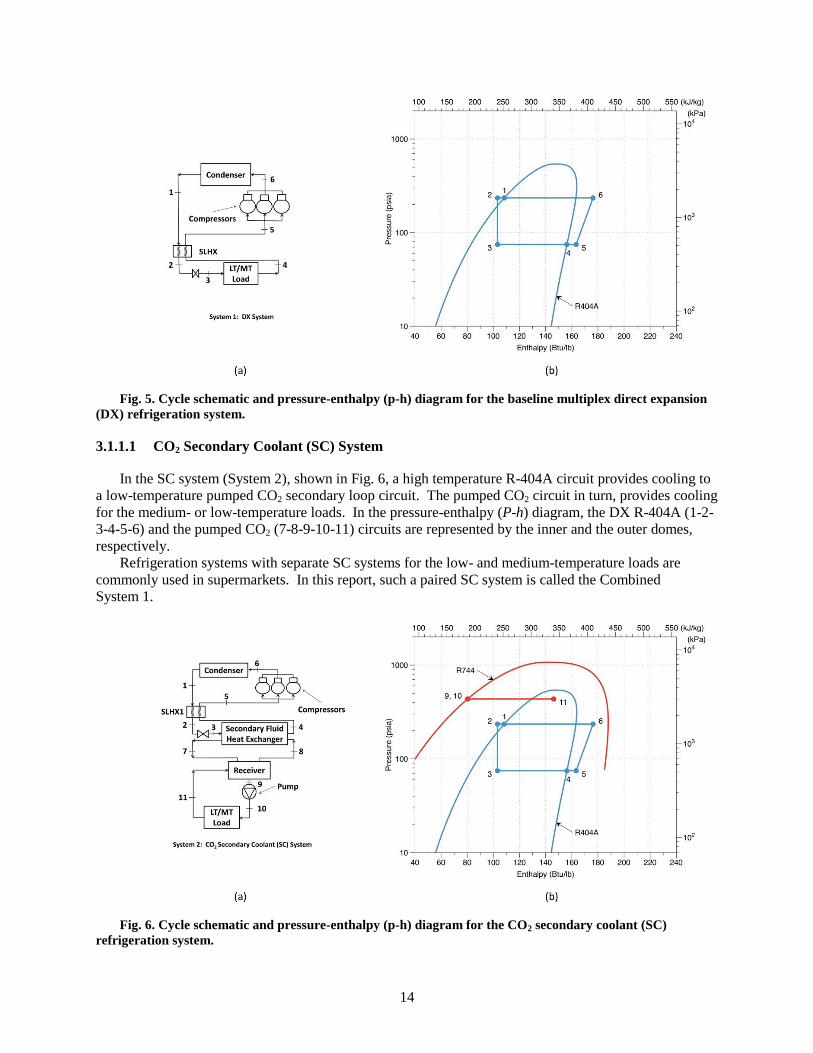
3.1.1.1 CO2 Secondary Coolant (SC) System
In the SC system (System 2), shown in Fig. 6, a high temperature R-404A circuit provides cooling to
a low-temperature pumped CO2 secondary loop circuit. The pumped CO2 circuit in turn, provides cooling
for the medium- or low-temperature loads. In the pressure-enthalpy (P-h) diagram, the DX R-404A (1-2-
3-4-5-6) and the pumped CO2 (7-8-9-10-11) circuits are represented by the inner and the outer domes,
respectively.
Refrigeration systems with separate SC systems for the low- and medium-temperature loads are
commonly used in supermarkets. In this report, such a paired SC system is called the Combined
System 1.
Fig. 6. Cycle schematic and pressure-enthalpy (p-h) diagram for the CO2 secondary coolant (SC)
refrigeration system.
15
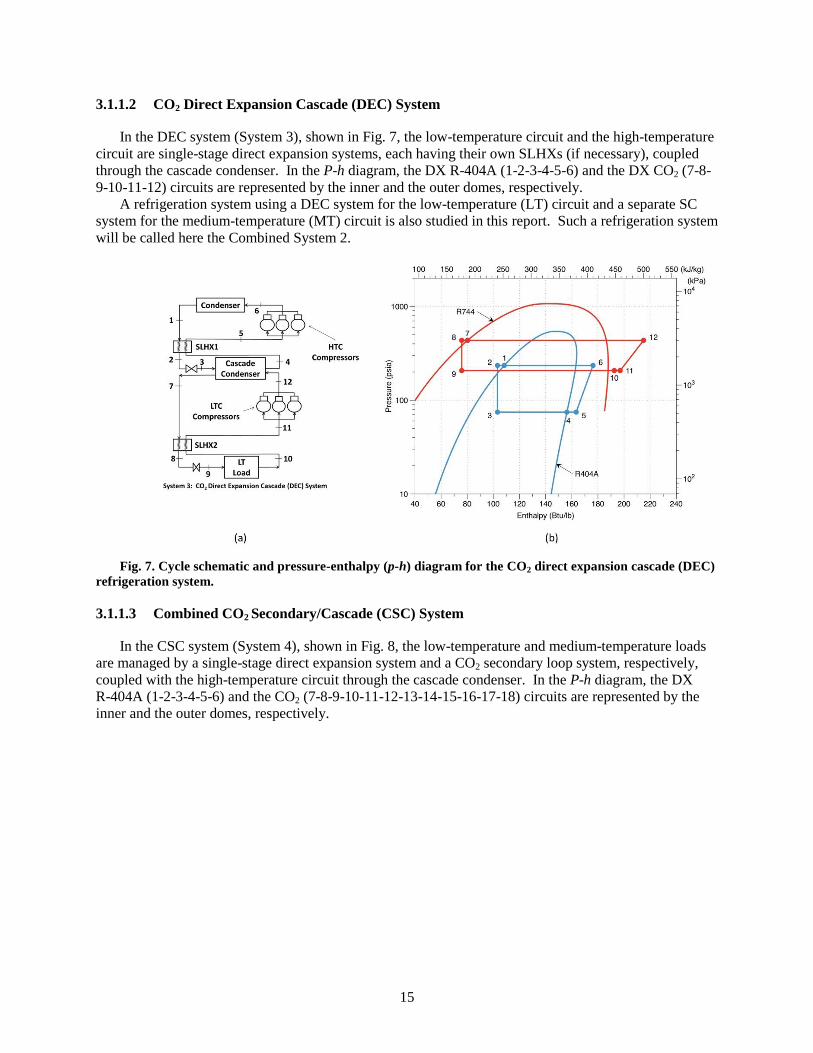
3.1.1.2 CO2 Direct Expansion Cascade (DEC) System
In the DEC system (System 3), shown in Fig. 7, the low-temperature circuit and the high-temperature
circuit are single-stage direct expansion systems, each having their own SLHXs (if necessary), coupled
through the cascade condenser. In the P-h diagram, the DX R-404A (1-2-3-4-5-6) and the DX CO2 (7-8-
9-10-11-12) circuits are represented by the inner and the outer domes, respectively.
A refrigeration system using a DEC system for the low-temperature (LT) circuit and a separate SC
system for the medium-temperature (MT) circuit is also studied in this report. Such a refrigeration system
will be called here the Combined System 2.
Fig. 7. Cycle schematic and pressure-enthalpy (p-h) diagram for the CO2 direct expansion cascade (DEC)
refrigeration system.
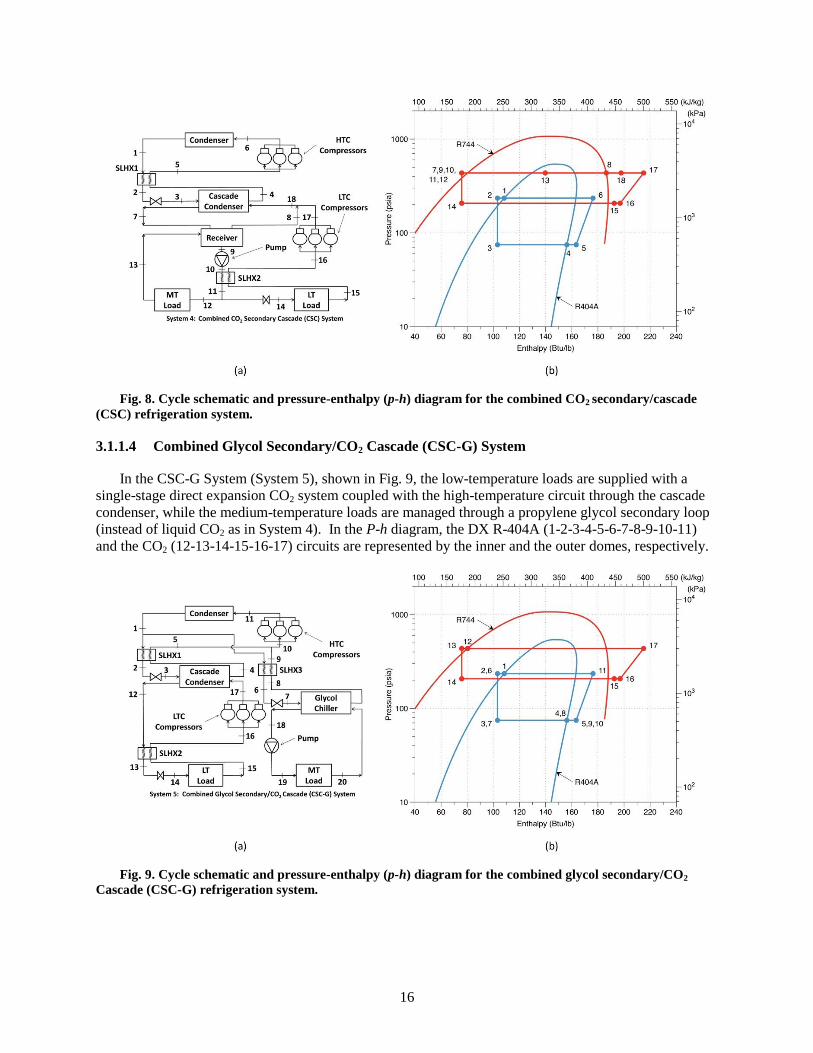
3.1.1.3 Combined CO2 Secondary/Cascade (CSC) System
In the CSC system (System 4), shown in Fig. 8, the low-temperature and medium-temperature loads
are managed by a single-stage direct expansion system and a CO2 secondary loop system, respectively,
coupled with the high-temperature circuit through the cascade condenser. In the P-h diagram, the DX
R-404A (1-2-3-4-5-6) and the CO2 (7-8-9-10-11-12-13-14-15-16-17-18) circuits are represented by the
inner and the outer domes, respectively.
16
Fig. 8. Cycle schematic and pressure-enthalpy (p-h) diagram for the combined CO2 secondary/cascade
(CSC) refrigeration system.
3.1.1.4 Combined Glycol Secondary/CO2 Cascade (CSC-G) System
In the CSC-G System (System 5), shown in Fig. 9, the low-temperature loads are supplied with a
single-stage direct expansion CO2 system coupled with the high-temperature circuit through the cascade
condenser, while the medium-temperature loads are managed through a propylene glycol secondary loop
(instead of liquid CO2 as in System 4). In the P-h diagram, the DX R-404A (1-2-3-4-5-6-7-8-9-10-11)
and the CO2 (12-13-14-15-16-17) circuits are represented by the inner and the outer domes, respectively.
Fig. 9. Cycle schematic and pressure-enthalpy (p-h) diagram for the combined glycol secondary/CO2
Cascade (CSC-G) refrigeration system.
17
3.1.2 Transcritical CO2 Booster Systems
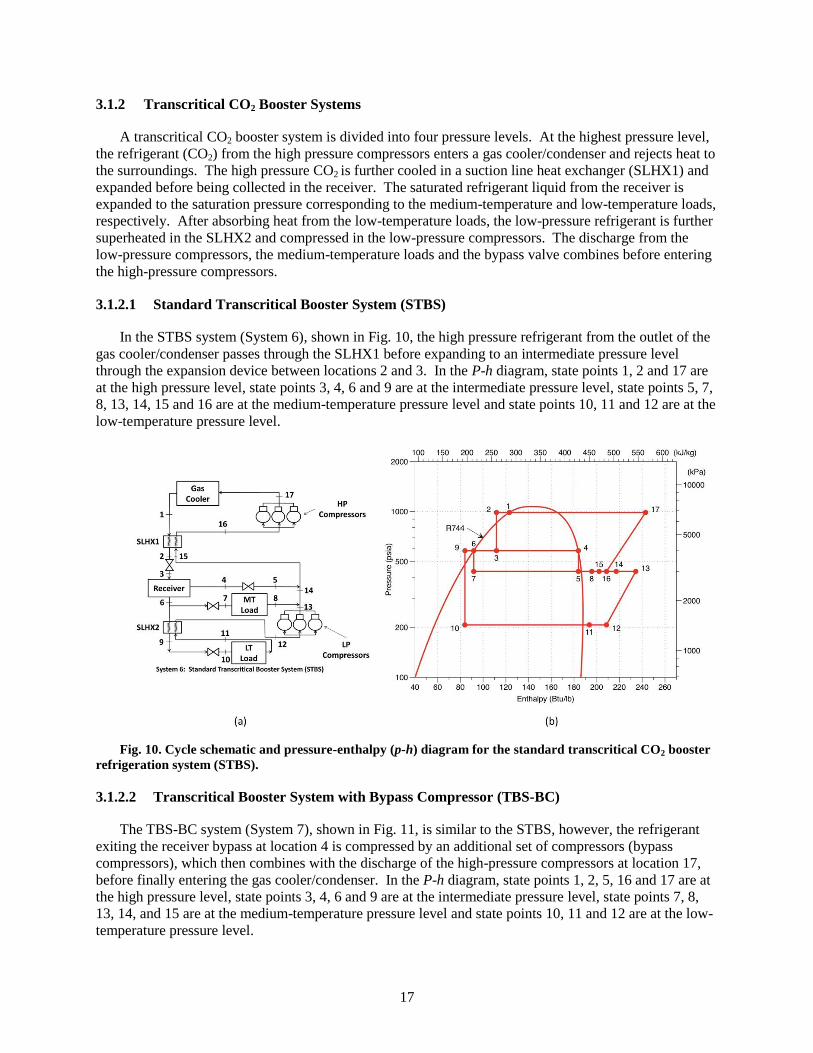
A transcritical CO2 booster system is divided into four pressure levels. At the highest pressure level,
the refrigerant (CO2) from the high pressure compressors enters a gas cooler/condenser and rejects heat to
the surroundings. The high pressure CO2 is further cooled in a suction line heat exchanger (SLHX1) and
expanded before being collected in the receiver. The saturated refrigerant liquid from the receiver is
expanded to the saturation pressure corresponding to the medium-temperature and low-temperature loads, respectively. After absorbing heat from the low-temperature loads, the low-pressure refrigerant is further
superheated in the SLHX2 and compressed in the low-pressure compressors. The discharge from the
low-pressure compressors, the medium-temperature loads and the bypass valve combines before entering
the high-pressure compressors.
3.1.2.1 Standard Transcritical Booster System (STBS)
In the STBS system (System 6), shown in Fig. 10, the high pressure refrigerant from the outlet of the
gas cooler/condenser passes through the SLHX1 before expanding to an intermediate pressure level
through the expansion device between locations 2 and 3. In the P-h diagram, state points 1, 2 and 17 are
at the high pressure level, state points 3, 4, 6 and 9 are at the intermediate pressure level, state points 5, 7,
8, 13, 14, 15 and 16 are at the medium-temperature pressure level and state points 10, 11 and 12 are at the
low-temperature pressure level.
Fig. 10. Cycle schematic and pressure-enthalpy (p-h) diagram for the standard transcritical CO2 booster
refrigeration system (STBS).
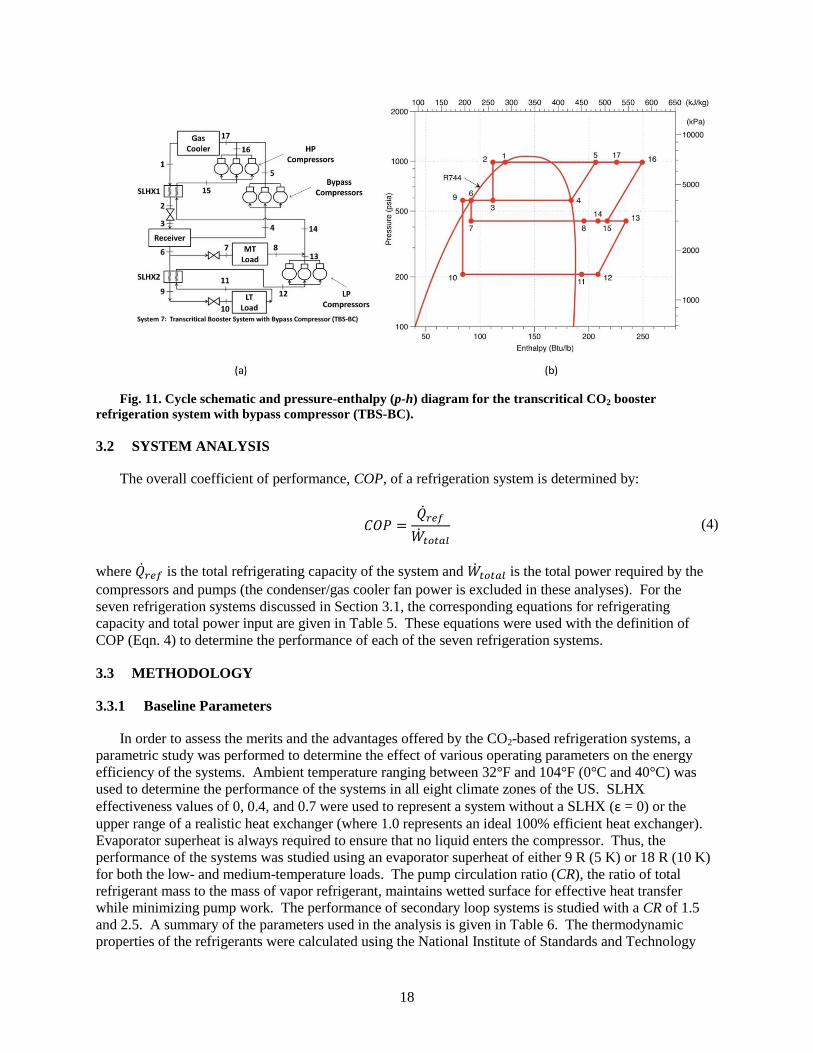
3.1.2.2 Transcritical Booster System with Bypass Compressor (TBS-BC)
The TBS-BC system (System 7), shown in Fig. 11, is similar to the STBS, however, the refrigerant
exiting the receiver bypass at location 4 is compressed by an additional set of compressors (bypass
compressors), which then combines with the discharge of the high-pressure compressors at location 17,
before finally entering the gas cooler/condenser. In the P-h diagram, state points 1, 2, 5, 16 and 17 are at
the high pressure level, state points 3, 4, 6 and 9 are at the intermediate pressure level, state points 7, 8,
13, 14, and 15 are at the medium-temperature pressure level and state points 10, 11 and 12 are at the low-
temperature pressure level.
18
Fig. 11. Cycle schematic and pressure-enthalpy (p-h) diagram for the transcritical CO2 booster
refrigeration system with bypass compressor (TBS-BC).
3.2 SYSTEM ANALYSIS
The overall coefficient of performance, COP, of a refrigeration system is determined by:
𝐶𝑂𝑃 =�̇�𝑟𝑒𝑓
�̇�𝑡𝑜𝑡𝑎𝑙
(4)
where �̇�𝑟𝑒𝑓 is the total refrigerating capacity of the system and �̇�𝑡𝑜𝑡𝑎𝑙 is the total power required by the
compressors and pumps (the condenser/gas cooler fan power is excluded in these analyses). For the
seven refrigeration systems discussed in Section 3.1, the corresponding equations for refrigerating
capacity and total power input are given in Table 5. These equations were used with the definition of
COP (Eqn. 4) to determine the performance of each of the seven refrigeration systems.
3.3 METHODOLOGY
3.3.1 Baseline Parameters
In order to assess the merits and the advantages offered by the CO2-based refrigeration systems, a
parametric study was performed to determine the effect of various operating parameters on the energy
efficiency of the systems. Ambient temperature ranging between 32°F and 104°F (0°C and 40°C) was
used to determine the performance of the systems in all eight climate zones of the US. SLHX
effectiveness values of 0, 0.4, and 0.7 were used to represent a system without a SLHX (ε = 0) or the
upper range of a realistic heat exchanger (where 1.0 represents an ideal 100% efficient heat exchanger).
Evaporator superheat is always required to ensure that no liquid enters the compressor. Thus, the
performance of the systems was studied using an evaporator superheat of either 9 R (5 K) or 18 R (10 K)
for both the low- and medium-temperature loads. The pump circulation ratio (CR), the ratio of total
refrigerant mass to the mass of vapor refrigerant, maintains wetted surface for effective heat transfer
while minimizing pump work. The performance of secondary loop systems is studied with a CR of 1.5
and 2.5. A summary of the parameters used in the analysis is given in Table 6. The thermodynamic
properties of the refrigerants were calculated using the National Institute of Standards and Technology
19
(NIST) Reference Fluid Thermodynamic and Transport Properties Database (REFPROP) Version 9.1
(Lemmon et al., 2013).
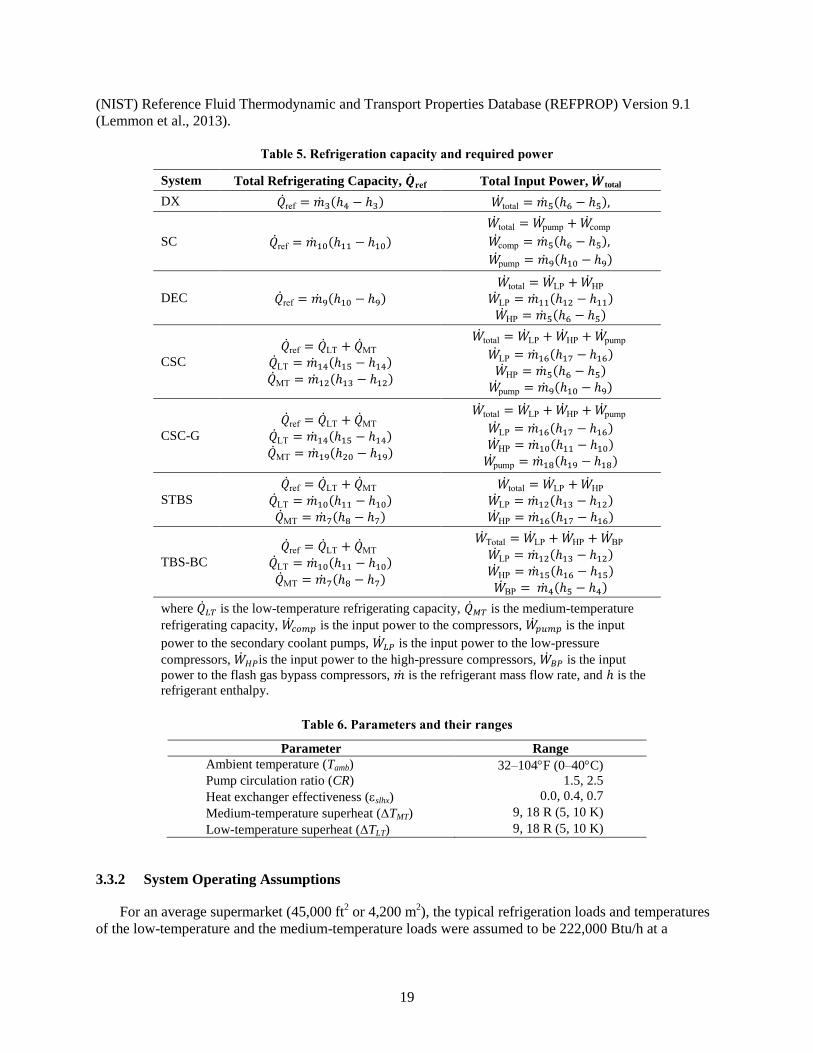
Table 5. Refrigeration capacity and required power
System Total Refrigerating Capacity, �̇�ref Total Input Power, �̇�total
DX �̇�ref = �̇�3(ℎ4 − ℎ3) �̇�total = �̇�5(ℎ6 − ℎ5),
SC �̇�ref = �̇�10(ℎ11 − ℎ10)
�̇�total = �̇�pump + �̇�comp
�̇�comp = �̇�5(ℎ6 − ℎ5),
�̇�pump = �̇�9(ℎ10 − ℎ9)
DEC �̇�ref = �̇�9(ℎ10 − ℎ9)
�̇�total = �̇�LP + �̇�HP
�̇�LP = �̇�11(ℎ12 − ℎ11)
�̇�HP = �̇�5(ℎ6 − ℎ5)
CSC
�̇�ref = �̇�LT + �̇�MT �̇�LT = �̇�14(ℎ15 − ℎ14)
�̇�MT = �̇�12(ℎ13 − ℎ12)
�̇�total = �̇�LP + �̇�HP + �̇�pump
�̇�LP = �̇�16(ℎ17 − ℎ16)
�̇�HP = �̇�5(ℎ6 − ℎ5)
�̇�pump = �̇�9(ℎ10 − ℎ9)
CSC-G
�̇�ref = �̇�LT + �̇�MT
�̇�LT = �̇�14(ℎ15 − ℎ14)
�̇�MT = �̇�19(ℎ20 − ℎ19)
�̇�total = �̇�LP + �̇�HP + �̇�pump
�̇�LP = �̇�16(ℎ17 − ℎ16)
�̇�HP = �̇�10(ℎ11 − ℎ10)
�̇�pump = �̇�18(ℎ19 − ℎ18)
STBS
�̇�ref = �̇�LT + �̇�MT
�̇�LT = �̇�10(ℎ11 − ℎ10)
�̇�MT = �̇�7(ℎ8 − ℎ7)
�̇�total = �̇�LP + �̇�HP
�̇�LP = �̇�12(ℎ13 − ℎ12)
�̇�HP = �̇�16(ℎ17 − ℎ16)
TBS-BC
�̇�ref = �̇�LT + �̇�MT
�̇�LT = �̇�10(ℎ11 − ℎ10)
�̇�MT = �̇�7(ℎ8 − ℎ7)
�̇�Total = �̇�LP + �̇�HP + �̇�BP
�̇�LP = �̇�12(ℎ13 − ℎ12)
�̇�HP = �̇�15(ℎ16 − ℎ15)
�̇�BP = �̇�4(ℎ5 − ℎ4)
where �̇�𝐿𝑇 is the low-temperature refrigerating capacity, �̇�𝑀𝑇 is the medium-temperature
refrigerating capacity, �̇�𝑐𝑜𝑚𝑝 is the input power to the compressors, �̇�𝑝𝑢𝑚𝑝 is the input
power to the secondary coolant pumps, �̇�𝐿𝑃 is the input power to the low-pressure
compressors, �̇�𝐻𝑃is the input power to the high-pressure compressors, �̇�𝐵𝑃 is the input
power to the flash gas bypass compressors, �̇� is the refrigerant mass flow rate, and ℎ is the
refrigerant enthalpy.
Table 6. Parameters and their ranges
Parameter Range
Ambient temperature (Tamb) 32–104F (0–40C)
Pump circulation ratio (CR) 1.5, 2.5
Heat exchanger effectiveness (slhx) 0.0, 0.4, 0.7
Medium-temperature superheat (TMT) 9, 18 R (5, 10 K)
Low-temperature superheat (TLT) 9, 18 R (5, 10 K)
3.3.2 System Operating Assumptions
For an average supermarket (45,000 ft2 or 4,200 m
2), the typical refrigeration loads and temperatures
of the low-temperature and the medium-temperature loads were assumed to be 222,000 Btu/h at a
20
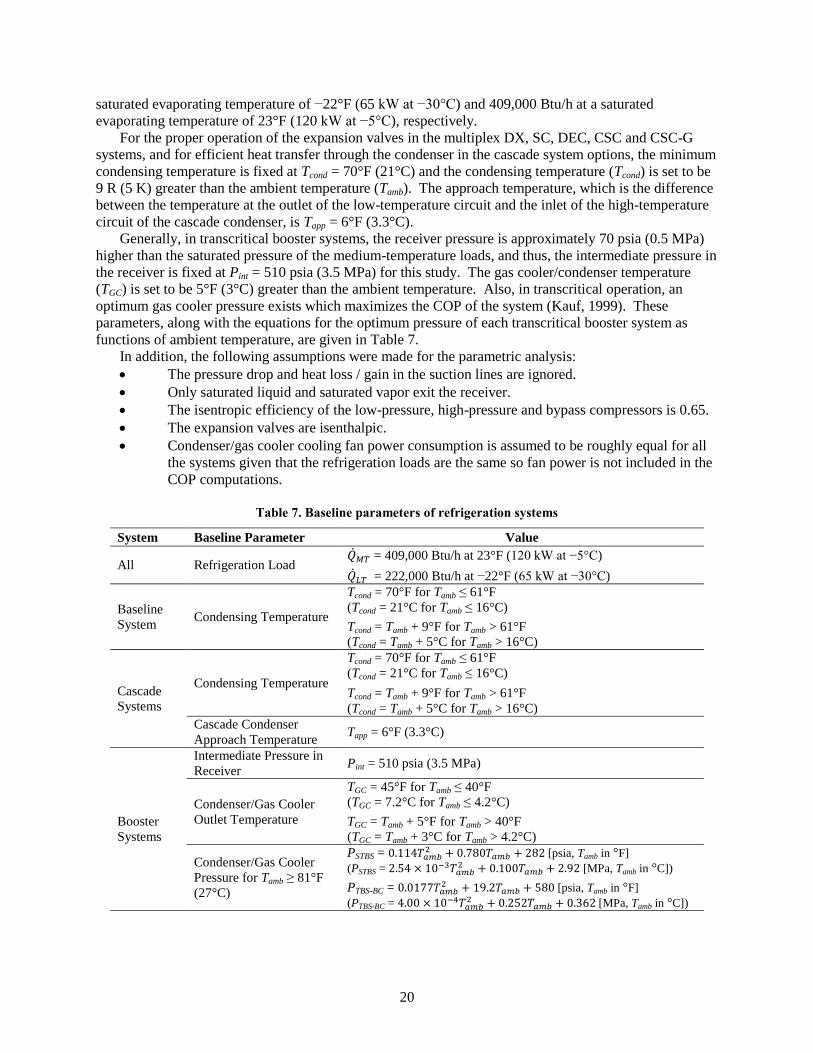
saturated evaporating temperature of −22°F (65 kW at −30°C) and 409,000 Btu/h at a saturated
evaporating temperature of 23°F (120 kW at −5°C), respectively.
For the proper operation of the expansion valves in the multiplex DX, SC, DEC, CSC and CSC-G
systems, and for efficient heat transfer through the condenser in the cascade system options, the minimum
condensing temperature is fixed at Tcond = 70°F (21°C) and the condensing temperature (Tcond) is set to be
9 R (5 K) greater than the ambient temperature (Tamb). The approach temperature, which is the difference
between the temperature at the outlet of the low-temperature circuit and the inlet of the high-temperature
circuit of the cascade condenser, is Tapp = 6°F (3.3°C).
Generally, in transcritical booster systems, the receiver pressure is approximately 70 psia (0.5 MPa)
higher than the saturated pressure of the medium-temperature loads, and thus, the intermediate pressure in
the receiver is fixed at Pint = 510 psia (3.5 MPa) for this study. The gas cooler/condenser temperature
(TGC) is set to be 5°F (3°C) greater than the ambient temperature. Also, in transcritical operation, an
optimum gas cooler pressure exists which maximizes the COP of the system (Kauf, 1999). These
parameters, along with the equations for the optimum pressure of each transcritical booster system as
functions of ambient temperature, are given in Table 7.
In addition, the following assumptions were made for the parametric analysis:
The pressure drop and heat loss / gain in the suction lines are ignored.
Only saturated liquid and saturated vapor exit the receiver.
The isentropic efficiency of the low-pressure, high-pressure and bypass compressors is 0.65.
The expansion valves are isenthalpic.
Condenser/gas cooler cooling fan power consumption is assumed to be roughly equal for all
the systems given that the refrigeration loads are the same so fan power is not included in the
COP computations.
Table 7. Baseline parameters of refrigeration systems
System Baseline Parameter Value
All Refrigeration Load �̇�𝑀𝑇 = 409,000 Btu/h at 23°F (120 kW at −5°C)
�̇�𝐿𝑇 = 222,000 Btu/h at −22°F (65 kW at −30°C)
Baseline
System Condensing Temperature
Tcond = 70°F for Tamb ≤ 61°F
(Tcond = 21°C for Tamb ≤ 16°C)
Tcond = Tamb + 9°F for Tamb > 61°F
(Tcond = Tamb + 5°C for Tamb > 16°C)
Cascade
Systems
Condensing Temperature
Tcond = 70°F for Tamb ≤ 61°F
(Tcond = 21°C for Tamb ≤ 16°C)
Tcond = Tamb + 9°F for Tamb > 61°F
(Tcond = Tamb + 5°C for Tamb > 16°C)
Cascade Condenser
Approach Temperature Tapp = 6°F (3.3°C)
Booster
Systems
Intermediate Pressure in
Receiver Pint = 510 psia (3.5 MPa)
Condenser/Gas Cooler
Outlet Temperature
TGC = 45°F for Tamb ≤ 40°F
(TGC = 7.2°C for Tamb ≤ 4.2°C)
TGC = Tamb + 5°F for Tamb > 40°F
(TGC = Tamb + 3°C for Tamb > 4.2°C)
Condenser/Gas Cooler
Pressure for Tamb ≥ 81°F
(27°C)
PSTBS = 0.114𝑇𝑎𝑚𝑏2 + 0.780𝑇𝑎𝑚𝑏 + 282 [psia, Tamb in °F]
(PSTBS = 2.54 × 10⁻³𝑇𝑎𝑚𝑏2 + 0.100𝑇𝑎𝑚𝑏 + 2.92 [MPa, Tamb in °C])
PTBS-BC = 0.0177𝑇𝑎𝑚𝑏2 + 19.2𝑇𝑎𝑚𝑏 + 580 [psia, Tamb in °F]
(PTBS-BC = 4.00 × 10⁻⁴𝑇𝑎𝑚𝑏2 + 0.252𝑇𝑎𝑚𝑏 + 0.362 [MPa, Tamb in °C])
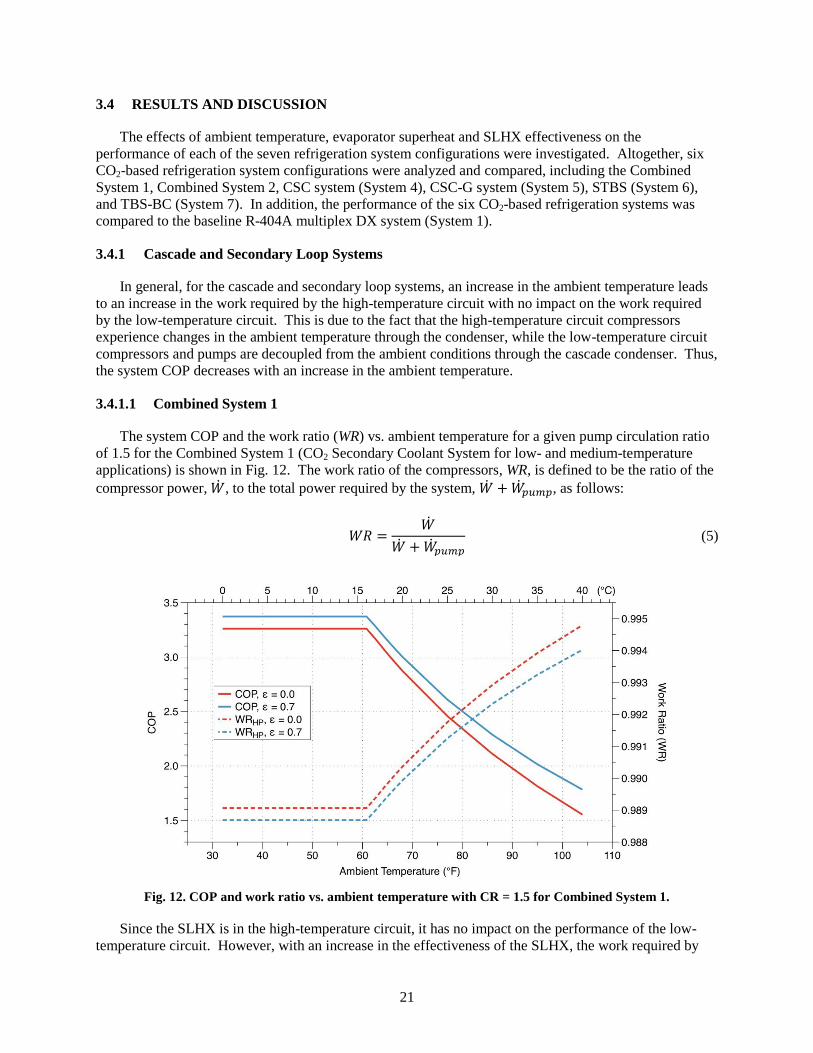
21
3.4 RESULTS AND DISCUSSION
The effects of ambient temperature, evaporator superheat and SLHX effectiveness on the
performance of each of the seven refrigeration system configurations were investigated. Altogether, six
CO2-based refrigeration system configurations were analyzed and compared, including the Combined
System 1, Combined System 2, CSC system (System 4), CSC-G system (System 5), STBS (System 6),
and TBS-BC (System 7). In addition, the performance of the six CO2-based refrigeration systems was
compared to the baseline R-404A multiplex DX system (System 1).
3.4.1 Cascade and Secondary Loop Systems
In general, for the cascade and secondary loop systems, an increase in the ambient temperature leads
to an increase in the work required by the high-temperature circuit with no impact on the work required
by the low-temperature circuit. This is due to the fact that the high-temperature circuit compressors
experience changes in the ambient temperature through the condenser, while the low-temperature circuit
compressors and pumps are decoupled from the ambient conditions through the cascade condenser. Thus,
the system COP decreases with an increase in the ambient temperature.
3.4.1.1 Combined System 1
The system COP and the work ratio (WR) vs. ambient temperature for a given pump circulation ratio
of 1.5 for the Combined System 1 (CO2 Secondary Coolant System for low- and medium-temperature
applications) is shown in Fig. 12. The work ratio of the compressors, WR, is defined to be the ratio of the
compressor power, �̇�, to the total power required by the system, �̇� + �̇�𝑝𝑢𝑚𝑝, as follows:
𝑊𝑅 =�̇�
�̇� + �̇�𝑝𝑢𝑚𝑝
(5)
Fig. 12. COP and work ratio vs. ambient temperature with CR = 1.5 for Combined System 1.
Since the SLHX is in the high-temperature circuit, it has no impact on the performance of the low-
temperature circuit. However, with an increase in the effectiveness of the SLHX, the work required by
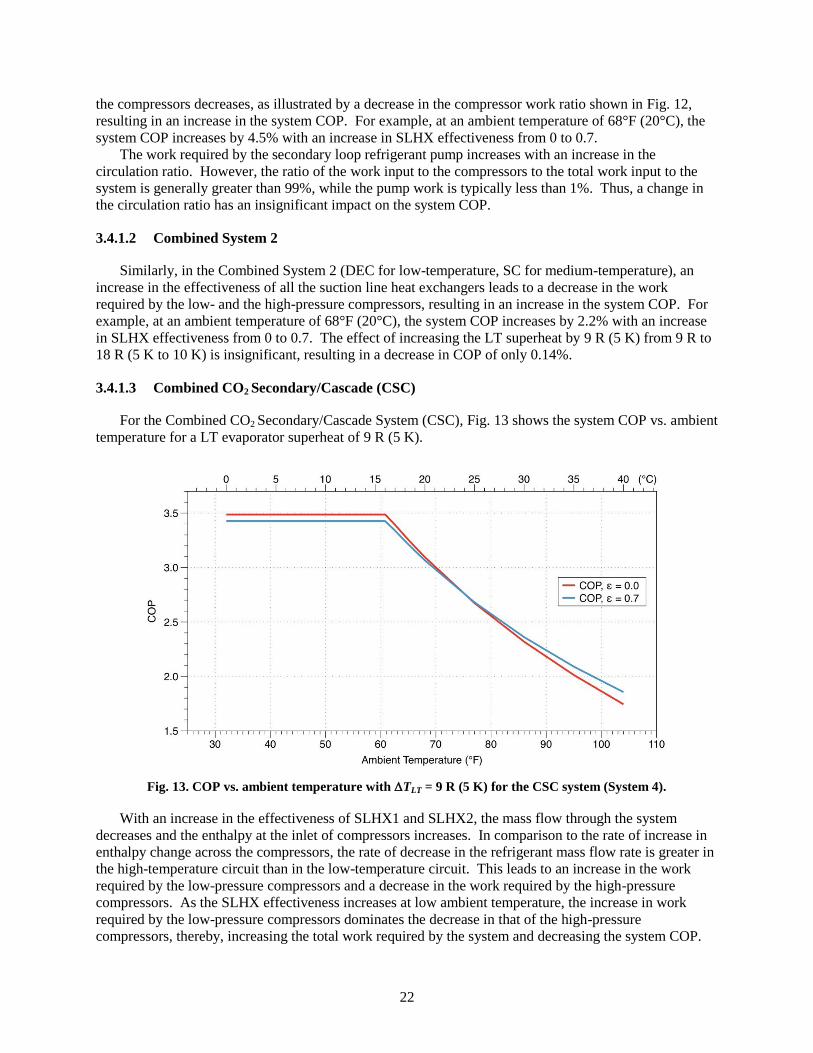
22
the compressors decreases, as illustrated by a decrease in the compressor work ratio shown in Fig. 12,
resulting in an increase in the system COP. For example, at an ambient temperature of 68°F (20°C), the
system COP increases by 4.5% with an increase in SLHX effectiveness from 0 to 0.7.
The work required by the secondary loop refrigerant pump increases with an increase in the
circulation ratio. However, the ratio of the work input to the compressors to the total work input to the
system is generally greater than 99%, while the pump work is typically less than 1%. Thus, a change in
the circulation ratio has an insignificant impact on the system COP.
3.4.1.2 Combined System 2
Similarly, in the Combined System 2 (DEC for low-temperature, SC for medium-temperature), an
increase in the effectiveness of all the suction line heat exchangers leads to a decrease in the work
required by the low- and the high-pressure compressors, resulting in an increase in the system COP. For
example, at an ambient temperature of 68°F (20°C), the system COP increases by 2.2% with an increase
in SLHX effectiveness from 0 to 0.7. The effect of increasing the LT superheat by 9 R (5 K) from 9 R to
18 R (5 K to 10 K) is insignificant, resulting in a decrease in COP of only 0.14%.
3.4.1.3 Combined CO2 Secondary/Cascade (CSC)
For the Combined CO2 Secondary/Cascade System (CSC), Fig. 13 shows the system COP vs. ambient
temperature for a LT evaporator superheat of 9 R (5 K).
Fig. 13. COP vs. ambient temperature with TLT = 9 R (5 K) for the CSC system (System 4).
With an increase in the effectiveness of SLHX1 and SLHX2, the mass flow through the system
decreases and the enthalpy at the inlet of compressors increases. In comparison to the rate of increase in
enthalpy change across the compressors, the rate of decrease in the refrigerant mass flow rate is greater in
the high-temperature circuit than in the low-temperature circuit. This leads to an increase in the work
required by the low-pressure compressors and a decrease in the work required by the high-pressure
compressors. As the SLHX effectiveness increases at low ambient temperature, the increase in work
required by the low-pressure compressors dominates the decrease in that of the high-pressure
compressors, thereby, increasing the total work required by the system and decreasing the system COP.
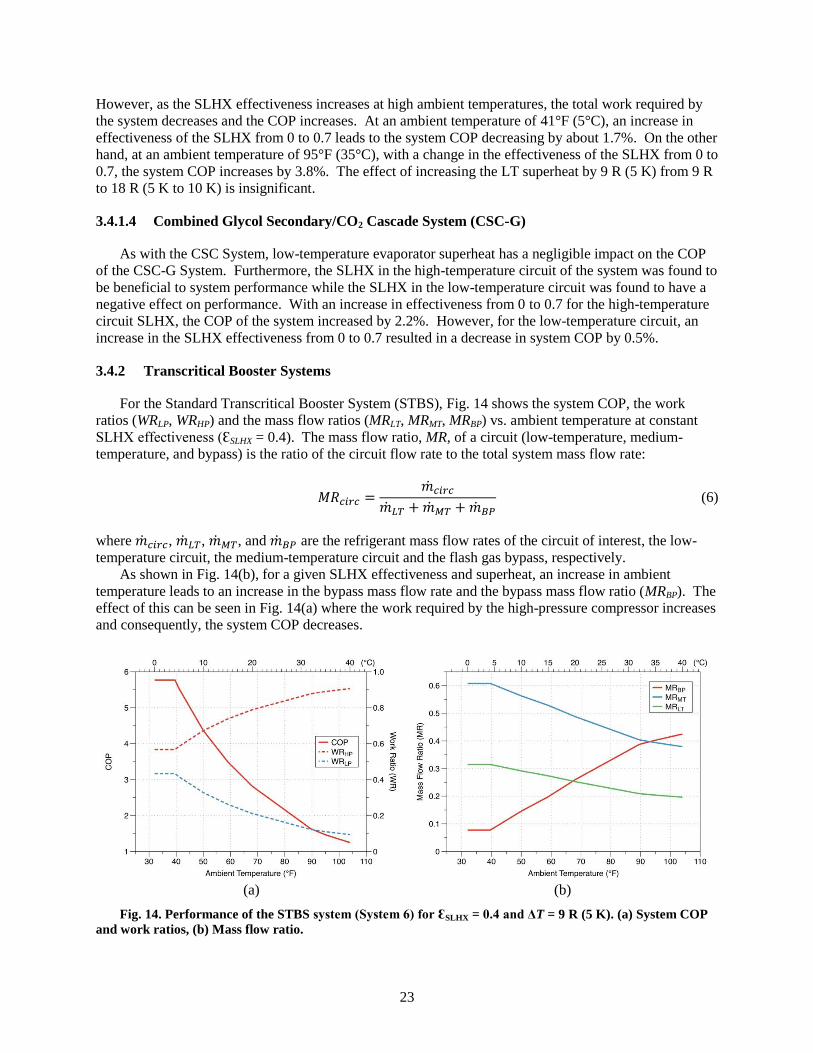
23
However, as the SLHX effectiveness increases at high ambient temperatures, the total work required by
the system decreases and the COP increases. At an ambient temperature of 41°F (5°C), an increase in
effectiveness of the SLHX from 0 to 0.7 leads to the system COP decreasing by about 1.7%. On the other
hand, at an ambient temperature of 95°F (35°C), with a change in the effectiveness of the SLHX from 0 to
0.7, the system COP increases by 3.8%. The effect of increasing the LT superheat by 9 R (5 K) from 9 R
to 18 R (5 K to 10 K) is insignificant.
3.4.1.4 Combined Glycol Secondary/CO2 Cascade System (CSC-G)
As with the CSC System, low-temperature evaporator superheat has a negligible impact on the COP
of the CSC-G System. Furthermore, the SLHX in the high-temperature circuit of the system was found to
be beneficial to system performance while the SLHX in the low-temperature circuit was found to have a
negative effect on performance. With an increase in effectiveness from 0 to 0.7 for the high-temperature
circuit SLHX, the COP of the system increased by 2.2%. However, for the low-temperature circuit, an
increase in the SLHX effectiveness from 0 to 0.7 resulted in a decrease in system COP by 0.5%.
3.4.2 Transcritical Booster Systems
For the Standard Transcritical Booster System (STBS), Fig. 14 shows the system COP, the work
ratios (WRLP, WRHP) and the mass flow ratios (MRLT, MRMT, MRBP) vs. ambient temperature at constant
SLHX effectiveness (ƐSLHX = 0.4). The mass flow ratio, MR, of a circuit (low-temperature, medium-
temperature, and bypass) is the ratio of the circuit flow rate to the total system mass flow rate:
𝑀𝑅𝑐𝑖𝑟𝑐 =�̇�𝑐𝑖𝑟𝑐
�̇�𝐿𝑇 + �̇�𝑀𝑇 + �̇�𝐵𝑃 (6)
where �̇�𝑐𝑖𝑟𝑐, �̇�𝐿𝑇, �̇�𝑀𝑇, and �̇�𝐵𝑃 are the refrigerant mass flow rates of the circuit of interest, the low-
temperature circuit, the medium-temperature circuit and the flash gas bypass, respectively.
As shown in Fig. 14(b), for a given SLHX effectiveness and superheat, an increase in ambient
temperature leads to an increase in the bypass mass flow rate and the bypass mass flow ratio (MRBP). The
effect of this can be seen in Fig. 14(a) where the work required by the high-pressure compressor increases
and consequently, the system COP decreases.
(a) (b)
Fig. 14. Performance of the STBS system (System 6) for ƐSLHX = 0.4 and ΔT = 9 R (5 K). (a) System COP
and work ratios, (b) Mass flow ratio.
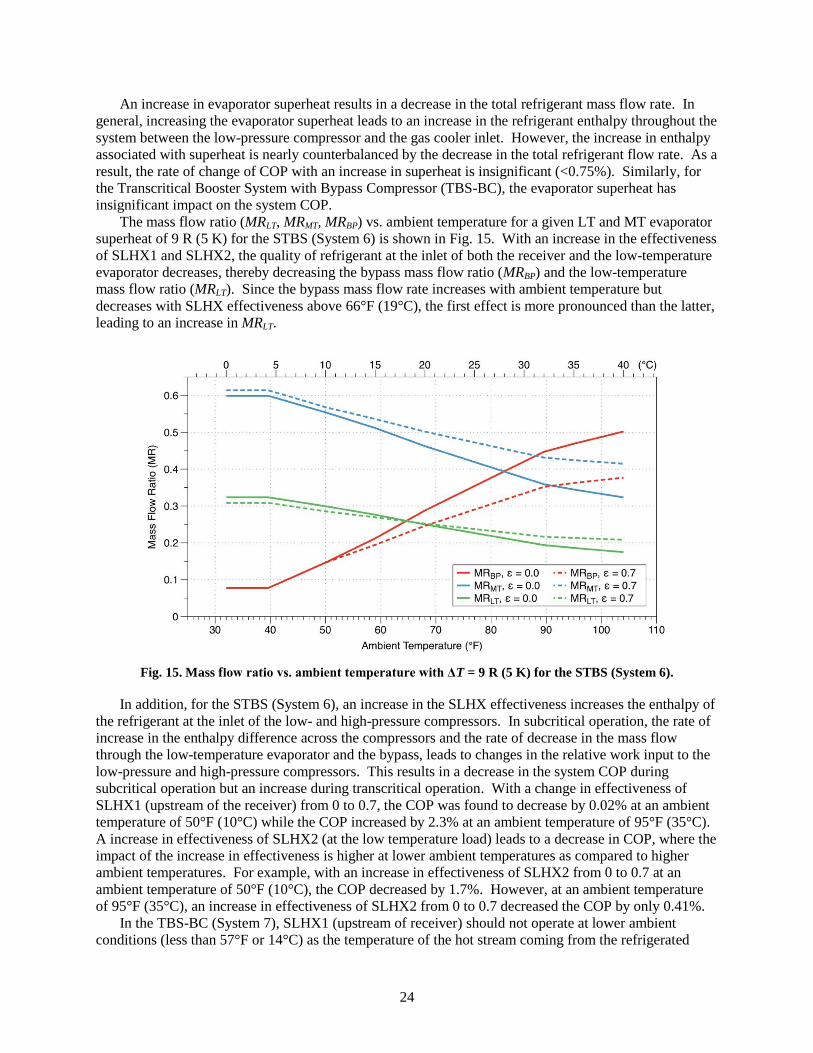
24
An increase in evaporator superheat results in a decrease in the total refrigerant mass flow rate. In
general, increasing the evaporator superheat leads to an increase in the refrigerant enthalpy throughout the
system between the low-pressure compressor and the gas cooler inlet. However, the increase in enthalpy
associated with superheat is nearly counterbalanced by the decrease in the total refrigerant flow rate. As a
result, the rate of change of COP with an increase in superheat is insignificant (<0.75%). Similarly, for
the Transcritical Booster System with Bypass Compressor (TBS-BC), the evaporator superheat has
insignificant impact on the system COP.
The mass flow ratio (MRLT, MRMT, MRBP) vs. ambient temperature for a given LT and MT evaporator
superheat of 9 R (5 K) for the STBS (System 6) is shown in Fig. 15. With an increase in the effectiveness
of SLHX1 and SLHX2, the quality of refrigerant at the inlet of both the receiver and the low-temperature
evaporator decreases, thereby decreasing the bypass mass flow ratio (MRBP) and the low-temperature
mass flow ratio (MRLT). Since the bypass mass flow rate increases with ambient temperature but
decreases with SLHX effectiveness above 66°F (19°C), the first effect is more pronounced than the latter,
leading to an increase in MRLT.
Fig. 15. Mass flow ratio vs. ambient temperature with ΔT = 9 R (5 K) for the STBS (System 6).
In addition, for the STBS (System 6), an increase in the SLHX effectiveness increases the enthalpy of
the refrigerant at the inlet of the low- and high-pressure compressors. In subcritical operation, the rate of
increase in the enthalpy difference across the compressors and the rate of decrease in the mass flow
through the low-temperature evaporator and the bypass, leads to changes in the relative work input to the
low-pressure and high-pressure compressors. This results in a decrease in the system COP during
subcritical operation but an increase during transcritical operation. With a change in effectiveness of
SLHX1 (upstream of the receiver) from 0 to 0.7, the COP was found to decrease by 0.02% at an ambient
temperature of 50°F (10°C) while the COP increased by 2.3% at an ambient temperature of 95°F (35°C).
A increase in effectiveness of SLHX2 (at the low temperature load) leads to a decrease in COP, where the
impact of the increase in effectiveness is higher at lower ambient temperatures as compared to higher
ambient temperatures. For example, with an increase in effectiveness of SLHX2 from 0 to 0.7 at an
ambient temperature of 50°F (10°C), the COP decreased by 1.7%. However, at an ambient temperature
of 95°F (35°C), an increase in effectiveness of SLHX2 from 0 to 0.7 decreased the COP by only 0.41%.
In the TBS-BC (System 7), SLHX1 (upstream of receiver) should not operate at lower ambient
conditions (less than 57°F or 14°C) as the temperature of the hot stream coming from the refrigerated
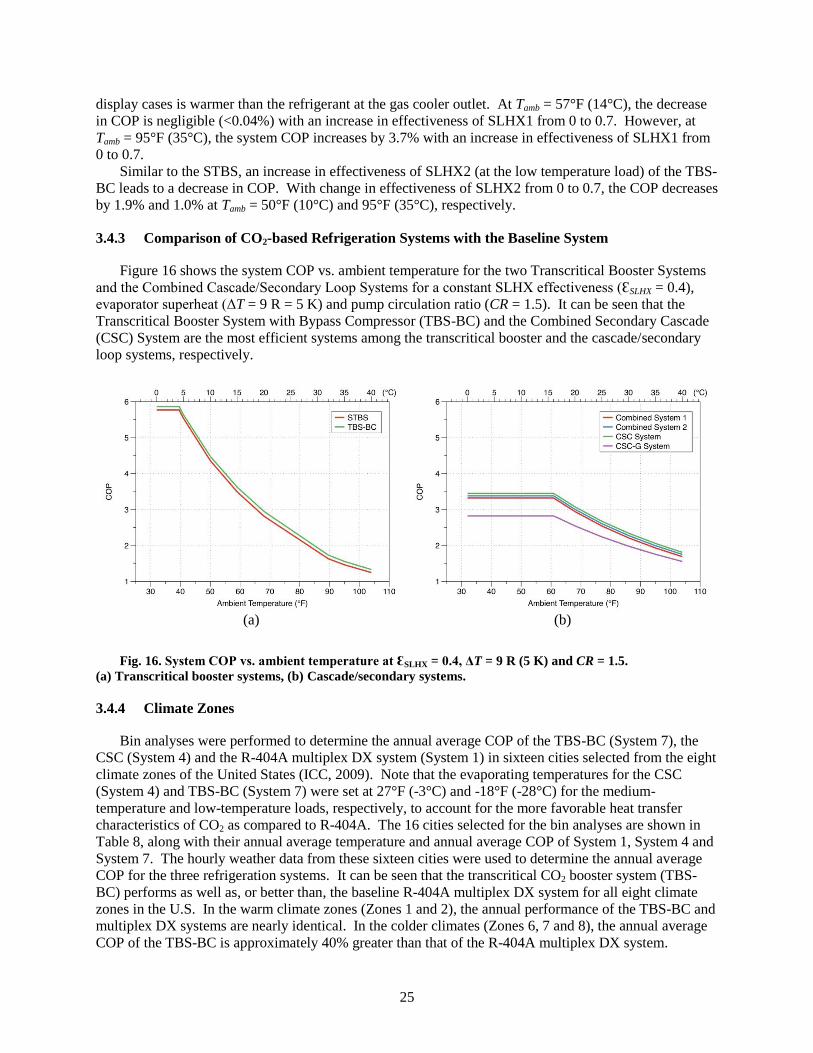
25
display cases is warmer than the refrigerant at the gas cooler outlet. At Tamb = 57°F (14°C), the decrease
in COP is negligible (<0.04%) with an increase in effectiveness of SLHX1 from 0 to 0.7. However, at
Tamb = 95°F (35°C), the system COP increases by 3.7% with an increase in effectiveness of SLHX1 from
0 to 0.7.
Similar to the STBS, an increase in effectiveness of SLHX2 (at the low temperature load) of the TBS-
BC leads to a decrease in COP. With change in effectiveness of SLHX2 from 0 to 0.7, the COP decreases
by 1.9% and 1.0% at Tamb = 50°F (10°C) and 95°F (35°C), respectively.
3.4.3 Comparison of CO2-based Refrigeration Systems with the Baseline System
Figure 16 shows the system COP vs. ambient temperature for the two Transcritical Booster Systems
and the Combined Cascade/Secondary Loop Systems for a constant SLHX effectiveness (ƐSLHX = 0.4),
evaporator superheat (ΔT = 9 R = 5 K) and pump circulation ratio (CR = 1.5). It can be seen that the
Transcritical Booster System with Bypass Compressor (TBS-BC) and the Combined Secondary Cascade
(CSC) System are the most efficient systems among the transcritical booster and the cascade/secondary
loop systems, respectively.
(a) (b)
Fig. 16. System COP vs. ambient temperature at ƐSLHX = 0.4, ΔT = 9 R (5 K) and CR = 1.5.
(a) Transcritical booster systems, (b) Cascade/secondary systems.
3.4.4 Climate Zones
Bin analyses were performed to determine the annual average COP of the TBS-BC (System 7), the
CSC (System 4) and the R-404A multiplex DX system (System 1) in sixteen cities selected from the eight
climate zones of the United States (ICC, 2009). Note that the evaporating temperatures for the CSC
(System 4) and TBS-BC (System 7) were set at 27°F (-3°C) and -18°F (-28°C) for the medium-
temperature and low-temperature loads, respectively, to account for the more favorable heat transfer
characteristics of CO2 as compared to R-404A. The 16 cities selected for the bin analyses are shown in
Table 8, along with their annual average temperature and annual average COP of System 1, System 4 and
System 7. The hourly weather data from these sixteen cities were used to determine the annual average
COP for the three refrigeration systems. It can be seen that the transcritical CO2 booster system (TBS-
BC) performs as well as, or better than, the baseline R-404A multiplex DX system for all eight climate
zones in the U.S. In the warm climate zones (Zones 1 and 2), the annual performance of the TBS-BC and
multiplex DX systems are nearly identical. In the colder climates (Zones 6, 7 and 8), the annual average
COP of the TBS-BC is approximately 40% greater than that of the R-404A multiplex DX system.
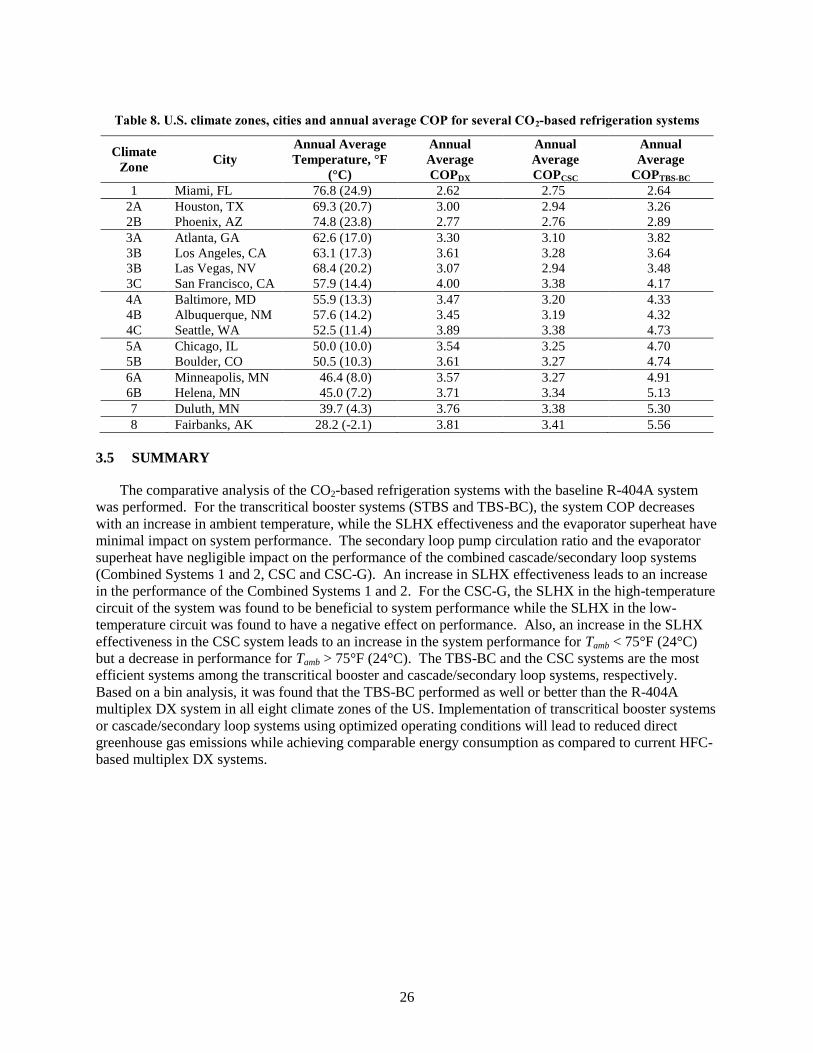
26
Table 8. U.S. climate zones, cities and annual average COP for several CO2-based refrigeration systems
Climate
Zone City
Annual Average
Temperature, °F
(°C)
Annual
Average
COPDX
Annual
Average
COPCSC
Annual
Average
COPTBS-BC
1 Miami, FL 76.8 (24.9) 2.62 2.75 2.64
2A Houston, TX 69.3 (20.7) 3.00 2.94 3.26
2B Phoenix, AZ 74.8 (23.8) 2.77 2.76 2.89
3A Atlanta, GA 62.6 (17.0) 3.30 3.10 3.82
3B Los Angeles, CA 63.1 (17.3) 3.61 3.28 3.64
3B Las Vegas, NV 68.4 (20.2) 3.07 2.94 3.48
3C San Francisco, CA 57.9 (14.4) 4.00 3.38 4.17
4A Baltimore, MD 55.9 (13.3) 3.47 3.20 4.33
4B Albuquerque, NM 57.6 (14.2) 3.45 3.19 4.32
4C Seattle, WA 52.5 (11.4) 3.89 3.38 4.73
5A Chicago, IL 50.0 (10.0) 3.54 3.25 4.70
5B Boulder, CO 50.5 (10.3) 3.61 3.27 4.74
6A Minneapolis, MN 46.4 (8.0) 3.57 3.27 4.91
6B Helena, MN 45.0 (7.2) 3.71 3.34 5.13
7 Duluth, MN 39.7 (4.3) 3.76 3.38 5.30
8 Fairbanks, AK 28.2 (-2.1) 3.81 3.41 5.56
3.5 SUMMARY
The comparative analysis of the CO2-based refrigeration systems with the baseline R-404A system
was performed. For the transcritical booster systems (STBS and TBS-BC), the system COP decreases
with an increase in ambient temperature, while the SLHX effectiveness and the evaporator superheat have
minimal impact on system performance. The secondary loop pump circulation ratio and the evaporator
superheat have negligible impact on the performance of the combined cascade/secondary loop systems
(Combined Systems 1 and 2, CSC and CSC-G). An increase in SLHX effectiveness leads to an increase
in the performance of the Combined Systems 1 and 2. For the CSC-G, the SLHX in the high-temperature
circuit of the system was found to be beneficial to system performance while the SLHX in the low-
temperature circuit was found to have a negative effect on performance. Also, an increase in the SLHX
effectiveness in the CSC system leads to an increase in the system performance for Tamb < 75°F (24°C)
but a decrease in performance for Tamb > 75°F (24°C). The TBS-BC and the CSC systems are the most
efficient systems among the transcritical booster and cascade/secondary loop systems, respectively.
Based on a bin analysis, it was found that the TBS-BC performed as well or better than the R-404A
multiplex DX system in all eight climate zones of the US. Implementation of transcritical booster systems
or cascade/secondary loop systems using optimized operating conditions will lead to reduced direct
greenhouse gas emissions while achieving comparable energy consumption as compared to current HFC-
based multiplex DX systems.
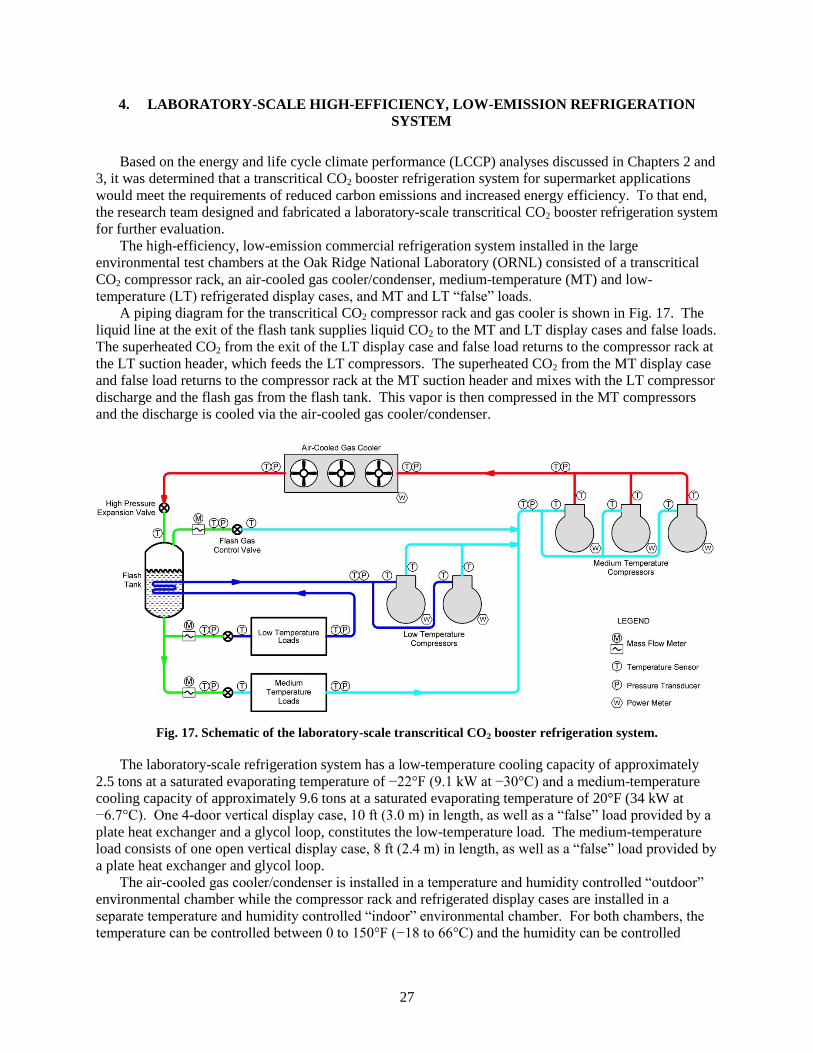
27
4. LABORATORY-SCALE HIGH-EFFICIENCY, LOW-EMISSION REFRIGERATION
SYSTEM
Based on the energy and life cycle climate performance (LCCP) analyses discussed in Chapters 2 and
3, it was determined that a transcritical CO2 booster refrigeration system for supermarket applications
would meet the requirements of reduced carbon emissions and increased energy efficiency. To that end,
the research team designed and fabricated a laboratory-scale transcritical CO2 booster refrigeration system
for further evaluation.
The high-efficiency, low-emission commercial refrigeration system installed in the large
environmental test chambers at the Oak Ridge National Laboratory (ORNL) consisted of a transcritical
CO2 compressor rack, an air-cooled gas cooler/condenser, medium-temperature (MT) and low-
temperature (LT) refrigerated display cases, and MT and LT “false” loads.
A piping diagram for the transcritical CO2 compressor rack and gas cooler is shown in Fig. 17. The
liquid line at the exit of the flash tank supplies liquid CO2 to the MT and LT display cases and false loads.
The superheated CO2 from the exit of the LT display case and false load returns to the compressor rack at
the LT suction header, which feeds the LT compressors. The superheated CO2 from the MT display case
and false load returns to the compressor rack at the MT suction header and mixes with the LT compressor
discharge and the flash gas from the flash tank. This vapor is then compressed in the MT compressors
and the discharge is cooled via the air-cooled gas cooler/condenser.
Fig. 17. Schematic of the laboratory-scale transcritical CO2 booster refrigeration system.
The laboratory-scale refrigeration system has a low-temperature cooling capacity of approximately
2.5 tons at a saturated evaporating temperature of −22°F (9.1 kW at −30°C) and a medium-temperature
cooling capacity of approximately 9.6 tons at a saturated evaporating temperature of 20°F (34 kW at
−6.7°C). One 4-door vertical display case, 10 ft (3.0 m) in length, as well as a “false” load provided by a
plate heat exchanger and a glycol loop, constitutes the low-temperature load. The medium-temperature
load consists of one open vertical display case, 8 ft (2.4 m) in length, as well as a “false” load provided by
a plate heat exchanger and glycol loop.
The air-cooled gas cooler/condenser is installed in a temperature and humidity controlled “outdoor”
environmental chamber while the compressor rack and refrigerated display cases are installed in a
separate temperature and humidity controlled “indoor” environmental chamber. For both chambers, the
temperature can be controlled between 0 to 150°F (−18 to 66°C) and the humidity can be controlled
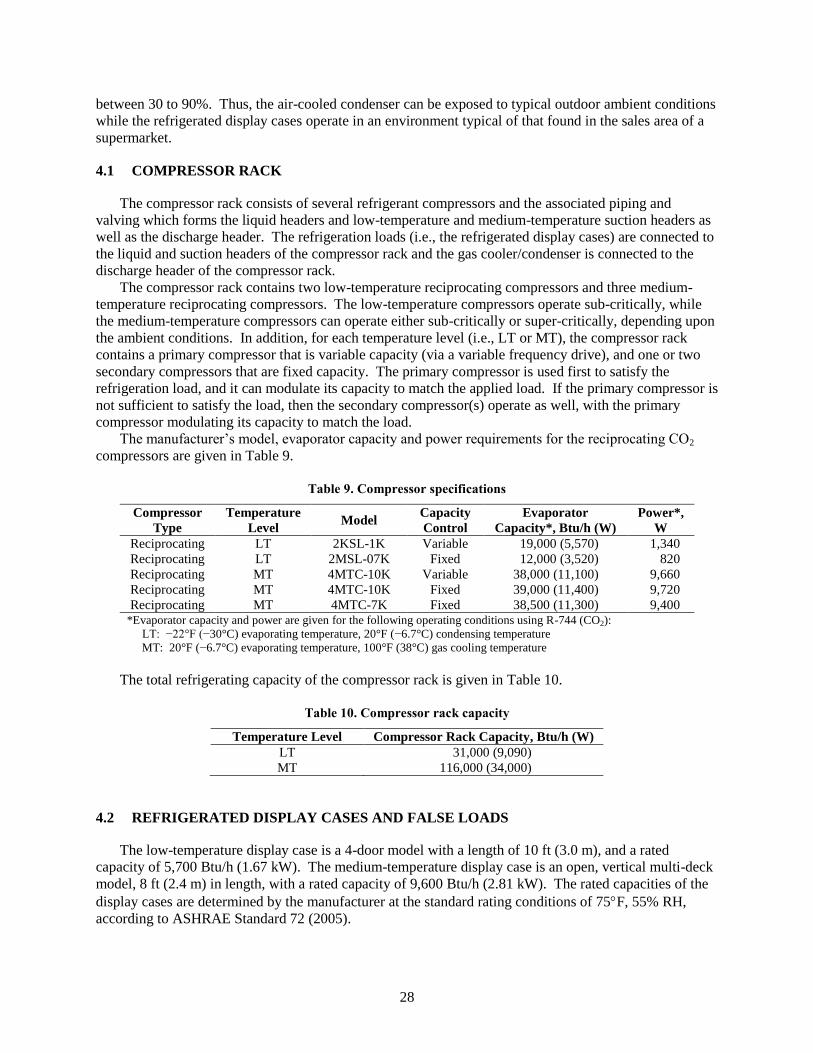
28
between 30 to 90%. Thus, the air-cooled condenser can be exposed to typical outdoor ambient conditions
while the refrigerated display cases operate in an environment typical of that found in the sales area of a
supermarket.
4.1 COMPRESSOR RACK
The compressor rack consists of several refrigerant compressors and the associated piping and
valving which forms the liquid headers and low-temperature and medium-temperature suction headers as
well as the discharge header. The refrigeration loads (i.e., the refrigerated display cases) are connected to
the liquid and suction headers of the compressor rack and the gas cooler/condenser is connected to the
discharge header of the compressor rack.
The compressor rack contains two low-temperature reciprocating compressors and three medium-
temperature reciprocating compressors. The low-temperature compressors operate sub-critically, while
the medium-temperature compressors can operate either sub-critically or super-critically, depending upon
the ambient conditions. In addition, for each temperature level (i.e., LT or MT), the compressor rack
contains a primary compressor that is variable capacity (via a variable frequency drive), and one or two
secondary compressors that are fixed capacity. The primary compressor is used first to satisfy the
refrigeration load, and it can modulate its capacity to match the applied load. If the primary compressor is
not sufficient to satisfy the load, then the secondary compressor(s) operate as well, with the primary
compressor modulating its capacity to match the load.
The manufacturer’s model, evaporator capacity and power requirements for the reciprocating CO2
compressors are given in Table 9.
Table 9. Compressor specifications
Compressor
Type
Temperature
Level Model
Capacity
Control
Evaporator
Capacity*, Btu/h (W)
Power*,
W
Reciprocating LT 2KSL-1K Variable 19,000 (5,570) 1,340
Reciprocating LT 2MSL-07K Fixed 12,000 (3,520) 820
Reciprocating MT 4MTC-10K Variable 38,000 (11,100) 9,660
Reciprocating MT 4MTC-10K Fixed 39,000 (11,400) 9,720
Reciprocating MT 4MTC-7K Fixed 38,500 (11,300) 9,400 *Evaporator capacity and power are given for the following operating conditions using R-744 (CO2):
LT: −22°F (−30°C) evaporating temperature, 20°F (−6.7°C) condensing temperature
MT: 20°F (−6.7°C) evaporating temperature, 100°F (38°C) gas cooling temperature
The total refrigerating capacity of the compressor rack is given in Table 10.
Table 10. Compressor rack capacity
Temperature Level Compressor Rack Capacity, Btu/h (W)
LT 31,000 (9,090)
MT 116,000 (34,000)
4.2 REFRIGERATED DISPLAY CASES AND FALSE LOADS
The low-temperature display case is a 4-door model with a length of 10 ft (3.0 m), and a rated
capacity of 5,700 Btu/h (1.67 kW). The medium-temperature display case is an open, vertical multi-deck
model, 8 ft (2.4 m) in length, with a rated capacity of 9,600 Btu/h (2.81 kW). The rated capacities of the
display cases are determined by the manufacturer at the standard rating conditions of 75F, 55% RH,
according to ASHRAE Standard 72 (2005).
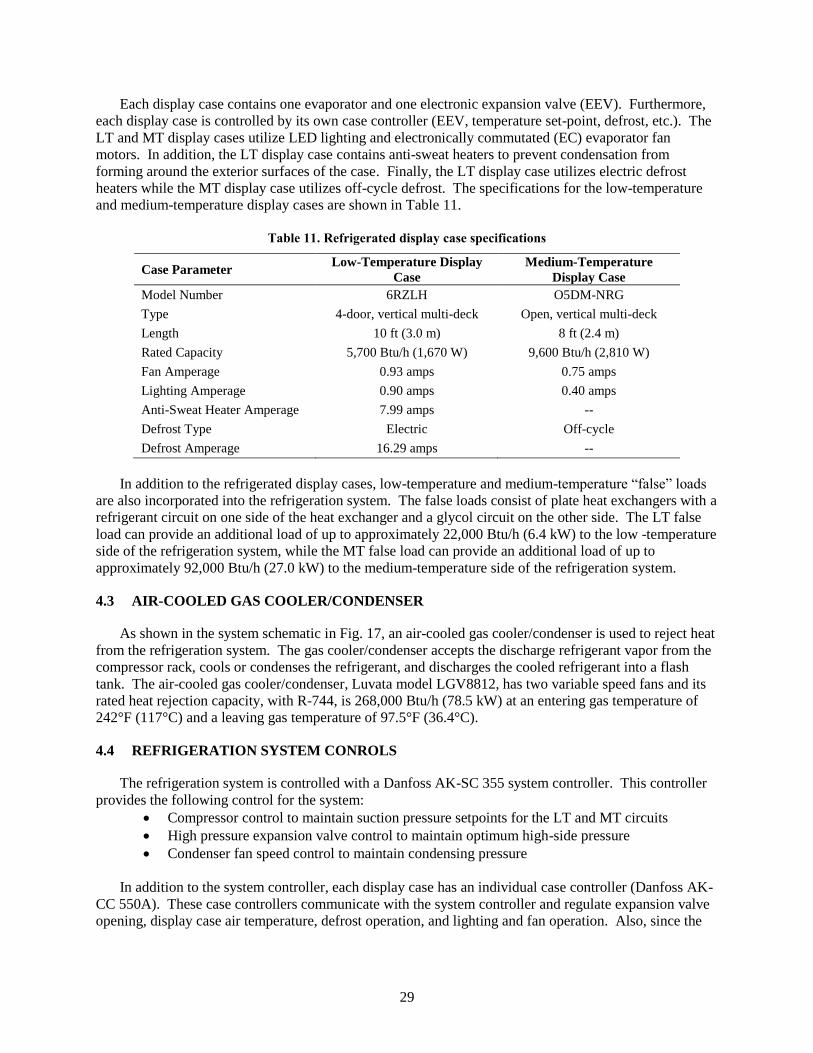
29
Each display case contains one evaporator and one electronic expansion valve (EEV). Furthermore,
each display case is controlled by its own case controller (EEV, temperature set-point, defrost, etc.). The
LT and MT display cases utilize LED lighting and electronically commutated (EC) evaporator fan
motors. In addition, the LT display case contains anti-sweat heaters to prevent condensation from
forming around the exterior surfaces of the case. Finally, the LT display case utilizes electric defrost
heaters while the MT display case utilizes off-cycle defrost. The specifications for the low-temperature
and medium-temperature display cases are shown in Table 11.
Table 11. Refrigerated display case specifications
Case Parameter Low-Temperature Display
Case
Medium-Temperature
Display Case
Model Number 6RZLH O5DM-NRG
Type 4-door, vertical multi-deck Open, vertical multi-deck
Length 10 ft (3.0 m) 8 ft (2.4 m)
Rated Capacity 5,700 Btu/h (1,670 W) 9,600 Btu/h (2,810 W)
Fan Amperage 0.93 amps 0.75 amps
Lighting Amperage 0.90 amps 0.40 amps
Anti-Sweat Heater Amperage 7.99 amps --
Defrost Type Electric Off-cycle
Defrost Amperage 16.29 amps --
In addition to the refrigerated display cases, low-temperature and medium-temperature “false” loads
are also incorporated into the refrigeration system. The false loads consist of plate heat exchangers with a
refrigerant circuit on one side of the heat exchanger and a glycol circuit on the other side. The LT false
load can provide an additional load of up to approximately 22,000 Btu/h (6.4 kW) to the low -temperature
side of the refrigeration system, while the MT false load can provide an additional load of up to
approximately 92,000 Btu/h (27.0 kW) to the medium-temperature side of the refrigeration system.
4.3 AIR-COOLED GAS COOLER/CONDENSER
As shown in the system schematic in Fig. 17, an air-cooled gas cooler/condenser is used to reject heat
from the refrigeration system. The gas cooler/condenser accepts the discharge refrigerant vapor from the
compressor rack, cools or condenses the refrigerant, and discharges the cooled refrigerant into a flash
tank. The air-cooled gas cooler/condenser, Luvata model LGV8812, has two variable speed fans and its
rated heat rejection capacity, with R-744, is 268,000 Btu/h (78.5 kW) at an entering gas temperature of
242°F (117°C) and a leaving gas temperature of 97.5°F (36.4°C).
4.4 REFRIGERATION SYSTEM CONROLS
The refrigeration system is controlled with a Danfoss AK-SC 355 system controller. This controller
provides the following control for the system:
Compressor control to maintain suction pressure setpoints for the LT and MT circuits
High pressure expansion valve control to maintain optimum high-side pressure
Condenser fan speed control to maintain condensing pressure
In addition to the system controller, each display case has an individual case controller (Danfoss AK-
CC 550A). These case controllers communicate with the system controller and regulate expansion valve
opening, display case air temperature, defrost operation, and lighting and fan operation. Also, since the
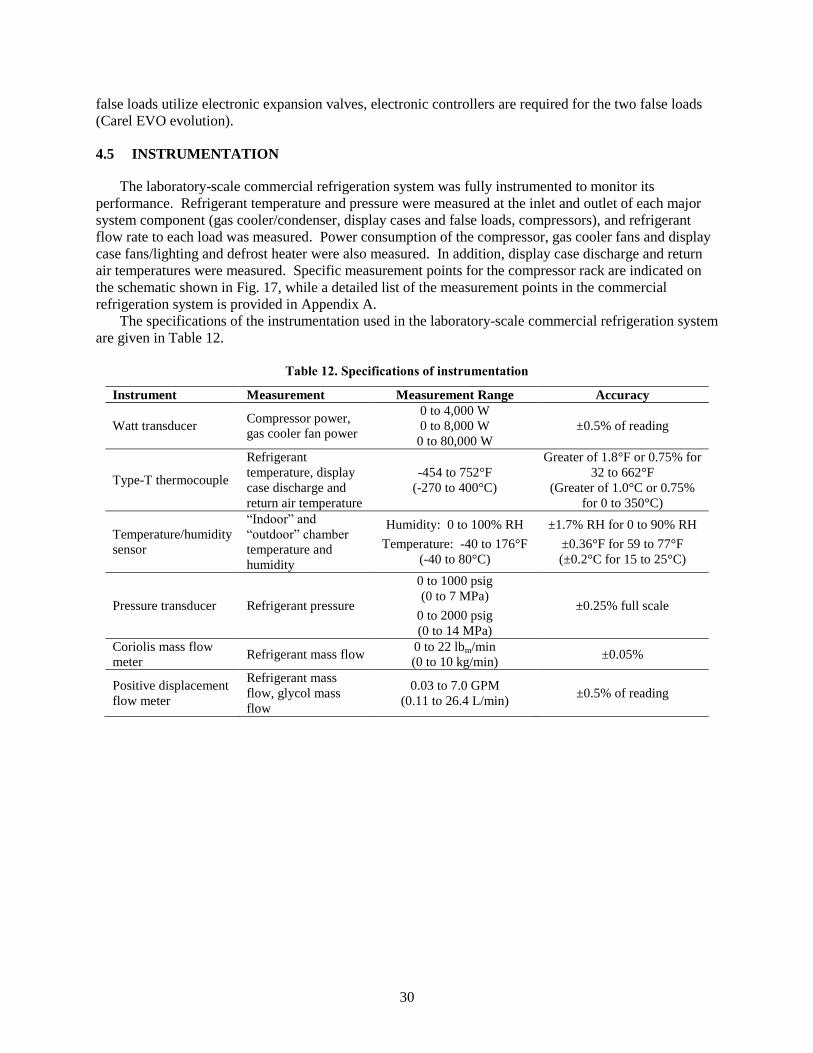
30
false loads utilize electronic expansion valves, electronic controllers are required for the two false loads
(Carel EVO evolution).
4.5 INSTRUMENTATION
The laboratory-scale commercial refrigeration system was fully instrumented to monitor its
performance. Refrigerant temperature and pressure were measured at the inlet and outlet of each major
system component (gas cooler/condenser, display cases and false loads, compressors), and refrigerant
flow rate to each load was measured. Power consumption of the compressor, gas cooler fans and display
case fans/lighting and defrost heater were also measured. In addition, display case discharge and return
air temperatures were measured. Specific measurement points for the compressor rack are indicated on
the schematic shown in Fig. 17, while a detailed list of the measurement points in the commercial
refrigeration system is provided in Appendix A.
The specifications of the instrumentation used in the laboratory-scale commercial refrigeration system
are given in Table 12.
Table 12. Specifications of instrumentation
Instrument Measurement Measurement Range Accuracy
Watt transducer Compressor power,
gas cooler fan power
0 to 4,000 W
0 to 8,000 W
0 to 80,000 W
±0.5% of reading
Type-T thermocouple
Refrigerant
temperature, display
case discharge and
return air temperature
-454 to 752°F
(-270 to 400°C)
Greater of 1.8°F or 0.75% for
32 to 662°F
(Greater of 1.0°C or 0.75%
for 0 to 350°C)
Temperature/humidity
sensor
“Indoor” and
“outdoor” chamber
temperature and
humidity
Humidity: 0 to 100% RH
Temperature: -40 to 176°F
(-40 to 80°C)
±1.7% RH for 0 to 90% RH
±0.36°F for 59 to 77°F
(±0.2°C for 15 to 25°C)
Pressure transducer Refrigerant pressure
0 to 1000 psig
(0 to 7 MPa)
0 to 2000 psig
(0 to 14 MPa)
±0.25% full scale
Coriolis mass flow
meter Refrigerant mass flow
0 to 22 lbm/min
(0 to 10 kg/min) ±0.05%
Positive displacement
flow meter
Refrigerant mass
flow, glycol mass
flow
0.03 to 7.0 GPM
(0.11 to 26.4 L/min) ±0.5% of reading
31
5. EVALUATION OF HIGH EFFICIENCY, LOW EMISSION REFRIGERATION SYSTEM
The performance of the transcritical CO2 booster refrigeration system was determined at four ambient
temperature conditions, nominally 60°F (16°C), 70°F (21°C), 80°F (27°C) and 90°F (32°C). After the
refrigeration system achieved steady-state operation at each of the four ambient temperature conditions,
system performance data was collected for a 24-hour period, with a sampling rate of 1 second.
Subsequently, 30-second averaged data was used for the calculation of thermodynamic properties and
performance metrics.
The collected performance data was analyzed to determine the following average performance
parameters for the 24-hour hour test periods:
Average LT Suction Header Pressure (psig)
Average LT Suction Header Temperature (°F)
Average LT Suction Header Superheat (°F)
Average MT Suction Header Pressure (psig)
Average MT Suction Header Temperature (°F)
Average MT Suction Header Superheat (°F)
Average LT Load Superheat (°F)
Average MT Load Superheat (°F)
Average LT Load (Btu/h)
Average MT Load (Btu/h)
Average Compressor Power (W)
Average COP
Average LT Refrigerant Mass Flow (lb/min)
Average MT Refrigerant Mass Flow (lb/min)
Average Gas Cooler Inlet Temperature (°F)
Average Gas Cooler Outlet Temperature (°F)
Average Gas Cooler Inlet Air Temperature (°F)
Average Gas Cooler Outlet Air Temperature (°F)
Average Heat Rejection (Btu/h)
A summary of the performance of the transcritical CO2 booster refrigeration system is presented in
the following sections.
5.1 LABORATORY PERFORMANCE DATA
The average medium-temperature and low-temperature refrigeration loads for the transcritical CO2
refrigeration system, as a function of outdoor ambient temperature, are shown in Fig. 18. Each
refrigeration load data point shown in Fig. 18 represents the sum of the either the LT or MT display case
load and the false load. For each display case and false load, the refrigeration load was determined from
the inlet and outlet enthalpies and refrigerant mass flow rate through the load as follows:
�̇�𝑖 = �̇�𝑖(ℎ𝑖,𝑜𝑢𝑡 − ℎ𝑖,𝑖𝑛) (7)
where �̇�𝑖 is the average refrigeration load of load i, �̇�𝑖 is the average refrigerant mass flow rate through
load i, ℎ𝑖,𝑜𝑢𝑡 is the average enthalpy of the refrigerant exiting load i, and ℎ𝑖,𝑖𝑛 is the average enthalpy of
the refrigerant entering load i. The enthalpies of the refrigerant were determined from the NIST
Reference Fluid Thermodynamic and Transport Properties Database (REFPROP) Version 9.1 (Lemmon,
McLinden, and Huber 2013), using the measured refrigerant pressures and temperatures at the
corresponding locations. Note that for the refrigerated display cases, the average values of the
thermodynamic properties and refrigerant mass flow exclude those periods during which the display cases
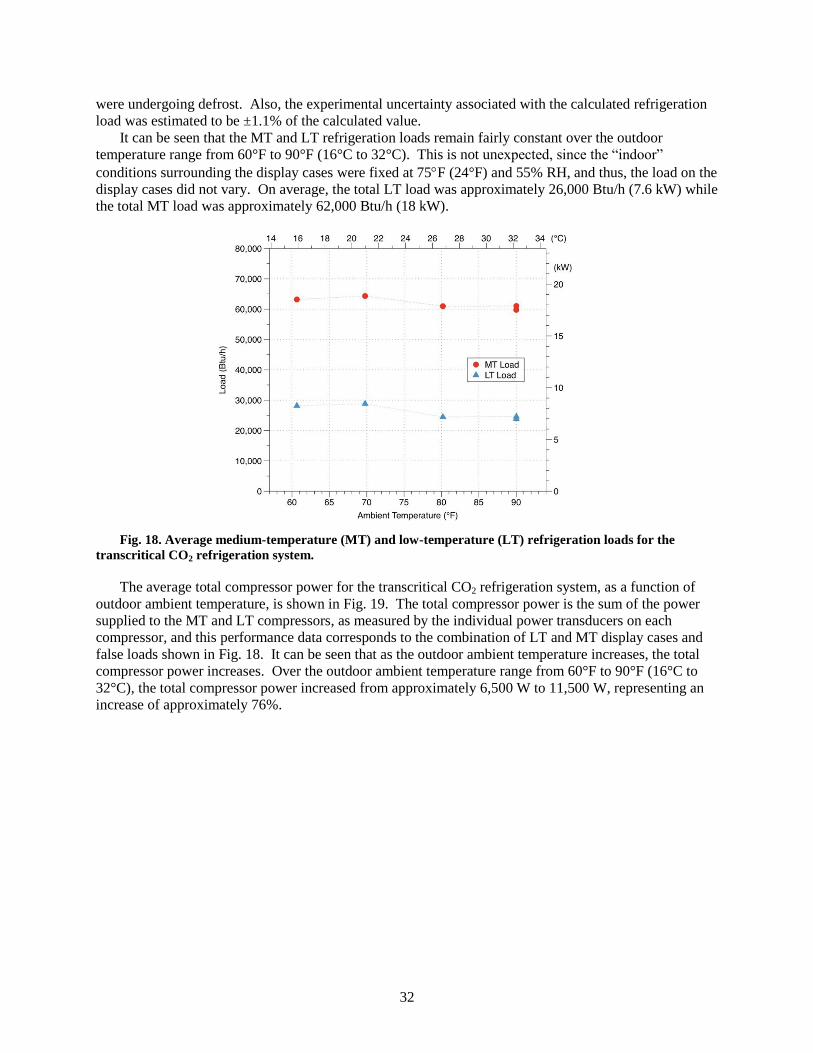
32
were undergoing defrost. Also, the experimental uncertainty associated with the calculated refrigeration
load was estimated to be ±1.1% of the calculated value.
It can be seen that the MT and LT refrigeration loads remain fairly constant over the outdoor
temperature range from 60°F to 90°F (16°C to 32°C). This is not unexpected, since the “indoor”
conditions surrounding the display cases were fixed at 75F (24°F) and 55% RH, and thus, the load on the
display cases did not vary. On average, the total LT load was approximately 26,000 Btu/h (7.6 kW) while
the total MT load was approximately 62,000 Btu/h (18 kW).
Fig. 18. Average medium-temperature (MT) and low-temperature (LT) refrigeration loads for the
transcritical CO2 refrigeration system.
The average total compressor power for the transcritical CO2 refrigeration system, as a function of
outdoor ambient temperature, is shown in Fig. 19. The total compressor power is the sum of the power
supplied to the MT and LT compressors, as measured by the individual power transducers on each
compressor, and this performance data corresponds to the combination of LT and MT display cases and
false loads shown in Fig. 18. It can be seen that as the outdoor ambient temperature increases, the total
compressor power increases. Over the outdoor ambient temperature range from 60°F to 90°F (16°C to
32°C), the total compressor power increased from approximately 6,500 W to 11,500 W, representing an
increase of approximately 76%.
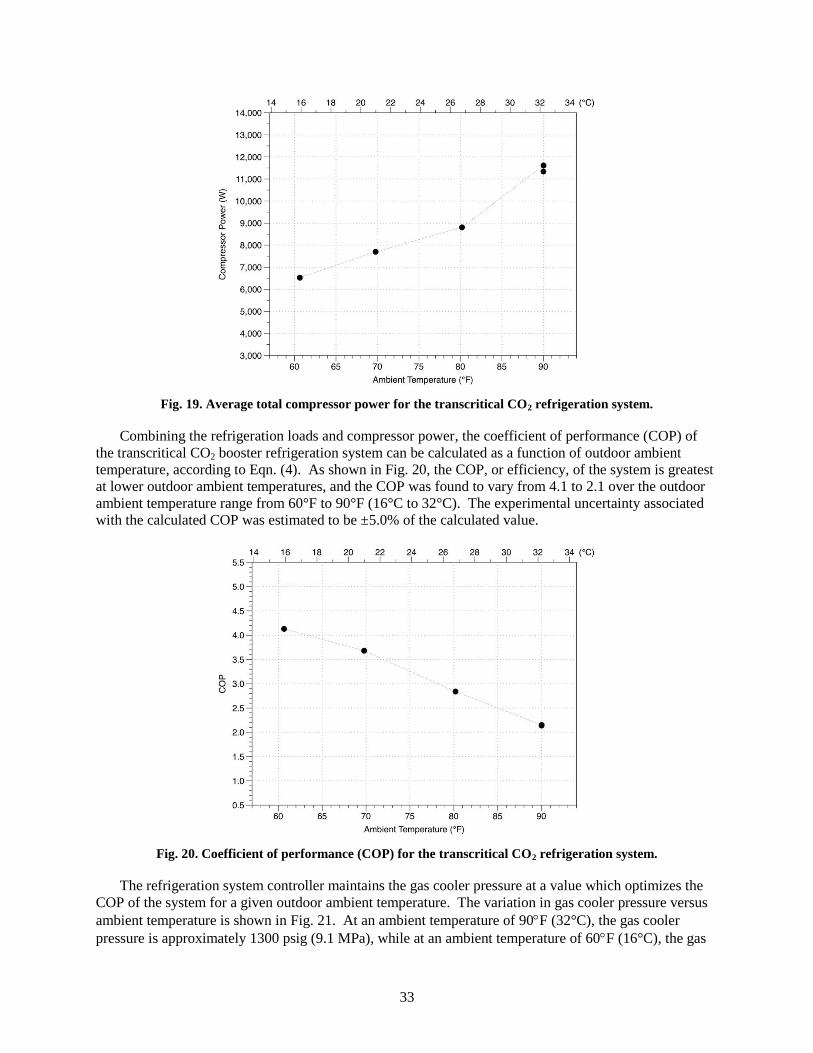
33
Fig. 19. Average total compressor power for the transcritical CO2 refrigeration system.
Combining the refrigeration loads and compressor power, the coefficient of performance (COP) of
the transcritical CO2 booster refrigeration system can be calculated as a function of outdoor ambient
temperature, according to Eqn. (4). As shown in Fig. 20, the COP, or efficiency, of the system is greatest
at lower outdoor ambient temperatures, and the COP was found to vary from 4.1 to 2.1 over the outdoor
ambient temperature range from 60°F to 90°F (16°C to 32°C). The experimental uncertainty associated
with the calculated COP was estimated to be ±5.0% of the calculated value.
Fig. 20. Coefficient of performance (COP) for the transcritical CO2 refrigeration system.
The refrigeration system controller maintains the gas cooler pressure at a value which optimizes the
COP of the system for a given outdoor ambient temperature. The variation in gas cooler pressure versus
ambient temperature is shown in Fig. 21. At an ambient temperature of 90F (32°C), the gas cooler
pressure is approximately 1300 psig (9.1 MPa), while at an ambient temperature of 60F (16°C), the gas
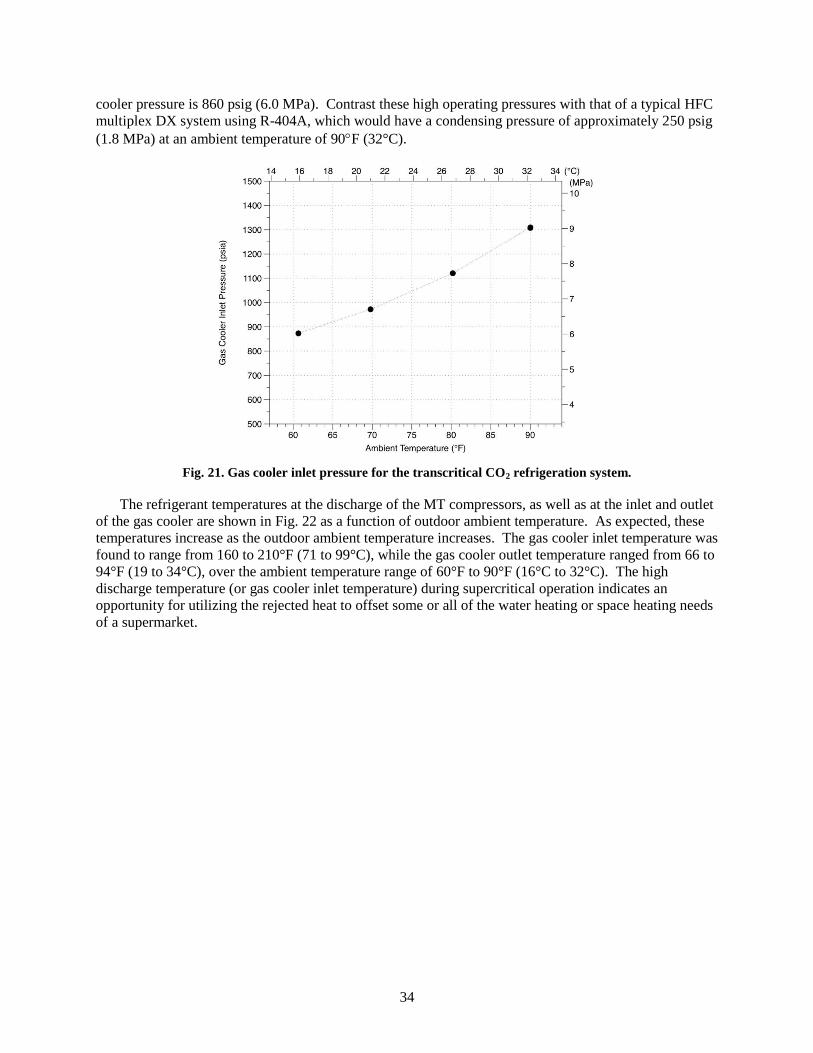
34
cooler pressure is 860 psig (6.0 MPa). Contrast these high operating pressures with that of a typical HFC
multiplex DX system using R-404A, which would have a condensing pressure of approximately 250 psig
(1.8 MPa) at an ambient temperature of 90F (32°C).
Fig. 21. Gas cooler inlet pressure for the transcritical CO2 refrigeration system.
The refrigerant temperatures at the discharge of the MT compressors, as well as at the inlet and outlet
of the gas cooler are shown in Fig. 22 as a function of outdoor ambient temperature. As expected, these
temperatures increase as the outdoor ambient temperature increases. The gas cooler inlet temperature was
found to range from 160 to 210°F (71 to 99°C), while the gas cooler outlet temperature ranged from 66 to
94°F (19 to 34°C), over the ambient temperature range of 60°F to 90°F (16°C to 32°C). The high
discharge temperature (or gas cooler inlet temperature) during supercritical operation indicates an
opportunity for utilizing the rejected heat to offset some or all of the water heating or space heating needs
of a supermarket.
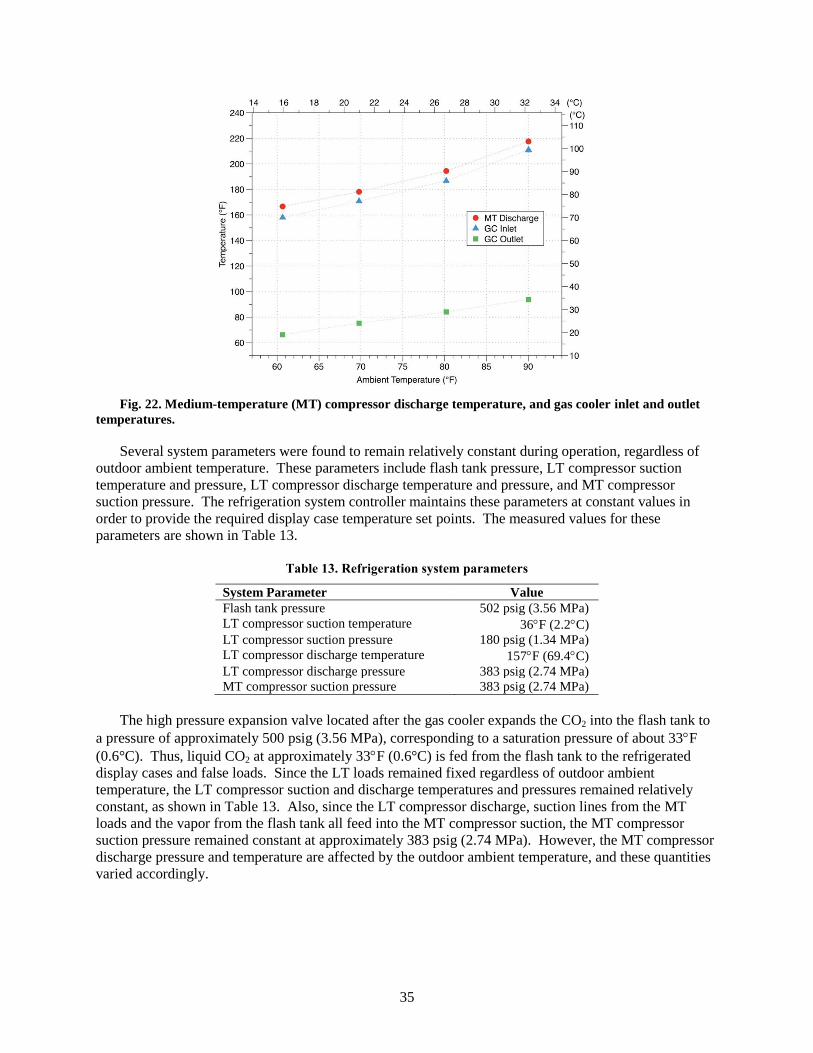
35
Fig. 22. Medium-temperature (MT) compressor discharge temperature, and gas cooler inlet and outlet
temperatures.
Several system parameters were found to remain relatively constant during operation, regardless of
outdoor ambient temperature. These parameters include flash tank pressure, LT compressor suction
temperature and pressure, LT compressor discharge temperature and pressure, and MT compressor
suction pressure. The refrigeration system controller maintains these parameters at constant values in
order to provide the required display case temperature set points. The measured values for these
parameters are shown in Table 13.
Table 13. Refrigeration system parameters
System Parameter Value
Flash tank pressure 502 psig (3.56 MPa)
LT compressor suction temperature 36F (2.2C)
LT compressor suction pressure 180 psig (1.34 MPa)
LT compressor discharge temperature 157F (69.4C)
LT compressor discharge pressure 383 psig (2.74 MPa)
MT compressor suction pressure 383 psig (2.74 MPa)
The high pressure expansion valve located after the gas cooler expands the CO2 into the flash tank to
a pressure of approximately 500 psig (3.56 MPa), corresponding to a saturation pressure of about 33F
(0.6°C). Thus, liquid CO2 at approximately 33F (0.6°C) is fed from the flash tank to the refrigerated
display cases and false loads. Since the LT loads remained fixed regardless of outdoor ambient
temperature, the LT compressor suction and discharge temperatures and pressures remained relatively
constant, as shown in Table 13. Also, since the LT compressor discharge, suction lines from the MT
loads and the vapor from the flash tank all feed into the MT compressor suction, the MT compressor
suction pressure remained constant at approximately 383 psig (2.74 MPa). However, the MT compressor
discharge pressure and temperature are affected by the outdoor ambient temperature, and these quantities
varied accordingly.
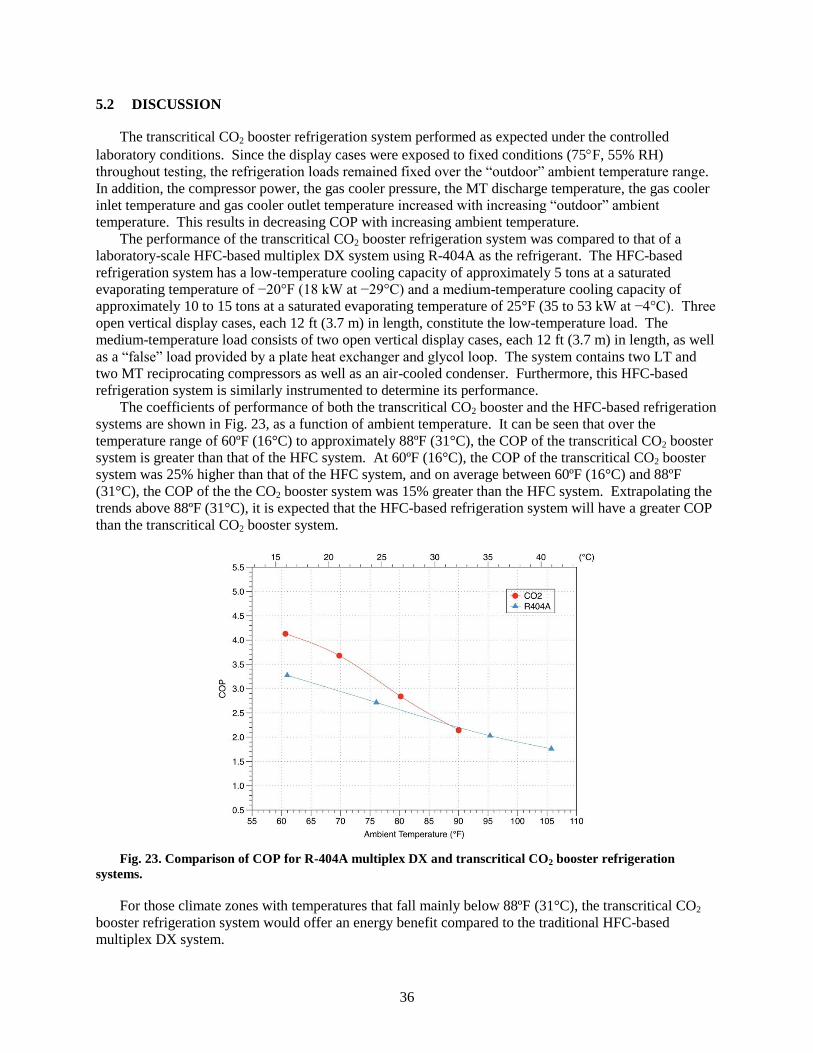
36
5.2 DISCUSSION
The transcritical CO2 booster refrigeration system performed as expected under the controlled
laboratory conditions. Since the display cases were exposed to fixed conditions (75F, 55% RH)
throughout testing, the refrigeration loads remained fixed over the “outdoor” ambient temperature range.
In addition, the compressor power, the gas cooler pressure, the MT discharge temperature, the gas cooler
inlet temperature and gas cooler outlet temperature increased with increasing “outdoor” ambient
temperature. This results in decreasing COP with increasing ambient temperature.
The performance of the transcritical CO2 booster refrigeration system was compared to that of a
laboratory-scale HFC-based multiplex DX system using R-404A as the refrigerant. The HFC-based
refrigeration system has a low-temperature cooling capacity of approximately 5 tons at a saturated
evaporating temperature of −20°F (18 kW at −29°C) and a medium-temperature cooling capacity of
approximately 10 to 15 tons at a saturated evaporating temperature of 25°F (35 to 53 kW at −4°C). Three
open vertical display cases, each 12 ft (3.7 m) in length, constitute the low-temperature load. The
medium-temperature load consists of two open vertical display cases, each 12 ft (3.7 m) in length, as well
as a “false” load provided by a plate heat exchanger and glycol loop. The system contains two LT and
two MT reciprocating compressors as well as an air-cooled condenser. Furthermore, this HFC-based
refrigeration system is similarly instrumented to determine its performance.
The coefficients of performance of both the transcritical CO2 booster and the HFC-based refrigeration
systems are shown in Fig. 23, as a function of ambient temperature. It can be seen that over the
temperature range of 60ºF (16°C) to approximately 88ºF (31°C), the COP of the transcritical CO2 booster
system is greater than that of the HFC system. At 60ºF (16°C), the COP of the transcritical CO2 booster
system was 25% higher than that of the HFC system, and on average between 60ºF (16°C) and 88ºF
(31°C), the COP of the the CO2 booster system was 15% greater than the HFC system. Extrapolating the
trends above 88ºF (31°C), it is expected that the HFC-based refrigeration system will have a greater COP
than the transcritical CO2 booster system.
Fig. 23. Comparison of COP for R-404A multiplex DX and transcritical CO2 booster refrigeration
systems.
For those climate zones with temperatures that fall mainly below 88ºF (31°C), the transcritical CO2
booster refrigeration system would offer an energy benefit compared to the traditional HFC-based
multiplex DX system.
37
6. FUTURE WORK
Future efforts related to this project include completing a field evaluation of the transcritical CO2
booster refrigeration system in a third-party supermarket, as well as performing system modifications to
enhance the efficiency of the CO2 refrigeration system, particularly in warm climates.
6.1 FIELD EVALUATION
Due to concerns related to ozone depletion and global climate change, refrigerants such as R-22 and
R-404A, which are commonly used in commercial refrigeration systems, have been, or may potentially
be, phased out due to their detrimental environmental effects. As noted previously, a transcritical carbon
dioxide booster refrigeration system has been designed and developed for commercial refrigeration
applications, which uses CO2 as the sole refrigerant. CO2 has a very low global warming potential
(GWP = 1), and thus the environmental impact of this system is estimated to be over 75% less than that of
a traditional multiplex direct expansion system utilizing R-404A. The main objective of this field
evaluation is to determine the energy consumption of a transcritical CO2 commercial refrigeration system
in an actual, operating supermarket, thereby providing motivation to supermarket owners and operators to
implement these low emission refrigeration systems.
6.1.1 General Plan
With the assistance of CRADA partner, Hillphoenix, a suitable supermarket will be identified for
installation of a transcritical CO2 refrigeration system. Details of the refrigeration system to be installed
will be collected, such as:
Basic system layout
MT and LT compressor specifications (capacity, power, quantity)
Gas cooler/condenser specifications (capacity, fan power, quantity)
Connected loads: display case and walk-in specifications (capacity, power, length/size)
System control strategy (pressure and temperature setpoints, gas cooler/evaporator pressures, etc.)
The measured performance of the transcritical CO2 booster refrigeration system will be compared to
that of a similarly configured HFC-based multiplex DX system. The performance of the multiplex DX
refrigeration system will either be measured directly using a system operating in a similar location as the
CO2 system or be determined with a calibrated energy model. The comparison of system performance
between the baseline refrigeration system and the transcritical CO2 refrigeration system will be
normalized to ambient conditions, operating conditions, and normalized to system capacity. Other
operating parameters such as suction and discharge pressures, refrigeration-side and case temperatures,
refrigerant level and system parameters setpoints will be compared.
It is anticipated that the performance of the refrigeration system will be determined for a period of no
less than six months, with an effort to ensure that the system performance data is collected for both a cold
and warm season.
6.1.2 Data Acquisition
The state of the existing data acquisition system connected to the refrigeration system, which could be
accessed through the refrigeration system controller, will be assessed to determine the following:
Type of quantities measured
Location and number of quantities measured
Frequency of measurements
Suitability of measured quantities to assess effect of refrigerant retrofit
38
It will be assumed that at a minimum, the following quantities should be measured to ensure that
meaningful comparisons can be made between the baseline system and the CO2 system:
Compressor and gas cooler/condenser fan power
Gas cooler/condenser pressure and temperature
MT (medium-temperature) suction pressure and temperature
LT (low-temperature) suction pressure and temperature
Display case discharge air temperatures
MT and LT liquid flow rate
Outdoor ambient temperature and relative humidity
Store indoor temperature and relative humidity
Instrumentation and data acquisition equipment will be added to the refrigeration system for those
quantities which are not sufficiently measured or recorded by the refrigeration system controller.
6.1.3 Field Evaluation Report
A detailed final report will be written to describe the results of the field evaluation of the transcritical
CO2 refrigeration system. This report will include the following:
High Level Objectives
Description of Test System
o Clear description of the new refrigeration technology
o Clear description of the benchmark. Whenever possible, this baseline system should use
reasonable-cost and up-to-date refrigeration technologies and fluids
Performance
o Overall assumptions that should include operating conditions.
o Identification of sources of differences using both theoretical and well documented field
measurement based arguments
o Energy measurements including both annualized energy and peak summer energy
consumption, and a “bin-hour” ambient temperature graph for typical year for the
location of the test store
o Inclusion of any reliability considerations
Economics
o Main assumptions that could affect return-on-investment (ROI)
o Realistic maintenance costs
Conclusions
6.1.4 Progress-to-Date
Hillphoenix and ORNL have negotiated the site selection and logistics for the field evaluation of the
transcritical CO2 booster refrigeration system with two major food retailers. Installations are planned for
the Summer and Fall of 2016, with results to be published in 2017.
6.2 SYSTEM MODIFICATIONS
At high ambient temperatures, the efficiency of the transcritical CO2 booster refrigeration system is
low, compared to the traditional HFC-based multiplex DX system. To increase the efficiency of the CO2
refrigeration system, particularly in warm climates, a number of modifications can be made to the
laboratory-scale system described in Chapter 4. These modifications include the use of ejectors, parallel
compression, adiabatic gas cooling and mechanical subcooling.
39
6.2.1 Ejectors
Carbon dioxide vapor compression refrigeration systems have a much larger pressure difference
between the high- and low-pressure sides of the system than other refrigerant systems. An ejector can
recover the large pressure drop to drive mass flow from the evaporator, and thus elevate the suction
pressure entering the compressor. The pressure ratio across the compressor is reduced, leading to
increased compressor efficiency. In addition, an ejector, in place of a conventional throttling device,
recovers useful momentum during the expansion process, leading to higher system efficiency.
6.2.2 Parallel Compression
In the transcritical CO2 booster refrigeration system, the CO2 exiting the gas cooler is expanded
through a high-pressure expansion valve to a flash tank at an intermediate pressure. This intermediate
pressure is greater than that required for the MT and LT loads, and thus, the CO2 must be further
expanded at the MT and LT loads. In the laboratory scale CO2 refrigeration system evaluated in this
study, the flash gas which subsequently exits the flash tank is further expanded to the suction pressure of
the MT loads. The expanded flash gas mixes with the suction gas from the MT loads and the discharge of
the LT compressors to be compressed to the high pressure in the gas cooler. The technique of separately
compressing the flash gas and the MT suction gas, known as parallel compression, can be used to increase
system efficiency. Separate compressors are used to compress the flash gas directly from the flash tank to
the high pressure in the gas cooler. Rather than expanding and then compressing the flash gas, it is
compressed directly, and since the pressure ratio associated with compressing the flash gas directly is
lower than that associated with compressing expanded flash gas, overall compressor energy use is be
decreased.
6.2.3 Adiabatic Gas Cooler
The transcritical CO2 booster refrigeration system operates most efficiently when the CO2 remains
subcritical. During warm ambient conditions, the CO2 refrigeration system will operate supercritically,
and its efficiency will be degraded. The use of an adiabatic gas cooler can extend the transition from
subcritical to supercritical operation by keeping the temperature and pressure of the CO2 below the
critical point at higher ambient temperatures as compared to a simple air-cooled gas cooler, and thereby
increase system efficiency. In an air-cooled gas cooler, the temperature of the CO2 at the outlet of the gas
cooler approaches the dry-bulb ambient temperature. On the other hand, in an adiabatic gas cooler, the
temperature of the CO2 at the exit of the gas cooler approaches the ambient wet-bulb temperature, which
in warm dry climates, is significantly lower than that of the dry-bulb temperature. This effect is achieved
by passing the ambient air first through a media saturated with moisture, which cools the ambient air, and
then passing the cooled air over the coils of the gas cooler. Thus, the CO2 exiting the adiabatic gas cooler
is lower than it would be if it had passed through an air-cooled gas cooler.
6.2.4 Mechanical Subcooler
A subcooler is a separate, smaller refrigeration cycle that is used to reduce the temperature of the CO2
exiting the gas cooler o below the ambient temperature, without affecting the discharge pressure. This
may be achieved with another vapor compression cycle, a thermoelectric cooler, or other means. As a
result, less flash gas is produced by the high-pressure expansion valve, and an increased refrigerating
effect is created in the evaporator. The subcooling device typically can be operated at a much smaller
temperature differential than that at which the refrigeration cycle is operating, so the efficiency of the
subcooler itself may be comparably very high. The resulting lower compressor energy consumption, due
to the reduced amount of flash gas and increased refrigerating effect, increases the overall cycle
efficiency.
40
6.3 SUMMARY
A field investigation of the transcritical CO2 booster refrigeration system is planned, in which a
system will be installed in an actual, operating supermarket. A field testing plan has been developed with
the CRADA partner, with the main objective to determine the energy consumption of a transcritical CO2
commercial refrigeration system in an actual, operating supermarket. It is hoped that the results of this
field evaluation will provide the motivation for supermarket owners and operators to deploy these low
emission refrigeration systems in their stores.
Future work will also include modification of the basic transcritical CO2 booster refrigeration system
to enhance its performance, particularly in warm climates. These modifications include the use of
ejectors, parallel compression, adiabatic gas cooling and mechanical subcooling.
41
7. CONCLUSIONS
The objective of the Cooperative Research and Development Agreement (CRADA) between Oak
Ridge National Laboratory (ORNL) and Hillphoenix, Inc., as described in this report, was to conduct
research and development on a supermarket refrigeration system that reduces greenhouse gas emissions
and has 25 to 30 percent lower energy consumption than existing systems.
Initially, energy and life cycle climate performance (LCCP) analyses were performed on a variety of
supermarket refrigeration systems to identify those designs and refrigerant selections which exhibit both
low environmental impact and high energy efficiency. The whole-building energy modeling tool,
EnergyPlus, was used to model traditional multiplex direct expansion (DX) system, cascade systems with
secondary loops and the transcritical CO2 system in a variety of climate zones across the United States.
Furthermore, a variety of refrigerants were investigated, including R-32, R-134a, R-404A, R-1234yf, R-
717, and R-744. LCCP analysis was used to determine the direct and indirect carbon dioxide emissions
resulting from the operation of the various refrigeration systems over their lifetimes. This analysis
showed that a transcritical CO2 booster refrigeration system, coupled with high-efficiency display cases
and walk-ins, can achieve average energy reductions of 39% compared to the standard-efficiency R-404A
multiplex DX system, with 76% lower emissions and hence is a potential low emission, high-efficiency
alternative to the current baseline R-404A multiplex DX systems in use.
In order to optimize the operating parameters of CO2-based refrigeration systems, further analysis
was presented of various CO2 transcritical and cascade/secondary loop refrigeration systems for
supermarket applications. In addition, the performance of selected CO2-based refrigeration systems is
compared to the baseline R-404A multiplex direct expansion system using bin analyses in the eight
climate zones of the United States. It was found that the transcritical CO2 booster system (TBS-BC)
performs as well as, or better than, the baseline R-404A multiplex DX system for all eight climate zones
in the U.S. In the warm climate zones (Zones 1 and 2), the annual performance of the TBS-BC and
multiplex DX systems are nearly identical. In the colder climates (Zones 6, 7 and 8), the annual average
COP of the TBS-BC is approximately 40% greater than that of the R-404A multiplex DX system.
Implementation of transcritical booster systems or cascade/secondary loop systems using optimized
operating conditions will lead to reduced direct greenhouse gas emissions while achieving comparable
energy consumption as compared to current HFC-based multiplex DX systems.
Based on the energy and life cycle climate performance (LCCP) analyses, it was determined that a
transcritical CO2 booster refrigeration system for supermarket applications would meet the requirements
of reduced carbon emissions and increased energy efficiency. To that end, the research team evaluated a
laboratory-scale transcritical CO2 booster refrigeration system to be evaluated in ORNL’s environmental
chambers. The high-efficiency, low-emission commercial refrigeration system consists of a transcritical
CO2 compressor rack, an air-cooled gas cooler/condenser, medium-temperature (MT) and low-
temperature (LT) refrigerated display cases, and MT and LT “false” loads. The laboratory-scale
refrigeration system has a low-temperature cooling capacity of approximately 2.5 tons at a saturated
evaporating temperature of −22°F (9.1 kW at −30°C) and a medium-temperature cooling capacity of
approximately 9.6 tons at a saturated evaporating temperature of 20°F (34 kW at −6.7°C). One 4-door
vertical display case, 10 ft (3.0 m) in length, as well as a “false” load provided by a plate heat exchanger
and a glycol loop, constitutes the low-temperature load. The medium-temperature load consists of one
open vertical display case, 8 ft (2.4 m) in length, as well as a “false” load provided by a plate heat
exchanger and glycol loop. The laboratory-scale commercial refrigeration system was fully instrumented
to monitor its performance. Refrigerant temperature and pressure were measured at the inlet and outlet of
each major system component (gas cooler/condenser, display cases and false loads, compressors), and
refrigerant flow rate to each load was measured. Power consumption of the compressor, gas cooler fans
and display case fans/lighting and defrost heater were also measured. In addition, display case discharge
and return air temperatures were measured.
42
The performance of the transcritical CO2 booster refrigeration system was determined at four outdoor
ambient temperature conditions, nominally 60°F (16°C), 70°F (21°C), 80°F (27°C) and 90°F (32°C).
After the refrigeration system achieved steady-state operation at each of the four outdoor ambient
temperature conditions, system performance data was collected for a 24-hour period. Over the outdoor
ambient temperature range from 60°F to 90°F (16°C to 32°C), the coefficient of performance (COP) of
the system was found to vary from 4.1 to 2.1. On average between ambient temperatures of 60ºF and
88ºF (16°C and 31°C), the COP of the the CO2 booster system was 15% greater than that of a laboratory-
scale HFC refrigeration system. Extrapolating the trends for ambient temperatures above 88ºF (31°C), it
is expected that the HFC-based refrigeration system will have a greater COP than the transcritical CO2
booster system.
Based on the exceptional energy and environmental performance of the transcritical CO2 booster
refrigeration system, the CRADA partner, Hillphoenix, has commercialized the system for supermarket
refrigeration applications. To date, Hillphoenix has over 130 installations of transcritical CO2 booster
refrigeration system in the U.S.
43
8. REFERENCES
American Society of Heating, Refrigerating and Air-Conditioning Engineers (ASHRAE). 2005.
ASHRAE Standard 72-2005, Method of Testing Commercial Refrigerators and Freezers. Atlanta,
GA: American Society of Heating, Refrigerating and Air Conditioning Engineers.
Bansal, P.K. 2012. "A Review - Status of CO2 as a Low Temperature Refrigerant: Fundamentals and
R&D Opportunities." Applied Thermal Engineering 41:18-29.
Bell, I. 2004. "Performance Increase of Carbon Dioxide Refrigeration Cycle with the Addition of Parallel
Compression Economization." 6th IIR Gustav Lorentzen Conference on Natural Working Fluids,
Glasgow, UK, 29 August – 1 September 2004.
Denecke, J., A. Hafner, T. Eikevik, and Y. Ladam. 2012. "Heat Recovery Solutions for R744 Booster
Commercial Refrigeration Systems." 10th IIR Gustav Lorentzen Conference on Natural Working
Fluids, Delft, The Netherlands, 25-27 June 2012.
Deru, M., and P. Torcellini. 2007. Source Energy and Emission Factors for Energy Use in Buildings.
NREL/TP-550-38617. Golden, CO: National Renewable Energy Laboratory.
Ferrandi, C., and M. Orlandi. 2012. "Theoretical Analysis of Cold Storage Device Effects on the
Performance and Regulation of a CO2 Supermarket Refrigeration Plant." 10th IIR Gustav Lorentzen
Conference on Natural Working Fluids, Delft, The Netherlands, 25-27 June 2012.
Food Marketing Institute (FMI). 2016. "Supermarket Facts." Accessed 1 February 2016.
http://www.fmi.org/research-resources/supermarket-facts.
Fricke, B.A., and B.R. Becker. 2010. "Energy Use of Doored and Open Vertical Refrigerated Display
Cases." 13th International Refrigeration and Air Conditioning Conference, Purdue University, West
Lafayette, IN, 12-15 July 2010.
Ge, Y.T., and S.A. Tassou. 2009. "Control Optimization of CO2 Cycles for Medium-Temperature Retail
Food Refrigeration Systems." International Journal of Refrigeration 32 (6):1376-1388.
Ge, Y.T., and S.A. Tassou. 2010. "Performance Evaluation and Control Optimization of a CO2 Booster
Refrigeration System in Supermarket." 1st IIR International Conference on Sustainability and the
Cold Chain, Cambridge, UK, 29-31 March 2010.
Getu, H.M., and P.K. Bansal. 2008. "Thermodynamic Analysis of an R744-R717 Cascade Refrigeration
System." International Journal of Refrigeration 31 (1):45-54.
Girotto, S., S. Minetto, and P. Nekså. 2004. "Commercial Refrigeration System using CO2 as the
Refrigerant." International Journal of Refrigeration 27 (7):717-723.
Hafner, A., P. Nekså, and J. Pettersen. 2004. "Life Cycle Climate Performance (LCCP) of Mobile Air-
Conditioning Systems with HFC-134a, HFC-152a and R-744." Mobile Air Conditioning Summit,
Washington, D.C., 14-15 April 2004.
Hinde, D., and S. Zha. 2009. "Natural Refrigerant Applications in North American Supermarkets." IIAR
Industrial Refrigeration Conference and Exhibition, Dallas, TX, 22-25 March 2009.
Horie, H., T. Kamiaka, C. Dang, and E. Hihara. 2010. "Study on Cycle Property and LCCP Evaluation of
Heat Pump using HFO-1234yf, HFC-32, and HFC-410A as Refrigerant." 2010 International
Symposium on Next-Generation Air Conditioning and Refrigeration Technology, Tokyo, Japan, 17-
19 February 2010.
ICF Consulting. 2005. Revised Draft Analysis of U.S. Commercial Supermarket Refrigeration Systems.
Washington, D.C.: US Environmental Protection Agency (EPA).
Johnson, C. 2004. "The Embodied Greenhouse Gas Emissions of Carbon Dioxide Refrigerant (R-744) as
an Adjustment to Global Warming Potential." 15th Annual Earth Technologies Forum and Mobile
Air Conditioning Summit, Washington, D.C., 13-15 April 2004.
Kim, M., J. Pettersen, and C.W. Bullard. 2004. "Fundamental Process and System Design Issues in CO2
Vapor Compression Systems." Progress in Energy and Combustion Science 30 (2):119-174.
44
Lemmon, E., M. McLinden, and M. Huber. NIST Standard Reference Database 23: Reference Fluid
Thermodynamic and Transport Properties-REFPROP, Version 9.1, Standard Reference Data
Program. Gaithersburg, MD: National Institute of Standards and Technology (NIST).
Mazzola, D., A. Toffolo, and M. Orlandi. 2012. "Supermarket Application. CO2 System with
Groundwater Sink. Model Simulation." 10th IIR Gustav Lorentzen Conference on Natural Working
Fluids, Delft, The Netherlands, 25-27 June 2012.
Pacific Northwest National Laboratory (PNNL). 2010. Volume 7.1, High-Performance Home
Technologies: Guide to Determining Climate Regions by County. Wasthington, D.C.: U.S.
Department of Energy (DOE).
Papasavva, S., W. Hill, and S. Andersen. 2010. "GREEN-MAC-LCCP: A Tool for Assessing the Life
Cycle Climate Performance of MAC Systems." Environmental Science and Technology 44
(19):7666-7672.
Rauss, D., S. Mitchell, and R. Faramarzi. 2008. "Cool Retrofit Solutions in Refrigerated Display Cases."
2008 ACEEE Summer Study on Energy Efficiency in Buildings, Pacific Grove, CA, 17-22 August
2008.
Sarkar, J., and N. Agrawal. 2010. "Performance Optimization of Transcritical CO2 Cycle with Parallel
Compression Economization." International Journal of Thermal Sciences 49 (5):838-843.
Sawalha, S. 2007. "Theoretical Evaluation of Trans-Critical CO2 Systems in Supermarket Refrigeration.
Part 1: Modeling, Simulation and Optimization of Two System Solutions." International Journal of
Refrigeration 31 (3):516-524.
Sawalha, S., and B. Palm. 2003. "Energy Consumption Evaluation of Indirect Systems with CO2 as
Secondary Refrigerant in Supermarket Refrigeration." 21st IIR International Congress of
Refrigeration, Washington, D.C., 17-22 August 2003.
Spatz, M., and S. Motta. 2004. "An Evaluation of Options for Replacing HCFC-22 in Medium
Temperature Refrigeration Systems." International Journal of Refrigeration 27 (5):475-483.
US Department of Energy (DOE). EnergyPlus. Washington, D.C.: Energy Efficiency & Renewable
Energy, U.S. Department of Energy.
Westphalen, D., R.A. Zogg, A.F. Varone, and M.A. Foran. 1996. Energy Savings Potential for
Commercial Refrigeration Equipment. Washington, D.C.: US Department of Energy (DOE).
Winter, J., and S. Murin. 2012. "Energy Saving and Increasing Reliability at CO2 Transcritical Boosters.
A Case Study." 10th IIR Gustav Lorentzen Conference on Natural Working Fluids, Delft, The
Netherlands, 25-27 June 2012.
Zhang, M. 2006. "Energy analysis of various supermarket refrigeration systems." 11th International
Refrigeration and Air Conditioning Conference, Purdue University, West Lafayette, IN, 17-20 July
2006.
Zhang, M., J. Muehlbauer, V. Aute, and R. Radermacher. 2011. Life Cycle Climate Performance Model
for Residential Heat Pump Systems. Arlington, VA: Air-Conditioning Heating and Refrigeration
Technology Institute (AHRTI).
APPENDIX A. MEASUREMENT POINTS FOR LABORATORY-SCALE
TRANSCRITICAL CO2 REFRIGERATION SYSTEM

A-3
APPENDIX A. MEASUREMENT POINTS FOR LABORATORY-SCALE TRANSCRITICAL
CO2 REFRIGERATION SYSTEM
A list of measurement points for the laboratory-scale transcritical CO2 booster refrigeration system is
provided below. During the performance evaluation of the laboratory-scale transcritical CO2 booster
refrigeration system, these system parameters were sampled and recorded once per second and
subsequently, 30-second averaged data was used for the calculation of the system performance metrics.
Mass flow of flash gas (lb/min)
Mass flow of liquid refrigerant to LT display case (lb/min)
Mass flow of liquid refrigerant to MT display case (lb/min)
Mass flow of liquid refrigerant to LT false load (GPM)
Mass flow of liquid refrigerant to MT false load (GPM)
Mass flow of glycol to LT false load (GPM)
Mass flow of glycol to MT false load (GPM)
Pressure, flash tank (psig)
Pressure, gas cooler refrigerant inlet (psig)
Pressure, gas cooler refrigerant outlet (psig)
Pressure, liquid to LT display case (psig)
Pressure, suction of LT display case (psig)
Pressure, liquid to LT false load (psig)
Pressure, suction of LT false load (psig)
Pressure, liquid to MT display case (psig)
Pressure, suction of MT display case (psig)
Pressure, liquid to MT false load (psig)
Pressure, suction of MT false load (psig)
Pressure, LT suction header (psig)
Pressure, MT suction header (psig)
Pressure, MT compressor discharge (psig)
Relative humidity, indoor chamber air (%)
Relative humidity, outdoor chamber air (%)
Temperature, flash gas bypass expansion valve inlet (°F)
Temperature, flash gas bypass expansion valve outlet (°F)
Temperature, gas cooler fan #1 inlet air (°F)
Temperature, gas cooler fan #2 inlet air (°F)
Temperature, gas cooler fan #1 outlet air (°F)
Temperature, gas cooler fan #2 outlet air (°F)
Temperature, gas cooler refrigerant inlet (°F)
Temperature, gas cooler refrigerant outlet (°F)
Temperature, indoor chamber air (°F)
Temperature, outdoor chamber air (°F)
Temperature, liquid to LT display case (°F)
Temperature, LT display case expansion valve outlet (°F)
Temperature, suction of LT display case (°F)
Temperature, LT display case return air (°F)
Temperature, LT display case discharge air (°F)
Temperature, liquid to LT false load (°F)
Temperature, LT false load expansion valve outlet (°F)
Temperature, suction of LT false load (°F)
A-4
Temperature, LT false load glycol inlet (°F)
Temperature, LT false load glycol outlet (°F)
Temperature, LT compressor #1 discharge (°F)
Temperature, LT compressor #1 suction (°F)
Temperature, LT compressor #2 discharge (°F)
Temperature, LT compressor #2 suction (°F)
Temperature, LT suction header (°F)
Temperature, LT discharge header (°F)
Temperature, liquid to MT display case (°F)
Temperature, MT display case expansion valve outlet (°F)
Temperature, suction of MT display case (°F)
Temperature, MT display case return air (°F)
Temperature, MT display case discharge air (°F)
Temperature, liquid to MT false load (°F)
Temperature, MT false load expansion valve outlet (°F)
Temperature, suction of MT false load (°F)
Temperature, MT false load glycol inlet (°F)
Temperature, MT false load glycol outlet (°F)
Temperature, MT compressor #1 discharge (°F)
Temperature, MT compressor #1 suction (°F)
Temperature, MT compressor #2 discharge (°F)
Temperature, MT compressor #2 suction (°F)
Temperature, MT compressor #3 discharge (°F)
Temperature, MT compressor #3 suction (°F)
Temperature, MT suction header (°F)
Temperature, MT discharge header (°F)
Temperature, compressor rack inlet, from gas cooler (°F)
Temperature, compressor rack outlet, to gas cooler (°F)
Temperature, compressor rack outlet, liquid to display cases (°F)
Temperature, compressor rack outlet, liquid to false loads (°F)
Temperature, compressor rack inlet, LT display case suction (°F)
Temperature, compressor rack inlet, LT false load suction (°F)
Temperature, compressor rack inlet, MT display case suction (°F)
Temperature, compressor rack inlet, MT false load suction (°F)
Power, gas cooler fans (W)
Power, LT compressor #1 (W)
Power, LT compressor #2 (W)
Power, MT compressor #1 (W)
Power, MT compressor #2 (W)
Power, MT compressor #3 (W)