high frequency ultrasonic non destructive evaluation · pdf filehigh frequency ultrasonic non...
TRANSCRIPT
High Frequency Ultrasonic Non Destructive Evaluation of Additively
Manufactured Components
N.V.Karthik*, Hengfeng Gu*, Deepankar Pal *, Thomas Starr†, Brent Stucker*
*Department of Industrial Engineering, †Department of Chemical Engineering,
J. B. Speed School of Engineering, University of Louisville, Louisville, KY 40292
Abstract
Ultrasonic testing of additively manufactured components is useful for non-destructive defect analysis such as porosity, void and delamination detection as well as for analysis of material properties such as density, material strength and Young’s modulus. A high frequency ultrasonic system has been set up on a Fabrisonics Ultrasonic Additive Manufacturing (Ultrasonic Consolidation) machine to measure the material properties after each layer. The same system is also used to perform offline tests of parts fabricated by SLM. Traditional material analysis carried out using SEM and optical microscopy is used to validate and demonstrate the effectiveness of the non-destructive testing equipment.
1. Introduction
1.1 Ultrasonic nondestructive testing (NDT)
Ultrasonic NDT uses the ability of high frequency sound energy to easily travel through several
materials and thus help to conduct examinations and make measurements that can be used for
flaw detection, dimensional measurements and material characterization. Ultrasonic testing can
be divided into contact, non-contact immersion, and non-contact in air. All kinds of ultrasonic
systems require a medium be it either a viscous fluid in contact, water/alcohol in immersion or
air in non-contact NDT. Ultrasonic signals are typically of three types, longitudinal, shear and
surface waves. In this paper we discuss primarily longitudinal ultrasonic signals.
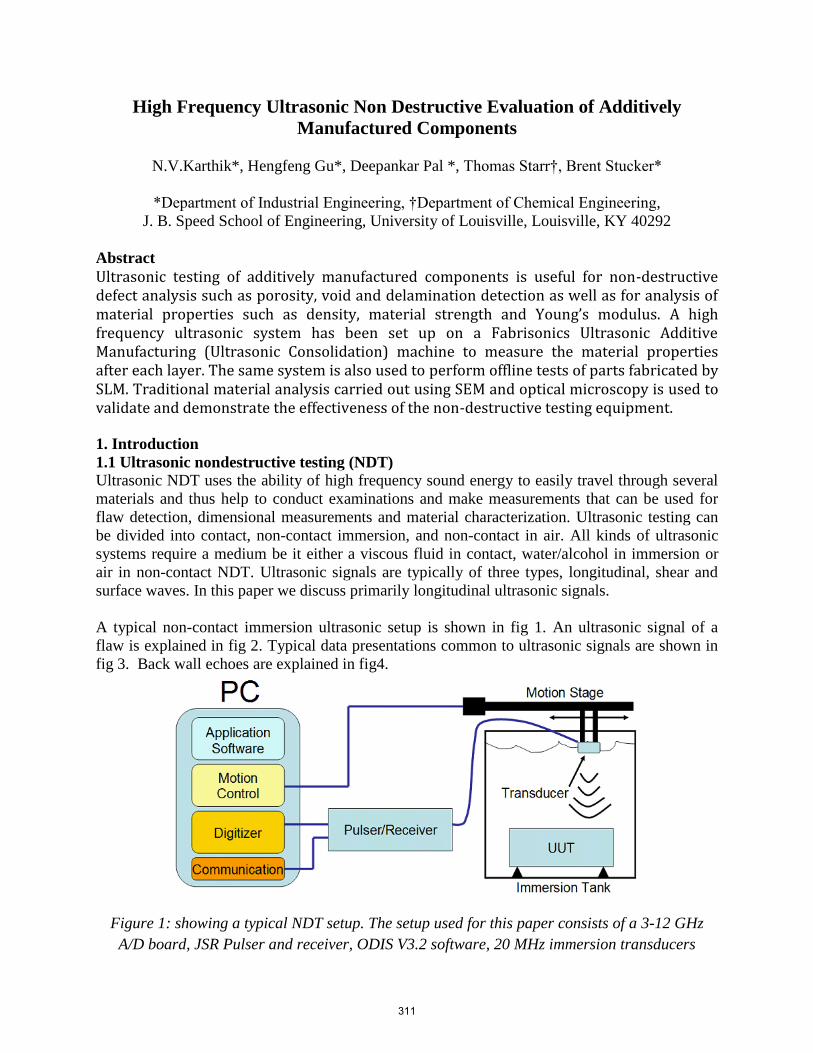
A typical non-contact immersion ultrasonic setup is shown in fig 1. An ultrasonic signal of a
flaw is explained in fig 2. Typical data presentations common to ultrasonic signals are shown in
fig 3. Back wall echoes are explained in fig4.
Figure 1: showing a typical NDT setup. The setup used for this paper consists of a 3-12 GHz
A/D board, JSR Pulser and receiver, ODIS V3.2 software, 20 MHz immersion transducers
311

Figure 2: shows how cracks can be detected from ultrasonic signals. When there is a
discontinuity (such as a crack) in the wave path, part of the energy will be reflected back from
the flaw surface. The reflected wave signal is transformed into an electrical signal by the
transducer and is displayed on a screen.
Figure 3: shows the typical data representations of ultrasonic signals. At every point we have the
entire Z information of the part and this single signal is known as an A scan. Rastering across
the entire top surface of a component gives us the complete 3D representation of the component
and this is represented as the B and C scans
A-SCAN
312

Figure 4: shows three back wall echoes from a sample. When ultrasonic waves travel through a
sample, part of the energy is absorbed, part is transmitted and part is reflected back. Multiple
reflections from the back surface of the sample are known as back wall echoes and occur once
sound travels travels 2*thickness of the sample
For this project, each of the data collection methods described in Figures 1-4 will be used to
extract information from ultrasonic signals. Correlating these signals to material properties and
part quality will be discussed in detail in further sections.
1.2 Applications
Since additive manufacturing (AM) involves layer by layer manufacturing, this provides
a unique opportunity for testing each layer as it is being built, if such an NDT system can be
setup. NDT methods such as Infrared thermography have shown some potential for testing the
shape and size of a melt pool in laser and electron beam based processes but they are able to
measure only visual aspects of material transformations. Ultrasonic testing has been shown to be
an excellent and efficient tool for detecting flaws, thickness, grain size, density/porosity, and
mechanical properties [1-5]. Ultrasonic testing offers high resolution among the available online
NDT techniques. The main drawback of ultrasonic NDT is that it cannot function at temperatures
higher than 500K. This makes Ultrasonic Consolidation (UC) an ideal process choice for
ultrasonic NDT as it is a solid state process involving no melting. Once an ultrasonic NDT
system has been set up and integrated onto a machine (in this case the Ultrasonic Consolidation
system) the goal is to achieve closed-loop control.
1.3 Close loop control
Control of a system involves a thorough understanding of the system, the parameters
which can be controlled and the sensors which measure the response and give feedback. Control
systems are of two types, open loop and a closed loop feedback control. Open loops give an
initial value into the system and are based on an assumed state and model of the system. Closed
loop control takes the feedback from the performance and changes the input based on the current
feedback. In case there is a repetitive action (which is the case in UC -- layer by layer welding),
it is also advantageous to use an ILC (Iterative Learning Controller) [6].
Closed loop control takes several cycles to stabilize since the values input through the
mathematical model are often not very close to the experimental values. Thus we propose to use
an open loop feed forward control from DDCP-FEM simulations [7] and a closed loop PID
Back wall 1 Back wall 2 Back wall 3
313

control (fig 5) with an ILC for each layer for each material. The role of the DDCP-FEM
simulations is to give an approximate and close value to the optimized parameters while the
Closed Loop PID controller is the main feedback control. The ILC will create a database of
information for a given material at every layer.
Figure 5: A prototype Control loop system setup involving a feed forward FEM simulation and
feedback from ultrasonic NDT
2. Integration of systems
2.1 Mounting the system and online NDT
In order to make effective ultrasonic measurements, it is essential to design an integrated
setup which holds the ultrasonic transducer right behind the welding head of the UC machine.
This gives us access to the X axis motor of the Fabrisonics machine for following the weld.
Motion in the Y-axis is accomplished using a precision linear motor and Z axis focusing is
achieved using a stepper motor as shown in fig 6.
314

Figure 6 shows the transducer mounted on the left and the X, Y and Z axes of movement
Since ultrasonic waves require a medium (preferably a liquid) it is important to design a structure
which ensures that the transducer is immersed at all times during the measurement. The choice
for the contact medium was isopropyl alcohol since it is easy to handle, does not corrode
materials of interest, is not very expensive and evaporates after we are done with the
measurement, which avoids contamination of the foils before the following layer is added. The
design of the immersion structure is shown in figure 7.
Figure 7: On the top left and center the complete immersion systems is shown. The top right
shows the final design which holds the contact medium only where required. The bottom left
shows the entire system and how the X, Y and Z axes work in coordination. The bottom right
shows the system physically installed.
315
3. Materials and Testing Methodology
There are four different domains in which ultrasonic signals are analyzed, namely
a) Time domain: Each signal is studied with respect to time in the X-axis which gives
waveform information from which velocity can be derived
b) Attenuation domain: The attenuation of the back wall echoes is studied giving
information about how the signal decays in the sample. This depends on absorption and
flaw scattering
c) Frequency domain: Spectral analysis of back wall echoes gives important micro
structural information
d) Image domain: For visualization of flaws, B and C scans are used as shown in fig 3.
In order to use ultrasonic NDT online, master graphs need to be generated for a given material. A
master graph is a correlation of a measured material property with respect to ultrasonic data for
the range in which the material property has been measured. Once the master graph is generated,
an ultrasonic measurement is performed and the required material property can be correlated to
the signal.
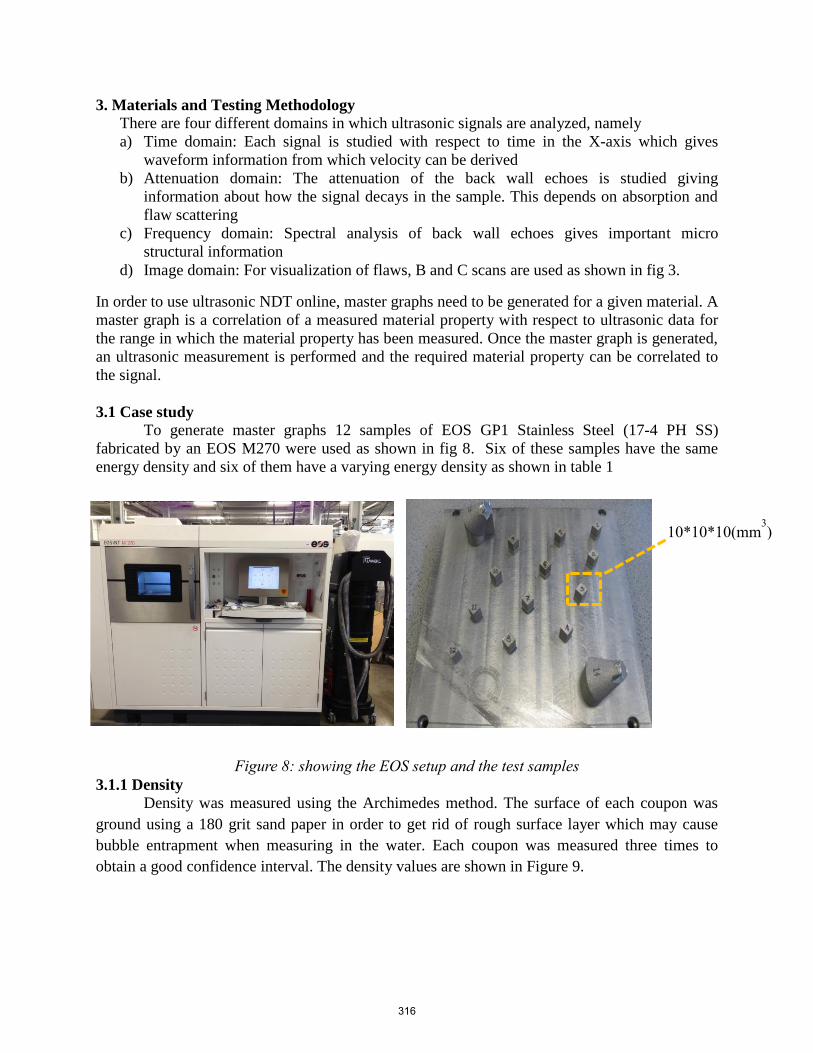
3.1 Case study
To generate master graphs 12 samples of EOS GP1 Stainless Steel (17-4 PH SS)
fabricated by an EOS M270 were used as shown in fig 8. Six of these samples have the same
energy density and six of them have a varying energy density as shown in table 1
Figure 8: showing the EOS setup and the test samples
3.1.1 Density
Density was measured using the Archimedes method. The surface of each coupon was
ground using a 180 grit sand paper in order to get rid of rough surface layer which may cause
bubble entrapment when measuring in the water. Each coupon was measured three times to
obtain a good confidence interval. The density values are shown in Figure 9.
10*10*10(mm3)
316
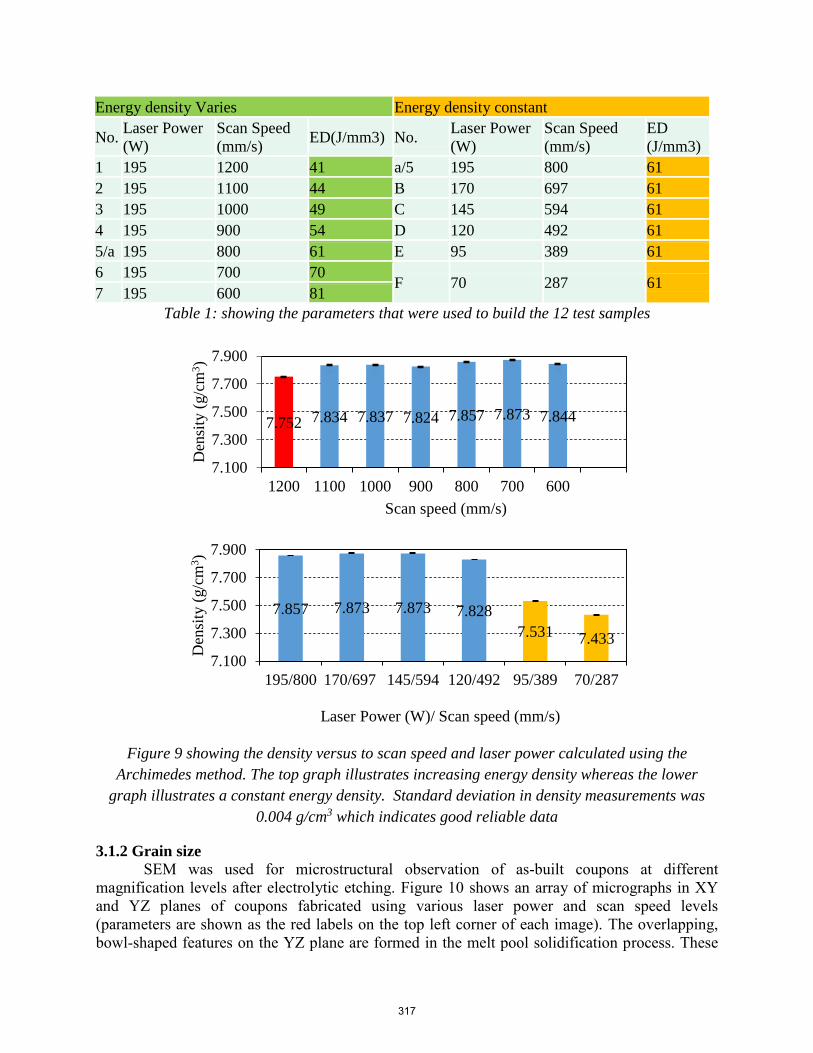
Energy density Varies Energy density constant
No. Laser Power
(W)
Scan Speed
(mm/s) ED(J/mm3) No.
Laser Power
(W)
Scan Speed
(mm/s)
ED
(J/mm3)
1 195 1200 41 a/5 195 800 61
2 195 1100 44 B 170 697 61
3 195 1000 49 C 145 594 61
4 195 900 54 D 120 492 61
5/a 195 800 61 E 95 389 61
6 195 700 70 F 70 287 61
7 195 600 81
Table 1: showing the parameters that were used to build the 12 test samples
Figure 9 showing the density versus to scan speed and laser power calculated using the
Archimedes method. The top graph illustrates increasing energy density whereas the lower
graph illustrates a constant energy density. Standard deviation in density measurements was
0.004 g/cm3 which indicates good reliable data
3.1.2 Grain size
SEM was used for microstructural observation of as-built coupons at different
magnification levels after electrolytic etching. Figure 10 shows an array of micrographs in XY
and YZ planes of coupons fabricated using various laser power and scan speed levels
(parameters are shown as the red labels on the top left corner of each image). The overlapping,
bowl-shaped features on the YZ plane are formed in the melt pool solidification process. These
7.752 7.834 7.837 7.824 7.857 7.873 7.844
7.100
7.300
7.500
7.700
7.900
1200 1100 1000 900 800 700 600
Den
sity
(g/c
m3)
Scan speed (mm/s)
7.857 7.873 7.873 7.828
7.531 7.433
7.100
7.300
7.500
7.700
7.900
195/800 170/697 145/594 120/492 95/389 70/287
Den
sity
(g/c
m3)
Laser Power (W)/ Scan speed (mm/s)
317

melt pool features, which are created by each laser scan, are parallel to the build direction.
Parallel columnar austenitic grains can be observed at higher magnification levels due to their
very fine sizes. The columnar grains show strongly preferred orientation since they grow along
with the heat transfer directions in both XY and YZ planes.
The top right corner SEM image is one of the selected images with 16000X magnification for
calculation of average diameter of columnar austenitic grain, where γ grain with circular contour
grows perpendicular to the cross section of the XY plane. Austenitic grain diameters under both
processing parameters set were calculated, the results are shown in figs 10,11.
Figure 10: Showing representative micrographs in the XY and YZ planes.
Y
Z P
lan
e
X
Y P
lan
e
318
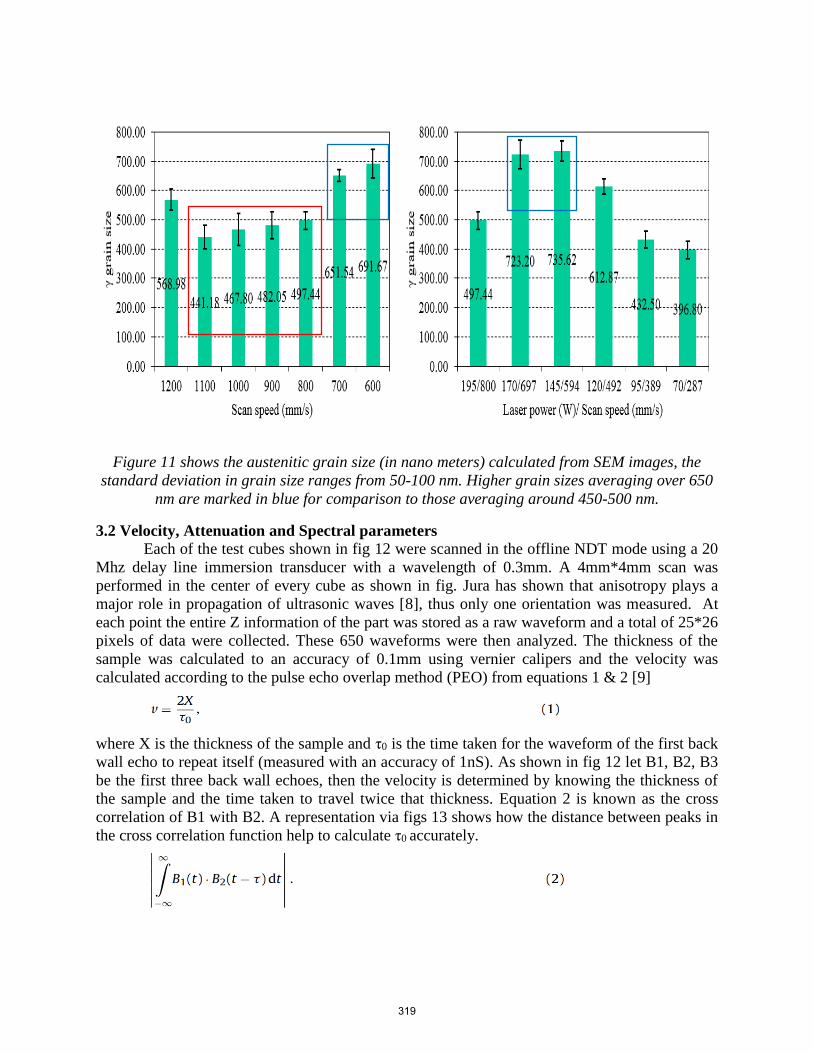
Figure 11 shows the austenitic grain size (in nano meters) calculated from SEM images, the
standard deviation in grain size ranges from 50-100 nm. Higher grain sizes averaging over 650
nm are marked in blue for comparison to those averaging around 450-500 nm.
3.2 Velocity, Attenuation and Spectral parameters
Each of the test cubes shown in fig 12 were scanned in the offline NDT mode using a 20
Mhz delay line immersion transducer with a wavelength of 0.3mm. A 4mm*4mm scan was
performed in the center of every cube as shown in fig. Jura has shown that anisotropy plays a
major role in propagation of ultrasonic waves [8], thus only one orientation was measured. At
each point the entire Z information of the part was stored as a raw waveform and a total of 25*26
pixels of data were collected. These 650 waveforms were then analyzed. The thickness of the
sample was calculated to an accuracy of 0.1mm using vernier calipers and the velocity was
calculated according to the pulse echo overlap method (PEO) from equations 1 & 2 [9]
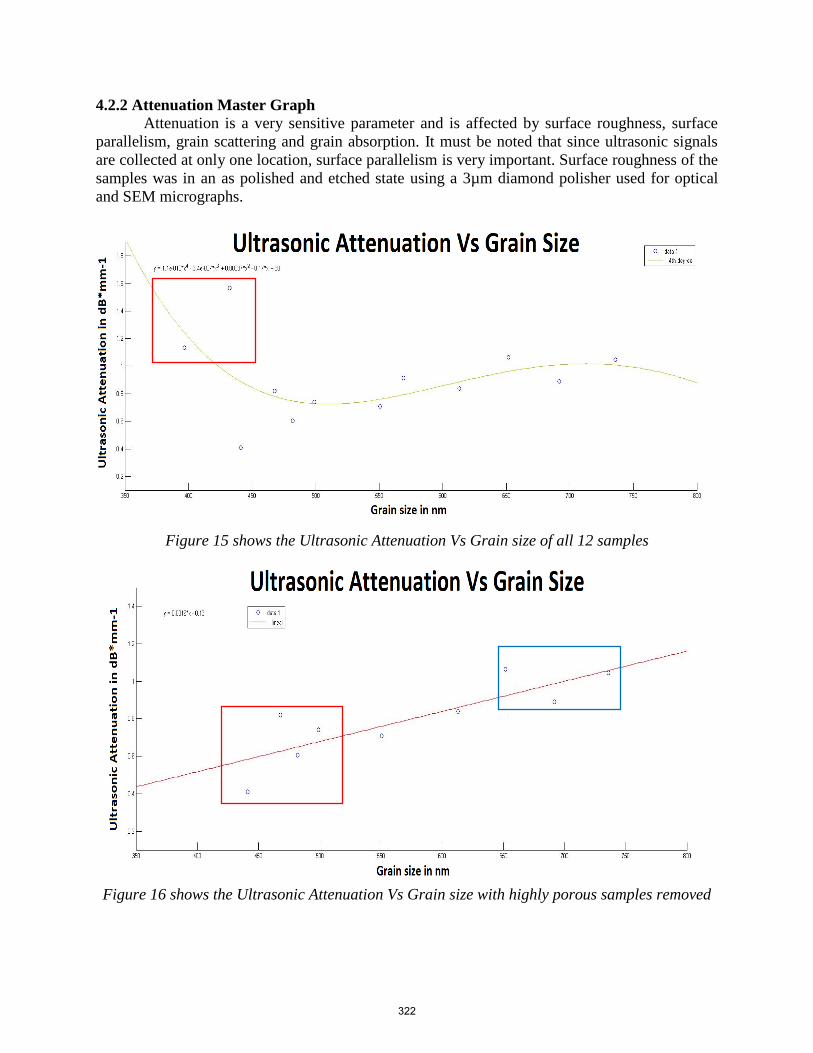
where X is the thickness of the sample and τ0 is the time taken for the waveform of the first back
wall echo to repeat itself (measured with an accuracy of 1nS). As shown in fig 12 let B1, B2, B3
be the first three back wall echoes, then the velocity is determined by knowing the thickness of
the sample and the time taken to travel twice that thickness. Equation 2 is known as the cross
correlation of B1 with B2. A representation via figs 13 shows how the distance between peaks in
the cross correlation function help to calculate τ0 accurately.
319
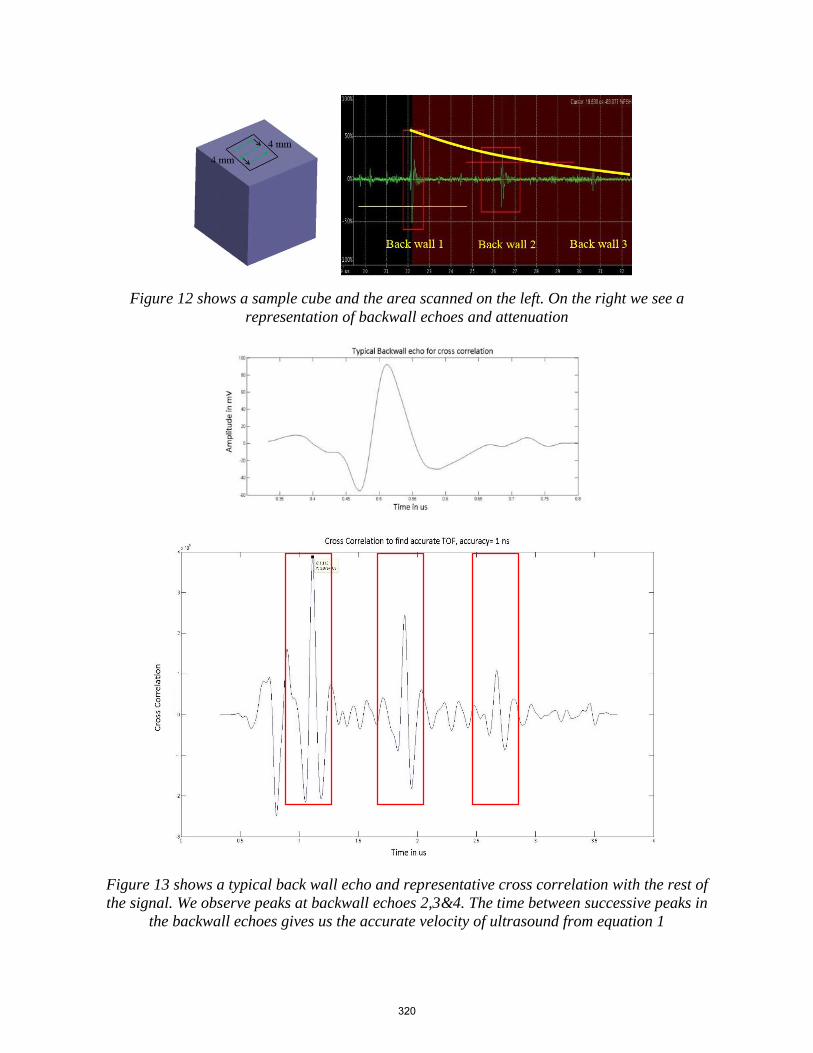
Figure 12 shows a sample cube and the area scanned on the left. On the right we see a
representation of backwall echoes and attenuation
Figure 13 shows a typical back wall echo and representative cross correlation with the rest of
the signal. We observe peaks at backwall echoes 2,3&4. The time between successive peaks in
the backwall echoes gives us the accurate velocity of ultrasound from equation 1
320

Ultrasonic attenuation is the rate at which the signal decays as it travels through the same
sample, or it is the rate of decay of back wall echoes as seen in fig 12. It is calculated from the
reduction of amplitude of the ultrasonic impulse and is quantified in terms of the attenuation
coefficient α dB/mm given by the equation 3
in which x is the sample thickness [mm], A0 is the amplitude of the first echo [dB], and A1 is the
amplitude of the second echo [dB].
Frequency domain representations of the back wall echoes are known to give useful information
about grain size. The FFT/Auto power spectrum of the first back wall echo as well as the FWHM
of the frequency spectrum have been studied.
4. Results
4.2.1 Velocity Master Graph
According to the literature [10-14], velocity has been correlated successfully to part
density/porosity and also to grain size. Ultrasonic velocity however is more sensitive to change
in texture and phase while it cannot accurately detect change in grain size. Density calculations
have a very good standard deviation but grain size data has a large variance, hence while looking
for grain size correlations we look to determine if an average trend can be observed while for
correlations with respect to density we look to obtain quantitative results. It was found that when
the density levels are low the ultrasonic velocity is significantly lower when compared to 100%
dense parts. According to EOS a density of 7.80 g/cm3 indicates fully dense. For the purpose of
this study the highest value of 7.87 g/cm3 is considered fully dense. Velocity when plotted vs
grain size does not give any significant correlations, while the correlations with density are
shown in fig 14.
Figure 14 shows the Velocity vs Density of all 12 samples
321
4.2.2 Attenuation Master Graph
Attenuation is a very sensitive parameter and is affected by surface roughness, surface
parallelism, grain scattering and grain absorption. It must be noted that since ultrasonic signals
are collected at only one location, surface parallelism is very important. Surface roughness of the
samples was in an as polished and etched state using a 3µm diamond polisher used for optical
and SEM micrographs.
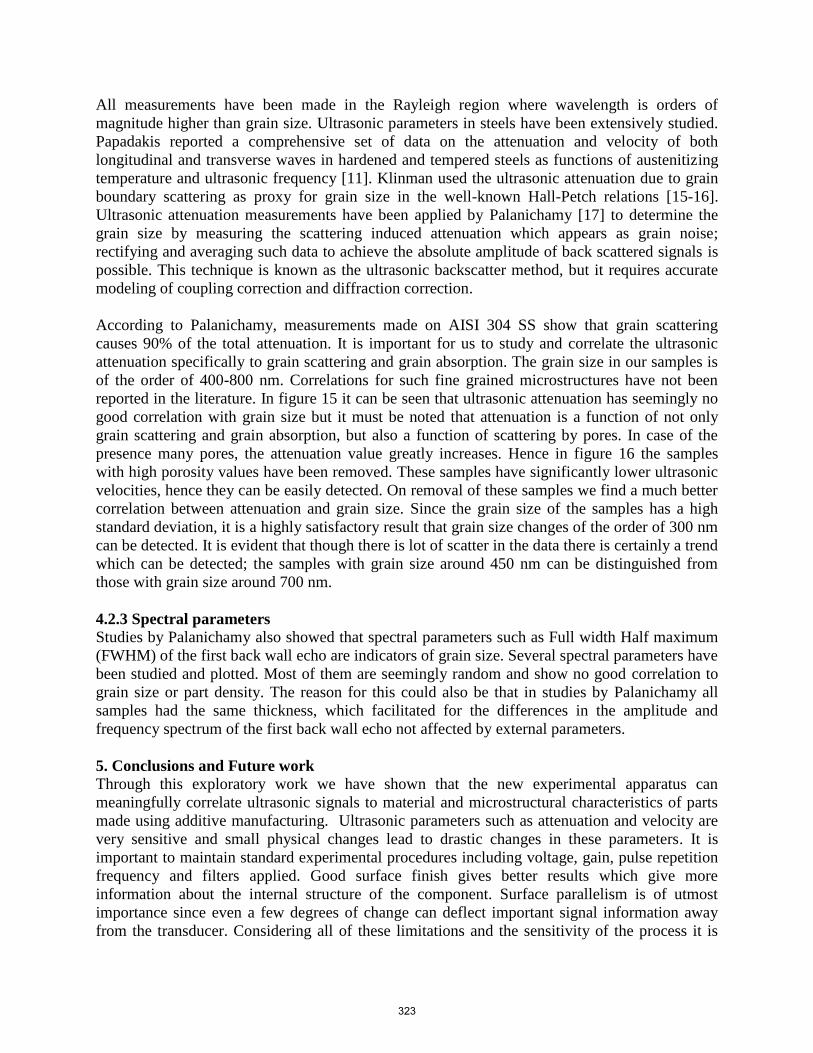
Figure 15 shows the Ultrasonic Attenuation Vs Grain size of all 12 samples
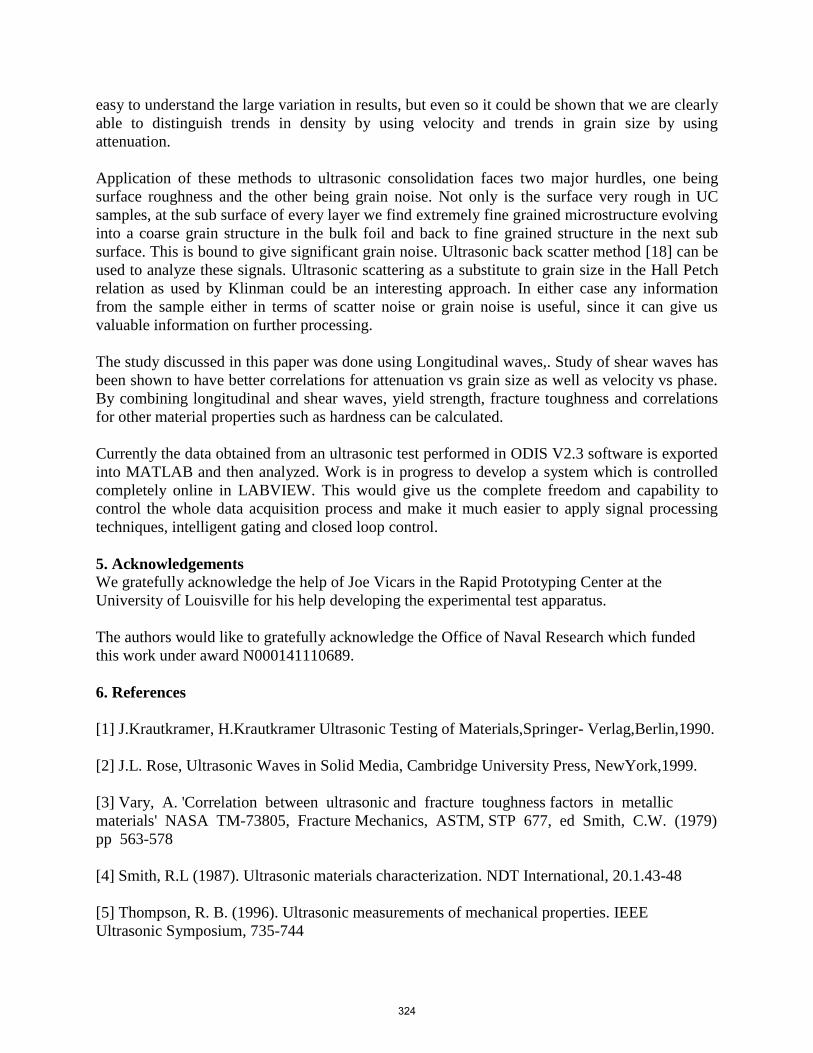
Figure 16 shows the Ultrasonic Attenuation Vs Grain size with highly porous samples removed
322
All measurements have been made in the Rayleigh region where wavelength is orders of
magnitude higher than grain size. Ultrasonic parameters in steels have been extensively studied.
Papadakis reported a comprehensive set of data on the attenuation and velocity of both
longitudinal and transverse waves in hardened and tempered steels as functions of austenitizing
temperature and ultrasonic frequency [11]. Klinman used the ultrasonic attenuation due to grain
boundary scattering as proxy for grain size in the well-known Hall-Petch relations [15-16].
Ultrasonic attenuation measurements have been applied by Palanichamy [17] to determine the
grain size by measuring the scattering induced attenuation which appears as grain noise;
rectifying and averaging such data to achieve the absolute amplitude of back scattered signals is
possible. This technique is known as the ultrasonic backscatter method, but it requires accurate
modeling of coupling correction and diffraction correction.
According to Palanichamy, measurements made on AISI 304 SS show that grain scattering
causes 90% of the total attenuation. It is important for us to study and correlate the ultrasonic
attenuation specifically to grain scattering and grain absorption. The grain size in our samples is
of the order of 400-800 nm. Correlations for such fine grained microstructures have not been
reported in the literature. In figure 15 it can be seen that ultrasonic attenuation has seemingly no
good correlation with grain size but it must be noted that attenuation is a function of not only
grain scattering and grain absorption, but also a function of scattering by pores. In case of the
presence many pores, the attenuation value greatly increases. Hence in figure 16 the samples
with high porosity values have been removed. These samples have significantly lower ultrasonic
velocities, hence they can be easily detected. On removal of these samples we find a much better
correlation between attenuation and grain size. Since the grain size of the samples has a high
standard deviation, it is a highly satisfactory result that grain size changes of the order of 300 nm
can be detected. It is evident that though there is lot of scatter in the data there is certainly a trend
which can be detected; the samples with grain size around 450 nm can be distinguished from
those with grain size around 700 nm.
4.2.3 Spectral parameters
Studies by Palanichamy also showed that spectral parameters such as Full width Half maximum
(FWHM) of the first back wall echo are indicators of grain size. Several spectral parameters have
been studied and plotted. Most of them are seemingly random and show no good correlation to
grain size or part density. The reason for this could also be that in studies by Palanichamy all
samples had the same thickness, which facilitated for the differences in the amplitude and
frequency spectrum of the first back wall echo not affected by external parameters.
5. Conclusions and Future work
Through this exploratory work we have shown that the new experimental apparatus can
meaningfully correlate ultrasonic signals to material and microstructural characteristics of parts
made using additive manufacturing. Ultrasonic parameters such as attenuation and velocity are
very sensitive and small physical changes lead to drastic changes in these parameters. It is
important to maintain standard experimental procedures including voltage, gain, pulse repetition
frequency and filters applied. Good surface finish gives better results which give more
information about the internal structure of the component. Surface parallelism is of utmost
importance since even a few degrees of change can deflect important signal information away
from the transducer. Considering all of these limitations and the sensitivity of the process it is
323
easy to understand the large variation in results, but even so it could be shown that we are clearly
able to distinguish trends in density by using velocity and trends in grain size by using
attenuation.
Application of these methods to ultrasonic consolidation faces two major hurdles, one being
surface roughness and the other being grain noise. Not only is the surface very rough in UC
samples, at the sub surface of every layer we find extremely fine grained microstructure evolving
into a coarse grain structure in the bulk foil and back to fine grained structure in the next sub
surface. This is bound to give significant grain noise. Ultrasonic back scatter method [18] can be
used to analyze these signals. Ultrasonic scattering as a substitute to grain size in the Hall Petch
relation as used by Klinman could be an interesting approach. In either case any information
from the sample either in terms of scatter noise or grain noise is useful, since it can give us
valuable information on further processing.
The study discussed in this paper was done using Longitudinal waves,. Study of shear waves has
been shown to have better correlations for attenuation vs grain size as well as velocity vs phase.
By combining longitudinal and shear waves, yield strength, fracture toughness and correlations
for other material properties such as hardness can be calculated.
Currently the data obtained from an ultrasonic test performed in ODIS V2.3 software is exported
into MATLAB and then analyzed. Work is in progress to develop a system which is controlled
completely online in LABVIEW. This would give us the complete freedom and capability to
control the whole data acquisition process and make it much easier to apply signal processing
techniques, intelligent gating and closed loop control.
5. Acknowledgements
We gratefully acknowledge the help of Joe Vicars in the Rapid Prototyping Center at the
University of Louisville for his help developing the experimental test apparatus.
The authors would like to gratefully acknowledge the Office of Naval Research which funded
this work under award N000141110689.
6. References
[1] J.Krautkramer, H.Krautkramer Ultrasonic Testing of Materials,Springer- Verlag,Berlin,1990.
[2] J.L. Rose, Ultrasonic Waves in Solid Media, Cambridge University Press, NewYork,1999.
[3] Vary, A. 'Correlation between ultrasonic and fracture toughness factors in metallic
materials' NASA TM-73805, Fracture Mechanics, ASTM, STP 677, ed Smith, C.W. (1979)
pp 563-578
[4] Smith, R.L (1987). Ultrasonic materials characterization. NDT International, 20.1.43-48
[5] Thompson, R. B. (1996). Ultrasonic measurements of mechanical properties. IEEE
Ultrasonic Symposium, 735-744
324
[6] K. L. Moore Iterative Learning Control for Deterministic Systems, 1993 :Springer-Verlag
[7] Pal, Deepankar, "Dislocation Density-Based Finite Element Method Modeling of Ultrasonic
Consolidation" (2011)
[8] Jura, A. and Lenkkeri, J. 'The effects of anisotropy on the propagation of ultrasonic
waves in austenitic stainless steel' Brussels, Belgium (1980) pp 1-24
[9] ASTM E 494, 1995 - Measuring Ultrasonic Velocity in Materials.
[10] Hakan, C. G. and Orkun, B. T.,2005, Characterization of micro structural phases of steels by
sound velocity measurement’, Materials Characterization Vol. 55, pp. 160-166.
[11] Papadakis, E.P., 1963, “Ultrasonic attenuation and velocity in three transformation products
in steel”, Journal Acoustic Society of America. Vol. 35, Issue 11, pp. 1884-1884.
[12] Bhattachayra, D. K.; Jayakumar, T.; Palanichamy, P. & Raj, Baldev. (1994). Ultrasonic
Measurements for Microstructural Characterisation in 17-4 PH Steel Journal of Non-Destructive
Evaluation, 13., 15-21
[13] Raj, B.; Moorthy V.; Jaya kumar, T. & Rao K. B. S. (2003). Assessment of microstructures
and mechanical behaviour of metallic materials through non-destructive characterization,
International Materials Reviews, 48.,5.,273-325.
[14]R.Prasad, S.Kumar, J. Mater. Processing Technol. 42 (1994) 51-59
[15] R.Klinman, G.R.Webster, F.J.Marsh, E.T.Stephenson, Mater. Eval. 38 (1980) 26-32
[16] R.Klinmann, E.T. Stephenson, Mater. Eval. 39 (1981) 1116-1120.
[17] P.Palanichamy, M.Vasudevan, T.Jayakumar, S.Venugopal, B.Raj, NDT&E Int. 33 (2000)
253-259.
[18] Hecht, A., Thiel, R., Neumann, E. and Mundry, E. 'Nondestructive determination of grain
size in austenitic sheet by ultrasonic backscattering' Mater Eval 39 (1981) pp 934-938
325