high grade expanding copper-gold producer canada · of and anticipated costs of recovery of, ......
TRANSCRIPT
HIGH-GRADE EXPANDING COPPER-GOLD PRODUCER CANADA
NOVEMBER 2017 RAB TSXV RMM AIM

FORWARD LOOKING STATEMENTS
Caution Regarding Forward Looking Statements:
Certain information included in this presentation, including information relating to future financial or operating performance and other statements that express the expectations of management or estimates of future performance constitute “forward-looking statements”. Such forward-looking statements include, without limitation, statements regarding copper and gold forecasts for fiscal 2017 (including the information provided in any tables relating to production and concentrate forecasts for fiscal 2017), the financial strength of the Company, estimates regarding timing of future development and production and statements concerning possible expansion opportunities for the Company. Where the Company expresses or implies an expectation or belief as to future events or results, such expectation or belief are based on assumptions made in good faith and believed to have a reasonable basis. Such assumptions include, without limitation, the price of and anticipated costs of recovery of, copper concentrate and gold, the presence of and continuity of such minerals at modeled grades and values, the capacities of various machinery and equipment, the availability of personnel, machinery and equipment at estimated prices, mineral recovery rates, and others. However, forward-looking statements are subject to risks, uncertainties and other factors, which could cause actual results to differ materially from future results expressed, projected or implied by such forward-looking statements. Such risks include, but are not limited to, interpretation and implications of drilling and geophysical results; estimates regarding timing of future capital expenditures and costs towards profitable commercial operations. Other factors that could cause actual results, developments or events to differ materially from those anticipated include, among others, increases/decreases in production; volatility in metals prices and demand; currency fluctuations; cash operating margins; cash operating cost per pound sold; costs per ton of ore; variances in ore grade or recovery rates from those assumed in mining plans; reserves and/or resources; the ability to successfully integrate acquired assets; operational risks inherent in mining or development activities and legislative factors relating to prices, taxes, royalties, land use, title and permits, importing and exporting of minerals and environmental protection. Accordingly, undue reliance should not be placed on forward-looking statements and the forward-looking statements contained in this press release are expressly qualified in their entirety by this cautionary statement. The forward-looking statements contained herein are made as at the date hereof and the Company does not undertake any obligation to update publicly or revise any such forward-looking statements or any forward-looking statements contained in any other documents whether as a result of new information, future events or otherwise, except as required under applicable law. RMM’s qualified person, Mr. Larry Pilgrim, P. Geo., is responsible for verification and quality assurance of the exploration data and the analytical results set forth in this presentation. RMM is in full compliance with all NI43-101 rules and regulations.
2

WHY OWN RAMBLER?
3 *Note: Pending detailed engineering studies. **C1=Net direct cash costs per pound of saleable copper net of by-product credits
Location High Grade Copper Expanding Production
Newfoundland, Canada Stable, low-risk jurisdiction in historical
mining district
Rising Copper Market
Location
Phase I
650 mtpd
Phase II
Fall 2017
1250 mtpd
Phase III*
Throughput Increase
2,000 mtpd
Long Mine Life
20 Years ~16 M Pounds of Copper Annually
Improving C1 Costs
Targeting Decrease in C1 Costs**
Exploration
Recent Results Include: 102.0 meters of 1.65% Cu

THE RIGHT TEAM
4
Norman Williams, CPA, CA – President, CEO and Director +20 years of financial and management experience
Former CFO of Rambler 2010-2014
Peter Mercer – VP and Corp. Secretary
Geologist with +15 years of exploration and development experience
Tim Sanford, P. Eng. – VP Technical Services
+23 years of experience at various supervisory levels, primarily related to underground development and production
Scott Britton, P. Eng. – General Manager
+35 years experience in underground mining
Tim Slater, ACA, CTA – Interim CFO
MD of Harmer Slater Chartered Accountants in the United Kingdom
Bradford Mills –Director, Chair
+30 years in the resource industry. Founder and managing director of Plinian. Currently Executive Chairman at Mandalay Resources.
Glenn Poulter –Lead Director Executive MBA, Cass Business School, specializing in finance and strategy. +30 years of experience with financial services in the UK.
Mark Sander – Non-Executive Director
PhD in Ore Deposits and Exploration and active in the mineral resource industry for +25 years. President and CEO at Mandalay Resources.
Belinda Labatte– Non-Executive Director
MBA from Rotman School of Management and CFA charterholder. Chief Development Officer at Mandalay Resources.
Terrell Ackerman– Non-Executive Director
40+ years in the resource industry. Former interim CEO at Stillwater Mining.
Eason Chen – Non-Executive Director
Extensive knowledge and experience in Canadian and cross-border listings, corporate governance and internal controls.
BOARD OF DIRECTORS MANAGEMENT
Proven Team with a Track Record of Mine Development and Operations
5 5
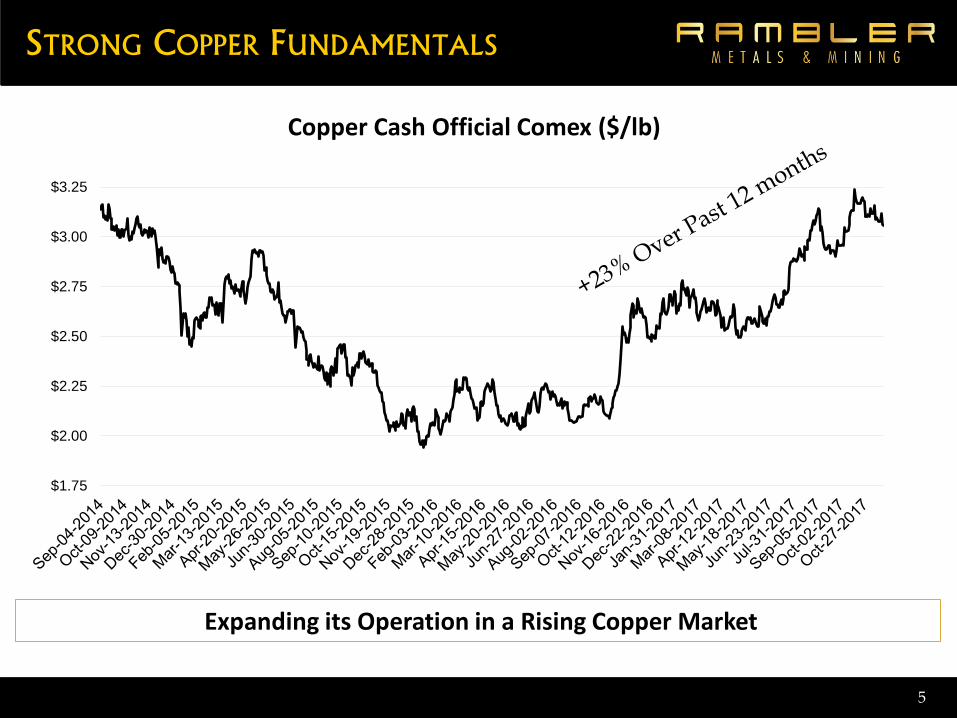
STRONG COPPER FUNDAMENTALS
$1.75
$2.00
$2.25
$2.50
$2.75
$3.00
$3.25
Copper Cash Official Comex ($/lb)
Expanding its Operation in a Rising Copper Market

SHARE STRUCTURE
6
Ticker RMM RAB
Share Price (November 16, 2017)
£ 0.081 $ 0.13 CAD
52 Week Range (£0.08-£0.13) ($0.11-$0.22)
Daily Volume 55,000 18,000
Market Cap. £ 44 M $ 71 M CAD
Shares Outstanding 549 M
Options 13 M
Warrants (£ 0.05 June 2018) 65 M
Cash $2 M
Shareholders As of November 15, 2017
Institutional Shareholders
CE Mining II 72%
Lombard Odier 6%
CI Global Investments 5%
Tinma International 4%
UBS Asset Management 3%
Float & Retail Network 10%
Strong Institutional Shareholder Support
Unless otherwise indicated all currency is USD
COPPER-GOLD PRODUCTION
7
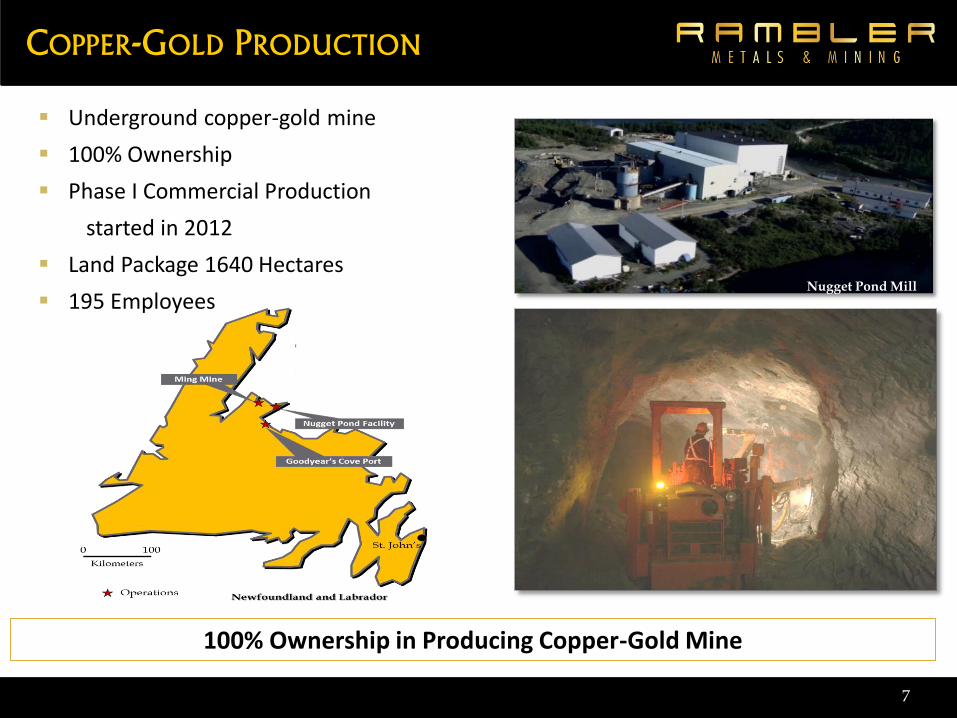
Underground copper-gold mine
100% Ownership
Phase I Commercial Production
started in 2012
Land Package 1640 Hectares
195 Employees
100% Ownership in Producing Copper-Gold Mine
Nugget Pond Mill

Block 1
Block 2
Block 3
Block 4
Block 5
Block 6
Historical Shaft
Lower Footwall Zone
1800 lv
Ramp
8
MING COPPER-GOLD MINE
8
Mineral Reserve Classification
T (‘000)
Cu (%)
Au (g/t)
Cu M lbs
Au K Oz
Proven* 5,205 1.98 0.43 226.9 71.6
Probable* 3,050 1.99 0.76 133.8 74.2
Total Reserve (diluted, recovered)
8,667 1.79 0.48 341.2 133.5
Note: Proven and Probable (undiluted and unrecovered) See Appendix for further detail
Development
Longhole Drilling
Drilled Stope
Blasted Ore
Modified Sub-level Longhole Mining
Transverse Long-hole Mining
Post Pillar Cut and Fill Mining
Phase II Expansion Focuses on the Addition of LFZ Ore into the Production Profile

PHASE II EXPANSION NEAR COMPLETE
9
Targeting sustained production of 1,250 mtpd in November 2017, currently averaging 1,246 mtpd
Phase II near complete after 14 months of mine optimization and development
Multiple LFZ stopes now in production
Ventilation upgrade project in progress
High grade / lower cost ore from LFZ stopes will result in lower copper cost per pound
Addition of a paste plant (2018/19)
Expansion of existing tailings dams (2019)
Phase II Expansion Continues: Targeting 1,250 tpd Fall 2017

$0.00
$0.50
$1.00
$1.50
$2.00
$2.50
$3.00
$3.50
0
0.5
1
1.5
2
2.5
3
3.5
4
Q1/2017 Q2/2016 Q3/2016 Q4/2016 Stub 20175 Month Period
Q1 2017 Q2 2017 Q3 2017
C1 C
ost
Po
un
ds
of
Sale
ab
le C
u i
n M
illi
on
s
Pounds of Saleable Cu and C1 Cost
Saleable CU, M lbs C1 $US
CURRENT PRODUCTION & COSTS
10
With the main LFZ stope production coming online mill feed grade is improving allowing the cost per pound of production to reduce
This will continue to drive C1 costs downward
The goal is to provide flexibility for the mine to operate in varying copper price environments
Stub 2017 : 5 month period from Aug. 1- Dec. 31, 2016 – transition to calendar year-end
Phase II Development Underway
*C1 – net direct cash cost per pound of saleable copper net of by-product credits
Phase II Expansion: Optimize and Improve Operating Efficiencies

FINANCIAL KPIS @ 1,250 MTPD
11 * Data source NI43-101 July 2015 Technical Report with base case KPI’s represented at long-term Cu of $2.79/lb
$0
$5,000
$10,000
$15,000
$20,000
$25,000
$2.25 $2.65 $2.79 $3.00 $3.25
000'
s p
er a
nn
um
USD $Cu/lb
EBITDA Net Operating Cash Free Cash
Attractive Financial Profile at Varying Copper Prices

FINANCIAL RESULTS & GUIDANCE ALL AMOUNTS IN $US ‘000S, UNLESS OTHERWISE STATED.
12 * C1=Net direct cash costs per pound of saleable copper net of by-product credits ** Revised Guidance as of November 2, 2017
2017 Q3 Q2 Q1
Revenue (M) $7.3 $6.9 $5.7
EBITDA (M) $1.1 $1.2 ($1.5)
Cash Flows from Ops. (M)
($2.5) $0.5 ($2.1)
C1 Cash Costs * $2.87 $2.44 $3.39
Copper (tonnes) 1,004 1,112 794
Gold (ounces) 930 939 391
Concentrate Copper (%)
28.9 26.6 28.2
Concentrate Gold (g/t)
9.9 7.7 5.2
Average Copper Price
$2.86 $2.56 $2.63
Fiscal 2017 Guidance**
Dry Tonnes Milled 330,000 - 360,000
Copper Recovery (%) 94 – 96
Gold Recovery (%) 60 –65
Copper Head Grade (%) 1.3 - 1.6
Gold Head Grade (g/t) 0.5 - 1.0
Concentrate Copper (%) 26 - 28
Concentrate Gold (g/t) 4.0 - 8.0
Dry Tonnes Produced 14,000 - 16,000
Copper (tonnes) 3,800 – 4,200
Copper (M lbs) 8.5 – 9.5
Gold (ounces ) 3,400 – 3,900
Improving Quarter over Quarter Financial and Operating Results in 2017
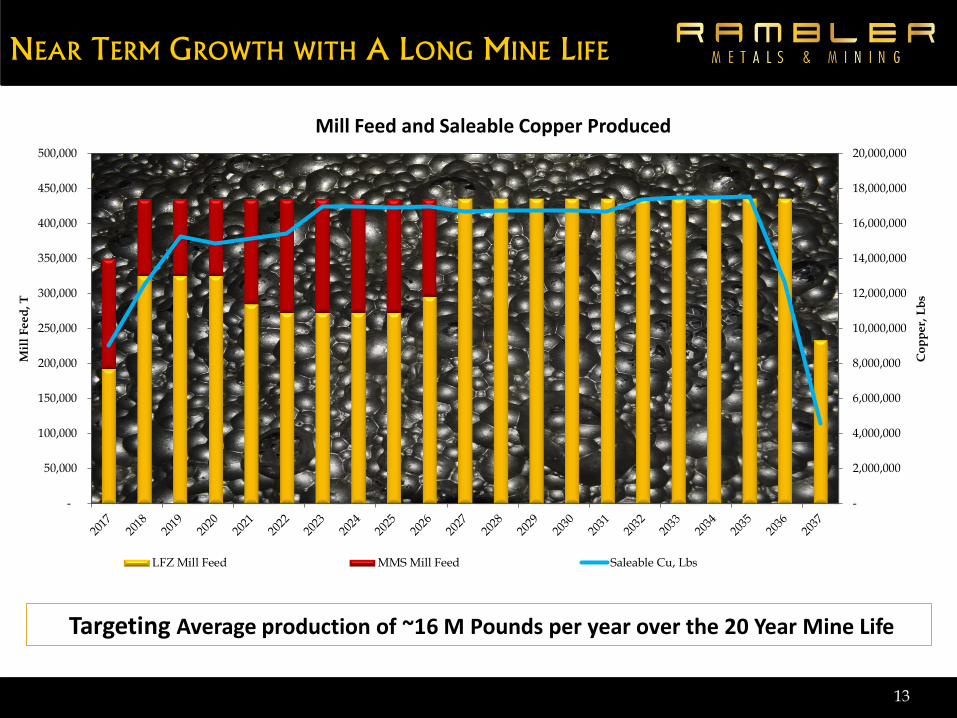
NEAR TERM GROWTH WITH A LONG MINE LIFE
13
Targeting Average production of ~16 M Pounds per year over the 20 Year Mine Life
-
2,000,000
4,000,000
6,000,000
8,000,000
10,000,000
12,000,000
14,000,000
16,000,000
18,000,000
20,000,000
-
50,000
100,000
150,000
200,000
250,000
300,000
350,000
400,000
450,000
500,000
Co
pp
er,
Lb
s
Mil
l F
ee
d, T
Mill Feed and Saleable Copper Produced
LFZ Mill Feed MMS Mill Feed Saleable Cu, Lbs

14
FUTURE GROWTH OPPORTUNITIES
Further Expansion – Phase III
Increase ore throughput beyond 1,250 mtpd - targeting 2,000 mtpd
Considerations/benefits include:
I. UG material handling options including potential rehab of old shaft to hoist 2,000 mtpd
II. Improved project economics with higher annual copper output and lower unit costs
Initiate further Engineering studies – including a Definitive Feasibility Study (‘DFS’)
14
SHAFT
Further Expansion Opportunities to Increase Production to 2,000 mtpd

EXPLORATION POTENTIAL - MMS
15
1807 Zone
Ming South Zone
Ming North Zone
1806 Zone
Previous Mining Horizon Recent Intersection of:
16.8 m of 1.8% Cu with 1.8 g/t Au
1800 ft lv
RM03-02 intersected
4.1 meters of 3.0 % Cu with 2.8 g/t Au ~1 km beyond historic workings
All Zones Remain Open at Depth
Surface Surface Portal
East West
Short term exploration focused on:
1. Continued Replacement of Reserves & Resources
2. Explore down-plunge of current mining fronts
3. Outward exploration to test extents of known mineralization
Exploration has been successful
in replacing MMS reserves year
over year
With further drilling there is the
potential for new sources of high
grade massive sulphides for the
operation
Ming North Zone (MNZ) was
historically the primary mining
horizon however remains
largely unexplored at depth
Recent Ming North Zone has
shown continued mineralization
at depth. Highlights include:
• R17-675-04: 4.00 m of 3.17% Cu with 6.56 g/t Au
• R17-675-05: 21.00 m of 3.10% Cu with 1.13 g/t Au
• R17-675-07: 17.97 m of 2.79% Cu with 1.73 g/t Au

3D Isometric View Looking North West
SURFACE DRILL PROGRAM ONGOING
Surface drilling indicating grades
and thickness are improving
with depth
Recent drill results extend
mineralization 550 m Down-dip
of Current Mineral Resource
New drill program ongoing
testing up to 1 km of
unexplored ground
RM17-25c
LFZ: 102.0 meters of 1.65% Cu
Including 35.8 meters of 2.59% Cu
Including 27.0 meters of 1.98 % Cu
40.00 meters of 1.42% Cu
including 7.57 meters of 2.27% Cu
Drilling Continues Testing Beyond the Known Mineralization
16
MMS: Lower lens
6.30 meters of
2.85% Cu and 2.99
g/t Au

SAFETY & HEALTH
17
• 1 lost time accident since the start of construction in 2011
• 2,240 Days Since Last Lost Time Accident (1044 Days since last medical aid)
• Fiscal 2017 TIFR Target < 3
• Over 2.4 million person hours worked on the project to date
Winner of the 2016 John T Ryan Safety Award from the Canadian Institute of
Mining, Metallurgy and Petroleum ('CIM')
• No reportable exceedances or environmental incidents in 3 fiscal years
• Strong commitment to safety and environment
• Committed to community engagement with a focus on regional benefits
ENVIRONMENT & COMMUNITY
SAFETY, HEALTH, ENVIRONMENT & COMMUNITY
4
6
2 1
2
4.3
6.4
1.14 0.57 1.26
0 0
0
1
2
3
4
5
6
7
0
5
10
15
2011 2012 2013 2014 2015 2016 2017
Freq
uen
cy R
ate
Nu
mb
er
Fiscal Year
Fatalities Lost Times Medical Aids Total Injury Freq. Rate
Construction
Production
Exceptional Health, Safety and Environmental Record

Near Term Focus – Phase II
Optimize and improve operating efficiencies with production at 1,250 mtpd
Continue with exploration and delineation drilling programs to replace and extend known ore bodies
Update NI 43-101 Technical Report
Longer Term Strategy - Phase III
Further advance engineering studies targeting production at 2,000 mtpd
Initiate a Definitive Feasibility Study
With expansion plans on track, we continue to review M&A opportunities on an opportunistic basis
18
LOOKING FORWARD
Producing High Grade Copper-Gold Miner
Executing an Expansion in an Upward Trending Copper Market

Producing High Grade Copper-Gold Executing Operations Expansion in
an Upward Trending Copper Market
Rambler Metals & Mining PLC Salatin House 19 Cedar Road Sutton Surrey, SM2 5DA United Kingdom Tel: +44(0) 20 8652 2700 Fax: +44(0) 20 8652 2719
Rambler Metals & Mining Canada Ltd P.O. Box 610 Baie Verte, NL, A0K 1B0 Route # 418 Ming's Bight Road, NL Tel: 709-800-1929 Fax: 709-800-1921

MINERAL RESERVE AND RESOURCE (RESERVE AS OF 20 JULY 2015)
20
Classification
Quantity Grade Contained Metal
tonnes Copper
% Gold g/t
Silver g/t
Zinc %
Copper M lbs
Gold K oz
Silver K oz
Zinc M lbs
Total Proven Reserve (undiluted, unrecovered)
5,205,300 1.98 0.43 3.08 0.07 226.9 71.6 515.5 8.4
Total Probable Reserve (undiluted, unrecovered)
3,050,100 1.99 0.76 3.19 0.10 133.8 74.2 312.4 6.6
Dilution (all sources) 1,374,500 0.61 0.06 0.70 0.01 18.5 2.6 30.7 0.3
Reserve (diluted and recovered) 8,667,000 1.79 0.48 2.77 0.07 341.2 133.5 772.8 13.8
Mineral Reserve Estimate Summary for the Ming Copper-Gold Mine 1 (Resources are Inclusive of Reserves)
Mineral Resource Estimate Summary for the Ming Copper-Gold Mine(2)
Measured Total 19,127 1.50 0.23 1.90 0.05 632.0 141.8 1,167.9 19.9
Indicated Total 9,199 1.53 0.39 2.07 0.07 310.5 115.3 613.5 14.3
M&I Total 28,326 1.51 0.28 1.96 0.05 942.5 257.1 1,781.4 34.2
Inferred Total 5,086 1.51 0.66 3.75 0.21 169.7 107.8 613.4 23.6

LOWER FOOTWALL ZONE RESOURCE (COPPER CUT-OFF SENSITIVITY)
21
Copper Cut-off Grade
Quantity Grade Contained Metal
(000't) Copper
% Gold g/t
Silver g/t
Zinc %
Copper lbs
Gold oz
Silver oz
Zinc lbs
0.25 68,622 0.96 0.09 0.98 0.02 1,451,097,627 193,484 2,159,594 29,245,136
0.50 57,632 1.07 0.09 1.05 0.02 1,357,287,418 169,203 1,942,167 24,593,816
0.75 40,936 1.25 0.10 1.16 0.02 1,126,324,596 128,553 1,527,440 17,296,650
1.00 25,958 1.47 0.11 1.28 0.02 839,593,090 87,667 1,071,175 10,875,301
1.25 16,025 1.69 0.11 1.41 0.02 595,434,650 57,649 727,852 6,574,685
1.50 9,427 1.91 0.12 1.56 0.02 396,656,024 36,580 472,111 3,845,516
1.75 5,380 2.13 0.13 1.73 0.02 252,605,662 22,393 298,499 2,220,336
2.00 2,860 2.36 0.14 1.88 0.02 149,083,363 12,685 172,891 1,203,654
Measured and Indicated Mineral Resource Estimate Combined
(1) All figures are rounded to reflect the accuracy of the estimate; numbers may not total due to this rounding. This reserve statement reflects changes to reserves in the massive sulphides based on depletion due to mining and additions due to new exploration drilling results. The NSR for the reserve material was calculated using an all-in costs of $147 per tonne of ore milled for the massive sulphides and $118 per tonne of ore milled for the lower footwall zone. Forecast long term metal prices of USD$2.79 per pound copper and USD$1,100 per ounce gold, and USD$15.50 per ounce silver with a long term USD/CDN FX rate of 1:0.88.
(2) Mineral Resources are not Mineral Reserves and have not demonstrated economic viability. All figures are rounded to reflect the accuracy of the estimate. Cut‐off grades of 1.0 per cent copper for the massive sulphides, 1.25 grams per tonne gold for any gold zones and 1.00 per cent copper for the stringer sulphides have been used in the estimate. Cut‐offs are based on an NSR model and forecast long term metal prices of USD$2.79 per pound copper and USD$1,100 per ounce gold, and USD$15.50 per ounce silver with a long term USD/CDN FX rate of 1:0.88. Zinc does not contribute to the revenues. Resources are inclusive of reserves.