high growth area in western states -...
TRANSCRIPT
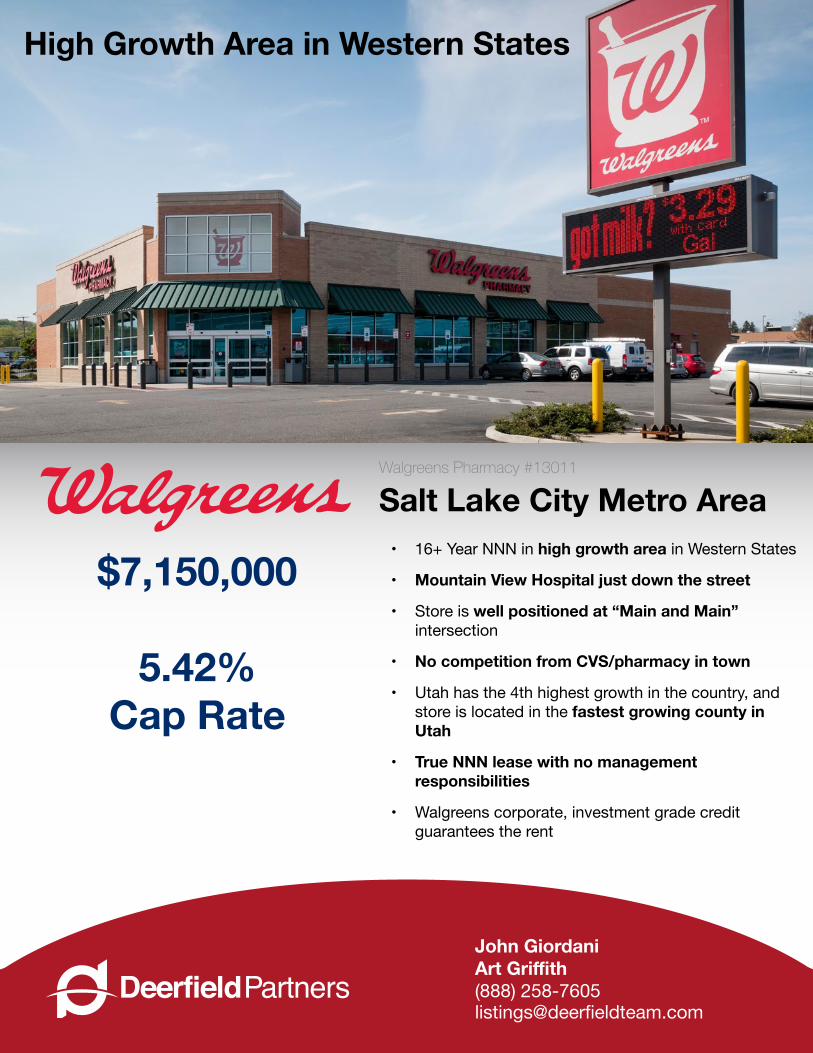
Walgreens Pharmacy #13011 Salt Lake City Metro Area
• 16+ Year NNN in high growth area in Western States
• Mountain View Hospital just down the street
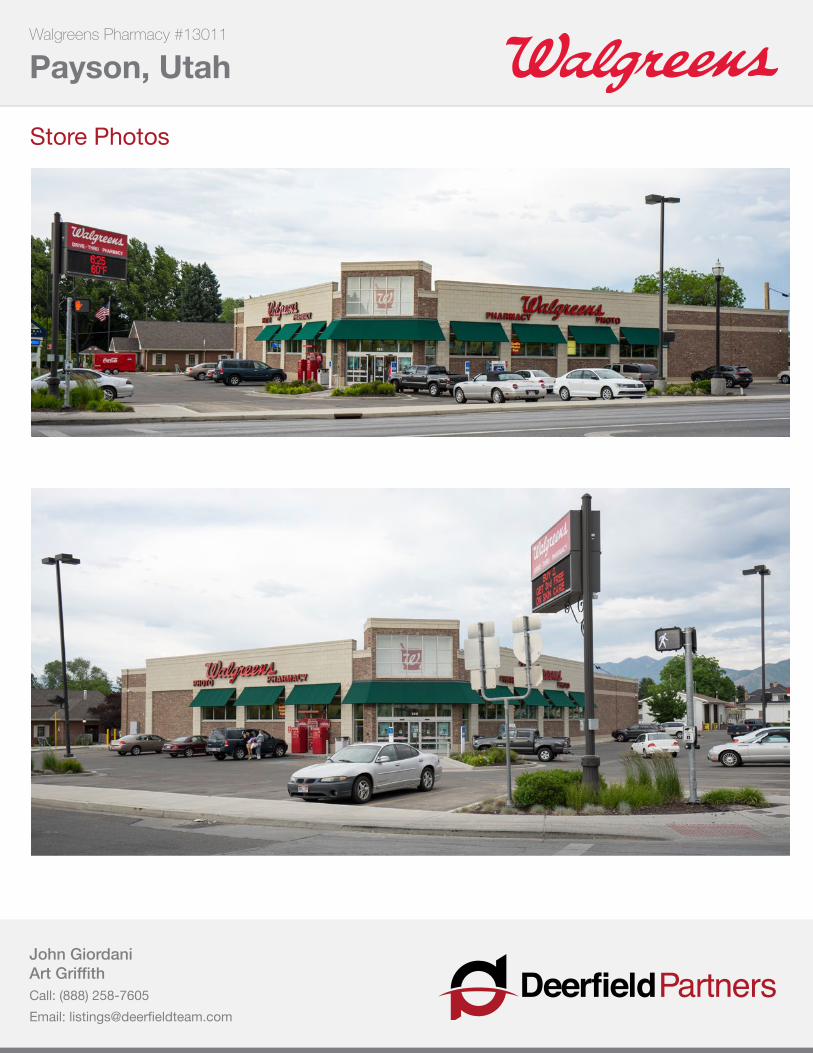
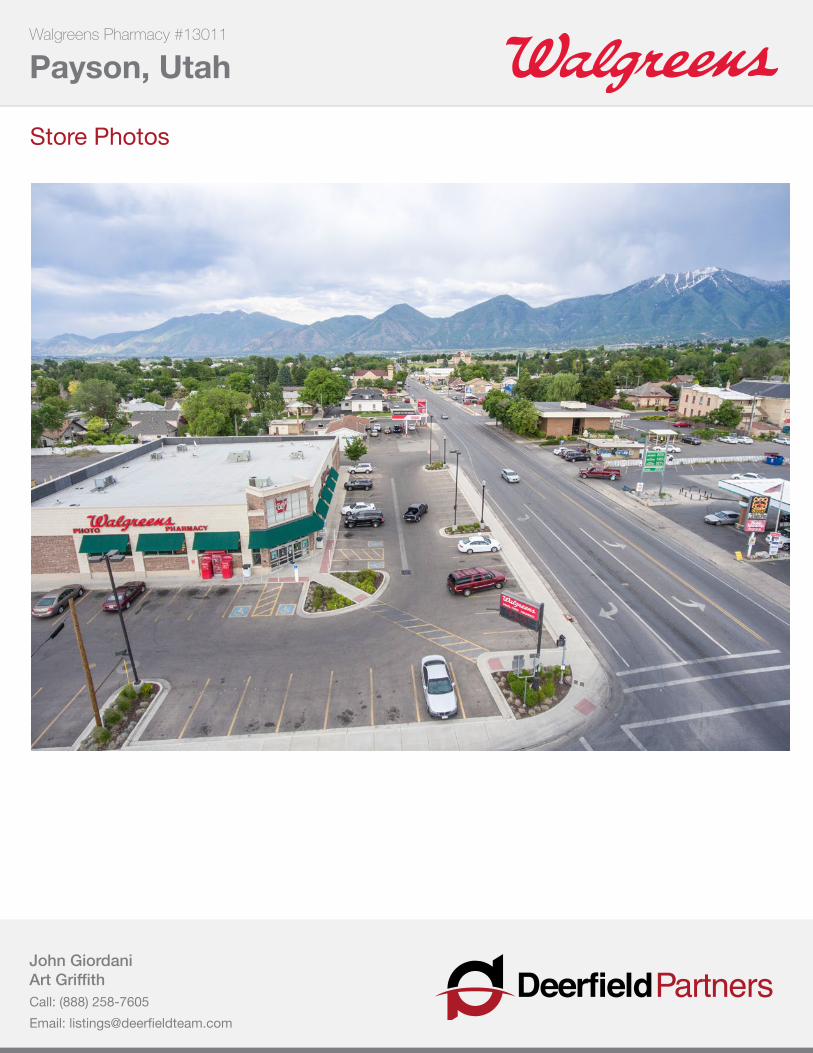
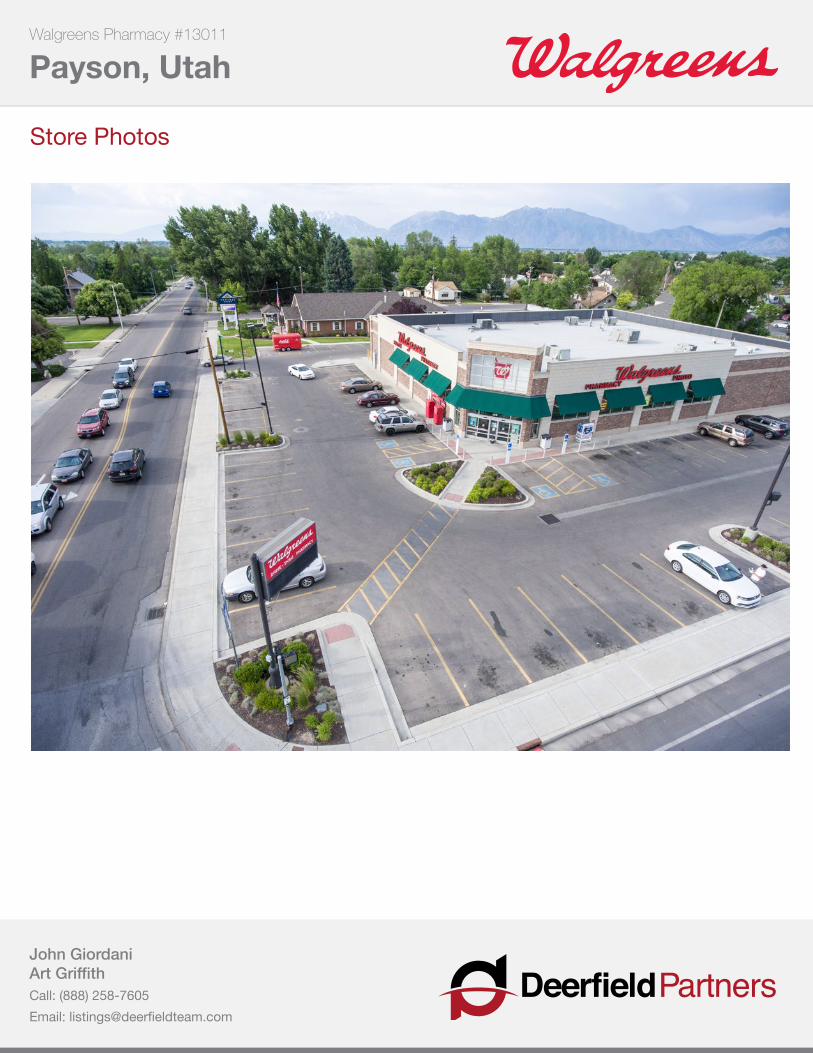
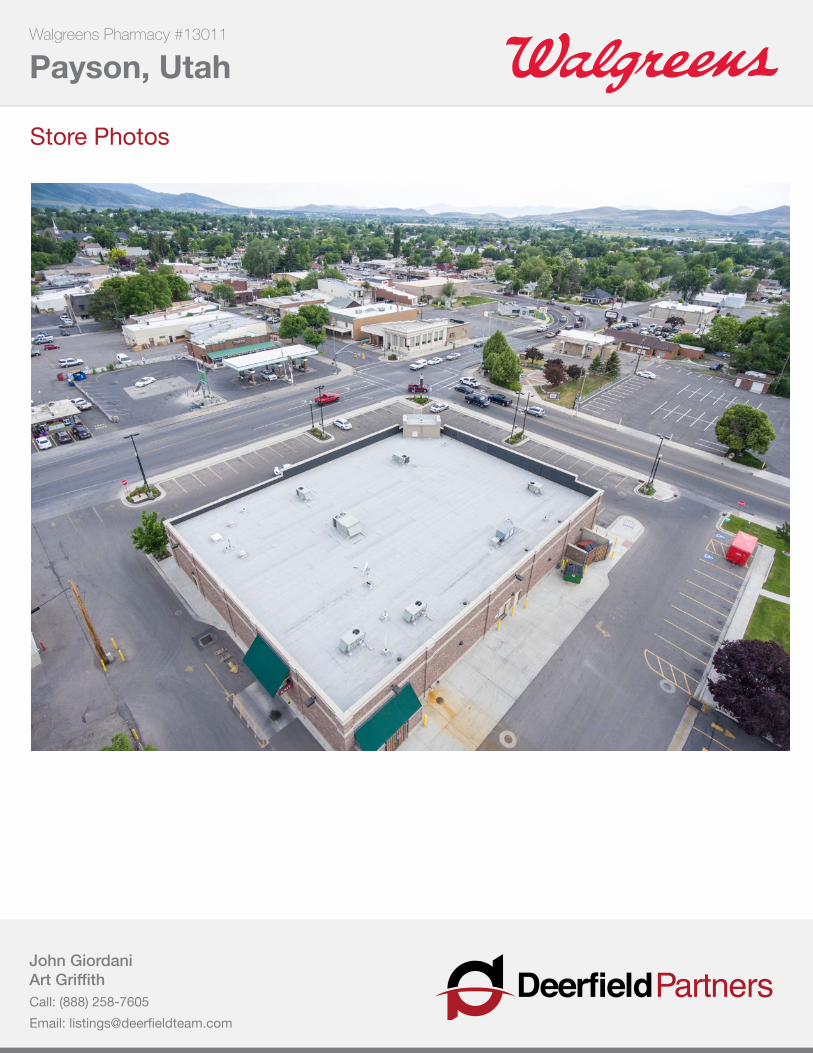
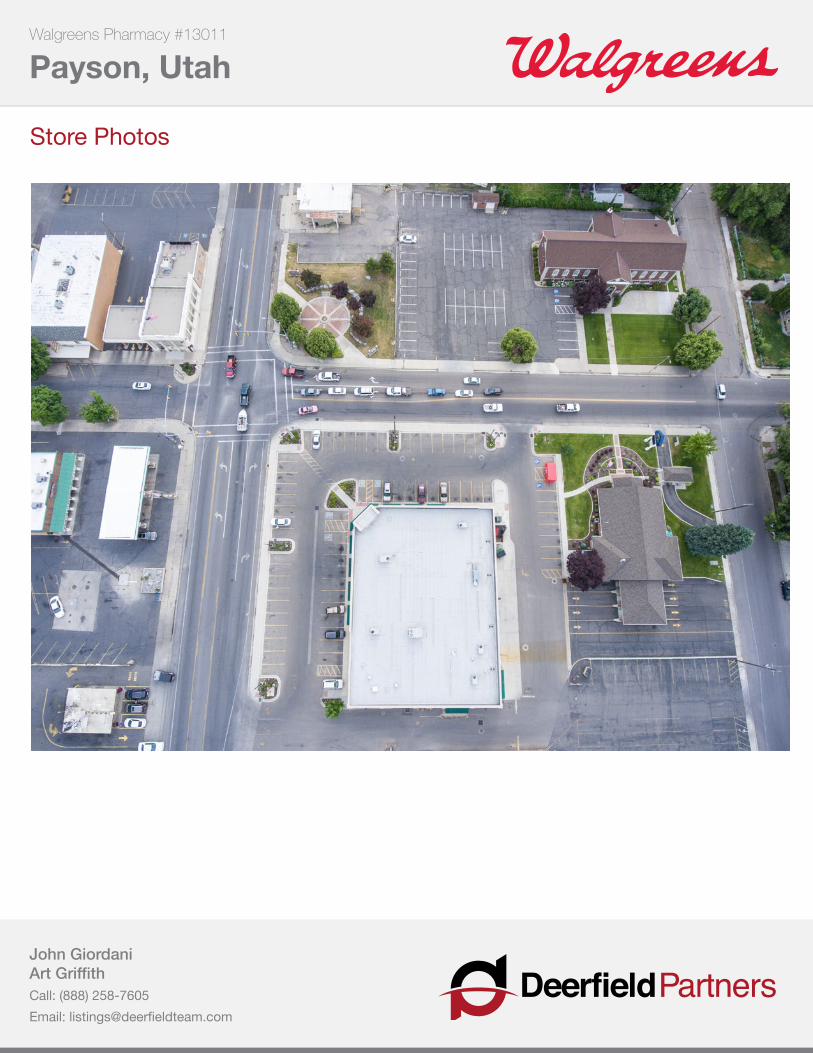
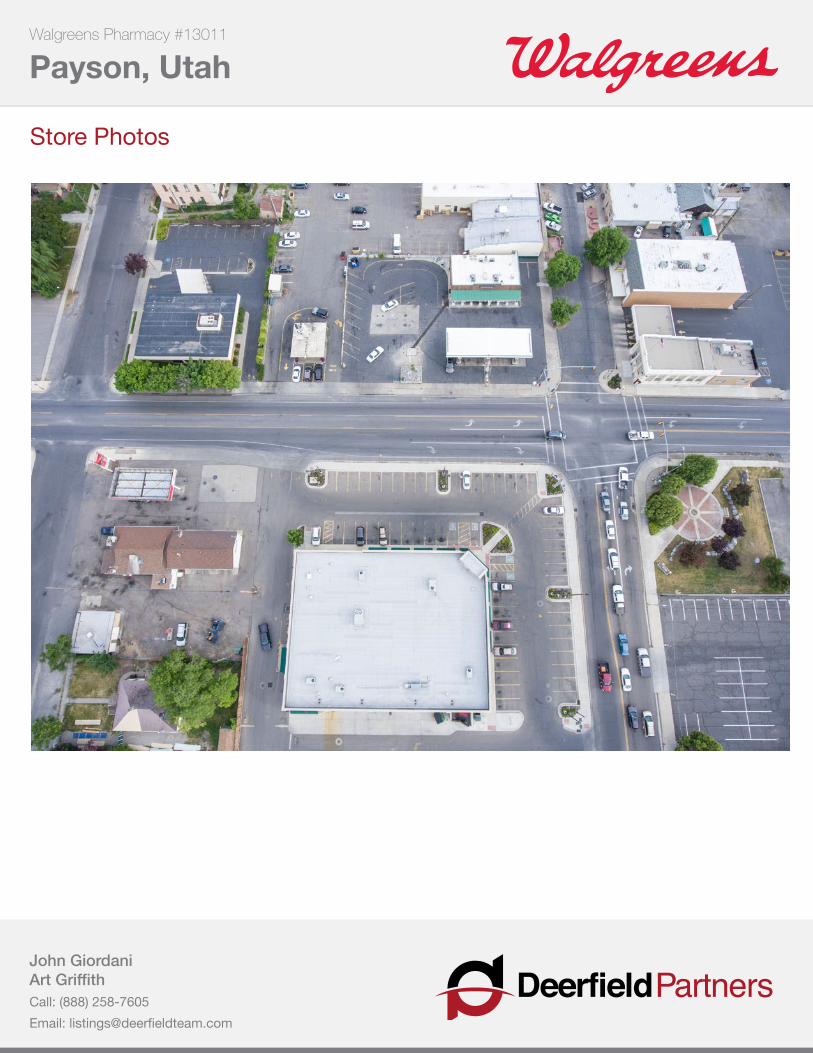
• Store is well positioned at “Main and Main” intersection
• No competition from CVS/pharmacy in town
• Utah has the 4th highest growth in the country, and store is located in the fastest growing county in Utah
• True NNN lease with no management responsibilities
• Walgreens corporate, investment grade credit guarantees the rent
DeerfieldPartnersJohn GiordaniArtGriffith(888) [email protected]
$7,150,000
5.42%Cap Rate
High Growth Area in Western States
Walgreens Pharmacy #13011 Payson, Utah
DeerfieldPartnersJohn GiordaniArt GriffithCall: (888) 258-7605Email: [email protected]
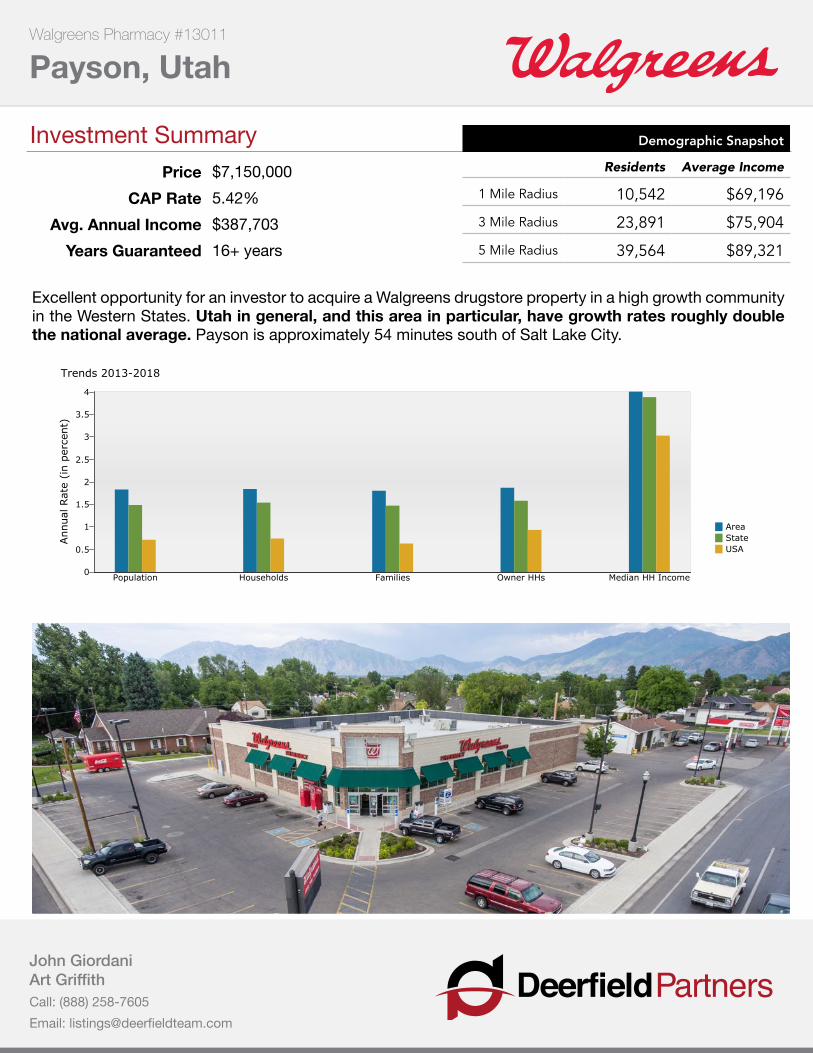
Excellent opportunity for an investor to acquire a Walgreens drugstore property in a high growth community intheWesternStates.Utah in general, and this area in particular, have growth rates roughly double the national average. Paysonisapproximately54minutessouthofSaltLakeCity.
Investment SummaryPrice $7,150,000
CAP Rate 5.42%Avg. Annual Income $387,703
Years Guaranteed 16+ years
Demographic Snapshot
Residents Average Income
1 Mile Radius 10,542 $69,196
3 Mile Radius 23,891 $75,904
5 Mile Radius 39,564 $89,321
Demographic and Income Profile132 N Main St, Payson, Utah, 84651 Prepared by Art GriffithPayson UTRing: 5 mile radius Latitude: 40.044920997
Longitude: -111.7322543
AreaStateUSA
Trends 2013-2018
Population Households Families Owner HHs Median HH Income
Annual
Rat
e (i
n p
erce
nt)
4
3.5
3
2.5
2
1.5
1
0.5
0
20132018
Population by Age
0-4 5-9 10-14 15-19 20-24 25-34 35-44 45-54 55-64 65-74 75-84 85+
Perc
ent
14
13
1211
10
9
87
6
5
4
32
1
0
2013 Household Income
<$15K5.0%
$15K - $24K7.4%
$25K - $34K9.6%
$35K - $49K11.8%
$50K - $74K26.4%
$75K - $99K18.0%
$100K - $149K16.0%
$150K - $199K3.6%
$200K+2.3%
2013 Population by Race
White Black Am. Ind. Asian Pacific Other Two+
Perc
ent
90
80
70
60
50
40
30
20
10
0
2013 Percent Hispanic Origin: 10.3%
August 28, 2014
©2014 Esri Page 6 of 6
Source: U.S. Census Bureau, Census 2010 Summary File 1. Esri forecasts for 2013 and 2018.
Walgreens Pharmacy #13011 Payson, Utah
DeerfieldPartnersJohn GiordaniArt GriffithCall: (888) 258-7605Email: [email protected]
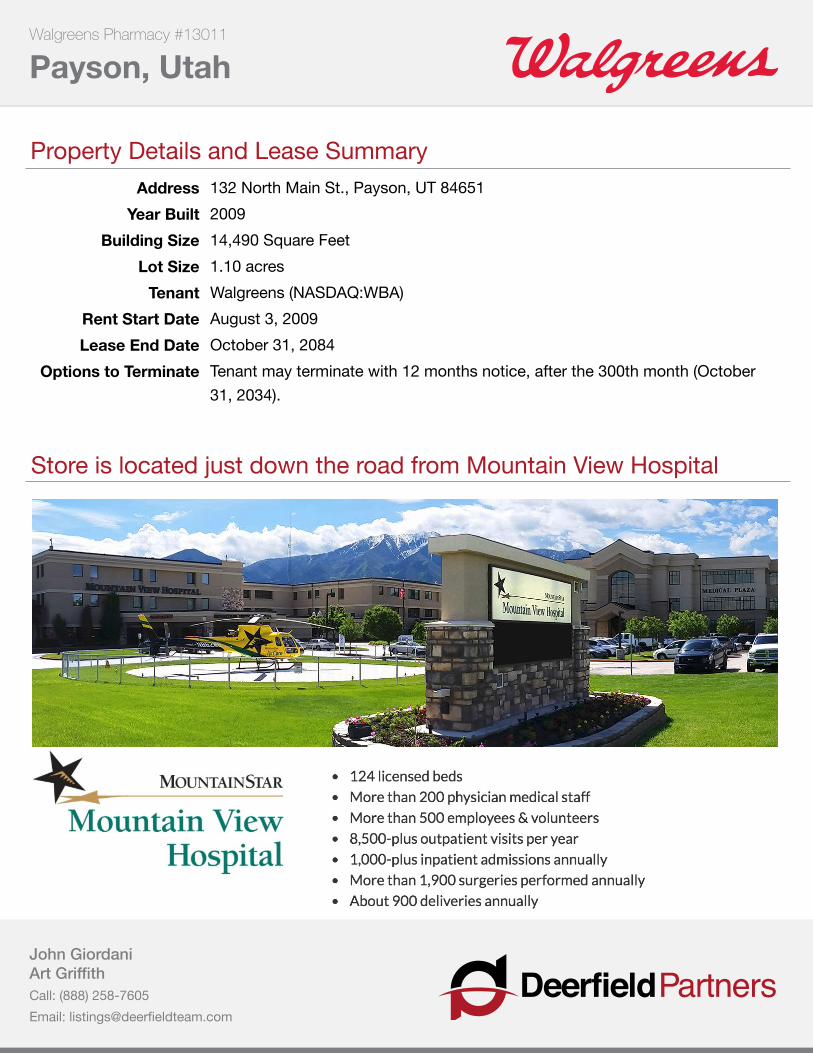
Store is located just down the road from Mountain View Hospital
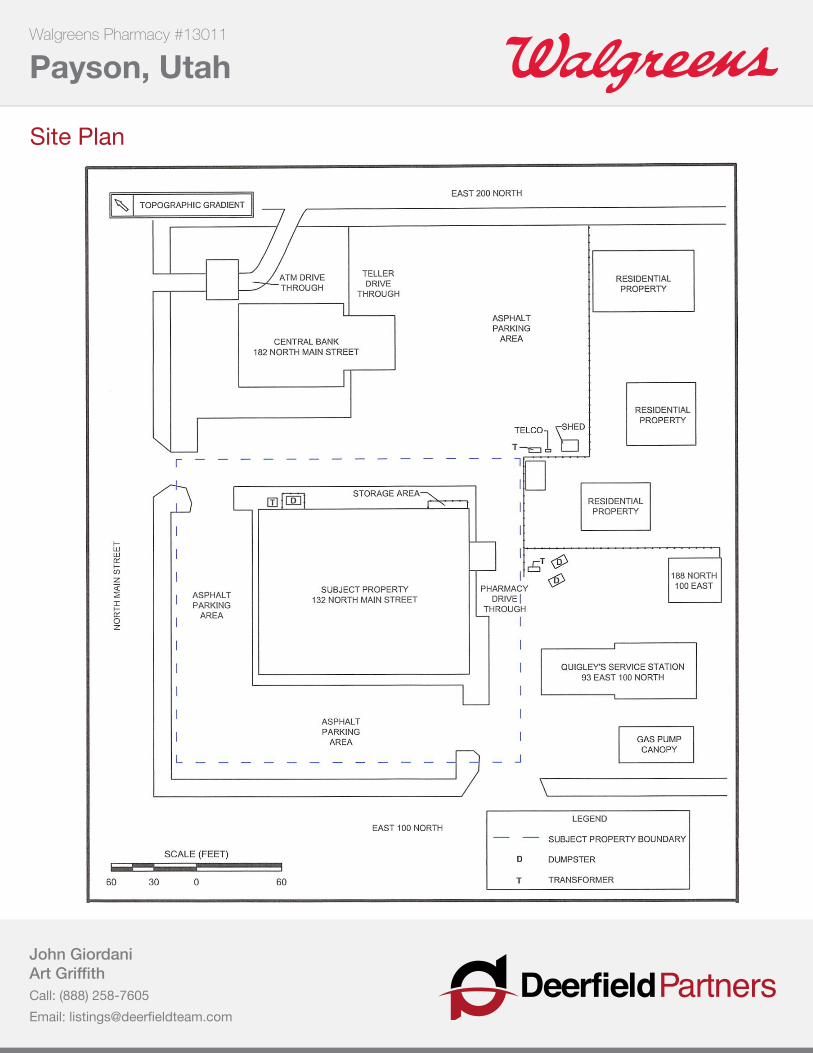
Property Details and Lease SummaryAddress 132NorthMainSt.,Payson,UT84651
Year Built 2009Building Size 14,490 Square Feet
Lot Size 1.10acresTenant Walgreens (NASDAQ:WBA)
Rent Start Date August 3, 2009Lease End Date October 31, 2084
Options to Terminate Tenantmayterminatewith12monthsnotice,afterthe300thmonth(October31,2034).
Walgreens Pharmacy #13011 Payson, Utah
DeerfieldPartnersJohn GiordaniArt GriffithCall: (888) 258-7605Email: [email protected]
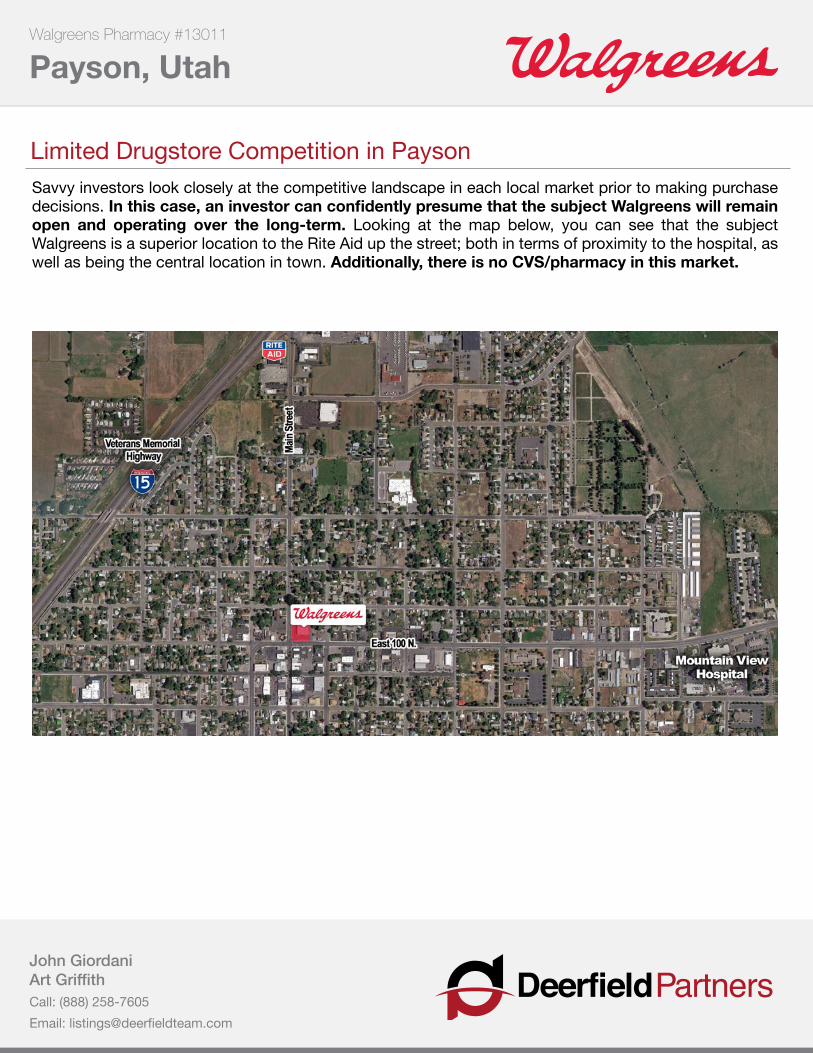
Limited Drugstore Competition in PaysonSavvy investors look closely at the competitive landscape in each local market prior to making purchase decisions.Inthiscase,aninvestorcanconfidentlypresumethatthesubjectWalgreenswillremainopen and operating over the long-term. Looking at the map below, you can see that the subject Walgreens is a superior location to the Rite Aid up the street; both in terms of proximity to the hospital, as wellasbeingthecentrallocationintown.Additionally, there is no CVS/pharmacy in this market.
Walgreens Pharmacy #13011 Payson, Utah
DeerfieldPartnersJohn GiordaniArt GriffithCall: (888) 258-7605Email: [email protected]
Store Photos
Walgreens Pharmacy #13011 Payson, Utah
DeerfieldPartnersJohn GiordaniArt GriffithCall: (888) 258-7605Email: [email protected]
Store Photos
Walgreens Pharmacy #13011 Payson, Utah
DeerfieldPartnersJohn GiordaniArt GriffithCall: (888) 258-7605Email: [email protected]
Store Photos
Walgreens Pharmacy #13011 Payson, Utah
DeerfieldPartnersJohn GiordaniArt GriffithCall: (888) 258-7605Email: [email protected]
Store Photos
Walgreens Pharmacy #13011 Payson, Utah
DeerfieldPartnersJohn GiordaniArt GriffithCall: (888) 258-7605Email: [email protected]
Store Photos
Walgreens Pharmacy #13011 Payson, Utah
DeerfieldPartnersJohn GiordaniArt GriffithCall: (888) 258-7605Email: [email protected]
Store Photos
Walgreens Pharmacy #13011 Payson, Utah
DeerfieldPartnersJohn GiordaniArt GriffithCall: (888) 258-7605Email: [email protected]
Site Plan
Walgreens Pharmacy #13011 Payson, Utah
DeerfieldPartnersJohn GiordaniArt GriffithCall: (888) 258-7605Email: [email protected]
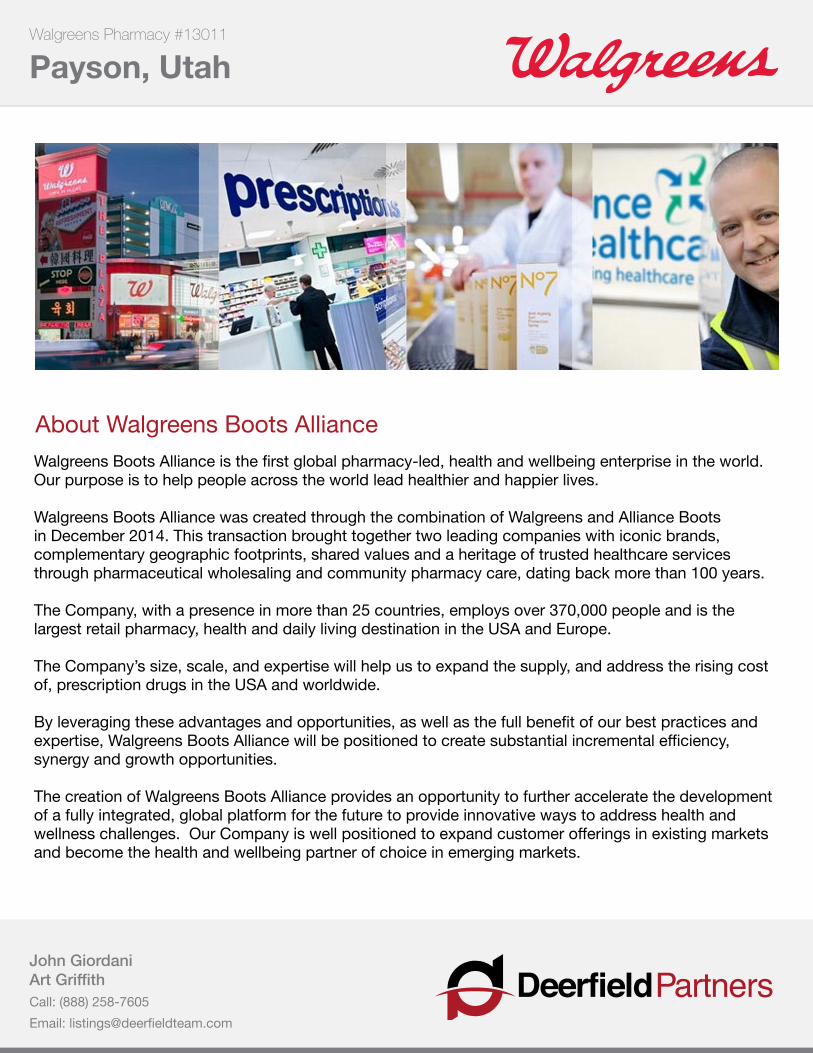
About Walgreens Boots AllianceWalgreensBootsAllianceisthefirstglobalpharmacy-led,healthandwellbeingenterpriseintheworld.Ourpurposeistohelppeopleacrosstheworldleadhealthierandhappierlives. Walgreens Boots Alliance was created through the combination of Walgreens and Alliance Boots inDecember2014.Thistransactionbroughttogethertwoleadingcompanieswithiconicbrands,complementary geographic footprints, shared values and a heritage of trusted healthcare services throughpharmaceuticalwholesalingandcommunitypharmacycare,datingbackmorethan100years.
TheCompany,withapresenceinmorethan25countries,employsover370,000peopleandisthelargestretailpharmacy,healthanddailylivingdestinationintheUSAandEurope.
TheCompany’ssize,scale,andexpertisewillhelpustoexpandthesupply,andaddresstherisingcostof,prescriptiondrugsintheUSAandworldwide.
Byleveragingtheseadvantagesandopportunities,aswellasthefullbenefitofourbestpracticesandexpertise,WalgreensBootsAlliancewillbepositionedtocreatesubstantialincrementalefficiency,synergyandgrowthopportunities.
ThecreationofWalgreensBootsAllianceprovidesanopportunitytofurtheracceleratethedevelopmentof a fully integrated, global platform for the future to provide innovative ways to address health and wellnesschallenges.OurCompanyiswellpositionedtoexpandcustomerofferingsinexistingmarketsandbecomethehealthandwellbeingpartnerofchoiceinemergingmarkets.
Walgreens Pharmacy #13011 Payson, Utah
DeerfieldPartnersJohn GiordaniArt GriffithCall: (888) 258-7605Email: [email protected]
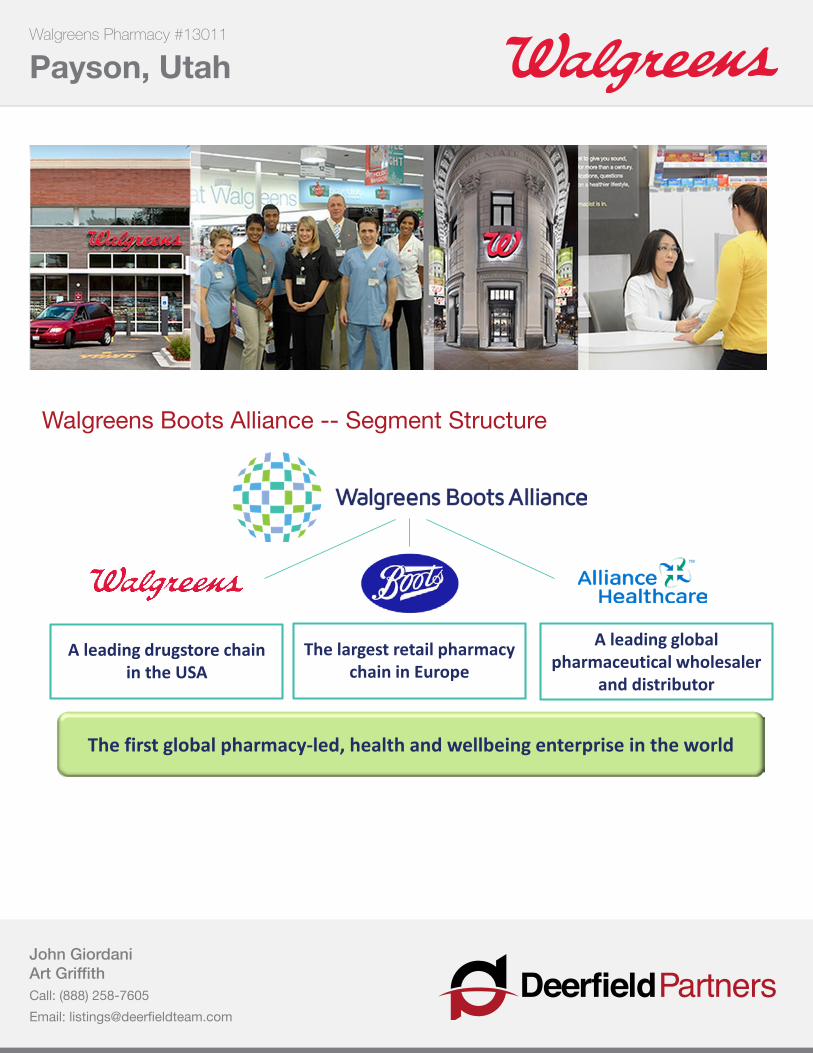
Walgreens Boots Alliance -- Segment Structure
8
Walgreens Boots Alliance – Segment Structure
The largest retail pharmacy chain in Europe
A leading global pharmaceutical wholesaler
and distributor
A leading drugstore chain in the USA
The first global pharmacy-led, health and wellbeing enterprise in the world
Walgreens Pharmacy #13011 Payson, Utah
DeerfieldPartnersJohn GiordaniArt GriffithCall: (888) 258-7605Email: [email protected]
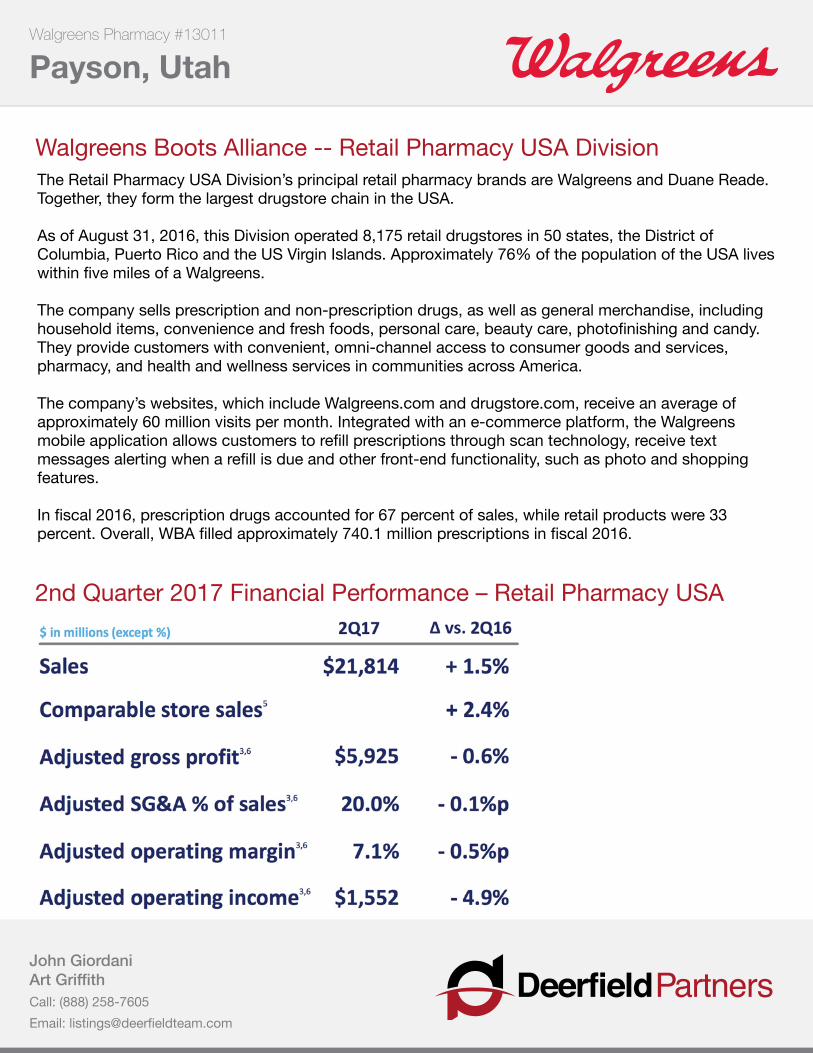
Walgreens Boots Alliance -- Retail Pharmacy USA DivisionTheRetailPharmacyUSADivision’sprincipalretailpharmacybrandsareWalgreensandDuaneReade.Together,theyformthelargestdrugstorechainintheUSA.
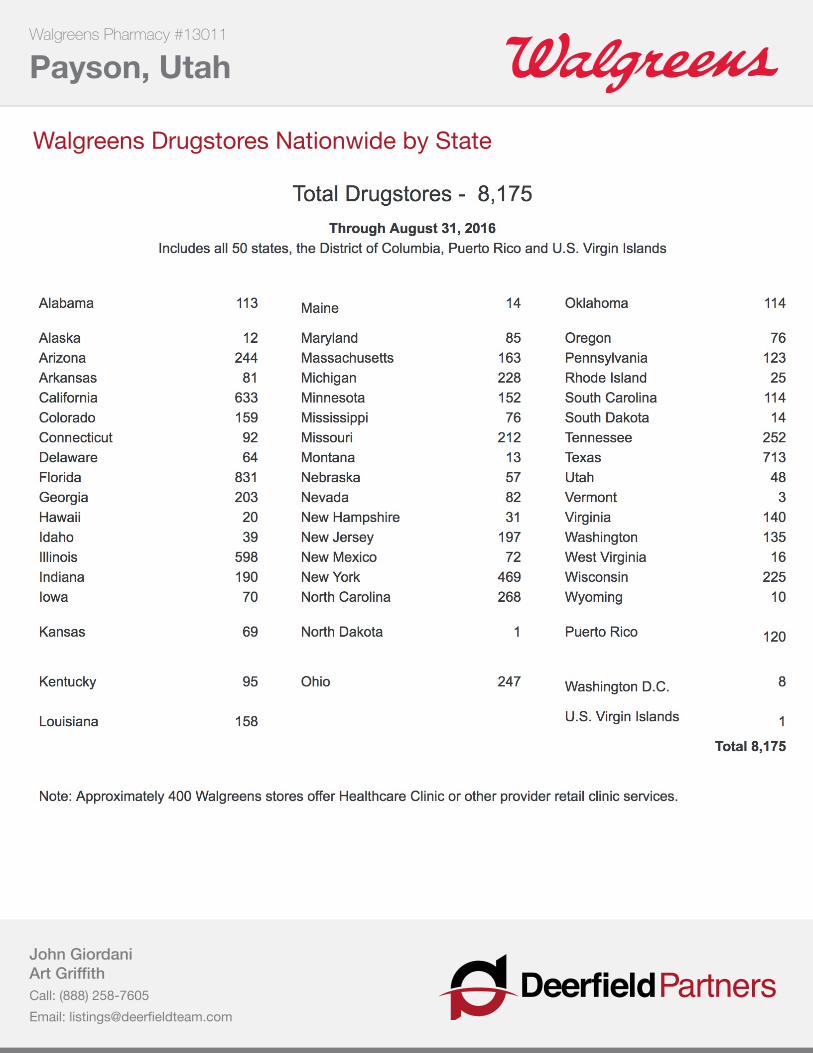
As of August 31, 2016, this Division operated 8,175 retail drugstores in 50 states, the District of Columbia,PuertoRicoandtheUSVirginIslands.Approximately76%ofthepopulationoftheUSAliveswithinfivemilesofaWalgreens.
Thecompanysellsprescriptionandnon-prescriptiondrugs,aswellasgeneralmerchandise,includinghouseholditems,convenienceandfreshfoods,personalcare,beautycare,photofinishingandcandy.Theyprovidecustomerswithconvenient,omni-channelaccesstoconsumergoodsandservices,pharmacy,andhealthandwellnessservicesincommunitiesacrossAmerica.
Thecompany’swebsites,whichincludeWalgreens.comanddrugstore.com,receiveanaverageofapproximately60millionvisitspermonth.Integratedwithane-commerceplatform,theWalgreensmobileapplicationallowscustomerstorefillprescriptionsthroughscantechnology,receivetextmessagesalertingwhenarefillisdueandotherfront-endfunctionality,suchasphotoandshoppingfeatures.
Infiscal2016,prescriptiondrugsaccountedfor67percentofsales,whileretailproductswere33percent.Overall,WBAfilledapproximately740.1millionprescriptionsinfiscal2016.
2nd Quarter 2017 Financial Performance – Retail Pharmacy USA
Walgreens Pharmacy #13011 Payson, Utah
DeerfieldPartnersJohn GiordaniArt GriffithCall: (888) 258-7605Email: [email protected]
Walgreens Drugstores Nationwide by State
Walgreens Pharmacy #13011 Payson, Utah
DeerfieldPartnersJohn GiordaniArt GriffithCall: (888) 258-7605Email: [email protected]
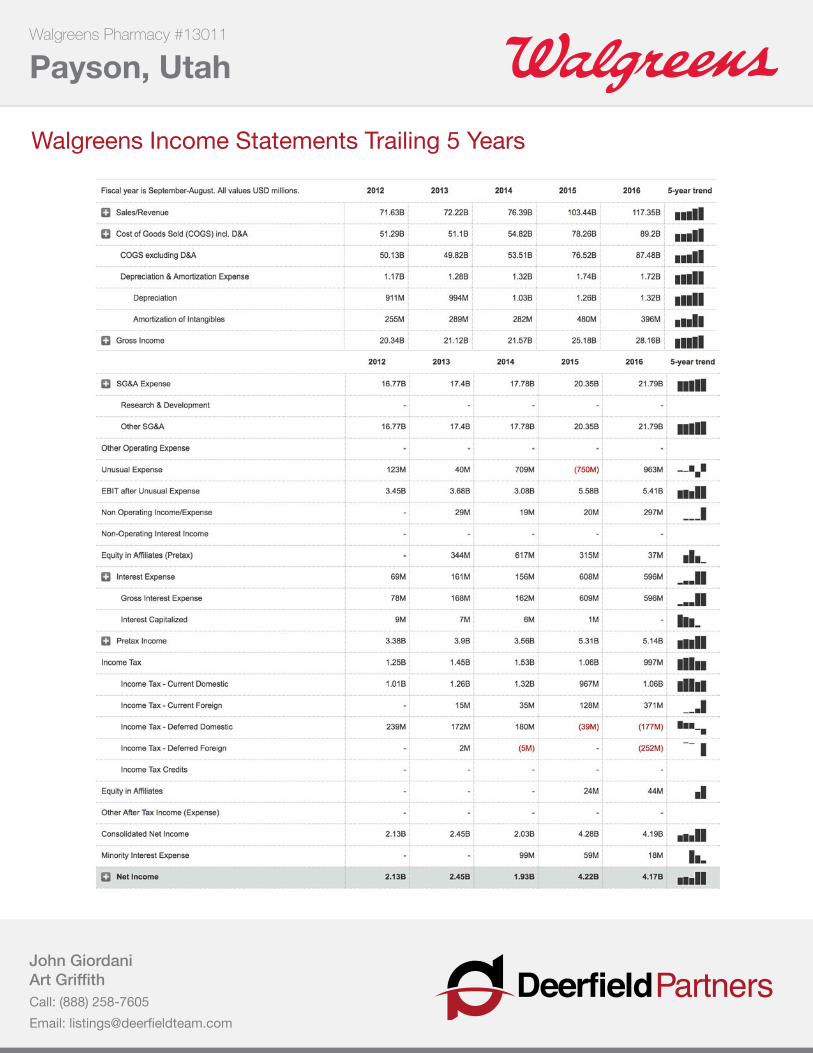
WalgreensIncomeStatementsTrailing5Years
Walgreens Pharmacy #13011 Payson, Utah
DeerfieldPartnersJohn GiordaniArt GriffithCall: (888) 258-7605Email: [email protected]
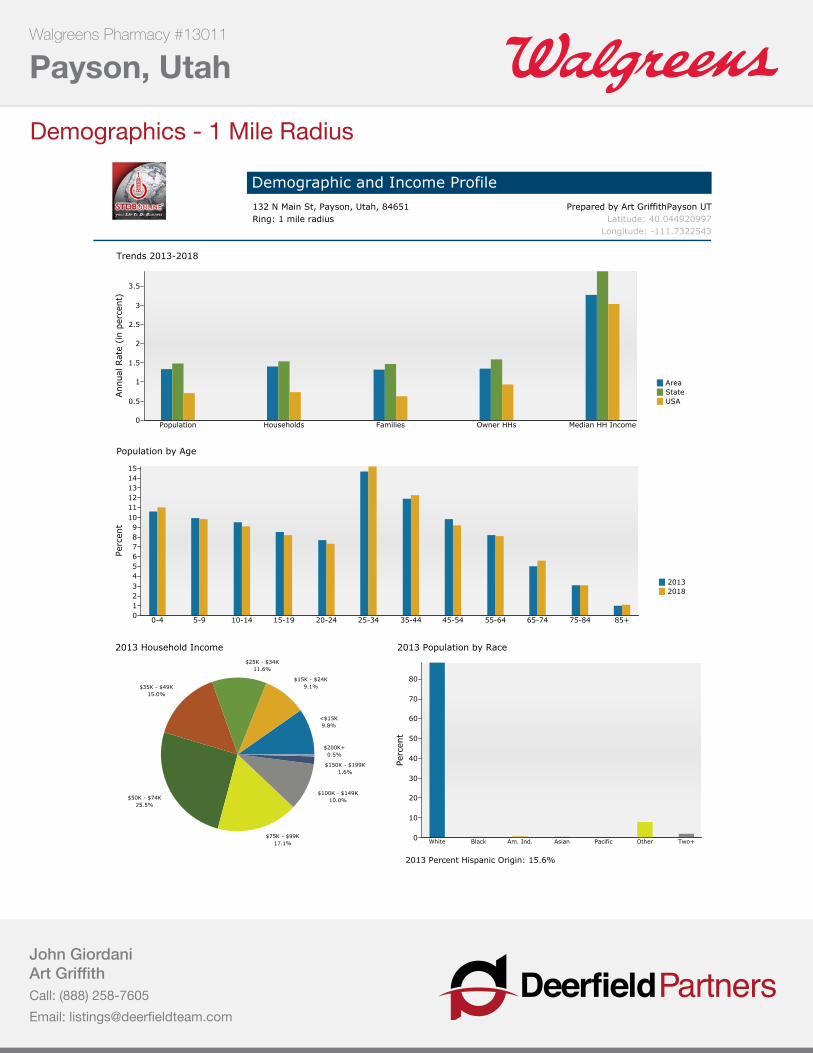
Demographics - 1 Mile Radius
Demographic and Income Profile132 N Main St, Payson, Utah, 84651 Prepared by Art GriffithPayson UTRing: 1 mile radius Latitude: 40.044920997
Longitude: -111.7322543
AreaStateUSA
Trends 2013-2018
Population Households Families Owner HHs Median HH Income
Annual
Rat
e (i
n p
erce
nt)
3.5
3
2.5
2
1.5
1
0.5
0
20132018
Population by Age
0-4 5-9 10-14 15-19 20-24 25-34 35-44 45-54 55-64 65-74 75-84 85+
Perc
ent
1514131211109876543210
2013 Household Income
<$15K9.8%
$15K - $24K9.1%
$25K - $34K11.6%
$35K - $49K15.0%
$50K - $74K25.5%
$75K - $99K17.1%
$100K - $149K10.0%
$150K - $199K1.6%
$200K+0.5%
2013 Population by Race
White Black Am. Ind. Asian Pacific Other Two+
Perc
ent
80
70
60
50
40
30
20
10
0
2013 Percent Hispanic Origin: 15.6%
August 28, 2014
©2014 Esri Page 2 of 6
Source: U.S. Census Bureau, Census 2010 Summary File 1. Esri forecasts for 2013 and 2018.
Walgreens Pharmacy #13011 Payson, Utah
DeerfieldPartnersJohn GiordaniArt GriffithCall: (888) 258-7605Email: [email protected]
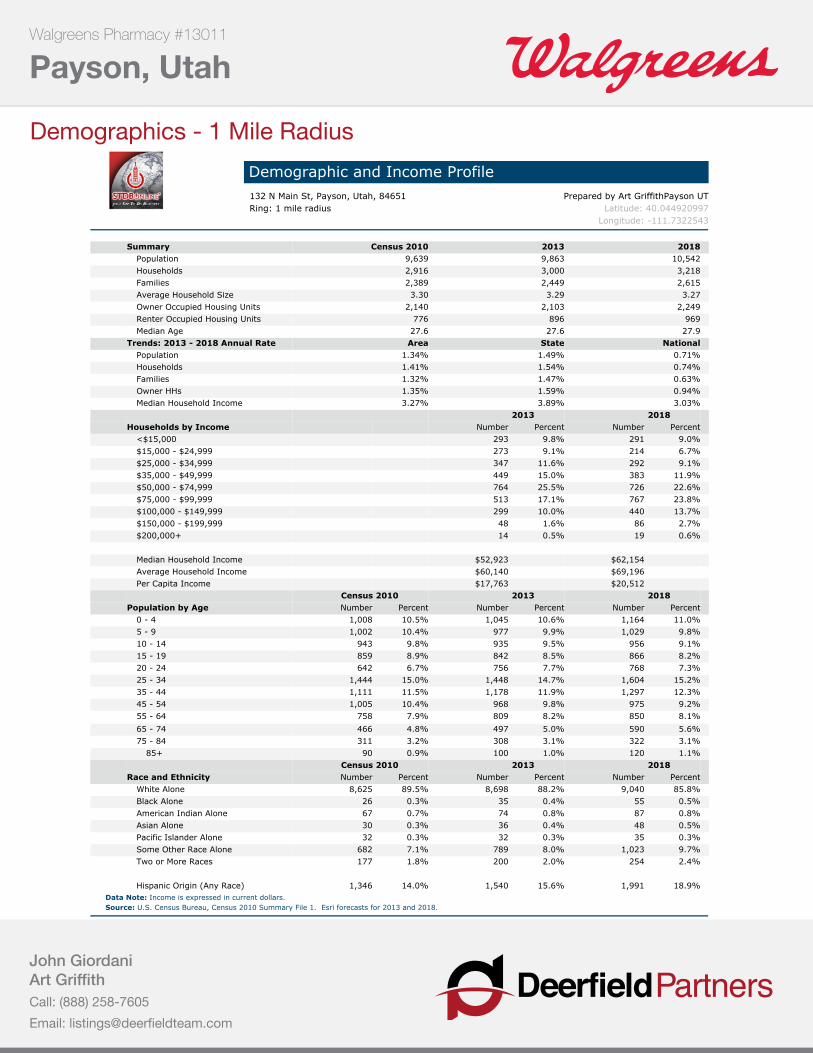
Demographics - 1 Mile RadiusDemographic and Income Profile132 N Main St, Payson, Utah, 84651 Prepared by Art GriffithPayson UTRing: 1 mile radius Latitude: 40.044920997
Longitude: -111.7322543
Summary Census 2010 2013 2018Population 9,639 9,863 10,542Households 2,916 3,000 3,218Families 2,389 2,449 2,615Average Household Size 3.30 3.29 3.27Owner Occupied Housing Units 2,140 2,103 2,249Renter Occupied Housing Units 776 896 969Median Age 27.6 27.6 27.9
Trends: 2013 - 2018 Annual Rate Area State NationalPopulation 1.34% 1.49% 0.71%Households 1.41% 1.54% 0.74%Families 1.32% 1.47% 0.63%Owner HHs 1.35% 1.59% 0.94%Median Household Income 3.27% 3.89% 3.03%
2013 2018 Households by Income Number Percent Number Percent
<$15,000 293 9.8% 291 9.0%$15,000 - $24,999 273 9.1% 214 6.7%$25,000 - $34,999 347 11.6% 292 9.1%$35,000 - $49,999 449 15.0% 383 11.9%$50,000 - $74,999 764 25.5% 726 22.6%$75,000 - $99,999 513 17.1% 767 23.8%$100,000 - $149,999 299 10.0% 440 13.7%$150,000 - $199,999 48 1.6% 86 2.7%$200,000+ 14 0.5% 19 0.6%
Median Household Income $52,923 $62,154Average Household Income $60,140 $69,196Per Capita Income $17,763 $20,512
Census 2010 2013 2018 Population by Age Number Percent Number Percent Number Percent
0 - 4 1,008 10.5% 1,045 10.6% 1,164 11.0%5 - 9 1,002 10.4% 977 9.9% 1,029 9.8%10 - 14 943 9.8% 935 9.5% 956 9.1%15 - 19 859 8.9% 842 8.5% 866 8.2%20 - 24 642 6.7% 756 7.7% 768 7.3%25 - 34 1,444 15.0% 1,448 14.7% 1,604 15.2%35 - 44 1,111 11.5% 1,178 11.9% 1,297 12.3%45 - 54 1,005 10.4% 968 9.8% 975 9.2%55 - 64 758 7.9% 809 8.2% 850 8.1%
65 - 74 466 4.8% 497 5.0% 590 5.6%75 - 84 311 3.2% 308 3.1% 322 3.1%
85+ 90 0.9% 100 1.0% 120 1.1%Census 2010 2013 2018
Race and Ethnicity Number Percent Number Percent Number PercentWhite Alone 8,625 89.5% 8,698 88.2% 9,040 85.8%Black Alone 26 0.3% 35 0.4% 55 0.5%American Indian Alone 67 0.7% 74 0.8% 87 0.8%Asian Alone 30 0.3% 36 0.4% 48 0.5%Pacific Islander Alone 32 0.3% 32 0.3% 35 0.3%Some Other Race Alone 682 7.1% 789 8.0% 1,023 9.7%Two or More Races 177 1.8% 200 2.0% 254 2.4%
Hispanic Origin (Any Race) 1,346 14.0% 1,540 15.6% 1,991 18.9%Data Note: Income is expressed in current dollars.
August 28, 2014
©2014 Esri Page 1 of 6
Source: U.S. Census Bureau, Census 2010 Summary File 1. Esri forecasts for 2013 and 2018.
Walgreens Pharmacy #13011 Payson, Utah
DeerfieldPartnersJohn GiordaniArt GriffithCall: (888) 258-7605Email: [email protected]
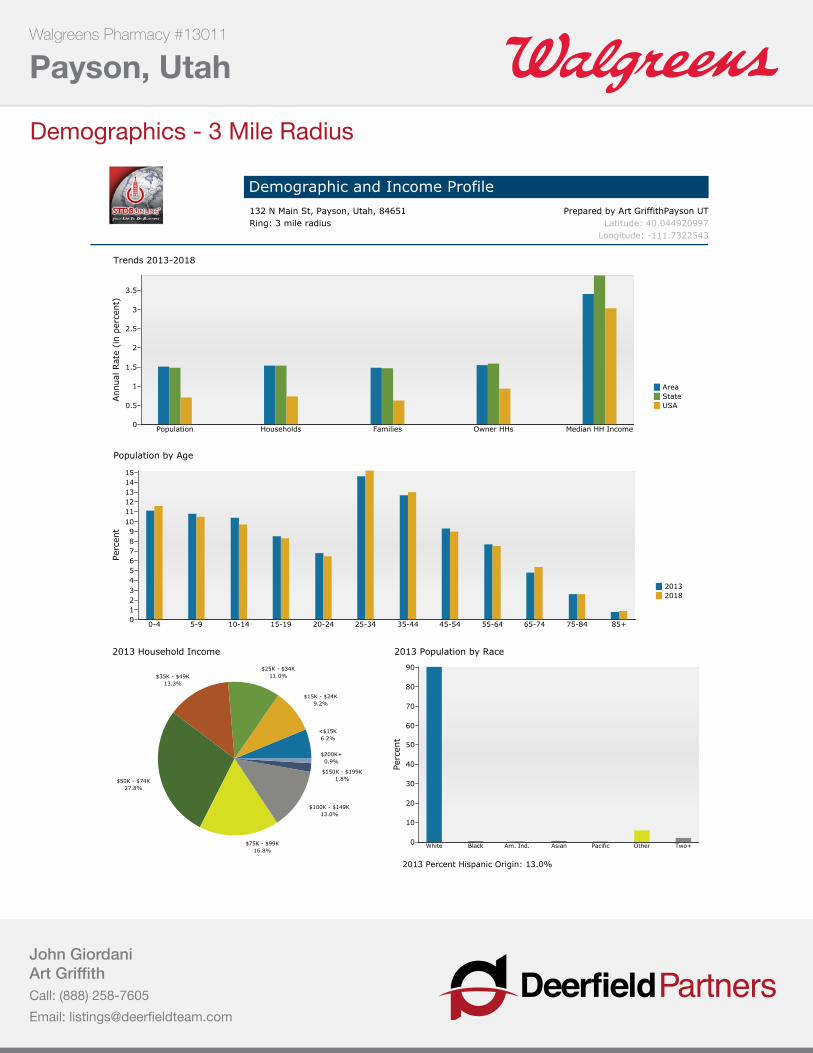
Demographics - 3 Mile Radius
Demographic and Income Profile132 N Main St, Payson, Utah, 84651 Prepared by Art GriffithPayson UTRing: 3 mile radius Latitude: 40.044920997
Longitude: -111.7322543
AreaStateUSA
Trends 2013-2018
Population Households Families Owner HHs Median HH Income
Annual
Rat
e (i
n p
erce
nt)
3.5
3
2.5
2
1.5
1
0.5
0
20132018
Population by Age
0-4 5-9 10-14 15-19 20-24 25-34 35-44 45-54 55-64 65-74 75-84 85+
Perc
ent
1514131211109876543210
2013 Household Income
<$15K6.2%
$15K - $24K9.2%
$25K - $34K11.0%$35K - $49K
13.3%
$50K - $74K27.8%
$75K - $99K16.8%
$100K - $149K13.0%
$150K - $199K1.8%
$200K+0.9%
2013 Population by Race
White Black Am. Ind. Asian Pacific Other Two+
Perc
ent
90
80
70
60
50
40
30
20
10
0
2013 Percent Hispanic Origin: 13.0%
August 28, 2014
©2014 Esri Page 4 of 6
Source: U.S. Census Bureau, Census 2010 Summary File 1. Esri forecasts for 2013 and 2018.
Walgreens Pharmacy #13011 Payson, Utah
DeerfieldPartnersJohn GiordaniArt GriffithCall: (888) 258-7605Email: [email protected]
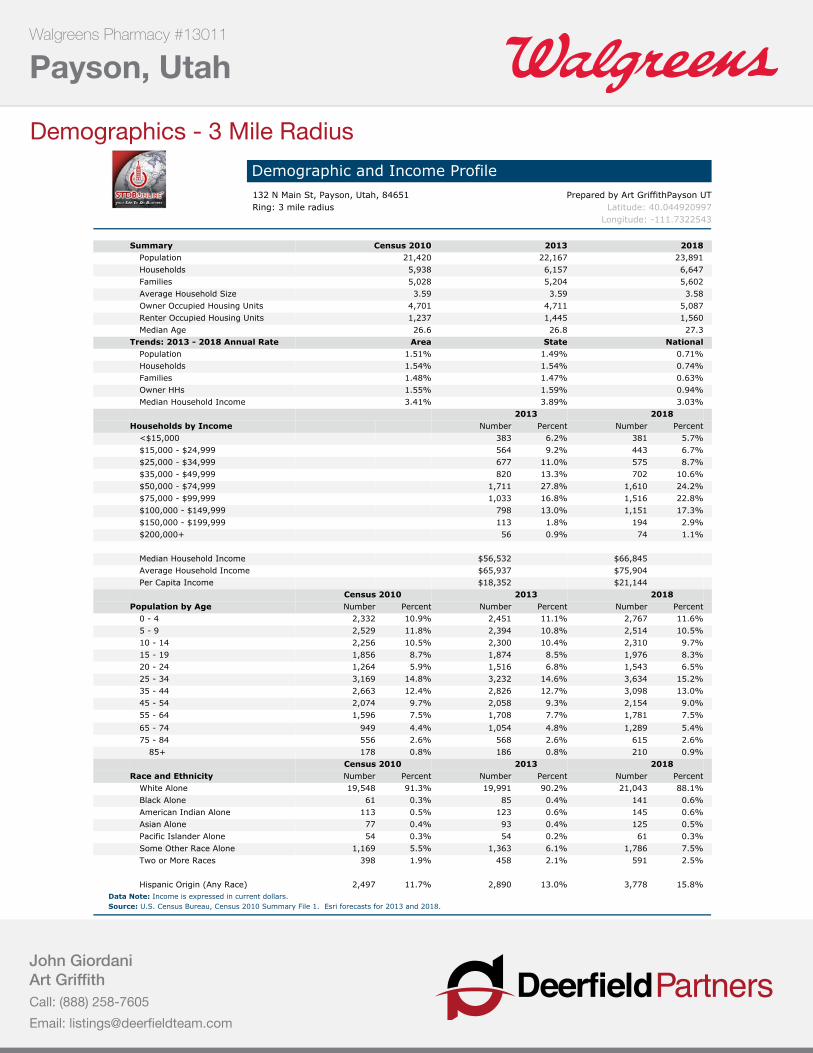
Demographics - 3 Mile RadiusDemographic and Income Profile132 N Main St, Payson, Utah, 84651 Prepared by Art GriffithPayson UTRing: 3 mile radius Latitude: 40.044920997
Longitude: -111.7322543
Summary Census 2010 2013 2018Population 21,420 22,167 23,891Households 5,938 6,157 6,647Families 5,028 5,204 5,602Average Household Size 3.59 3.59 3.58Owner Occupied Housing Units 4,701 4,711 5,087Renter Occupied Housing Units 1,237 1,445 1,560Median Age 26.6 26.8 27.3
Trends: 2013 - 2018 Annual Rate Area State NationalPopulation 1.51% 1.49% 0.71%Households 1.54% 1.54% 0.74%Families 1.48% 1.47% 0.63%Owner HHs 1.55% 1.59% 0.94%Median Household Income 3.41% 3.89% 3.03%
2013 2018 Households by Income Number Percent Number Percent
<$15,000 383 6.2% 381 5.7%$15,000 - $24,999 564 9.2% 443 6.7%$25,000 - $34,999 677 11.0% 575 8.7%$35,000 - $49,999 820 13.3% 702 10.6%$50,000 - $74,999 1,711 27.8% 1,610 24.2%$75,000 - $99,999 1,033 16.8% 1,516 22.8%$100,000 - $149,999 798 13.0% 1,151 17.3%$150,000 - $199,999 113 1.8% 194 2.9%$200,000+ 56 0.9% 74 1.1%
Median Household Income $56,532 $66,845Average Household Income $65,937 $75,904Per Capita Income $18,352 $21,144
Census 2010 2013 2018 Population by Age Number Percent Number Percent Number Percent
0 - 4 2,332 10.9% 2,451 11.1% 2,767 11.6%5 - 9 2,529 11.8% 2,394 10.8% 2,514 10.5%10 - 14 2,256 10.5% 2,300 10.4% 2,310 9.7%15 - 19 1,856 8.7% 1,874 8.5% 1,976 8.3%20 - 24 1,264 5.9% 1,516 6.8% 1,543 6.5%25 - 34 3,169 14.8% 3,232 14.6% 3,634 15.2%35 - 44 2,663 12.4% 2,826 12.7% 3,098 13.0%45 - 54 2,074 9.7% 2,058 9.3% 2,154 9.0%55 - 64 1,596 7.5% 1,708 7.7% 1,781 7.5%
65 - 74 949 4.4% 1,054 4.8% 1,289 5.4%75 - 84 556 2.6% 568 2.6% 615 2.6%
85+ 178 0.8% 186 0.8% 210 0.9%Census 2010 2013 2018
Race and Ethnicity Number Percent Number Percent Number PercentWhite Alone 19,548 91.3% 19,991 90.2% 21,043 88.1%Black Alone 61 0.3% 85 0.4% 141 0.6%American Indian Alone 113 0.5% 123 0.6% 145 0.6%Asian Alone 77 0.4% 93 0.4% 125 0.5%Pacific Islander Alone 54 0.3% 54 0.2% 61 0.3%Some Other Race Alone 1,169 5.5% 1,363 6.1% 1,786 7.5%Two or More Races 398 1.9% 458 2.1% 591 2.5%
Hispanic Origin (Any Race) 2,497 11.7% 2,890 13.0% 3,778 15.8%Data Note: Income is expressed in current dollars.
August 28, 2014
©2014 Esri Page 3 of 6
Source: U.S. Census Bureau, Census 2010 Summary File 1. Esri forecasts for 2013 and 2018.
Walgreens Pharmacy #13011 Payson, Utah
DeerfieldPartnersJohn GiordaniArt GriffithCall: (888) 258-7605Email: [email protected]
Demographics - 5 Mile Radius
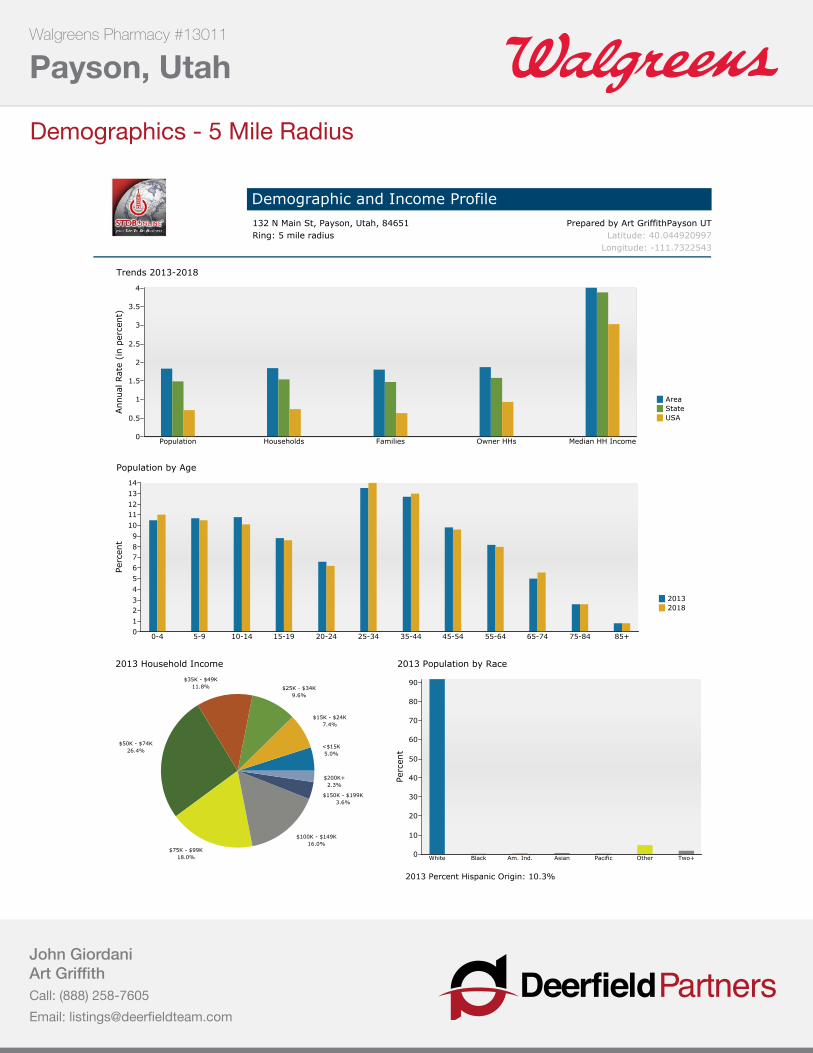
Demographic and Income Profile132 N Main St, Payson, Utah, 84651 Prepared by Art GriffithPayson UTRing: 5 mile radius Latitude: 40.044920997
Longitude: -111.7322543
AreaStateUSA
Trends 2013-2018
Population Households Families Owner HHs Median HH Income
Annual
Rat
e (i
n p
erce
nt)
4
3.5
3
2.5
2
1.5
1
0.5
0
20132018
Population by Age
0-4 5-9 10-14 15-19 20-24 25-34 35-44 45-54 55-64 65-74 75-84 85+
Perc
ent
14
13
1211
10
9
87
6
5
4
32
1
0
2013 Household Income
<$15K5.0%
$15K - $24K7.4%
$25K - $34K9.6%
$35K - $49K11.8%
$50K - $74K26.4%
$75K - $99K18.0%
$100K - $149K16.0%
$150K - $199K3.6%
$200K+2.3%
2013 Population by Race
White Black Am. Ind. Asian Pacific Other Two+
Perc
ent
90
80
70
60
50
40
30
20
10
0
2013 Percent Hispanic Origin: 10.3%
August 28, 2014
©2014 Esri Page 6 of 6
Source: U.S. Census Bureau, Census 2010 Summary File 1. Esri forecasts for 2013 and 2018.
Walgreens Pharmacy #13011 Payson, Utah
DeerfieldPartnersJohn GiordaniArt GriffithCall: (888) 258-7605Email: [email protected]
Demographics - 5 Mile Radius
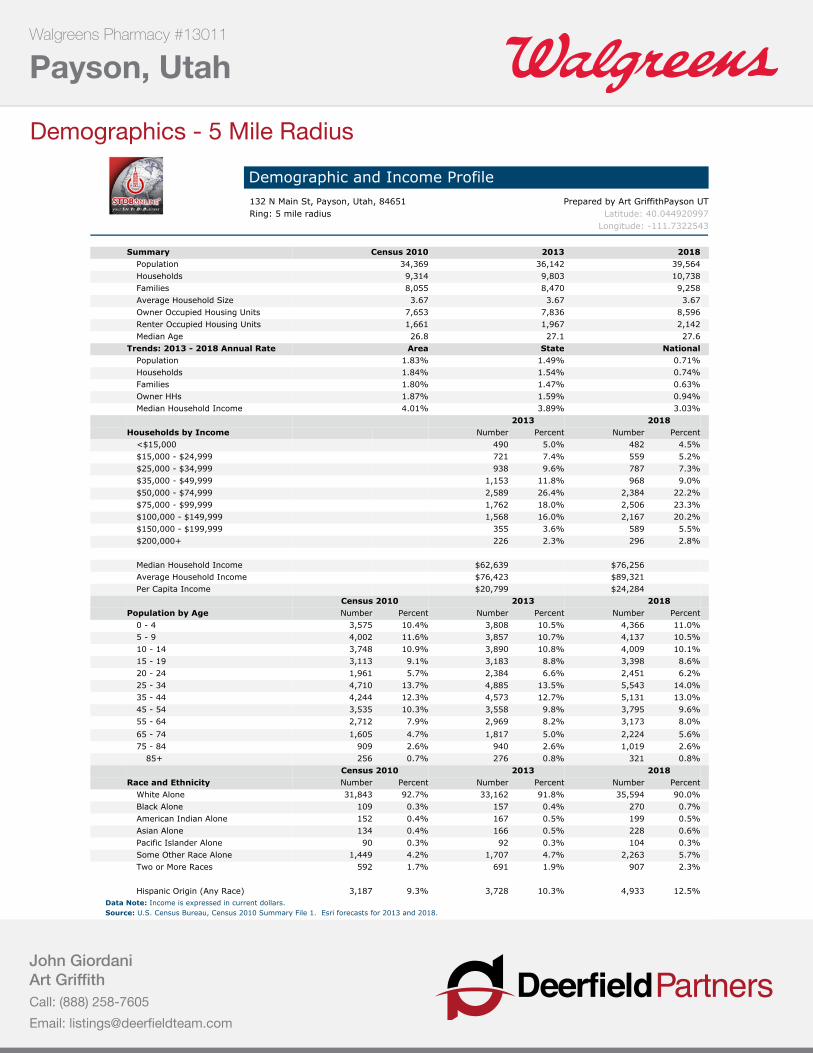
Demographic and Income Profile132 N Main St, Payson, Utah, 84651 Prepared by Art GriffithPayson UTRing: 5 mile radius Latitude: 40.044920997
Longitude: -111.7322543
Summary Census 2010 2013 2018Population 34,369 36,142 39,564Households 9,314 9,803 10,738Families 8,055 8,470 9,258Average Household Size 3.67 3.67 3.67Owner Occupied Housing Units 7,653 7,836 8,596Renter Occupied Housing Units 1,661 1,967 2,142Median Age 26.8 27.1 27.6
Trends: 2013 - 2018 Annual Rate Area State NationalPopulation 1.83% 1.49% 0.71%Households 1.84% 1.54% 0.74%Families 1.80% 1.47% 0.63%Owner HHs 1.87% 1.59% 0.94%Median Household Income 4.01% 3.89% 3.03%
2013 2018 Households by Income Number Percent Number Percent
<$15,000 490 5.0% 482 4.5%$15,000 - $24,999 721 7.4% 559 5.2%$25,000 - $34,999 938 9.6% 787 7.3%$35,000 - $49,999 1,153 11.8% 968 9.0%$50,000 - $74,999 2,589 26.4% 2,384 22.2%$75,000 - $99,999 1,762 18.0% 2,506 23.3%$100,000 - $149,999 1,568 16.0% 2,167 20.2%$150,000 - $199,999 355 3.6% 589 5.5%$200,000+ 226 2.3% 296 2.8%
Median Household Income $62,639 $76,256Average Household Income $76,423 $89,321Per Capita Income $20,799 $24,284
Census 2010 2013 2018 Population by Age Number Percent Number Percent Number Percent
0 - 4 3,575 10.4% 3,808 10.5% 4,366 11.0%5 - 9 4,002 11.6% 3,857 10.7% 4,137 10.5%10 - 14 3,748 10.9% 3,890 10.8% 4,009 10.1%15 - 19 3,113 9.1% 3,183 8.8% 3,398 8.6%20 - 24 1,961 5.7% 2,384 6.6% 2,451 6.2%25 - 34 4,710 13.7% 4,885 13.5% 5,543 14.0%35 - 44 4,244 12.3% 4,573 12.7% 5,131 13.0%45 - 54 3,535 10.3% 3,558 9.8% 3,795 9.6%55 - 64 2,712 7.9% 2,969 8.2% 3,173 8.0%
65 - 74 1,605 4.7% 1,817 5.0% 2,224 5.6%75 - 84 909 2.6% 940 2.6% 1,019 2.6%
85+ 256 0.7% 276 0.8% 321 0.8%Census 2010 2013 2018
Race and Ethnicity Number Percent Number Percent Number PercentWhite Alone 31,843 92.7% 33,162 91.8% 35,594 90.0%Black Alone 109 0.3% 157 0.4% 270 0.7%American Indian Alone 152 0.4% 167 0.5% 199 0.5%Asian Alone 134 0.4% 166 0.5% 228 0.6%Pacific Islander Alone 90 0.3% 92 0.3% 104 0.3%Some Other Race Alone 1,449 4.2% 1,707 4.7% 2,263 5.7%Two or More Races 592 1.7% 691 1.9% 907 2.3%
Hispanic Origin (Any Race) 3,187 9.3% 3,728 10.3% 4,933 12.5%Data Note: Income is expressed in current dollars.
August 28, 2014
©2014 Esri Page 5 of 6
Source: U.S. Census Bureau, Census 2010 Summary File 1. Esri forecasts for 2013 and 2018.