high heating rate dsc - ta instruments · high heating rate dsc ... even after that program rate is...
TRANSCRIPT

1 TA 297
High Heating Rate DSC
R. Bruce CasselTA Instruments, 109 Lukens Drive, New Castle DE 19720, USA
ABSTRACT
The use of fast DSC heating rates has been reported in several laboratories. TAInstruments’ Q SeriesTM DSC with Advanced Tzero Technology offers advantages forsuch experiments. Indium is analyzed to assess calorimetric performance, andpolylactide is used to demonstrate the utility of fast rates to suppress crystallization.Tzero Technology eliminates most thermal lag related errors, and permits fast heatingrates to be used as a practical technique.
INTRODUCTION
From the early days of thermal analysis, the accepted “standard” heating rate hasbeen 10 ºC/min. Faster high heating rates increase the sensitivity and productivity, but doso at the expense of temperature resolution and accuracy. Also, high heating ratessuppress kinetically hindered processes, such as crystallization, so that thethermodynamic properties of unstable materials may be investigated. Recently Mathotand co-workers have reported on a number of high heating rate polymer applications (1).In another example, gathering data to construct phase diagrams for polymorphic forms ofa pharmaceutical compound is benefited by the use of fast heating rates to determine thetransition temperatures of metastable forms.
One challenge with the use of high heating rates is that while the furnace mayachieve a rapid rate, there is a finite time delay before the sample achieves the same rate. Even after that program rate is achieved, the temperature of the sample, the samplecontainer, and parts of the DSC lag behind the furnace control temperature. The amountof thermal lag (T-lag) the sample experiences is described by Newton’s Law of Cooling:
T-lag = R0 dq/dt = R0 (Cp m + Cp (pan) m(pan)) dT/dt (1)
Where: R0 is the thermal resistance between the sample and sensordq/dt is the heat flow to the sampleCp is the specific heat capacitym is the mass, anddT/dt is the heating rate experienced by the sample and pan
.
The thermal lag is proportional to heating rate, sample and pan mass, sample andpan specific heat capacity and the thermal resistance between the sensor and the sample.

2 TA 297
All other conditions being equal, the use of 100 ºC/min heating rate produces a thermallag 10 times greater than at 10 ºC/min.
Of course, for a given set of conditions, calibration using a melting point standardmay allow the sample temperature to be known even at a fast rate. However, there isuncertainty in the temperature measurement due to uncertainty in contact resistance (R0)and in the heating rate experienced by the sample. Also, calibration at a particularheating rate does not always ensure temperature calibration at other heating rates evenwhen a scanning rate dependency calibration has been established using an ideal materialsuch as with indium.
Another problem is that different heating rates experienced by the sample andreference positions during transitions broaden and distort the DSC peak. These problemsare greatly amplified by fast heating rates.
EXPERIMENTAL
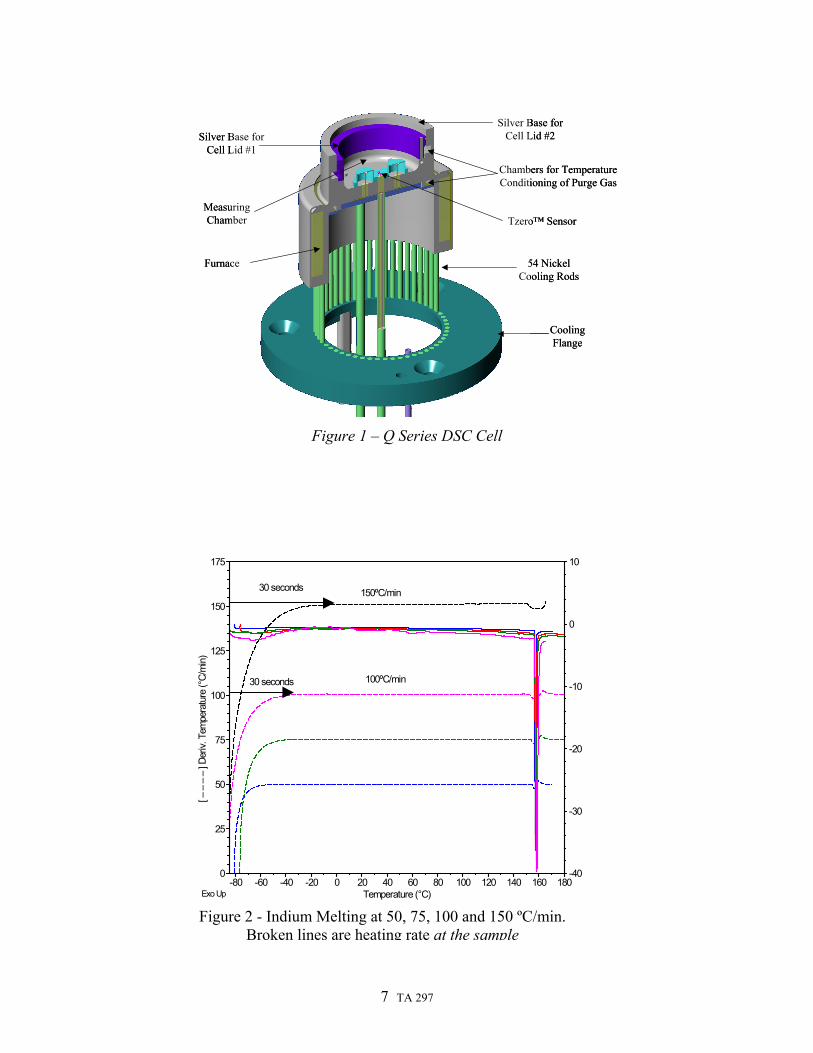
The Q1000 DSC with its Advanced Tzero Technology provides a solution tothese problems. Figure 1 is a schematic diagram of the Tzero DSC cell showing thepositions of the sample and reference platforms and the Tzero sensor (2). It utilizes anew measurement principle employing an additional element on the DSC sensor thatprovides compensation for intrinsic instrument distortion of the DSC signal (3). The heatflow to the sample specimen is determined using the multiple term relationship given byEquation 2:
( )dt
TdCdt
dTCC
RRT
RTq r
ssr
rsr
∆−−+
−∆+∆−= 11
0& (2)
where q = differential heat flow∆T = temperature difference between sample and reference∆To = temperature difference between sample and sensor baseRs = sample sensor thermal resistanceRr = reference sensor thermal resistanceCs = sample sensor thermal capacitanceCr = reference sensor thermal capacitancedTs/dt = sample temperature rate of change, andd∆T/dt = differential change in temperature.
The first term is the differential temperature signal used in traditional DSC instruments,the second and third terms are compensation for asymmetry in the resistance and thermalcapacitance elements of the DSC cell, and the fourth term treats the differences in heatingrate between the sample and reference sensors.
Equation 2 is a more general form of the heat flow equation used by other DSCs.It is derived from a model of the DSC cell that takes into account asymmetry in the cellconstruction, including asymmetry in the heat distribution in the cell caused by thermaleffects from the presence of the sample on one side of the cell. A more completeinstrumental calibration is performed to solve for the R and C cell parameters. Theadditional T0 thermocouple is key to being able to perform this calibration and tocompensate for asymmetry (3). Using this more complete derivation causes peak shapesto be less distorted from thermal lag, and temperature output is properly corrected for all

3 TA 297
temperature gradients. No place is this more important than when using fast heating ratesthat produce large temperature gradients.
To illustrate these benefits, three samples are run for this evaluation; a 0.42 mgsample of indium metal calibration standard, a 0.31 mg sample of low densitypolyethylene (PE) sample and a milligram sample of polylactide (PL), a commonly usedpharmaceutical excipient. The samples are placed in the bottom parts of standardaluminum DSC pans. To further reduce thermal lag, the pan mass was reduced bysubstituting a foil disk punched from aluminum wrap for the standard lid. Aftercrimping, the pans are further flattened to improve thermal contact. Prior to each heatingscan, the PE sample was cooled from above the melt to below –80 ºC using a nominalcooling rate of 20 ºC/min using the RCS mechanical refrigerator. This ensures that thesample is cooled at a known, constant cooling rate over the fusion temperature region.
RESULTS AND DISCUSSION
To obtain useful data, the DSC must quickly stabilize at the rapid heating rate.The Q Series DSC achieves substantially improved temperature control and equilibrationfrom a redesign of its furnace/cooling system (3). Figure 2 shows the derivative of thesample temperature for fast heating rate analyses of indium. With Advanced TzeroTechnology this heating rate is that of the sample pan and hence, the sample, for a small,well-coupled sample specimen, (not merely the heating rate of a control sensor, as iscommonly displayed in some DSCs.) For precise temperature measurement, thetemperature sensor must be as close to the sample as is physically possible withoutactually being in the sample (a necessary condition for heat flow measurements) (4). Thetemperature of the sample pan provided by Advanced Tzero Technology satisfies thiscondition. Figure 2 shows that heating rate equilibrium is achieved in about 30 secondsafter starting the scan even without the use of exotic purge gasses or non-standard samplepans.
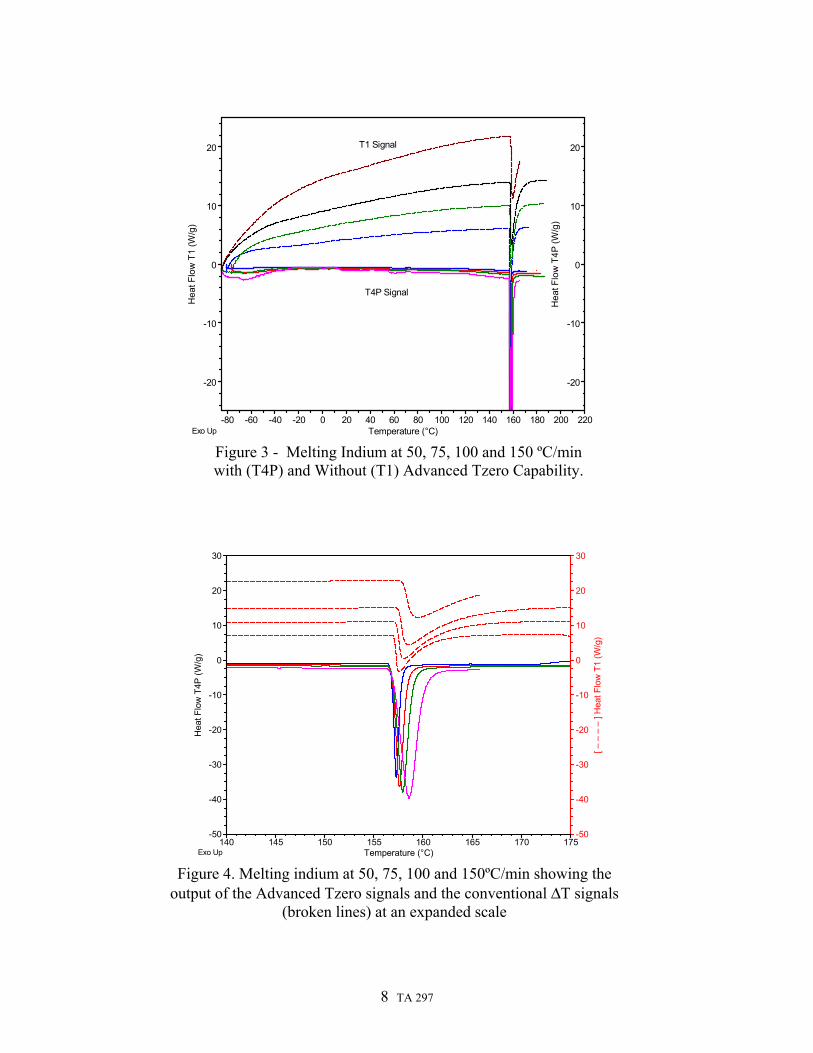
Useful heat flow data may be obtained only after the transient heat flow effects ofswitching from isothermal control to constant scanning control are dissipated. A steadystate, straight, baseline needs to be achieved prior to the onset of the transition. A steadybaseline indicates that the temperature gradients in the DSC cell have reached a steadystate. But asymmetry in the cell manufacture delays the time required to reach a steadystate. Because Tzero technology compensates for the cell asymmetry, the Q series DSCsquickly reach a straight baseline without subtracting empty-pan baseline data. Figure 3contrasts the pre-melting baseline obtained from the Tzero-compensated circuit of theQ1000TM DSC (T4P) with that obtained from the ∆T circuit from the traditional DSC(T1).
At a 100 ºC/min heating rate the temperature of the sample specimen and pan lagsbehind the temperature of the sensor surface up to 10 Celsius degrees, due to the thermalresistance between the pan and sensor. While temperature calibration may correct thispotential error for a given set of conditions, this correction is only exact for the same pantype, weight of sample and scanning rate used for calibration. At rapid heating rates theuncertainty in the temperature of the sample specimen can easily reach several Celsiusdegrees.
Advanced Tzero Technology explicitly compensates for the temperaturegradients in the DSC cell induced by the sample and pan heat capacity. Figures 3, 4 and5 (the same data at different levels of scale expansion) show that the extrapolated onset ofindium is independent of the heating rate (5).

4 TA 297
The phase rule holds that when a pure sample undergoes a first order transition,the temperature of the sample remains constant. At scanning rates of 100 ºC/min ormore, temperature gradients between the sample and DSC cell reach tens of Celsiusdegrees. This, in turn, creates temperature gradients within the DSC cell since only oneside of the DSC is thermally restrained. These temperature gradients change the heatingrate on one side of the DSC cell (Figure 2) distorting the peak shape, smearing it over awider temperature range and diminishing the peak sharpness. The dashed lines ofFigures 3 and 4 show the shape of the DSC peak using the T1 signal, the conventional ∆Tsignal used in DSC. Without correction to the data, analysis of this T1 signal leads toerrors in the assessment of the sample characteristics.
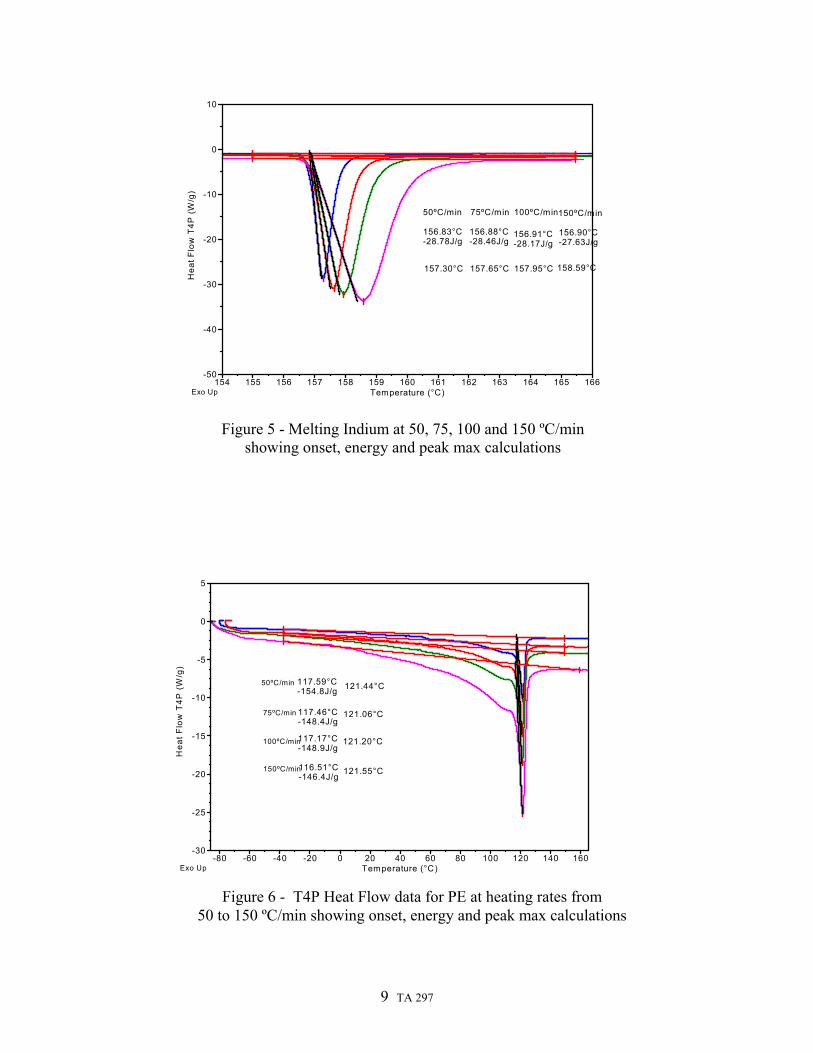
Again, Advanced Tzero Technology compensates for this effect is shown inFigure 4 and 5 in the indium T4P data. (“T4P” means pan considered four term heat flowequation data.) The data in Figure 5 indicates that the accuracy possible with fast rateDSC analysis using the Q Series is as good as a ± 0.2 °C and a few percent in the energyof melting in going from 50 to 150 °C/min. Moreover, the integrity of the peak shape isclear, while the peak shape for the conventional DSC output is clearly distorted.
One of the applications for fast scan DSC is the rapid characterization of smallquantities of polymer blends and copolymers produced by “shotgun” synthesistechniques, such as combinatorial analysis. To evaluate this rapid characterizationtechnique, a sample of low-density polyethylene (PE), displaying both broad and sharpmelting regions, was analyzed at rapid heating rates after imposing a controlled thermalhistory. Figure 6 shows the analysis of the peak maximum, onset and energy areindependent of scan rate. This indicates that the Tzero signal is properly compensatingfor the thermal lag permitting the operator to choose which heating rate to use for theanalysis.
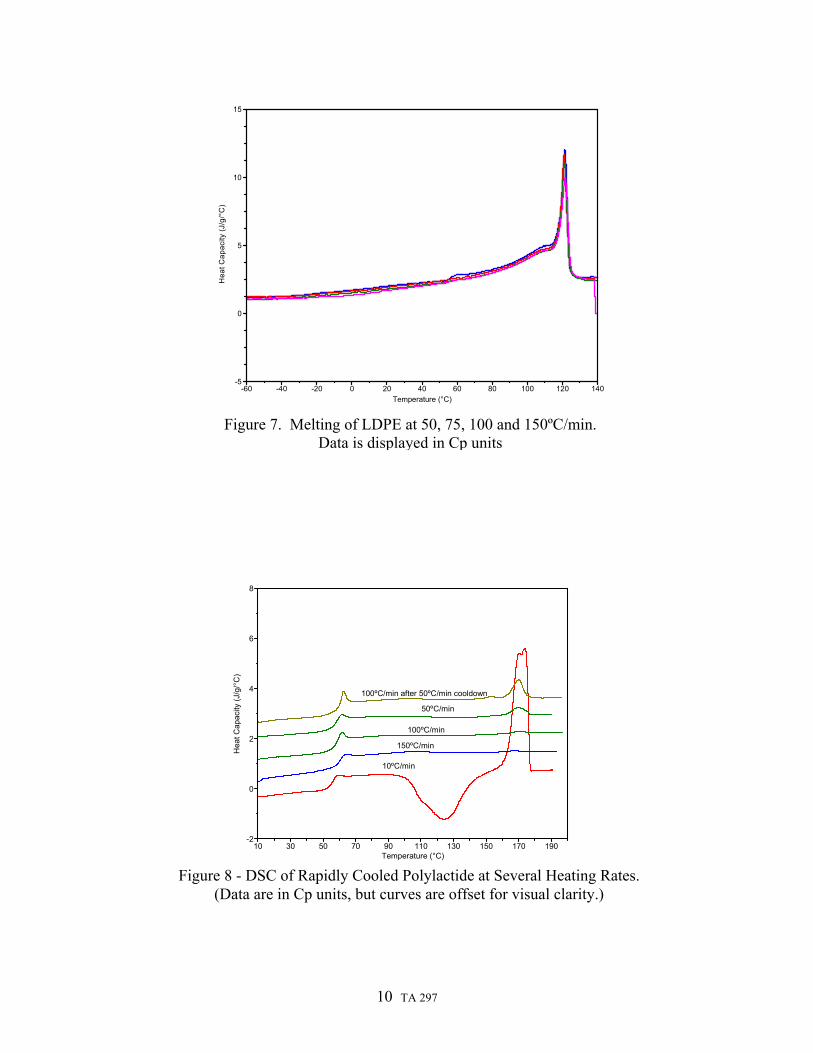
For easy comparison of data obtained at different heating rates, it is convenient todisplay results in heat capacity units. This is possible due to the DSC cell balancingeffect of the Tzero capability and is shown in Figure 7. One of the unique characteristicsof the Q1000 with Advanced Tzero Technology is that the displacement from zero isproportional to the scanning rate. Thus, by dividing by the scanning rate (and sampleweight), the sample specific heat capacity is directly obtained. The Q1000 offers thespecific heat capacity as one of the choices of output signal, and any data from a weighedsample can be displayed in specific heat capacity units, without subtracting empty panbaseline data. Figure 8 shows the PE data taken at 50, 75 100 and 150 ºC/min in heatcapacity units. It is clear that the temperature distribution of melting is the same at theserates, and that temperature dependent crystallinity could equally well be obtained fromany of these curves. This also indicates that there is very little crystallization occurringon heating at any of these rates.
One potential use of the fast rate DSC is in characterizing systems in metastablestates. For example, when an unstable amorphous material is heated at normal DSC ratescrystallization begins above the glass transition and is followed by the crystalline melt.Amorphous polyethylene terephthalate (PET), such as used in PET bottle performs, is afamiliar example. When such an amorphous material is heated at rates above 100ºC/minthere is little or no crystallization that occurs before the temperature of the specimen isabove the normal melting range. By suppressing crystallization, low levels ofcrystallinity can be more accurately measured, and the DSC analysis gives a moreaccurate characterization
To demonstrate this capability a sample of polylactide was repeatedly put into anamorphous state, and then run at a series of heating rates. From Figure 8 it can be seenthat at 10ºC/min the polylactide crystallizes, and then melts; whereas at 100 or 150ºC/min

5 TA 297
there is no apparent crystallization and very little melting. This behavior can also beobserved with PET. However, other materials crystallize so rapidly above Tg that theserates, and higher, are still insufficient to suppress crystallization.
In this analysis the polylactide specimen was put into an amorphous state byballistic cooling in the DSC using a refrigerated cooling system (RCS) to cool the DSCcell. For other materials it is necessary to quench cool more vigorously by manuallyremoving the sample from the DSC cell above the melt and placing it on a roomtemperature surface. Alternatively, this quenching step may be carried out automaticallyby using the Q Series autosampler to remove the encapsulated sample at a temperatureabove the melt and place it in the room temperature autosampler. It can then re-load thesample into the DSC cell at a temperature below Tg where it can be cooled to thesubambient and analyzed at a rapid scan rate. This is similar to the manually manipulatedprocedure illustrated by the data above.
Another cooling option for placing the samples in a metastable state is that ofusing a constant programmed cooling rate to give a more specified thermal history. Forthis application a cooling rate of 100°C/min is achievable over the necessary temperaturerange with the liquid nitrogen cooling accessory.
Some experimentalists suggest that data is improved by the use of neon-heliummixture purge gas, foil encapsulation and thermally conductive grease to improve thecoupling of the sample pan to the DSC (1). These procedures may indeed help, but theyeach have drawbacks and it is clear that they are not necessary when using AdvancedTzero Technology. Moreover the procedures used in this work are compatible with anautosampler recommended for high throughput operation. The data shows that rates upto 150 °C/min can be used. However, experience shows that unless there is a real need forthis fast rate, heating rates of 100 °C/min or less are adequate. Rates faster than 100ºC/min increase the likelihood of errors related to encapsulation, such as sample swellingwhich may change the value of R0 in Equation 1 thus leading to baseline artifacts.
One additional feature of the TA Advantage instrumentation control is theavailability of user-selected heater control PID values to optimize the heater control foreach type of method segment. This feature is used here to optimize performance for thehigh heating rates. Because of the demanding conditions required by fast rate DSC, thedefault PID values were replaced by user-selected values that optimized scanningequilibration (6). This is achieved experimentally with a simple addition to the DSCmethod that specifies the desired PID values shown in Figure 9 (3).
SUMMARY
High heating rates, rapid temperature equilibrium, invariant temperaturecalibration with changing heating rate are proven to be practical with the use ofAdvanced Tzero Technology
Advanced Tzero Technology provides automatic compensation for thermal lageffects that are a major source of error in fast rate DSC. The use of the Q1000 with TzeroTechnology, together with careful standard encapsulation, is shown to allow exceptionaldata to be obtained at heating rates of up to 150 ºC/min--without the need to use operator-intensive, foil-and-grease techniques.
REFERENCES
6 TA 297
1. T. F. J. Pijpers, V. B. F. Mathot, B. Goderis, E. van der Vegt, “High PerformanceDSC – High Scanning Rate DSC: Application to Polymers”, Proceedings of the28th Conference of the North American Thermal Analysis Society, 2000, pp. 32-37.
2. L. Waguespack and R. Blaine, “Design of a New DSC Cell with TzeroTechnology”, proceedings of the 29th Conference of the North American ThermalAnalysis Society, 2001, pp. 722-727.
3. R. L. Danley and P. A. Caulfield, “DSC Baseline Improvements Obtained by aHeat Flow Measurement Technique”, Proceedings of the 29th Conference of theNorth American Thermal Analysis Society, 2001, pp. 667-672.
4. S. L. Boersma, Journal of the American Ceramic Society, 1955, p 281.5. TA283, “How Tzero Technology Improves DSC Performance: Reducing Thermal
Lag” TA Instruments, New Castle DE.6. TN 47, “Using the Heater PID Method Segment”, TA Instruments, New Castle,
DE.
KEYWORDS
differential scanning calorimetry, metals, polyolefins, thermoplastic polymers
7 TA 297
Silver Base for Cell Lid #1
Measuring Chamber
Silver Base for Cell Lid #2
Furnace
Tzero™ Sensor
54 Nickel Cooling Rods
Cooling Flange
Chambers for Temperature Conditioning of Purge Gas
Silver Base for Cell Lid #1
Measuring Chamber
Silver Base for Cell Lid #2
Furnace
Tzero™ Sensor
54 Nickel Cooling Rods
Cooling Flange
Chambers for Temperature Conditioning of Purge Gas
Figure 1 – Q Series DSC Cell
30 seconds
30 seconds
150ºC/min
100ºC/min
-40
-30
-20
-10
0
10
0
25
50
75
100
125
150
175
[ – –
– –
] De
riv. T
empe
ratu
re (°
C/m
in)
-80 -60 -40 -20 0 20 40 60 80 100 120 140 160 180Temperature (°C)Exo Up
Figure 2 - Indium Melting at 50, 75, 100 and 150 ºC/min.Broken lines are heating rate at the sample
8 TA 297
T1 Signal
T4P Signal
-20
-10
0
10
20
Hea
t Flo
w T
4P (W
/g)
-20
-10
0
10
20
Hea
t Flo
w T
1 (W
/g)
-80 -60 -40 -20 0 20 40 60 80 100 120 140 160 180 200 220Temperature (°C)Exo Up
Figure 3 - Melting Indium at 50, 75, 100 and 150 ºC/minwith (T4P) and Without (T1) Advanced Tzero Capability.
-50
-40
-30
-20
-10
0
10
20
30
[ – –
– –
] H
eat F
low
T1
(W/g
)
-50
-40
-30
-20
-10
0
10
20
30
Hea
t Flo
w T
4P (W
/g)
140 145 150 155 160 165 170 175Temperature (°C)Exo Up
Figure 4. Melting indium at 50, 75, 100 and 150ºC/min showing theoutput of the Advanced Tzero signals and the conventional ∆T signals
(broken lines) at an expanded scale
9 TA 297
50ºC/min 75ºC/min 100ºC/min150ºC/min
157.30°C
156.83°C-28.78J/g
157.65°C
156.88°C-28.46J/g
157.95°C
156.91°C-28.17J/g
158.59°C
156.90°C-27.63J/g
-50
-40
-30
-20
-10
0
10
Hea
t Flo
w T
4P (W
/g)
154 155 156 157 158 159 160 161 162 163 164 165 166Temperature (°C)Exo Up
Figure 5 - Melting Indium at 50, 75, 100 and 150 ºC/minshowing onset, energy and peak max calculations
121.44°C117.59°C-154.8J/g
121.06°C117.46°C-148.4J/g
121.20°C117.17°C-148.9J/g
121.55°C116.51°C-146.4J/g
50ºC/min
75ºC/min
100ºC/min
150ºC/min
-30
-25
-20
-15
-10
-5
0
5
Hea
t Flo
w T
4P (
W/g
)
-80 -60 -40 -20 0 20 40 60 80 100 120 140 160Temperature (°C)Exo Up
Figure 6 - T4P Heat Flow data for PE at heating rates from50 to 150 ºC/min showing onset, energy and peak max calculations
10 TA 297
-5
0
5
10
15
Hea
t Cap
acity
(J/g
/°C
)
-60 -40 -20 0 20 40 60 80 100 120 140Temperature (°C)
Figure 7. Melting of LDPE at 50, 75, 100 and 150ºC/min.Data is displayed in Cp units
100ºC/min
150ºC/min
10ºC/min
50ºC/min
100ºC/min after 50ºC/min cooldown
-2
0
2
4
6
8
Hea
t Cap
acity
(J/g
/°C
)
10 30 50 70 90 110 130 150 170 190Temperature (°C)
Figure 8 - DSC of Rapidly Cooled Polylactide at Several Heating Rates.(Data are in Cp units, but curves are offset for visual clarity.)

11 TA 297
Figure 9. Universal Analysis Method Editor with PID step highlighted.On the left are the method steps, on the right is a menu
of available method step choices.