high pressure raman spectra of amino acid crystals · 2018-09-25 · high pressure raman spectra of...
TRANSCRIPT

2
High Pressure Raman Spectra of Amino Acid Crystals
Paulo de Tarso Cavalcante Freire Joseacute Alves Lima Juacutenior Bruno Tavares de Oliveira Abagaro
Gardecircnia de Sousa Pinheiro Joseacute de Arimateacutea Freitas e Silva Josueacute Mendes Filho and Francisco Erivan de Abreu Melo
Departamento de Fiacutesica Universidade Federal do Cearaacute Brazil
1 Introduction
Amino acids are molecules with general formula HCCO2-NH3+R where R is a lateral chain characteristic of each molecule which form the proteins of all living beings Due the fact that both hydrogen bonding (HB) interactions play a central role on the secondary structure of proteins and the amino acids in crystal structure present complex networks of HB they have been studied extensively in the last years (Barthes et al 2004 Boldyreva et al 2003a 2003b 2004 2005a 2007a 2007b Dawson et al 2005 Destro et al 1988 Faccedilanha Filho et al 2008 2009 Freire 2010 Funnel et al 2010 Goryainov et al 2005 2006 Harding amp Howieson 1976 Hermiacutenio da Silva et al 2009 Lima et al 2008 Migliori et al 1988 Murli et al 2003 Olsen et al 2008 Sabino et al 2009 Teixeira et al 2000 Tumanov et al 2010 Yamashita et al 2007) These studies can be seen as important background to understand both static structure and dynamics properties of proteins such as denaturation renaturation folding itself changes of folds among others (Freire 2010) The simplest protein amino acid is -glycine which was investigated by Raman spectroscopy under high pressure conditions being discovered that up to 23 GPa the crystal structure does not undergo any phase transition although modifications in the Raman spectra indicate changes in the intra-layer HB interactions (Murli et al 2003) In this chapter we investigate the effect of high hydrostatic pressure on L-histidine hydrochloride monohydrate (HHM) and L-proline monohydrate (PM) crystals in particular observing the effect of pressure on the vibrations related to hydrogen bonds observed in these amino acid crystals
2 State of the art
Many works have investigated high pressure vibrational and structural properties of amino acid crystals The simplest amino acid is glycine which at atmospheric pressure presents at least three different polymorphs When pressure is applied to the different polymorphs different results are obtained In this way when glycine is submitted to high pressure up to 23 GPa no structural modification is verified (Murli et al 2003) Relatively short N-HhellipO hydrogen bonds form layers parallel to the ac plane and the layers are connected by much
wwwintechopencom
Vibrational Spectroscopy
38
weaker bifurcated N-HhellipO hydrogen bond forming anti-parallel double layers (Murli et al 2003) The difficult of rearranging the double layers in the crystal structure is an explanation for the stability of -glycine with respect to pressure (Boldyreva 2007b) Such a fact the stability of the structure under high pressure conditions is very different from what is observed with - and -glycine The -glycine has a crystal structure very similar to the -glycine although this last polymorph is most stable and should be obtained from the -polymorph under humid conditions (Dawson et al 2005) For -glycine it was observed through both Raman and polarizing spectroscopies a reversible phase transition at 076 GPa (Goryainov et al 2005) Such a phase transition is accompanied by pronounced changes in the Raman spectra of the material in particular by jumps and kinks at the curves of frequency versus pressure (for the band associated to NH3 rock the jump is higher than 10 cm-1) Additionally the transition is characterized by a rapid propagation of an interphase boundary accompanied by the crack formation in the crystal as verified by authors of Ref (Goryainov et al 2005) On decompression the high pressure phase (rsquo-glycine) transforms back to the -glycine without hysteresis (Goryainov et al 2005) which is not a general result among amino acid crystals While the and forms of glycine crystallize in a monoclinic structure respectively with space groups P21n and P21 -glycine crystallizes in a trigonal symmetry (P31) (Boldyreva et al 2003a) Under ambient conditions the and -forms of glycine are stable for a very long time but under high temperature (T ~ 440 K) it is observed a phase transition from the - to the-polymorph of glycine On the other hand it is interesting to note that even the -form being thermodynamically slightly less stable than the -form at low temperatures its transformation to the -form is apparently kinetically hindered (Boldyreva et al 2003b) Related to the behavior of -glycine under hydrostatic pressure some studies have investigated this subject Under the scrutiny of X-ray diffraction authors of Ref (Boldyreva et al 2004) observed that -glycine undergoes a phase transition beginning at 27 GPa characterized by an abrupt change in the unit cell volume such a phase transition is not completed even to pressures of 78 GPa On compression up to 25 GPa -glycine structure is changing anisotropically in such a way that the ac ratio decreases At 27 GPa the reflection of a new phase -glycine begins to appear but when pressure is released even at ambient pressure the new phase did not disappears completely In other words part of the high pressure -glycine phase remains down to the atmospheric pressure and the transformation was not completely reversible (Boldyreva et al 2005a) On decompression of the and phases additionally it was observed the appearance of another new phase at 062 GPa glycine which could be observed both by Raman and optical spectroscopies (Goryainov et al 2006) Among the amino acids L-alanine is the most studied crystalline system and although a great number of works has visited its physical and chemical properties there are some interesting non conclusive questions related to it For example although there is no indication for occurrence of temperature induced phase transition it is known that the c lattice parameter of L-alanine increases with decreasing temperature (Destro et al 1988) by a step-wise dynamics (Barthes et al 2004) Under low temperature authors of Ref (Migliori et al 1988) have observed an unusual behavior of the intensities of the low wavenumber modes at 41 and 49 cm-1 associating the phenomenon to the occurrence of localized vibrational states Such modes have also an intriguing behavior with high pressure conditions between 0 and 23 GPa the lowest wavenumber band increases intensity while
wwwintechopencom
High Pressure Raman Spectra of Amino Acid Crystals
39
the band at 49 cm-1 decreases above the critical pressure of 23 GPa an inverse effect is observed eg the lowest wavenumber band decreases in intensity while the other band increases its intensity (Teixeira et al 2000) Beyond this under the scrutiny of the behavior of lattice modes of L-alanine through Raman spectroscopy it was reported the evidence of a structural phase transition at ~ 23 GPa (Teixeira et al 2000) that seems to be confirmed by X-ray diffraction measurements (Olsen et al 2008) However very recent works reinterpreted X-ray diffraction measurements as conformational changes of the ammonia group (Funnel et al 2010 Tumanov et al 2010) Additionally (i) the Raman scattering data were not correlated with a structural phase transition only with continuous changes in the intermolecular interactions (Tumanov et al 2010) (ii) at about 2 GPa the cell parameters a and b become accidentally equal to each other (Funnel et al 2010 Tumanov et al 2010) but maintaining the same orthorhombic structure (P212121) differently from the work of ref (Olsen et al 2008) that interpreted the X-ray diffraction results as an orthorhombic tetragonal phase transition There are three other aliphatic amino acids which were investigated by Raman spectroscopy under high pressure conditions L-leucine L-isoleucine and L-valine At atmospheric pressure and room temperature L-leucine (C6H13NO2) crystallizes in a monoclinic structure (C22) (Harding amp Howieson 1976) although there are reports of a second phase for temperatures higher than 353 K (Faccedilanha Filho et al 2008) and a third polymorph resulting from residues of a solution at 200 Ma (Yamashita et al 2007) A series of modifications on the Raman spectrum of L-leucine crystal were observed when it was submitted to high pressure conditions (Faccedilanha Filho et al 2009) The modifications occur in three different pressure ranges (i) between 0 and 046 GPa (ii) between 08 and 146 GPa and (iii) at around 36 GPa The first modification observed in the Raman spectra involves motions of the CH and CH3 units as can be understood from the behavior of the bands in the high wavenumber region (about 3000 cm-1) It is worth to note that such a change is also associated to the hydrogen bond changes because an increasing in the line width of a band associated with the torsion of CO2- is verified across the pressure of 046 GPa although there is no great change in the lattice modes Differently the changes observed between 08 and 146 GPa occurs both in the internal modes and in the lattice modes of the crystal indicating a structural phase transition undergone by L-leucine Finally around 36 GPa change of the slopes of the frequency versus pressure plots associated with CO2- moieties were observed pointing to changes associated to hydrogen bonds (Faccedilanha Filho et al 2009) The Raman spectrum of L-valine (C5H11NO2) under high pressure conditions presents several changes between 00 and 69 GPa (Hermiacutenio da Silva et al 2009) In particular an extraordinary increase of intensity of the C ndash H stretching bands is verified at about 3 GPa and a decrease of intensity is observed at ~ 53 GPa Simultaneously discontinuities are observed in the frequency versus pressure plots for all modes of the Raman spectrum in these two pressure values indicating possible phase transitions undergone by the crystal L-isoleucine (C6H13NO2) was another aliphatic amino acid whose Raman spectra were investigated under high pressure (Sabino et al 2009) From this preliminary study it were observed changes on bands associated with both the rocking of NH3+ r(NH3+) and the rocking of CO2- r(CO2-) as well as to lattice modes at ~ 23 GPa and 50 GPa Such modifications in L-isoleucine were associated with conformational change of molecules or to a phase transition undergone by the crystal However a confirmation of the occurrence of phase transitions for L-valine L-leucine and L-isoleucine through X-ray diffraction or neutron diffraction is still lacking
wwwintechopencom
Vibrational Spectroscopy
40
Two sulfur amino acids were investigated under high pressure conditions L-methionine (Lima et al 2008) and L-cysteine (Minkov et al 2008 2010 Moggach et al 2006 Murli et al 2006) L-methionine (C5H11NO2S) crystallizes in a monoclinic structure and under compression undergoes a phase transition at about 22 GPa This modification is realized by the observation of the appearance of a very strong peak between the bands associated to stretching of SC (SC) and wagging vibration of CO2- (CO2-) At P = 27 GPa the intensity of the bands (SC) and (CO2-) goes to zero Additionally two new structures are observed around 540 cm-1 in the region where it is expect to be observed the band associated to the rocking of CO2- r(CO2-) Such a picture was interpreted as a phase transition undergone by L-methionine crystal with a hysteresis of about 08 GPa On the other hand L-cysteine can crystallize in two different polymorphs with orthorhombic and monoclinic symmetries (Minkov et al 2010) For the monoclinic polymorph of L-cysteine it was observed phase transitions at about 29 and 39 GPa with the changes in the Raman spectra suggesting that the hydrogen bond network is distorted and the S-HhellipO bonding dominates over S-HhellipS bonding at high pressures For the orthorhombic polymorph a series of different phase transition occurs but with no evidence that it transforms into the most dense monoclinic polymorph which is also stable at atmospheric pressure It is worth to note that the phase transitions in the orthorhombic L-cysteine involve changes in molecular conformation while the pressure-induced phase transitions in the monoclinic phase are mainly related to changes in the hydrogen bond network (Minkov et al 2010) L-threonine (C4H9NO3) (Silva et al 2000) was investigated up to 43 GPa through Raman spectroscopy From this study it was observed several modifications in the Raman spectrum including the region associated to the lattice mode vibrations mainly between 2 and 22 GPa Other modifications above 3 GPa were also observed but no X-ray diffraction experiment was performed up to now which would confirm the occurrence of eventual phase transition undergone by L-threonine crystal L-serine was also investigated under high pressure conditions (Boldyreva et al 2005b 2006a 2006b Moggach et al 2005 2006) From x-ray diffraction measurements (Moggach et al 2005) it was observed that at ~ 48 GPa the crystal undergoes a phase transition with changes in the hydrogen bond network while the low pressure phase is characterized by OHhellipOH hydrogen bond chains in the high pressure phase it is observed shorter OHhellipcarboxyl interactions Yet Ref (Moggach et al 2005) shows that the phase transition occurs with change in two torsion angles but with any major changes in the orientations of the molecules in the unit cell Study of Ref (Boldyreva et al 2006b) confirms the phase transition previously reported in Ref (Moggach et al 2005) although with a transition pressure value of ~ 53 GPa and points the existence of another phase transition at 78 GPa In this second phase transition new OHhellipO(CO) hydrogen bond and a new NHhellipOH bond are formed showing that OH-group becomes both a proton donor and a proton acceptor Finally finishing this picture of the state of the art of vibrational and structural aspects of amino acid crystals under high pressure we briefly discuss results on L-asparagine monohydrate which was investigated both by Raman spectroscopy (Moreno et al 1997) and by X-ray diffraction experiments (Sasaki et al 2000) Both studies point to the occurrence of three different phase transitions between 00 and 13 GPa which constitute up to now the most unstable amino acid crystal structure In all these investigations the occurrence of phase transitions involving change in the dimension of the several HB in the unit cell seems to be the role An extension of studies of
wwwintechopencom
High Pressure Raman Spectra of Amino Acid Crystals
41
amino acid crystals under high pressure conditions investigated by Raman spectroscopy for L-histidineHClH2O and L-proline monohydrate is given here
3 Experimental
The samples of HHM were grown from aqueous solution by the slow evaporation method at controlled temperature The samples of PM polycrystals were obtained from reagent grade (Sigma Aldrich) and used without further purification Raman experiments on HHM were performed in the backscattering geometry employing a Jobin Yvon Triplemate 64000 micro-Raman system equipped with a N2-cooled charge-coupled device (CCD) detection system while for Raman experiments on PM it was employed an HR 460 Jobin Yvon spectrometer The slits were set for a 2 cm-1 spectral resolution Raman spectra were excited with the 5145 nm line of an argon ion laser The high-pressure experiments at room temperature were performed on a small piece of sample compressed using a diamond anvil cell (model NBS mdash National Bureau of Standards) For the Raman experiments on PM it was used a membrane diamond anvil cell (MDAC) with a 400 m culet diameter diamonds as the pressure device A 150 m-diameter hole in a stainless-steel (200 m of initial thickness preindented to 40 m) was loaded with argon while a 200 m-diameter hole in a stainless-steel with a 230 m of initial thickness was loaded with mineral oil in the study of L-histidineHClH2O An Olympus microscope lens with a focal distance f = 205 mm and a numerical aperture 035 was used to focus the laser beam on the sample surface which was located in the pressure cell The pressure in the cell was monitored using the standard shifts of the Cr3+Al2O3 emission lines
4 Results
41 L-proline monohydrate In this sub-section we present investigation of polycrystalline PM under hydrostatic pressure up to 118 GPa It is important to state that the sample used in the experiment had a small quantity of anhydrous phase (about 8 according to the Rietveld refinement) in such a way that the structure can be considered as monoclinic L-proline monohydrate
Fig 1 Unit cell of PM seen along the b-axis
wwwintechopencom
Vibrational Spectroscopy
42
PM (see Figure 1) crystal is found in a monoclinic structure space group C2with a = 2043 Aring b = 619 Aring c = 514 Aring and = 9579deg and Z=4 (Seijas et al 2010) In such a material the hydrogen bonds play a special role in the stability of the crystal structure X-ray diffraction study shows that there are interactions between amino and carboxylate groups through the hydrogen bonds N1-H1hellipO1 N1-H1hellipO2 and N1-H2hellipO1 with H1 atom acting as a bifurcated donor taking part in two hydrogen bonds These hydrogen bonds link the proline molecules forming pairs of chains in opposite directions along the c axis The water molecules form zigzag chains of O-HhellipO hydrogen bonds also parallel to the c axis (Seijas et al 2010) Figure 2 presents the Raman spectra of polycrystalline PM crystal in the spectral range 10 ndash 250 cm-1 for pressures from 00 to 118 GPa The spectrum taken at 00 GPa shows a complex profile indicating the occurrence of several bands in fact fitting with Lorentzian curves
Fig 2 Raman spectra of PM under several pressure conditions from 00 to 118 GPa in the spectral range 50 ndash 250 cm-1
wwwintechopencom
High Pressure Raman Spectra of Amino Acid Crystals
43
points to the existence of six bands between 10 and 160 cm-1 When pressure is increased great changes are observed in the Raman profile of the spectrum At 11 GPa the Raman spectrum of L-proline is very different from that obtained at 00 GPa (i) the mode peaked at ~ 68 cm-1 becomes the most intense band in the spectrum at 11 GPa (ii) the most intense peak in the spectrum taken at 00 GPa decreases intensity and in the spectrum taken at 11 GPa it is only the second most intense peak in the region 10 ndash 250 cm-1 (iii) the peaks marked by arrows in the spectrum at 00 GPa increase intensity Such a set of modifications point to the possibility of the occurrence of a phase transition undergone by polycrystalline L-proline for pressures below 11 GPa Results on other spectral regions of the Raman spectrum will reinforce this hypothesis It is observed a gradual change of intensity of all bands appearing in the Raman spectra of Figure 2 as well as continuous blue shifts of all wavenumbers when pressure is increased from 111 to 65 GPa The gradual change of the profiles of the Raman spectrum can be interpreted as continuous changes of the conformation of the molecules of L-proline in the unit cell of the crystal However between 65 and 78 GPa it is observed a strong change in the profile of the Raman spectrum in the low wavenumber region In particular the most intense band observed in the spectrum taken at 65 GPa lost intensity becoming one of the peaks with lowest intensity Additionally jump in the wavenumber of almost all bands are also verified in this pressure interval (65 - 78 GPa) As a consequence we have interpreted the changes of the Raman spectrum as a phase transition undergone by polycrystalline L-proline between 65 and 78 GPa Other evidences will be shown in the next paragraphs Finally when we decrease pressure from the highest value obtained in our experiments down to atmospheric pressure we observe that the original spectrum ndash bottom spectrum in Figure 2 ndash is recovered (the final spectrum is marked as 00 GPa) Figure 3 presents the Raman spectra of PM crystal for several pressures in the spectral range 200 ndash 750 cm-1 According to Ref (Herlinger amp Long 1970) (see also Table 1) the band recorded close to 294 cm-1 in the 00 GPa spectrum can be associated to a deformation vibration of the skeleton of the structure (skel) The bands observed at 377 and 447 cm-1 are associated respectively to the bending of CCN (CCN) and rocking of CO2- r(CO2-) In fact for other amino acid crystals it has been reported that the r(CO2-) is the most intense band in the 200 ndash 700 cm-1 spectral range However for the other amino acids differently from L-proline the r(CO2-) mode is observed for wavenumber higher than 500 cm-1 (-glycine 503 cm-1 (Dawson et al 2005) L-alanine 532 cm-1 L-valine 542 cm-1 (Goryainov et al 2005) DL-alanine 543 cm-1 etc) Finally in the spectrum taken at 00 GPa we can observe a band at 574 cm-1 which was associated to a bending of CO2- group Finally bands at 641 669 and 695 cm-1 were associated respectively to wagging of CO2- w(CO2-) (skel) and scissoring of CO2- sc(CO2-) By increasing the pressure we observe that between 00 and 11 GPa some important modifications are present For example the band (CCN) decreases intensity and seems to split A clear splitting is observed for the band at 574 cm-1 and the r(CO2-) band at 447 cm-1 begins to present a shoulder in the high wavenumber side Additionally the (skel) band at 669 cm-1 (marked by an asterisk in the spectrum of 00 GPa) disappears between the two lowest pressure spectra This entire complex picture corroborates the fact that the crystal is undergoing a phase transition between 00 and 11 GPa If one continues to increase pressure on the PM crystal it is possible to observe that all bands suffer blue shifts up to 65 GPa also in general terms the linewidth increases for all bands However no great changes are observed indicating that the crystal structure
wwwintechopencom
Vibrational Spectroscopy
44
Fig 3 Raman spectra of PM under several pressure conditions from 00 to 118 GPa in the spectral range 250 ndash 750 cm-1
remains the same of that observed at 11 GPa In other words the crystal seems to be stable between 11 to 65 GPa But when pressure arrives to 78 GPa great modifications are observed in the 200 ndash 700 cm-1 spectral region Let us state these modifications (i) the appearance of a band (marked by an arrow in the spectrum taken at 78 GPa) in the region ~ 450 cm-1 (ii) an impressive fall of intensity and a red shift of the band associated to r(CO2-) (iii) a red shift of the two bands in the region 550 ndash 600 cm-1 (iv) the appearance of low intense bands (marked by an asterisk in the spectrum taken at 78 GPa) for wavenumbers higher than 600 cm-1 (v) the increase of intensity of the band initially assigned as scissoring of CO2- (vi) the appearance of a band at ~ 725 cm-1 Again the modifications in the spectra between 65 and 78 GPa presented in Figure 3 corroborate the fact that PM crystal undergoes a second phase transition as discussed previously When pressure is released down to 00 GPa whose spectrum is marked by 00 GPa we observe that the starting atmospheric spectrum is recovered as already observed in Figure 2 Figure 4 presents the Raman spectra of PM crystal under high pressure conditions with argon as compression medium in the region 600 to 1250 cm-1 We have cut off the peaks in the region close to 900 cm-1 because there is a peak with high intensity that makes difficult the visualization of the bands close to it this region will be discussed in Figure 5 In the Figure 4 we observe that several peaks are well defined (the peak marked by an asterisk is due a lamp used to calibrate the spectra) It is important to state that in the spectrum at 00
wwwintechopencom
High Pressure Raman Spectra of Amino Acid Crystals
45
Wavenumber (cm-1) Assignment Wavenumber (cm-1) Assignment
68 Lattice mode 950 (CCN)+(CC)
81 Lattice mode 982 v(CCN)+(CC)
99 Lattice mode 991 (CCN)+(CC)
120 Lattice mode 1031 (CCN)+(CC)
134 Lattice mode 1055 w(CH2)
149 Lattice mode 1079 w(CH2)
203 - 1084 r(CH2)
294 (skel) 1161 t(CH2)
373 (CCN) 1172 t(CH2)
447 r(CO2-) 2876 (CH)
574 (CO2-) 2898 (CH)
641 w(CO2-) 2932 (CH)
669 (skel) 2949 (CH)
695 sc(CO2-) 2971 (CH)
791 (skel) 2983 (CH)
840 r(CH2) 3006 (CH)
863 r(CH2) 3011 (CH)
897 r(NH2+) 3041 (NH)
918 (CCN)+(CC) 3068 (NH)
Table 1 Wavenumber (in cm-1) and approximate assignments of Raman bands for L-proline monohydrate crystal where def deformation bending r rocking w wagging sc scissoring stretching t twisting
GPa there are two peaks between 975 and 1000 cm-1 and in the spectrum taken at 11 GPa only one band is observed Another aspect that worth note is the fact that the band of highest energy (~ 1172 cm-1 at 00 GPa twisting of CH2 t(CH2)) splits in the spectrum taken at 11 GPa Above this last pressure the intensity of the peaks remains approximately constant up to 65 GPa Between 65 and 78 GPa the Raman spectrum presents great changes The band associated to the rocking of CH2 r(CH2) observed initially at ~ 840 cm-1 presents both a jump to high wavenumbers and an increasing in its linewidth A splitting is observed for the band marked by an star in the spectrum recorded at 65 GPa and observed initially at ~ 950 cm-1 which is associated to the stretching of CCN and CC units (CCN) + (CC) If one observe the band at 1033 cm-1 which is associated to the wagging of CH2 w(CH2) interestingly between 65 and 78 GPa it changes intensity with the band marked by a down arrow in the spectrum taken at 65 GPa so the w(CH2) band lost intensity and the band marked by a down arrow increases intensity Similarly the low intense bands observed between 1080 and 1200 cm-1 present great changes in their intensities between 65 and 78 GPa All these changes corroborate the modification in the crystal structure which occurs above 65 GPa which are reversible when pressure is released down to 00 GPa
wwwintechopencom
Vibrational Spectroscopy
46
Fig 4 Raman spectra of PM under several pressure conditions from 00 to 118 GPa in the spectral range 600 ndash 1250 cm-1
Figure 5 shows the Raman spectra of PM crystal in the 800 ndash 1100 cm-1 spectral region The dominant band in the spectrum taken at 00 GPa observed at 897 cm-1 is associated to the rocking vibration of NH2+ r(NH2+) The changes occurring in the first phase transition are not impressive but we note that between 65 and 78 GPa the band lost intensity and splits into two bands Above 78 GPa blue shifts of the wavenumbers are verified but no great change is present up to the highest pressure arrived in the experiment Decreasing pressure down to 00 GPa again we observe that the original spectrum is also recovered in this region In the spectral region presented in Figure 6 it is expected to be observed bands associated to the stretching vibrations of CH and CH2 units A theoretical study performed on L-methionine showed that different profiles of the Raman spectrum in this wavenumber range are associated with different conformations of the molecule In this sense when we observe the Raman spectra of PM as a function of pressure we note that between 00 and 11 GPa the most intense band at 00 GPa split into three bands (marked by up arrows) In the spectrum taken at 17 GPa the separation is very clear and when pressure is further increased the bands become clearly distinct But between 65 and 78 GPa the spectrum changes abruptly indicating that between these two pressure values the proline molecules undergo a great conformational change Because we have observed additionally changes in the low wavenumber region we can understand that both conformational change and structural phase transition take place for PM crystal As observed in the other spectral regions the original spectrum at 00 GPa is recovered when pressure is released
wwwintechopencom
High Pressure Raman Spectra of Amino Acid Crystals
47
Fig 5 Raman spectra of PM under several pressure conditions from 00 to 118 GPa in the spectral range 800 ndash 1100 cm-1
Data can give us some insights related to the behaviour of molecules of proline as the crystal is compressed For example in a previous study on -glycine the softening of a bending of CO2- was associated to a decrease in the intra-layer hydrogen bond strength while the stiffening of the same vibration was associated to an increase in the bond strength (Dawson et al 2005) For PM we have observed that the band associated to both bending of CO2- (CO2-) and rocking of CO2- r(CO2-) increase wavenumbers from 11 to 65 GPa and between 65 and 78 GPa decrease wavenumber for (CO2-) the decreasing is represented by the two dashed lines in Figure 3 between the spectra of 65 and 78 GPa We have also observed an additional increasing of wavenumbers for pressures higher than 78 GPa This suggests that the intra-layer hydrogen bond strength is stiffened up to 65 GPa between 65 and 78 GPa the hydrogen bond strength is softened and above 80 GPa the hydrogen bond is stiffened Additionally our results suggest that between 65 and 78 GPa occurs a structural rearrangement in such a way that the behaviour of the hydrogen bond strengths is changed This rearrangement is enough to change the symmetry of the crystal because
wwwintechopencom
Vibrational Spectroscopy
48
Fig 6 Raman spectra of PM under several pressure conditions from 00 to 118 GPa in the spectral range 2850 ndash 3200 cm-1
associated to it we observe great modifications in the Raman spectrum of low wavenumber region (Figure 2) Yet related to the phase transition between 65 and 78 GPa it is impressive the increase of intensity of a band in the spectrum taken at 65 GPa (marked by an arrow see Figure 4) which can be assigned as wagging of CH2 w(CH2) it change of intensity with the band close to it at ~ 1055 cm-1 at 00 GPa which is also assigned as w(CH2) indicating that a conformational change in the ring may also occurs when the crystal undergoes the phase transition at 65 - 78 GPa It is also interesting to note that the first transition occurs from a monoclinic to a phase with lower symmetry (another monoclinic our a triclinic phase) because in several regions including both internal and lattice mode spectral regions the number of peaks in the spectrum taken at 11 GPa is greater than the number of Raman peaks in the spectrum taken at 00 GPa It is also worth note that above 78 GPa almost all bands increases linewidth indicating that some disorder is introduced in the high pressure phase However the disorder does not occur in a high degree because when pressure is released down to 00 GPa the original spectrum is recovered It is known that the amorphization process is preceded by some disorder in the crystal structure however due to recovered of the original Raman spectrum after releasing pressure we can infer that when we arrive to 1118 GPa we are far away from the pressure point where eventually the PM crystal should present amorphization
wwwintechopencom
High Pressure Raman Spectra of Amino Acid Crystals
49
42 L-histidine hydrochloride monohydrate Related to the HHM (see Figure 8) which crystallizes in an orthorhombic structure belonging to the P212121 (D24) space group with four molecules of C6H9N3O2HClH2O per unit cell we were able to arrive up to 75 GPa and discovery a new polymorph of the material above 31 GPa The strong bond between N-H of the imidazole ring and the carboxyl group of a neighboring molecule is the fundamental intermolecular link resulting in a spiral arrangement along the c-axis (Donohue amp Caron 1964) The coupling of the four zwitterions in the unit cell leads to 297 optical normal modes decomposed into irreducible representations of the factor group D2 as Γop = 75 A + 74 (B1 + B2 + B3) and the acoustic modes can be expressed as Γac = B1 + B2 + B3 Under high pressure conditions modifications the Raman spectra are interpreted in terms of both conformational changes of the molecules in the unit cell and in terms of a phase transition Figure 9(a) presents the Raman spectra of HHM for several pressures in the spectral range from 50 to 660 cm-1 The region for wavenumbers lower than 200 cm-1 as previously stated is characteristic of the lattice vibration modes Increasing pressure we observe that the bands present blue shifts of their wavenumbers However between 27 and 31 GPa it is possible to note that a great change occurs in the Raman spectrum the peak marked by a square which is associated to torsion of CO2- (τ(CO2-)) splits in two new peaks which are marked by up arrows in the spectrum at 31 GPa In Figure 9(b) which presents the plot of experimental wavenumber as function of pressure we clearly observe the splitting of the band close to 180 cm-1 Additionally we note that for other bands discontinuities of wavenumbers are observed between 27 to 31 GPa (De Sousa et al 2011)
Fig 8 Unit cell of HHM seen along the b-axis
In this region it is also possible to observe many internal vibrations of the histidine molecule such as skeletal structure at 442 and 490 cm-1 torsion of NH3+ which is observed at 385 cm-1 and rocking of CO2- at 530 cm-1 Again as occurs with the spectra shown in the lattice mode region modifications are observed in the spectral range 27 - 31 GPa Among these changes we observed the disappearance of the bands at 276 and 500 cm-1 and the
wwwintechopencom
Vibrational Spectroscopy
50
Fig 9 (a) Raman spectra of HHM under several pressure conditions from 04 to 75 GPa in the spectral range 50 ndash 650 cm-1 (b) wavenumber versus pressure of the bands of HHM appearing in Fig 9(a)
appearance of a band at 473 cm-1 in the spectrum taken at 31 GPa We additionally note that the intensity of the band associated to torsion of NH3+ decreases with increasing pressure indicating that there occurs a conformational change of histidine molecule Such a conformational change can be understood as consequence of the change of the intermolecular hydrogen bond length With increasing pressure the band initially at 385 cm-
1 which is associated with a torsion vibration of the NH3+ unit shifts linearly toward higher wavenumbers we can say that the pressure decreases the length of the hydrogen bonds increasing the wavenumber of the band associated to torsional vibration of NH3+ unit Figure 10(a) presents the Raman spectra of HHM in the 650 ndash 1250 cm-1 interval for several pressure values up to 75 GPa In this spectral region it is expected to observe vibrations assigned to the deformation of CO2- stretching of both C-C and C-N wagging of H2O and rocking of NH3+ The band observed at ~ 694 cm-1 is associated to a deformation vibration of CO2- (CO2) while the out-of-plane vibration of CO2- (CO2) is observed at ~ 822 cm-1 The band at 807 cm-1 is associated with a wagging vibration of the water molecule w(H2O) The bands recorded at 1191 and 1210 cm-1 can be assigned as the rocking of NH3+ unit r(NH3+) In this spectral region some changes are observed in the range 27 ndash 31 GPa (i) the disappearance of the band at 694 cm-1 (ii) the appearance of a new weak band at 717 cm-1
(marked by a star in the Figure 10(a)) (iii) the inversion of intensity of the two bands located at 807 and 822 cm-1 which are related to units directly involved in the hydrogen bonds and (iv) the inversion of intensity of the two bands associated to a rocking of NH3+ unit r(NH3+) located at 1191 and 1210 cm-1 The dependence of the wavenumber versus pressure plot for this spectral region is presented in Fig 10(b) we note that many of the observed Raman modes show a small discontinuous change in the slope in the pressure-induced variation of its wavenumber in range 27 ndash 31 GPa
wwwintechopencom
High Pressure Raman Spectra of Amino Acid Crystals
51
Figure 11(a) shows the Raman spectra of the HHM crystal in the spectral range 1700-1400 cm-1 for pressure from 00 to 75 GPa Fig 11(b) shows the respective wavenumber vs pressure plots In this region one expects to observe vibrations assigned to a deformations of the imidazole ring of the histidine molecule asymmetric stretching of the CO2- units stretching of C=O among others In the Figure 11(a) two modifications are observed in the range 27 ndash 31 GPa The first change is the decreasing of the relative intensity of the band originally at 1433 cm-1 and the second one is the appearance of a band at 1642 cm-1 In the wavenumber versus pressure plot presented in Figure 11(b) a subtle discontinuity occurs in the range 27 ndash 31 GPa with appreciably differences in slopes where two modes change from positive to negative slopes
Fig 10 (a) Raman spectra of HHM under several pressure conditions from 04 to 75 GPa in the spectral range 650 ndash 1250 cm-1 (b) wavenumber versus pressure of the bands of HHM appearing in Fig 10(a)
The Raman spectra of HHM crystal in the range 3450-3125 cm-1 are shown in the Figure 12(a) and in the Figure 12(b) the respective wavenumber versus pressure plots are given In this region we expected to observe stretching vibrations of several units of the amino acids and of the water molecule (CH NH3+ and OH-) It is important to note that for wavenumbers lower than 3000 cm-1 there are some modes related to the mineral oil used as compression media In detail the band at 3111 cm-1 can be associated to a stretching vibration of NH3+ unit (NH3+) while the bands observed at 3155 and 3163 cm-1 are associated to a CH stretching vibration of imidazole ring The bands observed at 3374 and 3408 cm-1 are related to the OH- stretching of the water molecules In the pressure range 27 ndash 31 GPa main changes are observed such as the disappearance of the bands related to a OH- stretching vibration (initially located at 3367 and 3393 cm-1) the appearance of a band of weak intensity at 3424 cm-1 and discontinuities of the wavenumber curve of bands at 3155 and 3163 cm-1 which are associated with the CH stretching vibration
wwwintechopencom
Vibrational Spectroscopy
52
Fig 11 (a) Raman spectra of HHM under several pressure conditions from 04 to 75 GPa in the spectral range 1400 ndash 1670 cm-1 (b) wavenumber versus pressure of the bands of HHM appearing in Fig 11(a)
Fig 12 (a) Raman spectra of HHM under several pressure conditions from 04 to 75 GPa in the spectral range 2950 ndash 3450 cm-1 (b) wavenumber versus pressure of the bands of HHM appearing in Fig 12(a)
wwwintechopencom
High Pressure Raman Spectra of Amino Acid Crystals
53
Table 2 gives a quantitative analysis of the evolution of the Raman spectra of HHM crystal with pressure where fitting of all bands to a linear expression ω = ω0 + P is furnished In Table 2 the first column (ωobs) represents the wavenumber of the Raman bands observed at room pressure the second and third columns correspond to adjustment of data for pressure values between 0 and 27 GPa and the two last columns correspond to fitting of the high-pressure phase that observed between 31 and 75 GPa A resume of the modifications observed in all spectral regions of the Raman spectra of HHM is as follows (i) splitting of the band in the low-wavenumber lattice range (ii) change in the number of bands associated to internal modes (iii) wavenumber shifts with discontinuities (iv) changes in the relative intensities of the vibrational bands It is important to state that changes were observed for the deformation vibrations of the OH- of the water molecule as well as of the NH3+ and CO2- groups of the amino acid molecule This picture indicates large conformational changes of the molecules in the unit cell Related to HHM beyond the hydrogen bonds originated from the histidine molecule there are two hydrogen bonds from the water molecule It is interesting to note from Figure 12(b) that the wavenumber of OH- stretching (OH-) decreases with increasing pressure However the OH units participate of hydrogen bonds one to a carboxyl oxygen and another to the chloride ion This means that between 00 and 31 GPa the hydrogen bond strength increases and the wavenumber of(OH-) decreases in this pressure range Also after the phase transition the wavenumber of (OH-) suffers a jump and continues to decrease up to the highest pressure obtained in our experiments Such a picture indicates a further increase of the hydrogen bonds formed by the water molecules and confirms that these bonds are playing an important role in the mechanism of the transition It is interesting to note that similar changes in the low-wavenumber region were also observed for the same crystal when subjected to low temperatures
ωobs
(cm-1)
Phase 1
(0 le P le 27 GPa) Phase 2
(31 le P le 75 GPa)
ω0
(cm-1)
(cm-1)(GPa)-1 ω0
(cm-1)
(cm-1)(GPa)-1
94 945 0669 937 -0103
105 1052 0276 1002 1771
121 1214 -1087 1109 2092
136 1357 1616 1360 0623
149 1497 2128 - -
159 1568 8033 1483 8105
- - - 1639 9960
188 1891 7661 1902 8059
270 2697 3093 - -
293 2919 6118 2945 7683
385 3846 7236 4015 1675
442 4423 1223 4423 1461
wwwintechopencom
Vibrational Spectroscopy
54
ωobs
(cm-1)
Phase 1
(0 le P le 27 GPa) Phase 2
(31 le P le 75 GPa)
ω0
(cm-1)
(cm-1)(GPa)-1 ω0
(cm-1)
(cm-1)(GPa)-1
- - - 4707 0785
491 490 5 3319 - -
530 5304 4335 - -
609 6078 5312 6208 2463
693 6935 1529 - -
- - - 7064 3449
807 8067 2042 8047 1467
824 8240 -0498 8204 1442
838 8361 7335 8504 3124
875 8734 6438 8881 2777
917 9173 0810 9187 2356
963 9630 2757 9636 2411
980 9787 4489 9787 5206
1068 10667 4790 10732 3418
1141 11403 1890 11403 2744
1162 11619 2611 11674 1120
1190 11900 2277 11885 1637
1208 12079 2859 12101 1341
1434 14345 1316 14382 0846
1448 14481 3059 14554 1677
1463 14621 4415 14760 0778
1481 14813 4238 14970 -0619
1609 16093 2739 16166 -0374
- - - 16249 2736
3111 31110 0919 31045 2914
3154 31546 1287 31532 6564
3164 31626 5305 31593 7905
3375 33739 -2638 - -
3407 34081 -5745 - -
- - - 34371 -3169
Table 2 Wavenumber values of the bands appearing in the HHM spectrum at 00 GPa (ωobs) and adjustment data by linear fitting (P) for the two phases
wwwintechopencom
High Pressure Raman Spectra of Amino Acid Crystals
55
5 Conclusions
The results suggested that L-proline monohydrate undergoes two phase transitions one between 00 and 11 GPa and a second between 65 and 78 GPa In both transitions it was possible to observed changes in the spectrum profile discontinuities in the wavenumber versus pressure plots in the lattice region of the spectrum and the appearance of news bands By releasing the pressure after attaining a maximum of 118 GPa the atmospheric pressure spectrum was fully recovered showing that the pressure-induced transitions undergone by polycrystalline L-proline crystal are reversible In the first transition it was observed the splitting of bands associated to (CCN) (CO2-) and (CH) vibrations The band associated to (skel) has disappeared In the second one we have observed the red shift of r(CO2-) significant changes in the intensity of the bands associated to the sc(CO2-) and w(CH2) vibrations and the splits of (CCN) + (CC) and r(NH2+) that also has lost intensity These modifications were interpreted as conformational changes of molecules in the unit cell Because these changes involve moieties that participate in hydrogen bonds we suppose that these hydrogen bonds have also been modified Modifications of hydrogen bonds can trigger some molecular rearrangements that lead to structural phase transitions In our work this hypothesis was supported by the changes that were observed in the region of the lattice modes for both phase transitions Therefore the results suggested two structural phase transitions one between 00 and 11 GPa and another between 65 and 78 GPa accompanied by significant conformational changes of molecules in the L-proline monohydrated crystal The results also suggest that HHM crystal undergoes a phase transition between 27 and 31 GPa when it is submitted to high pressure conditions up to 75 GPa The main changes observed in the Raman spectra was the splitting of the band in the low-wavenumber lattice range change in the number of bands associated to internal modes and wavenumber shifts with discontinuities Having described the behavior of two amino acid crystals under pressure and looked back at the past fourteen years of research we can ask to ourselves what does the future hold Based on the studies performed we believe that the use of several techniques such as neutron and Raman scattering as well as thermal and infrared analyses can help us to give a complete picture about hydrogen bond and the behavior of amino acids under pressure Maybe the study of peptide under similar external conditions should be the next road to be walked
6 Acknowledgment
Authors acknowledge CAPES CNPq and FUNCAP for financial support
7 References
Barthes M Bordallo HN Deacutenoyer F Lorenzo J-E Zaccaro J Robert A amp Zontone F (2004) Micro-transitions or breathers in L-alanine The European Physical Journal B Vol 37 No 3 (February 2004) pp 375-382 ISSN 1434-6028
Boldyreva EV Drebushchak VA Drebushchak TN Paukov IE Kovalevskaya YA amp Shutova ES (2003a) Polymorphism of glycine Part I Journal of Thermal Analysis and Calorimetry Vol 73 No 2 (August 2003) pp 409-418 ISSN 1388-6150
wwwintechopencom
Vibrational Spectroscopy
56
Boldyreva EV Drebushchak VA Drebushchak TN Paukov IE Kovalevskaya YA amp Shutova ES (2003b) Polymorphism of glycine Part II Journal of Thermal Analysis and Calorimetry Vol 73 No 2 (August 2003) pp 419-428 ISSN 1388-6150
Boldyreva EV Ivashevskaya SN Sowa H Ahsbahs H amp Weber H-P (2004) Effect of High Pressure on Crystalline Glycine A New High-Pressure Polymorph Doklady Physical Chemistry Vol 396 No 1 (May 2004) pp 111-114 ISSN 0012-5016
Boldyreva EV Ivashevskaya SN Sowa H Ahsbahs H amp Weber H-P (2005a) Effect of hydrostatic pressure on the -polymorph of glycine 1 A polymorphic transition into a new -form Zeitschrift fuumlr Kristallographie Vol 220 No 1 ( January 2005) pp 50- 57 ISSN 0044-2968
Boldyreva EV Kolesnik EN Drebushchak TN Ahsbahs H Beukes JA amp Weber H-P (2005b) A comparative study of the anisotropy of a lattice strain induced in the crystals of L-serine by cooling down to 100 K or by increasing pressure up to 44 GPa Zeitschrift fuumlr Kristallographie Vol 220 No 1 (January 2005) pp 58- 65 ISSN 0044-2968
Boldyreva EV Kolesnik EN Drebushchak TN Ahsbahs H amp Seryotkin YV (2006a) A comparative study of the anisotropy of a lattice strain induced in the crystals of DL-serine by cooling down to 100 K or by increasing pressure up to 86 GPa A comparison with L-serine Zeitschrift fuumlr Kristallographie Vol 221 No 2 (2006) pp 150- 161 ISSN 0044-2968
Boldyreva EV Sowa H Seryotkin YV Drebushchak TN Ahsbahs H Chernyshev V amp Dmitriev V (2006b) Pressure-induced phase transitions in crystalline L-serine studied by single crystal and gigh-resolution powder X-ray diffraction Chemical Physics Letters Vol 429 No 4-6 (October 2006) pp 474-478 ISSN 0009-2614
Boldyreva E (2007a) Cristalline Amino Acids A Link between Chemistry Materials Science and Biology In Models Mysteries and Magic of Molecules Boeyens JCA amp Ogilvie JF pp 167-192 Springer ISBN 978-1-4020-5940-7 Netherlands
Boldyreva E (2007b) High-Pressure Polymorphs of Molecular Solids When Are They Formed and When Are They Not Some Examples of the Role of Kinetic Control Crystal Growth amp Design Vol 7 No 9 (August 2007) pp 1662-1668 ISSN 1528-7483
Dawson A Allan DR Belmonte SA Clark SJ David WIF McGregor PA Parsons S Pulham CR amp Sawyer L (2005) Effect of high pressure on the crystal structures of polymorphs of glycine Crystal Growth amp Design Vol 5 No 4 (May 2005) pp 1415-1427 ISSN 1528-7483
Destro R Marsh RE amp Bianchi R (1988) A low-temperature (23K) study of L-alanine The Journal of Physical Chemistry Vol 92 No 4 (February 1988) pp 966-973 ISSN 0022-3654
De Sousa GP Freire PTC Lima Jr JA Mendes Filho J amp Melo FEA (2011) High-pressure Raman spectra of L-histidine hydrochloride monohydrate cristal Vibrational Spectroscopy Vol 57 No 1 (September 2011) pp 102-107 ISSN 0924-2031
Donohue J amp Caron A (1964) Refinement of cristal structure of histidine hydrochloride monohydrate Acta Crystallographica Vol 17 No 9 (September 1964) pp 1178-amp ISSN 0108-7673
wwwintechopencom
High Pressure Raman Spectra of Amino Acid Crystals
57
Faccedilanha Filho PF Freire PTC Lima KCV Mendes Filho J Melo FEA amp Pizani PS (2008) High temperature Raman spectra of L-leucine crystals Brazilian Journal of Physics Vol 38 No 1 (March 2008) pp 131-137 ISSN 0103-9733
Faccedilanha Filho PF Freire PTC Melo FEA Lemos V Mendes Filho J Pizani PS amp Rossatto DZ (2009) Pressure-induced phase transitions in L-leucine crystal Journal of Raman Spectroscopy Vol 40 No 1 (January 2009) pp 46-51 ISSN 1097-4555
Freire PTC (2010) Pressure-Induced Phase Transitions in Crystalline Amino Acids In High Pressure Crystallography ndash From Fundamental Phenomena to Technological Applications Boldyreva E amp Dera P pp 559-572 Springer ISBN 978-904-8192-60-1 New York USA
Funnel NP Dawson A Francis D Lennie DR Marshall WG Moggach SA Warren JE amp Parsons S (2010) The effect of pressure on the crystal structure of l-alanine CrystEngComm Vol 12 No 9 (September 2010) pp 2573-2583 ISSN 1466-8033
Goryainov SV Kolesnik EN amp Boldyreva EV (2005) A reversible pressure-induced phase transition in -glycine at 076 GPa Physica B Condensed Matter Vol 357 No 3-4 (March 2005) pp 340-347 ISSN 0921-4526
Goryainov SV Kolesnik EN amp Boldyreva EV (2006) Raman observation of a new (ζ) polymorph of glycine Chemical Physics Letters Vol 419 No 4-6 (February 2006) pp 496-500 ISSN 0009-2614
Harding MM amp Howieson RM (1976) L-Leucine Acta Crystallographica Section B Vol 32 No 2 (February 1976) pp 633-634 ISSN 1600-5740
Herlinger AW amp Long TV (1970) Laser Raman and infrared spectra of amino acids and their metal complexes 3 Proline and bisprolinato complexes Journal of the American Chemical Society Vol 92 No 22 (November 1970) pp 6481-6486 ISSN 0002-7863
Hermiacutenio da Silva J Lemos V Freire PTC Melo FEA Mendes Filho J Lima Jr JA amp Pizani PS (2009) Stability of the crystal structure of L-valine under high pressure Physica Status Solidi B Vol 246 No 3 (March 2009) pp 553-557 ISSN 0370-1972
Lima JA Freire PTC Melo FEA Lemos V Mendes Filho J amp Pizani PS (2008) High pressure Raman spectra of L-methionine Crystal Journal of Raman Spectroscopy Vol 39 No 10 (October 2008) pp 1356-1363 ISSN 1097-4555
Migliori A Maxton PM Clogston AM Zirngiebl E amp Lowe M (1988) Anomalous temperature dependence in the Raman spectra of l-alanine Evidence for dynamic localization Physical Review B Vol 38 No 18 (December 1988) pp 13464-13467 ISSN 1098-0121
Minkov VS Krylov AS Boldyreva EV Goryainov SN Bizyaev SN amp Vtyurin AN (2008) Pressure-Induced Phase Transitions in Crystalline L- and DL-Cysteine The Journal of Physical Chemistry B Vol 112 No 30 (July 2008) pp 8851-8854 ISSN 1520-6106
Minkov VS Goryainov SV Boldyreva EV amp Goumlrbitz CH (2010) Raman study of pressure-induced phase transitions in the crystals of orthorhombic and monoclinic polymorphs of L-cysteine dynamics of the side-chain Journal of Raman Spectroscopy Vol 41 No 12 (December 2010) pp 1458-1468 ISSN 1097-4555
Moggach SA Allan DR Morrison PA Parsons S amp Sawyer L (2005) Effect of pressure on the crystal structure of L-serine-I and the crystal structure of L-serine-II
wwwintechopencom
Vibrational Spectroscopy
58
at 54 GPa Acta Crystallographica Section B Vol 61 No 1 (February 2005) pp 58-68 ISSN 0108-7681
Moggach SA Marshall WG amp Parsons S (2006) High-pressure neutron diffraction study of L-serine-I and L-serine-II and the structure of L-serine-III at 81 GPa Acta Crystallographica Section B Vol 62 No 5 (October 2006) pp 815-825 ISSN 0108-7681
Moreno AJD Freire PTC Melo FEA Arauacutejo-Silva MA Guedes I Mendes Filho J (1997) Pressure-induced phase transitions in monohydrated l-asparagine aminoacid crystals Solid State Communications Vol 103 No 12 (September 1997) pp 655-658 ISSN 0038-1098
Murli C Sharma SK Karmakar S amp Sikka SK (2003) -Glycine under high pressures a Raman scattering study Physica B Condensed Matter Vol 339 No 1 (November 2003) pp 23-30 ISSN 0921-4526
Murli C Vasanthi R amp Sharma SM (2006) Raman spectroscopic investigations of DL-serine and DL-valine under pressure Chemical Physics Vol 331 No 1 (December 2006) pp 77-84 ISSN 0301-0104
Olsen JS Gerward L Freire PTC Mendes Filho J Melo FEA amp Souza Filho AG (2008) Pressure-induced phase transitions in L-alanine crystals Journal of Physics and Chemistry of Solids Vol 69 No 7 (July 2008) pp 1641-1645 ISSN 0022-3697
Sabino AS De Sousa GP Luz-Lima C Freire PTC Melo FEA amp Mendes Filho J (2009) High-pressure Raman spectra of L-isoleucine crystals Solid State Communications Vol 149 No 37-38 (October 2009) pp 1553-1556 ISSN 0038-1098
Sasaki JM Freire PTC Moreno AJD Melo FEA Guedes I Mendes Filho J Shu J Hu J amp Matildeo HK (2000) Single crystal X-ray diffraction in monohydrate L-asparagine under hydrostatic pressure Science and Technology of High Pressure Proceedings of AIRAPT-17 Hyderabad India 2000
Seijas LE Delgado GE Mora AJ Fitch AN amp Brunelli M (2010) On the Crystal structures and hydrogen bond patterns in proline pseudopolymorphs Powder Diffraction Vol 25 No 3 (September 2010) pp 235-240 ISSN 0885-7156
Silva BL Freire PTC Melo FEA Mendes Filho J Pimenta MA amp Dantas MSS (2000) High-pressure Raman spectra of L-threonine crystal Journal of Raman Spectroscopy Vol 31 No 6 (June 2000) pp 519-522 ISSN 1097-4555
Teixeira AMR Freire PTC Moreno AJD Sasaki JM Ayala AP Mendes Filho J amp Melo FEA (2000) High-pressure Raman study of l-alanine crystal Solid State Communications Vol 116 No 7 (October 2000) pp 405-409 ISSN 0038-1098
Tumanov NA Boldyreva EV Kolesov BA Kurnosov AV amp Quesada Cabrera R (2010) Pressure-induced phase transitions in L-alanine revisited Acta Crystallographica Section B Vol 66 No 4 (August 2010) pp 458-371 ISSN 1600-5740
Yamashita M Inomata S Ishikawa K Kashiwagi T Matsuo H Sawamura S amp Kato M (2007) A high-pressure polymorph of L--leucine Acta Crystallographica Section E Vol 63 No 5 (May 2007) pp o2762-o2764 ISSN 1600-5368
wwwintechopencom
Vibrational SpectroscopyEdited by Prof Dominique De Caro
ISBN 978-953-51-0107-9Hard cover 168 pagesPublisher InTechPublished online 24 February 2012Published in print edition February 2012
InTech EuropeUniversity Campus STeP Ri Slavka Krautzeka 83A 51000 Rijeka Croatia Phone +385 (51) 770 447 Fax +385 (51) 686 166wwwintechopencom
InTech ChinaUnit 405 Office Block Hotel Equatorial Shanghai No65 Yan An Road (West) Shanghai 200040 China
Phone +86-21-62489820 Fax +86-21-62489821
The infrared and Raman spectroscopy have applications in numerous fields namely chemistry physicsastronomy biology medicine geology mineralogy etc This book provides some examples of the use ofvibrational spectroscopy in supramolecular chemistry inorganic chemistry solid state physics but also in thefields of molecule-based materials or organic-inorganic interfaces
How to referenceIn order to correctly reference this scholarly work feel free to copy and paste the following
Paulo de Tarso Cavalcante Freire Joseacute Alves Lima Juacutenior Bruno Tavares de Oliveira Abagaro Gardecircnia deSousa Pinheiro Joseacute de Arimateacutea Freitas e Silva Josueacute Mendes Filho and Francisco Erivan de Abreu Melo(2012) High Pressure Raman Spectra of Amino Acid Crystals Vibrational Spectroscopy Prof Dominique DeCaro (Ed) ISBN 978-953-51-0107-9 InTech Available from httpwwwintechopencombooksvibrational-spectroscopyhigh-pressure-raman-spectra-of-amino-acid-crystals
copy 2012 The Author(s) Licensee IntechOpen This is an open access articledistributed under the terms of the Creative Commons Attribution 30License which permits unrestricted use distribution and reproduction inany medium provided the original work is properly cited
Vibrational Spectroscopy
38
weaker bifurcated N-HhellipO hydrogen bond forming anti-parallel double layers (Murli et al 2003) The difficult of rearranging the double layers in the crystal structure is an explanation for the stability of -glycine with respect to pressure (Boldyreva 2007b) Such a fact the stability of the structure under high pressure conditions is very different from what is observed with - and -glycine The -glycine has a crystal structure very similar to the -glycine although this last polymorph is most stable and should be obtained from the -polymorph under humid conditions (Dawson et al 2005) For -glycine it was observed through both Raman and polarizing spectroscopies a reversible phase transition at 076 GPa (Goryainov et al 2005) Such a phase transition is accompanied by pronounced changes in the Raman spectra of the material in particular by jumps and kinks at the curves of frequency versus pressure (for the band associated to NH3 rock the jump is higher than 10 cm-1) Additionally the transition is characterized by a rapid propagation of an interphase boundary accompanied by the crack formation in the crystal as verified by authors of Ref (Goryainov et al 2005) On decompression the high pressure phase (rsquo-glycine) transforms back to the -glycine without hysteresis (Goryainov et al 2005) which is not a general result among amino acid crystals While the and forms of glycine crystallize in a monoclinic structure respectively with space groups P21n and P21 -glycine crystallizes in a trigonal symmetry (P31) (Boldyreva et al 2003a) Under ambient conditions the and -forms of glycine are stable for a very long time but under high temperature (T ~ 440 K) it is observed a phase transition from the - to the-polymorph of glycine On the other hand it is interesting to note that even the -form being thermodynamically slightly less stable than the -form at low temperatures its transformation to the -form is apparently kinetically hindered (Boldyreva et al 2003b) Related to the behavior of -glycine under hydrostatic pressure some studies have investigated this subject Under the scrutiny of X-ray diffraction authors of Ref (Boldyreva et al 2004) observed that -glycine undergoes a phase transition beginning at 27 GPa characterized by an abrupt change in the unit cell volume such a phase transition is not completed even to pressures of 78 GPa On compression up to 25 GPa -glycine structure is changing anisotropically in such a way that the ac ratio decreases At 27 GPa the reflection of a new phase -glycine begins to appear but when pressure is released even at ambient pressure the new phase did not disappears completely In other words part of the high pressure -glycine phase remains down to the atmospheric pressure and the transformation was not completely reversible (Boldyreva et al 2005a) On decompression of the and phases additionally it was observed the appearance of another new phase at 062 GPa glycine which could be observed both by Raman and optical spectroscopies (Goryainov et al 2006) Among the amino acids L-alanine is the most studied crystalline system and although a great number of works has visited its physical and chemical properties there are some interesting non conclusive questions related to it For example although there is no indication for occurrence of temperature induced phase transition it is known that the c lattice parameter of L-alanine increases with decreasing temperature (Destro et al 1988) by a step-wise dynamics (Barthes et al 2004) Under low temperature authors of Ref (Migliori et al 1988) have observed an unusual behavior of the intensities of the low wavenumber modes at 41 and 49 cm-1 associating the phenomenon to the occurrence of localized vibrational states Such modes have also an intriguing behavior with high pressure conditions between 0 and 23 GPa the lowest wavenumber band increases intensity while
wwwintechopencom
High Pressure Raman Spectra of Amino Acid Crystals
39
the band at 49 cm-1 decreases above the critical pressure of 23 GPa an inverse effect is observed eg the lowest wavenumber band decreases in intensity while the other band increases its intensity (Teixeira et al 2000) Beyond this under the scrutiny of the behavior of lattice modes of L-alanine through Raman spectroscopy it was reported the evidence of a structural phase transition at ~ 23 GPa (Teixeira et al 2000) that seems to be confirmed by X-ray diffraction measurements (Olsen et al 2008) However very recent works reinterpreted X-ray diffraction measurements as conformational changes of the ammonia group (Funnel et al 2010 Tumanov et al 2010) Additionally (i) the Raman scattering data were not correlated with a structural phase transition only with continuous changes in the intermolecular interactions (Tumanov et al 2010) (ii) at about 2 GPa the cell parameters a and b become accidentally equal to each other (Funnel et al 2010 Tumanov et al 2010) but maintaining the same orthorhombic structure (P212121) differently from the work of ref (Olsen et al 2008) that interpreted the X-ray diffraction results as an orthorhombic tetragonal phase transition There are three other aliphatic amino acids which were investigated by Raman spectroscopy under high pressure conditions L-leucine L-isoleucine and L-valine At atmospheric pressure and room temperature L-leucine (C6H13NO2) crystallizes in a monoclinic structure (C22) (Harding amp Howieson 1976) although there are reports of a second phase for temperatures higher than 353 K (Faccedilanha Filho et al 2008) and a third polymorph resulting from residues of a solution at 200 Ma (Yamashita et al 2007) A series of modifications on the Raman spectrum of L-leucine crystal were observed when it was submitted to high pressure conditions (Faccedilanha Filho et al 2009) The modifications occur in three different pressure ranges (i) between 0 and 046 GPa (ii) between 08 and 146 GPa and (iii) at around 36 GPa The first modification observed in the Raman spectra involves motions of the CH and CH3 units as can be understood from the behavior of the bands in the high wavenumber region (about 3000 cm-1) It is worth to note that such a change is also associated to the hydrogen bond changes because an increasing in the line width of a band associated with the torsion of CO2- is verified across the pressure of 046 GPa although there is no great change in the lattice modes Differently the changes observed between 08 and 146 GPa occurs both in the internal modes and in the lattice modes of the crystal indicating a structural phase transition undergone by L-leucine Finally around 36 GPa change of the slopes of the frequency versus pressure plots associated with CO2- moieties were observed pointing to changes associated to hydrogen bonds (Faccedilanha Filho et al 2009) The Raman spectrum of L-valine (C5H11NO2) under high pressure conditions presents several changes between 00 and 69 GPa (Hermiacutenio da Silva et al 2009) In particular an extraordinary increase of intensity of the C ndash H stretching bands is verified at about 3 GPa and a decrease of intensity is observed at ~ 53 GPa Simultaneously discontinuities are observed in the frequency versus pressure plots for all modes of the Raman spectrum in these two pressure values indicating possible phase transitions undergone by the crystal L-isoleucine (C6H13NO2) was another aliphatic amino acid whose Raman spectra were investigated under high pressure (Sabino et al 2009) From this preliminary study it were observed changes on bands associated with both the rocking of NH3+ r(NH3+) and the rocking of CO2- r(CO2-) as well as to lattice modes at ~ 23 GPa and 50 GPa Such modifications in L-isoleucine were associated with conformational change of molecules or to a phase transition undergone by the crystal However a confirmation of the occurrence of phase transitions for L-valine L-leucine and L-isoleucine through X-ray diffraction or neutron diffraction is still lacking
wwwintechopencom
Vibrational Spectroscopy
40
Two sulfur amino acids were investigated under high pressure conditions L-methionine (Lima et al 2008) and L-cysteine (Minkov et al 2008 2010 Moggach et al 2006 Murli et al 2006) L-methionine (C5H11NO2S) crystallizes in a monoclinic structure and under compression undergoes a phase transition at about 22 GPa This modification is realized by the observation of the appearance of a very strong peak between the bands associated to stretching of SC (SC) and wagging vibration of CO2- (CO2-) At P = 27 GPa the intensity of the bands (SC) and (CO2-) goes to zero Additionally two new structures are observed around 540 cm-1 in the region where it is expect to be observed the band associated to the rocking of CO2- r(CO2-) Such a picture was interpreted as a phase transition undergone by L-methionine crystal with a hysteresis of about 08 GPa On the other hand L-cysteine can crystallize in two different polymorphs with orthorhombic and monoclinic symmetries (Minkov et al 2010) For the monoclinic polymorph of L-cysteine it was observed phase transitions at about 29 and 39 GPa with the changes in the Raman spectra suggesting that the hydrogen bond network is distorted and the S-HhellipO bonding dominates over S-HhellipS bonding at high pressures For the orthorhombic polymorph a series of different phase transition occurs but with no evidence that it transforms into the most dense monoclinic polymorph which is also stable at atmospheric pressure It is worth to note that the phase transitions in the orthorhombic L-cysteine involve changes in molecular conformation while the pressure-induced phase transitions in the monoclinic phase are mainly related to changes in the hydrogen bond network (Minkov et al 2010) L-threonine (C4H9NO3) (Silva et al 2000) was investigated up to 43 GPa through Raman spectroscopy From this study it was observed several modifications in the Raman spectrum including the region associated to the lattice mode vibrations mainly between 2 and 22 GPa Other modifications above 3 GPa were also observed but no X-ray diffraction experiment was performed up to now which would confirm the occurrence of eventual phase transition undergone by L-threonine crystal L-serine was also investigated under high pressure conditions (Boldyreva et al 2005b 2006a 2006b Moggach et al 2005 2006) From x-ray diffraction measurements (Moggach et al 2005) it was observed that at ~ 48 GPa the crystal undergoes a phase transition with changes in the hydrogen bond network while the low pressure phase is characterized by OHhellipOH hydrogen bond chains in the high pressure phase it is observed shorter OHhellipcarboxyl interactions Yet Ref (Moggach et al 2005) shows that the phase transition occurs with change in two torsion angles but with any major changes in the orientations of the molecules in the unit cell Study of Ref (Boldyreva et al 2006b) confirms the phase transition previously reported in Ref (Moggach et al 2005) although with a transition pressure value of ~ 53 GPa and points the existence of another phase transition at 78 GPa In this second phase transition new OHhellipO(CO) hydrogen bond and a new NHhellipOH bond are formed showing that OH-group becomes both a proton donor and a proton acceptor Finally finishing this picture of the state of the art of vibrational and structural aspects of amino acid crystals under high pressure we briefly discuss results on L-asparagine monohydrate which was investigated both by Raman spectroscopy (Moreno et al 1997) and by X-ray diffraction experiments (Sasaki et al 2000) Both studies point to the occurrence of three different phase transitions between 00 and 13 GPa which constitute up to now the most unstable amino acid crystal structure In all these investigations the occurrence of phase transitions involving change in the dimension of the several HB in the unit cell seems to be the role An extension of studies of
wwwintechopencom
High Pressure Raman Spectra of Amino Acid Crystals
41
amino acid crystals under high pressure conditions investigated by Raman spectroscopy for L-histidineHClH2O and L-proline monohydrate is given here
3 Experimental
The samples of HHM were grown from aqueous solution by the slow evaporation method at controlled temperature The samples of PM polycrystals were obtained from reagent grade (Sigma Aldrich) and used without further purification Raman experiments on HHM were performed in the backscattering geometry employing a Jobin Yvon Triplemate 64000 micro-Raman system equipped with a N2-cooled charge-coupled device (CCD) detection system while for Raman experiments on PM it was employed an HR 460 Jobin Yvon spectrometer The slits were set for a 2 cm-1 spectral resolution Raman spectra were excited with the 5145 nm line of an argon ion laser The high-pressure experiments at room temperature were performed on a small piece of sample compressed using a diamond anvil cell (model NBS mdash National Bureau of Standards) For the Raman experiments on PM it was used a membrane diamond anvil cell (MDAC) with a 400 m culet diameter diamonds as the pressure device A 150 m-diameter hole in a stainless-steel (200 m of initial thickness preindented to 40 m) was loaded with argon while a 200 m-diameter hole in a stainless-steel with a 230 m of initial thickness was loaded with mineral oil in the study of L-histidineHClH2O An Olympus microscope lens with a focal distance f = 205 mm and a numerical aperture 035 was used to focus the laser beam on the sample surface which was located in the pressure cell The pressure in the cell was monitored using the standard shifts of the Cr3+Al2O3 emission lines
4 Results
41 L-proline monohydrate In this sub-section we present investigation of polycrystalline PM under hydrostatic pressure up to 118 GPa It is important to state that the sample used in the experiment had a small quantity of anhydrous phase (about 8 according to the Rietveld refinement) in such a way that the structure can be considered as monoclinic L-proline monohydrate
Fig 1 Unit cell of PM seen along the b-axis
wwwintechopencom
Vibrational Spectroscopy
42
PM (see Figure 1) crystal is found in a monoclinic structure space group C2with a = 2043 Aring b = 619 Aring c = 514 Aring and = 9579deg and Z=4 (Seijas et al 2010) In such a material the hydrogen bonds play a special role in the stability of the crystal structure X-ray diffraction study shows that there are interactions between amino and carboxylate groups through the hydrogen bonds N1-H1hellipO1 N1-H1hellipO2 and N1-H2hellipO1 with H1 atom acting as a bifurcated donor taking part in two hydrogen bonds These hydrogen bonds link the proline molecules forming pairs of chains in opposite directions along the c axis The water molecules form zigzag chains of O-HhellipO hydrogen bonds also parallel to the c axis (Seijas et al 2010) Figure 2 presents the Raman spectra of polycrystalline PM crystal in the spectral range 10 ndash 250 cm-1 for pressures from 00 to 118 GPa The spectrum taken at 00 GPa shows a complex profile indicating the occurrence of several bands in fact fitting with Lorentzian curves
Fig 2 Raman spectra of PM under several pressure conditions from 00 to 118 GPa in the spectral range 50 ndash 250 cm-1
wwwintechopencom
High Pressure Raman Spectra of Amino Acid Crystals
43
points to the existence of six bands between 10 and 160 cm-1 When pressure is increased great changes are observed in the Raman profile of the spectrum At 11 GPa the Raman spectrum of L-proline is very different from that obtained at 00 GPa (i) the mode peaked at ~ 68 cm-1 becomes the most intense band in the spectrum at 11 GPa (ii) the most intense peak in the spectrum taken at 00 GPa decreases intensity and in the spectrum taken at 11 GPa it is only the second most intense peak in the region 10 ndash 250 cm-1 (iii) the peaks marked by arrows in the spectrum at 00 GPa increase intensity Such a set of modifications point to the possibility of the occurrence of a phase transition undergone by polycrystalline L-proline for pressures below 11 GPa Results on other spectral regions of the Raman spectrum will reinforce this hypothesis It is observed a gradual change of intensity of all bands appearing in the Raman spectra of Figure 2 as well as continuous blue shifts of all wavenumbers when pressure is increased from 111 to 65 GPa The gradual change of the profiles of the Raman spectrum can be interpreted as continuous changes of the conformation of the molecules of L-proline in the unit cell of the crystal However between 65 and 78 GPa it is observed a strong change in the profile of the Raman spectrum in the low wavenumber region In particular the most intense band observed in the spectrum taken at 65 GPa lost intensity becoming one of the peaks with lowest intensity Additionally jump in the wavenumber of almost all bands are also verified in this pressure interval (65 - 78 GPa) As a consequence we have interpreted the changes of the Raman spectrum as a phase transition undergone by polycrystalline L-proline between 65 and 78 GPa Other evidences will be shown in the next paragraphs Finally when we decrease pressure from the highest value obtained in our experiments down to atmospheric pressure we observe that the original spectrum ndash bottom spectrum in Figure 2 ndash is recovered (the final spectrum is marked as 00 GPa) Figure 3 presents the Raman spectra of PM crystal for several pressures in the spectral range 200 ndash 750 cm-1 According to Ref (Herlinger amp Long 1970) (see also Table 1) the band recorded close to 294 cm-1 in the 00 GPa spectrum can be associated to a deformation vibration of the skeleton of the structure (skel) The bands observed at 377 and 447 cm-1 are associated respectively to the bending of CCN (CCN) and rocking of CO2- r(CO2-) In fact for other amino acid crystals it has been reported that the r(CO2-) is the most intense band in the 200 ndash 700 cm-1 spectral range However for the other amino acids differently from L-proline the r(CO2-) mode is observed for wavenumber higher than 500 cm-1 (-glycine 503 cm-1 (Dawson et al 2005) L-alanine 532 cm-1 L-valine 542 cm-1 (Goryainov et al 2005) DL-alanine 543 cm-1 etc) Finally in the spectrum taken at 00 GPa we can observe a band at 574 cm-1 which was associated to a bending of CO2- group Finally bands at 641 669 and 695 cm-1 were associated respectively to wagging of CO2- w(CO2-) (skel) and scissoring of CO2- sc(CO2-) By increasing the pressure we observe that between 00 and 11 GPa some important modifications are present For example the band (CCN) decreases intensity and seems to split A clear splitting is observed for the band at 574 cm-1 and the r(CO2-) band at 447 cm-1 begins to present a shoulder in the high wavenumber side Additionally the (skel) band at 669 cm-1 (marked by an asterisk in the spectrum of 00 GPa) disappears between the two lowest pressure spectra This entire complex picture corroborates the fact that the crystal is undergoing a phase transition between 00 and 11 GPa If one continues to increase pressure on the PM crystal it is possible to observe that all bands suffer blue shifts up to 65 GPa also in general terms the linewidth increases for all bands However no great changes are observed indicating that the crystal structure
wwwintechopencom
Vibrational Spectroscopy
44
Fig 3 Raman spectra of PM under several pressure conditions from 00 to 118 GPa in the spectral range 250 ndash 750 cm-1
remains the same of that observed at 11 GPa In other words the crystal seems to be stable between 11 to 65 GPa But when pressure arrives to 78 GPa great modifications are observed in the 200 ndash 700 cm-1 spectral region Let us state these modifications (i) the appearance of a band (marked by an arrow in the spectrum taken at 78 GPa) in the region ~ 450 cm-1 (ii) an impressive fall of intensity and a red shift of the band associated to r(CO2-) (iii) a red shift of the two bands in the region 550 ndash 600 cm-1 (iv) the appearance of low intense bands (marked by an asterisk in the spectrum taken at 78 GPa) for wavenumbers higher than 600 cm-1 (v) the increase of intensity of the band initially assigned as scissoring of CO2- (vi) the appearance of a band at ~ 725 cm-1 Again the modifications in the spectra between 65 and 78 GPa presented in Figure 3 corroborate the fact that PM crystal undergoes a second phase transition as discussed previously When pressure is released down to 00 GPa whose spectrum is marked by 00 GPa we observe that the starting atmospheric spectrum is recovered as already observed in Figure 2 Figure 4 presents the Raman spectra of PM crystal under high pressure conditions with argon as compression medium in the region 600 to 1250 cm-1 We have cut off the peaks in the region close to 900 cm-1 because there is a peak with high intensity that makes difficult the visualization of the bands close to it this region will be discussed in Figure 5 In the Figure 4 we observe that several peaks are well defined (the peak marked by an asterisk is due a lamp used to calibrate the spectra) It is important to state that in the spectrum at 00
wwwintechopencom
High Pressure Raman Spectra of Amino Acid Crystals
45
Wavenumber (cm-1) Assignment Wavenumber (cm-1) Assignment
68 Lattice mode 950 (CCN)+(CC)
81 Lattice mode 982 v(CCN)+(CC)
99 Lattice mode 991 (CCN)+(CC)
120 Lattice mode 1031 (CCN)+(CC)
134 Lattice mode 1055 w(CH2)
149 Lattice mode 1079 w(CH2)
203 - 1084 r(CH2)
294 (skel) 1161 t(CH2)
373 (CCN) 1172 t(CH2)
447 r(CO2-) 2876 (CH)
574 (CO2-) 2898 (CH)
641 w(CO2-) 2932 (CH)
669 (skel) 2949 (CH)
695 sc(CO2-) 2971 (CH)
791 (skel) 2983 (CH)
840 r(CH2) 3006 (CH)
863 r(CH2) 3011 (CH)
897 r(NH2+) 3041 (NH)
918 (CCN)+(CC) 3068 (NH)
Table 1 Wavenumber (in cm-1) and approximate assignments of Raman bands for L-proline monohydrate crystal where def deformation bending r rocking w wagging sc scissoring stretching t twisting
GPa there are two peaks between 975 and 1000 cm-1 and in the spectrum taken at 11 GPa only one band is observed Another aspect that worth note is the fact that the band of highest energy (~ 1172 cm-1 at 00 GPa twisting of CH2 t(CH2)) splits in the spectrum taken at 11 GPa Above this last pressure the intensity of the peaks remains approximately constant up to 65 GPa Between 65 and 78 GPa the Raman spectrum presents great changes The band associated to the rocking of CH2 r(CH2) observed initially at ~ 840 cm-1 presents both a jump to high wavenumbers and an increasing in its linewidth A splitting is observed for the band marked by an star in the spectrum recorded at 65 GPa and observed initially at ~ 950 cm-1 which is associated to the stretching of CCN and CC units (CCN) + (CC) If one observe the band at 1033 cm-1 which is associated to the wagging of CH2 w(CH2) interestingly between 65 and 78 GPa it changes intensity with the band marked by a down arrow in the spectrum taken at 65 GPa so the w(CH2) band lost intensity and the band marked by a down arrow increases intensity Similarly the low intense bands observed between 1080 and 1200 cm-1 present great changes in their intensities between 65 and 78 GPa All these changes corroborate the modification in the crystal structure which occurs above 65 GPa which are reversible when pressure is released down to 00 GPa
wwwintechopencom
Vibrational Spectroscopy
46
Fig 4 Raman spectra of PM under several pressure conditions from 00 to 118 GPa in the spectral range 600 ndash 1250 cm-1
Figure 5 shows the Raman spectra of PM crystal in the 800 ndash 1100 cm-1 spectral region The dominant band in the spectrum taken at 00 GPa observed at 897 cm-1 is associated to the rocking vibration of NH2+ r(NH2+) The changes occurring in the first phase transition are not impressive but we note that between 65 and 78 GPa the band lost intensity and splits into two bands Above 78 GPa blue shifts of the wavenumbers are verified but no great change is present up to the highest pressure arrived in the experiment Decreasing pressure down to 00 GPa again we observe that the original spectrum is also recovered in this region In the spectral region presented in Figure 6 it is expected to be observed bands associated to the stretching vibrations of CH and CH2 units A theoretical study performed on L-methionine showed that different profiles of the Raman spectrum in this wavenumber range are associated with different conformations of the molecule In this sense when we observe the Raman spectra of PM as a function of pressure we note that between 00 and 11 GPa the most intense band at 00 GPa split into three bands (marked by up arrows) In the spectrum taken at 17 GPa the separation is very clear and when pressure is further increased the bands become clearly distinct But between 65 and 78 GPa the spectrum changes abruptly indicating that between these two pressure values the proline molecules undergo a great conformational change Because we have observed additionally changes in the low wavenumber region we can understand that both conformational change and structural phase transition take place for PM crystal As observed in the other spectral regions the original spectrum at 00 GPa is recovered when pressure is released
wwwintechopencom
High Pressure Raman Spectra of Amino Acid Crystals
47
Fig 5 Raman spectra of PM under several pressure conditions from 00 to 118 GPa in the spectral range 800 ndash 1100 cm-1
Data can give us some insights related to the behaviour of molecules of proline as the crystal is compressed For example in a previous study on -glycine the softening of a bending of CO2- was associated to a decrease in the intra-layer hydrogen bond strength while the stiffening of the same vibration was associated to an increase in the bond strength (Dawson et al 2005) For PM we have observed that the band associated to both bending of CO2- (CO2-) and rocking of CO2- r(CO2-) increase wavenumbers from 11 to 65 GPa and between 65 and 78 GPa decrease wavenumber for (CO2-) the decreasing is represented by the two dashed lines in Figure 3 between the spectra of 65 and 78 GPa We have also observed an additional increasing of wavenumbers for pressures higher than 78 GPa This suggests that the intra-layer hydrogen bond strength is stiffened up to 65 GPa between 65 and 78 GPa the hydrogen bond strength is softened and above 80 GPa the hydrogen bond is stiffened Additionally our results suggest that between 65 and 78 GPa occurs a structural rearrangement in such a way that the behaviour of the hydrogen bond strengths is changed This rearrangement is enough to change the symmetry of the crystal because
wwwintechopencom
Vibrational Spectroscopy
48
Fig 6 Raman spectra of PM under several pressure conditions from 00 to 118 GPa in the spectral range 2850 ndash 3200 cm-1
associated to it we observe great modifications in the Raman spectrum of low wavenumber region (Figure 2) Yet related to the phase transition between 65 and 78 GPa it is impressive the increase of intensity of a band in the spectrum taken at 65 GPa (marked by an arrow see Figure 4) which can be assigned as wagging of CH2 w(CH2) it change of intensity with the band close to it at ~ 1055 cm-1 at 00 GPa which is also assigned as w(CH2) indicating that a conformational change in the ring may also occurs when the crystal undergoes the phase transition at 65 - 78 GPa It is also interesting to note that the first transition occurs from a monoclinic to a phase with lower symmetry (another monoclinic our a triclinic phase) because in several regions including both internal and lattice mode spectral regions the number of peaks in the spectrum taken at 11 GPa is greater than the number of Raman peaks in the spectrum taken at 00 GPa It is also worth note that above 78 GPa almost all bands increases linewidth indicating that some disorder is introduced in the high pressure phase However the disorder does not occur in a high degree because when pressure is released down to 00 GPa the original spectrum is recovered It is known that the amorphization process is preceded by some disorder in the crystal structure however due to recovered of the original Raman spectrum after releasing pressure we can infer that when we arrive to 1118 GPa we are far away from the pressure point where eventually the PM crystal should present amorphization
wwwintechopencom
High Pressure Raman Spectra of Amino Acid Crystals
49
42 L-histidine hydrochloride monohydrate Related to the HHM (see Figure 8) which crystallizes in an orthorhombic structure belonging to the P212121 (D24) space group with four molecules of C6H9N3O2HClH2O per unit cell we were able to arrive up to 75 GPa and discovery a new polymorph of the material above 31 GPa The strong bond between N-H of the imidazole ring and the carboxyl group of a neighboring molecule is the fundamental intermolecular link resulting in a spiral arrangement along the c-axis (Donohue amp Caron 1964) The coupling of the four zwitterions in the unit cell leads to 297 optical normal modes decomposed into irreducible representations of the factor group D2 as Γop = 75 A + 74 (B1 + B2 + B3) and the acoustic modes can be expressed as Γac = B1 + B2 + B3 Under high pressure conditions modifications the Raman spectra are interpreted in terms of both conformational changes of the molecules in the unit cell and in terms of a phase transition Figure 9(a) presents the Raman spectra of HHM for several pressures in the spectral range from 50 to 660 cm-1 The region for wavenumbers lower than 200 cm-1 as previously stated is characteristic of the lattice vibration modes Increasing pressure we observe that the bands present blue shifts of their wavenumbers However between 27 and 31 GPa it is possible to note that a great change occurs in the Raman spectrum the peak marked by a square which is associated to torsion of CO2- (τ(CO2-)) splits in two new peaks which are marked by up arrows in the spectrum at 31 GPa In Figure 9(b) which presents the plot of experimental wavenumber as function of pressure we clearly observe the splitting of the band close to 180 cm-1 Additionally we note that for other bands discontinuities of wavenumbers are observed between 27 to 31 GPa (De Sousa et al 2011)
Fig 8 Unit cell of HHM seen along the b-axis
In this region it is also possible to observe many internal vibrations of the histidine molecule such as skeletal structure at 442 and 490 cm-1 torsion of NH3+ which is observed at 385 cm-1 and rocking of CO2- at 530 cm-1 Again as occurs with the spectra shown in the lattice mode region modifications are observed in the spectral range 27 - 31 GPa Among these changes we observed the disappearance of the bands at 276 and 500 cm-1 and the
wwwintechopencom
Vibrational Spectroscopy
50
Fig 9 (a) Raman spectra of HHM under several pressure conditions from 04 to 75 GPa in the spectral range 50 ndash 650 cm-1 (b) wavenumber versus pressure of the bands of HHM appearing in Fig 9(a)
appearance of a band at 473 cm-1 in the spectrum taken at 31 GPa We additionally note that the intensity of the band associated to torsion of NH3+ decreases with increasing pressure indicating that there occurs a conformational change of histidine molecule Such a conformational change can be understood as consequence of the change of the intermolecular hydrogen bond length With increasing pressure the band initially at 385 cm-
1 which is associated with a torsion vibration of the NH3+ unit shifts linearly toward higher wavenumbers we can say that the pressure decreases the length of the hydrogen bonds increasing the wavenumber of the band associated to torsional vibration of NH3+ unit Figure 10(a) presents the Raman spectra of HHM in the 650 ndash 1250 cm-1 interval for several pressure values up to 75 GPa In this spectral region it is expected to observe vibrations assigned to the deformation of CO2- stretching of both C-C and C-N wagging of H2O and rocking of NH3+ The band observed at ~ 694 cm-1 is associated to a deformation vibration of CO2- (CO2) while the out-of-plane vibration of CO2- (CO2) is observed at ~ 822 cm-1 The band at 807 cm-1 is associated with a wagging vibration of the water molecule w(H2O) The bands recorded at 1191 and 1210 cm-1 can be assigned as the rocking of NH3+ unit r(NH3+) In this spectral region some changes are observed in the range 27 ndash 31 GPa (i) the disappearance of the band at 694 cm-1 (ii) the appearance of a new weak band at 717 cm-1
(marked by a star in the Figure 10(a)) (iii) the inversion of intensity of the two bands located at 807 and 822 cm-1 which are related to units directly involved in the hydrogen bonds and (iv) the inversion of intensity of the two bands associated to a rocking of NH3+ unit r(NH3+) located at 1191 and 1210 cm-1 The dependence of the wavenumber versus pressure plot for this spectral region is presented in Fig 10(b) we note that many of the observed Raman modes show a small discontinuous change in the slope in the pressure-induced variation of its wavenumber in range 27 ndash 31 GPa
wwwintechopencom
High Pressure Raman Spectra of Amino Acid Crystals
51
Figure 11(a) shows the Raman spectra of the HHM crystal in the spectral range 1700-1400 cm-1 for pressure from 00 to 75 GPa Fig 11(b) shows the respective wavenumber vs pressure plots In this region one expects to observe vibrations assigned to a deformations of the imidazole ring of the histidine molecule asymmetric stretching of the CO2- units stretching of C=O among others In the Figure 11(a) two modifications are observed in the range 27 ndash 31 GPa The first change is the decreasing of the relative intensity of the band originally at 1433 cm-1 and the second one is the appearance of a band at 1642 cm-1 In the wavenumber versus pressure plot presented in Figure 11(b) a subtle discontinuity occurs in the range 27 ndash 31 GPa with appreciably differences in slopes where two modes change from positive to negative slopes
Fig 10 (a) Raman spectra of HHM under several pressure conditions from 04 to 75 GPa in the spectral range 650 ndash 1250 cm-1 (b) wavenumber versus pressure of the bands of HHM appearing in Fig 10(a)
The Raman spectra of HHM crystal in the range 3450-3125 cm-1 are shown in the Figure 12(a) and in the Figure 12(b) the respective wavenumber versus pressure plots are given In this region we expected to observe stretching vibrations of several units of the amino acids and of the water molecule (CH NH3+ and OH-) It is important to note that for wavenumbers lower than 3000 cm-1 there are some modes related to the mineral oil used as compression media In detail the band at 3111 cm-1 can be associated to a stretching vibration of NH3+ unit (NH3+) while the bands observed at 3155 and 3163 cm-1 are associated to a CH stretching vibration of imidazole ring The bands observed at 3374 and 3408 cm-1 are related to the OH- stretching of the water molecules In the pressure range 27 ndash 31 GPa main changes are observed such as the disappearance of the bands related to a OH- stretching vibration (initially located at 3367 and 3393 cm-1) the appearance of a band of weak intensity at 3424 cm-1 and discontinuities of the wavenumber curve of bands at 3155 and 3163 cm-1 which are associated with the CH stretching vibration
wwwintechopencom
Vibrational Spectroscopy
52
Fig 11 (a) Raman spectra of HHM under several pressure conditions from 04 to 75 GPa in the spectral range 1400 ndash 1670 cm-1 (b) wavenumber versus pressure of the bands of HHM appearing in Fig 11(a)
Fig 12 (a) Raman spectra of HHM under several pressure conditions from 04 to 75 GPa in the spectral range 2950 ndash 3450 cm-1 (b) wavenumber versus pressure of the bands of HHM appearing in Fig 12(a)
wwwintechopencom
High Pressure Raman Spectra of Amino Acid Crystals
53
Table 2 gives a quantitative analysis of the evolution of the Raman spectra of HHM crystal with pressure where fitting of all bands to a linear expression ω = ω0 + P is furnished In Table 2 the first column (ωobs) represents the wavenumber of the Raman bands observed at room pressure the second and third columns correspond to adjustment of data for pressure values between 0 and 27 GPa and the two last columns correspond to fitting of the high-pressure phase that observed between 31 and 75 GPa A resume of the modifications observed in all spectral regions of the Raman spectra of HHM is as follows (i) splitting of the band in the low-wavenumber lattice range (ii) change in the number of bands associated to internal modes (iii) wavenumber shifts with discontinuities (iv) changes in the relative intensities of the vibrational bands It is important to state that changes were observed for the deformation vibrations of the OH- of the water molecule as well as of the NH3+ and CO2- groups of the amino acid molecule This picture indicates large conformational changes of the molecules in the unit cell Related to HHM beyond the hydrogen bonds originated from the histidine molecule there are two hydrogen bonds from the water molecule It is interesting to note from Figure 12(b) that the wavenumber of OH- stretching (OH-) decreases with increasing pressure However the OH units participate of hydrogen bonds one to a carboxyl oxygen and another to the chloride ion This means that between 00 and 31 GPa the hydrogen bond strength increases and the wavenumber of(OH-) decreases in this pressure range Also after the phase transition the wavenumber of (OH-) suffers a jump and continues to decrease up to the highest pressure obtained in our experiments Such a picture indicates a further increase of the hydrogen bonds formed by the water molecules and confirms that these bonds are playing an important role in the mechanism of the transition It is interesting to note that similar changes in the low-wavenumber region were also observed for the same crystal when subjected to low temperatures
ωobs
(cm-1)
Phase 1
(0 le P le 27 GPa) Phase 2
(31 le P le 75 GPa)
ω0
(cm-1)
(cm-1)(GPa)-1 ω0
(cm-1)
(cm-1)(GPa)-1
94 945 0669 937 -0103
105 1052 0276 1002 1771
121 1214 -1087 1109 2092
136 1357 1616 1360 0623
149 1497 2128 - -
159 1568 8033 1483 8105
- - - 1639 9960
188 1891 7661 1902 8059
270 2697 3093 - -
293 2919 6118 2945 7683
385 3846 7236 4015 1675
442 4423 1223 4423 1461
wwwintechopencom
Vibrational Spectroscopy
54
ωobs
(cm-1)
Phase 1
(0 le P le 27 GPa) Phase 2
(31 le P le 75 GPa)
ω0
(cm-1)
(cm-1)(GPa)-1 ω0
(cm-1)
(cm-1)(GPa)-1
- - - 4707 0785
491 490 5 3319 - -
530 5304 4335 - -
609 6078 5312 6208 2463
693 6935 1529 - -
- - - 7064 3449
807 8067 2042 8047 1467
824 8240 -0498 8204 1442
838 8361 7335 8504 3124
875 8734 6438 8881 2777
917 9173 0810 9187 2356
963 9630 2757 9636 2411
980 9787 4489 9787 5206
1068 10667 4790 10732 3418
1141 11403 1890 11403 2744
1162 11619 2611 11674 1120
1190 11900 2277 11885 1637
1208 12079 2859 12101 1341
1434 14345 1316 14382 0846
1448 14481 3059 14554 1677
1463 14621 4415 14760 0778
1481 14813 4238 14970 -0619
1609 16093 2739 16166 -0374
- - - 16249 2736
3111 31110 0919 31045 2914
3154 31546 1287 31532 6564
3164 31626 5305 31593 7905
3375 33739 -2638 - -
3407 34081 -5745 - -
- - - 34371 -3169
Table 2 Wavenumber values of the bands appearing in the HHM spectrum at 00 GPa (ωobs) and adjustment data by linear fitting (P) for the two phases
wwwintechopencom
High Pressure Raman Spectra of Amino Acid Crystals
55
5 Conclusions
The results suggested that L-proline monohydrate undergoes two phase transitions one between 00 and 11 GPa and a second between 65 and 78 GPa In both transitions it was possible to observed changes in the spectrum profile discontinuities in the wavenumber versus pressure plots in the lattice region of the spectrum and the appearance of news bands By releasing the pressure after attaining a maximum of 118 GPa the atmospheric pressure spectrum was fully recovered showing that the pressure-induced transitions undergone by polycrystalline L-proline crystal are reversible In the first transition it was observed the splitting of bands associated to (CCN) (CO2-) and (CH) vibrations The band associated to (skel) has disappeared In the second one we have observed the red shift of r(CO2-) significant changes in the intensity of the bands associated to the sc(CO2-) and w(CH2) vibrations and the splits of (CCN) + (CC) and r(NH2+) that also has lost intensity These modifications were interpreted as conformational changes of molecules in the unit cell Because these changes involve moieties that participate in hydrogen bonds we suppose that these hydrogen bonds have also been modified Modifications of hydrogen bonds can trigger some molecular rearrangements that lead to structural phase transitions In our work this hypothesis was supported by the changes that were observed in the region of the lattice modes for both phase transitions Therefore the results suggested two structural phase transitions one between 00 and 11 GPa and another between 65 and 78 GPa accompanied by significant conformational changes of molecules in the L-proline monohydrated crystal The results also suggest that HHM crystal undergoes a phase transition between 27 and 31 GPa when it is submitted to high pressure conditions up to 75 GPa The main changes observed in the Raman spectra was the splitting of the band in the low-wavenumber lattice range change in the number of bands associated to internal modes and wavenumber shifts with discontinuities Having described the behavior of two amino acid crystals under pressure and looked back at the past fourteen years of research we can ask to ourselves what does the future hold Based on the studies performed we believe that the use of several techniques such as neutron and Raman scattering as well as thermal and infrared analyses can help us to give a complete picture about hydrogen bond and the behavior of amino acids under pressure Maybe the study of peptide under similar external conditions should be the next road to be walked
6 Acknowledgment
Authors acknowledge CAPES CNPq and FUNCAP for financial support
7 References
Barthes M Bordallo HN Deacutenoyer F Lorenzo J-E Zaccaro J Robert A amp Zontone F (2004) Micro-transitions or breathers in L-alanine The European Physical Journal B Vol 37 No 3 (February 2004) pp 375-382 ISSN 1434-6028
Boldyreva EV Drebushchak VA Drebushchak TN Paukov IE Kovalevskaya YA amp Shutova ES (2003a) Polymorphism of glycine Part I Journal of Thermal Analysis and Calorimetry Vol 73 No 2 (August 2003) pp 409-418 ISSN 1388-6150
wwwintechopencom
Vibrational Spectroscopy
56
Boldyreva EV Drebushchak VA Drebushchak TN Paukov IE Kovalevskaya YA amp Shutova ES (2003b) Polymorphism of glycine Part II Journal of Thermal Analysis and Calorimetry Vol 73 No 2 (August 2003) pp 419-428 ISSN 1388-6150
Boldyreva EV Ivashevskaya SN Sowa H Ahsbahs H amp Weber H-P (2004) Effect of High Pressure on Crystalline Glycine A New High-Pressure Polymorph Doklady Physical Chemistry Vol 396 No 1 (May 2004) pp 111-114 ISSN 0012-5016
Boldyreva EV Ivashevskaya SN Sowa H Ahsbahs H amp Weber H-P (2005a) Effect of hydrostatic pressure on the -polymorph of glycine 1 A polymorphic transition into a new -form Zeitschrift fuumlr Kristallographie Vol 220 No 1 ( January 2005) pp 50- 57 ISSN 0044-2968
Boldyreva EV Kolesnik EN Drebushchak TN Ahsbahs H Beukes JA amp Weber H-P (2005b) A comparative study of the anisotropy of a lattice strain induced in the crystals of L-serine by cooling down to 100 K or by increasing pressure up to 44 GPa Zeitschrift fuumlr Kristallographie Vol 220 No 1 (January 2005) pp 58- 65 ISSN 0044-2968
Boldyreva EV Kolesnik EN Drebushchak TN Ahsbahs H amp Seryotkin YV (2006a) A comparative study of the anisotropy of a lattice strain induced in the crystals of DL-serine by cooling down to 100 K or by increasing pressure up to 86 GPa A comparison with L-serine Zeitschrift fuumlr Kristallographie Vol 221 No 2 (2006) pp 150- 161 ISSN 0044-2968
Boldyreva EV Sowa H Seryotkin YV Drebushchak TN Ahsbahs H Chernyshev V amp Dmitriev V (2006b) Pressure-induced phase transitions in crystalline L-serine studied by single crystal and gigh-resolution powder X-ray diffraction Chemical Physics Letters Vol 429 No 4-6 (October 2006) pp 474-478 ISSN 0009-2614
Boldyreva E (2007a) Cristalline Amino Acids A Link between Chemistry Materials Science and Biology In Models Mysteries and Magic of Molecules Boeyens JCA amp Ogilvie JF pp 167-192 Springer ISBN 978-1-4020-5940-7 Netherlands
Boldyreva E (2007b) High-Pressure Polymorphs of Molecular Solids When Are They Formed and When Are They Not Some Examples of the Role of Kinetic Control Crystal Growth amp Design Vol 7 No 9 (August 2007) pp 1662-1668 ISSN 1528-7483
Dawson A Allan DR Belmonte SA Clark SJ David WIF McGregor PA Parsons S Pulham CR amp Sawyer L (2005) Effect of high pressure on the crystal structures of polymorphs of glycine Crystal Growth amp Design Vol 5 No 4 (May 2005) pp 1415-1427 ISSN 1528-7483
Destro R Marsh RE amp Bianchi R (1988) A low-temperature (23K) study of L-alanine The Journal of Physical Chemistry Vol 92 No 4 (February 1988) pp 966-973 ISSN 0022-3654
De Sousa GP Freire PTC Lima Jr JA Mendes Filho J amp Melo FEA (2011) High-pressure Raman spectra of L-histidine hydrochloride monohydrate cristal Vibrational Spectroscopy Vol 57 No 1 (September 2011) pp 102-107 ISSN 0924-2031
Donohue J amp Caron A (1964) Refinement of cristal structure of histidine hydrochloride monohydrate Acta Crystallographica Vol 17 No 9 (September 1964) pp 1178-amp ISSN 0108-7673
wwwintechopencom
High Pressure Raman Spectra of Amino Acid Crystals
57
Faccedilanha Filho PF Freire PTC Lima KCV Mendes Filho J Melo FEA amp Pizani PS (2008) High temperature Raman spectra of L-leucine crystals Brazilian Journal of Physics Vol 38 No 1 (March 2008) pp 131-137 ISSN 0103-9733
Faccedilanha Filho PF Freire PTC Melo FEA Lemos V Mendes Filho J Pizani PS amp Rossatto DZ (2009) Pressure-induced phase transitions in L-leucine crystal Journal of Raman Spectroscopy Vol 40 No 1 (January 2009) pp 46-51 ISSN 1097-4555
Freire PTC (2010) Pressure-Induced Phase Transitions in Crystalline Amino Acids In High Pressure Crystallography ndash From Fundamental Phenomena to Technological Applications Boldyreva E amp Dera P pp 559-572 Springer ISBN 978-904-8192-60-1 New York USA
Funnel NP Dawson A Francis D Lennie DR Marshall WG Moggach SA Warren JE amp Parsons S (2010) The effect of pressure on the crystal structure of l-alanine CrystEngComm Vol 12 No 9 (September 2010) pp 2573-2583 ISSN 1466-8033
Goryainov SV Kolesnik EN amp Boldyreva EV (2005) A reversible pressure-induced phase transition in -glycine at 076 GPa Physica B Condensed Matter Vol 357 No 3-4 (March 2005) pp 340-347 ISSN 0921-4526
Goryainov SV Kolesnik EN amp Boldyreva EV (2006) Raman observation of a new (ζ) polymorph of glycine Chemical Physics Letters Vol 419 No 4-6 (February 2006) pp 496-500 ISSN 0009-2614
Harding MM amp Howieson RM (1976) L-Leucine Acta Crystallographica Section B Vol 32 No 2 (February 1976) pp 633-634 ISSN 1600-5740
Herlinger AW amp Long TV (1970) Laser Raman and infrared spectra of amino acids and their metal complexes 3 Proline and bisprolinato complexes Journal of the American Chemical Society Vol 92 No 22 (November 1970) pp 6481-6486 ISSN 0002-7863
Hermiacutenio da Silva J Lemos V Freire PTC Melo FEA Mendes Filho J Lima Jr JA amp Pizani PS (2009) Stability of the crystal structure of L-valine under high pressure Physica Status Solidi B Vol 246 No 3 (March 2009) pp 553-557 ISSN 0370-1972
Lima JA Freire PTC Melo FEA Lemos V Mendes Filho J amp Pizani PS (2008) High pressure Raman spectra of L-methionine Crystal Journal of Raman Spectroscopy Vol 39 No 10 (October 2008) pp 1356-1363 ISSN 1097-4555
Migliori A Maxton PM Clogston AM Zirngiebl E amp Lowe M (1988) Anomalous temperature dependence in the Raman spectra of l-alanine Evidence for dynamic localization Physical Review B Vol 38 No 18 (December 1988) pp 13464-13467 ISSN 1098-0121
Minkov VS Krylov AS Boldyreva EV Goryainov SN Bizyaev SN amp Vtyurin AN (2008) Pressure-Induced Phase Transitions in Crystalline L- and DL-Cysteine The Journal of Physical Chemistry B Vol 112 No 30 (July 2008) pp 8851-8854 ISSN 1520-6106
Minkov VS Goryainov SV Boldyreva EV amp Goumlrbitz CH (2010) Raman study of pressure-induced phase transitions in the crystals of orthorhombic and monoclinic polymorphs of L-cysteine dynamics of the side-chain Journal of Raman Spectroscopy Vol 41 No 12 (December 2010) pp 1458-1468 ISSN 1097-4555
Moggach SA Allan DR Morrison PA Parsons S amp Sawyer L (2005) Effect of pressure on the crystal structure of L-serine-I and the crystal structure of L-serine-II
wwwintechopencom
Vibrational Spectroscopy
58
at 54 GPa Acta Crystallographica Section B Vol 61 No 1 (February 2005) pp 58-68 ISSN 0108-7681
Moggach SA Marshall WG amp Parsons S (2006) High-pressure neutron diffraction study of L-serine-I and L-serine-II and the structure of L-serine-III at 81 GPa Acta Crystallographica Section B Vol 62 No 5 (October 2006) pp 815-825 ISSN 0108-7681
Moreno AJD Freire PTC Melo FEA Arauacutejo-Silva MA Guedes I Mendes Filho J (1997) Pressure-induced phase transitions in monohydrated l-asparagine aminoacid crystals Solid State Communications Vol 103 No 12 (September 1997) pp 655-658 ISSN 0038-1098
Murli C Sharma SK Karmakar S amp Sikka SK (2003) -Glycine under high pressures a Raman scattering study Physica B Condensed Matter Vol 339 No 1 (November 2003) pp 23-30 ISSN 0921-4526
Murli C Vasanthi R amp Sharma SM (2006) Raman spectroscopic investigations of DL-serine and DL-valine under pressure Chemical Physics Vol 331 No 1 (December 2006) pp 77-84 ISSN 0301-0104
Olsen JS Gerward L Freire PTC Mendes Filho J Melo FEA amp Souza Filho AG (2008) Pressure-induced phase transitions in L-alanine crystals Journal of Physics and Chemistry of Solids Vol 69 No 7 (July 2008) pp 1641-1645 ISSN 0022-3697
Sabino AS De Sousa GP Luz-Lima C Freire PTC Melo FEA amp Mendes Filho J (2009) High-pressure Raman spectra of L-isoleucine crystals Solid State Communications Vol 149 No 37-38 (October 2009) pp 1553-1556 ISSN 0038-1098
Sasaki JM Freire PTC Moreno AJD Melo FEA Guedes I Mendes Filho J Shu J Hu J amp Matildeo HK (2000) Single crystal X-ray diffraction in monohydrate L-asparagine under hydrostatic pressure Science and Technology of High Pressure Proceedings of AIRAPT-17 Hyderabad India 2000
Seijas LE Delgado GE Mora AJ Fitch AN amp Brunelli M (2010) On the Crystal structures and hydrogen bond patterns in proline pseudopolymorphs Powder Diffraction Vol 25 No 3 (September 2010) pp 235-240 ISSN 0885-7156
Silva BL Freire PTC Melo FEA Mendes Filho J Pimenta MA amp Dantas MSS (2000) High-pressure Raman spectra of L-threonine crystal Journal of Raman Spectroscopy Vol 31 No 6 (June 2000) pp 519-522 ISSN 1097-4555
Teixeira AMR Freire PTC Moreno AJD Sasaki JM Ayala AP Mendes Filho J amp Melo FEA (2000) High-pressure Raman study of l-alanine crystal Solid State Communications Vol 116 No 7 (October 2000) pp 405-409 ISSN 0038-1098
Tumanov NA Boldyreva EV Kolesov BA Kurnosov AV amp Quesada Cabrera R (2010) Pressure-induced phase transitions in L-alanine revisited Acta Crystallographica Section B Vol 66 No 4 (August 2010) pp 458-371 ISSN 1600-5740
Yamashita M Inomata S Ishikawa K Kashiwagi T Matsuo H Sawamura S amp Kato M (2007) A high-pressure polymorph of L--leucine Acta Crystallographica Section E Vol 63 No 5 (May 2007) pp o2762-o2764 ISSN 1600-5368
wwwintechopencom
Vibrational SpectroscopyEdited by Prof Dominique De Caro
ISBN 978-953-51-0107-9Hard cover 168 pagesPublisher InTechPublished online 24 February 2012Published in print edition February 2012
InTech EuropeUniversity Campus STeP Ri Slavka Krautzeka 83A 51000 Rijeka Croatia Phone +385 (51) 770 447 Fax +385 (51) 686 166wwwintechopencom
InTech ChinaUnit 405 Office Block Hotel Equatorial Shanghai No65 Yan An Road (West) Shanghai 200040 China
Phone +86-21-62489820 Fax +86-21-62489821
The infrared and Raman spectroscopy have applications in numerous fields namely chemistry physicsastronomy biology medicine geology mineralogy etc This book provides some examples of the use ofvibrational spectroscopy in supramolecular chemistry inorganic chemistry solid state physics but also in thefields of molecule-based materials or organic-inorganic interfaces
How to referenceIn order to correctly reference this scholarly work feel free to copy and paste the following
Paulo de Tarso Cavalcante Freire Joseacute Alves Lima Juacutenior Bruno Tavares de Oliveira Abagaro Gardecircnia deSousa Pinheiro Joseacute de Arimateacutea Freitas e Silva Josueacute Mendes Filho and Francisco Erivan de Abreu Melo(2012) High Pressure Raman Spectra of Amino Acid Crystals Vibrational Spectroscopy Prof Dominique DeCaro (Ed) ISBN 978-953-51-0107-9 InTech Available from httpwwwintechopencombooksvibrational-spectroscopyhigh-pressure-raman-spectra-of-amino-acid-crystals
copy 2012 The Author(s) Licensee IntechOpen This is an open access articledistributed under the terms of the Creative Commons Attribution 30License which permits unrestricted use distribution and reproduction inany medium provided the original work is properly cited
High Pressure Raman Spectra of Amino Acid Crystals
39
the band at 49 cm-1 decreases above the critical pressure of 23 GPa an inverse effect is observed eg the lowest wavenumber band decreases in intensity while the other band increases its intensity (Teixeira et al 2000) Beyond this under the scrutiny of the behavior of lattice modes of L-alanine through Raman spectroscopy it was reported the evidence of a structural phase transition at ~ 23 GPa (Teixeira et al 2000) that seems to be confirmed by X-ray diffraction measurements (Olsen et al 2008) However very recent works reinterpreted X-ray diffraction measurements as conformational changes of the ammonia group (Funnel et al 2010 Tumanov et al 2010) Additionally (i) the Raman scattering data were not correlated with a structural phase transition only with continuous changes in the intermolecular interactions (Tumanov et al 2010) (ii) at about 2 GPa the cell parameters a and b become accidentally equal to each other (Funnel et al 2010 Tumanov et al 2010) but maintaining the same orthorhombic structure (P212121) differently from the work of ref (Olsen et al 2008) that interpreted the X-ray diffraction results as an orthorhombic tetragonal phase transition There are three other aliphatic amino acids which were investigated by Raman spectroscopy under high pressure conditions L-leucine L-isoleucine and L-valine At atmospheric pressure and room temperature L-leucine (C6H13NO2) crystallizes in a monoclinic structure (C22) (Harding amp Howieson 1976) although there are reports of a second phase for temperatures higher than 353 K (Faccedilanha Filho et al 2008) and a third polymorph resulting from residues of a solution at 200 Ma (Yamashita et al 2007) A series of modifications on the Raman spectrum of L-leucine crystal were observed when it was submitted to high pressure conditions (Faccedilanha Filho et al 2009) The modifications occur in three different pressure ranges (i) between 0 and 046 GPa (ii) between 08 and 146 GPa and (iii) at around 36 GPa The first modification observed in the Raman spectra involves motions of the CH and CH3 units as can be understood from the behavior of the bands in the high wavenumber region (about 3000 cm-1) It is worth to note that such a change is also associated to the hydrogen bond changes because an increasing in the line width of a band associated with the torsion of CO2- is verified across the pressure of 046 GPa although there is no great change in the lattice modes Differently the changes observed between 08 and 146 GPa occurs both in the internal modes and in the lattice modes of the crystal indicating a structural phase transition undergone by L-leucine Finally around 36 GPa change of the slopes of the frequency versus pressure plots associated with CO2- moieties were observed pointing to changes associated to hydrogen bonds (Faccedilanha Filho et al 2009) The Raman spectrum of L-valine (C5H11NO2) under high pressure conditions presents several changes between 00 and 69 GPa (Hermiacutenio da Silva et al 2009) In particular an extraordinary increase of intensity of the C ndash H stretching bands is verified at about 3 GPa and a decrease of intensity is observed at ~ 53 GPa Simultaneously discontinuities are observed in the frequency versus pressure plots for all modes of the Raman spectrum in these two pressure values indicating possible phase transitions undergone by the crystal L-isoleucine (C6H13NO2) was another aliphatic amino acid whose Raman spectra were investigated under high pressure (Sabino et al 2009) From this preliminary study it were observed changes on bands associated with both the rocking of NH3+ r(NH3+) and the rocking of CO2- r(CO2-) as well as to lattice modes at ~ 23 GPa and 50 GPa Such modifications in L-isoleucine were associated with conformational change of molecules or to a phase transition undergone by the crystal However a confirmation of the occurrence of phase transitions for L-valine L-leucine and L-isoleucine through X-ray diffraction or neutron diffraction is still lacking
wwwintechopencom
Vibrational Spectroscopy
40
Two sulfur amino acids were investigated under high pressure conditions L-methionine (Lima et al 2008) and L-cysteine (Minkov et al 2008 2010 Moggach et al 2006 Murli et al 2006) L-methionine (C5H11NO2S) crystallizes in a monoclinic structure and under compression undergoes a phase transition at about 22 GPa This modification is realized by the observation of the appearance of a very strong peak between the bands associated to stretching of SC (SC) and wagging vibration of CO2- (CO2-) At P = 27 GPa the intensity of the bands (SC) and (CO2-) goes to zero Additionally two new structures are observed around 540 cm-1 in the region where it is expect to be observed the band associated to the rocking of CO2- r(CO2-) Such a picture was interpreted as a phase transition undergone by L-methionine crystal with a hysteresis of about 08 GPa On the other hand L-cysteine can crystallize in two different polymorphs with orthorhombic and monoclinic symmetries (Minkov et al 2010) For the monoclinic polymorph of L-cysteine it was observed phase transitions at about 29 and 39 GPa with the changes in the Raman spectra suggesting that the hydrogen bond network is distorted and the S-HhellipO bonding dominates over S-HhellipS bonding at high pressures For the orthorhombic polymorph a series of different phase transition occurs but with no evidence that it transforms into the most dense monoclinic polymorph which is also stable at atmospheric pressure It is worth to note that the phase transitions in the orthorhombic L-cysteine involve changes in molecular conformation while the pressure-induced phase transitions in the monoclinic phase are mainly related to changes in the hydrogen bond network (Minkov et al 2010) L-threonine (C4H9NO3) (Silva et al 2000) was investigated up to 43 GPa through Raman spectroscopy From this study it was observed several modifications in the Raman spectrum including the region associated to the lattice mode vibrations mainly between 2 and 22 GPa Other modifications above 3 GPa were also observed but no X-ray diffraction experiment was performed up to now which would confirm the occurrence of eventual phase transition undergone by L-threonine crystal L-serine was also investigated under high pressure conditions (Boldyreva et al 2005b 2006a 2006b Moggach et al 2005 2006) From x-ray diffraction measurements (Moggach et al 2005) it was observed that at ~ 48 GPa the crystal undergoes a phase transition with changes in the hydrogen bond network while the low pressure phase is characterized by OHhellipOH hydrogen bond chains in the high pressure phase it is observed shorter OHhellipcarboxyl interactions Yet Ref (Moggach et al 2005) shows that the phase transition occurs with change in two torsion angles but with any major changes in the orientations of the molecules in the unit cell Study of Ref (Boldyreva et al 2006b) confirms the phase transition previously reported in Ref (Moggach et al 2005) although with a transition pressure value of ~ 53 GPa and points the existence of another phase transition at 78 GPa In this second phase transition new OHhellipO(CO) hydrogen bond and a new NHhellipOH bond are formed showing that OH-group becomes both a proton donor and a proton acceptor Finally finishing this picture of the state of the art of vibrational and structural aspects of amino acid crystals under high pressure we briefly discuss results on L-asparagine monohydrate which was investigated both by Raman spectroscopy (Moreno et al 1997) and by X-ray diffraction experiments (Sasaki et al 2000) Both studies point to the occurrence of three different phase transitions between 00 and 13 GPa which constitute up to now the most unstable amino acid crystal structure In all these investigations the occurrence of phase transitions involving change in the dimension of the several HB in the unit cell seems to be the role An extension of studies of
wwwintechopencom
High Pressure Raman Spectra of Amino Acid Crystals
41
amino acid crystals under high pressure conditions investigated by Raman spectroscopy for L-histidineHClH2O and L-proline monohydrate is given here
3 Experimental
The samples of HHM were grown from aqueous solution by the slow evaporation method at controlled temperature The samples of PM polycrystals were obtained from reagent grade (Sigma Aldrich) and used without further purification Raman experiments on HHM were performed in the backscattering geometry employing a Jobin Yvon Triplemate 64000 micro-Raman system equipped with a N2-cooled charge-coupled device (CCD) detection system while for Raman experiments on PM it was employed an HR 460 Jobin Yvon spectrometer The slits were set for a 2 cm-1 spectral resolution Raman spectra were excited with the 5145 nm line of an argon ion laser The high-pressure experiments at room temperature were performed on a small piece of sample compressed using a diamond anvil cell (model NBS mdash National Bureau of Standards) For the Raman experiments on PM it was used a membrane diamond anvil cell (MDAC) with a 400 m culet diameter diamonds as the pressure device A 150 m-diameter hole in a stainless-steel (200 m of initial thickness preindented to 40 m) was loaded with argon while a 200 m-diameter hole in a stainless-steel with a 230 m of initial thickness was loaded with mineral oil in the study of L-histidineHClH2O An Olympus microscope lens with a focal distance f = 205 mm and a numerical aperture 035 was used to focus the laser beam on the sample surface which was located in the pressure cell The pressure in the cell was monitored using the standard shifts of the Cr3+Al2O3 emission lines
4 Results
41 L-proline monohydrate In this sub-section we present investigation of polycrystalline PM under hydrostatic pressure up to 118 GPa It is important to state that the sample used in the experiment had a small quantity of anhydrous phase (about 8 according to the Rietveld refinement) in such a way that the structure can be considered as monoclinic L-proline monohydrate
Fig 1 Unit cell of PM seen along the b-axis
wwwintechopencom
Vibrational Spectroscopy
42
PM (see Figure 1) crystal is found in a monoclinic structure space group C2with a = 2043 Aring b = 619 Aring c = 514 Aring and = 9579deg and Z=4 (Seijas et al 2010) In such a material the hydrogen bonds play a special role in the stability of the crystal structure X-ray diffraction study shows that there are interactions between amino and carboxylate groups through the hydrogen bonds N1-H1hellipO1 N1-H1hellipO2 and N1-H2hellipO1 with H1 atom acting as a bifurcated donor taking part in two hydrogen bonds These hydrogen bonds link the proline molecules forming pairs of chains in opposite directions along the c axis The water molecules form zigzag chains of O-HhellipO hydrogen bonds also parallel to the c axis (Seijas et al 2010) Figure 2 presents the Raman spectra of polycrystalline PM crystal in the spectral range 10 ndash 250 cm-1 for pressures from 00 to 118 GPa The spectrum taken at 00 GPa shows a complex profile indicating the occurrence of several bands in fact fitting with Lorentzian curves
Fig 2 Raman spectra of PM under several pressure conditions from 00 to 118 GPa in the spectral range 50 ndash 250 cm-1
wwwintechopencom
High Pressure Raman Spectra of Amino Acid Crystals
43
points to the existence of six bands between 10 and 160 cm-1 When pressure is increased great changes are observed in the Raman profile of the spectrum At 11 GPa the Raman spectrum of L-proline is very different from that obtained at 00 GPa (i) the mode peaked at ~ 68 cm-1 becomes the most intense band in the spectrum at 11 GPa (ii) the most intense peak in the spectrum taken at 00 GPa decreases intensity and in the spectrum taken at 11 GPa it is only the second most intense peak in the region 10 ndash 250 cm-1 (iii) the peaks marked by arrows in the spectrum at 00 GPa increase intensity Such a set of modifications point to the possibility of the occurrence of a phase transition undergone by polycrystalline L-proline for pressures below 11 GPa Results on other spectral regions of the Raman spectrum will reinforce this hypothesis It is observed a gradual change of intensity of all bands appearing in the Raman spectra of Figure 2 as well as continuous blue shifts of all wavenumbers when pressure is increased from 111 to 65 GPa The gradual change of the profiles of the Raman spectrum can be interpreted as continuous changes of the conformation of the molecules of L-proline in the unit cell of the crystal However between 65 and 78 GPa it is observed a strong change in the profile of the Raman spectrum in the low wavenumber region In particular the most intense band observed in the spectrum taken at 65 GPa lost intensity becoming one of the peaks with lowest intensity Additionally jump in the wavenumber of almost all bands are also verified in this pressure interval (65 - 78 GPa) As a consequence we have interpreted the changes of the Raman spectrum as a phase transition undergone by polycrystalline L-proline between 65 and 78 GPa Other evidences will be shown in the next paragraphs Finally when we decrease pressure from the highest value obtained in our experiments down to atmospheric pressure we observe that the original spectrum ndash bottom spectrum in Figure 2 ndash is recovered (the final spectrum is marked as 00 GPa) Figure 3 presents the Raman spectra of PM crystal for several pressures in the spectral range 200 ndash 750 cm-1 According to Ref (Herlinger amp Long 1970) (see also Table 1) the band recorded close to 294 cm-1 in the 00 GPa spectrum can be associated to a deformation vibration of the skeleton of the structure (skel) The bands observed at 377 and 447 cm-1 are associated respectively to the bending of CCN (CCN) and rocking of CO2- r(CO2-) In fact for other amino acid crystals it has been reported that the r(CO2-) is the most intense band in the 200 ndash 700 cm-1 spectral range However for the other amino acids differently from L-proline the r(CO2-) mode is observed for wavenumber higher than 500 cm-1 (-glycine 503 cm-1 (Dawson et al 2005) L-alanine 532 cm-1 L-valine 542 cm-1 (Goryainov et al 2005) DL-alanine 543 cm-1 etc) Finally in the spectrum taken at 00 GPa we can observe a band at 574 cm-1 which was associated to a bending of CO2- group Finally bands at 641 669 and 695 cm-1 were associated respectively to wagging of CO2- w(CO2-) (skel) and scissoring of CO2- sc(CO2-) By increasing the pressure we observe that between 00 and 11 GPa some important modifications are present For example the band (CCN) decreases intensity and seems to split A clear splitting is observed for the band at 574 cm-1 and the r(CO2-) band at 447 cm-1 begins to present a shoulder in the high wavenumber side Additionally the (skel) band at 669 cm-1 (marked by an asterisk in the spectrum of 00 GPa) disappears between the two lowest pressure spectra This entire complex picture corroborates the fact that the crystal is undergoing a phase transition between 00 and 11 GPa If one continues to increase pressure on the PM crystal it is possible to observe that all bands suffer blue shifts up to 65 GPa also in general terms the linewidth increases for all bands However no great changes are observed indicating that the crystal structure
wwwintechopencom
Vibrational Spectroscopy
44
Fig 3 Raman spectra of PM under several pressure conditions from 00 to 118 GPa in the spectral range 250 ndash 750 cm-1
remains the same of that observed at 11 GPa In other words the crystal seems to be stable between 11 to 65 GPa But when pressure arrives to 78 GPa great modifications are observed in the 200 ndash 700 cm-1 spectral region Let us state these modifications (i) the appearance of a band (marked by an arrow in the spectrum taken at 78 GPa) in the region ~ 450 cm-1 (ii) an impressive fall of intensity and a red shift of the band associated to r(CO2-) (iii) a red shift of the two bands in the region 550 ndash 600 cm-1 (iv) the appearance of low intense bands (marked by an asterisk in the spectrum taken at 78 GPa) for wavenumbers higher than 600 cm-1 (v) the increase of intensity of the band initially assigned as scissoring of CO2- (vi) the appearance of a band at ~ 725 cm-1 Again the modifications in the spectra between 65 and 78 GPa presented in Figure 3 corroborate the fact that PM crystal undergoes a second phase transition as discussed previously When pressure is released down to 00 GPa whose spectrum is marked by 00 GPa we observe that the starting atmospheric spectrum is recovered as already observed in Figure 2 Figure 4 presents the Raman spectra of PM crystal under high pressure conditions with argon as compression medium in the region 600 to 1250 cm-1 We have cut off the peaks in the region close to 900 cm-1 because there is a peak with high intensity that makes difficult the visualization of the bands close to it this region will be discussed in Figure 5 In the Figure 4 we observe that several peaks are well defined (the peak marked by an asterisk is due a lamp used to calibrate the spectra) It is important to state that in the spectrum at 00
wwwintechopencom
High Pressure Raman Spectra of Amino Acid Crystals
45
Wavenumber (cm-1) Assignment Wavenumber (cm-1) Assignment
68 Lattice mode 950 (CCN)+(CC)
81 Lattice mode 982 v(CCN)+(CC)
99 Lattice mode 991 (CCN)+(CC)
120 Lattice mode 1031 (CCN)+(CC)
134 Lattice mode 1055 w(CH2)
149 Lattice mode 1079 w(CH2)
203 - 1084 r(CH2)
294 (skel) 1161 t(CH2)
373 (CCN) 1172 t(CH2)
447 r(CO2-) 2876 (CH)
574 (CO2-) 2898 (CH)
641 w(CO2-) 2932 (CH)
669 (skel) 2949 (CH)
695 sc(CO2-) 2971 (CH)
791 (skel) 2983 (CH)
840 r(CH2) 3006 (CH)
863 r(CH2) 3011 (CH)
897 r(NH2+) 3041 (NH)
918 (CCN)+(CC) 3068 (NH)
Table 1 Wavenumber (in cm-1) and approximate assignments of Raman bands for L-proline monohydrate crystal where def deformation bending r rocking w wagging sc scissoring stretching t twisting
GPa there are two peaks between 975 and 1000 cm-1 and in the spectrum taken at 11 GPa only one band is observed Another aspect that worth note is the fact that the band of highest energy (~ 1172 cm-1 at 00 GPa twisting of CH2 t(CH2)) splits in the spectrum taken at 11 GPa Above this last pressure the intensity of the peaks remains approximately constant up to 65 GPa Between 65 and 78 GPa the Raman spectrum presents great changes The band associated to the rocking of CH2 r(CH2) observed initially at ~ 840 cm-1 presents both a jump to high wavenumbers and an increasing in its linewidth A splitting is observed for the band marked by an star in the spectrum recorded at 65 GPa and observed initially at ~ 950 cm-1 which is associated to the stretching of CCN and CC units (CCN) + (CC) If one observe the band at 1033 cm-1 which is associated to the wagging of CH2 w(CH2) interestingly between 65 and 78 GPa it changes intensity with the band marked by a down arrow in the spectrum taken at 65 GPa so the w(CH2) band lost intensity and the band marked by a down arrow increases intensity Similarly the low intense bands observed between 1080 and 1200 cm-1 present great changes in their intensities between 65 and 78 GPa All these changes corroborate the modification in the crystal structure which occurs above 65 GPa which are reversible when pressure is released down to 00 GPa
wwwintechopencom
Vibrational Spectroscopy
46
Fig 4 Raman spectra of PM under several pressure conditions from 00 to 118 GPa in the spectral range 600 ndash 1250 cm-1
Figure 5 shows the Raman spectra of PM crystal in the 800 ndash 1100 cm-1 spectral region The dominant band in the spectrum taken at 00 GPa observed at 897 cm-1 is associated to the rocking vibration of NH2+ r(NH2+) The changes occurring in the first phase transition are not impressive but we note that between 65 and 78 GPa the band lost intensity and splits into two bands Above 78 GPa blue shifts of the wavenumbers are verified but no great change is present up to the highest pressure arrived in the experiment Decreasing pressure down to 00 GPa again we observe that the original spectrum is also recovered in this region In the spectral region presented in Figure 6 it is expected to be observed bands associated to the stretching vibrations of CH and CH2 units A theoretical study performed on L-methionine showed that different profiles of the Raman spectrum in this wavenumber range are associated with different conformations of the molecule In this sense when we observe the Raman spectra of PM as a function of pressure we note that between 00 and 11 GPa the most intense band at 00 GPa split into three bands (marked by up arrows) In the spectrum taken at 17 GPa the separation is very clear and when pressure is further increased the bands become clearly distinct But between 65 and 78 GPa the spectrum changes abruptly indicating that between these two pressure values the proline molecules undergo a great conformational change Because we have observed additionally changes in the low wavenumber region we can understand that both conformational change and structural phase transition take place for PM crystal As observed in the other spectral regions the original spectrum at 00 GPa is recovered when pressure is released
wwwintechopencom
High Pressure Raman Spectra of Amino Acid Crystals
47
Fig 5 Raman spectra of PM under several pressure conditions from 00 to 118 GPa in the spectral range 800 ndash 1100 cm-1
Data can give us some insights related to the behaviour of molecules of proline as the crystal is compressed For example in a previous study on -glycine the softening of a bending of CO2- was associated to a decrease in the intra-layer hydrogen bond strength while the stiffening of the same vibration was associated to an increase in the bond strength (Dawson et al 2005) For PM we have observed that the band associated to both bending of CO2- (CO2-) and rocking of CO2- r(CO2-) increase wavenumbers from 11 to 65 GPa and between 65 and 78 GPa decrease wavenumber for (CO2-) the decreasing is represented by the two dashed lines in Figure 3 between the spectra of 65 and 78 GPa We have also observed an additional increasing of wavenumbers for pressures higher than 78 GPa This suggests that the intra-layer hydrogen bond strength is stiffened up to 65 GPa between 65 and 78 GPa the hydrogen bond strength is softened and above 80 GPa the hydrogen bond is stiffened Additionally our results suggest that between 65 and 78 GPa occurs a structural rearrangement in such a way that the behaviour of the hydrogen bond strengths is changed This rearrangement is enough to change the symmetry of the crystal because
wwwintechopencom
Vibrational Spectroscopy
48
Fig 6 Raman spectra of PM under several pressure conditions from 00 to 118 GPa in the spectral range 2850 ndash 3200 cm-1
associated to it we observe great modifications in the Raman spectrum of low wavenumber region (Figure 2) Yet related to the phase transition between 65 and 78 GPa it is impressive the increase of intensity of a band in the spectrum taken at 65 GPa (marked by an arrow see Figure 4) which can be assigned as wagging of CH2 w(CH2) it change of intensity with the band close to it at ~ 1055 cm-1 at 00 GPa which is also assigned as w(CH2) indicating that a conformational change in the ring may also occurs when the crystal undergoes the phase transition at 65 - 78 GPa It is also interesting to note that the first transition occurs from a monoclinic to a phase with lower symmetry (another monoclinic our a triclinic phase) because in several regions including both internal and lattice mode spectral regions the number of peaks in the spectrum taken at 11 GPa is greater than the number of Raman peaks in the spectrum taken at 00 GPa It is also worth note that above 78 GPa almost all bands increases linewidth indicating that some disorder is introduced in the high pressure phase However the disorder does not occur in a high degree because when pressure is released down to 00 GPa the original spectrum is recovered It is known that the amorphization process is preceded by some disorder in the crystal structure however due to recovered of the original Raman spectrum after releasing pressure we can infer that when we arrive to 1118 GPa we are far away from the pressure point where eventually the PM crystal should present amorphization
wwwintechopencom
High Pressure Raman Spectra of Amino Acid Crystals
49
42 L-histidine hydrochloride monohydrate Related to the HHM (see Figure 8) which crystallizes in an orthorhombic structure belonging to the P212121 (D24) space group with four molecules of C6H9N3O2HClH2O per unit cell we were able to arrive up to 75 GPa and discovery a new polymorph of the material above 31 GPa The strong bond between N-H of the imidazole ring and the carboxyl group of a neighboring molecule is the fundamental intermolecular link resulting in a spiral arrangement along the c-axis (Donohue amp Caron 1964) The coupling of the four zwitterions in the unit cell leads to 297 optical normal modes decomposed into irreducible representations of the factor group D2 as Γop = 75 A + 74 (B1 + B2 + B3) and the acoustic modes can be expressed as Γac = B1 + B2 + B3 Under high pressure conditions modifications the Raman spectra are interpreted in terms of both conformational changes of the molecules in the unit cell and in terms of a phase transition Figure 9(a) presents the Raman spectra of HHM for several pressures in the spectral range from 50 to 660 cm-1 The region for wavenumbers lower than 200 cm-1 as previously stated is characteristic of the lattice vibration modes Increasing pressure we observe that the bands present blue shifts of their wavenumbers However between 27 and 31 GPa it is possible to note that a great change occurs in the Raman spectrum the peak marked by a square which is associated to torsion of CO2- (τ(CO2-)) splits in two new peaks which are marked by up arrows in the spectrum at 31 GPa In Figure 9(b) which presents the plot of experimental wavenumber as function of pressure we clearly observe the splitting of the band close to 180 cm-1 Additionally we note that for other bands discontinuities of wavenumbers are observed between 27 to 31 GPa (De Sousa et al 2011)
Fig 8 Unit cell of HHM seen along the b-axis
In this region it is also possible to observe many internal vibrations of the histidine molecule such as skeletal structure at 442 and 490 cm-1 torsion of NH3+ which is observed at 385 cm-1 and rocking of CO2- at 530 cm-1 Again as occurs with the spectra shown in the lattice mode region modifications are observed in the spectral range 27 - 31 GPa Among these changes we observed the disappearance of the bands at 276 and 500 cm-1 and the
wwwintechopencom
Vibrational Spectroscopy
50
Fig 9 (a) Raman spectra of HHM under several pressure conditions from 04 to 75 GPa in the spectral range 50 ndash 650 cm-1 (b) wavenumber versus pressure of the bands of HHM appearing in Fig 9(a)
appearance of a band at 473 cm-1 in the spectrum taken at 31 GPa We additionally note that the intensity of the band associated to torsion of NH3+ decreases with increasing pressure indicating that there occurs a conformational change of histidine molecule Such a conformational change can be understood as consequence of the change of the intermolecular hydrogen bond length With increasing pressure the band initially at 385 cm-
1 which is associated with a torsion vibration of the NH3+ unit shifts linearly toward higher wavenumbers we can say that the pressure decreases the length of the hydrogen bonds increasing the wavenumber of the band associated to torsional vibration of NH3+ unit Figure 10(a) presents the Raman spectra of HHM in the 650 ndash 1250 cm-1 interval for several pressure values up to 75 GPa In this spectral region it is expected to observe vibrations assigned to the deformation of CO2- stretching of both C-C and C-N wagging of H2O and rocking of NH3+ The band observed at ~ 694 cm-1 is associated to a deformation vibration of CO2- (CO2) while the out-of-plane vibration of CO2- (CO2) is observed at ~ 822 cm-1 The band at 807 cm-1 is associated with a wagging vibration of the water molecule w(H2O) The bands recorded at 1191 and 1210 cm-1 can be assigned as the rocking of NH3+ unit r(NH3+) In this spectral region some changes are observed in the range 27 ndash 31 GPa (i) the disappearance of the band at 694 cm-1 (ii) the appearance of a new weak band at 717 cm-1
(marked by a star in the Figure 10(a)) (iii) the inversion of intensity of the two bands located at 807 and 822 cm-1 which are related to units directly involved in the hydrogen bonds and (iv) the inversion of intensity of the two bands associated to a rocking of NH3+ unit r(NH3+) located at 1191 and 1210 cm-1 The dependence of the wavenumber versus pressure plot for this spectral region is presented in Fig 10(b) we note that many of the observed Raman modes show a small discontinuous change in the slope in the pressure-induced variation of its wavenumber in range 27 ndash 31 GPa
wwwintechopencom
High Pressure Raman Spectra of Amino Acid Crystals
51
Figure 11(a) shows the Raman spectra of the HHM crystal in the spectral range 1700-1400 cm-1 for pressure from 00 to 75 GPa Fig 11(b) shows the respective wavenumber vs pressure plots In this region one expects to observe vibrations assigned to a deformations of the imidazole ring of the histidine molecule asymmetric stretching of the CO2- units stretching of C=O among others In the Figure 11(a) two modifications are observed in the range 27 ndash 31 GPa The first change is the decreasing of the relative intensity of the band originally at 1433 cm-1 and the second one is the appearance of a band at 1642 cm-1 In the wavenumber versus pressure plot presented in Figure 11(b) a subtle discontinuity occurs in the range 27 ndash 31 GPa with appreciably differences in slopes where two modes change from positive to negative slopes
Fig 10 (a) Raman spectra of HHM under several pressure conditions from 04 to 75 GPa in the spectral range 650 ndash 1250 cm-1 (b) wavenumber versus pressure of the bands of HHM appearing in Fig 10(a)
The Raman spectra of HHM crystal in the range 3450-3125 cm-1 are shown in the Figure 12(a) and in the Figure 12(b) the respective wavenumber versus pressure plots are given In this region we expected to observe stretching vibrations of several units of the amino acids and of the water molecule (CH NH3+ and OH-) It is important to note that for wavenumbers lower than 3000 cm-1 there are some modes related to the mineral oil used as compression media In detail the band at 3111 cm-1 can be associated to a stretching vibration of NH3+ unit (NH3+) while the bands observed at 3155 and 3163 cm-1 are associated to a CH stretching vibration of imidazole ring The bands observed at 3374 and 3408 cm-1 are related to the OH- stretching of the water molecules In the pressure range 27 ndash 31 GPa main changes are observed such as the disappearance of the bands related to a OH- stretching vibration (initially located at 3367 and 3393 cm-1) the appearance of a band of weak intensity at 3424 cm-1 and discontinuities of the wavenumber curve of bands at 3155 and 3163 cm-1 which are associated with the CH stretching vibration
wwwintechopencom
Vibrational Spectroscopy
52
Fig 11 (a) Raman spectra of HHM under several pressure conditions from 04 to 75 GPa in the spectral range 1400 ndash 1670 cm-1 (b) wavenumber versus pressure of the bands of HHM appearing in Fig 11(a)
Fig 12 (a) Raman spectra of HHM under several pressure conditions from 04 to 75 GPa in the spectral range 2950 ndash 3450 cm-1 (b) wavenumber versus pressure of the bands of HHM appearing in Fig 12(a)
wwwintechopencom
High Pressure Raman Spectra of Amino Acid Crystals
53
Table 2 gives a quantitative analysis of the evolution of the Raman spectra of HHM crystal with pressure where fitting of all bands to a linear expression ω = ω0 + P is furnished In Table 2 the first column (ωobs) represents the wavenumber of the Raman bands observed at room pressure the second and third columns correspond to adjustment of data for pressure values between 0 and 27 GPa and the two last columns correspond to fitting of the high-pressure phase that observed between 31 and 75 GPa A resume of the modifications observed in all spectral regions of the Raman spectra of HHM is as follows (i) splitting of the band in the low-wavenumber lattice range (ii) change in the number of bands associated to internal modes (iii) wavenumber shifts with discontinuities (iv) changes in the relative intensities of the vibrational bands It is important to state that changes were observed for the deformation vibrations of the OH- of the water molecule as well as of the NH3+ and CO2- groups of the amino acid molecule This picture indicates large conformational changes of the molecules in the unit cell Related to HHM beyond the hydrogen bonds originated from the histidine molecule there are two hydrogen bonds from the water molecule It is interesting to note from Figure 12(b) that the wavenumber of OH- stretching (OH-) decreases with increasing pressure However the OH units participate of hydrogen bonds one to a carboxyl oxygen and another to the chloride ion This means that between 00 and 31 GPa the hydrogen bond strength increases and the wavenumber of(OH-) decreases in this pressure range Also after the phase transition the wavenumber of (OH-) suffers a jump and continues to decrease up to the highest pressure obtained in our experiments Such a picture indicates a further increase of the hydrogen bonds formed by the water molecules and confirms that these bonds are playing an important role in the mechanism of the transition It is interesting to note that similar changes in the low-wavenumber region were also observed for the same crystal when subjected to low temperatures
ωobs
(cm-1)
Phase 1
(0 le P le 27 GPa) Phase 2
(31 le P le 75 GPa)
ω0
(cm-1)
(cm-1)(GPa)-1 ω0
(cm-1)
(cm-1)(GPa)-1
94 945 0669 937 -0103
105 1052 0276 1002 1771
121 1214 -1087 1109 2092
136 1357 1616 1360 0623
149 1497 2128 - -
159 1568 8033 1483 8105
- - - 1639 9960
188 1891 7661 1902 8059
270 2697 3093 - -
293 2919 6118 2945 7683
385 3846 7236 4015 1675
442 4423 1223 4423 1461
wwwintechopencom
Vibrational Spectroscopy
54
ωobs
(cm-1)
Phase 1
(0 le P le 27 GPa) Phase 2
(31 le P le 75 GPa)
ω0
(cm-1)
(cm-1)(GPa)-1 ω0
(cm-1)
(cm-1)(GPa)-1
- - - 4707 0785
491 490 5 3319 - -
530 5304 4335 - -
609 6078 5312 6208 2463
693 6935 1529 - -
- - - 7064 3449
807 8067 2042 8047 1467
824 8240 -0498 8204 1442
838 8361 7335 8504 3124
875 8734 6438 8881 2777
917 9173 0810 9187 2356
963 9630 2757 9636 2411
980 9787 4489 9787 5206
1068 10667 4790 10732 3418
1141 11403 1890 11403 2744
1162 11619 2611 11674 1120
1190 11900 2277 11885 1637
1208 12079 2859 12101 1341
1434 14345 1316 14382 0846
1448 14481 3059 14554 1677
1463 14621 4415 14760 0778
1481 14813 4238 14970 -0619
1609 16093 2739 16166 -0374
- - - 16249 2736
3111 31110 0919 31045 2914
3154 31546 1287 31532 6564
3164 31626 5305 31593 7905
3375 33739 -2638 - -
3407 34081 -5745 - -
- - - 34371 -3169
Table 2 Wavenumber values of the bands appearing in the HHM spectrum at 00 GPa (ωobs) and adjustment data by linear fitting (P) for the two phases
wwwintechopencom
High Pressure Raman Spectra of Amino Acid Crystals
55
5 Conclusions
The results suggested that L-proline monohydrate undergoes two phase transitions one between 00 and 11 GPa and a second between 65 and 78 GPa In both transitions it was possible to observed changes in the spectrum profile discontinuities in the wavenumber versus pressure plots in the lattice region of the spectrum and the appearance of news bands By releasing the pressure after attaining a maximum of 118 GPa the atmospheric pressure spectrum was fully recovered showing that the pressure-induced transitions undergone by polycrystalline L-proline crystal are reversible In the first transition it was observed the splitting of bands associated to (CCN) (CO2-) and (CH) vibrations The band associated to (skel) has disappeared In the second one we have observed the red shift of r(CO2-) significant changes in the intensity of the bands associated to the sc(CO2-) and w(CH2) vibrations and the splits of (CCN) + (CC) and r(NH2+) that also has lost intensity These modifications were interpreted as conformational changes of molecules in the unit cell Because these changes involve moieties that participate in hydrogen bonds we suppose that these hydrogen bonds have also been modified Modifications of hydrogen bonds can trigger some molecular rearrangements that lead to structural phase transitions In our work this hypothesis was supported by the changes that were observed in the region of the lattice modes for both phase transitions Therefore the results suggested two structural phase transitions one between 00 and 11 GPa and another between 65 and 78 GPa accompanied by significant conformational changes of molecules in the L-proline monohydrated crystal The results also suggest that HHM crystal undergoes a phase transition between 27 and 31 GPa when it is submitted to high pressure conditions up to 75 GPa The main changes observed in the Raman spectra was the splitting of the band in the low-wavenumber lattice range change in the number of bands associated to internal modes and wavenumber shifts with discontinuities Having described the behavior of two amino acid crystals under pressure and looked back at the past fourteen years of research we can ask to ourselves what does the future hold Based on the studies performed we believe that the use of several techniques such as neutron and Raman scattering as well as thermal and infrared analyses can help us to give a complete picture about hydrogen bond and the behavior of amino acids under pressure Maybe the study of peptide under similar external conditions should be the next road to be walked
6 Acknowledgment
Authors acknowledge CAPES CNPq and FUNCAP for financial support
7 References
Barthes M Bordallo HN Deacutenoyer F Lorenzo J-E Zaccaro J Robert A amp Zontone F (2004) Micro-transitions or breathers in L-alanine The European Physical Journal B Vol 37 No 3 (February 2004) pp 375-382 ISSN 1434-6028
Boldyreva EV Drebushchak VA Drebushchak TN Paukov IE Kovalevskaya YA amp Shutova ES (2003a) Polymorphism of glycine Part I Journal of Thermal Analysis and Calorimetry Vol 73 No 2 (August 2003) pp 409-418 ISSN 1388-6150
wwwintechopencom
Vibrational Spectroscopy
56
Boldyreva EV Drebushchak VA Drebushchak TN Paukov IE Kovalevskaya YA amp Shutova ES (2003b) Polymorphism of glycine Part II Journal of Thermal Analysis and Calorimetry Vol 73 No 2 (August 2003) pp 419-428 ISSN 1388-6150
Boldyreva EV Ivashevskaya SN Sowa H Ahsbahs H amp Weber H-P (2004) Effect of High Pressure on Crystalline Glycine A New High-Pressure Polymorph Doklady Physical Chemistry Vol 396 No 1 (May 2004) pp 111-114 ISSN 0012-5016
Boldyreva EV Ivashevskaya SN Sowa H Ahsbahs H amp Weber H-P (2005a) Effect of hydrostatic pressure on the -polymorph of glycine 1 A polymorphic transition into a new -form Zeitschrift fuumlr Kristallographie Vol 220 No 1 ( January 2005) pp 50- 57 ISSN 0044-2968
Boldyreva EV Kolesnik EN Drebushchak TN Ahsbahs H Beukes JA amp Weber H-P (2005b) A comparative study of the anisotropy of a lattice strain induced in the crystals of L-serine by cooling down to 100 K or by increasing pressure up to 44 GPa Zeitschrift fuumlr Kristallographie Vol 220 No 1 (January 2005) pp 58- 65 ISSN 0044-2968
Boldyreva EV Kolesnik EN Drebushchak TN Ahsbahs H amp Seryotkin YV (2006a) A comparative study of the anisotropy of a lattice strain induced in the crystals of DL-serine by cooling down to 100 K or by increasing pressure up to 86 GPa A comparison with L-serine Zeitschrift fuumlr Kristallographie Vol 221 No 2 (2006) pp 150- 161 ISSN 0044-2968
Boldyreva EV Sowa H Seryotkin YV Drebushchak TN Ahsbahs H Chernyshev V amp Dmitriev V (2006b) Pressure-induced phase transitions in crystalline L-serine studied by single crystal and gigh-resolution powder X-ray diffraction Chemical Physics Letters Vol 429 No 4-6 (October 2006) pp 474-478 ISSN 0009-2614
Boldyreva E (2007a) Cristalline Amino Acids A Link between Chemistry Materials Science and Biology In Models Mysteries and Magic of Molecules Boeyens JCA amp Ogilvie JF pp 167-192 Springer ISBN 978-1-4020-5940-7 Netherlands
Boldyreva E (2007b) High-Pressure Polymorphs of Molecular Solids When Are They Formed and When Are They Not Some Examples of the Role of Kinetic Control Crystal Growth amp Design Vol 7 No 9 (August 2007) pp 1662-1668 ISSN 1528-7483
Dawson A Allan DR Belmonte SA Clark SJ David WIF McGregor PA Parsons S Pulham CR amp Sawyer L (2005) Effect of high pressure on the crystal structures of polymorphs of glycine Crystal Growth amp Design Vol 5 No 4 (May 2005) pp 1415-1427 ISSN 1528-7483
Destro R Marsh RE amp Bianchi R (1988) A low-temperature (23K) study of L-alanine The Journal of Physical Chemistry Vol 92 No 4 (February 1988) pp 966-973 ISSN 0022-3654
De Sousa GP Freire PTC Lima Jr JA Mendes Filho J amp Melo FEA (2011) High-pressure Raman spectra of L-histidine hydrochloride monohydrate cristal Vibrational Spectroscopy Vol 57 No 1 (September 2011) pp 102-107 ISSN 0924-2031
Donohue J amp Caron A (1964) Refinement of cristal structure of histidine hydrochloride monohydrate Acta Crystallographica Vol 17 No 9 (September 1964) pp 1178-amp ISSN 0108-7673
wwwintechopencom
High Pressure Raman Spectra of Amino Acid Crystals
57
Faccedilanha Filho PF Freire PTC Lima KCV Mendes Filho J Melo FEA amp Pizani PS (2008) High temperature Raman spectra of L-leucine crystals Brazilian Journal of Physics Vol 38 No 1 (March 2008) pp 131-137 ISSN 0103-9733
Faccedilanha Filho PF Freire PTC Melo FEA Lemos V Mendes Filho J Pizani PS amp Rossatto DZ (2009) Pressure-induced phase transitions in L-leucine crystal Journal of Raman Spectroscopy Vol 40 No 1 (January 2009) pp 46-51 ISSN 1097-4555
Freire PTC (2010) Pressure-Induced Phase Transitions in Crystalline Amino Acids In High Pressure Crystallography ndash From Fundamental Phenomena to Technological Applications Boldyreva E amp Dera P pp 559-572 Springer ISBN 978-904-8192-60-1 New York USA
Funnel NP Dawson A Francis D Lennie DR Marshall WG Moggach SA Warren JE amp Parsons S (2010) The effect of pressure on the crystal structure of l-alanine CrystEngComm Vol 12 No 9 (September 2010) pp 2573-2583 ISSN 1466-8033
Goryainov SV Kolesnik EN amp Boldyreva EV (2005) A reversible pressure-induced phase transition in -glycine at 076 GPa Physica B Condensed Matter Vol 357 No 3-4 (March 2005) pp 340-347 ISSN 0921-4526
Goryainov SV Kolesnik EN amp Boldyreva EV (2006) Raman observation of a new (ζ) polymorph of glycine Chemical Physics Letters Vol 419 No 4-6 (February 2006) pp 496-500 ISSN 0009-2614
Harding MM amp Howieson RM (1976) L-Leucine Acta Crystallographica Section B Vol 32 No 2 (February 1976) pp 633-634 ISSN 1600-5740
Herlinger AW amp Long TV (1970) Laser Raman and infrared spectra of amino acids and their metal complexes 3 Proline and bisprolinato complexes Journal of the American Chemical Society Vol 92 No 22 (November 1970) pp 6481-6486 ISSN 0002-7863
Hermiacutenio da Silva J Lemos V Freire PTC Melo FEA Mendes Filho J Lima Jr JA amp Pizani PS (2009) Stability of the crystal structure of L-valine under high pressure Physica Status Solidi B Vol 246 No 3 (March 2009) pp 553-557 ISSN 0370-1972
Lima JA Freire PTC Melo FEA Lemos V Mendes Filho J amp Pizani PS (2008) High pressure Raman spectra of L-methionine Crystal Journal of Raman Spectroscopy Vol 39 No 10 (October 2008) pp 1356-1363 ISSN 1097-4555
Migliori A Maxton PM Clogston AM Zirngiebl E amp Lowe M (1988) Anomalous temperature dependence in the Raman spectra of l-alanine Evidence for dynamic localization Physical Review B Vol 38 No 18 (December 1988) pp 13464-13467 ISSN 1098-0121
Minkov VS Krylov AS Boldyreva EV Goryainov SN Bizyaev SN amp Vtyurin AN (2008) Pressure-Induced Phase Transitions in Crystalline L- and DL-Cysteine The Journal of Physical Chemistry B Vol 112 No 30 (July 2008) pp 8851-8854 ISSN 1520-6106
Minkov VS Goryainov SV Boldyreva EV amp Goumlrbitz CH (2010) Raman study of pressure-induced phase transitions in the crystals of orthorhombic and monoclinic polymorphs of L-cysteine dynamics of the side-chain Journal of Raman Spectroscopy Vol 41 No 12 (December 2010) pp 1458-1468 ISSN 1097-4555
Moggach SA Allan DR Morrison PA Parsons S amp Sawyer L (2005) Effect of pressure on the crystal structure of L-serine-I and the crystal structure of L-serine-II
wwwintechopencom
Vibrational Spectroscopy
58
at 54 GPa Acta Crystallographica Section B Vol 61 No 1 (February 2005) pp 58-68 ISSN 0108-7681
Moggach SA Marshall WG amp Parsons S (2006) High-pressure neutron diffraction study of L-serine-I and L-serine-II and the structure of L-serine-III at 81 GPa Acta Crystallographica Section B Vol 62 No 5 (October 2006) pp 815-825 ISSN 0108-7681
Moreno AJD Freire PTC Melo FEA Arauacutejo-Silva MA Guedes I Mendes Filho J (1997) Pressure-induced phase transitions in monohydrated l-asparagine aminoacid crystals Solid State Communications Vol 103 No 12 (September 1997) pp 655-658 ISSN 0038-1098
Murli C Sharma SK Karmakar S amp Sikka SK (2003) -Glycine under high pressures a Raman scattering study Physica B Condensed Matter Vol 339 No 1 (November 2003) pp 23-30 ISSN 0921-4526
Murli C Vasanthi R amp Sharma SM (2006) Raman spectroscopic investigations of DL-serine and DL-valine under pressure Chemical Physics Vol 331 No 1 (December 2006) pp 77-84 ISSN 0301-0104
Olsen JS Gerward L Freire PTC Mendes Filho J Melo FEA amp Souza Filho AG (2008) Pressure-induced phase transitions in L-alanine crystals Journal of Physics and Chemistry of Solids Vol 69 No 7 (July 2008) pp 1641-1645 ISSN 0022-3697
Sabino AS De Sousa GP Luz-Lima C Freire PTC Melo FEA amp Mendes Filho J (2009) High-pressure Raman spectra of L-isoleucine crystals Solid State Communications Vol 149 No 37-38 (October 2009) pp 1553-1556 ISSN 0038-1098
Sasaki JM Freire PTC Moreno AJD Melo FEA Guedes I Mendes Filho J Shu J Hu J amp Matildeo HK (2000) Single crystal X-ray diffraction in monohydrate L-asparagine under hydrostatic pressure Science and Technology of High Pressure Proceedings of AIRAPT-17 Hyderabad India 2000
Seijas LE Delgado GE Mora AJ Fitch AN amp Brunelli M (2010) On the Crystal structures and hydrogen bond patterns in proline pseudopolymorphs Powder Diffraction Vol 25 No 3 (September 2010) pp 235-240 ISSN 0885-7156
Silva BL Freire PTC Melo FEA Mendes Filho J Pimenta MA amp Dantas MSS (2000) High-pressure Raman spectra of L-threonine crystal Journal of Raman Spectroscopy Vol 31 No 6 (June 2000) pp 519-522 ISSN 1097-4555
Teixeira AMR Freire PTC Moreno AJD Sasaki JM Ayala AP Mendes Filho J amp Melo FEA (2000) High-pressure Raman study of l-alanine crystal Solid State Communications Vol 116 No 7 (October 2000) pp 405-409 ISSN 0038-1098
Tumanov NA Boldyreva EV Kolesov BA Kurnosov AV amp Quesada Cabrera R (2010) Pressure-induced phase transitions in L-alanine revisited Acta Crystallographica Section B Vol 66 No 4 (August 2010) pp 458-371 ISSN 1600-5740
Yamashita M Inomata S Ishikawa K Kashiwagi T Matsuo H Sawamura S amp Kato M (2007) A high-pressure polymorph of L--leucine Acta Crystallographica Section E Vol 63 No 5 (May 2007) pp o2762-o2764 ISSN 1600-5368
wwwintechopencom
Vibrational SpectroscopyEdited by Prof Dominique De Caro
ISBN 978-953-51-0107-9Hard cover 168 pagesPublisher InTechPublished online 24 February 2012Published in print edition February 2012
InTech EuropeUniversity Campus STeP Ri Slavka Krautzeka 83A 51000 Rijeka Croatia Phone +385 (51) 770 447 Fax +385 (51) 686 166wwwintechopencom
InTech ChinaUnit 405 Office Block Hotel Equatorial Shanghai No65 Yan An Road (West) Shanghai 200040 China
Phone +86-21-62489820 Fax +86-21-62489821
The infrared and Raman spectroscopy have applications in numerous fields namely chemistry physicsastronomy biology medicine geology mineralogy etc This book provides some examples of the use ofvibrational spectroscopy in supramolecular chemistry inorganic chemistry solid state physics but also in thefields of molecule-based materials or organic-inorganic interfaces
How to referenceIn order to correctly reference this scholarly work feel free to copy and paste the following
Paulo de Tarso Cavalcante Freire Joseacute Alves Lima Juacutenior Bruno Tavares de Oliveira Abagaro Gardecircnia deSousa Pinheiro Joseacute de Arimateacutea Freitas e Silva Josueacute Mendes Filho and Francisco Erivan de Abreu Melo(2012) High Pressure Raman Spectra of Amino Acid Crystals Vibrational Spectroscopy Prof Dominique DeCaro (Ed) ISBN 978-953-51-0107-9 InTech Available from httpwwwintechopencombooksvibrational-spectroscopyhigh-pressure-raman-spectra-of-amino-acid-crystals
copy 2012 The Author(s) Licensee IntechOpen This is an open access articledistributed under the terms of the Creative Commons Attribution 30License which permits unrestricted use distribution and reproduction inany medium provided the original work is properly cited
Vibrational Spectroscopy
40
Two sulfur amino acids were investigated under high pressure conditions L-methionine (Lima et al 2008) and L-cysteine (Minkov et al 2008 2010 Moggach et al 2006 Murli et al 2006) L-methionine (C5H11NO2S) crystallizes in a monoclinic structure and under compression undergoes a phase transition at about 22 GPa This modification is realized by the observation of the appearance of a very strong peak between the bands associated to stretching of SC (SC) and wagging vibration of CO2- (CO2-) At P = 27 GPa the intensity of the bands (SC) and (CO2-) goes to zero Additionally two new structures are observed around 540 cm-1 in the region where it is expect to be observed the band associated to the rocking of CO2- r(CO2-) Such a picture was interpreted as a phase transition undergone by L-methionine crystal with a hysteresis of about 08 GPa On the other hand L-cysteine can crystallize in two different polymorphs with orthorhombic and monoclinic symmetries (Minkov et al 2010) For the monoclinic polymorph of L-cysteine it was observed phase transitions at about 29 and 39 GPa with the changes in the Raman spectra suggesting that the hydrogen bond network is distorted and the S-HhellipO bonding dominates over S-HhellipS bonding at high pressures For the orthorhombic polymorph a series of different phase transition occurs but with no evidence that it transforms into the most dense monoclinic polymorph which is also stable at atmospheric pressure It is worth to note that the phase transitions in the orthorhombic L-cysteine involve changes in molecular conformation while the pressure-induced phase transitions in the monoclinic phase are mainly related to changes in the hydrogen bond network (Minkov et al 2010) L-threonine (C4H9NO3) (Silva et al 2000) was investigated up to 43 GPa through Raman spectroscopy From this study it was observed several modifications in the Raman spectrum including the region associated to the lattice mode vibrations mainly between 2 and 22 GPa Other modifications above 3 GPa were also observed but no X-ray diffraction experiment was performed up to now which would confirm the occurrence of eventual phase transition undergone by L-threonine crystal L-serine was also investigated under high pressure conditions (Boldyreva et al 2005b 2006a 2006b Moggach et al 2005 2006) From x-ray diffraction measurements (Moggach et al 2005) it was observed that at ~ 48 GPa the crystal undergoes a phase transition with changes in the hydrogen bond network while the low pressure phase is characterized by OHhellipOH hydrogen bond chains in the high pressure phase it is observed shorter OHhellipcarboxyl interactions Yet Ref (Moggach et al 2005) shows that the phase transition occurs with change in two torsion angles but with any major changes in the orientations of the molecules in the unit cell Study of Ref (Boldyreva et al 2006b) confirms the phase transition previously reported in Ref (Moggach et al 2005) although with a transition pressure value of ~ 53 GPa and points the existence of another phase transition at 78 GPa In this second phase transition new OHhellipO(CO) hydrogen bond and a new NHhellipOH bond are formed showing that OH-group becomes both a proton donor and a proton acceptor Finally finishing this picture of the state of the art of vibrational and structural aspects of amino acid crystals under high pressure we briefly discuss results on L-asparagine monohydrate which was investigated both by Raman spectroscopy (Moreno et al 1997) and by X-ray diffraction experiments (Sasaki et al 2000) Both studies point to the occurrence of three different phase transitions between 00 and 13 GPa which constitute up to now the most unstable amino acid crystal structure In all these investigations the occurrence of phase transitions involving change in the dimension of the several HB in the unit cell seems to be the role An extension of studies of
wwwintechopencom
High Pressure Raman Spectra of Amino Acid Crystals
41
amino acid crystals under high pressure conditions investigated by Raman spectroscopy for L-histidineHClH2O and L-proline monohydrate is given here
3 Experimental
The samples of HHM were grown from aqueous solution by the slow evaporation method at controlled temperature The samples of PM polycrystals were obtained from reagent grade (Sigma Aldrich) and used without further purification Raman experiments on HHM were performed in the backscattering geometry employing a Jobin Yvon Triplemate 64000 micro-Raman system equipped with a N2-cooled charge-coupled device (CCD) detection system while for Raman experiments on PM it was employed an HR 460 Jobin Yvon spectrometer The slits were set for a 2 cm-1 spectral resolution Raman spectra were excited with the 5145 nm line of an argon ion laser The high-pressure experiments at room temperature were performed on a small piece of sample compressed using a diamond anvil cell (model NBS mdash National Bureau of Standards) For the Raman experiments on PM it was used a membrane diamond anvil cell (MDAC) with a 400 m culet diameter diamonds as the pressure device A 150 m-diameter hole in a stainless-steel (200 m of initial thickness preindented to 40 m) was loaded with argon while a 200 m-diameter hole in a stainless-steel with a 230 m of initial thickness was loaded with mineral oil in the study of L-histidineHClH2O An Olympus microscope lens with a focal distance f = 205 mm and a numerical aperture 035 was used to focus the laser beam on the sample surface which was located in the pressure cell The pressure in the cell was monitored using the standard shifts of the Cr3+Al2O3 emission lines
4 Results
41 L-proline monohydrate In this sub-section we present investigation of polycrystalline PM under hydrostatic pressure up to 118 GPa It is important to state that the sample used in the experiment had a small quantity of anhydrous phase (about 8 according to the Rietveld refinement) in such a way that the structure can be considered as monoclinic L-proline monohydrate
Fig 1 Unit cell of PM seen along the b-axis
wwwintechopencom
Vibrational Spectroscopy
42
PM (see Figure 1) crystal is found in a monoclinic structure space group C2with a = 2043 Aring b = 619 Aring c = 514 Aring and = 9579deg and Z=4 (Seijas et al 2010) In such a material the hydrogen bonds play a special role in the stability of the crystal structure X-ray diffraction study shows that there are interactions between amino and carboxylate groups through the hydrogen bonds N1-H1hellipO1 N1-H1hellipO2 and N1-H2hellipO1 with H1 atom acting as a bifurcated donor taking part in two hydrogen bonds These hydrogen bonds link the proline molecules forming pairs of chains in opposite directions along the c axis The water molecules form zigzag chains of O-HhellipO hydrogen bonds also parallel to the c axis (Seijas et al 2010) Figure 2 presents the Raman spectra of polycrystalline PM crystal in the spectral range 10 ndash 250 cm-1 for pressures from 00 to 118 GPa The spectrum taken at 00 GPa shows a complex profile indicating the occurrence of several bands in fact fitting with Lorentzian curves
Fig 2 Raman spectra of PM under several pressure conditions from 00 to 118 GPa in the spectral range 50 ndash 250 cm-1
wwwintechopencom
High Pressure Raman Spectra of Amino Acid Crystals
43
points to the existence of six bands between 10 and 160 cm-1 When pressure is increased great changes are observed in the Raman profile of the spectrum At 11 GPa the Raman spectrum of L-proline is very different from that obtained at 00 GPa (i) the mode peaked at ~ 68 cm-1 becomes the most intense band in the spectrum at 11 GPa (ii) the most intense peak in the spectrum taken at 00 GPa decreases intensity and in the spectrum taken at 11 GPa it is only the second most intense peak in the region 10 ndash 250 cm-1 (iii) the peaks marked by arrows in the spectrum at 00 GPa increase intensity Such a set of modifications point to the possibility of the occurrence of a phase transition undergone by polycrystalline L-proline for pressures below 11 GPa Results on other spectral regions of the Raman spectrum will reinforce this hypothesis It is observed a gradual change of intensity of all bands appearing in the Raman spectra of Figure 2 as well as continuous blue shifts of all wavenumbers when pressure is increased from 111 to 65 GPa The gradual change of the profiles of the Raman spectrum can be interpreted as continuous changes of the conformation of the molecules of L-proline in the unit cell of the crystal However between 65 and 78 GPa it is observed a strong change in the profile of the Raman spectrum in the low wavenumber region In particular the most intense band observed in the spectrum taken at 65 GPa lost intensity becoming one of the peaks with lowest intensity Additionally jump in the wavenumber of almost all bands are also verified in this pressure interval (65 - 78 GPa) As a consequence we have interpreted the changes of the Raman spectrum as a phase transition undergone by polycrystalline L-proline between 65 and 78 GPa Other evidences will be shown in the next paragraphs Finally when we decrease pressure from the highest value obtained in our experiments down to atmospheric pressure we observe that the original spectrum ndash bottom spectrum in Figure 2 ndash is recovered (the final spectrum is marked as 00 GPa) Figure 3 presents the Raman spectra of PM crystal for several pressures in the spectral range 200 ndash 750 cm-1 According to Ref (Herlinger amp Long 1970) (see also Table 1) the band recorded close to 294 cm-1 in the 00 GPa spectrum can be associated to a deformation vibration of the skeleton of the structure (skel) The bands observed at 377 and 447 cm-1 are associated respectively to the bending of CCN (CCN) and rocking of CO2- r(CO2-) In fact for other amino acid crystals it has been reported that the r(CO2-) is the most intense band in the 200 ndash 700 cm-1 spectral range However for the other amino acids differently from L-proline the r(CO2-) mode is observed for wavenumber higher than 500 cm-1 (-glycine 503 cm-1 (Dawson et al 2005) L-alanine 532 cm-1 L-valine 542 cm-1 (Goryainov et al 2005) DL-alanine 543 cm-1 etc) Finally in the spectrum taken at 00 GPa we can observe a band at 574 cm-1 which was associated to a bending of CO2- group Finally bands at 641 669 and 695 cm-1 were associated respectively to wagging of CO2- w(CO2-) (skel) and scissoring of CO2- sc(CO2-) By increasing the pressure we observe that between 00 and 11 GPa some important modifications are present For example the band (CCN) decreases intensity and seems to split A clear splitting is observed for the band at 574 cm-1 and the r(CO2-) band at 447 cm-1 begins to present a shoulder in the high wavenumber side Additionally the (skel) band at 669 cm-1 (marked by an asterisk in the spectrum of 00 GPa) disappears between the two lowest pressure spectra This entire complex picture corroborates the fact that the crystal is undergoing a phase transition between 00 and 11 GPa If one continues to increase pressure on the PM crystal it is possible to observe that all bands suffer blue shifts up to 65 GPa also in general terms the linewidth increases for all bands However no great changes are observed indicating that the crystal structure
wwwintechopencom
Vibrational Spectroscopy
44
Fig 3 Raman spectra of PM under several pressure conditions from 00 to 118 GPa in the spectral range 250 ndash 750 cm-1
remains the same of that observed at 11 GPa In other words the crystal seems to be stable between 11 to 65 GPa But when pressure arrives to 78 GPa great modifications are observed in the 200 ndash 700 cm-1 spectral region Let us state these modifications (i) the appearance of a band (marked by an arrow in the spectrum taken at 78 GPa) in the region ~ 450 cm-1 (ii) an impressive fall of intensity and a red shift of the band associated to r(CO2-) (iii) a red shift of the two bands in the region 550 ndash 600 cm-1 (iv) the appearance of low intense bands (marked by an asterisk in the spectrum taken at 78 GPa) for wavenumbers higher than 600 cm-1 (v) the increase of intensity of the band initially assigned as scissoring of CO2- (vi) the appearance of a band at ~ 725 cm-1 Again the modifications in the spectra between 65 and 78 GPa presented in Figure 3 corroborate the fact that PM crystal undergoes a second phase transition as discussed previously When pressure is released down to 00 GPa whose spectrum is marked by 00 GPa we observe that the starting atmospheric spectrum is recovered as already observed in Figure 2 Figure 4 presents the Raman spectra of PM crystal under high pressure conditions with argon as compression medium in the region 600 to 1250 cm-1 We have cut off the peaks in the region close to 900 cm-1 because there is a peak with high intensity that makes difficult the visualization of the bands close to it this region will be discussed in Figure 5 In the Figure 4 we observe that several peaks are well defined (the peak marked by an asterisk is due a lamp used to calibrate the spectra) It is important to state that in the spectrum at 00
wwwintechopencom
High Pressure Raman Spectra of Amino Acid Crystals
45
Wavenumber (cm-1) Assignment Wavenumber (cm-1) Assignment
68 Lattice mode 950 (CCN)+(CC)
81 Lattice mode 982 v(CCN)+(CC)
99 Lattice mode 991 (CCN)+(CC)
120 Lattice mode 1031 (CCN)+(CC)
134 Lattice mode 1055 w(CH2)
149 Lattice mode 1079 w(CH2)
203 - 1084 r(CH2)
294 (skel) 1161 t(CH2)
373 (CCN) 1172 t(CH2)
447 r(CO2-) 2876 (CH)
574 (CO2-) 2898 (CH)
641 w(CO2-) 2932 (CH)
669 (skel) 2949 (CH)
695 sc(CO2-) 2971 (CH)
791 (skel) 2983 (CH)
840 r(CH2) 3006 (CH)
863 r(CH2) 3011 (CH)
897 r(NH2+) 3041 (NH)
918 (CCN)+(CC) 3068 (NH)
Table 1 Wavenumber (in cm-1) and approximate assignments of Raman bands for L-proline monohydrate crystal where def deformation bending r rocking w wagging sc scissoring stretching t twisting
GPa there are two peaks between 975 and 1000 cm-1 and in the spectrum taken at 11 GPa only one band is observed Another aspect that worth note is the fact that the band of highest energy (~ 1172 cm-1 at 00 GPa twisting of CH2 t(CH2)) splits in the spectrum taken at 11 GPa Above this last pressure the intensity of the peaks remains approximately constant up to 65 GPa Between 65 and 78 GPa the Raman spectrum presents great changes The band associated to the rocking of CH2 r(CH2) observed initially at ~ 840 cm-1 presents both a jump to high wavenumbers and an increasing in its linewidth A splitting is observed for the band marked by an star in the spectrum recorded at 65 GPa and observed initially at ~ 950 cm-1 which is associated to the stretching of CCN and CC units (CCN) + (CC) If one observe the band at 1033 cm-1 which is associated to the wagging of CH2 w(CH2) interestingly between 65 and 78 GPa it changes intensity with the band marked by a down arrow in the spectrum taken at 65 GPa so the w(CH2) band lost intensity and the band marked by a down arrow increases intensity Similarly the low intense bands observed between 1080 and 1200 cm-1 present great changes in their intensities between 65 and 78 GPa All these changes corroborate the modification in the crystal structure which occurs above 65 GPa which are reversible when pressure is released down to 00 GPa
wwwintechopencom
Vibrational Spectroscopy
46
Fig 4 Raman spectra of PM under several pressure conditions from 00 to 118 GPa in the spectral range 600 ndash 1250 cm-1
Figure 5 shows the Raman spectra of PM crystal in the 800 ndash 1100 cm-1 spectral region The dominant band in the spectrum taken at 00 GPa observed at 897 cm-1 is associated to the rocking vibration of NH2+ r(NH2+) The changes occurring in the first phase transition are not impressive but we note that between 65 and 78 GPa the band lost intensity and splits into two bands Above 78 GPa blue shifts of the wavenumbers are verified but no great change is present up to the highest pressure arrived in the experiment Decreasing pressure down to 00 GPa again we observe that the original spectrum is also recovered in this region In the spectral region presented in Figure 6 it is expected to be observed bands associated to the stretching vibrations of CH and CH2 units A theoretical study performed on L-methionine showed that different profiles of the Raman spectrum in this wavenumber range are associated with different conformations of the molecule In this sense when we observe the Raman spectra of PM as a function of pressure we note that between 00 and 11 GPa the most intense band at 00 GPa split into three bands (marked by up arrows) In the spectrum taken at 17 GPa the separation is very clear and when pressure is further increased the bands become clearly distinct But between 65 and 78 GPa the spectrum changes abruptly indicating that between these two pressure values the proline molecules undergo a great conformational change Because we have observed additionally changes in the low wavenumber region we can understand that both conformational change and structural phase transition take place for PM crystal As observed in the other spectral regions the original spectrum at 00 GPa is recovered when pressure is released
wwwintechopencom
High Pressure Raman Spectra of Amino Acid Crystals
47
Fig 5 Raman spectra of PM under several pressure conditions from 00 to 118 GPa in the spectral range 800 ndash 1100 cm-1
Data can give us some insights related to the behaviour of molecules of proline as the crystal is compressed For example in a previous study on -glycine the softening of a bending of CO2- was associated to a decrease in the intra-layer hydrogen bond strength while the stiffening of the same vibration was associated to an increase in the bond strength (Dawson et al 2005) For PM we have observed that the band associated to both bending of CO2- (CO2-) and rocking of CO2- r(CO2-) increase wavenumbers from 11 to 65 GPa and between 65 and 78 GPa decrease wavenumber for (CO2-) the decreasing is represented by the two dashed lines in Figure 3 between the spectra of 65 and 78 GPa We have also observed an additional increasing of wavenumbers for pressures higher than 78 GPa This suggests that the intra-layer hydrogen bond strength is stiffened up to 65 GPa between 65 and 78 GPa the hydrogen bond strength is softened and above 80 GPa the hydrogen bond is stiffened Additionally our results suggest that between 65 and 78 GPa occurs a structural rearrangement in such a way that the behaviour of the hydrogen bond strengths is changed This rearrangement is enough to change the symmetry of the crystal because
wwwintechopencom
Vibrational Spectroscopy
48
Fig 6 Raman spectra of PM under several pressure conditions from 00 to 118 GPa in the spectral range 2850 ndash 3200 cm-1
associated to it we observe great modifications in the Raman spectrum of low wavenumber region (Figure 2) Yet related to the phase transition between 65 and 78 GPa it is impressive the increase of intensity of a band in the spectrum taken at 65 GPa (marked by an arrow see Figure 4) which can be assigned as wagging of CH2 w(CH2) it change of intensity with the band close to it at ~ 1055 cm-1 at 00 GPa which is also assigned as w(CH2) indicating that a conformational change in the ring may also occurs when the crystal undergoes the phase transition at 65 - 78 GPa It is also interesting to note that the first transition occurs from a monoclinic to a phase with lower symmetry (another monoclinic our a triclinic phase) because in several regions including both internal and lattice mode spectral regions the number of peaks in the spectrum taken at 11 GPa is greater than the number of Raman peaks in the spectrum taken at 00 GPa It is also worth note that above 78 GPa almost all bands increases linewidth indicating that some disorder is introduced in the high pressure phase However the disorder does not occur in a high degree because when pressure is released down to 00 GPa the original spectrum is recovered It is known that the amorphization process is preceded by some disorder in the crystal structure however due to recovered of the original Raman spectrum after releasing pressure we can infer that when we arrive to 1118 GPa we are far away from the pressure point where eventually the PM crystal should present amorphization
wwwintechopencom
High Pressure Raman Spectra of Amino Acid Crystals
49
42 L-histidine hydrochloride monohydrate Related to the HHM (see Figure 8) which crystallizes in an orthorhombic structure belonging to the P212121 (D24) space group with four molecules of C6H9N3O2HClH2O per unit cell we were able to arrive up to 75 GPa and discovery a new polymorph of the material above 31 GPa The strong bond between N-H of the imidazole ring and the carboxyl group of a neighboring molecule is the fundamental intermolecular link resulting in a spiral arrangement along the c-axis (Donohue amp Caron 1964) The coupling of the four zwitterions in the unit cell leads to 297 optical normal modes decomposed into irreducible representations of the factor group D2 as Γop = 75 A + 74 (B1 + B2 + B3) and the acoustic modes can be expressed as Γac = B1 + B2 + B3 Under high pressure conditions modifications the Raman spectra are interpreted in terms of both conformational changes of the molecules in the unit cell and in terms of a phase transition Figure 9(a) presents the Raman spectra of HHM for several pressures in the spectral range from 50 to 660 cm-1 The region for wavenumbers lower than 200 cm-1 as previously stated is characteristic of the lattice vibration modes Increasing pressure we observe that the bands present blue shifts of their wavenumbers However between 27 and 31 GPa it is possible to note that a great change occurs in the Raman spectrum the peak marked by a square which is associated to torsion of CO2- (τ(CO2-)) splits in two new peaks which are marked by up arrows in the spectrum at 31 GPa In Figure 9(b) which presents the plot of experimental wavenumber as function of pressure we clearly observe the splitting of the band close to 180 cm-1 Additionally we note that for other bands discontinuities of wavenumbers are observed between 27 to 31 GPa (De Sousa et al 2011)
Fig 8 Unit cell of HHM seen along the b-axis
In this region it is also possible to observe many internal vibrations of the histidine molecule such as skeletal structure at 442 and 490 cm-1 torsion of NH3+ which is observed at 385 cm-1 and rocking of CO2- at 530 cm-1 Again as occurs with the spectra shown in the lattice mode region modifications are observed in the spectral range 27 - 31 GPa Among these changes we observed the disappearance of the bands at 276 and 500 cm-1 and the
wwwintechopencom
Vibrational Spectroscopy
50
Fig 9 (a) Raman spectra of HHM under several pressure conditions from 04 to 75 GPa in the spectral range 50 ndash 650 cm-1 (b) wavenumber versus pressure of the bands of HHM appearing in Fig 9(a)
appearance of a band at 473 cm-1 in the spectrum taken at 31 GPa We additionally note that the intensity of the band associated to torsion of NH3+ decreases with increasing pressure indicating that there occurs a conformational change of histidine molecule Such a conformational change can be understood as consequence of the change of the intermolecular hydrogen bond length With increasing pressure the band initially at 385 cm-
1 which is associated with a torsion vibration of the NH3+ unit shifts linearly toward higher wavenumbers we can say that the pressure decreases the length of the hydrogen bonds increasing the wavenumber of the band associated to torsional vibration of NH3+ unit Figure 10(a) presents the Raman spectra of HHM in the 650 ndash 1250 cm-1 interval for several pressure values up to 75 GPa In this spectral region it is expected to observe vibrations assigned to the deformation of CO2- stretching of both C-C and C-N wagging of H2O and rocking of NH3+ The band observed at ~ 694 cm-1 is associated to a deformation vibration of CO2- (CO2) while the out-of-plane vibration of CO2- (CO2) is observed at ~ 822 cm-1 The band at 807 cm-1 is associated with a wagging vibration of the water molecule w(H2O) The bands recorded at 1191 and 1210 cm-1 can be assigned as the rocking of NH3+ unit r(NH3+) In this spectral region some changes are observed in the range 27 ndash 31 GPa (i) the disappearance of the band at 694 cm-1 (ii) the appearance of a new weak band at 717 cm-1
(marked by a star in the Figure 10(a)) (iii) the inversion of intensity of the two bands located at 807 and 822 cm-1 which are related to units directly involved in the hydrogen bonds and (iv) the inversion of intensity of the two bands associated to a rocking of NH3+ unit r(NH3+) located at 1191 and 1210 cm-1 The dependence of the wavenumber versus pressure plot for this spectral region is presented in Fig 10(b) we note that many of the observed Raman modes show a small discontinuous change in the slope in the pressure-induced variation of its wavenumber in range 27 ndash 31 GPa
wwwintechopencom
High Pressure Raman Spectra of Amino Acid Crystals
51
Figure 11(a) shows the Raman spectra of the HHM crystal in the spectral range 1700-1400 cm-1 for pressure from 00 to 75 GPa Fig 11(b) shows the respective wavenumber vs pressure plots In this region one expects to observe vibrations assigned to a deformations of the imidazole ring of the histidine molecule asymmetric stretching of the CO2- units stretching of C=O among others In the Figure 11(a) two modifications are observed in the range 27 ndash 31 GPa The first change is the decreasing of the relative intensity of the band originally at 1433 cm-1 and the second one is the appearance of a band at 1642 cm-1 In the wavenumber versus pressure plot presented in Figure 11(b) a subtle discontinuity occurs in the range 27 ndash 31 GPa with appreciably differences in slopes where two modes change from positive to negative slopes
Fig 10 (a) Raman spectra of HHM under several pressure conditions from 04 to 75 GPa in the spectral range 650 ndash 1250 cm-1 (b) wavenumber versus pressure of the bands of HHM appearing in Fig 10(a)
The Raman spectra of HHM crystal in the range 3450-3125 cm-1 are shown in the Figure 12(a) and in the Figure 12(b) the respective wavenumber versus pressure plots are given In this region we expected to observe stretching vibrations of several units of the amino acids and of the water molecule (CH NH3+ and OH-) It is important to note that for wavenumbers lower than 3000 cm-1 there are some modes related to the mineral oil used as compression media In detail the band at 3111 cm-1 can be associated to a stretching vibration of NH3+ unit (NH3+) while the bands observed at 3155 and 3163 cm-1 are associated to a CH stretching vibration of imidazole ring The bands observed at 3374 and 3408 cm-1 are related to the OH- stretching of the water molecules In the pressure range 27 ndash 31 GPa main changes are observed such as the disappearance of the bands related to a OH- stretching vibration (initially located at 3367 and 3393 cm-1) the appearance of a band of weak intensity at 3424 cm-1 and discontinuities of the wavenumber curve of bands at 3155 and 3163 cm-1 which are associated with the CH stretching vibration
wwwintechopencom
Vibrational Spectroscopy
52
Fig 11 (a) Raman spectra of HHM under several pressure conditions from 04 to 75 GPa in the spectral range 1400 ndash 1670 cm-1 (b) wavenumber versus pressure of the bands of HHM appearing in Fig 11(a)
Fig 12 (a) Raman spectra of HHM under several pressure conditions from 04 to 75 GPa in the spectral range 2950 ndash 3450 cm-1 (b) wavenumber versus pressure of the bands of HHM appearing in Fig 12(a)
wwwintechopencom
High Pressure Raman Spectra of Amino Acid Crystals
53
Table 2 gives a quantitative analysis of the evolution of the Raman spectra of HHM crystal with pressure where fitting of all bands to a linear expression ω = ω0 + P is furnished In Table 2 the first column (ωobs) represents the wavenumber of the Raman bands observed at room pressure the second and third columns correspond to adjustment of data for pressure values between 0 and 27 GPa and the two last columns correspond to fitting of the high-pressure phase that observed between 31 and 75 GPa A resume of the modifications observed in all spectral regions of the Raman spectra of HHM is as follows (i) splitting of the band in the low-wavenumber lattice range (ii) change in the number of bands associated to internal modes (iii) wavenumber shifts with discontinuities (iv) changes in the relative intensities of the vibrational bands It is important to state that changes were observed for the deformation vibrations of the OH- of the water molecule as well as of the NH3+ and CO2- groups of the amino acid molecule This picture indicates large conformational changes of the molecules in the unit cell Related to HHM beyond the hydrogen bonds originated from the histidine molecule there are two hydrogen bonds from the water molecule It is interesting to note from Figure 12(b) that the wavenumber of OH- stretching (OH-) decreases with increasing pressure However the OH units participate of hydrogen bonds one to a carboxyl oxygen and another to the chloride ion This means that between 00 and 31 GPa the hydrogen bond strength increases and the wavenumber of(OH-) decreases in this pressure range Also after the phase transition the wavenumber of (OH-) suffers a jump and continues to decrease up to the highest pressure obtained in our experiments Such a picture indicates a further increase of the hydrogen bonds formed by the water molecules and confirms that these bonds are playing an important role in the mechanism of the transition It is interesting to note that similar changes in the low-wavenumber region were also observed for the same crystal when subjected to low temperatures
ωobs
(cm-1)
Phase 1
(0 le P le 27 GPa) Phase 2
(31 le P le 75 GPa)
ω0
(cm-1)
(cm-1)(GPa)-1 ω0
(cm-1)
(cm-1)(GPa)-1
94 945 0669 937 -0103
105 1052 0276 1002 1771
121 1214 -1087 1109 2092
136 1357 1616 1360 0623
149 1497 2128 - -
159 1568 8033 1483 8105
- - - 1639 9960
188 1891 7661 1902 8059
270 2697 3093 - -
293 2919 6118 2945 7683
385 3846 7236 4015 1675
442 4423 1223 4423 1461
wwwintechopencom
Vibrational Spectroscopy
54
ωobs
(cm-1)
Phase 1
(0 le P le 27 GPa) Phase 2
(31 le P le 75 GPa)
ω0
(cm-1)
(cm-1)(GPa)-1 ω0
(cm-1)
(cm-1)(GPa)-1
- - - 4707 0785
491 490 5 3319 - -
530 5304 4335 - -
609 6078 5312 6208 2463
693 6935 1529 - -
- - - 7064 3449
807 8067 2042 8047 1467
824 8240 -0498 8204 1442
838 8361 7335 8504 3124
875 8734 6438 8881 2777
917 9173 0810 9187 2356
963 9630 2757 9636 2411
980 9787 4489 9787 5206
1068 10667 4790 10732 3418
1141 11403 1890 11403 2744
1162 11619 2611 11674 1120
1190 11900 2277 11885 1637
1208 12079 2859 12101 1341
1434 14345 1316 14382 0846
1448 14481 3059 14554 1677
1463 14621 4415 14760 0778
1481 14813 4238 14970 -0619
1609 16093 2739 16166 -0374
- - - 16249 2736
3111 31110 0919 31045 2914
3154 31546 1287 31532 6564
3164 31626 5305 31593 7905
3375 33739 -2638 - -
3407 34081 -5745 - -
- - - 34371 -3169
Table 2 Wavenumber values of the bands appearing in the HHM spectrum at 00 GPa (ωobs) and adjustment data by linear fitting (P) for the two phases
wwwintechopencom
High Pressure Raman Spectra of Amino Acid Crystals
55
5 Conclusions
The results suggested that L-proline monohydrate undergoes two phase transitions one between 00 and 11 GPa and a second between 65 and 78 GPa In both transitions it was possible to observed changes in the spectrum profile discontinuities in the wavenumber versus pressure plots in the lattice region of the spectrum and the appearance of news bands By releasing the pressure after attaining a maximum of 118 GPa the atmospheric pressure spectrum was fully recovered showing that the pressure-induced transitions undergone by polycrystalline L-proline crystal are reversible In the first transition it was observed the splitting of bands associated to (CCN) (CO2-) and (CH) vibrations The band associated to (skel) has disappeared In the second one we have observed the red shift of r(CO2-) significant changes in the intensity of the bands associated to the sc(CO2-) and w(CH2) vibrations and the splits of (CCN) + (CC) and r(NH2+) that also has lost intensity These modifications were interpreted as conformational changes of molecules in the unit cell Because these changes involve moieties that participate in hydrogen bonds we suppose that these hydrogen bonds have also been modified Modifications of hydrogen bonds can trigger some molecular rearrangements that lead to structural phase transitions In our work this hypothesis was supported by the changes that were observed in the region of the lattice modes for both phase transitions Therefore the results suggested two structural phase transitions one between 00 and 11 GPa and another between 65 and 78 GPa accompanied by significant conformational changes of molecules in the L-proline monohydrated crystal The results also suggest that HHM crystal undergoes a phase transition between 27 and 31 GPa when it is submitted to high pressure conditions up to 75 GPa The main changes observed in the Raman spectra was the splitting of the band in the low-wavenumber lattice range change in the number of bands associated to internal modes and wavenumber shifts with discontinuities Having described the behavior of two amino acid crystals under pressure and looked back at the past fourteen years of research we can ask to ourselves what does the future hold Based on the studies performed we believe that the use of several techniques such as neutron and Raman scattering as well as thermal and infrared analyses can help us to give a complete picture about hydrogen bond and the behavior of amino acids under pressure Maybe the study of peptide under similar external conditions should be the next road to be walked
6 Acknowledgment
Authors acknowledge CAPES CNPq and FUNCAP for financial support
7 References
Barthes M Bordallo HN Deacutenoyer F Lorenzo J-E Zaccaro J Robert A amp Zontone F (2004) Micro-transitions or breathers in L-alanine The European Physical Journal B Vol 37 No 3 (February 2004) pp 375-382 ISSN 1434-6028
Boldyreva EV Drebushchak VA Drebushchak TN Paukov IE Kovalevskaya YA amp Shutova ES (2003a) Polymorphism of glycine Part I Journal of Thermal Analysis and Calorimetry Vol 73 No 2 (August 2003) pp 409-418 ISSN 1388-6150
wwwintechopencom
Vibrational Spectroscopy
56
Boldyreva EV Drebushchak VA Drebushchak TN Paukov IE Kovalevskaya YA amp Shutova ES (2003b) Polymorphism of glycine Part II Journal of Thermal Analysis and Calorimetry Vol 73 No 2 (August 2003) pp 419-428 ISSN 1388-6150
Boldyreva EV Ivashevskaya SN Sowa H Ahsbahs H amp Weber H-P (2004) Effect of High Pressure on Crystalline Glycine A New High-Pressure Polymorph Doklady Physical Chemistry Vol 396 No 1 (May 2004) pp 111-114 ISSN 0012-5016
Boldyreva EV Ivashevskaya SN Sowa H Ahsbahs H amp Weber H-P (2005a) Effect of hydrostatic pressure on the -polymorph of glycine 1 A polymorphic transition into a new -form Zeitschrift fuumlr Kristallographie Vol 220 No 1 ( January 2005) pp 50- 57 ISSN 0044-2968
Boldyreva EV Kolesnik EN Drebushchak TN Ahsbahs H Beukes JA amp Weber H-P (2005b) A comparative study of the anisotropy of a lattice strain induced in the crystals of L-serine by cooling down to 100 K or by increasing pressure up to 44 GPa Zeitschrift fuumlr Kristallographie Vol 220 No 1 (January 2005) pp 58- 65 ISSN 0044-2968
Boldyreva EV Kolesnik EN Drebushchak TN Ahsbahs H amp Seryotkin YV (2006a) A comparative study of the anisotropy of a lattice strain induced in the crystals of DL-serine by cooling down to 100 K or by increasing pressure up to 86 GPa A comparison with L-serine Zeitschrift fuumlr Kristallographie Vol 221 No 2 (2006) pp 150- 161 ISSN 0044-2968
Boldyreva EV Sowa H Seryotkin YV Drebushchak TN Ahsbahs H Chernyshev V amp Dmitriev V (2006b) Pressure-induced phase transitions in crystalline L-serine studied by single crystal and gigh-resolution powder X-ray diffraction Chemical Physics Letters Vol 429 No 4-6 (October 2006) pp 474-478 ISSN 0009-2614
Boldyreva E (2007a) Cristalline Amino Acids A Link between Chemistry Materials Science and Biology In Models Mysteries and Magic of Molecules Boeyens JCA amp Ogilvie JF pp 167-192 Springer ISBN 978-1-4020-5940-7 Netherlands
Boldyreva E (2007b) High-Pressure Polymorphs of Molecular Solids When Are They Formed and When Are They Not Some Examples of the Role of Kinetic Control Crystal Growth amp Design Vol 7 No 9 (August 2007) pp 1662-1668 ISSN 1528-7483
Dawson A Allan DR Belmonte SA Clark SJ David WIF McGregor PA Parsons S Pulham CR amp Sawyer L (2005) Effect of high pressure on the crystal structures of polymorphs of glycine Crystal Growth amp Design Vol 5 No 4 (May 2005) pp 1415-1427 ISSN 1528-7483
Destro R Marsh RE amp Bianchi R (1988) A low-temperature (23K) study of L-alanine The Journal of Physical Chemistry Vol 92 No 4 (February 1988) pp 966-973 ISSN 0022-3654
De Sousa GP Freire PTC Lima Jr JA Mendes Filho J amp Melo FEA (2011) High-pressure Raman spectra of L-histidine hydrochloride monohydrate cristal Vibrational Spectroscopy Vol 57 No 1 (September 2011) pp 102-107 ISSN 0924-2031
Donohue J amp Caron A (1964) Refinement of cristal structure of histidine hydrochloride monohydrate Acta Crystallographica Vol 17 No 9 (September 1964) pp 1178-amp ISSN 0108-7673
wwwintechopencom
High Pressure Raman Spectra of Amino Acid Crystals
57
Faccedilanha Filho PF Freire PTC Lima KCV Mendes Filho J Melo FEA amp Pizani PS (2008) High temperature Raman spectra of L-leucine crystals Brazilian Journal of Physics Vol 38 No 1 (March 2008) pp 131-137 ISSN 0103-9733
Faccedilanha Filho PF Freire PTC Melo FEA Lemos V Mendes Filho J Pizani PS amp Rossatto DZ (2009) Pressure-induced phase transitions in L-leucine crystal Journal of Raman Spectroscopy Vol 40 No 1 (January 2009) pp 46-51 ISSN 1097-4555
Freire PTC (2010) Pressure-Induced Phase Transitions in Crystalline Amino Acids In High Pressure Crystallography ndash From Fundamental Phenomena to Technological Applications Boldyreva E amp Dera P pp 559-572 Springer ISBN 978-904-8192-60-1 New York USA
Funnel NP Dawson A Francis D Lennie DR Marshall WG Moggach SA Warren JE amp Parsons S (2010) The effect of pressure on the crystal structure of l-alanine CrystEngComm Vol 12 No 9 (September 2010) pp 2573-2583 ISSN 1466-8033
Goryainov SV Kolesnik EN amp Boldyreva EV (2005) A reversible pressure-induced phase transition in -glycine at 076 GPa Physica B Condensed Matter Vol 357 No 3-4 (March 2005) pp 340-347 ISSN 0921-4526
Goryainov SV Kolesnik EN amp Boldyreva EV (2006) Raman observation of a new (ζ) polymorph of glycine Chemical Physics Letters Vol 419 No 4-6 (February 2006) pp 496-500 ISSN 0009-2614
Harding MM amp Howieson RM (1976) L-Leucine Acta Crystallographica Section B Vol 32 No 2 (February 1976) pp 633-634 ISSN 1600-5740
Herlinger AW amp Long TV (1970) Laser Raman and infrared spectra of amino acids and their metal complexes 3 Proline and bisprolinato complexes Journal of the American Chemical Society Vol 92 No 22 (November 1970) pp 6481-6486 ISSN 0002-7863
Hermiacutenio da Silva J Lemos V Freire PTC Melo FEA Mendes Filho J Lima Jr JA amp Pizani PS (2009) Stability of the crystal structure of L-valine under high pressure Physica Status Solidi B Vol 246 No 3 (March 2009) pp 553-557 ISSN 0370-1972
Lima JA Freire PTC Melo FEA Lemos V Mendes Filho J amp Pizani PS (2008) High pressure Raman spectra of L-methionine Crystal Journal of Raman Spectroscopy Vol 39 No 10 (October 2008) pp 1356-1363 ISSN 1097-4555
Migliori A Maxton PM Clogston AM Zirngiebl E amp Lowe M (1988) Anomalous temperature dependence in the Raman spectra of l-alanine Evidence for dynamic localization Physical Review B Vol 38 No 18 (December 1988) pp 13464-13467 ISSN 1098-0121
Minkov VS Krylov AS Boldyreva EV Goryainov SN Bizyaev SN amp Vtyurin AN (2008) Pressure-Induced Phase Transitions in Crystalline L- and DL-Cysteine The Journal of Physical Chemistry B Vol 112 No 30 (July 2008) pp 8851-8854 ISSN 1520-6106
Minkov VS Goryainov SV Boldyreva EV amp Goumlrbitz CH (2010) Raman study of pressure-induced phase transitions in the crystals of orthorhombic and monoclinic polymorphs of L-cysteine dynamics of the side-chain Journal of Raman Spectroscopy Vol 41 No 12 (December 2010) pp 1458-1468 ISSN 1097-4555
Moggach SA Allan DR Morrison PA Parsons S amp Sawyer L (2005) Effect of pressure on the crystal structure of L-serine-I and the crystal structure of L-serine-II
wwwintechopencom
Vibrational Spectroscopy
58
at 54 GPa Acta Crystallographica Section B Vol 61 No 1 (February 2005) pp 58-68 ISSN 0108-7681
Moggach SA Marshall WG amp Parsons S (2006) High-pressure neutron diffraction study of L-serine-I and L-serine-II and the structure of L-serine-III at 81 GPa Acta Crystallographica Section B Vol 62 No 5 (October 2006) pp 815-825 ISSN 0108-7681
Moreno AJD Freire PTC Melo FEA Arauacutejo-Silva MA Guedes I Mendes Filho J (1997) Pressure-induced phase transitions in monohydrated l-asparagine aminoacid crystals Solid State Communications Vol 103 No 12 (September 1997) pp 655-658 ISSN 0038-1098
Murli C Sharma SK Karmakar S amp Sikka SK (2003) -Glycine under high pressures a Raman scattering study Physica B Condensed Matter Vol 339 No 1 (November 2003) pp 23-30 ISSN 0921-4526
Murli C Vasanthi R amp Sharma SM (2006) Raman spectroscopic investigations of DL-serine and DL-valine under pressure Chemical Physics Vol 331 No 1 (December 2006) pp 77-84 ISSN 0301-0104
Olsen JS Gerward L Freire PTC Mendes Filho J Melo FEA amp Souza Filho AG (2008) Pressure-induced phase transitions in L-alanine crystals Journal of Physics and Chemistry of Solids Vol 69 No 7 (July 2008) pp 1641-1645 ISSN 0022-3697
Sabino AS De Sousa GP Luz-Lima C Freire PTC Melo FEA amp Mendes Filho J (2009) High-pressure Raman spectra of L-isoleucine crystals Solid State Communications Vol 149 No 37-38 (October 2009) pp 1553-1556 ISSN 0038-1098
Sasaki JM Freire PTC Moreno AJD Melo FEA Guedes I Mendes Filho J Shu J Hu J amp Matildeo HK (2000) Single crystal X-ray diffraction in monohydrate L-asparagine under hydrostatic pressure Science and Technology of High Pressure Proceedings of AIRAPT-17 Hyderabad India 2000
Seijas LE Delgado GE Mora AJ Fitch AN amp Brunelli M (2010) On the Crystal structures and hydrogen bond patterns in proline pseudopolymorphs Powder Diffraction Vol 25 No 3 (September 2010) pp 235-240 ISSN 0885-7156
Silva BL Freire PTC Melo FEA Mendes Filho J Pimenta MA amp Dantas MSS (2000) High-pressure Raman spectra of L-threonine crystal Journal of Raman Spectroscopy Vol 31 No 6 (June 2000) pp 519-522 ISSN 1097-4555
Teixeira AMR Freire PTC Moreno AJD Sasaki JM Ayala AP Mendes Filho J amp Melo FEA (2000) High-pressure Raman study of l-alanine crystal Solid State Communications Vol 116 No 7 (October 2000) pp 405-409 ISSN 0038-1098
Tumanov NA Boldyreva EV Kolesov BA Kurnosov AV amp Quesada Cabrera R (2010) Pressure-induced phase transitions in L-alanine revisited Acta Crystallographica Section B Vol 66 No 4 (August 2010) pp 458-371 ISSN 1600-5740
Yamashita M Inomata S Ishikawa K Kashiwagi T Matsuo H Sawamura S amp Kato M (2007) A high-pressure polymorph of L--leucine Acta Crystallographica Section E Vol 63 No 5 (May 2007) pp o2762-o2764 ISSN 1600-5368
wwwintechopencom
Vibrational SpectroscopyEdited by Prof Dominique De Caro
ISBN 978-953-51-0107-9Hard cover 168 pagesPublisher InTechPublished online 24 February 2012Published in print edition February 2012
InTech EuropeUniversity Campus STeP Ri Slavka Krautzeka 83A 51000 Rijeka Croatia Phone +385 (51) 770 447 Fax +385 (51) 686 166wwwintechopencom
InTech ChinaUnit 405 Office Block Hotel Equatorial Shanghai No65 Yan An Road (West) Shanghai 200040 China
Phone +86-21-62489820 Fax +86-21-62489821
The infrared and Raman spectroscopy have applications in numerous fields namely chemistry physicsastronomy biology medicine geology mineralogy etc This book provides some examples of the use ofvibrational spectroscopy in supramolecular chemistry inorganic chemistry solid state physics but also in thefields of molecule-based materials or organic-inorganic interfaces
How to referenceIn order to correctly reference this scholarly work feel free to copy and paste the following
Paulo de Tarso Cavalcante Freire Joseacute Alves Lima Juacutenior Bruno Tavares de Oliveira Abagaro Gardecircnia deSousa Pinheiro Joseacute de Arimateacutea Freitas e Silva Josueacute Mendes Filho and Francisco Erivan de Abreu Melo(2012) High Pressure Raman Spectra of Amino Acid Crystals Vibrational Spectroscopy Prof Dominique DeCaro (Ed) ISBN 978-953-51-0107-9 InTech Available from httpwwwintechopencombooksvibrational-spectroscopyhigh-pressure-raman-spectra-of-amino-acid-crystals
copy 2012 The Author(s) Licensee IntechOpen This is an open access articledistributed under the terms of the Creative Commons Attribution 30License which permits unrestricted use distribution and reproduction inany medium provided the original work is properly cited

High Pressure Raman Spectra of Amino Acid Crystals
41
amino acid crystals under high pressure conditions investigated by Raman spectroscopy for L-histidineHClH2O and L-proline monohydrate is given here
3 Experimental
The samples of HHM were grown from aqueous solution by the slow evaporation method at controlled temperature The samples of PM polycrystals were obtained from reagent grade (Sigma Aldrich) and used without further purification Raman experiments on HHM were performed in the backscattering geometry employing a Jobin Yvon Triplemate 64000 micro-Raman system equipped with a N2-cooled charge-coupled device (CCD) detection system while for Raman experiments on PM it was employed an HR 460 Jobin Yvon spectrometer The slits were set for a 2 cm-1 spectral resolution Raman spectra were excited with the 5145 nm line of an argon ion laser The high-pressure experiments at room temperature were performed on a small piece of sample compressed using a diamond anvil cell (model NBS mdash National Bureau of Standards) For the Raman experiments on PM it was used a membrane diamond anvil cell (MDAC) with a 400 m culet diameter diamonds as the pressure device A 150 m-diameter hole in a stainless-steel (200 m of initial thickness preindented to 40 m) was loaded with argon while a 200 m-diameter hole in a stainless-steel with a 230 m of initial thickness was loaded with mineral oil in the study of L-histidineHClH2O An Olympus microscope lens with a focal distance f = 205 mm and a numerical aperture 035 was used to focus the laser beam on the sample surface which was located in the pressure cell The pressure in the cell was monitored using the standard shifts of the Cr3+Al2O3 emission lines
4 Results
41 L-proline monohydrate In this sub-section we present investigation of polycrystalline PM under hydrostatic pressure up to 118 GPa It is important to state that the sample used in the experiment had a small quantity of anhydrous phase (about 8 according to the Rietveld refinement) in such a way that the structure can be considered as monoclinic L-proline monohydrate
Fig 1 Unit cell of PM seen along the b-axis
wwwintechopencom
Vibrational Spectroscopy
42
PM (see Figure 1) crystal is found in a monoclinic structure space group C2with a = 2043 Aring b = 619 Aring c = 514 Aring and = 9579deg and Z=4 (Seijas et al 2010) In such a material the hydrogen bonds play a special role in the stability of the crystal structure X-ray diffraction study shows that there are interactions between amino and carboxylate groups through the hydrogen bonds N1-H1hellipO1 N1-H1hellipO2 and N1-H2hellipO1 with H1 atom acting as a bifurcated donor taking part in two hydrogen bonds These hydrogen bonds link the proline molecules forming pairs of chains in opposite directions along the c axis The water molecules form zigzag chains of O-HhellipO hydrogen bonds also parallel to the c axis (Seijas et al 2010) Figure 2 presents the Raman spectra of polycrystalline PM crystal in the spectral range 10 ndash 250 cm-1 for pressures from 00 to 118 GPa The spectrum taken at 00 GPa shows a complex profile indicating the occurrence of several bands in fact fitting with Lorentzian curves
Fig 2 Raman spectra of PM under several pressure conditions from 00 to 118 GPa in the spectral range 50 ndash 250 cm-1
wwwintechopencom
High Pressure Raman Spectra of Amino Acid Crystals
43
points to the existence of six bands between 10 and 160 cm-1 When pressure is increased great changes are observed in the Raman profile of the spectrum At 11 GPa the Raman spectrum of L-proline is very different from that obtained at 00 GPa (i) the mode peaked at ~ 68 cm-1 becomes the most intense band in the spectrum at 11 GPa (ii) the most intense peak in the spectrum taken at 00 GPa decreases intensity and in the spectrum taken at 11 GPa it is only the second most intense peak in the region 10 ndash 250 cm-1 (iii) the peaks marked by arrows in the spectrum at 00 GPa increase intensity Such a set of modifications point to the possibility of the occurrence of a phase transition undergone by polycrystalline L-proline for pressures below 11 GPa Results on other spectral regions of the Raman spectrum will reinforce this hypothesis It is observed a gradual change of intensity of all bands appearing in the Raman spectra of Figure 2 as well as continuous blue shifts of all wavenumbers when pressure is increased from 111 to 65 GPa The gradual change of the profiles of the Raman spectrum can be interpreted as continuous changes of the conformation of the molecules of L-proline in the unit cell of the crystal However between 65 and 78 GPa it is observed a strong change in the profile of the Raman spectrum in the low wavenumber region In particular the most intense band observed in the spectrum taken at 65 GPa lost intensity becoming one of the peaks with lowest intensity Additionally jump in the wavenumber of almost all bands are also verified in this pressure interval (65 - 78 GPa) As a consequence we have interpreted the changes of the Raman spectrum as a phase transition undergone by polycrystalline L-proline between 65 and 78 GPa Other evidences will be shown in the next paragraphs Finally when we decrease pressure from the highest value obtained in our experiments down to atmospheric pressure we observe that the original spectrum ndash bottom spectrum in Figure 2 ndash is recovered (the final spectrum is marked as 00 GPa) Figure 3 presents the Raman spectra of PM crystal for several pressures in the spectral range 200 ndash 750 cm-1 According to Ref (Herlinger amp Long 1970) (see also Table 1) the band recorded close to 294 cm-1 in the 00 GPa spectrum can be associated to a deformation vibration of the skeleton of the structure (skel) The bands observed at 377 and 447 cm-1 are associated respectively to the bending of CCN (CCN) and rocking of CO2- r(CO2-) In fact for other amino acid crystals it has been reported that the r(CO2-) is the most intense band in the 200 ndash 700 cm-1 spectral range However for the other amino acids differently from L-proline the r(CO2-) mode is observed for wavenumber higher than 500 cm-1 (-glycine 503 cm-1 (Dawson et al 2005) L-alanine 532 cm-1 L-valine 542 cm-1 (Goryainov et al 2005) DL-alanine 543 cm-1 etc) Finally in the spectrum taken at 00 GPa we can observe a band at 574 cm-1 which was associated to a bending of CO2- group Finally bands at 641 669 and 695 cm-1 were associated respectively to wagging of CO2- w(CO2-) (skel) and scissoring of CO2- sc(CO2-) By increasing the pressure we observe that between 00 and 11 GPa some important modifications are present For example the band (CCN) decreases intensity and seems to split A clear splitting is observed for the band at 574 cm-1 and the r(CO2-) band at 447 cm-1 begins to present a shoulder in the high wavenumber side Additionally the (skel) band at 669 cm-1 (marked by an asterisk in the spectrum of 00 GPa) disappears between the two lowest pressure spectra This entire complex picture corroborates the fact that the crystal is undergoing a phase transition between 00 and 11 GPa If one continues to increase pressure on the PM crystal it is possible to observe that all bands suffer blue shifts up to 65 GPa also in general terms the linewidth increases for all bands However no great changes are observed indicating that the crystal structure
wwwintechopencom
Vibrational Spectroscopy
44
Fig 3 Raman spectra of PM under several pressure conditions from 00 to 118 GPa in the spectral range 250 ndash 750 cm-1
remains the same of that observed at 11 GPa In other words the crystal seems to be stable between 11 to 65 GPa But when pressure arrives to 78 GPa great modifications are observed in the 200 ndash 700 cm-1 spectral region Let us state these modifications (i) the appearance of a band (marked by an arrow in the spectrum taken at 78 GPa) in the region ~ 450 cm-1 (ii) an impressive fall of intensity and a red shift of the band associated to r(CO2-) (iii) a red shift of the two bands in the region 550 ndash 600 cm-1 (iv) the appearance of low intense bands (marked by an asterisk in the spectrum taken at 78 GPa) for wavenumbers higher than 600 cm-1 (v) the increase of intensity of the band initially assigned as scissoring of CO2- (vi) the appearance of a band at ~ 725 cm-1 Again the modifications in the spectra between 65 and 78 GPa presented in Figure 3 corroborate the fact that PM crystal undergoes a second phase transition as discussed previously When pressure is released down to 00 GPa whose spectrum is marked by 00 GPa we observe that the starting atmospheric spectrum is recovered as already observed in Figure 2 Figure 4 presents the Raman spectra of PM crystal under high pressure conditions with argon as compression medium in the region 600 to 1250 cm-1 We have cut off the peaks in the region close to 900 cm-1 because there is a peak with high intensity that makes difficult the visualization of the bands close to it this region will be discussed in Figure 5 In the Figure 4 we observe that several peaks are well defined (the peak marked by an asterisk is due a lamp used to calibrate the spectra) It is important to state that in the spectrum at 00
wwwintechopencom
High Pressure Raman Spectra of Amino Acid Crystals
45
Wavenumber (cm-1) Assignment Wavenumber (cm-1) Assignment
68 Lattice mode 950 (CCN)+(CC)
81 Lattice mode 982 v(CCN)+(CC)
99 Lattice mode 991 (CCN)+(CC)
120 Lattice mode 1031 (CCN)+(CC)
134 Lattice mode 1055 w(CH2)
149 Lattice mode 1079 w(CH2)
203 - 1084 r(CH2)
294 (skel) 1161 t(CH2)
373 (CCN) 1172 t(CH2)
447 r(CO2-) 2876 (CH)
574 (CO2-) 2898 (CH)
641 w(CO2-) 2932 (CH)
669 (skel) 2949 (CH)
695 sc(CO2-) 2971 (CH)
791 (skel) 2983 (CH)
840 r(CH2) 3006 (CH)
863 r(CH2) 3011 (CH)
897 r(NH2+) 3041 (NH)
918 (CCN)+(CC) 3068 (NH)
Table 1 Wavenumber (in cm-1) and approximate assignments of Raman bands for L-proline monohydrate crystal where def deformation bending r rocking w wagging sc scissoring stretching t twisting
GPa there are two peaks between 975 and 1000 cm-1 and in the spectrum taken at 11 GPa only one band is observed Another aspect that worth note is the fact that the band of highest energy (~ 1172 cm-1 at 00 GPa twisting of CH2 t(CH2)) splits in the spectrum taken at 11 GPa Above this last pressure the intensity of the peaks remains approximately constant up to 65 GPa Between 65 and 78 GPa the Raman spectrum presents great changes The band associated to the rocking of CH2 r(CH2) observed initially at ~ 840 cm-1 presents both a jump to high wavenumbers and an increasing in its linewidth A splitting is observed for the band marked by an star in the spectrum recorded at 65 GPa and observed initially at ~ 950 cm-1 which is associated to the stretching of CCN and CC units (CCN) + (CC) If one observe the band at 1033 cm-1 which is associated to the wagging of CH2 w(CH2) interestingly between 65 and 78 GPa it changes intensity with the band marked by a down arrow in the spectrum taken at 65 GPa so the w(CH2) band lost intensity and the band marked by a down arrow increases intensity Similarly the low intense bands observed between 1080 and 1200 cm-1 present great changes in their intensities between 65 and 78 GPa All these changes corroborate the modification in the crystal structure which occurs above 65 GPa which are reversible when pressure is released down to 00 GPa
wwwintechopencom
Vibrational Spectroscopy
46
Fig 4 Raman spectra of PM under several pressure conditions from 00 to 118 GPa in the spectral range 600 ndash 1250 cm-1
Figure 5 shows the Raman spectra of PM crystal in the 800 ndash 1100 cm-1 spectral region The dominant band in the spectrum taken at 00 GPa observed at 897 cm-1 is associated to the rocking vibration of NH2+ r(NH2+) The changes occurring in the first phase transition are not impressive but we note that between 65 and 78 GPa the band lost intensity and splits into two bands Above 78 GPa blue shifts of the wavenumbers are verified but no great change is present up to the highest pressure arrived in the experiment Decreasing pressure down to 00 GPa again we observe that the original spectrum is also recovered in this region In the spectral region presented in Figure 6 it is expected to be observed bands associated to the stretching vibrations of CH and CH2 units A theoretical study performed on L-methionine showed that different profiles of the Raman spectrum in this wavenumber range are associated with different conformations of the molecule In this sense when we observe the Raman spectra of PM as a function of pressure we note that between 00 and 11 GPa the most intense band at 00 GPa split into three bands (marked by up arrows) In the spectrum taken at 17 GPa the separation is very clear and when pressure is further increased the bands become clearly distinct But between 65 and 78 GPa the spectrum changes abruptly indicating that between these two pressure values the proline molecules undergo a great conformational change Because we have observed additionally changes in the low wavenumber region we can understand that both conformational change and structural phase transition take place for PM crystal As observed in the other spectral regions the original spectrum at 00 GPa is recovered when pressure is released
wwwintechopencom
High Pressure Raman Spectra of Amino Acid Crystals
47
Fig 5 Raman spectra of PM under several pressure conditions from 00 to 118 GPa in the spectral range 800 ndash 1100 cm-1
Data can give us some insights related to the behaviour of molecules of proline as the crystal is compressed For example in a previous study on -glycine the softening of a bending of CO2- was associated to a decrease in the intra-layer hydrogen bond strength while the stiffening of the same vibration was associated to an increase in the bond strength (Dawson et al 2005) For PM we have observed that the band associated to both bending of CO2- (CO2-) and rocking of CO2- r(CO2-) increase wavenumbers from 11 to 65 GPa and between 65 and 78 GPa decrease wavenumber for (CO2-) the decreasing is represented by the two dashed lines in Figure 3 between the spectra of 65 and 78 GPa We have also observed an additional increasing of wavenumbers for pressures higher than 78 GPa This suggests that the intra-layer hydrogen bond strength is stiffened up to 65 GPa between 65 and 78 GPa the hydrogen bond strength is softened and above 80 GPa the hydrogen bond is stiffened Additionally our results suggest that between 65 and 78 GPa occurs a structural rearrangement in such a way that the behaviour of the hydrogen bond strengths is changed This rearrangement is enough to change the symmetry of the crystal because
wwwintechopencom
Vibrational Spectroscopy
48
Fig 6 Raman spectra of PM under several pressure conditions from 00 to 118 GPa in the spectral range 2850 ndash 3200 cm-1
associated to it we observe great modifications in the Raman spectrum of low wavenumber region (Figure 2) Yet related to the phase transition between 65 and 78 GPa it is impressive the increase of intensity of a band in the spectrum taken at 65 GPa (marked by an arrow see Figure 4) which can be assigned as wagging of CH2 w(CH2) it change of intensity with the band close to it at ~ 1055 cm-1 at 00 GPa which is also assigned as w(CH2) indicating that a conformational change in the ring may also occurs when the crystal undergoes the phase transition at 65 - 78 GPa It is also interesting to note that the first transition occurs from a monoclinic to a phase with lower symmetry (another monoclinic our a triclinic phase) because in several regions including both internal and lattice mode spectral regions the number of peaks in the spectrum taken at 11 GPa is greater than the number of Raman peaks in the spectrum taken at 00 GPa It is also worth note that above 78 GPa almost all bands increases linewidth indicating that some disorder is introduced in the high pressure phase However the disorder does not occur in a high degree because when pressure is released down to 00 GPa the original spectrum is recovered It is known that the amorphization process is preceded by some disorder in the crystal structure however due to recovered of the original Raman spectrum after releasing pressure we can infer that when we arrive to 1118 GPa we are far away from the pressure point where eventually the PM crystal should present amorphization
wwwintechopencom
High Pressure Raman Spectra of Amino Acid Crystals
49
42 L-histidine hydrochloride monohydrate Related to the HHM (see Figure 8) which crystallizes in an orthorhombic structure belonging to the P212121 (D24) space group with four molecules of C6H9N3O2HClH2O per unit cell we were able to arrive up to 75 GPa and discovery a new polymorph of the material above 31 GPa The strong bond between N-H of the imidazole ring and the carboxyl group of a neighboring molecule is the fundamental intermolecular link resulting in a spiral arrangement along the c-axis (Donohue amp Caron 1964) The coupling of the four zwitterions in the unit cell leads to 297 optical normal modes decomposed into irreducible representations of the factor group D2 as Γop = 75 A + 74 (B1 + B2 + B3) and the acoustic modes can be expressed as Γac = B1 + B2 + B3 Under high pressure conditions modifications the Raman spectra are interpreted in terms of both conformational changes of the molecules in the unit cell and in terms of a phase transition Figure 9(a) presents the Raman spectra of HHM for several pressures in the spectral range from 50 to 660 cm-1 The region for wavenumbers lower than 200 cm-1 as previously stated is characteristic of the lattice vibration modes Increasing pressure we observe that the bands present blue shifts of their wavenumbers However between 27 and 31 GPa it is possible to note that a great change occurs in the Raman spectrum the peak marked by a square which is associated to torsion of CO2- (τ(CO2-)) splits in two new peaks which are marked by up arrows in the spectrum at 31 GPa In Figure 9(b) which presents the plot of experimental wavenumber as function of pressure we clearly observe the splitting of the band close to 180 cm-1 Additionally we note that for other bands discontinuities of wavenumbers are observed between 27 to 31 GPa (De Sousa et al 2011)
Fig 8 Unit cell of HHM seen along the b-axis
In this region it is also possible to observe many internal vibrations of the histidine molecule such as skeletal structure at 442 and 490 cm-1 torsion of NH3+ which is observed at 385 cm-1 and rocking of CO2- at 530 cm-1 Again as occurs with the spectra shown in the lattice mode region modifications are observed in the spectral range 27 - 31 GPa Among these changes we observed the disappearance of the bands at 276 and 500 cm-1 and the
wwwintechopencom
Vibrational Spectroscopy
50
Fig 9 (a) Raman spectra of HHM under several pressure conditions from 04 to 75 GPa in the spectral range 50 ndash 650 cm-1 (b) wavenumber versus pressure of the bands of HHM appearing in Fig 9(a)
appearance of a band at 473 cm-1 in the spectrum taken at 31 GPa We additionally note that the intensity of the band associated to torsion of NH3+ decreases with increasing pressure indicating that there occurs a conformational change of histidine molecule Such a conformational change can be understood as consequence of the change of the intermolecular hydrogen bond length With increasing pressure the band initially at 385 cm-
1 which is associated with a torsion vibration of the NH3+ unit shifts linearly toward higher wavenumbers we can say that the pressure decreases the length of the hydrogen bonds increasing the wavenumber of the band associated to torsional vibration of NH3+ unit Figure 10(a) presents the Raman spectra of HHM in the 650 ndash 1250 cm-1 interval for several pressure values up to 75 GPa In this spectral region it is expected to observe vibrations assigned to the deformation of CO2- stretching of both C-C and C-N wagging of H2O and rocking of NH3+ The band observed at ~ 694 cm-1 is associated to a deformation vibration of CO2- (CO2) while the out-of-plane vibration of CO2- (CO2) is observed at ~ 822 cm-1 The band at 807 cm-1 is associated with a wagging vibration of the water molecule w(H2O) The bands recorded at 1191 and 1210 cm-1 can be assigned as the rocking of NH3+ unit r(NH3+) In this spectral region some changes are observed in the range 27 ndash 31 GPa (i) the disappearance of the band at 694 cm-1 (ii) the appearance of a new weak band at 717 cm-1
(marked by a star in the Figure 10(a)) (iii) the inversion of intensity of the two bands located at 807 and 822 cm-1 which are related to units directly involved in the hydrogen bonds and (iv) the inversion of intensity of the two bands associated to a rocking of NH3+ unit r(NH3+) located at 1191 and 1210 cm-1 The dependence of the wavenumber versus pressure plot for this spectral region is presented in Fig 10(b) we note that many of the observed Raman modes show a small discontinuous change in the slope in the pressure-induced variation of its wavenumber in range 27 ndash 31 GPa
wwwintechopencom
High Pressure Raman Spectra of Amino Acid Crystals
51
Figure 11(a) shows the Raman spectra of the HHM crystal in the spectral range 1700-1400 cm-1 for pressure from 00 to 75 GPa Fig 11(b) shows the respective wavenumber vs pressure plots In this region one expects to observe vibrations assigned to a deformations of the imidazole ring of the histidine molecule asymmetric stretching of the CO2- units stretching of C=O among others In the Figure 11(a) two modifications are observed in the range 27 ndash 31 GPa The first change is the decreasing of the relative intensity of the band originally at 1433 cm-1 and the second one is the appearance of a band at 1642 cm-1 In the wavenumber versus pressure plot presented in Figure 11(b) a subtle discontinuity occurs in the range 27 ndash 31 GPa with appreciably differences in slopes where two modes change from positive to negative slopes
Fig 10 (a) Raman spectra of HHM under several pressure conditions from 04 to 75 GPa in the spectral range 650 ndash 1250 cm-1 (b) wavenumber versus pressure of the bands of HHM appearing in Fig 10(a)
The Raman spectra of HHM crystal in the range 3450-3125 cm-1 are shown in the Figure 12(a) and in the Figure 12(b) the respective wavenumber versus pressure plots are given In this region we expected to observe stretching vibrations of several units of the amino acids and of the water molecule (CH NH3+ and OH-) It is important to note that for wavenumbers lower than 3000 cm-1 there are some modes related to the mineral oil used as compression media In detail the band at 3111 cm-1 can be associated to a stretching vibration of NH3+ unit (NH3+) while the bands observed at 3155 and 3163 cm-1 are associated to a CH stretching vibration of imidazole ring The bands observed at 3374 and 3408 cm-1 are related to the OH- stretching of the water molecules In the pressure range 27 ndash 31 GPa main changes are observed such as the disappearance of the bands related to a OH- stretching vibration (initially located at 3367 and 3393 cm-1) the appearance of a band of weak intensity at 3424 cm-1 and discontinuities of the wavenumber curve of bands at 3155 and 3163 cm-1 which are associated with the CH stretching vibration
wwwintechopencom
Vibrational Spectroscopy
52
Fig 11 (a) Raman spectra of HHM under several pressure conditions from 04 to 75 GPa in the spectral range 1400 ndash 1670 cm-1 (b) wavenumber versus pressure of the bands of HHM appearing in Fig 11(a)
Fig 12 (a) Raman spectra of HHM under several pressure conditions from 04 to 75 GPa in the spectral range 2950 ndash 3450 cm-1 (b) wavenumber versus pressure of the bands of HHM appearing in Fig 12(a)
wwwintechopencom
High Pressure Raman Spectra of Amino Acid Crystals
53
Table 2 gives a quantitative analysis of the evolution of the Raman spectra of HHM crystal with pressure where fitting of all bands to a linear expression ω = ω0 + P is furnished In Table 2 the first column (ωobs) represents the wavenumber of the Raman bands observed at room pressure the second and third columns correspond to adjustment of data for pressure values between 0 and 27 GPa and the two last columns correspond to fitting of the high-pressure phase that observed between 31 and 75 GPa A resume of the modifications observed in all spectral regions of the Raman spectra of HHM is as follows (i) splitting of the band in the low-wavenumber lattice range (ii) change in the number of bands associated to internal modes (iii) wavenumber shifts with discontinuities (iv) changes in the relative intensities of the vibrational bands It is important to state that changes were observed for the deformation vibrations of the OH- of the water molecule as well as of the NH3+ and CO2- groups of the amino acid molecule This picture indicates large conformational changes of the molecules in the unit cell Related to HHM beyond the hydrogen bonds originated from the histidine molecule there are two hydrogen bonds from the water molecule It is interesting to note from Figure 12(b) that the wavenumber of OH- stretching (OH-) decreases with increasing pressure However the OH units participate of hydrogen bonds one to a carboxyl oxygen and another to the chloride ion This means that between 00 and 31 GPa the hydrogen bond strength increases and the wavenumber of(OH-) decreases in this pressure range Also after the phase transition the wavenumber of (OH-) suffers a jump and continues to decrease up to the highest pressure obtained in our experiments Such a picture indicates a further increase of the hydrogen bonds formed by the water molecules and confirms that these bonds are playing an important role in the mechanism of the transition It is interesting to note that similar changes in the low-wavenumber region were also observed for the same crystal when subjected to low temperatures
ωobs
(cm-1)
Phase 1
(0 le P le 27 GPa) Phase 2
(31 le P le 75 GPa)
ω0
(cm-1)
(cm-1)(GPa)-1 ω0
(cm-1)
(cm-1)(GPa)-1
94 945 0669 937 -0103
105 1052 0276 1002 1771
121 1214 -1087 1109 2092
136 1357 1616 1360 0623
149 1497 2128 - -
159 1568 8033 1483 8105
- - - 1639 9960
188 1891 7661 1902 8059
270 2697 3093 - -
293 2919 6118 2945 7683
385 3846 7236 4015 1675
442 4423 1223 4423 1461
wwwintechopencom
Vibrational Spectroscopy
54
ωobs
(cm-1)
Phase 1
(0 le P le 27 GPa) Phase 2
(31 le P le 75 GPa)
ω0
(cm-1)
(cm-1)(GPa)-1 ω0
(cm-1)
(cm-1)(GPa)-1
- - - 4707 0785
491 490 5 3319 - -
530 5304 4335 - -
609 6078 5312 6208 2463
693 6935 1529 - -
- - - 7064 3449
807 8067 2042 8047 1467
824 8240 -0498 8204 1442
838 8361 7335 8504 3124
875 8734 6438 8881 2777
917 9173 0810 9187 2356
963 9630 2757 9636 2411
980 9787 4489 9787 5206
1068 10667 4790 10732 3418
1141 11403 1890 11403 2744
1162 11619 2611 11674 1120
1190 11900 2277 11885 1637
1208 12079 2859 12101 1341
1434 14345 1316 14382 0846
1448 14481 3059 14554 1677
1463 14621 4415 14760 0778
1481 14813 4238 14970 -0619
1609 16093 2739 16166 -0374
- - - 16249 2736
3111 31110 0919 31045 2914
3154 31546 1287 31532 6564
3164 31626 5305 31593 7905
3375 33739 -2638 - -
3407 34081 -5745 - -
- - - 34371 -3169
Table 2 Wavenumber values of the bands appearing in the HHM spectrum at 00 GPa (ωobs) and adjustment data by linear fitting (P) for the two phases
wwwintechopencom
High Pressure Raman Spectra of Amino Acid Crystals
55
5 Conclusions
The results suggested that L-proline monohydrate undergoes two phase transitions one between 00 and 11 GPa and a second between 65 and 78 GPa In both transitions it was possible to observed changes in the spectrum profile discontinuities in the wavenumber versus pressure plots in the lattice region of the spectrum and the appearance of news bands By releasing the pressure after attaining a maximum of 118 GPa the atmospheric pressure spectrum was fully recovered showing that the pressure-induced transitions undergone by polycrystalline L-proline crystal are reversible In the first transition it was observed the splitting of bands associated to (CCN) (CO2-) and (CH) vibrations The band associated to (skel) has disappeared In the second one we have observed the red shift of r(CO2-) significant changes in the intensity of the bands associated to the sc(CO2-) and w(CH2) vibrations and the splits of (CCN) + (CC) and r(NH2+) that also has lost intensity These modifications were interpreted as conformational changes of molecules in the unit cell Because these changes involve moieties that participate in hydrogen bonds we suppose that these hydrogen bonds have also been modified Modifications of hydrogen bonds can trigger some molecular rearrangements that lead to structural phase transitions In our work this hypothesis was supported by the changes that were observed in the region of the lattice modes for both phase transitions Therefore the results suggested two structural phase transitions one between 00 and 11 GPa and another between 65 and 78 GPa accompanied by significant conformational changes of molecules in the L-proline monohydrated crystal The results also suggest that HHM crystal undergoes a phase transition between 27 and 31 GPa when it is submitted to high pressure conditions up to 75 GPa The main changes observed in the Raman spectra was the splitting of the band in the low-wavenumber lattice range change in the number of bands associated to internal modes and wavenumber shifts with discontinuities Having described the behavior of two amino acid crystals under pressure and looked back at the past fourteen years of research we can ask to ourselves what does the future hold Based on the studies performed we believe that the use of several techniques such as neutron and Raman scattering as well as thermal and infrared analyses can help us to give a complete picture about hydrogen bond and the behavior of amino acids under pressure Maybe the study of peptide under similar external conditions should be the next road to be walked
6 Acknowledgment
Authors acknowledge CAPES CNPq and FUNCAP for financial support
7 References
Barthes M Bordallo HN Deacutenoyer F Lorenzo J-E Zaccaro J Robert A amp Zontone F (2004) Micro-transitions or breathers in L-alanine The European Physical Journal B Vol 37 No 3 (February 2004) pp 375-382 ISSN 1434-6028
Boldyreva EV Drebushchak VA Drebushchak TN Paukov IE Kovalevskaya YA amp Shutova ES (2003a) Polymorphism of glycine Part I Journal of Thermal Analysis and Calorimetry Vol 73 No 2 (August 2003) pp 409-418 ISSN 1388-6150
wwwintechopencom
Vibrational Spectroscopy
56
Boldyreva EV Drebushchak VA Drebushchak TN Paukov IE Kovalevskaya YA amp Shutova ES (2003b) Polymorphism of glycine Part II Journal of Thermal Analysis and Calorimetry Vol 73 No 2 (August 2003) pp 419-428 ISSN 1388-6150
Boldyreva EV Ivashevskaya SN Sowa H Ahsbahs H amp Weber H-P (2004) Effect of High Pressure on Crystalline Glycine A New High-Pressure Polymorph Doklady Physical Chemistry Vol 396 No 1 (May 2004) pp 111-114 ISSN 0012-5016
Boldyreva EV Ivashevskaya SN Sowa H Ahsbahs H amp Weber H-P (2005a) Effect of hydrostatic pressure on the -polymorph of glycine 1 A polymorphic transition into a new -form Zeitschrift fuumlr Kristallographie Vol 220 No 1 ( January 2005) pp 50- 57 ISSN 0044-2968
Boldyreva EV Kolesnik EN Drebushchak TN Ahsbahs H Beukes JA amp Weber H-P (2005b) A comparative study of the anisotropy of a lattice strain induced in the crystals of L-serine by cooling down to 100 K or by increasing pressure up to 44 GPa Zeitschrift fuumlr Kristallographie Vol 220 No 1 (January 2005) pp 58- 65 ISSN 0044-2968
Boldyreva EV Kolesnik EN Drebushchak TN Ahsbahs H amp Seryotkin YV (2006a) A comparative study of the anisotropy of a lattice strain induced in the crystals of DL-serine by cooling down to 100 K or by increasing pressure up to 86 GPa A comparison with L-serine Zeitschrift fuumlr Kristallographie Vol 221 No 2 (2006) pp 150- 161 ISSN 0044-2968
Boldyreva EV Sowa H Seryotkin YV Drebushchak TN Ahsbahs H Chernyshev V amp Dmitriev V (2006b) Pressure-induced phase transitions in crystalline L-serine studied by single crystal and gigh-resolution powder X-ray diffraction Chemical Physics Letters Vol 429 No 4-6 (October 2006) pp 474-478 ISSN 0009-2614
Boldyreva E (2007a) Cristalline Amino Acids A Link between Chemistry Materials Science and Biology In Models Mysteries and Magic of Molecules Boeyens JCA amp Ogilvie JF pp 167-192 Springer ISBN 978-1-4020-5940-7 Netherlands
Boldyreva E (2007b) High-Pressure Polymorphs of Molecular Solids When Are They Formed and When Are They Not Some Examples of the Role of Kinetic Control Crystal Growth amp Design Vol 7 No 9 (August 2007) pp 1662-1668 ISSN 1528-7483
Dawson A Allan DR Belmonte SA Clark SJ David WIF McGregor PA Parsons S Pulham CR amp Sawyer L (2005) Effect of high pressure on the crystal structures of polymorphs of glycine Crystal Growth amp Design Vol 5 No 4 (May 2005) pp 1415-1427 ISSN 1528-7483
Destro R Marsh RE amp Bianchi R (1988) A low-temperature (23K) study of L-alanine The Journal of Physical Chemistry Vol 92 No 4 (February 1988) pp 966-973 ISSN 0022-3654
De Sousa GP Freire PTC Lima Jr JA Mendes Filho J amp Melo FEA (2011) High-pressure Raman spectra of L-histidine hydrochloride monohydrate cristal Vibrational Spectroscopy Vol 57 No 1 (September 2011) pp 102-107 ISSN 0924-2031
Donohue J amp Caron A (1964) Refinement of cristal structure of histidine hydrochloride monohydrate Acta Crystallographica Vol 17 No 9 (September 1964) pp 1178-amp ISSN 0108-7673
wwwintechopencom
High Pressure Raman Spectra of Amino Acid Crystals
57
Faccedilanha Filho PF Freire PTC Lima KCV Mendes Filho J Melo FEA amp Pizani PS (2008) High temperature Raman spectra of L-leucine crystals Brazilian Journal of Physics Vol 38 No 1 (March 2008) pp 131-137 ISSN 0103-9733
Faccedilanha Filho PF Freire PTC Melo FEA Lemos V Mendes Filho J Pizani PS amp Rossatto DZ (2009) Pressure-induced phase transitions in L-leucine crystal Journal of Raman Spectroscopy Vol 40 No 1 (January 2009) pp 46-51 ISSN 1097-4555
Freire PTC (2010) Pressure-Induced Phase Transitions in Crystalline Amino Acids In High Pressure Crystallography ndash From Fundamental Phenomena to Technological Applications Boldyreva E amp Dera P pp 559-572 Springer ISBN 978-904-8192-60-1 New York USA
Funnel NP Dawson A Francis D Lennie DR Marshall WG Moggach SA Warren JE amp Parsons S (2010) The effect of pressure on the crystal structure of l-alanine CrystEngComm Vol 12 No 9 (September 2010) pp 2573-2583 ISSN 1466-8033
Goryainov SV Kolesnik EN amp Boldyreva EV (2005) A reversible pressure-induced phase transition in -glycine at 076 GPa Physica B Condensed Matter Vol 357 No 3-4 (March 2005) pp 340-347 ISSN 0921-4526
Goryainov SV Kolesnik EN amp Boldyreva EV (2006) Raman observation of a new (ζ) polymorph of glycine Chemical Physics Letters Vol 419 No 4-6 (February 2006) pp 496-500 ISSN 0009-2614
Harding MM amp Howieson RM (1976) L-Leucine Acta Crystallographica Section B Vol 32 No 2 (February 1976) pp 633-634 ISSN 1600-5740
Herlinger AW amp Long TV (1970) Laser Raman and infrared spectra of amino acids and their metal complexes 3 Proline and bisprolinato complexes Journal of the American Chemical Society Vol 92 No 22 (November 1970) pp 6481-6486 ISSN 0002-7863
Hermiacutenio da Silva J Lemos V Freire PTC Melo FEA Mendes Filho J Lima Jr JA amp Pizani PS (2009) Stability of the crystal structure of L-valine under high pressure Physica Status Solidi B Vol 246 No 3 (March 2009) pp 553-557 ISSN 0370-1972
Lima JA Freire PTC Melo FEA Lemos V Mendes Filho J amp Pizani PS (2008) High pressure Raman spectra of L-methionine Crystal Journal of Raman Spectroscopy Vol 39 No 10 (October 2008) pp 1356-1363 ISSN 1097-4555
Migliori A Maxton PM Clogston AM Zirngiebl E amp Lowe M (1988) Anomalous temperature dependence in the Raman spectra of l-alanine Evidence for dynamic localization Physical Review B Vol 38 No 18 (December 1988) pp 13464-13467 ISSN 1098-0121
Minkov VS Krylov AS Boldyreva EV Goryainov SN Bizyaev SN amp Vtyurin AN (2008) Pressure-Induced Phase Transitions in Crystalline L- and DL-Cysteine The Journal of Physical Chemistry B Vol 112 No 30 (July 2008) pp 8851-8854 ISSN 1520-6106
Minkov VS Goryainov SV Boldyreva EV amp Goumlrbitz CH (2010) Raman study of pressure-induced phase transitions in the crystals of orthorhombic and monoclinic polymorphs of L-cysteine dynamics of the side-chain Journal of Raman Spectroscopy Vol 41 No 12 (December 2010) pp 1458-1468 ISSN 1097-4555
Moggach SA Allan DR Morrison PA Parsons S amp Sawyer L (2005) Effect of pressure on the crystal structure of L-serine-I and the crystal structure of L-serine-II
wwwintechopencom
Vibrational Spectroscopy
58
at 54 GPa Acta Crystallographica Section B Vol 61 No 1 (February 2005) pp 58-68 ISSN 0108-7681
Moggach SA Marshall WG amp Parsons S (2006) High-pressure neutron diffraction study of L-serine-I and L-serine-II and the structure of L-serine-III at 81 GPa Acta Crystallographica Section B Vol 62 No 5 (October 2006) pp 815-825 ISSN 0108-7681
Moreno AJD Freire PTC Melo FEA Arauacutejo-Silva MA Guedes I Mendes Filho J (1997) Pressure-induced phase transitions in monohydrated l-asparagine aminoacid crystals Solid State Communications Vol 103 No 12 (September 1997) pp 655-658 ISSN 0038-1098
Murli C Sharma SK Karmakar S amp Sikka SK (2003) -Glycine under high pressures a Raman scattering study Physica B Condensed Matter Vol 339 No 1 (November 2003) pp 23-30 ISSN 0921-4526
Murli C Vasanthi R amp Sharma SM (2006) Raman spectroscopic investigations of DL-serine and DL-valine under pressure Chemical Physics Vol 331 No 1 (December 2006) pp 77-84 ISSN 0301-0104
Olsen JS Gerward L Freire PTC Mendes Filho J Melo FEA amp Souza Filho AG (2008) Pressure-induced phase transitions in L-alanine crystals Journal of Physics and Chemistry of Solids Vol 69 No 7 (July 2008) pp 1641-1645 ISSN 0022-3697
Sabino AS De Sousa GP Luz-Lima C Freire PTC Melo FEA amp Mendes Filho J (2009) High-pressure Raman spectra of L-isoleucine crystals Solid State Communications Vol 149 No 37-38 (October 2009) pp 1553-1556 ISSN 0038-1098
Sasaki JM Freire PTC Moreno AJD Melo FEA Guedes I Mendes Filho J Shu J Hu J amp Matildeo HK (2000) Single crystal X-ray diffraction in monohydrate L-asparagine under hydrostatic pressure Science and Technology of High Pressure Proceedings of AIRAPT-17 Hyderabad India 2000
Seijas LE Delgado GE Mora AJ Fitch AN amp Brunelli M (2010) On the Crystal structures and hydrogen bond patterns in proline pseudopolymorphs Powder Diffraction Vol 25 No 3 (September 2010) pp 235-240 ISSN 0885-7156
Silva BL Freire PTC Melo FEA Mendes Filho J Pimenta MA amp Dantas MSS (2000) High-pressure Raman spectra of L-threonine crystal Journal of Raman Spectroscopy Vol 31 No 6 (June 2000) pp 519-522 ISSN 1097-4555
Teixeira AMR Freire PTC Moreno AJD Sasaki JM Ayala AP Mendes Filho J amp Melo FEA (2000) High-pressure Raman study of l-alanine crystal Solid State Communications Vol 116 No 7 (October 2000) pp 405-409 ISSN 0038-1098
Tumanov NA Boldyreva EV Kolesov BA Kurnosov AV amp Quesada Cabrera R (2010) Pressure-induced phase transitions in L-alanine revisited Acta Crystallographica Section B Vol 66 No 4 (August 2010) pp 458-371 ISSN 1600-5740
Yamashita M Inomata S Ishikawa K Kashiwagi T Matsuo H Sawamura S amp Kato M (2007) A high-pressure polymorph of L--leucine Acta Crystallographica Section E Vol 63 No 5 (May 2007) pp o2762-o2764 ISSN 1600-5368
wwwintechopencom
Vibrational SpectroscopyEdited by Prof Dominique De Caro
ISBN 978-953-51-0107-9Hard cover 168 pagesPublisher InTechPublished online 24 February 2012Published in print edition February 2012
InTech EuropeUniversity Campus STeP Ri Slavka Krautzeka 83A 51000 Rijeka Croatia Phone +385 (51) 770 447 Fax +385 (51) 686 166wwwintechopencom
InTech ChinaUnit 405 Office Block Hotel Equatorial Shanghai No65 Yan An Road (West) Shanghai 200040 China
Phone +86-21-62489820 Fax +86-21-62489821
The infrared and Raman spectroscopy have applications in numerous fields namely chemistry physicsastronomy biology medicine geology mineralogy etc This book provides some examples of the use ofvibrational spectroscopy in supramolecular chemistry inorganic chemistry solid state physics but also in thefields of molecule-based materials or organic-inorganic interfaces
How to referenceIn order to correctly reference this scholarly work feel free to copy and paste the following
Paulo de Tarso Cavalcante Freire Joseacute Alves Lima Juacutenior Bruno Tavares de Oliveira Abagaro Gardecircnia deSousa Pinheiro Joseacute de Arimateacutea Freitas e Silva Josueacute Mendes Filho and Francisco Erivan de Abreu Melo(2012) High Pressure Raman Spectra of Amino Acid Crystals Vibrational Spectroscopy Prof Dominique DeCaro (Ed) ISBN 978-953-51-0107-9 InTech Available from httpwwwintechopencombooksvibrational-spectroscopyhigh-pressure-raman-spectra-of-amino-acid-crystals
copy 2012 The Author(s) Licensee IntechOpen This is an open access articledistributed under the terms of the Creative Commons Attribution 30License which permits unrestricted use distribution and reproduction inany medium provided the original work is properly cited

Vibrational Spectroscopy
42
PM (see Figure 1) crystal is found in a monoclinic structure space group C2with a = 2043 Aring b = 619 Aring c = 514 Aring and = 9579deg and Z=4 (Seijas et al 2010) In such a material the hydrogen bonds play a special role in the stability of the crystal structure X-ray diffraction study shows that there are interactions between amino and carboxylate groups through the hydrogen bonds N1-H1hellipO1 N1-H1hellipO2 and N1-H2hellipO1 with H1 atom acting as a bifurcated donor taking part in two hydrogen bonds These hydrogen bonds link the proline molecules forming pairs of chains in opposite directions along the c axis The water molecules form zigzag chains of O-HhellipO hydrogen bonds also parallel to the c axis (Seijas et al 2010) Figure 2 presents the Raman spectra of polycrystalline PM crystal in the spectral range 10 ndash 250 cm-1 for pressures from 00 to 118 GPa The spectrum taken at 00 GPa shows a complex profile indicating the occurrence of several bands in fact fitting with Lorentzian curves
Fig 2 Raman spectra of PM under several pressure conditions from 00 to 118 GPa in the spectral range 50 ndash 250 cm-1
wwwintechopencom
High Pressure Raman Spectra of Amino Acid Crystals
43
points to the existence of six bands between 10 and 160 cm-1 When pressure is increased great changes are observed in the Raman profile of the spectrum At 11 GPa the Raman spectrum of L-proline is very different from that obtained at 00 GPa (i) the mode peaked at ~ 68 cm-1 becomes the most intense band in the spectrum at 11 GPa (ii) the most intense peak in the spectrum taken at 00 GPa decreases intensity and in the spectrum taken at 11 GPa it is only the second most intense peak in the region 10 ndash 250 cm-1 (iii) the peaks marked by arrows in the spectrum at 00 GPa increase intensity Such a set of modifications point to the possibility of the occurrence of a phase transition undergone by polycrystalline L-proline for pressures below 11 GPa Results on other spectral regions of the Raman spectrum will reinforce this hypothesis It is observed a gradual change of intensity of all bands appearing in the Raman spectra of Figure 2 as well as continuous blue shifts of all wavenumbers when pressure is increased from 111 to 65 GPa The gradual change of the profiles of the Raman spectrum can be interpreted as continuous changes of the conformation of the molecules of L-proline in the unit cell of the crystal However between 65 and 78 GPa it is observed a strong change in the profile of the Raman spectrum in the low wavenumber region In particular the most intense band observed in the spectrum taken at 65 GPa lost intensity becoming one of the peaks with lowest intensity Additionally jump in the wavenumber of almost all bands are also verified in this pressure interval (65 - 78 GPa) As a consequence we have interpreted the changes of the Raman spectrum as a phase transition undergone by polycrystalline L-proline between 65 and 78 GPa Other evidences will be shown in the next paragraphs Finally when we decrease pressure from the highest value obtained in our experiments down to atmospheric pressure we observe that the original spectrum ndash bottom spectrum in Figure 2 ndash is recovered (the final spectrum is marked as 00 GPa) Figure 3 presents the Raman spectra of PM crystal for several pressures in the spectral range 200 ndash 750 cm-1 According to Ref (Herlinger amp Long 1970) (see also Table 1) the band recorded close to 294 cm-1 in the 00 GPa spectrum can be associated to a deformation vibration of the skeleton of the structure (skel) The bands observed at 377 and 447 cm-1 are associated respectively to the bending of CCN (CCN) and rocking of CO2- r(CO2-) In fact for other amino acid crystals it has been reported that the r(CO2-) is the most intense band in the 200 ndash 700 cm-1 spectral range However for the other amino acids differently from L-proline the r(CO2-) mode is observed for wavenumber higher than 500 cm-1 (-glycine 503 cm-1 (Dawson et al 2005) L-alanine 532 cm-1 L-valine 542 cm-1 (Goryainov et al 2005) DL-alanine 543 cm-1 etc) Finally in the spectrum taken at 00 GPa we can observe a band at 574 cm-1 which was associated to a bending of CO2- group Finally bands at 641 669 and 695 cm-1 were associated respectively to wagging of CO2- w(CO2-) (skel) and scissoring of CO2- sc(CO2-) By increasing the pressure we observe that between 00 and 11 GPa some important modifications are present For example the band (CCN) decreases intensity and seems to split A clear splitting is observed for the band at 574 cm-1 and the r(CO2-) band at 447 cm-1 begins to present a shoulder in the high wavenumber side Additionally the (skel) band at 669 cm-1 (marked by an asterisk in the spectrum of 00 GPa) disappears between the two lowest pressure spectra This entire complex picture corroborates the fact that the crystal is undergoing a phase transition between 00 and 11 GPa If one continues to increase pressure on the PM crystal it is possible to observe that all bands suffer blue shifts up to 65 GPa also in general terms the linewidth increases for all bands However no great changes are observed indicating that the crystal structure
wwwintechopencom
Vibrational Spectroscopy
44
Fig 3 Raman spectra of PM under several pressure conditions from 00 to 118 GPa in the spectral range 250 ndash 750 cm-1
remains the same of that observed at 11 GPa In other words the crystal seems to be stable between 11 to 65 GPa But when pressure arrives to 78 GPa great modifications are observed in the 200 ndash 700 cm-1 spectral region Let us state these modifications (i) the appearance of a band (marked by an arrow in the spectrum taken at 78 GPa) in the region ~ 450 cm-1 (ii) an impressive fall of intensity and a red shift of the band associated to r(CO2-) (iii) a red shift of the two bands in the region 550 ndash 600 cm-1 (iv) the appearance of low intense bands (marked by an asterisk in the spectrum taken at 78 GPa) for wavenumbers higher than 600 cm-1 (v) the increase of intensity of the band initially assigned as scissoring of CO2- (vi) the appearance of a band at ~ 725 cm-1 Again the modifications in the spectra between 65 and 78 GPa presented in Figure 3 corroborate the fact that PM crystal undergoes a second phase transition as discussed previously When pressure is released down to 00 GPa whose spectrum is marked by 00 GPa we observe that the starting atmospheric spectrum is recovered as already observed in Figure 2 Figure 4 presents the Raman spectra of PM crystal under high pressure conditions with argon as compression medium in the region 600 to 1250 cm-1 We have cut off the peaks in the region close to 900 cm-1 because there is a peak with high intensity that makes difficult the visualization of the bands close to it this region will be discussed in Figure 5 In the Figure 4 we observe that several peaks are well defined (the peak marked by an asterisk is due a lamp used to calibrate the spectra) It is important to state that in the spectrum at 00
wwwintechopencom
High Pressure Raman Spectra of Amino Acid Crystals
45
Wavenumber (cm-1) Assignment Wavenumber (cm-1) Assignment
68 Lattice mode 950 (CCN)+(CC)
81 Lattice mode 982 v(CCN)+(CC)
99 Lattice mode 991 (CCN)+(CC)
120 Lattice mode 1031 (CCN)+(CC)
134 Lattice mode 1055 w(CH2)
149 Lattice mode 1079 w(CH2)
203 - 1084 r(CH2)
294 (skel) 1161 t(CH2)
373 (CCN) 1172 t(CH2)
447 r(CO2-) 2876 (CH)
574 (CO2-) 2898 (CH)
641 w(CO2-) 2932 (CH)
669 (skel) 2949 (CH)
695 sc(CO2-) 2971 (CH)
791 (skel) 2983 (CH)
840 r(CH2) 3006 (CH)
863 r(CH2) 3011 (CH)
897 r(NH2+) 3041 (NH)
918 (CCN)+(CC) 3068 (NH)
Table 1 Wavenumber (in cm-1) and approximate assignments of Raman bands for L-proline monohydrate crystal where def deformation bending r rocking w wagging sc scissoring stretching t twisting
GPa there are two peaks between 975 and 1000 cm-1 and in the spectrum taken at 11 GPa only one band is observed Another aspect that worth note is the fact that the band of highest energy (~ 1172 cm-1 at 00 GPa twisting of CH2 t(CH2)) splits in the spectrum taken at 11 GPa Above this last pressure the intensity of the peaks remains approximately constant up to 65 GPa Between 65 and 78 GPa the Raman spectrum presents great changes The band associated to the rocking of CH2 r(CH2) observed initially at ~ 840 cm-1 presents both a jump to high wavenumbers and an increasing in its linewidth A splitting is observed for the band marked by an star in the spectrum recorded at 65 GPa and observed initially at ~ 950 cm-1 which is associated to the stretching of CCN and CC units (CCN) + (CC) If one observe the band at 1033 cm-1 which is associated to the wagging of CH2 w(CH2) interestingly between 65 and 78 GPa it changes intensity with the band marked by a down arrow in the spectrum taken at 65 GPa so the w(CH2) band lost intensity and the band marked by a down arrow increases intensity Similarly the low intense bands observed between 1080 and 1200 cm-1 present great changes in their intensities between 65 and 78 GPa All these changes corroborate the modification in the crystal structure which occurs above 65 GPa which are reversible when pressure is released down to 00 GPa
wwwintechopencom
Vibrational Spectroscopy
46
Fig 4 Raman spectra of PM under several pressure conditions from 00 to 118 GPa in the spectral range 600 ndash 1250 cm-1
Figure 5 shows the Raman spectra of PM crystal in the 800 ndash 1100 cm-1 spectral region The dominant band in the spectrum taken at 00 GPa observed at 897 cm-1 is associated to the rocking vibration of NH2+ r(NH2+) The changes occurring in the first phase transition are not impressive but we note that between 65 and 78 GPa the band lost intensity and splits into two bands Above 78 GPa blue shifts of the wavenumbers are verified but no great change is present up to the highest pressure arrived in the experiment Decreasing pressure down to 00 GPa again we observe that the original spectrum is also recovered in this region In the spectral region presented in Figure 6 it is expected to be observed bands associated to the stretching vibrations of CH and CH2 units A theoretical study performed on L-methionine showed that different profiles of the Raman spectrum in this wavenumber range are associated with different conformations of the molecule In this sense when we observe the Raman spectra of PM as a function of pressure we note that between 00 and 11 GPa the most intense band at 00 GPa split into three bands (marked by up arrows) In the spectrum taken at 17 GPa the separation is very clear and when pressure is further increased the bands become clearly distinct But between 65 and 78 GPa the spectrum changes abruptly indicating that between these two pressure values the proline molecules undergo a great conformational change Because we have observed additionally changes in the low wavenumber region we can understand that both conformational change and structural phase transition take place for PM crystal As observed in the other spectral regions the original spectrum at 00 GPa is recovered when pressure is released
wwwintechopencom
High Pressure Raman Spectra of Amino Acid Crystals
47
Fig 5 Raman spectra of PM under several pressure conditions from 00 to 118 GPa in the spectral range 800 ndash 1100 cm-1
Data can give us some insights related to the behaviour of molecules of proline as the crystal is compressed For example in a previous study on -glycine the softening of a bending of CO2- was associated to a decrease in the intra-layer hydrogen bond strength while the stiffening of the same vibration was associated to an increase in the bond strength (Dawson et al 2005) For PM we have observed that the band associated to both bending of CO2- (CO2-) and rocking of CO2- r(CO2-) increase wavenumbers from 11 to 65 GPa and between 65 and 78 GPa decrease wavenumber for (CO2-) the decreasing is represented by the two dashed lines in Figure 3 between the spectra of 65 and 78 GPa We have also observed an additional increasing of wavenumbers for pressures higher than 78 GPa This suggests that the intra-layer hydrogen bond strength is stiffened up to 65 GPa between 65 and 78 GPa the hydrogen bond strength is softened and above 80 GPa the hydrogen bond is stiffened Additionally our results suggest that between 65 and 78 GPa occurs a structural rearrangement in such a way that the behaviour of the hydrogen bond strengths is changed This rearrangement is enough to change the symmetry of the crystal because
wwwintechopencom
Vibrational Spectroscopy
48
Fig 6 Raman spectra of PM under several pressure conditions from 00 to 118 GPa in the spectral range 2850 ndash 3200 cm-1
associated to it we observe great modifications in the Raman spectrum of low wavenumber region (Figure 2) Yet related to the phase transition between 65 and 78 GPa it is impressive the increase of intensity of a band in the spectrum taken at 65 GPa (marked by an arrow see Figure 4) which can be assigned as wagging of CH2 w(CH2) it change of intensity with the band close to it at ~ 1055 cm-1 at 00 GPa which is also assigned as w(CH2) indicating that a conformational change in the ring may also occurs when the crystal undergoes the phase transition at 65 - 78 GPa It is also interesting to note that the first transition occurs from a monoclinic to a phase with lower symmetry (another monoclinic our a triclinic phase) because in several regions including both internal and lattice mode spectral regions the number of peaks in the spectrum taken at 11 GPa is greater than the number of Raman peaks in the spectrum taken at 00 GPa It is also worth note that above 78 GPa almost all bands increases linewidth indicating that some disorder is introduced in the high pressure phase However the disorder does not occur in a high degree because when pressure is released down to 00 GPa the original spectrum is recovered It is known that the amorphization process is preceded by some disorder in the crystal structure however due to recovered of the original Raman spectrum after releasing pressure we can infer that when we arrive to 1118 GPa we are far away from the pressure point where eventually the PM crystal should present amorphization
wwwintechopencom
High Pressure Raman Spectra of Amino Acid Crystals
49
42 L-histidine hydrochloride monohydrate Related to the HHM (see Figure 8) which crystallizes in an orthorhombic structure belonging to the P212121 (D24) space group with four molecules of C6H9N3O2HClH2O per unit cell we were able to arrive up to 75 GPa and discovery a new polymorph of the material above 31 GPa The strong bond between N-H of the imidazole ring and the carboxyl group of a neighboring molecule is the fundamental intermolecular link resulting in a spiral arrangement along the c-axis (Donohue amp Caron 1964) The coupling of the four zwitterions in the unit cell leads to 297 optical normal modes decomposed into irreducible representations of the factor group D2 as Γop = 75 A + 74 (B1 + B2 + B3) and the acoustic modes can be expressed as Γac = B1 + B2 + B3 Under high pressure conditions modifications the Raman spectra are interpreted in terms of both conformational changes of the molecules in the unit cell and in terms of a phase transition Figure 9(a) presents the Raman spectra of HHM for several pressures in the spectral range from 50 to 660 cm-1 The region for wavenumbers lower than 200 cm-1 as previously stated is characteristic of the lattice vibration modes Increasing pressure we observe that the bands present blue shifts of their wavenumbers However between 27 and 31 GPa it is possible to note that a great change occurs in the Raman spectrum the peak marked by a square which is associated to torsion of CO2- (τ(CO2-)) splits in two new peaks which are marked by up arrows in the spectrum at 31 GPa In Figure 9(b) which presents the plot of experimental wavenumber as function of pressure we clearly observe the splitting of the band close to 180 cm-1 Additionally we note that for other bands discontinuities of wavenumbers are observed between 27 to 31 GPa (De Sousa et al 2011)
Fig 8 Unit cell of HHM seen along the b-axis
In this region it is also possible to observe many internal vibrations of the histidine molecule such as skeletal structure at 442 and 490 cm-1 torsion of NH3+ which is observed at 385 cm-1 and rocking of CO2- at 530 cm-1 Again as occurs with the spectra shown in the lattice mode region modifications are observed in the spectral range 27 - 31 GPa Among these changes we observed the disappearance of the bands at 276 and 500 cm-1 and the
wwwintechopencom
Vibrational Spectroscopy
50
Fig 9 (a) Raman spectra of HHM under several pressure conditions from 04 to 75 GPa in the spectral range 50 ndash 650 cm-1 (b) wavenumber versus pressure of the bands of HHM appearing in Fig 9(a)
appearance of a band at 473 cm-1 in the spectrum taken at 31 GPa We additionally note that the intensity of the band associated to torsion of NH3+ decreases with increasing pressure indicating that there occurs a conformational change of histidine molecule Such a conformational change can be understood as consequence of the change of the intermolecular hydrogen bond length With increasing pressure the band initially at 385 cm-
1 which is associated with a torsion vibration of the NH3+ unit shifts linearly toward higher wavenumbers we can say that the pressure decreases the length of the hydrogen bonds increasing the wavenumber of the band associated to torsional vibration of NH3+ unit Figure 10(a) presents the Raman spectra of HHM in the 650 ndash 1250 cm-1 interval for several pressure values up to 75 GPa In this spectral region it is expected to observe vibrations assigned to the deformation of CO2- stretching of both C-C and C-N wagging of H2O and rocking of NH3+ The band observed at ~ 694 cm-1 is associated to a deformation vibration of CO2- (CO2) while the out-of-plane vibration of CO2- (CO2) is observed at ~ 822 cm-1 The band at 807 cm-1 is associated with a wagging vibration of the water molecule w(H2O) The bands recorded at 1191 and 1210 cm-1 can be assigned as the rocking of NH3+ unit r(NH3+) In this spectral region some changes are observed in the range 27 ndash 31 GPa (i) the disappearance of the band at 694 cm-1 (ii) the appearance of a new weak band at 717 cm-1
(marked by a star in the Figure 10(a)) (iii) the inversion of intensity of the two bands located at 807 and 822 cm-1 which are related to units directly involved in the hydrogen bonds and (iv) the inversion of intensity of the two bands associated to a rocking of NH3+ unit r(NH3+) located at 1191 and 1210 cm-1 The dependence of the wavenumber versus pressure plot for this spectral region is presented in Fig 10(b) we note that many of the observed Raman modes show a small discontinuous change in the slope in the pressure-induced variation of its wavenumber in range 27 ndash 31 GPa
wwwintechopencom
High Pressure Raman Spectra of Amino Acid Crystals
51
Figure 11(a) shows the Raman spectra of the HHM crystal in the spectral range 1700-1400 cm-1 for pressure from 00 to 75 GPa Fig 11(b) shows the respective wavenumber vs pressure plots In this region one expects to observe vibrations assigned to a deformations of the imidazole ring of the histidine molecule asymmetric stretching of the CO2- units stretching of C=O among others In the Figure 11(a) two modifications are observed in the range 27 ndash 31 GPa The first change is the decreasing of the relative intensity of the band originally at 1433 cm-1 and the second one is the appearance of a band at 1642 cm-1 In the wavenumber versus pressure plot presented in Figure 11(b) a subtle discontinuity occurs in the range 27 ndash 31 GPa with appreciably differences in slopes where two modes change from positive to negative slopes
Fig 10 (a) Raman spectra of HHM under several pressure conditions from 04 to 75 GPa in the spectral range 650 ndash 1250 cm-1 (b) wavenumber versus pressure of the bands of HHM appearing in Fig 10(a)
The Raman spectra of HHM crystal in the range 3450-3125 cm-1 are shown in the Figure 12(a) and in the Figure 12(b) the respective wavenumber versus pressure plots are given In this region we expected to observe stretching vibrations of several units of the amino acids and of the water molecule (CH NH3+ and OH-) It is important to note that for wavenumbers lower than 3000 cm-1 there are some modes related to the mineral oil used as compression media In detail the band at 3111 cm-1 can be associated to a stretching vibration of NH3+ unit (NH3+) while the bands observed at 3155 and 3163 cm-1 are associated to a CH stretching vibration of imidazole ring The bands observed at 3374 and 3408 cm-1 are related to the OH- stretching of the water molecules In the pressure range 27 ndash 31 GPa main changes are observed such as the disappearance of the bands related to a OH- stretching vibration (initially located at 3367 and 3393 cm-1) the appearance of a band of weak intensity at 3424 cm-1 and discontinuities of the wavenumber curve of bands at 3155 and 3163 cm-1 which are associated with the CH stretching vibration
wwwintechopencom
Vibrational Spectroscopy
52
Fig 11 (a) Raman spectra of HHM under several pressure conditions from 04 to 75 GPa in the spectral range 1400 ndash 1670 cm-1 (b) wavenumber versus pressure of the bands of HHM appearing in Fig 11(a)
Fig 12 (a) Raman spectra of HHM under several pressure conditions from 04 to 75 GPa in the spectral range 2950 ndash 3450 cm-1 (b) wavenumber versus pressure of the bands of HHM appearing in Fig 12(a)
wwwintechopencom
High Pressure Raman Spectra of Amino Acid Crystals
53
Table 2 gives a quantitative analysis of the evolution of the Raman spectra of HHM crystal with pressure where fitting of all bands to a linear expression ω = ω0 + P is furnished In Table 2 the first column (ωobs) represents the wavenumber of the Raman bands observed at room pressure the second and third columns correspond to adjustment of data for pressure values between 0 and 27 GPa and the two last columns correspond to fitting of the high-pressure phase that observed between 31 and 75 GPa A resume of the modifications observed in all spectral regions of the Raman spectra of HHM is as follows (i) splitting of the band in the low-wavenumber lattice range (ii) change in the number of bands associated to internal modes (iii) wavenumber shifts with discontinuities (iv) changes in the relative intensities of the vibrational bands It is important to state that changes were observed for the deformation vibrations of the OH- of the water molecule as well as of the NH3+ and CO2- groups of the amino acid molecule This picture indicates large conformational changes of the molecules in the unit cell Related to HHM beyond the hydrogen bonds originated from the histidine molecule there are two hydrogen bonds from the water molecule It is interesting to note from Figure 12(b) that the wavenumber of OH- stretching (OH-) decreases with increasing pressure However the OH units participate of hydrogen bonds one to a carboxyl oxygen and another to the chloride ion This means that between 00 and 31 GPa the hydrogen bond strength increases and the wavenumber of(OH-) decreases in this pressure range Also after the phase transition the wavenumber of (OH-) suffers a jump and continues to decrease up to the highest pressure obtained in our experiments Such a picture indicates a further increase of the hydrogen bonds formed by the water molecules and confirms that these bonds are playing an important role in the mechanism of the transition It is interesting to note that similar changes in the low-wavenumber region were also observed for the same crystal when subjected to low temperatures
ωobs
(cm-1)
Phase 1
(0 le P le 27 GPa) Phase 2
(31 le P le 75 GPa)
ω0
(cm-1)
(cm-1)(GPa)-1 ω0
(cm-1)
(cm-1)(GPa)-1
94 945 0669 937 -0103
105 1052 0276 1002 1771
121 1214 -1087 1109 2092
136 1357 1616 1360 0623
149 1497 2128 - -
159 1568 8033 1483 8105
- - - 1639 9960
188 1891 7661 1902 8059
270 2697 3093 - -
293 2919 6118 2945 7683
385 3846 7236 4015 1675
442 4423 1223 4423 1461
wwwintechopencom
Vibrational Spectroscopy
54
ωobs
(cm-1)
Phase 1
(0 le P le 27 GPa) Phase 2
(31 le P le 75 GPa)
ω0
(cm-1)
(cm-1)(GPa)-1 ω0
(cm-1)
(cm-1)(GPa)-1
- - - 4707 0785
491 490 5 3319 - -
530 5304 4335 - -
609 6078 5312 6208 2463
693 6935 1529 - -
- - - 7064 3449
807 8067 2042 8047 1467
824 8240 -0498 8204 1442
838 8361 7335 8504 3124
875 8734 6438 8881 2777
917 9173 0810 9187 2356
963 9630 2757 9636 2411
980 9787 4489 9787 5206
1068 10667 4790 10732 3418
1141 11403 1890 11403 2744
1162 11619 2611 11674 1120
1190 11900 2277 11885 1637
1208 12079 2859 12101 1341
1434 14345 1316 14382 0846
1448 14481 3059 14554 1677
1463 14621 4415 14760 0778
1481 14813 4238 14970 -0619
1609 16093 2739 16166 -0374
- - - 16249 2736
3111 31110 0919 31045 2914
3154 31546 1287 31532 6564
3164 31626 5305 31593 7905
3375 33739 -2638 - -
3407 34081 -5745 - -
- - - 34371 -3169
Table 2 Wavenumber values of the bands appearing in the HHM spectrum at 00 GPa (ωobs) and adjustment data by linear fitting (P) for the two phases
wwwintechopencom
High Pressure Raman Spectra of Amino Acid Crystals
55
5 Conclusions
The results suggested that L-proline monohydrate undergoes two phase transitions one between 00 and 11 GPa and a second between 65 and 78 GPa In both transitions it was possible to observed changes in the spectrum profile discontinuities in the wavenumber versus pressure plots in the lattice region of the spectrum and the appearance of news bands By releasing the pressure after attaining a maximum of 118 GPa the atmospheric pressure spectrum was fully recovered showing that the pressure-induced transitions undergone by polycrystalline L-proline crystal are reversible In the first transition it was observed the splitting of bands associated to (CCN) (CO2-) and (CH) vibrations The band associated to (skel) has disappeared In the second one we have observed the red shift of r(CO2-) significant changes in the intensity of the bands associated to the sc(CO2-) and w(CH2) vibrations and the splits of (CCN) + (CC) and r(NH2+) that also has lost intensity These modifications were interpreted as conformational changes of molecules in the unit cell Because these changes involve moieties that participate in hydrogen bonds we suppose that these hydrogen bonds have also been modified Modifications of hydrogen bonds can trigger some molecular rearrangements that lead to structural phase transitions In our work this hypothesis was supported by the changes that were observed in the region of the lattice modes for both phase transitions Therefore the results suggested two structural phase transitions one between 00 and 11 GPa and another between 65 and 78 GPa accompanied by significant conformational changes of molecules in the L-proline monohydrated crystal The results also suggest that HHM crystal undergoes a phase transition between 27 and 31 GPa when it is submitted to high pressure conditions up to 75 GPa The main changes observed in the Raman spectra was the splitting of the band in the low-wavenumber lattice range change in the number of bands associated to internal modes and wavenumber shifts with discontinuities Having described the behavior of two amino acid crystals under pressure and looked back at the past fourteen years of research we can ask to ourselves what does the future hold Based on the studies performed we believe that the use of several techniques such as neutron and Raman scattering as well as thermal and infrared analyses can help us to give a complete picture about hydrogen bond and the behavior of amino acids under pressure Maybe the study of peptide under similar external conditions should be the next road to be walked
6 Acknowledgment
Authors acknowledge CAPES CNPq and FUNCAP for financial support
7 References
Barthes M Bordallo HN Deacutenoyer F Lorenzo J-E Zaccaro J Robert A amp Zontone F (2004) Micro-transitions or breathers in L-alanine The European Physical Journal B Vol 37 No 3 (February 2004) pp 375-382 ISSN 1434-6028
Boldyreva EV Drebushchak VA Drebushchak TN Paukov IE Kovalevskaya YA amp Shutova ES (2003a) Polymorphism of glycine Part I Journal of Thermal Analysis and Calorimetry Vol 73 No 2 (August 2003) pp 409-418 ISSN 1388-6150
wwwintechopencom
Vibrational Spectroscopy
56
Boldyreva EV Drebushchak VA Drebushchak TN Paukov IE Kovalevskaya YA amp Shutova ES (2003b) Polymorphism of glycine Part II Journal of Thermal Analysis and Calorimetry Vol 73 No 2 (August 2003) pp 419-428 ISSN 1388-6150
Boldyreva EV Ivashevskaya SN Sowa H Ahsbahs H amp Weber H-P (2004) Effect of High Pressure on Crystalline Glycine A New High-Pressure Polymorph Doklady Physical Chemistry Vol 396 No 1 (May 2004) pp 111-114 ISSN 0012-5016
Boldyreva EV Ivashevskaya SN Sowa H Ahsbahs H amp Weber H-P (2005a) Effect of hydrostatic pressure on the -polymorph of glycine 1 A polymorphic transition into a new -form Zeitschrift fuumlr Kristallographie Vol 220 No 1 ( January 2005) pp 50- 57 ISSN 0044-2968
Boldyreva EV Kolesnik EN Drebushchak TN Ahsbahs H Beukes JA amp Weber H-P (2005b) A comparative study of the anisotropy of a lattice strain induced in the crystals of L-serine by cooling down to 100 K or by increasing pressure up to 44 GPa Zeitschrift fuumlr Kristallographie Vol 220 No 1 (January 2005) pp 58- 65 ISSN 0044-2968
Boldyreva EV Kolesnik EN Drebushchak TN Ahsbahs H amp Seryotkin YV (2006a) A comparative study of the anisotropy of a lattice strain induced in the crystals of DL-serine by cooling down to 100 K or by increasing pressure up to 86 GPa A comparison with L-serine Zeitschrift fuumlr Kristallographie Vol 221 No 2 (2006) pp 150- 161 ISSN 0044-2968
Boldyreva EV Sowa H Seryotkin YV Drebushchak TN Ahsbahs H Chernyshev V amp Dmitriev V (2006b) Pressure-induced phase transitions in crystalline L-serine studied by single crystal and gigh-resolution powder X-ray diffraction Chemical Physics Letters Vol 429 No 4-6 (October 2006) pp 474-478 ISSN 0009-2614
Boldyreva E (2007a) Cristalline Amino Acids A Link between Chemistry Materials Science and Biology In Models Mysteries and Magic of Molecules Boeyens JCA amp Ogilvie JF pp 167-192 Springer ISBN 978-1-4020-5940-7 Netherlands
Boldyreva E (2007b) High-Pressure Polymorphs of Molecular Solids When Are They Formed and When Are They Not Some Examples of the Role of Kinetic Control Crystal Growth amp Design Vol 7 No 9 (August 2007) pp 1662-1668 ISSN 1528-7483
Dawson A Allan DR Belmonte SA Clark SJ David WIF McGregor PA Parsons S Pulham CR amp Sawyer L (2005) Effect of high pressure on the crystal structures of polymorphs of glycine Crystal Growth amp Design Vol 5 No 4 (May 2005) pp 1415-1427 ISSN 1528-7483
Destro R Marsh RE amp Bianchi R (1988) A low-temperature (23K) study of L-alanine The Journal of Physical Chemistry Vol 92 No 4 (February 1988) pp 966-973 ISSN 0022-3654
De Sousa GP Freire PTC Lima Jr JA Mendes Filho J amp Melo FEA (2011) High-pressure Raman spectra of L-histidine hydrochloride monohydrate cristal Vibrational Spectroscopy Vol 57 No 1 (September 2011) pp 102-107 ISSN 0924-2031
Donohue J amp Caron A (1964) Refinement of cristal structure of histidine hydrochloride monohydrate Acta Crystallographica Vol 17 No 9 (September 1964) pp 1178-amp ISSN 0108-7673
wwwintechopencom
High Pressure Raman Spectra of Amino Acid Crystals
57
Faccedilanha Filho PF Freire PTC Lima KCV Mendes Filho J Melo FEA amp Pizani PS (2008) High temperature Raman spectra of L-leucine crystals Brazilian Journal of Physics Vol 38 No 1 (March 2008) pp 131-137 ISSN 0103-9733
Faccedilanha Filho PF Freire PTC Melo FEA Lemos V Mendes Filho J Pizani PS amp Rossatto DZ (2009) Pressure-induced phase transitions in L-leucine crystal Journal of Raman Spectroscopy Vol 40 No 1 (January 2009) pp 46-51 ISSN 1097-4555
Freire PTC (2010) Pressure-Induced Phase Transitions in Crystalline Amino Acids In High Pressure Crystallography ndash From Fundamental Phenomena to Technological Applications Boldyreva E amp Dera P pp 559-572 Springer ISBN 978-904-8192-60-1 New York USA
Funnel NP Dawson A Francis D Lennie DR Marshall WG Moggach SA Warren JE amp Parsons S (2010) The effect of pressure on the crystal structure of l-alanine CrystEngComm Vol 12 No 9 (September 2010) pp 2573-2583 ISSN 1466-8033
Goryainov SV Kolesnik EN amp Boldyreva EV (2005) A reversible pressure-induced phase transition in -glycine at 076 GPa Physica B Condensed Matter Vol 357 No 3-4 (March 2005) pp 340-347 ISSN 0921-4526
Goryainov SV Kolesnik EN amp Boldyreva EV (2006) Raman observation of a new (ζ) polymorph of glycine Chemical Physics Letters Vol 419 No 4-6 (February 2006) pp 496-500 ISSN 0009-2614
Harding MM amp Howieson RM (1976) L-Leucine Acta Crystallographica Section B Vol 32 No 2 (February 1976) pp 633-634 ISSN 1600-5740
Herlinger AW amp Long TV (1970) Laser Raman and infrared spectra of amino acids and their metal complexes 3 Proline and bisprolinato complexes Journal of the American Chemical Society Vol 92 No 22 (November 1970) pp 6481-6486 ISSN 0002-7863
Hermiacutenio da Silva J Lemos V Freire PTC Melo FEA Mendes Filho J Lima Jr JA amp Pizani PS (2009) Stability of the crystal structure of L-valine under high pressure Physica Status Solidi B Vol 246 No 3 (March 2009) pp 553-557 ISSN 0370-1972
Lima JA Freire PTC Melo FEA Lemos V Mendes Filho J amp Pizani PS (2008) High pressure Raman spectra of L-methionine Crystal Journal of Raman Spectroscopy Vol 39 No 10 (October 2008) pp 1356-1363 ISSN 1097-4555
Migliori A Maxton PM Clogston AM Zirngiebl E amp Lowe M (1988) Anomalous temperature dependence in the Raman spectra of l-alanine Evidence for dynamic localization Physical Review B Vol 38 No 18 (December 1988) pp 13464-13467 ISSN 1098-0121
Minkov VS Krylov AS Boldyreva EV Goryainov SN Bizyaev SN amp Vtyurin AN (2008) Pressure-Induced Phase Transitions in Crystalline L- and DL-Cysteine The Journal of Physical Chemistry B Vol 112 No 30 (July 2008) pp 8851-8854 ISSN 1520-6106
Minkov VS Goryainov SV Boldyreva EV amp Goumlrbitz CH (2010) Raman study of pressure-induced phase transitions in the crystals of orthorhombic and monoclinic polymorphs of L-cysteine dynamics of the side-chain Journal of Raman Spectroscopy Vol 41 No 12 (December 2010) pp 1458-1468 ISSN 1097-4555
Moggach SA Allan DR Morrison PA Parsons S amp Sawyer L (2005) Effect of pressure on the crystal structure of L-serine-I and the crystal structure of L-serine-II
wwwintechopencom
Vibrational Spectroscopy
58
at 54 GPa Acta Crystallographica Section B Vol 61 No 1 (February 2005) pp 58-68 ISSN 0108-7681
Moggach SA Marshall WG amp Parsons S (2006) High-pressure neutron diffraction study of L-serine-I and L-serine-II and the structure of L-serine-III at 81 GPa Acta Crystallographica Section B Vol 62 No 5 (October 2006) pp 815-825 ISSN 0108-7681
Moreno AJD Freire PTC Melo FEA Arauacutejo-Silva MA Guedes I Mendes Filho J (1997) Pressure-induced phase transitions in monohydrated l-asparagine aminoacid crystals Solid State Communications Vol 103 No 12 (September 1997) pp 655-658 ISSN 0038-1098
Murli C Sharma SK Karmakar S amp Sikka SK (2003) -Glycine under high pressures a Raman scattering study Physica B Condensed Matter Vol 339 No 1 (November 2003) pp 23-30 ISSN 0921-4526
Murli C Vasanthi R amp Sharma SM (2006) Raman spectroscopic investigations of DL-serine and DL-valine under pressure Chemical Physics Vol 331 No 1 (December 2006) pp 77-84 ISSN 0301-0104
Olsen JS Gerward L Freire PTC Mendes Filho J Melo FEA amp Souza Filho AG (2008) Pressure-induced phase transitions in L-alanine crystals Journal of Physics and Chemistry of Solids Vol 69 No 7 (July 2008) pp 1641-1645 ISSN 0022-3697
Sabino AS De Sousa GP Luz-Lima C Freire PTC Melo FEA amp Mendes Filho J (2009) High-pressure Raman spectra of L-isoleucine crystals Solid State Communications Vol 149 No 37-38 (October 2009) pp 1553-1556 ISSN 0038-1098
Sasaki JM Freire PTC Moreno AJD Melo FEA Guedes I Mendes Filho J Shu J Hu J amp Matildeo HK (2000) Single crystal X-ray diffraction in monohydrate L-asparagine under hydrostatic pressure Science and Technology of High Pressure Proceedings of AIRAPT-17 Hyderabad India 2000
Seijas LE Delgado GE Mora AJ Fitch AN amp Brunelli M (2010) On the Crystal structures and hydrogen bond patterns in proline pseudopolymorphs Powder Diffraction Vol 25 No 3 (September 2010) pp 235-240 ISSN 0885-7156
Silva BL Freire PTC Melo FEA Mendes Filho J Pimenta MA amp Dantas MSS (2000) High-pressure Raman spectra of L-threonine crystal Journal of Raman Spectroscopy Vol 31 No 6 (June 2000) pp 519-522 ISSN 1097-4555
Teixeira AMR Freire PTC Moreno AJD Sasaki JM Ayala AP Mendes Filho J amp Melo FEA (2000) High-pressure Raman study of l-alanine crystal Solid State Communications Vol 116 No 7 (October 2000) pp 405-409 ISSN 0038-1098
Tumanov NA Boldyreva EV Kolesov BA Kurnosov AV amp Quesada Cabrera R (2010) Pressure-induced phase transitions in L-alanine revisited Acta Crystallographica Section B Vol 66 No 4 (August 2010) pp 458-371 ISSN 1600-5740
Yamashita M Inomata S Ishikawa K Kashiwagi T Matsuo H Sawamura S amp Kato M (2007) A high-pressure polymorph of L--leucine Acta Crystallographica Section E Vol 63 No 5 (May 2007) pp o2762-o2764 ISSN 1600-5368
wwwintechopencom
Vibrational SpectroscopyEdited by Prof Dominique De Caro
ISBN 978-953-51-0107-9Hard cover 168 pagesPublisher InTechPublished online 24 February 2012Published in print edition February 2012
InTech EuropeUniversity Campus STeP Ri Slavka Krautzeka 83A 51000 Rijeka Croatia Phone +385 (51) 770 447 Fax +385 (51) 686 166wwwintechopencom
InTech ChinaUnit 405 Office Block Hotel Equatorial Shanghai No65 Yan An Road (West) Shanghai 200040 China
Phone +86-21-62489820 Fax +86-21-62489821
The infrared and Raman spectroscopy have applications in numerous fields namely chemistry physicsastronomy biology medicine geology mineralogy etc This book provides some examples of the use ofvibrational spectroscopy in supramolecular chemistry inorganic chemistry solid state physics but also in thefields of molecule-based materials or organic-inorganic interfaces
How to referenceIn order to correctly reference this scholarly work feel free to copy and paste the following
Paulo de Tarso Cavalcante Freire Joseacute Alves Lima Juacutenior Bruno Tavares de Oliveira Abagaro Gardecircnia deSousa Pinheiro Joseacute de Arimateacutea Freitas e Silva Josueacute Mendes Filho and Francisco Erivan de Abreu Melo(2012) High Pressure Raman Spectra of Amino Acid Crystals Vibrational Spectroscopy Prof Dominique DeCaro (Ed) ISBN 978-953-51-0107-9 InTech Available from httpwwwintechopencombooksvibrational-spectroscopyhigh-pressure-raman-spectra-of-amino-acid-crystals
copy 2012 The Author(s) Licensee IntechOpen This is an open access articledistributed under the terms of the Creative Commons Attribution 30License which permits unrestricted use distribution and reproduction inany medium provided the original work is properly cited

High Pressure Raman Spectra of Amino Acid Crystals
43
points to the existence of six bands between 10 and 160 cm-1 When pressure is increased great changes are observed in the Raman profile of the spectrum At 11 GPa the Raman spectrum of L-proline is very different from that obtained at 00 GPa (i) the mode peaked at ~ 68 cm-1 becomes the most intense band in the spectrum at 11 GPa (ii) the most intense peak in the spectrum taken at 00 GPa decreases intensity and in the spectrum taken at 11 GPa it is only the second most intense peak in the region 10 ndash 250 cm-1 (iii) the peaks marked by arrows in the spectrum at 00 GPa increase intensity Such a set of modifications point to the possibility of the occurrence of a phase transition undergone by polycrystalline L-proline for pressures below 11 GPa Results on other spectral regions of the Raman spectrum will reinforce this hypothesis It is observed a gradual change of intensity of all bands appearing in the Raman spectra of Figure 2 as well as continuous blue shifts of all wavenumbers when pressure is increased from 111 to 65 GPa The gradual change of the profiles of the Raman spectrum can be interpreted as continuous changes of the conformation of the molecules of L-proline in the unit cell of the crystal However between 65 and 78 GPa it is observed a strong change in the profile of the Raman spectrum in the low wavenumber region In particular the most intense band observed in the spectrum taken at 65 GPa lost intensity becoming one of the peaks with lowest intensity Additionally jump in the wavenumber of almost all bands are also verified in this pressure interval (65 - 78 GPa) As a consequence we have interpreted the changes of the Raman spectrum as a phase transition undergone by polycrystalline L-proline between 65 and 78 GPa Other evidences will be shown in the next paragraphs Finally when we decrease pressure from the highest value obtained in our experiments down to atmospheric pressure we observe that the original spectrum ndash bottom spectrum in Figure 2 ndash is recovered (the final spectrum is marked as 00 GPa) Figure 3 presents the Raman spectra of PM crystal for several pressures in the spectral range 200 ndash 750 cm-1 According to Ref (Herlinger amp Long 1970) (see also Table 1) the band recorded close to 294 cm-1 in the 00 GPa spectrum can be associated to a deformation vibration of the skeleton of the structure (skel) The bands observed at 377 and 447 cm-1 are associated respectively to the bending of CCN (CCN) and rocking of CO2- r(CO2-) In fact for other amino acid crystals it has been reported that the r(CO2-) is the most intense band in the 200 ndash 700 cm-1 spectral range However for the other amino acids differently from L-proline the r(CO2-) mode is observed for wavenumber higher than 500 cm-1 (-glycine 503 cm-1 (Dawson et al 2005) L-alanine 532 cm-1 L-valine 542 cm-1 (Goryainov et al 2005) DL-alanine 543 cm-1 etc) Finally in the spectrum taken at 00 GPa we can observe a band at 574 cm-1 which was associated to a bending of CO2- group Finally bands at 641 669 and 695 cm-1 were associated respectively to wagging of CO2- w(CO2-) (skel) and scissoring of CO2- sc(CO2-) By increasing the pressure we observe that between 00 and 11 GPa some important modifications are present For example the band (CCN) decreases intensity and seems to split A clear splitting is observed for the band at 574 cm-1 and the r(CO2-) band at 447 cm-1 begins to present a shoulder in the high wavenumber side Additionally the (skel) band at 669 cm-1 (marked by an asterisk in the spectrum of 00 GPa) disappears between the two lowest pressure spectra This entire complex picture corroborates the fact that the crystal is undergoing a phase transition between 00 and 11 GPa If one continues to increase pressure on the PM crystal it is possible to observe that all bands suffer blue shifts up to 65 GPa also in general terms the linewidth increases for all bands However no great changes are observed indicating that the crystal structure
wwwintechopencom
Vibrational Spectroscopy
44
Fig 3 Raman spectra of PM under several pressure conditions from 00 to 118 GPa in the spectral range 250 ndash 750 cm-1
remains the same of that observed at 11 GPa In other words the crystal seems to be stable between 11 to 65 GPa But when pressure arrives to 78 GPa great modifications are observed in the 200 ndash 700 cm-1 spectral region Let us state these modifications (i) the appearance of a band (marked by an arrow in the spectrum taken at 78 GPa) in the region ~ 450 cm-1 (ii) an impressive fall of intensity and a red shift of the band associated to r(CO2-) (iii) a red shift of the two bands in the region 550 ndash 600 cm-1 (iv) the appearance of low intense bands (marked by an asterisk in the spectrum taken at 78 GPa) for wavenumbers higher than 600 cm-1 (v) the increase of intensity of the band initially assigned as scissoring of CO2- (vi) the appearance of a band at ~ 725 cm-1 Again the modifications in the spectra between 65 and 78 GPa presented in Figure 3 corroborate the fact that PM crystal undergoes a second phase transition as discussed previously When pressure is released down to 00 GPa whose spectrum is marked by 00 GPa we observe that the starting atmospheric spectrum is recovered as already observed in Figure 2 Figure 4 presents the Raman spectra of PM crystal under high pressure conditions with argon as compression medium in the region 600 to 1250 cm-1 We have cut off the peaks in the region close to 900 cm-1 because there is a peak with high intensity that makes difficult the visualization of the bands close to it this region will be discussed in Figure 5 In the Figure 4 we observe that several peaks are well defined (the peak marked by an asterisk is due a lamp used to calibrate the spectra) It is important to state that in the spectrum at 00
wwwintechopencom
High Pressure Raman Spectra of Amino Acid Crystals
45
Wavenumber (cm-1) Assignment Wavenumber (cm-1) Assignment
68 Lattice mode 950 (CCN)+(CC)
81 Lattice mode 982 v(CCN)+(CC)
99 Lattice mode 991 (CCN)+(CC)
120 Lattice mode 1031 (CCN)+(CC)
134 Lattice mode 1055 w(CH2)
149 Lattice mode 1079 w(CH2)
203 - 1084 r(CH2)
294 (skel) 1161 t(CH2)
373 (CCN) 1172 t(CH2)
447 r(CO2-) 2876 (CH)
574 (CO2-) 2898 (CH)
641 w(CO2-) 2932 (CH)
669 (skel) 2949 (CH)
695 sc(CO2-) 2971 (CH)
791 (skel) 2983 (CH)
840 r(CH2) 3006 (CH)
863 r(CH2) 3011 (CH)
897 r(NH2+) 3041 (NH)
918 (CCN)+(CC) 3068 (NH)
Table 1 Wavenumber (in cm-1) and approximate assignments of Raman bands for L-proline monohydrate crystal where def deformation bending r rocking w wagging sc scissoring stretching t twisting
GPa there are two peaks between 975 and 1000 cm-1 and in the spectrum taken at 11 GPa only one band is observed Another aspect that worth note is the fact that the band of highest energy (~ 1172 cm-1 at 00 GPa twisting of CH2 t(CH2)) splits in the spectrum taken at 11 GPa Above this last pressure the intensity of the peaks remains approximately constant up to 65 GPa Between 65 and 78 GPa the Raman spectrum presents great changes The band associated to the rocking of CH2 r(CH2) observed initially at ~ 840 cm-1 presents both a jump to high wavenumbers and an increasing in its linewidth A splitting is observed for the band marked by an star in the spectrum recorded at 65 GPa and observed initially at ~ 950 cm-1 which is associated to the stretching of CCN and CC units (CCN) + (CC) If one observe the band at 1033 cm-1 which is associated to the wagging of CH2 w(CH2) interestingly between 65 and 78 GPa it changes intensity with the band marked by a down arrow in the spectrum taken at 65 GPa so the w(CH2) band lost intensity and the band marked by a down arrow increases intensity Similarly the low intense bands observed between 1080 and 1200 cm-1 present great changes in their intensities between 65 and 78 GPa All these changes corroborate the modification in the crystal structure which occurs above 65 GPa which are reversible when pressure is released down to 00 GPa
wwwintechopencom
Vibrational Spectroscopy
46
Fig 4 Raman spectra of PM under several pressure conditions from 00 to 118 GPa in the spectral range 600 ndash 1250 cm-1
Figure 5 shows the Raman spectra of PM crystal in the 800 ndash 1100 cm-1 spectral region The dominant band in the spectrum taken at 00 GPa observed at 897 cm-1 is associated to the rocking vibration of NH2+ r(NH2+) The changes occurring in the first phase transition are not impressive but we note that between 65 and 78 GPa the band lost intensity and splits into two bands Above 78 GPa blue shifts of the wavenumbers are verified but no great change is present up to the highest pressure arrived in the experiment Decreasing pressure down to 00 GPa again we observe that the original spectrum is also recovered in this region In the spectral region presented in Figure 6 it is expected to be observed bands associated to the stretching vibrations of CH and CH2 units A theoretical study performed on L-methionine showed that different profiles of the Raman spectrum in this wavenumber range are associated with different conformations of the molecule In this sense when we observe the Raman spectra of PM as a function of pressure we note that between 00 and 11 GPa the most intense band at 00 GPa split into three bands (marked by up arrows) In the spectrum taken at 17 GPa the separation is very clear and when pressure is further increased the bands become clearly distinct But between 65 and 78 GPa the spectrum changes abruptly indicating that between these two pressure values the proline molecules undergo a great conformational change Because we have observed additionally changes in the low wavenumber region we can understand that both conformational change and structural phase transition take place for PM crystal As observed in the other spectral regions the original spectrum at 00 GPa is recovered when pressure is released
wwwintechopencom
High Pressure Raman Spectra of Amino Acid Crystals
47
Fig 5 Raman spectra of PM under several pressure conditions from 00 to 118 GPa in the spectral range 800 ndash 1100 cm-1
Data can give us some insights related to the behaviour of molecules of proline as the crystal is compressed For example in a previous study on -glycine the softening of a bending of CO2- was associated to a decrease in the intra-layer hydrogen bond strength while the stiffening of the same vibration was associated to an increase in the bond strength (Dawson et al 2005) For PM we have observed that the band associated to both bending of CO2- (CO2-) and rocking of CO2- r(CO2-) increase wavenumbers from 11 to 65 GPa and between 65 and 78 GPa decrease wavenumber for (CO2-) the decreasing is represented by the two dashed lines in Figure 3 between the spectra of 65 and 78 GPa We have also observed an additional increasing of wavenumbers for pressures higher than 78 GPa This suggests that the intra-layer hydrogen bond strength is stiffened up to 65 GPa between 65 and 78 GPa the hydrogen bond strength is softened and above 80 GPa the hydrogen bond is stiffened Additionally our results suggest that between 65 and 78 GPa occurs a structural rearrangement in such a way that the behaviour of the hydrogen bond strengths is changed This rearrangement is enough to change the symmetry of the crystal because
wwwintechopencom
Vibrational Spectroscopy
48
Fig 6 Raman spectra of PM under several pressure conditions from 00 to 118 GPa in the spectral range 2850 ndash 3200 cm-1
associated to it we observe great modifications in the Raman spectrum of low wavenumber region (Figure 2) Yet related to the phase transition between 65 and 78 GPa it is impressive the increase of intensity of a band in the spectrum taken at 65 GPa (marked by an arrow see Figure 4) which can be assigned as wagging of CH2 w(CH2) it change of intensity with the band close to it at ~ 1055 cm-1 at 00 GPa which is also assigned as w(CH2) indicating that a conformational change in the ring may also occurs when the crystal undergoes the phase transition at 65 - 78 GPa It is also interesting to note that the first transition occurs from a monoclinic to a phase with lower symmetry (another monoclinic our a triclinic phase) because in several regions including both internal and lattice mode spectral regions the number of peaks in the spectrum taken at 11 GPa is greater than the number of Raman peaks in the spectrum taken at 00 GPa It is also worth note that above 78 GPa almost all bands increases linewidth indicating that some disorder is introduced in the high pressure phase However the disorder does not occur in a high degree because when pressure is released down to 00 GPa the original spectrum is recovered It is known that the amorphization process is preceded by some disorder in the crystal structure however due to recovered of the original Raman spectrum after releasing pressure we can infer that when we arrive to 1118 GPa we are far away from the pressure point where eventually the PM crystal should present amorphization
wwwintechopencom
High Pressure Raman Spectra of Amino Acid Crystals
49
42 L-histidine hydrochloride monohydrate Related to the HHM (see Figure 8) which crystallizes in an orthorhombic structure belonging to the P212121 (D24) space group with four molecules of C6H9N3O2HClH2O per unit cell we were able to arrive up to 75 GPa and discovery a new polymorph of the material above 31 GPa The strong bond between N-H of the imidazole ring and the carboxyl group of a neighboring molecule is the fundamental intermolecular link resulting in a spiral arrangement along the c-axis (Donohue amp Caron 1964) The coupling of the four zwitterions in the unit cell leads to 297 optical normal modes decomposed into irreducible representations of the factor group D2 as Γop = 75 A + 74 (B1 + B2 + B3) and the acoustic modes can be expressed as Γac = B1 + B2 + B3 Under high pressure conditions modifications the Raman spectra are interpreted in terms of both conformational changes of the molecules in the unit cell and in terms of a phase transition Figure 9(a) presents the Raman spectra of HHM for several pressures in the spectral range from 50 to 660 cm-1 The region for wavenumbers lower than 200 cm-1 as previously stated is characteristic of the lattice vibration modes Increasing pressure we observe that the bands present blue shifts of their wavenumbers However between 27 and 31 GPa it is possible to note that a great change occurs in the Raman spectrum the peak marked by a square which is associated to torsion of CO2- (τ(CO2-)) splits in two new peaks which are marked by up arrows in the spectrum at 31 GPa In Figure 9(b) which presents the plot of experimental wavenumber as function of pressure we clearly observe the splitting of the band close to 180 cm-1 Additionally we note that for other bands discontinuities of wavenumbers are observed between 27 to 31 GPa (De Sousa et al 2011)
Fig 8 Unit cell of HHM seen along the b-axis
In this region it is also possible to observe many internal vibrations of the histidine molecule such as skeletal structure at 442 and 490 cm-1 torsion of NH3+ which is observed at 385 cm-1 and rocking of CO2- at 530 cm-1 Again as occurs with the spectra shown in the lattice mode region modifications are observed in the spectral range 27 - 31 GPa Among these changes we observed the disappearance of the bands at 276 and 500 cm-1 and the
wwwintechopencom
Vibrational Spectroscopy
50
Fig 9 (a) Raman spectra of HHM under several pressure conditions from 04 to 75 GPa in the spectral range 50 ndash 650 cm-1 (b) wavenumber versus pressure of the bands of HHM appearing in Fig 9(a)
appearance of a band at 473 cm-1 in the spectrum taken at 31 GPa We additionally note that the intensity of the band associated to torsion of NH3+ decreases with increasing pressure indicating that there occurs a conformational change of histidine molecule Such a conformational change can be understood as consequence of the change of the intermolecular hydrogen bond length With increasing pressure the band initially at 385 cm-
1 which is associated with a torsion vibration of the NH3+ unit shifts linearly toward higher wavenumbers we can say that the pressure decreases the length of the hydrogen bonds increasing the wavenumber of the band associated to torsional vibration of NH3+ unit Figure 10(a) presents the Raman spectra of HHM in the 650 ndash 1250 cm-1 interval for several pressure values up to 75 GPa In this spectral region it is expected to observe vibrations assigned to the deformation of CO2- stretching of both C-C and C-N wagging of H2O and rocking of NH3+ The band observed at ~ 694 cm-1 is associated to a deformation vibration of CO2- (CO2) while the out-of-plane vibration of CO2- (CO2) is observed at ~ 822 cm-1 The band at 807 cm-1 is associated with a wagging vibration of the water molecule w(H2O) The bands recorded at 1191 and 1210 cm-1 can be assigned as the rocking of NH3+ unit r(NH3+) In this spectral region some changes are observed in the range 27 ndash 31 GPa (i) the disappearance of the band at 694 cm-1 (ii) the appearance of a new weak band at 717 cm-1
(marked by a star in the Figure 10(a)) (iii) the inversion of intensity of the two bands located at 807 and 822 cm-1 which are related to units directly involved in the hydrogen bonds and (iv) the inversion of intensity of the two bands associated to a rocking of NH3+ unit r(NH3+) located at 1191 and 1210 cm-1 The dependence of the wavenumber versus pressure plot for this spectral region is presented in Fig 10(b) we note that many of the observed Raman modes show a small discontinuous change in the slope in the pressure-induced variation of its wavenumber in range 27 ndash 31 GPa
wwwintechopencom
High Pressure Raman Spectra of Amino Acid Crystals
51
Figure 11(a) shows the Raman spectra of the HHM crystal in the spectral range 1700-1400 cm-1 for pressure from 00 to 75 GPa Fig 11(b) shows the respective wavenumber vs pressure plots In this region one expects to observe vibrations assigned to a deformations of the imidazole ring of the histidine molecule asymmetric stretching of the CO2- units stretching of C=O among others In the Figure 11(a) two modifications are observed in the range 27 ndash 31 GPa The first change is the decreasing of the relative intensity of the band originally at 1433 cm-1 and the second one is the appearance of a band at 1642 cm-1 In the wavenumber versus pressure plot presented in Figure 11(b) a subtle discontinuity occurs in the range 27 ndash 31 GPa with appreciably differences in slopes where two modes change from positive to negative slopes
Fig 10 (a) Raman spectra of HHM under several pressure conditions from 04 to 75 GPa in the spectral range 650 ndash 1250 cm-1 (b) wavenumber versus pressure of the bands of HHM appearing in Fig 10(a)
The Raman spectra of HHM crystal in the range 3450-3125 cm-1 are shown in the Figure 12(a) and in the Figure 12(b) the respective wavenumber versus pressure plots are given In this region we expected to observe stretching vibrations of several units of the amino acids and of the water molecule (CH NH3+ and OH-) It is important to note that for wavenumbers lower than 3000 cm-1 there are some modes related to the mineral oil used as compression media In detail the band at 3111 cm-1 can be associated to a stretching vibration of NH3+ unit (NH3+) while the bands observed at 3155 and 3163 cm-1 are associated to a CH stretching vibration of imidazole ring The bands observed at 3374 and 3408 cm-1 are related to the OH- stretching of the water molecules In the pressure range 27 ndash 31 GPa main changes are observed such as the disappearance of the bands related to a OH- stretching vibration (initially located at 3367 and 3393 cm-1) the appearance of a band of weak intensity at 3424 cm-1 and discontinuities of the wavenumber curve of bands at 3155 and 3163 cm-1 which are associated with the CH stretching vibration
wwwintechopencom
Vibrational Spectroscopy
52
Fig 11 (a) Raman spectra of HHM under several pressure conditions from 04 to 75 GPa in the spectral range 1400 ndash 1670 cm-1 (b) wavenumber versus pressure of the bands of HHM appearing in Fig 11(a)
Fig 12 (a) Raman spectra of HHM under several pressure conditions from 04 to 75 GPa in the spectral range 2950 ndash 3450 cm-1 (b) wavenumber versus pressure of the bands of HHM appearing in Fig 12(a)
wwwintechopencom
High Pressure Raman Spectra of Amino Acid Crystals
53
Table 2 gives a quantitative analysis of the evolution of the Raman spectra of HHM crystal with pressure where fitting of all bands to a linear expression ω = ω0 + P is furnished In Table 2 the first column (ωobs) represents the wavenumber of the Raman bands observed at room pressure the second and third columns correspond to adjustment of data for pressure values between 0 and 27 GPa and the two last columns correspond to fitting of the high-pressure phase that observed between 31 and 75 GPa A resume of the modifications observed in all spectral regions of the Raman spectra of HHM is as follows (i) splitting of the band in the low-wavenumber lattice range (ii) change in the number of bands associated to internal modes (iii) wavenumber shifts with discontinuities (iv) changes in the relative intensities of the vibrational bands It is important to state that changes were observed for the deformation vibrations of the OH- of the water molecule as well as of the NH3+ and CO2- groups of the amino acid molecule This picture indicates large conformational changes of the molecules in the unit cell Related to HHM beyond the hydrogen bonds originated from the histidine molecule there are two hydrogen bonds from the water molecule It is interesting to note from Figure 12(b) that the wavenumber of OH- stretching (OH-) decreases with increasing pressure However the OH units participate of hydrogen bonds one to a carboxyl oxygen and another to the chloride ion This means that between 00 and 31 GPa the hydrogen bond strength increases and the wavenumber of(OH-) decreases in this pressure range Also after the phase transition the wavenumber of (OH-) suffers a jump and continues to decrease up to the highest pressure obtained in our experiments Such a picture indicates a further increase of the hydrogen bonds formed by the water molecules and confirms that these bonds are playing an important role in the mechanism of the transition It is interesting to note that similar changes in the low-wavenumber region were also observed for the same crystal when subjected to low temperatures
ωobs
(cm-1)
Phase 1
(0 le P le 27 GPa) Phase 2
(31 le P le 75 GPa)
ω0
(cm-1)
(cm-1)(GPa)-1 ω0
(cm-1)
(cm-1)(GPa)-1
94 945 0669 937 -0103
105 1052 0276 1002 1771
121 1214 -1087 1109 2092
136 1357 1616 1360 0623
149 1497 2128 - -
159 1568 8033 1483 8105
- - - 1639 9960
188 1891 7661 1902 8059
270 2697 3093 - -
293 2919 6118 2945 7683
385 3846 7236 4015 1675
442 4423 1223 4423 1461
wwwintechopencom
Vibrational Spectroscopy
54
ωobs
(cm-1)
Phase 1
(0 le P le 27 GPa) Phase 2
(31 le P le 75 GPa)
ω0
(cm-1)
(cm-1)(GPa)-1 ω0
(cm-1)
(cm-1)(GPa)-1
- - - 4707 0785
491 490 5 3319 - -
530 5304 4335 - -
609 6078 5312 6208 2463
693 6935 1529 - -
- - - 7064 3449
807 8067 2042 8047 1467
824 8240 -0498 8204 1442
838 8361 7335 8504 3124
875 8734 6438 8881 2777
917 9173 0810 9187 2356
963 9630 2757 9636 2411
980 9787 4489 9787 5206
1068 10667 4790 10732 3418
1141 11403 1890 11403 2744
1162 11619 2611 11674 1120
1190 11900 2277 11885 1637
1208 12079 2859 12101 1341
1434 14345 1316 14382 0846
1448 14481 3059 14554 1677
1463 14621 4415 14760 0778
1481 14813 4238 14970 -0619
1609 16093 2739 16166 -0374
- - - 16249 2736
3111 31110 0919 31045 2914
3154 31546 1287 31532 6564
3164 31626 5305 31593 7905
3375 33739 -2638 - -
3407 34081 -5745 - -
- - - 34371 -3169
Table 2 Wavenumber values of the bands appearing in the HHM spectrum at 00 GPa (ωobs) and adjustment data by linear fitting (P) for the two phases
wwwintechopencom
High Pressure Raman Spectra of Amino Acid Crystals
55
5 Conclusions
The results suggested that L-proline monohydrate undergoes two phase transitions one between 00 and 11 GPa and a second between 65 and 78 GPa In both transitions it was possible to observed changes in the spectrum profile discontinuities in the wavenumber versus pressure plots in the lattice region of the spectrum and the appearance of news bands By releasing the pressure after attaining a maximum of 118 GPa the atmospheric pressure spectrum was fully recovered showing that the pressure-induced transitions undergone by polycrystalline L-proline crystal are reversible In the first transition it was observed the splitting of bands associated to (CCN) (CO2-) and (CH) vibrations The band associated to (skel) has disappeared In the second one we have observed the red shift of r(CO2-) significant changes in the intensity of the bands associated to the sc(CO2-) and w(CH2) vibrations and the splits of (CCN) + (CC) and r(NH2+) that also has lost intensity These modifications were interpreted as conformational changes of molecules in the unit cell Because these changes involve moieties that participate in hydrogen bonds we suppose that these hydrogen bonds have also been modified Modifications of hydrogen bonds can trigger some molecular rearrangements that lead to structural phase transitions In our work this hypothesis was supported by the changes that were observed in the region of the lattice modes for both phase transitions Therefore the results suggested two structural phase transitions one between 00 and 11 GPa and another between 65 and 78 GPa accompanied by significant conformational changes of molecules in the L-proline monohydrated crystal The results also suggest that HHM crystal undergoes a phase transition between 27 and 31 GPa when it is submitted to high pressure conditions up to 75 GPa The main changes observed in the Raman spectra was the splitting of the band in the low-wavenumber lattice range change in the number of bands associated to internal modes and wavenumber shifts with discontinuities Having described the behavior of two amino acid crystals under pressure and looked back at the past fourteen years of research we can ask to ourselves what does the future hold Based on the studies performed we believe that the use of several techniques such as neutron and Raman scattering as well as thermal and infrared analyses can help us to give a complete picture about hydrogen bond and the behavior of amino acids under pressure Maybe the study of peptide under similar external conditions should be the next road to be walked
6 Acknowledgment
Authors acknowledge CAPES CNPq and FUNCAP for financial support
7 References
Barthes M Bordallo HN Deacutenoyer F Lorenzo J-E Zaccaro J Robert A amp Zontone F (2004) Micro-transitions or breathers in L-alanine The European Physical Journal B Vol 37 No 3 (February 2004) pp 375-382 ISSN 1434-6028
Boldyreva EV Drebushchak VA Drebushchak TN Paukov IE Kovalevskaya YA amp Shutova ES (2003a) Polymorphism of glycine Part I Journal of Thermal Analysis and Calorimetry Vol 73 No 2 (August 2003) pp 409-418 ISSN 1388-6150
wwwintechopencom
Vibrational Spectroscopy
56
Boldyreva EV Drebushchak VA Drebushchak TN Paukov IE Kovalevskaya YA amp Shutova ES (2003b) Polymorphism of glycine Part II Journal of Thermal Analysis and Calorimetry Vol 73 No 2 (August 2003) pp 419-428 ISSN 1388-6150
Boldyreva EV Ivashevskaya SN Sowa H Ahsbahs H amp Weber H-P (2004) Effect of High Pressure on Crystalline Glycine A New High-Pressure Polymorph Doklady Physical Chemistry Vol 396 No 1 (May 2004) pp 111-114 ISSN 0012-5016
Boldyreva EV Ivashevskaya SN Sowa H Ahsbahs H amp Weber H-P (2005a) Effect of hydrostatic pressure on the -polymorph of glycine 1 A polymorphic transition into a new -form Zeitschrift fuumlr Kristallographie Vol 220 No 1 ( January 2005) pp 50- 57 ISSN 0044-2968
Boldyreva EV Kolesnik EN Drebushchak TN Ahsbahs H Beukes JA amp Weber H-P (2005b) A comparative study of the anisotropy of a lattice strain induced in the crystals of L-serine by cooling down to 100 K or by increasing pressure up to 44 GPa Zeitschrift fuumlr Kristallographie Vol 220 No 1 (January 2005) pp 58- 65 ISSN 0044-2968
Boldyreva EV Kolesnik EN Drebushchak TN Ahsbahs H amp Seryotkin YV (2006a) A comparative study of the anisotropy of a lattice strain induced in the crystals of DL-serine by cooling down to 100 K or by increasing pressure up to 86 GPa A comparison with L-serine Zeitschrift fuumlr Kristallographie Vol 221 No 2 (2006) pp 150- 161 ISSN 0044-2968
Boldyreva EV Sowa H Seryotkin YV Drebushchak TN Ahsbahs H Chernyshev V amp Dmitriev V (2006b) Pressure-induced phase transitions in crystalline L-serine studied by single crystal and gigh-resolution powder X-ray diffraction Chemical Physics Letters Vol 429 No 4-6 (October 2006) pp 474-478 ISSN 0009-2614
Boldyreva E (2007a) Cristalline Amino Acids A Link between Chemistry Materials Science and Biology In Models Mysteries and Magic of Molecules Boeyens JCA amp Ogilvie JF pp 167-192 Springer ISBN 978-1-4020-5940-7 Netherlands
Boldyreva E (2007b) High-Pressure Polymorphs of Molecular Solids When Are They Formed and When Are They Not Some Examples of the Role of Kinetic Control Crystal Growth amp Design Vol 7 No 9 (August 2007) pp 1662-1668 ISSN 1528-7483
Dawson A Allan DR Belmonte SA Clark SJ David WIF McGregor PA Parsons S Pulham CR amp Sawyer L (2005) Effect of high pressure on the crystal structures of polymorphs of glycine Crystal Growth amp Design Vol 5 No 4 (May 2005) pp 1415-1427 ISSN 1528-7483
Destro R Marsh RE amp Bianchi R (1988) A low-temperature (23K) study of L-alanine The Journal of Physical Chemistry Vol 92 No 4 (February 1988) pp 966-973 ISSN 0022-3654
De Sousa GP Freire PTC Lima Jr JA Mendes Filho J amp Melo FEA (2011) High-pressure Raman spectra of L-histidine hydrochloride monohydrate cristal Vibrational Spectroscopy Vol 57 No 1 (September 2011) pp 102-107 ISSN 0924-2031
Donohue J amp Caron A (1964) Refinement of cristal structure of histidine hydrochloride monohydrate Acta Crystallographica Vol 17 No 9 (September 1964) pp 1178-amp ISSN 0108-7673
wwwintechopencom
High Pressure Raman Spectra of Amino Acid Crystals
57
Faccedilanha Filho PF Freire PTC Lima KCV Mendes Filho J Melo FEA amp Pizani PS (2008) High temperature Raman spectra of L-leucine crystals Brazilian Journal of Physics Vol 38 No 1 (March 2008) pp 131-137 ISSN 0103-9733
Faccedilanha Filho PF Freire PTC Melo FEA Lemos V Mendes Filho J Pizani PS amp Rossatto DZ (2009) Pressure-induced phase transitions in L-leucine crystal Journal of Raman Spectroscopy Vol 40 No 1 (January 2009) pp 46-51 ISSN 1097-4555
Freire PTC (2010) Pressure-Induced Phase Transitions in Crystalline Amino Acids In High Pressure Crystallography ndash From Fundamental Phenomena to Technological Applications Boldyreva E amp Dera P pp 559-572 Springer ISBN 978-904-8192-60-1 New York USA
Funnel NP Dawson A Francis D Lennie DR Marshall WG Moggach SA Warren JE amp Parsons S (2010) The effect of pressure on the crystal structure of l-alanine CrystEngComm Vol 12 No 9 (September 2010) pp 2573-2583 ISSN 1466-8033
Goryainov SV Kolesnik EN amp Boldyreva EV (2005) A reversible pressure-induced phase transition in -glycine at 076 GPa Physica B Condensed Matter Vol 357 No 3-4 (March 2005) pp 340-347 ISSN 0921-4526
Goryainov SV Kolesnik EN amp Boldyreva EV (2006) Raman observation of a new (ζ) polymorph of glycine Chemical Physics Letters Vol 419 No 4-6 (February 2006) pp 496-500 ISSN 0009-2614
Harding MM amp Howieson RM (1976) L-Leucine Acta Crystallographica Section B Vol 32 No 2 (February 1976) pp 633-634 ISSN 1600-5740
Herlinger AW amp Long TV (1970) Laser Raman and infrared spectra of amino acids and their metal complexes 3 Proline and bisprolinato complexes Journal of the American Chemical Society Vol 92 No 22 (November 1970) pp 6481-6486 ISSN 0002-7863
Hermiacutenio da Silva J Lemos V Freire PTC Melo FEA Mendes Filho J Lima Jr JA amp Pizani PS (2009) Stability of the crystal structure of L-valine under high pressure Physica Status Solidi B Vol 246 No 3 (March 2009) pp 553-557 ISSN 0370-1972
Lima JA Freire PTC Melo FEA Lemos V Mendes Filho J amp Pizani PS (2008) High pressure Raman spectra of L-methionine Crystal Journal of Raman Spectroscopy Vol 39 No 10 (October 2008) pp 1356-1363 ISSN 1097-4555
Migliori A Maxton PM Clogston AM Zirngiebl E amp Lowe M (1988) Anomalous temperature dependence in the Raman spectra of l-alanine Evidence for dynamic localization Physical Review B Vol 38 No 18 (December 1988) pp 13464-13467 ISSN 1098-0121
Minkov VS Krylov AS Boldyreva EV Goryainov SN Bizyaev SN amp Vtyurin AN (2008) Pressure-Induced Phase Transitions in Crystalline L- and DL-Cysteine The Journal of Physical Chemistry B Vol 112 No 30 (July 2008) pp 8851-8854 ISSN 1520-6106
Minkov VS Goryainov SV Boldyreva EV amp Goumlrbitz CH (2010) Raman study of pressure-induced phase transitions in the crystals of orthorhombic and monoclinic polymorphs of L-cysteine dynamics of the side-chain Journal of Raman Spectroscopy Vol 41 No 12 (December 2010) pp 1458-1468 ISSN 1097-4555
Moggach SA Allan DR Morrison PA Parsons S amp Sawyer L (2005) Effect of pressure on the crystal structure of L-serine-I and the crystal structure of L-serine-II
wwwintechopencom
Vibrational Spectroscopy
58
at 54 GPa Acta Crystallographica Section B Vol 61 No 1 (February 2005) pp 58-68 ISSN 0108-7681
Moggach SA Marshall WG amp Parsons S (2006) High-pressure neutron diffraction study of L-serine-I and L-serine-II and the structure of L-serine-III at 81 GPa Acta Crystallographica Section B Vol 62 No 5 (October 2006) pp 815-825 ISSN 0108-7681
Moreno AJD Freire PTC Melo FEA Arauacutejo-Silva MA Guedes I Mendes Filho J (1997) Pressure-induced phase transitions in monohydrated l-asparagine aminoacid crystals Solid State Communications Vol 103 No 12 (September 1997) pp 655-658 ISSN 0038-1098
Murli C Sharma SK Karmakar S amp Sikka SK (2003) -Glycine under high pressures a Raman scattering study Physica B Condensed Matter Vol 339 No 1 (November 2003) pp 23-30 ISSN 0921-4526
Murli C Vasanthi R amp Sharma SM (2006) Raman spectroscopic investigations of DL-serine and DL-valine under pressure Chemical Physics Vol 331 No 1 (December 2006) pp 77-84 ISSN 0301-0104
Olsen JS Gerward L Freire PTC Mendes Filho J Melo FEA amp Souza Filho AG (2008) Pressure-induced phase transitions in L-alanine crystals Journal of Physics and Chemistry of Solids Vol 69 No 7 (July 2008) pp 1641-1645 ISSN 0022-3697
Sabino AS De Sousa GP Luz-Lima C Freire PTC Melo FEA amp Mendes Filho J (2009) High-pressure Raman spectra of L-isoleucine crystals Solid State Communications Vol 149 No 37-38 (October 2009) pp 1553-1556 ISSN 0038-1098
Sasaki JM Freire PTC Moreno AJD Melo FEA Guedes I Mendes Filho J Shu J Hu J amp Matildeo HK (2000) Single crystal X-ray diffraction in monohydrate L-asparagine under hydrostatic pressure Science and Technology of High Pressure Proceedings of AIRAPT-17 Hyderabad India 2000
Seijas LE Delgado GE Mora AJ Fitch AN amp Brunelli M (2010) On the Crystal structures and hydrogen bond patterns in proline pseudopolymorphs Powder Diffraction Vol 25 No 3 (September 2010) pp 235-240 ISSN 0885-7156
Silva BL Freire PTC Melo FEA Mendes Filho J Pimenta MA amp Dantas MSS (2000) High-pressure Raman spectra of L-threonine crystal Journal of Raman Spectroscopy Vol 31 No 6 (June 2000) pp 519-522 ISSN 1097-4555
Teixeira AMR Freire PTC Moreno AJD Sasaki JM Ayala AP Mendes Filho J amp Melo FEA (2000) High-pressure Raman study of l-alanine crystal Solid State Communications Vol 116 No 7 (October 2000) pp 405-409 ISSN 0038-1098
Tumanov NA Boldyreva EV Kolesov BA Kurnosov AV amp Quesada Cabrera R (2010) Pressure-induced phase transitions in L-alanine revisited Acta Crystallographica Section B Vol 66 No 4 (August 2010) pp 458-371 ISSN 1600-5740
Yamashita M Inomata S Ishikawa K Kashiwagi T Matsuo H Sawamura S amp Kato M (2007) A high-pressure polymorph of L--leucine Acta Crystallographica Section E Vol 63 No 5 (May 2007) pp o2762-o2764 ISSN 1600-5368
wwwintechopencom
Vibrational SpectroscopyEdited by Prof Dominique De Caro
ISBN 978-953-51-0107-9Hard cover 168 pagesPublisher InTechPublished online 24 February 2012Published in print edition February 2012
InTech EuropeUniversity Campus STeP Ri Slavka Krautzeka 83A 51000 Rijeka Croatia Phone +385 (51) 770 447 Fax +385 (51) 686 166wwwintechopencom
InTech ChinaUnit 405 Office Block Hotel Equatorial Shanghai No65 Yan An Road (West) Shanghai 200040 China
Phone +86-21-62489820 Fax +86-21-62489821
The infrared and Raman spectroscopy have applications in numerous fields namely chemistry physicsastronomy biology medicine geology mineralogy etc This book provides some examples of the use ofvibrational spectroscopy in supramolecular chemistry inorganic chemistry solid state physics but also in thefields of molecule-based materials or organic-inorganic interfaces
How to referenceIn order to correctly reference this scholarly work feel free to copy and paste the following
Paulo de Tarso Cavalcante Freire Joseacute Alves Lima Juacutenior Bruno Tavares de Oliveira Abagaro Gardecircnia deSousa Pinheiro Joseacute de Arimateacutea Freitas e Silva Josueacute Mendes Filho and Francisco Erivan de Abreu Melo(2012) High Pressure Raman Spectra of Amino Acid Crystals Vibrational Spectroscopy Prof Dominique DeCaro (Ed) ISBN 978-953-51-0107-9 InTech Available from httpwwwintechopencombooksvibrational-spectroscopyhigh-pressure-raman-spectra-of-amino-acid-crystals
copy 2012 The Author(s) Licensee IntechOpen This is an open access articledistributed under the terms of the Creative Commons Attribution 30License which permits unrestricted use distribution and reproduction inany medium provided the original work is properly cited

Vibrational Spectroscopy
44
Fig 3 Raman spectra of PM under several pressure conditions from 00 to 118 GPa in the spectral range 250 ndash 750 cm-1
remains the same of that observed at 11 GPa In other words the crystal seems to be stable between 11 to 65 GPa But when pressure arrives to 78 GPa great modifications are observed in the 200 ndash 700 cm-1 spectral region Let us state these modifications (i) the appearance of a band (marked by an arrow in the spectrum taken at 78 GPa) in the region ~ 450 cm-1 (ii) an impressive fall of intensity and a red shift of the band associated to r(CO2-) (iii) a red shift of the two bands in the region 550 ndash 600 cm-1 (iv) the appearance of low intense bands (marked by an asterisk in the spectrum taken at 78 GPa) for wavenumbers higher than 600 cm-1 (v) the increase of intensity of the band initially assigned as scissoring of CO2- (vi) the appearance of a band at ~ 725 cm-1 Again the modifications in the spectra between 65 and 78 GPa presented in Figure 3 corroborate the fact that PM crystal undergoes a second phase transition as discussed previously When pressure is released down to 00 GPa whose spectrum is marked by 00 GPa we observe that the starting atmospheric spectrum is recovered as already observed in Figure 2 Figure 4 presents the Raman spectra of PM crystal under high pressure conditions with argon as compression medium in the region 600 to 1250 cm-1 We have cut off the peaks in the region close to 900 cm-1 because there is a peak with high intensity that makes difficult the visualization of the bands close to it this region will be discussed in Figure 5 In the Figure 4 we observe that several peaks are well defined (the peak marked by an asterisk is due a lamp used to calibrate the spectra) It is important to state that in the spectrum at 00
wwwintechopencom
High Pressure Raman Spectra of Amino Acid Crystals
45
Wavenumber (cm-1) Assignment Wavenumber (cm-1) Assignment
68 Lattice mode 950 (CCN)+(CC)
81 Lattice mode 982 v(CCN)+(CC)
99 Lattice mode 991 (CCN)+(CC)
120 Lattice mode 1031 (CCN)+(CC)
134 Lattice mode 1055 w(CH2)
149 Lattice mode 1079 w(CH2)
203 - 1084 r(CH2)
294 (skel) 1161 t(CH2)
373 (CCN) 1172 t(CH2)
447 r(CO2-) 2876 (CH)
574 (CO2-) 2898 (CH)
641 w(CO2-) 2932 (CH)
669 (skel) 2949 (CH)
695 sc(CO2-) 2971 (CH)
791 (skel) 2983 (CH)
840 r(CH2) 3006 (CH)
863 r(CH2) 3011 (CH)
897 r(NH2+) 3041 (NH)
918 (CCN)+(CC) 3068 (NH)
Table 1 Wavenumber (in cm-1) and approximate assignments of Raman bands for L-proline monohydrate crystal where def deformation bending r rocking w wagging sc scissoring stretching t twisting
GPa there are two peaks between 975 and 1000 cm-1 and in the spectrum taken at 11 GPa only one band is observed Another aspect that worth note is the fact that the band of highest energy (~ 1172 cm-1 at 00 GPa twisting of CH2 t(CH2)) splits in the spectrum taken at 11 GPa Above this last pressure the intensity of the peaks remains approximately constant up to 65 GPa Between 65 and 78 GPa the Raman spectrum presents great changes The band associated to the rocking of CH2 r(CH2) observed initially at ~ 840 cm-1 presents both a jump to high wavenumbers and an increasing in its linewidth A splitting is observed for the band marked by an star in the spectrum recorded at 65 GPa and observed initially at ~ 950 cm-1 which is associated to the stretching of CCN and CC units (CCN) + (CC) If one observe the band at 1033 cm-1 which is associated to the wagging of CH2 w(CH2) interestingly between 65 and 78 GPa it changes intensity with the band marked by a down arrow in the spectrum taken at 65 GPa so the w(CH2) band lost intensity and the band marked by a down arrow increases intensity Similarly the low intense bands observed between 1080 and 1200 cm-1 present great changes in their intensities between 65 and 78 GPa All these changes corroborate the modification in the crystal structure which occurs above 65 GPa which are reversible when pressure is released down to 00 GPa
wwwintechopencom
Vibrational Spectroscopy
46
Fig 4 Raman spectra of PM under several pressure conditions from 00 to 118 GPa in the spectral range 600 ndash 1250 cm-1
Figure 5 shows the Raman spectra of PM crystal in the 800 ndash 1100 cm-1 spectral region The dominant band in the spectrum taken at 00 GPa observed at 897 cm-1 is associated to the rocking vibration of NH2+ r(NH2+) The changes occurring in the first phase transition are not impressive but we note that between 65 and 78 GPa the band lost intensity and splits into two bands Above 78 GPa blue shifts of the wavenumbers are verified but no great change is present up to the highest pressure arrived in the experiment Decreasing pressure down to 00 GPa again we observe that the original spectrum is also recovered in this region In the spectral region presented in Figure 6 it is expected to be observed bands associated to the stretching vibrations of CH and CH2 units A theoretical study performed on L-methionine showed that different profiles of the Raman spectrum in this wavenumber range are associated with different conformations of the molecule In this sense when we observe the Raman spectra of PM as a function of pressure we note that between 00 and 11 GPa the most intense band at 00 GPa split into three bands (marked by up arrows) In the spectrum taken at 17 GPa the separation is very clear and when pressure is further increased the bands become clearly distinct But between 65 and 78 GPa the spectrum changes abruptly indicating that between these two pressure values the proline molecules undergo a great conformational change Because we have observed additionally changes in the low wavenumber region we can understand that both conformational change and structural phase transition take place for PM crystal As observed in the other spectral regions the original spectrum at 00 GPa is recovered when pressure is released
wwwintechopencom
High Pressure Raman Spectra of Amino Acid Crystals
47
Fig 5 Raman spectra of PM under several pressure conditions from 00 to 118 GPa in the spectral range 800 ndash 1100 cm-1
Data can give us some insights related to the behaviour of molecules of proline as the crystal is compressed For example in a previous study on -glycine the softening of a bending of CO2- was associated to a decrease in the intra-layer hydrogen bond strength while the stiffening of the same vibration was associated to an increase in the bond strength (Dawson et al 2005) For PM we have observed that the band associated to both bending of CO2- (CO2-) and rocking of CO2- r(CO2-) increase wavenumbers from 11 to 65 GPa and between 65 and 78 GPa decrease wavenumber for (CO2-) the decreasing is represented by the two dashed lines in Figure 3 between the spectra of 65 and 78 GPa We have also observed an additional increasing of wavenumbers for pressures higher than 78 GPa This suggests that the intra-layer hydrogen bond strength is stiffened up to 65 GPa between 65 and 78 GPa the hydrogen bond strength is softened and above 80 GPa the hydrogen bond is stiffened Additionally our results suggest that between 65 and 78 GPa occurs a structural rearrangement in such a way that the behaviour of the hydrogen bond strengths is changed This rearrangement is enough to change the symmetry of the crystal because
wwwintechopencom
Vibrational Spectroscopy
48
Fig 6 Raman spectra of PM under several pressure conditions from 00 to 118 GPa in the spectral range 2850 ndash 3200 cm-1
associated to it we observe great modifications in the Raman spectrum of low wavenumber region (Figure 2) Yet related to the phase transition between 65 and 78 GPa it is impressive the increase of intensity of a band in the spectrum taken at 65 GPa (marked by an arrow see Figure 4) which can be assigned as wagging of CH2 w(CH2) it change of intensity with the band close to it at ~ 1055 cm-1 at 00 GPa which is also assigned as w(CH2) indicating that a conformational change in the ring may also occurs when the crystal undergoes the phase transition at 65 - 78 GPa It is also interesting to note that the first transition occurs from a monoclinic to a phase with lower symmetry (another monoclinic our a triclinic phase) because in several regions including both internal and lattice mode spectral regions the number of peaks in the spectrum taken at 11 GPa is greater than the number of Raman peaks in the spectrum taken at 00 GPa It is also worth note that above 78 GPa almost all bands increases linewidth indicating that some disorder is introduced in the high pressure phase However the disorder does not occur in a high degree because when pressure is released down to 00 GPa the original spectrum is recovered It is known that the amorphization process is preceded by some disorder in the crystal structure however due to recovered of the original Raman spectrum after releasing pressure we can infer that when we arrive to 1118 GPa we are far away from the pressure point where eventually the PM crystal should present amorphization
wwwintechopencom
High Pressure Raman Spectra of Amino Acid Crystals
49
42 L-histidine hydrochloride monohydrate Related to the HHM (see Figure 8) which crystallizes in an orthorhombic structure belonging to the P212121 (D24) space group with four molecules of C6H9N3O2HClH2O per unit cell we were able to arrive up to 75 GPa and discovery a new polymorph of the material above 31 GPa The strong bond between N-H of the imidazole ring and the carboxyl group of a neighboring molecule is the fundamental intermolecular link resulting in a spiral arrangement along the c-axis (Donohue amp Caron 1964) The coupling of the four zwitterions in the unit cell leads to 297 optical normal modes decomposed into irreducible representations of the factor group D2 as Γop = 75 A + 74 (B1 + B2 + B3) and the acoustic modes can be expressed as Γac = B1 + B2 + B3 Under high pressure conditions modifications the Raman spectra are interpreted in terms of both conformational changes of the molecules in the unit cell and in terms of a phase transition Figure 9(a) presents the Raman spectra of HHM for several pressures in the spectral range from 50 to 660 cm-1 The region for wavenumbers lower than 200 cm-1 as previously stated is characteristic of the lattice vibration modes Increasing pressure we observe that the bands present blue shifts of their wavenumbers However between 27 and 31 GPa it is possible to note that a great change occurs in the Raman spectrum the peak marked by a square which is associated to torsion of CO2- (τ(CO2-)) splits in two new peaks which are marked by up arrows in the spectrum at 31 GPa In Figure 9(b) which presents the plot of experimental wavenumber as function of pressure we clearly observe the splitting of the band close to 180 cm-1 Additionally we note that for other bands discontinuities of wavenumbers are observed between 27 to 31 GPa (De Sousa et al 2011)
Fig 8 Unit cell of HHM seen along the b-axis
In this region it is also possible to observe many internal vibrations of the histidine molecule such as skeletal structure at 442 and 490 cm-1 torsion of NH3+ which is observed at 385 cm-1 and rocking of CO2- at 530 cm-1 Again as occurs with the spectra shown in the lattice mode region modifications are observed in the spectral range 27 - 31 GPa Among these changes we observed the disappearance of the bands at 276 and 500 cm-1 and the
wwwintechopencom
Vibrational Spectroscopy
50
Fig 9 (a) Raman spectra of HHM under several pressure conditions from 04 to 75 GPa in the spectral range 50 ndash 650 cm-1 (b) wavenumber versus pressure of the bands of HHM appearing in Fig 9(a)
appearance of a band at 473 cm-1 in the spectrum taken at 31 GPa We additionally note that the intensity of the band associated to torsion of NH3+ decreases with increasing pressure indicating that there occurs a conformational change of histidine molecule Such a conformational change can be understood as consequence of the change of the intermolecular hydrogen bond length With increasing pressure the band initially at 385 cm-
1 which is associated with a torsion vibration of the NH3+ unit shifts linearly toward higher wavenumbers we can say that the pressure decreases the length of the hydrogen bonds increasing the wavenumber of the band associated to torsional vibration of NH3+ unit Figure 10(a) presents the Raman spectra of HHM in the 650 ndash 1250 cm-1 interval for several pressure values up to 75 GPa In this spectral region it is expected to observe vibrations assigned to the deformation of CO2- stretching of both C-C and C-N wagging of H2O and rocking of NH3+ The band observed at ~ 694 cm-1 is associated to a deformation vibration of CO2- (CO2) while the out-of-plane vibration of CO2- (CO2) is observed at ~ 822 cm-1 The band at 807 cm-1 is associated with a wagging vibration of the water molecule w(H2O) The bands recorded at 1191 and 1210 cm-1 can be assigned as the rocking of NH3+ unit r(NH3+) In this spectral region some changes are observed in the range 27 ndash 31 GPa (i) the disappearance of the band at 694 cm-1 (ii) the appearance of a new weak band at 717 cm-1
(marked by a star in the Figure 10(a)) (iii) the inversion of intensity of the two bands located at 807 and 822 cm-1 which are related to units directly involved in the hydrogen bonds and (iv) the inversion of intensity of the two bands associated to a rocking of NH3+ unit r(NH3+) located at 1191 and 1210 cm-1 The dependence of the wavenumber versus pressure plot for this spectral region is presented in Fig 10(b) we note that many of the observed Raman modes show a small discontinuous change in the slope in the pressure-induced variation of its wavenumber in range 27 ndash 31 GPa
wwwintechopencom
High Pressure Raman Spectra of Amino Acid Crystals
51
Figure 11(a) shows the Raman spectra of the HHM crystal in the spectral range 1700-1400 cm-1 for pressure from 00 to 75 GPa Fig 11(b) shows the respective wavenumber vs pressure plots In this region one expects to observe vibrations assigned to a deformations of the imidazole ring of the histidine molecule asymmetric stretching of the CO2- units stretching of C=O among others In the Figure 11(a) two modifications are observed in the range 27 ndash 31 GPa The first change is the decreasing of the relative intensity of the band originally at 1433 cm-1 and the second one is the appearance of a band at 1642 cm-1 In the wavenumber versus pressure plot presented in Figure 11(b) a subtle discontinuity occurs in the range 27 ndash 31 GPa with appreciably differences in slopes where two modes change from positive to negative slopes
Fig 10 (a) Raman spectra of HHM under several pressure conditions from 04 to 75 GPa in the spectral range 650 ndash 1250 cm-1 (b) wavenumber versus pressure of the bands of HHM appearing in Fig 10(a)
The Raman spectra of HHM crystal in the range 3450-3125 cm-1 are shown in the Figure 12(a) and in the Figure 12(b) the respective wavenumber versus pressure plots are given In this region we expected to observe stretching vibrations of several units of the amino acids and of the water molecule (CH NH3+ and OH-) It is important to note that for wavenumbers lower than 3000 cm-1 there are some modes related to the mineral oil used as compression media In detail the band at 3111 cm-1 can be associated to a stretching vibration of NH3+ unit (NH3+) while the bands observed at 3155 and 3163 cm-1 are associated to a CH stretching vibration of imidazole ring The bands observed at 3374 and 3408 cm-1 are related to the OH- stretching of the water molecules In the pressure range 27 ndash 31 GPa main changes are observed such as the disappearance of the bands related to a OH- stretching vibration (initially located at 3367 and 3393 cm-1) the appearance of a band of weak intensity at 3424 cm-1 and discontinuities of the wavenumber curve of bands at 3155 and 3163 cm-1 which are associated with the CH stretching vibration
wwwintechopencom
Vibrational Spectroscopy
52
Fig 11 (a) Raman spectra of HHM under several pressure conditions from 04 to 75 GPa in the spectral range 1400 ndash 1670 cm-1 (b) wavenumber versus pressure of the bands of HHM appearing in Fig 11(a)
Fig 12 (a) Raman spectra of HHM under several pressure conditions from 04 to 75 GPa in the spectral range 2950 ndash 3450 cm-1 (b) wavenumber versus pressure of the bands of HHM appearing in Fig 12(a)
wwwintechopencom
High Pressure Raman Spectra of Amino Acid Crystals
53
Table 2 gives a quantitative analysis of the evolution of the Raman spectra of HHM crystal with pressure where fitting of all bands to a linear expression ω = ω0 + P is furnished In Table 2 the first column (ωobs) represents the wavenumber of the Raman bands observed at room pressure the second and third columns correspond to adjustment of data for pressure values between 0 and 27 GPa and the two last columns correspond to fitting of the high-pressure phase that observed between 31 and 75 GPa A resume of the modifications observed in all spectral regions of the Raman spectra of HHM is as follows (i) splitting of the band in the low-wavenumber lattice range (ii) change in the number of bands associated to internal modes (iii) wavenumber shifts with discontinuities (iv) changes in the relative intensities of the vibrational bands It is important to state that changes were observed for the deformation vibrations of the OH- of the water molecule as well as of the NH3+ and CO2- groups of the amino acid molecule This picture indicates large conformational changes of the molecules in the unit cell Related to HHM beyond the hydrogen bonds originated from the histidine molecule there are two hydrogen bonds from the water molecule It is interesting to note from Figure 12(b) that the wavenumber of OH- stretching (OH-) decreases with increasing pressure However the OH units participate of hydrogen bonds one to a carboxyl oxygen and another to the chloride ion This means that between 00 and 31 GPa the hydrogen bond strength increases and the wavenumber of(OH-) decreases in this pressure range Also after the phase transition the wavenumber of (OH-) suffers a jump and continues to decrease up to the highest pressure obtained in our experiments Such a picture indicates a further increase of the hydrogen bonds formed by the water molecules and confirms that these bonds are playing an important role in the mechanism of the transition It is interesting to note that similar changes in the low-wavenumber region were also observed for the same crystal when subjected to low temperatures
ωobs
(cm-1)
Phase 1
(0 le P le 27 GPa) Phase 2
(31 le P le 75 GPa)
ω0
(cm-1)
(cm-1)(GPa)-1 ω0
(cm-1)
(cm-1)(GPa)-1
94 945 0669 937 -0103
105 1052 0276 1002 1771
121 1214 -1087 1109 2092
136 1357 1616 1360 0623
149 1497 2128 - -
159 1568 8033 1483 8105
- - - 1639 9960
188 1891 7661 1902 8059
270 2697 3093 - -
293 2919 6118 2945 7683
385 3846 7236 4015 1675
442 4423 1223 4423 1461
wwwintechopencom
Vibrational Spectroscopy
54
ωobs
(cm-1)
Phase 1
(0 le P le 27 GPa) Phase 2
(31 le P le 75 GPa)
ω0
(cm-1)
(cm-1)(GPa)-1 ω0
(cm-1)
(cm-1)(GPa)-1
- - - 4707 0785
491 490 5 3319 - -
530 5304 4335 - -
609 6078 5312 6208 2463
693 6935 1529 - -
- - - 7064 3449
807 8067 2042 8047 1467
824 8240 -0498 8204 1442
838 8361 7335 8504 3124
875 8734 6438 8881 2777
917 9173 0810 9187 2356
963 9630 2757 9636 2411
980 9787 4489 9787 5206
1068 10667 4790 10732 3418
1141 11403 1890 11403 2744
1162 11619 2611 11674 1120
1190 11900 2277 11885 1637
1208 12079 2859 12101 1341
1434 14345 1316 14382 0846
1448 14481 3059 14554 1677
1463 14621 4415 14760 0778
1481 14813 4238 14970 -0619
1609 16093 2739 16166 -0374
- - - 16249 2736
3111 31110 0919 31045 2914
3154 31546 1287 31532 6564
3164 31626 5305 31593 7905
3375 33739 -2638 - -
3407 34081 -5745 - -
- - - 34371 -3169
Table 2 Wavenumber values of the bands appearing in the HHM spectrum at 00 GPa (ωobs) and adjustment data by linear fitting (P) for the two phases
wwwintechopencom
High Pressure Raman Spectra of Amino Acid Crystals
55
5 Conclusions
The results suggested that L-proline monohydrate undergoes two phase transitions one between 00 and 11 GPa and a second between 65 and 78 GPa In both transitions it was possible to observed changes in the spectrum profile discontinuities in the wavenumber versus pressure plots in the lattice region of the spectrum and the appearance of news bands By releasing the pressure after attaining a maximum of 118 GPa the atmospheric pressure spectrum was fully recovered showing that the pressure-induced transitions undergone by polycrystalline L-proline crystal are reversible In the first transition it was observed the splitting of bands associated to (CCN) (CO2-) and (CH) vibrations The band associated to (skel) has disappeared In the second one we have observed the red shift of r(CO2-) significant changes in the intensity of the bands associated to the sc(CO2-) and w(CH2) vibrations and the splits of (CCN) + (CC) and r(NH2+) that also has lost intensity These modifications were interpreted as conformational changes of molecules in the unit cell Because these changes involve moieties that participate in hydrogen bonds we suppose that these hydrogen bonds have also been modified Modifications of hydrogen bonds can trigger some molecular rearrangements that lead to structural phase transitions In our work this hypothesis was supported by the changes that were observed in the region of the lattice modes for both phase transitions Therefore the results suggested two structural phase transitions one between 00 and 11 GPa and another between 65 and 78 GPa accompanied by significant conformational changes of molecules in the L-proline monohydrated crystal The results also suggest that HHM crystal undergoes a phase transition between 27 and 31 GPa when it is submitted to high pressure conditions up to 75 GPa The main changes observed in the Raman spectra was the splitting of the band in the low-wavenumber lattice range change in the number of bands associated to internal modes and wavenumber shifts with discontinuities Having described the behavior of two amino acid crystals under pressure and looked back at the past fourteen years of research we can ask to ourselves what does the future hold Based on the studies performed we believe that the use of several techniques such as neutron and Raman scattering as well as thermal and infrared analyses can help us to give a complete picture about hydrogen bond and the behavior of amino acids under pressure Maybe the study of peptide under similar external conditions should be the next road to be walked
6 Acknowledgment
Authors acknowledge CAPES CNPq and FUNCAP for financial support
7 References
Barthes M Bordallo HN Deacutenoyer F Lorenzo J-E Zaccaro J Robert A amp Zontone F (2004) Micro-transitions or breathers in L-alanine The European Physical Journal B Vol 37 No 3 (February 2004) pp 375-382 ISSN 1434-6028
Boldyreva EV Drebushchak VA Drebushchak TN Paukov IE Kovalevskaya YA amp Shutova ES (2003a) Polymorphism of glycine Part I Journal of Thermal Analysis and Calorimetry Vol 73 No 2 (August 2003) pp 409-418 ISSN 1388-6150
wwwintechopencom
Vibrational Spectroscopy
56
Boldyreva EV Drebushchak VA Drebushchak TN Paukov IE Kovalevskaya YA amp Shutova ES (2003b) Polymorphism of glycine Part II Journal of Thermal Analysis and Calorimetry Vol 73 No 2 (August 2003) pp 419-428 ISSN 1388-6150
Boldyreva EV Ivashevskaya SN Sowa H Ahsbahs H amp Weber H-P (2004) Effect of High Pressure on Crystalline Glycine A New High-Pressure Polymorph Doklady Physical Chemistry Vol 396 No 1 (May 2004) pp 111-114 ISSN 0012-5016
Boldyreva EV Ivashevskaya SN Sowa H Ahsbahs H amp Weber H-P (2005a) Effect of hydrostatic pressure on the -polymorph of glycine 1 A polymorphic transition into a new -form Zeitschrift fuumlr Kristallographie Vol 220 No 1 ( January 2005) pp 50- 57 ISSN 0044-2968
Boldyreva EV Kolesnik EN Drebushchak TN Ahsbahs H Beukes JA amp Weber H-P (2005b) A comparative study of the anisotropy of a lattice strain induced in the crystals of L-serine by cooling down to 100 K or by increasing pressure up to 44 GPa Zeitschrift fuumlr Kristallographie Vol 220 No 1 (January 2005) pp 58- 65 ISSN 0044-2968
Boldyreva EV Kolesnik EN Drebushchak TN Ahsbahs H amp Seryotkin YV (2006a) A comparative study of the anisotropy of a lattice strain induced in the crystals of DL-serine by cooling down to 100 K or by increasing pressure up to 86 GPa A comparison with L-serine Zeitschrift fuumlr Kristallographie Vol 221 No 2 (2006) pp 150- 161 ISSN 0044-2968
Boldyreva EV Sowa H Seryotkin YV Drebushchak TN Ahsbahs H Chernyshev V amp Dmitriev V (2006b) Pressure-induced phase transitions in crystalline L-serine studied by single crystal and gigh-resolution powder X-ray diffraction Chemical Physics Letters Vol 429 No 4-6 (October 2006) pp 474-478 ISSN 0009-2614
Boldyreva E (2007a) Cristalline Amino Acids A Link between Chemistry Materials Science and Biology In Models Mysteries and Magic of Molecules Boeyens JCA amp Ogilvie JF pp 167-192 Springer ISBN 978-1-4020-5940-7 Netherlands
Boldyreva E (2007b) High-Pressure Polymorphs of Molecular Solids When Are They Formed and When Are They Not Some Examples of the Role of Kinetic Control Crystal Growth amp Design Vol 7 No 9 (August 2007) pp 1662-1668 ISSN 1528-7483
Dawson A Allan DR Belmonte SA Clark SJ David WIF McGregor PA Parsons S Pulham CR amp Sawyer L (2005) Effect of high pressure on the crystal structures of polymorphs of glycine Crystal Growth amp Design Vol 5 No 4 (May 2005) pp 1415-1427 ISSN 1528-7483
Destro R Marsh RE amp Bianchi R (1988) A low-temperature (23K) study of L-alanine The Journal of Physical Chemistry Vol 92 No 4 (February 1988) pp 966-973 ISSN 0022-3654
De Sousa GP Freire PTC Lima Jr JA Mendes Filho J amp Melo FEA (2011) High-pressure Raman spectra of L-histidine hydrochloride monohydrate cristal Vibrational Spectroscopy Vol 57 No 1 (September 2011) pp 102-107 ISSN 0924-2031
Donohue J amp Caron A (1964) Refinement of cristal structure of histidine hydrochloride monohydrate Acta Crystallographica Vol 17 No 9 (September 1964) pp 1178-amp ISSN 0108-7673
wwwintechopencom
High Pressure Raman Spectra of Amino Acid Crystals
57
Faccedilanha Filho PF Freire PTC Lima KCV Mendes Filho J Melo FEA amp Pizani PS (2008) High temperature Raman spectra of L-leucine crystals Brazilian Journal of Physics Vol 38 No 1 (March 2008) pp 131-137 ISSN 0103-9733
Faccedilanha Filho PF Freire PTC Melo FEA Lemos V Mendes Filho J Pizani PS amp Rossatto DZ (2009) Pressure-induced phase transitions in L-leucine crystal Journal of Raman Spectroscopy Vol 40 No 1 (January 2009) pp 46-51 ISSN 1097-4555
Freire PTC (2010) Pressure-Induced Phase Transitions in Crystalline Amino Acids In High Pressure Crystallography ndash From Fundamental Phenomena to Technological Applications Boldyreva E amp Dera P pp 559-572 Springer ISBN 978-904-8192-60-1 New York USA
Funnel NP Dawson A Francis D Lennie DR Marshall WG Moggach SA Warren JE amp Parsons S (2010) The effect of pressure on the crystal structure of l-alanine CrystEngComm Vol 12 No 9 (September 2010) pp 2573-2583 ISSN 1466-8033
Goryainov SV Kolesnik EN amp Boldyreva EV (2005) A reversible pressure-induced phase transition in -glycine at 076 GPa Physica B Condensed Matter Vol 357 No 3-4 (March 2005) pp 340-347 ISSN 0921-4526
Goryainov SV Kolesnik EN amp Boldyreva EV (2006) Raman observation of a new (ζ) polymorph of glycine Chemical Physics Letters Vol 419 No 4-6 (February 2006) pp 496-500 ISSN 0009-2614
Harding MM amp Howieson RM (1976) L-Leucine Acta Crystallographica Section B Vol 32 No 2 (February 1976) pp 633-634 ISSN 1600-5740
Herlinger AW amp Long TV (1970) Laser Raman and infrared spectra of amino acids and their metal complexes 3 Proline and bisprolinato complexes Journal of the American Chemical Society Vol 92 No 22 (November 1970) pp 6481-6486 ISSN 0002-7863
Hermiacutenio da Silva J Lemos V Freire PTC Melo FEA Mendes Filho J Lima Jr JA amp Pizani PS (2009) Stability of the crystal structure of L-valine under high pressure Physica Status Solidi B Vol 246 No 3 (March 2009) pp 553-557 ISSN 0370-1972
Lima JA Freire PTC Melo FEA Lemos V Mendes Filho J amp Pizani PS (2008) High pressure Raman spectra of L-methionine Crystal Journal of Raman Spectroscopy Vol 39 No 10 (October 2008) pp 1356-1363 ISSN 1097-4555
Migliori A Maxton PM Clogston AM Zirngiebl E amp Lowe M (1988) Anomalous temperature dependence in the Raman spectra of l-alanine Evidence for dynamic localization Physical Review B Vol 38 No 18 (December 1988) pp 13464-13467 ISSN 1098-0121
Minkov VS Krylov AS Boldyreva EV Goryainov SN Bizyaev SN amp Vtyurin AN (2008) Pressure-Induced Phase Transitions in Crystalline L- and DL-Cysteine The Journal of Physical Chemistry B Vol 112 No 30 (July 2008) pp 8851-8854 ISSN 1520-6106
Minkov VS Goryainov SV Boldyreva EV amp Goumlrbitz CH (2010) Raman study of pressure-induced phase transitions in the crystals of orthorhombic and monoclinic polymorphs of L-cysteine dynamics of the side-chain Journal of Raman Spectroscopy Vol 41 No 12 (December 2010) pp 1458-1468 ISSN 1097-4555
Moggach SA Allan DR Morrison PA Parsons S amp Sawyer L (2005) Effect of pressure on the crystal structure of L-serine-I and the crystal structure of L-serine-II
wwwintechopencom
Vibrational Spectroscopy
58
at 54 GPa Acta Crystallographica Section B Vol 61 No 1 (February 2005) pp 58-68 ISSN 0108-7681
Moggach SA Marshall WG amp Parsons S (2006) High-pressure neutron diffraction study of L-serine-I and L-serine-II and the structure of L-serine-III at 81 GPa Acta Crystallographica Section B Vol 62 No 5 (October 2006) pp 815-825 ISSN 0108-7681
Moreno AJD Freire PTC Melo FEA Arauacutejo-Silva MA Guedes I Mendes Filho J (1997) Pressure-induced phase transitions in monohydrated l-asparagine aminoacid crystals Solid State Communications Vol 103 No 12 (September 1997) pp 655-658 ISSN 0038-1098
Murli C Sharma SK Karmakar S amp Sikka SK (2003) -Glycine under high pressures a Raman scattering study Physica B Condensed Matter Vol 339 No 1 (November 2003) pp 23-30 ISSN 0921-4526
Murli C Vasanthi R amp Sharma SM (2006) Raman spectroscopic investigations of DL-serine and DL-valine under pressure Chemical Physics Vol 331 No 1 (December 2006) pp 77-84 ISSN 0301-0104
Olsen JS Gerward L Freire PTC Mendes Filho J Melo FEA amp Souza Filho AG (2008) Pressure-induced phase transitions in L-alanine crystals Journal of Physics and Chemistry of Solids Vol 69 No 7 (July 2008) pp 1641-1645 ISSN 0022-3697
Sabino AS De Sousa GP Luz-Lima C Freire PTC Melo FEA amp Mendes Filho J (2009) High-pressure Raman spectra of L-isoleucine crystals Solid State Communications Vol 149 No 37-38 (October 2009) pp 1553-1556 ISSN 0038-1098
Sasaki JM Freire PTC Moreno AJD Melo FEA Guedes I Mendes Filho J Shu J Hu J amp Matildeo HK (2000) Single crystal X-ray diffraction in monohydrate L-asparagine under hydrostatic pressure Science and Technology of High Pressure Proceedings of AIRAPT-17 Hyderabad India 2000
Seijas LE Delgado GE Mora AJ Fitch AN amp Brunelli M (2010) On the Crystal structures and hydrogen bond patterns in proline pseudopolymorphs Powder Diffraction Vol 25 No 3 (September 2010) pp 235-240 ISSN 0885-7156
Silva BL Freire PTC Melo FEA Mendes Filho J Pimenta MA amp Dantas MSS (2000) High-pressure Raman spectra of L-threonine crystal Journal of Raman Spectroscopy Vol 31 No 6 (June 2000) pp 519-522 ISSN 1097-4555
Teixeira AMR Freire PTC Moreno AJD Sasaki JM Ayala AP Mendes Filho J amp Melo FEA (2000) High-pressure Raman study of l-alanine crystal Solid State Communications Vol 116 No 7 (October 2000) pp 405-409 ISSN 0038-1098
Tumanov NA Boldyreva EV Kolesov BA Kurnosov AV amp Quesada Cabrera R (2010) Pressure-induced phase transitions in L-alanine revisited Acta Crystallographica Section B Vol 66 No 4 (August 2010) pp 458-371 ISSN 1600-5740
Yamashita M Inomata S Ishikawa K Kashiwagi T Matsuo H Sawamura S amp Kato M (2007) A high-pressure polymorph of L--leucine Acta Crystallographica Section E Vol 63 No 5 (May 2007) pp o2762-o2764 ISSN 1600-5368
wwwintechopencom
Vibrational SpectroscopyEdited by Prof Dominique De Caro
ISBN 978-953-51-0107-9Hard cover 168 pagesPublisher InTechPublished online 24 February 2012Published in print edition February 2012
InTech EuropeUniversity Campus STeP Ri Slavka Krautzeka 83A 51000 Rijeka Croatia Phone +385 (51) 770 447 Fax +385 (51) 686 166wwwintechopencom
InTech ChinaUnit 405 Office Block Hotel Equatorial Shanghai No65 Yan An Road (West) Shanghai 200040 China
Phone +86-21-62489820 Fax +86-21-62489821
The infrared and Raman spectroscopy have applications in numerous fields namely chemistry physicsastronomy biology medicine geology mineralogy etc This book provides some examples of the use ofvibrational spectroscopy in supramolecular chemistry inorganic chemistry solid state physics but also in thefields of molecule-based materials or organic-inorganic interfaces
How to referenceIn order to correctly reference this scholarly work feel free to copy and paste the following
Paulo de Tarso Cavalcante Freire Joseacute Alves Lima Juacutenior Bruno Tavares de Oliveira Abagaro Gardecircnia deSousa Pinheiro Joseacute de Arimateacutea Freitas e Silva Josueacute Mendes Filho and Francisco Erivan de Abreu Melo(2012) High Pressure Raman Spectra of Amino Acid Crystals Vibrational Spectroscopy Prof Dominique DeCaro (Ed) ISBN 978-953-51-0107-9 InTech Available from httpwwwintechopencombooksvibrational-spectroscopyhigh-pressure-raman-spectra-of-amino-acid-crystals
copy 2012 The Author(s) Licensee IntechOpen This is an open access articledistributed under the terms of the Creative Commons Attribution 30License which permits unrestricted use distribution and reproduction inany medium provided the original work is properly cited

High Pressure Raman Spectra of Amino Acid Crystals
45
Wavenumber (cm-1) Assignment Wavenumber (cm-1) Assignment
68 Lattice mode 950 (CCN)+(CC)
81 Lattice mode 982 v(CCN)+(CC)
99 Lattice mode 991 (CCN)+(CC)
120 Lattice mode 1031 (CCN)+(CC)
134 Lattice mode 1055 w(CH2)
149 Lattice mode 1079 w(CH2)
203 - 1084 r(CH2)
294 (skel) 1161 t(CH2)
373 (CCN) 1172 t(CH2)
447 r(CO2-) 2876 (CH)
574 (CO2-) 2898 (CH)
641 w(CO2-) 2932 (CH)
669 (skel) 2949 (CH)
695 sc(CO2-) 2971 (CH)
791 (skel) 2983 (CH)
840 r(CH2) 3006 (CH)
863 r(CH2) 3011 (CH)
897 r(NH2+) 3041 (NH)
918 (CCN)+(CC) 3068 (NH)
Table 1 Wavenumber (in cm-1) and approximate assignments of Raman bands for L-proline monohydrate crystal where def deformation bending r rocking w wagging sc scissoring stretching t twisting
GPa there are two peaks between 975 and 1000 cm-1 and in the spectrum taken at 11 GPa only one band is observed Another aspect that worth note is the fact that the band of highest energy (~ 1172 cm-1 at 00 GPa twisting of CH2 t(CH2)) splits in the spectrum taken at 11 GPa Above this last pressure the intensity of the peaks remains approximately constant up to 65 GPa Between 65 and 78 GPa the Raman spectrum presents great changes The band associated to the rocking of CH2 r(CH2) observed initially at ~ 840 cm-1 presents both a jump to high wavenumbers and an increasing in its linewidth A splitting is observed for the band marked by an star in the spectrum recorded at 65 GPa and observed initially at ~ 950 cm-1 which is associated to the stretching of CCN and CC units (CCN) + (CC) If one observe the band at 1033 cm-1 which is associated to the wagging of CH2 w(CH2) interestingly between 65 and 78 GPa it changes intensity with the band marked by a down arrow in the spectrum taken at 65 GPa so the w(CH2) band lost intensity and the band marked by a down arrow increases intensity Similarly the low intense bands observed between 1080 and 1200 cm-1 present great changes in their intensities between 65 and 78 GPa All these changes corroborate the modification in the crystal structure which occurs above 65 GPa which are reversible when pressure is released down to 00 GPa
wwwintechopencom
Vibrational Spectroscopy
46
Fig 4 Raman spectra of PM under several pressure conditions from 00 to 118 GPa in the spectral range 600 ndash 1250 cm-1
Figure 5 shows the Raman spectra of PM crystal in the 800 ndash 1100 cm-1 spectral region The dominant band in the spectrum taken at 00 GPa observed at 897 cm-1 is associated to the rocking vibration of NH2+ r(NH2+) The changes occurring in the first phase transition are not impressive but we note that between 65 and 78 GPa the band lost intensity and splits into two bands Above 78 GPa blue shifts of the wavenumbers are verified but no great change is present up to the highest pressure arrived in the experiment Decreasing pressure down to 00 GPa again we observe that the original spectrum is also recovered in this region In the spectral region presented in Figure 6 it is expected to be observed bands associated to the stretching vibrations of CH and CH2 units A theoretical study performed on L-methionine showed that different profiles of the Raman spectrum in this wavenumber range are associated with different conformations of the molecule In this sense when we observe the Raman spectra of PM as a function of pressure we note that between 00 and 11 GPa the most intense band at 00 GPa split into three bands (marked by up arrows) In the spectrum taken at 17 GPa the separation is very clear and when pressure is further increased the bands become clearly distinct But between 65 and 78 GPa the spectrum changes abruptly indicating that between these two pressure values the proline molecules undergo a great conformational change Because we have observed additionally changes in the low wavenumber region we can understand that both conformational change and structural phase transition take place for PM crystal As observed in the other spectral regions the original spectrum at 00 GPa is recovered when pressure is released
wwwintechopencom
High Pressure Raman Spectra of Amino Acid Crystals
47
Fig 5 Raman spectra of PM under several pressure conditions from 00 to 118 GPa in the spectral range 800 ndash 1100 cm-1
Data can give us some insights related to the behaviour of molecules of proline as the crystal is compressed For example in a previous study on -glycine the softening of a bending of CO2- was associated to a decrease in the intra-layer hydrogen bond strength while the stiffening of the same vibration was associated to an increase in the bond strength (Dawson et al 2005) For PM we have observed that the band associated to both bending of CO2- (CO2-) and rocking of CO2- r(CO2-) increase wavenumbers from 11 to 65 GPa and between 65 and 78 GPa decrease wavenumber for (CO2-) the decreasing is represented by the two dashed lines in Figure 3 between the spectra of 65 and 78 GPa We have also observed an additional increasing of wavenumbers for pressures higher than 78 GPa This suggests that the intra-layer hydrogen bond strength is stiffened up to 65 GPa between 65 and 78 GPa the hydrogen bond strength is softened and above 80 GPa the hydrogen bond is stiffened Additionally our results suggest that between 65 and 78 GPa occurs a structural rearrangement in such a way that the behaviour of the hydrogen bond strengths is changed This rearrangement is enough to change the symmetry of the crystal because
wwwintechopencom
Vibrational Spectroscopy
48
Fig 6 Raman spectra of PM under several pressure conditions from 00 to 118 GPa in the spectral range 2850 ndash 3200 cm-1
associated to it we observe great modifications in the Raman spectrum of low wavenumber region (Figure 2) Yet related to the phase transition between 65 and 78 GPa it is impressive the increase of intensity of a band in the spectrum taken at 65 GPa (marked by an arrow see Figure 4) which can be assigned as wagging of CH2 w(CH2) it change of intensity with the band close to it at ~ 1055 cm-1 at 00 GPa which is also assigned as w(CH2) indicating that a conformational change in the ring may also occurs when the crystal undergoes the phase transition at 65 - 78 GPa It is also interesting to note that the first transition occurs from a monoclinic to a phase with lower symmetry (another monoclinic our a triclinic phase) because in several regions including both internal and lattice mode spectral regions the number of peaks in the spectrum taken at 11 GPa is greater than the number of Raman peaks in the spectrum taken at 00 GPa It is also worth note that above 78 GPa almost all bands increases linewidth indicating that some disorder is introduced in the high pressure phase However the disorder does not occur in a high degree because when pressure is released down to 00 GPa the original spectrum is recovered It is known that the amorphization process is preceded by some disorder in the crystal structure however due to recovered of the original Raman spectrum after releasing pressure we can infer that when we arrive to 1118 GPa we are far away from the pressure point where eventually the PM crystal should present amorphization
wwwintechopencom
High Pressure Raman Spectra of Amino Acid Crystals
49
42 L-histidine hydrochloride monohydrate Related to the HHM (see Figure 8) which crystallizes in an orthorhombic structure belonging to the P212121 (D24) space group with four molecules of C6H9N3O2HClH2O per unit cell we were able to arrive up to 75 GPa and discovery a new polymorph of the material above 31 GPa The strong bond between N-H of the imidazole ring and the carboxyl group of a neighboring molecule is the fundamental intermolecular link resulting in a spiral arrangement along the c-axis (Donohue amp Caron 1964) The coupling of the four zwitterions in the unit cell leads to 297 optical normal modes decomposed into irreducible representations of the factor group D2 as Γop = 75 A + 74 (B1 + B2 + B3) and the acoustic modes can be expressed as Γac = B1 + B2 + B3 Under high pressure conditions modifications the Raman spectra are interpreted in terms of both conformational changes of the molecules in the unit cell and in terms of a phase transition Figure 9(a) presents the Raman spectra of HHM for several pressures in the spectral range from 50 to 660 cm-1 The region for wavenumbers lower than 200 cm-1 as previously stated is characteristic of the lattice vibration modes Increasing pressure we observe that the bands present blue shifts of their wavenumbers However between 27 and 31 GPa it is possible to note that a great change occurs in the Raman spectrum the peak marked by a square which is associated to torsion of CO2- (τ(CO2-)) splits in two new peaks which are marked by up arrows in the spectrum at 31 GPa In Figure 9(b) which presents the plot of experimental wavenumber as function of pressure we clearly observe the splitting of the band close to 180 cm-1 Additionally we note that for other bands discontinuities of wavenumbers are observed between 27 to 31 GPa (De Sousa et al 2011)
Fig 8 Unit cell of HHM seen along the b-axis
In this region it is also possible to observe many internal vibrations of the histidine molecule such as skeletal structure at 442 and 490 cm-1 torsion of NH3+ which is observed at 385 cm-1 and rocking of CO2- at 530 cm-1 Again as occurs with the spectra shown in the lattice mode region modifications are observed in the spectral range 27 - 31 GPa Among these changes we observed the disappearance of the bands at 276 and 500 cm-1 and the
wwwintechopencom
Vibrational Spectroscopy
50
Fig 9 (a) Raman spectra of HHM under several pressure conditions from 04 to 75 GPa in the spectral range 50 ndash 650 cm-1 (b) wavenumber versus pressure of the bands of HHM appearing in Fig 9(a)
appearance of a band at 473 cm-1 in the spectrum taken at 31 GPa We additionally note that the intensity of the band associated to torsion of NH3+ decreases with increasing pressure indicating that there occurs a conformational change of histidine molecule Such a conformational change can be understood as consequence of the change of the intermolecular hydrogen bond length With increasing pressure the band initially at 385 cm-
1 which is associated with a torsion vibration of the NH3+ unit shifts linearly toward higher wavenumbers we can say that the pressure decreases the length of the hydrogen bonds increasing the wavenumber of the band associated to torsional vibration of NH3+ unit Figure 10(a) presents the Raman spectra of HHM in the 650 ndash 1250 cm-1 interval for several pressure values up to 75 GPa In this spectral region it is expected to observe vibrations assigned to the deformation of CO2- stretching of both C-C and C-N wagging of H2O and rocking of NH3+ The band observed at ~ 694 cm-1 is associated to a deformation vibration of CO2- (CO2) while the out-of-plane vibration of CO2- (CO2) is observed at ~ 822 cm-1 The band at 807 cm-1 is associated with a wagging vibration of the water molecule w(H2O) The bands recorded at 1191 and 1210 cm-1 can be assigned as the rocking of NH3+ unit r(NH3+) In this spectral region some changes are observed in the range 27 ndash 31 GPa (i) the disappearance of the band at 694 cm-1 (ii) the appearance of a new weak band at 717 cm-1
(marked by a star in the Figure 10(a)) (iii) the inversion of intensity of the two bands located at 807 and 822 cm-1 which are related to units directly involved in the hydrogen bonds and (iv) the inversion of intensity of the two bands associated to a rocking of NH3+ unit r(NH3+) located at 1191 and 1210 cm-1 The dependence of the wavenumber versus pressure plot for this spectral region is presented in Fig 10(b) we note that many of the observed Raman modes show a small discontinuous change in the slope in the pressure-induced variation of its wavenumber in range 27 ndash 31 GPa
wwwintechopencom
High Pressure Raman Spectra of Amino Acid Crystals
51
Figure 11(a) shows the Raman spectra of the HHM crystal in the spectral range 1700-1400 cm-1 for pressure from 00 to 75 GPa Fig 11(b) shows the respective wavenumber vs pressure plots In this region one expects to observe vibrations assigned to a deformations of the imidazole ring of the histidine molecule asymmetric stretching of the CO2- units stretching of C=O among others In the Figure 11(a) two modifications are observed in the range 27 ndash 31 GPa The first change is the decreasing of the relative intensity of the band originally at 1433 cm-1 and the second one is the appearance of a band at 1642 cm-1 In the wavenumber versus pressure plot presented in Figure 11(b) a subtle discontinuity occurs in the range 27 ndash 31 GPa with appreciably differences in slopes where two modes change from positive to negative slopes
Fig 10 (a) Raman spectra of HHM under several pressure conditions from 04 to 75 GPa in the spectral range 650 ndash 1250 cm-1 (b) wavenumber versus pressure of the bands of HHM appearing in Fig 10(a)
The Raman spectra of HHM crystal in the range 3450-3125 cm-1 are shown in the Figure 12(a) and in the Figure 12(b) the respective wavenumber versus pressure plots are given In this region we expected to observe stretching vibrations of several units of the amino acids and of the water molecule (CH NH3+ and OH-) It is important to note that for wavenumbers lower than 3000 cm-1 there are some modes related to the mineral oil used as compression media In detail the band at 3111 cm-1 can be associated to a stretching vibration of NH3+ unit (NH3+) while the bands observed at 3155 and 3163 cm-1 are associated to a CH stretching vibration of imidazole ring The bands observed at 3374 and 3408 cm-1 are related to the OH- stretching of the water molecules In the pressure range 27 ndash 31 GPa main changes are observed such as the disappearance of the bands related to a OH- stretching vibration (initially located at 3367 and 3393 cm-1) the appearance of a band of weak intensity at 3424 cm-1 and discontinuities of the wavenumber curve of bands at 3155 and 3163 cm-1 which are associated with the CH stretching vibration
wwwintechopencom
Vibrational Spectroscopy
52
Fig 11 (a) Raman spectra of HHM under several pressure conditions from 04 to 75 GPa in the spectral range 1400 ndash 1670 cm-1 (b) wavenumber versus pressure of the bands of HHM appearing in Fig 11(a)
Fig 12 (a) Raman spectra of HHM under several pressure conditions from 04 to 75 GPa in the spectral range 2950 ndash 3450 cm-1 (b) wavenumber versus pressure of the bands of HHM appearing in Fig 12(a)
wwwintechopencom
High Pressure Raman Spectra of Amino Acid Crystals
53
Table 2 gives a quantitative analysis of the evolution of the Raman spectra of HHM crystal with pressure where fitting of all bands to a linear expression ω = ω0 + P is furnished In Table 2 the first column (ωobs) represents the wavenumber of the Raman bands observed at room pressure the second and third columns correspond to adjustment of data for pressure values between 0 and 27 GPa and the two last columns correspond to fitting of the high-pressure phase that observed between 31 and 75 GPa A resume of the modifications observed in all spectral regions of the Raman spectra of HHM is as follows (i) splitting of the band in the low-wavenumber lattice range (ii) change in the number of bands associated to internal modes (iii) wavenumber shifts with discontinuities (iv) changes in the relative intensities of the vibrational bands It is important to state that changes were observed for the deformation vibrations of the OH- of the water molecule as well as of the NH3+ and CO2- groups of the amino acid molecule This picture indicates large conformational changes of the molecules in the unit cell Related to HHM beyond the hydrogen bonds originated from the histidine molecule there are two hydrogen bonds from the water molecule It is interesting to note from Figure 12(b) that the wavenumber of OH- stretching (OH-) decreases with increasing pressure However the OH units participate of hydrogen bonds one to a carboxyl oxygen and another to the chloride ion This means that between 00 and 31 GPa the hydrogen bond strength increases and the wavenumber of(OH-) decreases in this pressure range Also after the phase transition the wavenumber of (OH-) suffers a jump and continues to decrease up to the highest pressure obtained in our experiments Such a picture indicates a further increase of the hydrogen bonds formed by the water molecules and confirms that these bonds are playing an important role in the mechanism of the transition It is interesting to note that similar changes in the low-wavenumber region were also observed for the same crystal when subjected to low temperatures
ωobs
(cm-1)
Phase 1
(0 le P le 27 GPa) Phase 2
(31 le P le 75 GPa)
ω0
(cm-1)
(cm-1)(GPa)-1 ω0
(cm-1)
(cm-1)(GPa)-1
94 945 0669 937 -0103
105 1052 0276 1002 1771
121 1214 -1087 1109 2092
136 1357 1616 1360 0623
149 1497 2128 - -
159 1568 8033 1483 8105
- - - 1639 9960
188 1891 7661 1902 8059
270 2697 3093 - -
293 2919 6118 2945 7683
385 3846 7236 4015 1675
442 4423 1223 4423 1461
wwwintechopencom
Vibrational Spectroscopy
54
ωobs
(cm-1)
Phase 1
(0 le P le 27 GPa) Phase 2
(31 le P le 75 GPa)
ω0
(cm-1)
(cm-1)(GPa)-1 ω0
(cm-1)
(cm-1)(GPa)-1
- - - 4707 0785
491 490 5 3319 - -
530 5304 4335 - -
609 6078 5312 6208 2463
693 6935 1529 - -
- - - 7064 3449
807 8067 2042 8047 1467
824 8240 -0498 8204 1442
838 8361 7335 8504 3124
875 8734 6438 8881 2777
917 9173 0810 9187 2356
963 9630 2757 9636 2411
980 9787 4489 9787 5206
1068 10667 4790 10732 3418
1141 11403 1890 11403 2744
1162 11619 2611 11674 1120
1190 11900 2277 11885 1637
1208 12079 2859 12101 1341
1434 14345 1316 14382 0846
1448 14481 3059 14554 1677
1463 14621 4415 14760 0778
1481 14813 4238 14970 -0619
1609 16093 2739 16166 -0374
- - - 16249 2736
3111 31110 0919 31045 2914
3154 31546 1287 31532 6564
3164 31626 5305 31593 7905
3375 33739 -2638 - -
3407 34081 -5745 - -
- - - 34371 -3169
Table 2 Wavenumber values of the bands appearing in the HHM spectrum at 00 GPa (ωobs) and adjustment data by linear fitting (P) for the two phases
wwwintechopencom
High Pressure Raman Spectra of Amino Acid Crystals
55
5 Conclusions
The results suggested that L-proline monohydrate undergoes two phase transitions one between 00 and 11 GPa and a second between 65 and 78 GPa In both transitions it was possible to observed changes in the spectrum profile discontinuities in the wavenumber versus pressure plots in the lattice region of the spectrum and the appearance of news bands By releasing the pressure after attaining a maximum of 118 GPa the atmospheric pressure spectrum was fully recovered showing that the pressure-induced transitions undergone by polycrystalline L-proline crystal are reversible In the first transition it was observed the splitting of bands associated to (CCN) (CO2-) and (CH) vibrations The band associated to (skel) has disappeared In the second one we have observed the red shift of r(CO2-) significant changes in the intensity of the bands associated to the sc(CO2-) and w(CH2) vibrations and the splits of (CCN) + (CC) and r(NH2+) that also has lost intensity These modifications were interpreted as conformational changes of molecules in the unit cell Because these changes involve moieties that participate in hydrogen bonds we suppose that these hydrogen bonds have also been modified Modifications of hydrogen bonds can trigger some molecular rearrangements that lead to structural phase transitions In our work this hypothesis was supported by the changes that were observed in the region of the lattice modes for both phase transitions Therefore the results suggested two structural phase transitions one between 00 and 11 GPa and another between 65 and 78 GPa accompanied by significant conformational changes of molecules in the L-proline monohydrated crystal The results also suggest that HHM crystal undergoes a phase transition between 27 and 31 GPa when it is submitted to high pressure conditions up to 75 GPa The main changes observed in the Raman spectra was the splitting of the band in the low-wavenumber lattice range change in the number of bands associated to internal modes and wavenumber shifts with discontinuities Having described the behavior of two amino acid crystals under pressure and looked back at the past fourteen years of research we can ask to ourselves what does the future hold Based on the studies performed we believe that the use of several techniques such as neutron and Raman scattering as well as thermal and infrared analyses can help us to give a complete picture about hydrogen bond and the behavior of amino acids under pressure Maybe the study of peptide under similar external conditions should be the next road to be walked
6 Acknowledgment
Authors acknowledge CAPES CNPq and FUNCAP for financial support
7 References
Barthes M Bordallo HN Deacutenoyer F Lorenzo J-E Zaccaro J Robert A amp Zontone F (2004) Micro-transitions or breathers in L-alanine The European Physical Journal B Vol 37 No 3 (February 2004) pp 375-382 ISSN 1434-6028
Boldyreva EV Drebushchak VA Drebushchak TN Paukov IE Kovalevskaya YA amp Shutova ES (2003a) Polymorphism of glycine Part I Journal of Thermal Analysis and Calorimetry Vol 73 No 2 (August 2003) pp 409-418 ISSN 1388-6150
wwwintechopencom
Vibrational Spectroscopy
56
Boldyreva EV Drebushchak VA Drebushchak TN Paukov IE Kovalevskaya YA amp Shutova ES (2003b) Polymorphism of glycine Part II Journal of Thermal Analysis and Calorimetry Vol 73 No 2 (August 2003) pp 419-428 ISSN 1388-6150
Boldyreva EV Ivashevskaya SN Sowa H Ahsbahs H amp Weber H-P (2004) Effect of High Pressure on Crystalline Glycine A New High-Pressure Polymorph Doklady Physical Chemistry Vol 396 No 1 (May 2004) pp 111-114 ISSN 0012-5016
Boldyreva EV Ivashevskaya SN Sowa H Ahsbahs H amp Weber H-P (2005a) Effect of hydrostatic pressure on the -polymorph of glycine 1 A polymorphic transition into a new -form Zeitschrift fuumlr Kristallographie Vol 220 No 1 ( January 2005) pp 50- 57 ISSN 0044-2968
Boldyreva EV Kolesnik EN Drebushchak TN Ahsbahs H Beukes JA amp Weber H-P (2005b) A comparative study of the anisotropy of a lattice strain induced in the crystals of L-serine by cooling down to 100 K or by increasing pressure up to 44 GPa Zeitschrift fuumlr Kristallographie Vol 220 No 1 (January 2005) pp 58- 65 ISSN 0044-2968
Boldyreva EV Kolesnik EN Drebushchak TN Ahsbahs H amp Seryotkin YV (2006a) A comparative study of the anisotropy of a lattice strain induced in the crystals of DL-serine by cooling down to 100 K or by increasing pressure up to 86 GPa A comparison with L-serine Zeitschrift fuumlr Kristallographie Vol 221 No 2 (2006) pp 150- 161 ISSN 0044-2968
Boldyreva EV Sowa H Seryotkin YV Drebushchak TN Ahsbahs H Chernyshev V amp Dmitriev V (2006b) Pressure-induced phase transitions in crystalline L-serine studied by single crystal and gigh-resolution powder X-ray diffraction Chemical Physics Letters Vol 429 No 4-6 (October 2006) pp 474-478 ISSN 0009-2614
Boldyreva E (2007a) Cristalline Amino Acids A Link between Chemistry Materials Science and Biology In Models Mysteries and Magic of Molecules Boeyens JCA amp Ogilvie JF pp 167-192 Springer ISBN 978-1-4020-5940-7 Netherlands
Boldyreva E (2007b) High-Pressure Polymorphs of Molecular Solids When Are They Formed and When Are They Not Some Examples of the Role of Kinetic Control Crystal Growth amp Design Vol 7 No 9 (August 2007) pp 1662-1668 ISSN 1528-7483
Dawson A Allan DR Belmonte SA Clark SJ David WIF McGregor PA Parsons S Pulham CR amp Sawyer L (2005) Effect of high pressure on the crystal structures of polymorphs of glycine Crystal Growth amp Design Vol 5 No 4 (May 2005) pp 1415-1427 ISSN 1528-7483
Destro R Marsh RE amp Bianchi R (1988) A low-temperature (23K) study of L-alanine The Journal of Physical Chemistry Vol 92 No 4 (February 1988) pp 966-973 ISSN 0022-3654
De Sousa GP Freire PTC Lima Jr JA Mendes Filho J amp Melo FEA (2011) High-pressure Raman spectra of L-histidine hydrochloride monohydrate cristal Vibrational Spectroscopy Vol 57 No 1 (September 2011) pp 102-107 ISSN 0924-2031
Donohue J amp Caron A (1964) Refinement of cristal structure of histidine hydrochloride monohydrate Acta Crystallographica Vol 17 No 9 (September 1964) pp 1178-amp ISSN 0108-7673
wwwintechopencom
High Pressure Raman Spectra of Amino Acid Crystals
57
Faccedilanha Filho PF Freire PTC Lima KCV Mendes Filho J Melo FEA amp Pizani PS (2008) High temperature Raman spectra of L-leucine crystals Brazilian Journal of Physics Vol 38 No 1 (March 2008) pp 131-137 ISSN 0103-9733
Faccedilanha Filho PF Freire PTC Melo FEA Lemos V Mendes Filho J Pizani PS amp Rossatto DZ (2009) Pressure-induced phase transitions in L-leucine crystal Journal of Raman Spectroscopy Vol 40 No 1 (January 2009) pp 46-51 ISSN 1097-4555
Freire PTC (2010) Pressure-Induced Phase Transitions in Crystalline Amino Acids In High Pressure Crystallography ndash From Fundamental Phenomena to Technological Applications Boldyreva E amp Dera P pp 559-572 Springer ISBN 978-904-8192-60-1 New York USA
Funnel NP Dawson A Francis D Lennie DR Marshall WG Moggach SA Warren JE amp Parsons S (2010) The effect of pressure on the crystal structure of l-alanine CrystEngComm Vol 12 No 9 (September 2010) pp 2573-2583 ISSN 1466-8033
Goryainov SV Kolesnik EN amp Boldyreva EV (2005) A reversible pressure-induced phase transition in -glycine at 076 GPa Physica B Condensed Matter Vol 357 No 3-4 (March 2005) pp 340-347 ISSN 0921-4526
Goryainov SV Kolesnik EN amp Boldyreva EV (2006) Raman observation of a new (ζ) polymorph of glycine Chemical Physics Letters Vol 419 No 4-6 (February 2006) pp 496-500 ISSN 0009-2614
Harding MM amp Howieson RM (1976) L-Leucine Acta Crystallographica Section B Vol 32 No 2 (February 1976) pp 633-634 ISSN 1600-5740
Herlinger AW amp Long TV (1970) Laser Raman and infrared spectra of amino acids and their metal complexes 3 Proline and bisprolinato complexes Journal of the American Chemical Society Vol 92 No 22 (November 1970) pp 6481-6486 ISSN 0002-7863
Hermiacutenio da Silva J Lemos V Freire PTC Melo FEA Mendes Filho J Lima Jr JA amp Pizani PS (2009) Stability of the crystal structure of L-valine under high pressure Physica Status Solidi B Vol 246 No 3 (March 2009) pp 553-557 ISSN 0370-1972
Lima JA Freire PTC Melo FEA Lemos V Mendes Filho J amp Pizani PS (2008) High pressure Raman spectra of L-methionine Crystal Journal of Raman Spectroscopy Vol 39 No 10 (October 2008) pp 1356-1363 ISSN 1097-4555
Migliori A Maxton PM Clogston AM Zirngiebl E amp Lowe M (1988) Anomalous temperature dependence in the Raman spectra of l-alanine Evidence for dynamic localization Physical Review B Vol 38 No 18 (December 1988) pp 13464-13467 ISSN 1098-0121
Minkov VS Krylov AS Boldyreva EV Goryainov SN Bizyaev SN amp Vtyurin AN (2008) Pressure-Induced Phase Transitions in Crystalline L- and DL-Cysteine The Journal of Physical Chemistry B Vol 112 No 30 (July 2008) pp 8851-8854 ISSN 1520-6106
Minkov VS Goryainov SV Boldyreva EV amp Goumlrbitz CH (2010) Raman study of pressure-induced phase transitions in the crystals of orthorhombic and monoclinic polymorphs of L-cysteine dynamics of the side-chain Journal of Raman Spectroscopy Vol 41 No 12 (December 2010) pp 1458-1468 ISSN 1097-4555
Moggach SA Allan DR Morrison PA Parsons S amp Sawyer L (2005) Effect of pressure on the crystal structure of L-serine-I and the crystal structure of L-serine-II
wwwintechopencom
Vibrational Spectroscopy
58
at 54 GPa Acta Crystallographica Section B Vol 61 No 1 (February 2005) pp 58-68 ISSN 0108-7681
Moggach SA Marshall WG amp Parsons S (2006) High-pressure neutron diffraction study of L-serine-I and L-serine-II and the structure of L-serine-III at 81 GPa Acta Crystallographica Section B Vol 62 No 5 (October 2006) pp 815-825 ISSN 0108-7681
Moreno AJD Freire PTC Melo FEA Arauacutejo-Silva MA Guedes I Mendes Filho J (1997) Pressure-induced phase transitions in monohydrated l-asparagine aminoacid crystals Solid State Communications Vol 103 No 12 (September 1997) pp 655-658 ISSN 0038-1098
Murli C Sharma SK Karmakar S amp Sikka SK (2003) -Glycine under high pressures a Raman scattering study Physica B Condensed Matter Vol 339 No 1 (November 2003) pp 23-30 ISSN 0921-4526
Murli C Vasanthi R amp Sharma SM (2006) Raman spectroscopic investigations of DL-serine and DL-valine under pressure Chemical Physics Vol 331 No 1 (December 2006) pp 77-84 ISSN 0301-0104
Olsen JS Gerward L Freire PTC Mendes Filho J Melo FEA amp Souza Filho AG (2008) Pressure-induced phase transitions in L-alanine crystals Journal of Physics and Chemistry of Solids Vol 69 No 7 (July 2008) pp 1641-1645 ISSN 0022-3697
Sabino AS De Sousa GP Luz-Lima C Freire PTC Melo FEA amp Mendes Filho J (2009) High-pressure Raman spectra of L-isoleucine crystals Solid State Communications Vol 149 No 37-38 (October 2009) pp 1553-1556 ISSN 0038-1098
Sasaki JM Freire PTC Moreno AJD Melo FEA Guedes I Mendes Filho J Shu J Hu J amp Matildeo HK (2000) Single crystal X-ray diffraction in monohydrate L-asparagine under hydrostatic pressure Science and Technology of High Pressure Proceedings of AIRAPT-17 Hyderabad India 2000
Seijas LE Delgado GE Mora AJ Fitch AN amp Brunelli M (2010) On the Crystal structures and hydrogen bond patterns in proline pseudopolymorphs Powder Diffraction Vol 25 No 3 (September 2010) pp 235-240 ISSN 0885-7156
Silva BL Freire PTC Melo FEA Mendes Filho J Pimenta MA amp Dantas MSS (2000) High-pressure Raman spectra of L-threonine crystal Journal of Raman Spectroscopy Vol 31 No 6 (June 2000) pp 519-522 ISSN 1097-4555
Teixeira AMR Freire PTC Moreno AJD Sasaki JM Ayala AP Mendes Filho J amp Melo FEA (2000) High-pressure Raman study of l-alanine crystal Solid State Communications Vol 116 No 7 (October 2000) pp 405-409 ISSN 0038-1098
Tumanov NA Boldyreva EV Kolesov BA Kurnosov AV amp Quesada Cabrera R (2010) Pressure-induced phase transitions in L-alanine revisited Acta Crystallographica Section B Vol 66 No 4 (August 2010) pp 458-371 ISSN 1600-5740
Yamashita M Inomata S Ishikawa K Kashiwagi T Matsuo H Sawamura S amp Kato M (2007) A high-pressure polymorph of L--leucine Acta Crystallographica Section E Vol 63 No 5 (May 2007) pp o2762-o2764 ISSN 1600-5368
wwwintechopencom
Vibrational SpectroscopyEdited by Prof Dominique De Caro
ISBN 978-953-51-0107-9Hard cover 168 pagesPublisher InTechPublished online 24 February 2012Published in print edition February 2012
InTech EuropeUniversity Campus STeP Ri Slavka Krautzeka 83A 51000 Rijeka Croatia Phone +385 (51) 770 447 Fax +385 (51) 686 166wwwintechopencom
InTech ChinaUnit 405 Office Block Hotel Equatorial Shanghai No65 Yan An Road (West) Shanghai 200040 China
Phone +86-21-62489820 Fax +86-21-62489821
The infrared and Raman spectroscopy have applications in numerous fields namely chemistry physicsastronomy biology medicine geology mineralogy etc This book provides some examples of the use ofvibrational spectroscopy in supramolecular chemistry inorganic chemistry solid state physics but also in thefields of molecule-based materials or organic-inorganic interfaces
How to referenceIn order to correctly reference this scholarly work feel free to copy and paste the following
Paulo de Tarso Cavalcante Freire Joseacute Alves Lima Juacutenior Bruno Tavares de Oliveira Abagaro Gardecircnia deSousa Pinheiro Joseacute de Arimateacutea Freitas e Silva Josueacute Mendes Filho and Francisco Erivan de Abreu Melo(2012) High Pressure Raman Spectra of Amino Acid Crystals Vibrational Spectroscopy Prof Dominique DeCaro (Ed) ISBN 978-953-51-0107-9 InTech Available from httpwwwintechopencombooksvibrational-spectroscopyhigh-pressure-raman-spectra-of-amino-acid-crystals
copy 2012 The Author(s) Licensee IntechOpen This is an open access articledistributed under the terms of the Creative Commons Attribution 30License which permits unrestricted use distribution and reproduction inany medium provided the original work is properly cited

Vibrational Spectroscopy
46
Fig 4 Raman spectra of PM under several pressure conditions from 00 to 118 GPa in the spectral range 600 ndash 1250 cm-1
Figure 5 shows the Raman spectra of PM crystal in the 800 ndash 1100 cm-1 spectral region The dominant band in the spectrum taken at 00 GPa observed at 897 cm-1 is associated to the rocking vibration of NH2+ r(NH2+) The changes occurring in the first phase transition are not impressive but we note that between 65 and 78 GPa the band lost intensity and splits into two bands Above 78 GPa blue shifts of the wavenumbers are verified but no great change is present up to the highest pressure arrived in the experiment Decreasing pressure down to 00 GPa again we observe that the original spectrum is also recovered in this region In the spectral region presented in Figure 6 it is expected to be observed bands associated to the stretching vibrations of CH and CH2 units A theoretical study performed on L-methionine showed that different profiles of the Raman spectrum in this wavenumber range are associated with different conformations of the molecule In this sense when we observe the Raman spectra of PM as a function of pressure we note that between 00 and 11 GPa the most intense band at 00 GPa split into three bands (marked by up arrows) In the spectrum taken at 17 GPa the separation is very clear and when pressure is further increased the bands become clearly distinct But between 65 and 78 GPa the spectrum changes abruptly indicating that between these two pressure values the proline molecules undergo a great conformational change Because we have observed additionally changes in the low wavenumber region we can understand that both conformational change and structural phase transition take place for PM crystal As observed in the other spectral regions the original spectrum at 00 GPa is recovered when pressure is released
wwwintechopencom
High Pressure Raman Spectra of Amino Acid Crystals
47
Fig 5 Raman spectra of PM under several pressure conditions from 00 to 118 GPa in the spectral range 800 ndash 1100 cm-1
Data can give us some insights related to the behaviour of molecules of proline as the crystal is compressed For example in a previous study on -glycine the softening of a bending of CO2- was associated to a decrease in the intra-layer hydrogen bond strength while the stiffening of the same vibration was associated to an increase in the bond strength (Dawson et al 2005) For PM we have observed that the band associated to both bending of CO2- (CO2-) and rocking of CO2- r(CO2-) increase wavenumbers from 11 to 65 GPa and between 65 and 78 GPa decrease wavenumber for (CO2-) the decreasing is represented by the two dashed lines in Figure 3 between the spectra of 65 and 78 GPa We have also observed an additional increasing of wavenumbers for pressures higher than 78 GPa This suggests that the intra-layer hydrogen bond strength is stiffened up to 65 GPa between 65 and 78 GPa the hydrogen bond strength is softened and above 80 GPa the hydrogen bond is stiffened Additionally our results suggest that between 65 and 78 GPa occurs a structural rearrangement in such a way that the behaviour of the hydrogen bond strengths is changed This rearrangement is enough to change the symmetry of the crystal because
wwwintechopencom
Vibrational Spectroscopy
48
Fig 6 Raman spectra of PM under several pressure conditions from 00 to 118 GPa in the spectral range 2850 ndash 3200 cm-1
associated to it we observe great modifications in the Raman spectrum of low wavenumber region (Figure 2) Yet related to the phase transition between 65 and 78 GPa it is impressive the increase of intensity of a band in the spectrum taken at 65 GPa (marked by an arrow see Figure 4) which can be assigned as wagging of CH2 w(CH2) it change of intensity with the band close to it at ~ 1055 cm-1 at 00 GPa which is also assigned as w(CH2) indicating that a conformational change in the ring may also occurs when the crystal undergoes the phase transition at 65 - 78 GPa It is also interesting to note that the first transition occurs from a monoclinic to a phase with lower symmetry (another monoclinic our a triclinic phase) because in several regions including both internal and lattice mode spectral regions the number of peaks in the spectrum taken at 11 GPa is greater than the number of Raman peaks in the spectrum taken at 00 GPa It is also worth note that above 78 GPa almost all bands increases linewidth indicating that some disorder is introduced in the high pressure phase However the disorder does not occur in a high degree because when pressure is released down to 00 GPa the original spectrum is recovered It is known that the amorphization process is preceded by some disorder in the crystal structure however due to recovered of the original Raman spectrum after releasing pressure we can infer that when we arrive to 1118 GPa we are far away from the pressure point where eventually the PM crystal should present amorphization
wwwintechopencom
High Pressure Raman Spectra of Amino Acid Crystals
49
42 L-histidine hydrochloride monohydrate Related to the HHM (see Figure 8) which crystallizes in an orthorhombic structure belonging to the P212121 (D24) space group with four molecules of C6H9N3O2HClH2O per unit cell we were able to arrive up to 75 GPa and discovery a new polymorph of the material above 31 GPa The strong bond between N-H of the imidazole ring and the carboxyl group of a neighboring molecule is the fundamental intermolecular link resulting in a spiral arrangement along the c-axis (Donohue amp Caron 1964) The coupling of the four zwitterions in the unit cell leads to 297 optical normal modes decomposed into irreducible representations of the factor group D2 as Γop = 75 A + 74 (B1 + B2 + B3) and the acoustic modes can be expressed as Γac = B1 + B2 + B3 Under high pressure conditions modifications the Raman spectra are interpreted in terms of both conformational changes of the molecules in the unit cell and in terms of a phase transition Figure 9(a) presents the Raman spectra of HHM for several pressures in the spectral range from 50 to 660 cm-1 The region for wavenumbers lower than 200 cm-1 as previously stated is characteristic of the lattice vibration modes Increasing pressure we observe that the bands present blue shifts of their wavenumbers However between 27 and 31 GPa it is possible to note that a great change occurs in the Raman spectrum the peak marked by a square which is associated to torsion of CO2- (τ(CO2-)) splits in two new peaks which are marked by up arrows in the spectrum at 31 GPa In Figure 9(b) which presents the plot of experimental wavenumber as function of pressure we clearly observe the splitting of the band close to 180 cm-1 Additionally we note that for other bands discontinuities of wavenumbers are observed between 27 to 31 GPa (De Sousa et al 2011)
Fig 8 Unit cell of HHM seen along the b-axis
In this region it is also possible to observe many internal vibrations of the histidine molecule such as skeletal structure at 442 and 490 cm-1 torsion of NH3+ which is observed at 385 cm-1 and rocking of CO2- at 530 cm-1 Again as occurs with the spectra shown in the lattice mode region modifications are observed in the spectral range 27 - 31 GPa Among these changes we observed the disappearance of the bands at 276 and 500 cm-1 and the
wwwintechopencom
Vibrational Spectroscopy
50
Fig 9 (a) Raman spectra of HHM under several pressure conditions from 04 to 75 GPa in the spectral range 50 ndash 650 cm-1 (b) wavenumber versus pressure of the bands of HHM appearing in Fig 9(a)
appearance of a band at 473 cm-1 in the spectrum taken at 31 GPa We additionally note that the intensity of the band associated to torsion of NH3+ decreases with increasing pressure indicating that there occurs a conformational change of histidine molecule Such a conformational change can be understood as consequence of the change of the intermolecular hydrogen bond length With increasing pressure the band initially at 385 cm-
1 which is associated with a torsion vibration of the NH3+ unit shifts linearly toward higher wavenumbers we can say that the pressure decreases the length of the hydrogen bonds increasing the wavenumber of the band associated to torsional vibration of NH3+ unit Figure 10(a) presents the Raman spectra of HHM in the 650 ndash 1250 cm-1 interval for several pressure values up to 75 GPa In this spectral region it is expected to observe vibrations assigned to the deformation of CO2- stretching of both C-C and C-N wagging of H2O and rocking of NH3+ The band observed at ~ 694 cm-1 is associated to a deformation vibration of CO2- (CO2) while the out-of-plane vibration of CO2- (CO2) is observed at ~ 822 cm-1 The band at 807 cm-1 is associated with a wagging vibration of the water molecule w(H2O) The bands recorded at 1191 and 1210 cm-1 can be assigned as the rocking of NH3+ unit r(NH3+) In this spectral region some changes are observed in the range 27 ndash 31 GPa (i) the disappearance of the band at 694 cm-1 (ii) the appearance of a new weak band at 717 cm-1
(marked by a star in the Figure 10(a)) (iii) the inversion of intensity of the two bands located at 807 and 822 cm-1 which are related to units directly involved in the hydrogen bonds and (iv) the inversion of intensity of the two bands associated to a rocking of NH3+ unit r(NH3+) located at 1191 and 1210 cm-1 The dependence of the wavenumber versus pressure plot for this spectral region is presented in Fig 10(b) we note that many of the observed Raman modes show a small discontinuous change in the slope in the pressure-induced variation of its wavenumber in range 27 ndash 31 GPa
wwwintechopencom
High Pressure Raman Spectra of Amino Acid Crystals
51
Figure 11(a) shows the Raman spectra of the HHM crystal in the spectral range 1700-1400 cm-1 for pressure from 00 to 75 GPa Fig 11(b) shows the respective wavenumber vs pressure plots In this region one expects to observe vibrations assigned to a deformations of the imidazole ring of the histidine molecule asymmetric stretching of the CO2- units stretching of C=O among others In the Figure 11(a) two modifications are observed in the range 27 ndash 31 GPa The first change is the decreasing of the relative intensity of the band originally at 1433 cm-1 and the second one is the appearance of a band at 1642 cm-1 In the wavenumber versus pressure plot presented in Figure 11(b) a subtle discontinuity occurs in the range 27 ndash 31 GPa with appreciably differences in slopes where two modes change from positive to negative slopes
Fig 10 (a) Raman spectra of HHM under several pressure conditions from 04 to 75 GPa in the spectral range 650 ndash 1250 cm-1 (b) wavenumber versus pressure of the bands of HHM appearing in Fig 10(a)
The Raman spectra of HHM crystal in the range 3450-3125 cm-1 are shown in the Figure 12(a) and in the Figure 12(b) the respective wavenumber versus pressure plots are given In this region we expected to observe stretching vibrations of several units of the amino acids and of the water molecule (CH NH3+ and OH-) It is important to note that for wavenumbers lower than 3000 cm-1 there are some modes related to the mineral oil used as compression media In detail the band at 3111 cm-1 can be associated to a stretching vibration of NH3+ unit (NH3+) while the bands observed at 3155 and 3163 cm-1 are associated to a CH stretching vibration of imidazole ring The bands observed at 3374 and 3408 cm-1 are related to the OH- stretching of the water molecules In the pressure range 27 ndash 31 GPa main changes are observed such as the disappearance of the bands related to a OH- stretching vibration (initially located at 3367 and 3393 cm-1) the appearance of a band of weak intensity at 3424 cm-1 and discontinuities of the wavenumber curve of bands at 3155 and 3163 cm-1 which are associated with the CH stretching vibration
wwwintechopencom
Vibrational Spectroscopy
52
Fig 11 (a) Raman spectra of HHM under several pressure conditions from 04 to 75 GPa in the spectral range 1400 ndash 1670 cm-1 (b) wavenumber versus pressure of the bands of HHM appearing in Fig 11(a)
Fig 12 (a) Raman spectra of HHM under several pressure conditions from 04 to 75 GPa in the spectral range 2950 ndash 3450 cm-1 (b) wavenumber versus pressure of the bands of HHM appearing in Fig 12(a)
wwwintechopencom
High Pressure Raman Spectra of Amino Acid Crystals
53
Table 2 gives a quantitative analysis of the evolution of the Raman spectra of HHM crystal with pressure where fitting of all bands to a linear expression ω = ω0 + P is furnished In Table 2 the first column (ωobs) represents the wavenumber of the Raman bands observed at room pressure the second and third columns correspond to adjustment of data for pressure values between 0 and 27 GPa and the two last columns correspond to fitting of the high-pressure phase that observed between 31 and 75 GPa A resume of the modifications observed in all spectral regions of the Raman spectra of HHM is as follows (i) splitting of the band in the low-wavenumber lattice range (ii) change in the number of bands associated to internal modes (iii) wavenumber shifts with discontinuities (iv) changes in the relative intensities of the vibrational bands It is important to state that changes were observed for the deformation vibrations of the OH- of the water molecule as well as of the NH3+ and CO2- groups of the amino acid molecule This picture indicates large conformational changes of the molecules in the unit cell Related to HHM beyond the hydrogen bonds originated from the histidine molecule there are two hydrogen bonds from the water molecule It is interesting to note from Figure 12(b) that the wavenumber of OH- stretching (OH-) decreases with increasing pressure However the OH units participate of hydrogen bonds one to a carboxyl oxygen and another to the chloride ion This means that between 00 and 31 GPa the hydrogen bond strength increases and the wavenumber of(OH-) decreases in this pressure range Also after the phase transition the wavenumber of (OH-) suffers a jump and continues to decrease up to the highest pressure obtained in our experiments Such a picture indicates a further increase of the hydrogen bonds formed by the water molecules and confirms that these bonds are playing an important role in the mechanism of the transition It is interesting to note that similar changes in the low-wavenumber region were also observed for the same crystal when subjected to low temperatures
ωobs
(cm-1)
Phase 1
(0 le P le 27 GPa) Phase 2
(31 le P le 75 GPa)
ω0
(cm-1)
(cm-1)(GPa)-1 ω0
(cm-1)
(cm-1)(GPa)-1
94 945 0669 937 -0103
105 1052 0276 1002 1771
121 1214 -1087 1109 2092
136 1357 1616 1360 0623
149 1497 2128 - -
159 1568 8033 1483 8105
- - - 1639 9960
188 1891 7661 1902 8059
270 2697 3093 - -
293 2919 6118 2945 7683
385 3846 7236 4015 1675
442 4423 1223 4423 1461
wwwintechopencom
Vibrational Spectroscopy
54
ωobs
(cm-1)
Phase 1
(0 le P le 27 GPa) Phase 2
(31 le P le 75 GPa)
ω0
(cm-1)
(cm-1)(GPa)-1 ω0
(cm-1)
(cm-1)(GPa)-1
- - - 4707 0785
491 490 5 3319 - -
530 5304 4335 - -
609 6078 5312 6208 2463
693 6935 1529 - -
- - - 7064 3449
807 8067 2042 8047 1467
824 8240 -0498 8204 1442
838 8361 7335 8504 3124
875 8734 6438 8881 2777
917 9173 0810 9187 2356
963 9630 2757 9636 2411
980 9787 4489 9787 5206
1068 10667 4790 10732 3418
1141 11403 1890 11403 2744
1162 11619 2611 11674 1120
1190 11900 2277 11885 1637
1208 12079 2859 12101 1341
1434 14345 1316 14382 0846
1448 14481 3059 14554 1677
1463 14621 4415 14760 0778
1481 14813 4238 14970 -0619
1609 16093 2739 16166 -0374
- - - 16249 2736
3111 31110 0919 31045 2914
3154 31546 1287 31532 6564
3164 31626 5305 31593 7905
3375 33739 -2638 - -
3407 34081 -5745 - -
- - - 34371 -3169
Table 2 Wavenumber values of the bands appearing in the HHM spectrum at 00 GPa (ωobs) and adjustment data by linear fitting (P) for the two phases
wwwintechopencom
High Pressure Raman Spectra of Amino Acid Crystals
55
5 Conclusions
The results suggested that L-proline monohydrate undergoes two phase transitions one between 00 and 11 GPa and a second between 65 and 78 GPa In both transitions it was possible to observed changes in the spectrum profile discontinuities in the wavenumber versus pressure plots in the lattice region of the spectrum and the appearance of news bands By releasing the pressure after attaining a maximum of 118 GPa the atmospheric pressure spectrum was fully recovered showing that the pressure-induced transitions undergone by polycrystalline L-proline crystal are reversible In the first transition it was observed the splitting of bands associated to (CCN) (CO2-) and (CH) vibrations The band associated to (skel) has disappeared In the second one we have observed the red shift of r(CO2-) significant changes in the intensity of the bands associated to the sc(CO2-) and w(CH2) vibrations and the splits of (CCN) + (CC) and r(NH2+) that also has lost intensity These modifications were interpreted as conformational changes of molecules in the unit cell Because these changes involve moieties that participate in hydrogen bonds we suppose that these hydrogen bonds have also been modified Modifications of hydrogen bonds can trigger some molecular rearrangements that lead to structural phase transitions In our work this hypothesis was supported by the changes that were observed in the region of the lattice modes for both phase transitions Therefore the results suggested two structural phase transitions one between 00 and 11 GPa and another between 65 and 78 GPa accompanied by significant conformational changes of molecules in the L-proline monohydrated crystal The results also suggest that HHM crystal undergoes a phase transition between 27 and 31 GPa when it is submitted to high pressure conditions up to 75 GPa The main changes observed in the Raman spectra was the splitting of the band in the low-wavenumber lattice range change in the number of bands associated to internal modes and wavenumber shifts with discontinuities Having described the behavior of two amino acid crystals under pressure and looked back at the past fourteen years of research we can ask to ourselves what does the future hold Based on the studies performed we believe that the use of several techniques such as neutron and Raman scattering as well as thermal and infrared analyses can help us to give a complete picture about hydrogen bond and the behavior of amino acids under pressure Maybe the study of peptide under similar external conditions should be the next road to be walked
6 Acknowledgment
Authors acknowledge CAPES CNPq and FUNCAP for financial support
7 References
Barthes M Bordallo HN Deacutenoyer F Lorenzo J-E Zaccaro J Robert A amp Zontone F (2004) Micro-transitions or breathers in L-alanine The European Physical Journal B Vol 37 No 3 (February 2004) pp 375-382 ISSN 1434-6028
Boldyreva EV Drebushchak VA Drebushchak TN Paukov IE Kovalevskaya YA amp Shutova ES (2003a) Polymorphism of glycine Part I Journal of Thermal Analysis and Calorimetry Vol 73 No 2 (August 2003) pp 409-418 ISSN 1388-6150
wwwintechopencom
Vibrational Spectroscopy
56
Boldyreva EV Drebushchak VA Drebushchak TN Paukov IE Kovalevskaya YA amp Shutova ES (2003b) Polymorphism of glycine Part II Journal of Thermal Analysis and Calorimetry Vol 73 No 2 (August 2003) pp 419-428 ISSN 1388-6150
Boldyreva EV Ivashevskaya SN Sowa H Ahsbahs H amp Weber H-P (2004) Effect of High Pressure on Crystalline Glycine A New High-Pressure Polymorph Doklady Physical Chemistry Vol 396 No 1 (May 2004) pp 111-114 ISSN 0012-5016
Boldyreva EV Ivashevskaya SN Sowa H Ahsbahs H amp Weber H-P (2005a) Effect of hydrostatic pressure on the -polymorph of glycine 1 A polymorphic transition into a new -form Zeitschrift fuumlr Kristallographie Vol 220 No 1 ( January 2005) pp 50- 57 ISSN 0044-2968
Boldyreva EV Kolesnik EN Drebushchak TN Ahsbahs H Beukes JA amp Weber H-P (2005b) A comparative study of the anisotropy of a lattice strain induced in the crystals of L-serine by cooling down to 100 K or by increasing pressure up to 44 GPa Zeitschrift fuumlr Kristallographie Vol 220 No 1 (January 2005) pp 58- 65 ISSN 0044-2968
Boldyreva EV Kolesnik EN Drebushchak TN Ahsbahs H amp Seryotkin YV (2006a) A comparative study of the anisotropy of a lattice strain induced in the crystals of DL-serine by cooling down to 100 K or by increasing pressure up to 86 GPa A comparison with L-serine Zeitschrift fuumlr Kristallographie Vol 221 No 2 (2006) pp 150- 161 ISSN 0044-2968
Boldyreva EV Sowa H Seryotkin YV Drebushchak TN Ahsbahs H Chernyshev V amp Dmitriev V (2006b) Pressure-induced phase transitions in crystalline L-serine studied by single crystal and gigh-resolution powder X-ray diffraction Chemical Physics Letters Vol 429 No 4-6 (October 2006) pp 474-478 ISSN 0009-2614
Boldyreva E (2007a) Cristalline Amino Acids A Link between Chemistry Materials Science and Biology In Models Mysteries and Magic of Molecules Boeyens JCA amp Ogilvie JF pp 167-192 Springer ISBN 978-1-4020-5940-7 Netherlands
Boldyreva E (2007b) High-Pressure Polymorphs of Molecular Solids When Are They Formed and When Are They Not Some Examples of the Role of Kinetic Control Crystal Growth amp Design Vol 7 No 9 (August 2007) pp 1662-1668 ISSN 1528-7483
Dawson A Allan DR Belmonte SA Clark SJ David WIF McGregor PA Parsons S Pulham CR amp Sawyer L (2005) Effect of high pressure on the crystal structures of polymorphs of glycine Crystal Growth amp Design Vol 5 No 4 (May 2005) pp 1415-1427 ISSN 1528-7483
Destro R Marsh RE amp Bianchi R (1988) A low-temperature (23K) study of L-alanine The Journal of Physical Chemistry Vol 92 No 4 (February 1988) pp 966-973 ISSN 0022-3654
De Sousa GP Freire PTC Lima Jr JA Mendes Filho J amp Melo FEA (2011) High-pressure Raman spectra of L-histidine hydrochloride monohydrate cristal Vibrational Spectroscopy Vol 57 No 1 (September 2011) pp 102-107 ISSN 0924-2031
Donohue J amp Caron A (1964) Refinement of cristal structure of histidine hydrochloride monohydrate Acta Crystallographica Vol 17 No 9 (September 1964) pp 1178-amp ISSN 0108-7673
wwwintechopencom
High Pressure Raman Spectra of Amino Acid Crystals
57
Faccedilanha Filho PF Freire PTC Lima KCV Mendes Filho J Melo FEA amp Pizani PS (2008) High temperature Raman spectra of L-leucine crystals Brazilian Journal of Physics Vol 38 No 1 (March 2008) pp 131-137 ISSN 0103-9733
Faccedilanha Filho PF Freire PTC Melo FEA Lemos V Mendes Filho J Pizani PS amp Rossatto DZ (2009) Pressure-induced phase transitions in L-leucine crystal Journal of Raman Spectroscopy Vol 40 No 1 (January 2009) pp 46-51 ISSN 1097-4555
Freire PTC (2010) Pressure-Induced Phase Transitions in Crystalline Amino Acids In High Pressure Crystallography ndash From Fundamental Phenomena to Technological Applications Boldyreva E amp Dera P pp 559-572 Springer ISBN 978-904-8192-60-1 New York USA
Funnel NP Dawson A Francis D Lennie DR Marshall WG Moggach SA Warren JE amp Parsons S (2010) The effect of pressure on the crystal structure of l-alanine CrystEngComm Vol 12 No 9 (September 2010) pp 2573-2583 ISSN 1466-8033
Goryainov SV Kolesnik EN amp Boldyreva EV (2005) A reversible pressure-induced phase transition in -glycine at 076 GPa Physica B Condensed Matter Vol 357 No 3-4 (March 2005) pp 340-347 ISSN 0921-4526
Goryainov SV Kolesnik EN amp Boldyreva EV (2006) Raman observation of a new (ζ) polymorph of glycine Chemical Physics Letters Vol 419 No 4-6 (February 2006) pp 496-500 ISSN 0009-2614
Harding MM amp Howieson RM (1976) L-Leucine Acta Crystallographica Section B Vol 32 No 2 (February 1976) pp 633-634 ISSN 1600-5740
Herlinger AW amp Long TV (1970) Laser Raman and infrared spectra of amino acids and their metal complexes 3 Proline and bisprolinato complexes Journal of the American Chemical Society Vol 92 No 22 (November 1970) pp 6481-6486 ISSN 0002-7863
Hermiacutenio da Silva J Lemos V Freire PTC Melo FEA Mendes Filho J Lima Jr JA amp Pizani PS (2009) Stability of the crystal structure of L-valine under high pressure Physica Status Solidi B Vol 246 No 3 (March 2009) pp 553-557 ISSN 0370-1972
Lima JA Freire PTC Melo FEA Lemos V Mendes Filho J amp Pizani PS (2008) High pressure Raman spectra of L-methionine Crystal Journal of Raman Spectroscopy Vol 39 No 10 (October 2008) pp 1356-1363 ISSN 1097-4555
Migliori A Maxton PM Clogston AM Zirngiebl E amp Lowe M (1988) Anomalous temperature dependence in the Raman spectra of l-alanine Evidence for dynamic localization Physical Review B Vol 38 No 18 (December 1988) pp 13464-13467 ISSN 1098-0121
Minkov VS Krylov AS Boldyreva EV Goryainov SN Bizyaev SN amp Vtyurin AN (2008) Pressure-Induced Phase Transitions in Crystalline L- and DL-Cysteine The Journal of Physical Chemistry B Vol 112 No 30 (July 2008) pp 8851-8854 ISSN 1520-6106
Minkov VS Goryainov SV Boldyreva EV amp Goumlrbitz CH (2010) Raman study of pressure-induced phase transitions in the crystals of orthorhombic and monoclinic polymorphs of L-cysteine dynamics of the side-chain Journal of Raman Spectroscopy Vol 41 No 12 (December 2010) pp 1458-1468 ISSN 1097-4555
Moggach SA Allan DR Morrison PA Parsons S amp Sawyer L (2005) Effect of pressure on the crystal structure of L-serine-I and the crystal structure of L-serine-II
wwwintechopencom
Vibrational Spectroscopy
58
at 54 GPa Acta Crystallographica Section B Vol 61 No 1 (February 2005) pp 58-68 ISSN 0108-7681
Moggach SA Marshall WG amp Parsons S (2006) High-pressure neutron diffraction study of L-serine-I and L-serine-II and the structure of L-serine-III at 81 GPa Acta Crystallographica Section B Vol 62 No 5 (October 2006) pp 815-825 ISSN 0108-7681
Moreno AJD Freire PTC Melo FEA Arauacutejo-Silva MA Guedes I Mendes Filho J (1997) Pressure-induced phase transitions in monohydrated l-asparagine aminoacid crystals Solid State Communications Vol 103 No 12 (September 1997) pp 655-658 ISSN 0038-1098
Murli C Sharma SK Karmakar S amp Sikka SK (2003) -Glycine under high pressures a Raman scattering study Physica B Condensed Matter Vol 339 No 1 (November 2003) pp 23-30 ISSN 0921-4526
Murli C Vasanthi R amp Sharma SM (2006) Raman spectroscopic investigations of DL-serine and DL-valine under pressure Chemical Physics Vol 331 No 1 (December 2006) pp 77-84 ISSN 0301-0104
Olsen JS Gerward L Freire PTC Mendes Filho J Melo FEA amp Souza Filho AG (2008) Pressure-induced phase transitions in L-alanine crystals Journal of Physics and Chemistry of Solids Vol 69 No 7 (July 2008) pp 1641-1645 ISSN 0022-3697
Sabino AS De Sousa GP Luz-Lima C Freire PTC Melo FEA amp Mendes Filho J (2009) High-pressure Raman spectra of L-isoleucine crystals Solid State Communications Vol 149 No 37-38 (October 2009) pp 1553-1556 ISSN 0038-1098
Sasaki JM Freire PTC Moreno AJD Melo FEA Guedes I Mendes Filho J Shu J Hu J amp Matildeo HK (2000) Single crystal X-ray diffraction in monohydrate L-asparagine under hydrostatic pressure Science and Technology of High Pressure Proceedings of AIRAPT-17 Hyderabad India 2000
Seijas LE Delgado GE Mora AJ Fitch AN amp Brunelli M (2010) On the Crystal structures and hydrogen bond patterns in proline pseudopolymorphs Powder Diffraction Vol 25 No 3 (September 2010) pp 235-240 ISSN 0885-7156
Silva BL Freire PTC Melo FEA Mendes Filho J Pimenta MA amp Dantas MSS (2000) High-pressure Raman spectra of L-threonine crystal Journal of Raman Spectroscopy Vol 31 No 6 (June 2000) pp 519-522 ISSN 1097-4555
Teixeira AMR Freire PTC Moreno AJD Sasaki JM Ayala AP Mendes Filho J amp Melo FEA (2000) High-pressure Raman study of l-alanine crystal Solid State Communications Vol 116 No 7 (October 2000) pp 405-409 ISSN 0038-1098
Tumanov NA Boldyreva EV Kolesov BA Kurnosov AV amp Quesada Cabrera R (2010) Pressure-induced phase transitions in L-alanine revisited Acta Crystallographica Section B Vol 66 No 4 (August 2010) pp 458-371 ISSN 1600-5740
Yamashita M Inomata S Ishikawa K Kashiwagi T Matsuo H Sawamura S amp Kato M (2007) A high-pressure polymorph of L--leucine Acta Crystallographica Section E Vol 63 No 5 (May 2007) pp o2762-o2764 ISSN 1600-5368
wwwintechopencom
Vibrational SpectroscopyEdited by Prof Dominique De Caro
ISBN 978-953-51-0107-9Hard cover 168 pagesPublisher InTechPublished online 24 February 2012Published in print edition February 2012
InTech EuropeUniversity Campus STeP Ri Slavka Krautzeka 83A 51000 Rijeka Croatia Phone +385 (51) 770 447 Fax +385 (51) 686 166wwwintechopencom
InTech ChinaUnit 405 Office Block Hotel Equatorial Shanghai No65 Yan An Road (West) Shanghai 200040 China
Phone +86-21-62489820 Fax +86-21-62489821
The infrared and Raman spectroscopy have applications in numerous fields namely chemistry physicsastronomy biology medicine geology mineralogy etc This book provides some examples of the use ofvibrational spectroscopy in supramolecular chemistry inorganic chemistry solid state physics but also in thefields of molecule-based materials or organic-inorganic interfaces
How to referenceIn order to correctly reference this scholarly work feel free to copy and paste the following
Paulo de Tarso Cavalcante Freire Joseacute Alves Lima Juacutenior Bruno Tavares de Oliveira Abagaro Gardecircnia deSousa Pinheiro Joseacute de Arimateacutea Freitas e Silva Josueacute Mendes Filho and Francisco Erivan de Abreu Melo(2012) High Pressure Raman Spectra of Amino Acid Crystals Vibrational Spectroscopy Prof Dominique DeCaro (Ed) ISBN 978-953-51-0107-9 InTech Available from httpwwwintechopencombooksvibrational-spectroscopyhigh-pressure-raman-spectra-of-amino-acid-crystals
copy 2012 The Author(s) Licensee IntechOpen This is an open access articledistributed under the terms of the Creative Commons Attribution 30License which permits unrestricted use distribution and reproduction inany medium provided the original work is properly cited

High Pressure Raman Spectra of Amino Acid Crystals
47
Fig 5 Raman spectra of PM under several pressure conditions from 00 to 118 GPa in the spectral range 800 ndash 1100 cm-1
Data can give us some insights related to the behaviour of molecules of proline as the crystal is compressed For example in a previous study on -glycine the softening of a bending of CO2- was associated to a decrease in the intra-layer hydrogen bond strength while the stiffening of the same vibration was associated to an increase in the bond strength (Dawson et al 2005) For PM we have observed that the band associated to both bending of CO2- (CO2-) and rocking of CO2- r(CO2-) increase wavenumbers from 11 to 65 GPa and between 65 and 78 GPa decrease wavenumber for (CO2-) the decreasing is represented by the two dashed lines in Figure 3 between the spectra of 65 and 78 GPa We have also observed an additional increasing of wavenumbers for pressures higher than 78 GPa This suggests that the intra-layer hydrogen bond strength is stiffened up to 65 GPa between 65 and 78 GPa the hydrogen bond strength is softened and above 80 GPa the hydrogen bond is stiffened Additionally our results suggest that between 65 and 78 GPa occurs a structural rearrangement in such a way that the behaviour of the hydrogen bond strengths is changed This rearrangement is enough to change the symmetry of the crystal because
wwwintechopencom
Vibrational Spectroscopy
48
Fig 6 Raman spectra of PM under several pressure conditions from 00 to 118 GPa in the spectral range 2850 ndash 3200 cm-1
associated to it we observe great modifications in the Raman spectrum of low wavenumber region (Figure 2) Yet related to the phase transition between 65 and 78 GPa it is impressive the increase of intensity of a band in the spectrum taken at 65 GPa (marked by an arrow see Figure 4) which can be assigned as wagging of CH2 w(CH2) it change of intensity with the band close to it at ~ 1055 cm-1 at 00 GPa which is also assigned as w(CH2) indicating that a conformational change in the ring may also occurs when the crystal undergoes the phase transition at 65 - 78 GPa It is also interesting to note that the first transition occurs from a monoclinic to a phase with lower symmetry (another monoclinic our a triclinic phase) because in several regions including both internal and lattice mode spectral regions the number of peaks in the spectrum taken at 11 GPa is greater than the number of Raman peaks in the spectrum taken at 00 GPa It is also worth note that above 78 GPa almost all bands increases linewidth indicating that some disorder is introduced in the high pressure phase However the disorder does not occur in a high degree because when pressure is released down to 00 GPa the original spectrum is recovered It is known that the amorphization process is preceded by some disorder in the crystal structure however due to recovered of the original Raman spectrum after releasing pressure we can infer that when we arrive to 1118 GPa we are far away from the pressure point where eventually the PM crystal should present amorphization
wwwintechopencom
High Pressure Raman Spectra of Amino Acid Crystals
49
42 L-histidine hydrochloride monohydrate Related to the HHM (see Figure 8) which crystallizes in an orthorhombic structure belonging to the P212121 (D24) space group with four molecules of C6H9N3O2HClH2O per unit cell we were able to arrive up to 75 GPa and discovery a new polymorph of the material above 31 GPa The strong bond between N-H of the imidazole ring and the carboxyl group of a neighboring molecule is the fundamental intermolecular link resulting in a spiral arrangement along the c-axis (Donohue amp Caron 1964) The coupling of the four zwitterions in the unit cell leads to 297 optical normal modes decomposed into irreducible representations of the factor group D2 as Γop = 75 A + 74 (B1 + B2 + B3) and the acoustic modes can be expressed as Γac = B1 + B2 + B3 Under high pressure conditions modifications the Raman spectra are interpreted in terms of both conformational changes of the molecules in the unit cell and in terms of a phase transition Figure 9(a) presents the Raman spectra of HHM for several pressures in the spectral range from 50 to 660 cm-1 The region for wavenumbers lower than 200 cm-1 as previously stated is characteristic of the lattice vibration modes Increasing pressure we observe that the bands present blue shifts of their wavenumbers However between 27 and 31 GPa it is possible to note that a great change occurs in the Raman spectrum the peak marked by a square which is associated to torsion of CO2- (τ(CO2-)) splits in two new peaks which are marked by up arrows in the spectrum at 31 GPa In Figure 9(b) which presents the plot of experimental wavenumber as function of pressure we clearly observe the splitting of the band close to 180 cm-1 Additionally we note that for other bands discontinuities of wavenumbers are observed between 27 to 31 GPa (De Sousa et al 2011)
Fig 8 Unit cell of HHM seen along the b-axis
In this region it is also possible to observe many internal vibrations of the histidine molecule such as skeletal structure at 442 and 490 cm-1 torsion of NH3+ which is observed at 385 cm-1 and rocking of CO2- at 530 cm-1 Again as occurs with the spectra shown in the lattice mode region modifications are observed in the spectral range 27 - 31 GPa Among these changes we observed the disappearance of the bands at 276 and 500 cm-1 and the
wwwintechopencom
Vibrational Spectroscopy
50
Fig 9 (a) Raman spectra of HHM under several pressure conditions from 04 to 75 GPa in the spectral range 50 ndash 650 cm-1 (b) wavenumber versus pressure of the bands of HHM appearing in Fig 9(a)
appearance of a band at 473 cm-1 in the spectrum taken at 31 GPa We additionally note that the intensity of the band associated to torsion of NH3+ decreases with increasing pressure indicating that there occurs a conformational change of histidine molecule Such a conformational change can be understood as consequence of the change of the intermolecular hydrogen bond length With increasing pressure the band initially at 385 cm-
1 which is associated with a torsion vibration of the NH3+ unit shifts linearly toward higher wavenumbers we can say that the pressure decreases the length of the hydrogen bonds increasing the wavenumber of the band associated to torsional vibration of NH3+ unit Figure 10(a) presents the Raman spectra of HHM in the 650 ndash 1250 cm-1 interval for several pressure values up to 75 GPa In this spectral region it is expected to observe vibrations assigned to the deformation of CO2- stretching of both C-C and C-N wagging of H2O and rocking of NH3+ The band observed at ~ 694 cm-1 is associated to a deformation vibration of CO2- (CO2) while the out-of-plane vibration of CO2- (CO2) is observed at ~ 822 cm-1 The band at 807 cm-1 is associated with a wagging vibration of the water molecule w(H2O) The bands recorded at 1191 and 1210 cm-1 can be assigned as the rocking of NH3+ unit r(NH3+) In this spectral region some changes are observed in the range 27 ndash 31 GPa (i) the disappearance of the band at 694 cm-1 (ii) the appearance of a new weak band at 717 cm-1
(marked by a star in the Figure 10(a)) (iii) the inversion of intensity of the two bands located at 807 and 822 cm-1 which are related to units directly involved in the hydrogen bonds and (iv) the inversion of intensity of the two bands associated to a rocking of NH3+ unit r(NH3+) located at 1191 and 1210 cm-1 The dependence of the wavenumber versus pressure plot for this spectral region is presented in Fig 10(b) we note that many of the observed Raman modes show a small discontinuous change in the slope in the pressure-induced variation of its wavenumber in range 27 ndash 31 GPa
wwwintechopencom
High Pressure Raman Spectra of Amino Acid Crystals
51
Figure 11(a) shows the Raman spectra of the HHM crystal in the spectral range 1700-1400 cm-1 for pressure from 00 to 75 GPa Fig 11(b) shows the respective wavenumber vs pressure plots In this region one expects to observe vibrations assigned to a deformations of the imidazole ring of the histidine molecule asymmetric stretching of the CO2- units stretching of C=O among others In the Figure 11(a) two modifications are observed in the range 27 ndash 31 GPa The first change is the decreasing of the relative intensity of the band originally at 1433 cm-1 and the second one is the appearance of a band at 1642 cm-1 In the wavenumber versus pressure plot presented in Figure 11(b) a subtle discontinuity occurs in the range 27 ndash 31 GPa with appreciably differences in slopes where two modes change from positive to negative slopes
Fig 10 (a) Raman spectra of HHM under several pressure conditions from 04 to 75 GPa in the spectral range 650 ndash 1250 cm-1 (b) wavenumber versus pressure of the bands of HHM appearing in Fig 10(a)
The Raman spectra of HHM crystal in the range 3450-3125 cm-1 are shown in the Figure 12(a) and in the Figure 12(b) the respective wavenumber versus pressure plots are given In this region we expected to observe stretching vibrations of several units of the amino acids and of the water molecule (CH NH3+ and OH-) It is important to note that for wavenumbers lower than 3000 cm-1 there are some modes related to the mineral oil used as compression media In detail the band at 3111 cm-1 can be associated to a stretching vibration of NH3+ unit (NH3+) while the bands observed at 3155 and 3163 cm-1 are associated to a CH stretching vibration of imidazole ring The bands observed at 3374 and 3408 cm-1 are related to the OH- stretching of the water molecules In the pressure range 27 ndash 31 GPa main changes are observed such as the disappearance of the bands related to a OH- stretching vibration (initially located at 3367 and 3393 cm-1) the appearance of a band of weak intensity at 3424 cm-1 and discontinuities of the wavenumber curve of bands at 3155 and 3163 cm-1 which are associated with the CH stretching vibration
wwwintechopencom
Vibrational Spectroscopy
52
Fig 11 (a) Raman spectra of HHM under several pressure conditions from 04 to 75 GPa in the spectral range 1400 ndash 1670 cm-1 (b) wavenumber versus pressure of the bands of HHM appearing in Fig 11(a)
Fig 12 (a) Raman spectra of HHM under several pressure conditions from 04 to 75 GPa in the spectral range 2950 ndash 3450 cm-1 (b) wavenumber versus pressure of the bands of HHM appearing in Fig 12(a)
wwwintechopencom
High Pressure Raman Spectra of Amino Acid Crystals
53
Table 2 gives a quantitative analysis of the evolution of the Raman spectra of HHM crystal with pressure where fitting of all bands to a linear expression ω = ω0 + P is furnished In Table 2 the first column (ωobs) represents the wavenumber of the Raman bands observed at room pressure the second and third columns correspond to adjustment of data for pressure values between 0 and 27 GPa and the two last columns correspond to fitting of the high-pressure phase that observed between 31 and 75 GPa A resume of the modifications observed in all spectral regions of the Raman spectra of HHM is as follows (i) splitting of the band in the low-wavenumber lattice range (ii) change in the number of bands associated to internal modes (iii) wavenumber shifts with discontinuities (iv) changes in the relative intensities of the vibrational bands It is important to state that changes were observed for the deformation vibrations of the OH- of the water molecule as well as of the NH3+ and CO2- groups of the amino acid molecule This picture indicates large conformational changes of the molecules in the unit cell Related to HHM beyond the hydrogen bonds originated from the histidine molecule there are two hydrogen bonds from the water molecule It is interesting to note from Figure 12(b) that the wavenumber of OH- stretching (OH-) decreases with increasing pressure However the OH units participate of hydrogen bonds one to a carboxyl oxygen and another to the chloride ion This means that between 00 and 31 GPa the hydrogen bond strength increases and the wavenumber of(OH-) decreases in this pressure range Also after the phase transition the wavenumber of (OH-) suffers a jump and continues to decrease up to the highest pressure obtained in our experiments Such a picture indicates a further increase of the hydrogen bonds formed by the water molecules and confirms that these bonds are playing an important role in the mechanism of the transition It is interesting to note that similar changes in the low-wavenumber region were also observed for the same crystal when subjected to low temperatures
ωobs
(cm-1)
Phase 1
(0 le P le 27 GPa) Phase 2
(31 le P le 75 GPa)
ω0
(cm-1)
(cm-1)(GPa)-1 ω0
(cm-1)
(cm-1)(GPa)-1
94 945 0669 937 -0103
105 1052 0276 1002 1771
121 1214 -1087 1109 2092
136 1357 1616 1360 0623
149 1497 2128 - -
159 1568 8033 1483 8105
- - - 1639 9960
188 1891 7661 1902 8059
270 2697 3093 - -
293 2919 6118 2945 7683
385 3846 7236 4015 1675
442 4423 1223 4423 1461
wwwintechopencom
Vibrational Spectroscopy
54
ωobs
(cm-1)
Phase 1
(0 le P le 27 GPa) Phase 2
(31 le P le 75 GPa)
ω0
(cm-1)
(cm-1)(GPa)-1 ω0
(cm-1)
(cm-1)(GPa)-1
- - - 4707 0785
491 490 5 3319 - -
530 5304 4335 - -
609 6078 5312 6208 2463
693 6935 1529 - -
- - - 7064 3449
807 8067 2042 8047 1467
824 8240 -0498 8204 1442
838 8361 7335 8504 3124
875 8734 6438 8881 2777
917 9173 0810 9187 2356
963 9630 2757 9636 2411
980 9787 4489 9787 5206
1068 10667 4790 10732 3418
1141 11403 1890 11403 2744
1162 11619 2611 11674 1120
1190 11900 2277 11885 1637
1208 12079 2859 12101 1341
1434 14345 1316 14382 0846
1448 14481 3059 14554 1677
1463 14621 4415 14760 0778
1481 14813 4238 14970 -0619
1609 16093 2739 16166 -0374
- - - 16249 2736
3111 31110 0919 31045 2914
3154 31546 1287 31532 6564
3164 31626 5305 31593 7905
3375 33739 -2638 - -
3407 34081 -5745 - -
- - - 34371 -3169
Table 2 Wavenumber values of the bands appearing in the HHM spectrum at 00 GPa (ωobs) and adjustment data by linear fitting (P) for the two phases
wwwintechopencom
High Pressure Raman Spectra of Amino Acid Crystals
55
5 Conclusions
The results suggested that L-proline monohydrate undergoes two phase transitions one between 00 and 11 GPa and a second between 65 and 78 GPa In both transitions it was possible to observed changes in the spectrum profile discontinuities in the wavenumber versus pressure plots in the lattice region of the spectrum and the appearance of news bands By releasing the pressure after attaining a maximum of 118 GPa the atmospheric pressure spectrum was fully recovered showing that the pressure-induced transitions undergone by polycrystalline L-proline crystal are reversible In the first transition it was observed the splitting of bands associated to (CCN) (CO2-) and (CH) vibrations The band associated to (skel) has disappeared In the second one we have observed the red shift of r(CO2-) significant changes in the intensity of the bands associated to the sc(CO2-) and w(CH2) vibrations and the splits of (CCN) + (CC) and r(NH2+) that also has lost intensity These modifications were interpreted as conformational changes of molecules in the unit cell Because these changes involve moieties that participate in hydrogen bonds we suppose that these hydrogen bonds have also been modified Modifications of hydrogen bonds can trigger some molecular rearrangements that lead to structural phase transitions In our work this hypothesis was supported by the changes that were observed in the region of the lattice modes for both phase transitions Therefore the results suggested two structural phase transitions one between 00 and 11 GPa and another between 65 and 78 GPa accompanied by significant conformational changes of molecules in the L-proline monohydrated crystal The results also suggest that HHM crystal undergoes a phase transition between 27 and 31 GPa when it is submitted to high pressure conditions up to 75 GPa The main changes observed in the Raman spectra was the splitting of the band in the low-wavenumber lattice range change in the number of bands associated to internal modes and wavenumber shifts with discontinuities Having described the behavior of two amino acid crystals under pressure and looked back at the past fourteen years of research we can ask to ourselves what does the future hold Based on the studies performed we believe that the use of several techniques such as neutron and Raman scattering as well as thermal and infrared analyses can help us to give a complete picture about hydrogen bond and the behavior of amino acids under pressure Maybe the study of peptide under similar external conditions should be the next road to be walked
6 Acknowledgment
Authors acknowledge CAPES CNPq and FUNCAP for financial support
7 References
Barthes M Bordallo HN Deacutenoyer F Lorenzo J-E Zaccaro J Robert A amp Zontone F (2004) Micro-transitions or breathers in L-alanine The European Physical Journal B Vol 37 No 3 (February 2004) pp 375-382 ISSN 1434-6028
Boldyreva EV Drebushchak VA Drebushchak TN Paukov IE Kovalevskaya YA amp Shutova ES (2003a) Polymorphism of glycine Part I Journal of Thermal Analysis and Calorimetry Vol 73 No 2 (August 2003) pp 409-418 ISSN 1388-6150
wwwintechopencom
Vibrational Spectroscopy
56
Boldyreva EV Drebushchak VA Drebushchak TN Paukov IE Kovalevskaya YA amp Shutova ES (2003b) Polymorphism of glycine Part II Journal of Thermal Analysis and Calorimetry Vol 73 No 2 (August 2003) pp 419-428 ISSN 1388-6150
Boldyreva EV Ivashevskaya SN Sowa H Ahsbahs H amp Weber H-P (2004) Effect of High Pressure on Crystalline Glycine A New High-Pressure Polymorph Doklady Physical Chemistry Vol 396 No 1 (May 2004) pp 111-114 ISSN 0012-5016
Boldyreva EV Ivashevskaya SN Sowa H Ahsbahs H amp Weber H-P (2005a) Effect of hydrostatic pressure on the -polymorph of glycine 1 A polymorphic transition into a new -form Zeitschrift fuumlr Kristallographie Vol 220 No 1 ( January 2005) pp 50- 57 ISSN 0044-2968
Boldyreva EV Kolesnik EN Drebushchak TN Ahsbahs H Beukes JA amp Weber H-P (2005b) A comparative study of the anisotropy of a lattice strain induced in the crystals of L-serine by cooling down to 100 K or by increasing pressure up to 44 GPa Zeitschrift fuumlr Kristallographie Vol 220 No 1 (January 2005) pp 58- 65 ISSN 0044-2968
Boldyreva EV Kolesnik EN Drebushchak TN Ahsbahs H amp Seryotkin YV (2006a) A comparative study of the anisotropy of a lattice strain induced in the crystals of DL-serine by cooling down to 100 K or by increasing pressure up to 86 GPa A comparison with L-serine Zeitschrift fuumlr Kristallographie Vol 221 No 2 (2006) pp 150- 161 ISSN 0044-2968
Boldyreva EV Sowa H Seryotkin YV Drebushchak TN Ahsbahs H Chernyshev V amp Dmitriev V (2006b) Pressure-induced phase transitions in crystalline L-serine studied by single crystal and gigh-resolution powder X-ray diffraction Chemical Physics Letters Vol 429 No 4-6 (October 2006) pp 474-478 ISSN 0009-2614
Boldyreva E (2007a) Cristalline Amino Acids A Link between Chemistry Materials Science and Biology In Models Mysteries and Magic of Molecules Boeyens JCA amp Ogilvie JF pp 167-192 Springer ISBN 978-1-4020-5940-7 Netherlands
Boldyreva E (2007b) High-Pressure Polymorphs of Molecular Solids When Are They Formed and When Are They Not Some Examples of the Role of Kinetic Control Crystal Growth amp Design Vol 7 No 9 (August 2007) pp 1662-1668 ISSN 1528-7483
Dawson A Allan DR Belmonte SA Clark SJ David WIF McGregor PA Parsons S Pulham CR amp Sawyer L (2005) Effect of high pressure on the crystal structures of polymorphs of glycine Crystal Growth amp Design Vol 5 No 4 (May 2005) pp 1415-1427 ISSN 1528-7483
Destro R Marsh RE amp Bianchi R (1988) A low-temperature (23K) study of L-alanine The Journal of Physical Chemistry Vol 92 No 4 (February 1988) pp 966-973 ISSN 0022-3654
De Sousa GP Freire PTC Lima Jr JA Mendes Filho J amp Melo FEA (2011) High-pressure Raman spectra of L-histidine hydrochloride monohydrate cristal Vibrational Spectroscopy Vol 57 No 1 (September 2011) pp 102-107 ISSN 0924-2031
Donohue J amp Caron A (1964) Refinement of cristal structure of histidine hydrochloride monohydrate Acta Crystallographica Vol 17 No 9 (September 1964) pp 1178-amp ISSN 0108-7673
wwwintechopencom
High Pressure Raman Spectra of Amino Acid Crystals
57
Faccedilanha Filho PF Freire PTC Lima KCV Mendes Filho J Melo FEA amp Pizani PS (2008) High temperature Raman spectra of L-leucine crystals Brazilian Journal of Physics Vol 38 No 1 (March 2008) pp 131-137 ISSN 0103-9733
Faccedilanha Filho PF Freire PTC Melo FEA Lemos V Mendes Filho J Pizani PS amp Rossatto DZ (2009) Pressure-induced phase transitions in L-leucine crystal Journal of Raman Spectroscopy Vol 40 No 1 (January 2009) pp 46-51 ISSN 1097-4555
Freire PTC (2010) Pressure-Induced Phase Transitions in Crystalline Amino Acids In High Pressure Crystallography ndash From Fundamental Phenomena to Technological Applications Boldyreva E amp Dera P pp 559-572 Springer ISBN 978-904-8192-60-1 New York USA
Funnel NP Dawson A Francis D Lennie DR Marshall WG Moggach SA Warren JE amp Parsons S (2010) The effect of pressure on the crystal structure of l-alanine CrystEngComm Vol 12 No 9 (September 2010) pp 2573-2583 ISSN 1466-8033
Goryainov SV Kolesnik EN amp Boldyreva EV (2005) A reversible pressure-induced phase transition in -glycine at 076 GPa Physica B Condensed Matter Vol 357 No 3-4 (March 2005) pp 340-347 ISSN 0921-4526
Goryainov SV Kolesnik EN amp Boldyreva EV (2006) Raman observation of a new (ζ) polymorph of glycine Chemical Physics Letters Vol 419 No 4-6 (February 2006) pp 496-500 ISSN 0009-2614
Harding MM amp Howieson RM (1976) L-Leucine Acta Crystallographica Section B Vol 32 No 2 (February 1976) pp 633-634 ISSN 1600-5740
Herlinger AW amp Long TV (1970) Laser Raman and infrared spectra of amino acids and their metal complexes 3 Proline and bisprolinato complexes Journal of the American Chemical Society Vol 92 No 22 (November 1970) pp 6481-6486 ISSN 0002-7863
Hermiacutenio da Silva J Lemos V Freire PTC Melo FEA Mendes Filho J Lima Jr JA amp Pizani PS (2009) Stability of the crystal structure of L-valine under high pressure Physica Status Solidi B Vol 246 No 3 (March 2009) pp 553-557 ISSN 0370-1972
Lima JA Freire PTC Melo FEA Lemos V Mendes Filho J amp Pizani PS (2008) High pressure Raman spectra of L-methionine Crystal Journal of Raman Spectroscopy Vol 39 No 10 (October 2008) pp 1356-1363 ISSN 1097-4555
Migliori A Maxton PM Clogston AM Zirngiebl E amp Lowe M (1988) Anomalous temperature dependence in the Raman spectra of l-alanine Evidence for dynamic localization Physical Review B Vol 38 No 18 (December 1988) pp 13464-13467 ISSN 1098-0121
Minkov VS Krylov AS Boldyreva EV Goryainov SN Bizyaev SN amp Vtyurin AN (2008) Pressure-Induced Phase Transitions in Crystalline L- and DL-Cysteine The Journal of Physical Chemistry B Vol 112 No 30 (July 2008) pp 8851-8854 ISSN 1520-6106
Minkov VS Goryainov SV Boldyreva EV amp Goumlrbitz CH (2010) Raman study of pressure-induced phase transitions in the crystals of orthorhombic and monoclinic polymorphs of L-cysteine dynamics of the side-chain Journal of Raman Spectroscopy Vol 41 No 12 (December 2010) pp 1458-1468 ISSN 1097-4555
Moggach SA Allan DR Morrison PA Parsons S amp Sawyer L (2005) Effect of pressure on the crystal structure of L-serine-I and the crystal structure of L-serine-II
wwwintechopencom
Vibrational Spectroscopy
58
at 54 GPa Acta Crystallographica Section B Vol 61 No 1 (February 2005) pp 58-68 ISSN 0108-7681
Moggach SA Marshall WG amp Parsons S (2006) High-pressure neutron diffraction study of L-serine-I and L-serine-II and the structure of L-serine-III at 81 GPa Acta Crystallographica Section B Vol 62 No 5 (October 2006) pp 815-825 ISSN 0108-7681
Moreno AJD Freire PTC Melo FEA Arauacutejo-Silva MA Guedes I Mendes Filho J (1997) Pressure-induced phase transitions in monohydrated l-asparagine aminoacid crystals Solid State Communications Vol 103 No 12 (September 1997) pp 655-658 ISSN 0038-1098
Murli C Sharma SK Karmakar S amp Sikka SK (2003) -Glycine under high pressures a Raman scattering study Physica B Condensed Matter Vol 339 No 1 (November 2003) pp 23-30 ISSN 0921-4526
Murli C Vasanthi R amp Sharma SM (2006) Raman spectroscopic investigations of DL-serine and DL-valine under pressure Chemical Physics Vol 331 No 1 (December 2006) pp 77-84 ISSN 0301-0104
Olsen JS Gerward L Freire PTC Mendes Filho J Melo FEA amp Souza Filho AG (2008) Pressure-induced phase transitions in L-alanine crystals Journal of Physics and Chemistry of Solids Vol 69 No 7 (July 2008) pp 1641-1645 ISSN 0022-3697
Sabino AS De Sousa GP Luz-Lima C Freire PTC Melo FEA amp Mendes Filho J (2009) High-pressure Raman spectra of L-isoleucine crystals Solid State Communications Vol 149 No 37-38 (October 2009) pp 1553-1556 ISSN 0038-1098
Sasaki JM Freire PTC Moreno AJD Melo FEA Guedes I Mendes Filho J Shu J Hu J amp Matildeo HK (2000) Single crystal X-ray diffraction in monohydrate L-asparagine under hydrostatic pressure Science and Technology of High Pressure Proceedings of AIRAPT-17 Hyderabad India 2000
Seijas LE Delgado GE Mora AJ Fitch AN amp Brunelli M (2010) On the Crystal structures and hydrogen bond patterns in proline pseudopolymorphs Powder Diffraction Vol 25 No 3 (September 2010) pp 235-240 ISSN 0885-7156
Silva BL Freire PTC Melo FEA Mendes Filho J Pimenta MA amp Dantas MSS (2000) High-pressure Raman spectra of L-threonine crystal Journal of Raman Spectroscopy Vol 31 No 6 (June 2000) pp 519-522 ISSN 1097-4555
Teixeira AMR Freire PTC Moreno AJD Sasaki JM Ayala AP Mendes Filho J amp Melo FEA (2000) High-pressure Raman study of l-alanine crystal Solid State Communications Vol 116 No 7 (October 2000) pp 405-409 ISSN 0038-1098
Tumanov NA Boldyreva EV Kolesov BA Kurnosov AV amp Quesada Cabrera R (2010) Pressure-induced phase transitions in L-alanine revisited Acta Crystallographica Section B Vol 66 No 4 (August 2010) pp 458-371 ISSN 1600-5740
Yamashita M Inomata S Ishikawa K Kashiwagi T Matsuo H Sawamura S amp Kato M (2007) A high-pressure polymorph of L--leucine Acta Crystallographica Section E Vol 63 No 5 (May 2007) pp o2762-o2764 ISSN 1600-5368
wwwintechopencom
Vibrational SpectroscopyEdited by Prof Dominique De Caro
ISBN 978-953-51-0107-9Hard cover 168 pagesPublisher InTechPublished online 24 February 2012Published in print edition February 2012
InTech EuropeUniversity Campus STeP Ri Slavka Krautzeka 83A 51000 Rijeka Croatia Phone +385 (51) 770 447 Fax +385 (51) 686 166wwwintechopencom
InTech ChinaUnit 405 Office Block Hotel Equatorial Shanghai No65 Yan An Road (West) Shanghai 200040 China
Phone +86-21-62489820 Fax +86-21-62489821
The infrared and Raman spectroscopy have applications in numerous fields namely chemistry physicsastronomy biology medicine geology mineralogy etc This book provides some examples of the use ofvibrational spectroscopy in supramolecular chemistry inorganic chemistry solid state physics but also in thefields of molecule-based materials or organic-inorganic interfaces
How to referenceIn order to correctly reference this scholarly work feel free to copy and paste the following
Paulo de Tarso Cavalcante Freire Joseacute Alves Lima Juacutenior Bruno Tavares de Oliveira Abagaro Gardecircnia deSousa Pinheiro Joseacute de Arimateacutea Freitas e Silva Josueacute Mendes Filho and Francisco Erivan de Abreu Melo(2012) High Pressure Raman Spectra of Amino Acid Crystals Vibrational Spectroscopy Prof Dominique DeCaro (Ed) ISBN 978-953-51-0107-9 InTech Available from httpwwwintechopencombooksvibrational-spectroscopyhigh-pressure-raman-spectra-of-amino-acid-crystals
copy 2012 The Author(s) Licensee IntechOpen This is an open access articledistributed under the terms of the Creative Commons Attribution 30License which permits unrestricted use distribution and reproduction inany medium provided the original work is properly cited
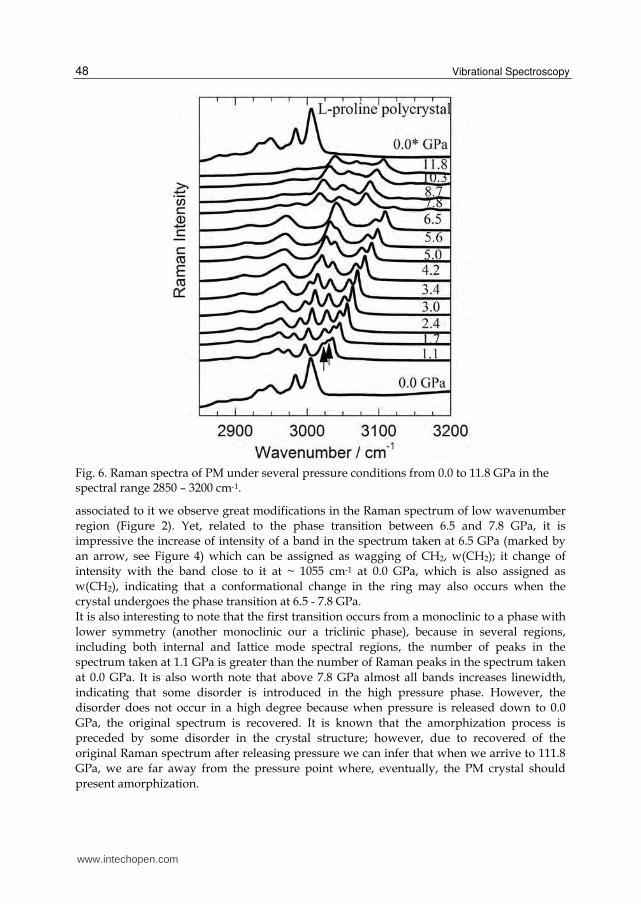
Vibrational Spectroscopy
48
Fig 6 Raman spectra of PM under several pressure conditions from 00 to 118 GPa in the spectral range 2850 ndash 3200 cm-1
associated to it we observe great modifications in the Raman spectrum of low wavenumber region (Figure 2) Yet related to the phase transition between 65 and 78 GPa it is impressive the increase of intensity of a band in the spectrum taken at 65 GPa (marked by an arrow see Figure 4) which can be assigned as wagging of CH2 w(CH2) it change of intensity with the band close to it at ~ 1055 cm-1 at 00 GPa which is also assigned as w(CH2) indicating that a conformational change in the ring may also occurs when the crystal undergoes the phase transition at 65 - 78 GPa It is also interesting to note that the first transition occurs from a monoclinic to a phase with lower symmetry (another monoclinic our a triclinic phase) because in several regions including both internal and lattice mode spectral regions the number of peaks in the spectrum taken at 11 GPa is greater than the number of Raman peaks in the spectrum taken at 00 GPa It is also worth note that above 78 GPa almost all bands increases linewidth indicating that some disorder is introduced in the high pressure phase However the disorder does not occur in a high degree because when pressure is released down to 00 GPa the original spectrum is recovered It is known that the amorphization process is preceded by some disorder in the crystal structure however due to recovered of the original Raman spectrum after releasing pressure we can infer that when we arrive to 1118 GPa we are far away from the pressure point where eventually the PM crystal should present amorphization
wwwintechopencom
High Pressure Raman Spectra of Amino Acid Crystals
49
42 L-histidine hydrochloride monohydrate Related to the HHM (see Figure 8) which crystallizes in an orthorhombic structure belonging to the P212121 (D24) space group with four molecules of C6H9N3O2HClH2O per unit cell we were able to arrive up to 75 GPa and discovery a new polymorph of the material above 31 GPa The strong bond between N-H of the imidazole ring and the carboxyl group of a neighboring molecule is the fundamental intermolecular link resulting in a spiral arrangement along the c-axis (Donohue amp Caron 1964) The coupling of the four zwitterions in the unit cell leads to 297 optical normal modes decomposed into irreducible representations of the factor group D2 as Γop = 75 A + 74 (B1 + B2 + B3) and the acoustic modes can be expressed as Γac = B1 + B2 + B3 Under high pressure conditions modifications the Raman spectra are interpreted in terms of both conformational changes of the molecules in the unit cell and in terms of a phase transition Figure 9(a) presents the Raman spectra of HHM for several pressures in the spectral range from 50 to 660 cm-1 The region for wavenumbers lower than 200 cm-1 as previously stated is characteristic of the lattice vibration modes Increasing pressure we observe that the bands present blue shifts of their wavenumbers However between 27 and 31 GPa it is possible to note that a great change occurs in the Raman spectrum the peak marked by a square which is associated to torsion of CO2- (τ(CO2-)) splits in two new peaks which are marked by up arrows in the spectrum at 31 GPa In Figure 9(b) which presents the plot of experimental wavenumber as function of pressure we clearly observe the splitting of the band close to 180 cm-1 Additionally we note that for other bands discontinuities of wavenumbers are observed between 27 to 31 GPa (De Sousa et al 2011)
Fig 8 Unit cell of HHM seen along the b-axis
In this region it is also possible to observe many internal vibrations of the histidine molecule such as skeletal structure at 442 and 490 cm-1 torsion of NH3+ which is observed at 385 cm-1 and rocking of CO2- at 530 cm-1 Again as occurs with the spectra shown in the lattice mode region modifications are observed in the spectral range 27 - 31 GPa Among these changes we observed the disappearance of the bands at 276 and 500 cm-1 and the
wwwintechopencom
Vibrational Spectroscopy
50
Fig 9 (a) Raman spectra of HHM under several pressure conditions from 04 to 75 GPa in the spectral range 50 ndash 650 cm-1 (b) wavenumber versus pressure of the bands of HHM appearing in Fig 9(a)
appearance of a band at 473 cm-1 in the spectrum taken at 31 GPa We additionally note that the intensity of the band associated to torsion of NH3+ decreases with increasing pressure indicating that there occurs a conformational change of histidine molecule Such a conformational change can be understood as consequence of the change of the intermolecular hydrogen bond length With increasing pressure the band initially at 385 cm-
1 which is associated with a torsion vibration of the NH3+ unit shifts linearly toward higher wavenumbers we can say that the pressure decreases the length of the hydrogen bonds increasing the wavenumber of the band associated to torsional vibration of NH3+ unit Figure 10(a) presents the Raman spectra of HHM in the 650 ndash 1250 cm-1 interval for several pressure values up to 75 GPa In this spectral region it is expected to observe vibrations assigned to the deformation of CO2- stretching of both C-C and C-N wagging of H2O and rocking of NH3+ The band observed at ~ 694 cm-1 is associated to a deformation vibration of CO2- (CO2) while the out-of-plane vibration of CO2- (CO2) is observed at ~ 822 cm-1 The band at 807 cm-1 is associated with a wagging vibration of the water molecule w(H2O) The bands recorded at 1191 and 1210 cm-1 can be assigned as the rocking of NH3+ unit r(NH3+) In this spectral region some changes are observed in the range 27 ndash 31 GPa (i) the disappearance of the band at 694 cm-1 (ii) the appearance of a new weak band at 717 cm-1
(marked by a star in the Figure 10(a)) (iii) the inversion of intensity of the two bands located at 807 and 822 cm-1 which are related to units directly involved in the hydrogen bonds and (iv) the inversion of intensity of the two bands associated to a rocking of NH3+ unit r(NH3+) located at 1191 and 1210 cm-1 The dependence of the wavenumber versus pressure plot for this spectral region is presented in Fig 10(b) we note that many of the observed Raman modes show a small discontinuous change in the slope in the pressure-induced variation of its wavenumber in range 27 ndash 31 GPa
wwwintechopencom
High Pressure Raman Spectra of Amino Acid Crystals
51
Figure 11(a) shows the Raman spectra of the HHM crystal in the spectral range 1700-1400 cm-1 for pressure from 00 to 75 GPa Fig 11(b) shows the respective wavenumber vs pressure plots In this region one expects to observe vibrations assigned to a deformations of the imidazole ring of the histidine molecule asymmetric stretching of the CO2- units stretching of C=O among others In the Figure 11(a) two modifications are observed in the range 27 ndash 31 GPa The first change is the decreasing of the relative intensity of the band originally at 1433 cm-1 and the second one is the appearance of a band at 1642 cm-1 In the wavenumber versus pressure plot presented in Figure 11(b) a subtle discontinuity occurs in the range 27 ndash 31 GPa with appreciably differences in slopes where two modes change from positive to negative slopes
Fig 10 (a) Raman spectra of HHM under several pressure conditions from 04 to 75 GPa in the spectral range 650 ndash 1250 cm-1 (b) wavenumber versus pressure of the bands of HHM appearing in Fig 10(a)
The Raman spectra of HHM crystal in the range 3450-3125 cm-1 are shown in the Figure 12(a) and in the Figure 12(b) the respective wavenumber versus pressure plots are given In this region we expected to observe stretching vibrations of several units of the amino acids and of the water molecule (CH NH3+ and OH-) It is important to note that for wavenumbers lower than 3000 cm-1 there are some modes related to the mineral oil used as compression media In detail the band at 3111 cm-1 can be associated to a stretching vibration of NH3+ unit (NH3+) while the bands observed at 3155 and 3163 cm-1 are associated to a CH stretching vibration of imidazole ring The bands observed at 3374 and 3408 cm-1 are related to the OH- stretching of the water molecules In the pressure range 27 ndash 31 GPa main changes are observed such as the disappearance of the bands related to a OH- stretching vibration (initially located at 3367 and 3393 cm-1) the appearance of a band of weak intensity at 3424 cm-1 and discontinuities of the wavenumber curve of bands at 3155 and 3163 cm-1 which are associated with the CH stretching vibration
wwwintechopencom
Vibrational Spectroscopy
52
Fig 11 (a) Raman spectra of HHM under several pressure conditions from 04 to 75 GPa in the spectral range 1400 ndash 1670 cm-1 (b) wavenumber versus pressure of the bands of HHM appearing in Fig 11(a)
Fig 12 (a) Raman spectra of HHM under several pressure conditions from 04 to 75 GPa in the spectral range 2950 ndash 3450 cm-1 (b) wavenumber versus pressure of the bands of HHM appearing in Fig 12(a)
wwwintechopencom
High Pressure Raman Spectra of Amino Acid Crystals
53
Table 2 gives a quantitative analysis of the evolution of the Raman spectra of HHM crystal with pressure where fitting of all bands to a linear expression ω = ω0 + P is furnished In Table 2 the first column (ωobs) represents the wavenumber of the Raman bands observed at room pressure the second and third columns correspond to adjustment of data for pressure values between 0 and 27 GPa and the two last columns correspond to fitting of the high-pressure phase that observed between 31 and 75 GPa A resume of the modifications observed in all spectral regions of the Raman spectra of HHM is as follows (i) splitting of the band in the low-wavenumber lattice range (ii) change in the number of bands associated to internal modes (iii) wavenumber shifts with discontinuities (iv) changes in the relative intensities of the vibrational bands It is important to state that changes were observed for the deformation vibrations of the OH- of the water molecule as well as of the NH3+ and CO2- groups of the amino acid molecule This picture indicates large conformational changes of the molecules in the unit cell Related to HHM beyond the hydrogen bonds originated from the histidine molecule there are two hydrogen bonds from the water molecule It is interesting to note from Figure 12(b) that the wavenumber of OH- stretching (OH-) decreases with increasing pressure However the OH units participate of hydrogen bonds one to a carboxyl oxygen and another to the chloride ion This means that between 00 and 31 GPa the hydrogen bond strength increases and the wavenumber of(OH-) decreases in this pressure range Also after the phase transition the wavenumber of (OH-) suffers a jump and continues to decrease up to the highest pressure obtained in our experiments Such a picture indicates a further increase of the hydrogen bonds formed by the water molecules and confirms that these bonds are playing an important role in the mechanism of the transition It is interesting to note that similar changes in the low-wavenumber region were also observed for the same crystal when subjected to low temperatures
ωobs
(cm-1)
Phase 1
(0 le P le 27 GPa) Phase 2
(31 le P le 75 GPa)
ω0
(cm-1)
(cm-1)(GPa)-1 ω0
(cm-1)
(cm-1)(GPa)-1
94 945 0669 937 -0103
105 1052 0276 1002 1771
121 1214 -1087 1109 2092
136 1357 1616 1360 0623
149 1497 2128 - -
159 1568 8033 1483 8105
- - - 1639 9960
188 1891 7661 1902 8059
270 2697 3093 - -
293 2919 6118 2945 7683
385 3846 7236 4015 1675
442 4423 1223 4423 1461
wwwintechopencom
Vibrational Spectroscopy
54
ωobs
(cm-1)
Phase 1
(0 le P le 27 GPa) Phase 2
(31 le P le 75 GPa)
ω0
(cm-1)
(cm-1)(GPa)-1 ω0
(cm-1)
(cm-1)(GPa)-1
- - - 4707 0785
491 490 5 3319 - -
530 5304 4335 - -
609 6078 5312 6208 2463
693 6935 1529 - -
- - - 7064 3449
807 8067 2042 8047 1467
824 8240 -0498 8204 1442
838 8361 7335 8504 3124
875 8734 6438 8881 2777
917 9173 0810 9187 2356
963 9630 2757 9636 2411
980 9787 4489 9787 5206
1068 10667 4790 10732 3418
1141 11403 1890 11403 2744
1162 11619 2611 11674 1120
1190 11900 2277 11885 1637
1208 12079 2859 12101 1341
1434 14345 1316 14382 0846
1448 14481 3059 14554 1677
1463 14621 4415 14760 0778
1481 14813 4238 14970 -0619
1609 16093 2739 16166 -0374
- - - 16249 2736
3111 31110 0919 31045 2914
3154 31546 1287 31532 6564
3164 31626 5305 31593 7905
3375 33739 -2638 - -
3407 34081 -5745 - -
- - - 34371 -3169
Table 2 Wavenumber values of the bands appearing in the HHM spectrum at 00 GPa (ωobs) and adjustment data by linear fitting (P) for the two phases
wwwintechopencom
High Pressure Raman Spectra of Amino Acid Crystals
55
5 Conclusions
The results suggested that L-proline monohydrate undergoes two phase transitions one between 00 and 11 GPa and a second between 65 and 78 GPa In both transitions it was possible to observed changes in the spectrum profile discontinuities in the wavenumber versus pressure plots in the lattice region of the spectrum and the appearance of news bands By releasing the pressure after attaining a maximum of 118 GPa the atmospheric pressure spectrum was fully recovered showing that the pressure-induced transitions undergone by polycrystalline L-proline crystal are reversible In the first transition it was observed the splitting of bands associated to (CCN) (CO2-) and (CH) vibrations The band associated to (skel) has disappeared In the second one we have observed the red shift of r(CO2-) significant changes in the intensity of the bands associated to the sc(CO2-) and w(CH2) vibrations and the splits of (CCN) + (CC) and r(NH2+) that also has lost intensity These modifications were interpreted as conformational changes of molecules in the unit cell Because these changes involve moieties that participate in hydrogen bonds we suppose that these hydrogen bonds have also been modified Modifications of hydrogen bonds can trigger some molecular rearrangements that lead to structural phase transitions In our work this hypothesis was supported by the changes that were observed in the region of the lattice modes for both phase transitions Therefore the results suggested two structural phase transitions one between 00 and 11 GPa and another between 65 and 78 GPa accompanied by significant conformational changes of molecules in the L-proline monohydrated crystal The results also suggest that HHM crystal undergoes a phase transition between 27 and 31 GPa when it is submitted to high pressure conditions up to 75 GPa The main changes observed in the Raman spectra was the splitting of the band in the low-wavenumber lattice range change in the number of bands associated to internal modes and wavenumber shifts with discontinuities Having described the behavior of two amino acid crystals under pressure and looked back at the past fourteen years of research we can ask to ourselves what does the future hold Based on the studies performed we believe that the use of several techniques such as neutron and Raman scattering as well as thermal and infrared analyses can help us to give a complete picture about hydrogen bond and the behavior of amino acids under pressure Maybe the study of peptide under similar external conditions should be the next road to be walked
6 Acknowledgment
Authors acknowledge CAPES CNPq and FUNCAP for financial support
7 References
Barthes M Bordallo HN Deacutenoyer F Lorenzo J-E Zaccaro J Robert A amp Zontone F (2004) Micro-transitions or breathers in L-alanine The European Physical Journal B Vol 37 No 3 (February 2004) pp 375-382 ISSN 1434-6028
Boldyreva EV Drebushchak VA Drebushchak TN Paukov IE Kovalevskaya YA amp Shutova ES (2003a) Polymorphism of glycine Part I Journal of Thermal Analysis and Calorimetry Vol 73 No 2 (August 2003) pp 409-418 ISSN 1388-6150
wwwintechopencom
Vibrational Spectroscopy
56
Boldyreva EV Drebushchak VA Drebushchak TN Paukov IE Kovalevskaya YA amp Shutova ES (2003b) Polymorphism of glycine Part II Journal of Thermal Analysis and Calorimetry Vol 73 No 2 (August 2003) pp 419-428 ISSN 1388-6150
Boldyreva EV Ivashevskaya SN Sowa H Ahsbahs H amp Weber H-P (2004) Effect of High Pressure on Crystalline Glycine A New High-Pressure Polymorph Doklady Physical Chemistry Vol 396 No 1 (May 2004) pp 111-114 ISSN 0012-5016
Boldyreva EV Ivashevskaya SN Sowa H Ahsbahs H amp Weber H-P (2005a) Effect of hydrostatic pressure on the -polymorph of glycine 1 A polymorphic transition into a new -form Zeitschrift fuumlr Kristallographie Vol 220 No 1 ( January 2005) pp 50- 57 ISSN 0044-2968
Boldyreva EV Kolesnik EN Drebushchak TN Ahsbahs H Beukes JA amp Weber H-P (2005b) A comparative study of the anisotropy of a lattice strain induced in the crystals of L-serine by cooling down to 100 K or by increasing pressure up to 44 GPa Zeitschrift fuumlr Kristallographie Vol 220 No 1 (January 2005) pp 58- 65 ISSN 0044-2968
Boldyreva EV Kolesnik EN Drebushchak TN Ahsbahs H amp Seryotkin YV (2006a) A comparative study of the anisotropy of a lattice strain induced in the crystals of DL-serine by cooling down to 100 K or by increasing pressure up to 86 GPa A comparison with L-serine Zeitschrift fuumlr Kristallographie Vol 221 No 2 (2006) pp 150- 161 ISSN 0044-2968
Boldyreva EV Sowa H Seryotkin YV Drebushchak TN Ahsbahs H Chernyshev V amp Dmitriev V (2006b) Pressure-induced phase transitions in crystalline L-serine studied by single crystal and gigh-resolution powder X-ray diffraction Chemical Physics Letters Vol 429 No 4-6 (October 2006) pp 474-478 ISSN 0009-2614
Boldyreva E (2007a) Cristalline Amino Acids A Link between Chemistry Materials Science and Biology In Models Mysteries and Magic of Molecules Boeyens JCA amp Ogilvie JF pp 167-192 Springer ISBN 978-1-4020-5940-7 Netherlands
Boldyreva E (2007b) High-Pressure Polymorphs of Molecular Solids When Are They Formed and When Are They Not Some Examples of the Role of Kinetic Control Crystal Growth amp Design Vol 7 No 9 (August 2007) pp 1662-1668 ISSN 1528-7483
Dawson A Allan DR Belmonte SA Clark SJ David WIF McGregor PA Parsons S Pulham CR amp Sawyer L (2005) Effect of high pressure on the crystal structures of polymorphs of glycine Crystal Growth amp Design Vol 5 No 4 (May 2005) pp 1415-1427 ISSN 1528-7483
Destro R Marsh RE amp Bianchi R (1988) A low-temperature (23K) study of L-alanine The Journal of Physical Chemistry Vol 92 No 4 (February 1988) pp 966-973 ISSN 0022-3654
De Sousa GP Freire PTC Lima Jr JA Mendes Filho J amp Melo FEA (2011) High-pressure Raman spectra of L-histidine hydrochloride monohydrate cristal Vibrational Spectroscopy Vol 57 No 1 (September 2011) pp 102-107 ISSN 0924-2031
Donohue J amp Caron A (1964) Refinement of cristal structure of histidine hydrochloride monohydrate Acta Crystallographica Vol 17 No 9 (September 1964) pp 1178-amp ISSN 0108-7673
wwwintechopencom
High Pressure Raman Spectra of Amino Acid Crystals
57
Faccedilanha Filho PF Freire PTC Lima KCV Mendes Filho J Melo FEA amp Pizani PS (2008) High temperature Raman spectra of L-leucine crystals Brazilian Journal of Physics Vol 38 No 1 (March 2008) pp 131-137 ISSN 0103-9733
Faccedilanha Filho PF Freire PTC Melo FEA Lemos V Mendes Filho J Pizani PS amp Rossatto DZ (2009) Pressure-induced phase transitions in L-leucine crystal Journal of Raman Spectroscopy Vol 40 No 1 (January 2009) pp 46-51 ISSN 1097-4555
Freire PTC (2010) Pressure-Induced Phase Transitions in Crystalline Amino Acids In High Pressure Crystallography ndash From Fundamental Phenomena to Technological Applications Boldyreva E amp Dera P pp 559-572 Springer ISBN 978-904-8192-60-1 New York USA
Funnel NP Dawson A Francis D Lennie DR Marshall WG Moggach SA Warren JE amp Parsons S (2010) The effect of pressure on the crystal structure of l-alanine CrystEngComm Vol 12 No 9 (September 2010) pp 2573-2583 ISSN 1466-8033
Goryainov SV Kolesnik EN amp Boldyreva EV (2005) A reversible pressure-induced phase transition in -glycine at 076 GPa Physica B Condensed Matter Vol 357 No 3-4 (March 2005) pp 340-347 ISSN 0921-4526
Goryainov SV Kolesnik EN amp Boldyreva EV (2006) Raman observation of a new (ζ) polymorph of glycine Chemical Physics Letters Vol 419 No 4-6 (February 2006) pp 496-500 ISSN 0009-2614
Harding MM amp Howieson RM (1976) L-Leucine Acta Crystallographica Section B Vol 32 No 2 (February 1976) pp 633-634 ISSN 1600-5740
Herlinger AW amp Long TV (1970) Laser Raman and infrared spectra of amino acids and their metal complexes 3 Proline and bisprolinato complexes Journal of the American Chemical Society Vol 92 No 22 (November 1970) pp 6481-6486 ISSN 0002-7863
Hermiacutenio da Silva J Lemos V Freire PTC Melo FEA Mendes Filho J Lima Jr JA amp Pizani PS (2009) Stability of the crystal structure of L-valine under high pressure Physica Status Solidi B Vol 246 No 3 (March 2009) pp 553-557 ISSN 0370-1972
Lima JA Freire PTC Melo FEA Lemos V Mendes Filho J amp Pizani PS (2008) High pressure Raman spectra of L-methionine Crystal Journal of Raman Spectroscopy Vol 39 No 10 (October 2008) pp 1356-1363 ISSN 1097-4555
Migliori A Maxton PM Clogston AM Zirngiebl E amp Lowe M (1988) Anomalous temperature dependence in the Raman spectra of l-alanine Evidence for dynamic localization Physical Review B Vol 38 No 18 (December 1988) pp 13464-13467 ISSN 1098-0121
Minkov VS Krylov AS Boldyreva EV Goryainov SN Bizyaev SN amp Vtyurin AN (2008) Pressure-Induced Phase Transitions in Crystalline L- and DL-Cysteine The Journal of Physical Chemistry B Vol 112 No 30 (July 2008) pp 8851-8854 ISSN 1520-6106
Minkov VS Goryainov SV Boldyreva EV amp Goumlrbitz CH (2010) Raman study of pressure-induced phase transitions in the crystals of orthorhombic and monoclinic polymorphs of L-cysteine dynamics of the side-chain Journal of Raman Spectroscopy Vol 41 No 12 (December 2010) pp 1458-1468 ISSN 1097-4555
Moggach SA Allan DR Morrison PA Parsons S amp Sawyer L (2005) Effect of pressure on the crystal structure of L-serine-I and the crystal structure of L-serine-II
wwwintechopencom
Vibrational Spectroscopy
58
at 54 GPa Acta Crystallographica Section B Vol 61 No 1 (February 2005) pp 58-68 ISSN 0108-7681
Moggach SA Marshall WG amp Parsons S (2006) High-pressure neutron diffraction study of L-serine-I and L-serine-II and the structure of L-serine-III at 81 GPa Acta Crystallographica Section B Vol 62 No 5 (October 2006) pp 815-825 ISSN 0108-7681
Moreno AJD Freire PTC Melo FEA Arauacutejo-Silva MA Guedes I Mendes Filho J (1997) Pressure-induced phase transitions in monohydrated l-asparagine aminoacid crystals Solid State Communications Vol 103 No 12 (September 1997) pp 655-658 ISSN 0038-1098
Murli C Sharma SK Karmakar S amp Sikka SK (2003) -Glycine under high pressures a Raman scattering study Physica B Condensed Matter Vol 339 No 1 (November 2003) pp 23-30 ISSN 0921-4526
Murli C Vasanthi R amp Sharma SM (2006) Raman spectroscopic investigations of DL-serine and DL-valine under pressure Chemical Physics Vol 331 No 1 (December 2006) pp 77-84 ISSN 0301-0104
Olsen JS Gerward L Freire PTC Mendes Filho J Melo FEA amp Souza Filho AG (2008) Pressure-induced phase transitions in L-alanine crystals Journal of Physics and Chemistry of Solids Vol 69 No 7 (July 2008) pp 1641-1645 ISSN 0022-3697
Sabino AS De Sousa GP Luz-Lima C Freire PTC Melo FEA amp Mendes Filho J (2009) High-pressure Raman spectra of L-isoleucine crystals Solid State Communications Vol 149 No 37-38 (October 2009) pp 1553-1556 ISSN 0038-1098
Sasaki JM Freire PTC Moreno AJD Melo FEA Guedes I Mendes Filho J Shu J Hu J amp Matildeo HK (2000) Single crystal X-ray diffraction in monohydrate L-asparagine under hydrostatic pressure Science and Technology of High Pressure Proceedings of AIRAPT-17 Hyderabad India 2000
Seijas LE Delgado GE Mora AJ Fitch AN amp Brunelli M (2010) On the Crystal structures and hydrogen bond patterns in proline pseudopolymorphs Powder Diffraction Vol 25 No 3 (September 2010) pp 235-240 ISSN 0885-7156
Silva BL Freire PTC Melo FEA Mendes Filho J Pimenta MA amp Dantas MSS (2000) High-pressure Raman spectra of L-threonine crystal Journal of Raman Spectroscopy Vol 31 No 6 (June 2000) pp 519-522 ISSN 1097-4555
Teixeira AMR Freire PTC Moreno AJD Sasaki JM Ayala AP Mendes Filho J amp Melo FEA (2000) High-pressure Raman study of l-alanine crystal Solid State Communications Vol 116 No 7 (October 2000) pp 405-409 ISSN 0038-1098
Tumanov NA Boldyreva EV Kolesov BA Kurnosov AV amp Quesada Cabrera R (2010) Pressure-induced phase transitions in L-alanine revisited Acta Crystallographica Section B Vol 66 No 4 (August 2010) pp 458-371 ISSN 1600-5740
Yamashita M Inomata S Ishikawa K Kashiwagi T Matsuo H Sawamura S amp Kato M (2007) A high-pressure polymorph of L--leucine Acta Crystallographica Section E Vol 63 No 5 (May 2007) pp o2762-o2764 ISSN 1600-5368
wwwintechopencom
Vibrational SpectroscopyEdited by Prof Dominique De Caro
ISBN 978-953-51-0107-9Hard cover 168 pagesPublisher InTechPublished online 24 February 2012Published in print edition February 2012
InTech EuropeUniversity Campus STeP Ri Slavka Krautzeka 83A 51000 Rijeka Croatia Phone +385 (51) 770 447 Fax +385 (51) 686 166wwwintechopencom
InTech ChinaUnit 405 Office Block Hotel Equatorial Shanghai No65 Yan An Road (West) Shanghai 200040 China
Phone +86-21-62489820 Fax +86-21-62489821
The infrared and Raman spectroscopy have applications in numerous fields namely chemistry physicsastronomy biology medicine geology mineralogy etc This book provides some examples of the use ofvibrational spectroscopy in supramolecular chemistry inorganic chemistry solid state physics but also in thefields of molecule-based materials or organic-inorganic interfaces
How to referenceIn order to correctly reference this scholarly work feel free to copy and paste the following
Paulo de Tarso Cavalcante Freire Joseacute Alves Lima Juacutenior Bruno Tavares de Oliveira Abagaro Gardecircnia deSousa Pinheiro Joseacute de Arimateacutea Freitas e Silva Josueacute Mendes Filho and Francisco Erivan de Abreu Melo(2012) High Pressure Raman Spectra of Amino Acid Crystals Vibrational Spectroscopy Prof Dominique DeCaro (Ed) ISBN 978-953-51-0107-9 InTech Available from httpwwwintechopencombooksvibrational-spectroscopyhigh-pressure-raman-spectra-of-amino-acid-crystals
copy 2012 The Author(s) Licensee IntechOpen This is an open access articledistributed under the terms of the Creative Commons Attribution 30License which permits unrestricted use distribution and reproduction inany medium provided the original work is properly cited
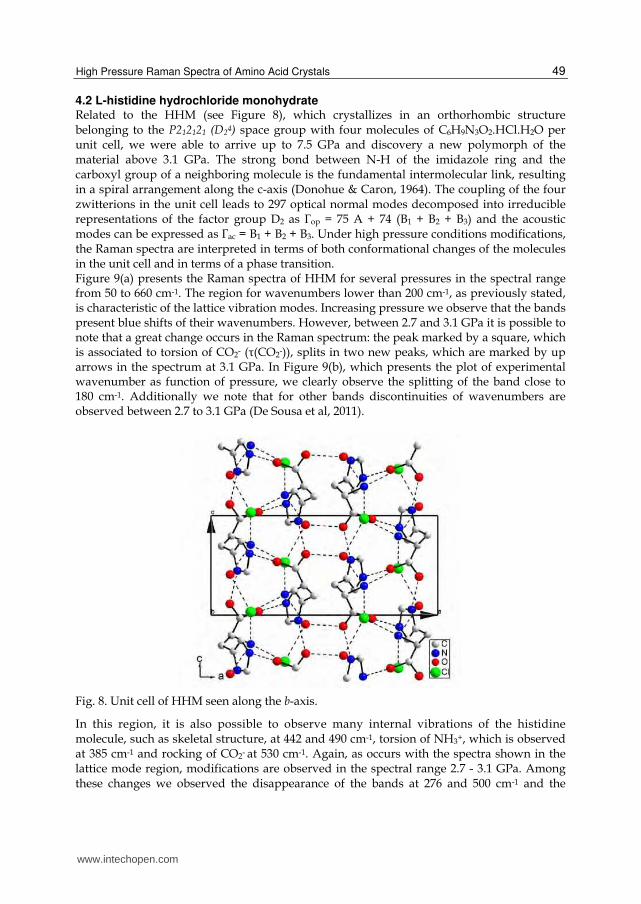
High Pressure Raman Spectra of Amino Acid Crystals
49
42 L-histidine hydrochloride monohydrate Related to the HHM (see Figure 8) which crystallizes in an orthorhombic structure belonging to the P212121 (D24) space group with four molecules of C6H9N3O2HClH2O per unit cell we were able to arrive up to 75 GPa and discovery a new polymorph of the material above 31 GPa The strong bond between N-H of the imidazole ring and the carboxyl group of a neighboring molecule is the fundamental intermolecular link resulting in a spiral arrangement along the c-axis (Donohue amp Caron 1964) The coupling of the four zwitterions in the unit cell leads to 297 optical normal modes decomposed into irreducible representations of the factor group D2 as Γop = 75 A + 74 (B1 + B2 + B3) and the acoustic modes can be expressed as Γac = B1 + B2 + B3 Under high pressure conditions modifications the Raman spectra are interpreted in terms of both conformational changes of the molecules in the unit cell and in terms of a phase transition Figure 9(a) presents the Raman spectra of HHM for several pressures in the spectral range from 50 to 660 cm-1 The region for wavenumbers lower than 200 cm-1 as previously stated is characteristic of the lattice vibration modes Increasing pressure we observe that the bands present blue shifts of their wavenumbers However between 27 and 31 GPa it is possible to note that a great change occurs in the Raman spectrum the peak marked by a square which is associated to torsion of CO2- (τ(CO2-)) splits in two new peaks which are marked by up arrows in the spectrum at 31 GPa In Figure 9(b) which presents the plot of experimental wavenumber as function of pressure we clearly observe the splitting of the band close to 180 cm-1 Additionally we note that for other bands discontinuities of wavenumbers are observed between 27 to 31 GPa (De Sousa et al 2011)
Fig 8 Unit cell of HHM seen along the b-axis
In this region it is also possible to observe many internal vibrations of the histidine molecule such as skeletal structure at 442 and 490 cm-1 torsion of NH3+ which is observed at 385 cm-1 and rocking of CO2- at 530 cm-1 Again as occurs with the spectra shown in the lattice mode region modifications are observed in the spectral range 27 - 31 GPa Among these changes we observed the disappearance of the bands at 276 and 500 cm-1 and the
wwwintechopencom
Vibrational Spectroscopy
50
Fig 9 (a) Raman spectra of HHM under several pressure conditions from 04 to 75 GPa in the spectral range 50 ndash 650 cm-1 (b) wavenumber versus pressure of the bands of HHM appearing in Fig 9(a)
appearance of a band at 473 cm-1 in the spectrum taken at 31 GPa We additionally note that the intensity of the band associated to torsion of NH3+ decreases with increasing pressure indicating that there occurs a conformational change of histidine molecule Such a conformational change can be understood as consequence of the change of the intermolecular hydrogen bond length With increasing pressure the band initially at 385 cm-
1 which is associated with a torsion vibration of the NH3+ unit shifts linearly toward higher wavenumbers we can say that the pressure decreases the length of the hydrogen bonds increasing the wavenumber of the band associated to torsional vibration of NH3+ unit Figure 10(a) presents the Raman spectra of HHM in the 650 ndash 1250 cm-1 interval for several pressure values up to 75 GPa In this spectral region it is expected to observe vibrations assigned to the deformation of CO2- stretching of both C-C and C-N wagging of H2O and rocking of NH3+ The band observed at ~ 694 cm-1 is associated to a deformation vibration of CO2- (CO2) while the out-of-plane vibration of CO2- (CO2) is observed at ~ 822 cm-1 The band at 807 cm-1 is associated with a wagging vibration of the water molecule w(H2O) The bands recorded at 1191 and 1210 cm-1 can be assigned as the rocking of NH3+ unit r(NH3+) In this spectral region some changes are observed in the range 27 ndash 31 GPa (i) the disappearance of the band at 694 cm-1 (ii) the appearance of a new weak band at 717 cm-1
(marked by a star in the Figure 10(a)) (iii) the inversion of intensity of the two bands located at 807 and 822 cm-1 which are related to units directly involved in the hydrogen bonds and (iv) the inversion of intensity of the two bands associated to a rocking of NH3+ unit r(NH3+) located at 1191 and 1210 cm-1 The dependence of the wavenumber versus pressure plot for this spectral region is presented in Fig 10(b) we note that many of the observed Raman modes show a small discontinuous change in the slope in the pressure-induced variation of its wavenumber in range 27 ndash 31 GPa
wwwintechopencom
High Pressure Raman Spectra of Amino Acid Crystals
51
Figure 11(a) shows the Raman spectra of the HHM crystal in the spectral range 1700-1400 cm-1 for pressure from 00 to 75 GPa Fig 11(b) shows the respective wavenumber vs pressure plots In this region one expects to observe vibrations assigned to a deformations of the imidazole ring of the histidine molecule asymmetric stretching of the CO2- units stretching of C=O among others In the Figure 11(a) two modifications are observed in the range 27 ndash 31 GPa The first change is the decreasing of the relative intensity of the band originally at 1433 cm-1 and the second one is the appearance of a band at 1642 cm-1 In the wavenumber versus pressure plot presented in Figure 11(b) a subtle discontinuity occurs in the range 27 ndash 31 GPa with appreciably differences in slopes where two modes change from positive to negative slopes
Fig 10 (a) Raman spectra of HHM under several pressure conditions from 04 to 75 GPa in the spectral range 650 ndash 1250 cm-1 (b) wavenumber versus pressure of the bands of HHM appearing in Fig 10(a)
The Raman spectra of HHM crystal in the range 3450-3125 cm-1 are shown in the Figure 12(a) and in the Figure 12(b) the respective wavenumber versus pressure plots are given In this region we expected to observe stretching vibrations of several units of the amino acids and of the water molecule (CH NH3+ and OH-) It is important to note that for wavenumbers lower than 3000 cm-1 there are some modes related to the mineral oil used as compression media In detail the band at 3111 cm-1 can be associated to a stretching vibration of NH3+ unit (NH3+) while the bands observed at 3155 and 3163 cm-1 are associated to a CH stretching vibration of imidazole ring The bands observed at 3374 and 3408 cm-1 are related to the OH- stretching of the water molecules In the pressure range 27 ndash 31 GPa main changes are observed such as the disappearance of the bands related to a OH- stretching vibration (initially located at 3367 and 3393 cm-1) the appearance of a band of weak intensity at 3424 cm-1 and discontinuities of the wavenumber curve of bands at 3155 and 3163 cm-1 which are associated with the CH stretching vibration
wwwintechopencom
Vibrational Spectroscopy
52
Fig 11 (a) Raman spectra of HHM under several pressure conditions from 04 to 75 GPa in the spectral range 1400 ndash 1670 cm-1 (b) wavenumber versus pressure of the bands of HHM appearing in Fig 11(a)
Fig 12 (a) Raman spectra of HHM under several pressure conditions from 04 to 75 GPa in the spectral range 2950 ndash 3450 cm-1 (b) wavenumber versus pressure of the bands of HHM appearing in Fig 12(a)
wwwintechopencom
High Pressure Raman Spectra of Amino Acid Crystals
53
Table 2 gives a quantitative analysis of the evolution of the Raman spectra of HHM crystal with pressure where fitting of all bands to a linear expression ω = ω0 + P is furnished In Table 2 the first column (ωobs) represents the wavenumber of the Raman bands observed at room pressure the second and third columns correspond to adjustment of data for pressure values between 0 and 27 GPa and the two last columns correspond to fitting of the high-pressure phase that observed between 31 and 75 GPa A resume of the modifications observed in all spectral regions of the Raman spectra of HHM is as follows (i) splitting of the band in the low-wavenumber lattice range (ii) change in the number of bands associated to internal modes (iii) wavenumber shifts with discontinuities (iv) changes in the relative intensities of the vibrational bands It is important to state that changes were observed for the deformation vibrations of the OH- of the water molecule as well as of the NH3+ and CO2- groups of the amino acid molecule This picture indicates large conformational changes of the molecules in the unit cell Related to HHM beyond the hydrogen bonds originated from the histidine molecule there are two hydrogen bonds from the water molecule It is interesting to note from Figure 12(b) that the wavenumber of OH- stretching (OH-) decreases with increasing pressure However the OH units participate of hydrogen bonds one to a carboxyl oxygen and another to the chloride ion This means that between 00 and 31 GPa the hydrogen bond strength increases and the wavenumber of(OH-) decreases in this pressure range Also after the phase transition the wavenumber of (OH-) suffers a jump and continues to decrease up to the highest pressure obtained in our experiments Such a picture indicates a further increase of the hydrogen bonds formed by the water molecules and confirms that these bonds are playing an important role in the mechanism of the transition It is interesting to note that similar changes in the low-wavenumber region were also observed for the same crystal when subjected to low temperatures
ωobs
(cm-1)
Phase 1
(0 le P le 27 GPa) Phase 2
(31 le P le 75 GPa)
ω0
(cm-1)
(cm-1)(GPa)-1 ω0
(cm-1)
(cm-1)(GPa)-1
94 945 0669 937 -0103
105 1052 0276 1002 1771
121 1214 -1087 1109 2092
136 1357 1616 1360 0623
149 1497 2128 - -
159 1568 8033 1483 8105
- - - 1639 9960
188 1891 7661 1902 8059
270 2697 3093 - -
293 2919 6118 2945 7683
385 3846 7236 4015 1675
442 4423 1223 4423 1461
wwwintechopencom
Vibrational Spectroscopy
54
ωobs
(cm-1)
Phase 1
(0 le P le 27 GPa) Phase 2
(31 le P le 75 GPa)
ω0
(cm-1)
(cm-1)(GPa)-1 ω0
(cm-1)
(cm-1)(GPa)-1
- - - 4707 0785
491 490 5 3319 - -
530 5304 4335 - -
609 6078 5312 6208 2463
693 6935 1529 - -
- - - 7064 3449
807 8067 2042 8047 1467
824 8240 -0498 8204 1442
838 8361 7335 8504 3124
875 8734 6438 8881 2777
917 9173 0810 9187 2356
963 9630 2757 9636 2411
980 9787 4489 9787 5206
1068 10667 4790 10732 3418
1141 11403 1890 11403 2744
1162 11619 2611 11674 1120
1190 11900 2277 11885 1637
1208 12079 2859 12101 1341
1434 14345 1316 14382 0846
1448 14481 3059 14554 1677
1463 14621 4415 14760 0778
1481 14813 4238 14970 -0619
1609 16093 2739 16166 -0374
- - - 16249 2736
3111 31110 0919 31045 2914
3154 31546 1287 31532 6564
3164 31626 5305 31593 7905
3375 33739 -2638 - -
3407 34081 -5745 - -
- - - 34371 -3169
Table 2 Wavenumber values of the bands appearing in the HHM spectrum at 00 GPa (ωobs) and adjustment data by linear fitting (P) for the two phases
wwwintechopencom
High Pressure Raman Spectra of Amino Acid Crystals
55
5 Conclusions
The results suggested that L-proline monohydrate undergoes two phase transitions one between 00 and 11 GPa and a second between 65 and 78 GPa In both transitions it was possible to observed changes in the spectrum profile discontinuities in the wavenumber versus pressure plots in the lattice region of the spectrum and the appearance of news bands By releasing the pressure after attaining a maximum of 118 GPa the atmospheric pressure spectrum was fully recovered showing that the pressure-induced transitions undergone by polycrystalline L-proline crystal are reversible In the first transition it was observed the splitting of bands associated to (CCN) (CO2-) and (CH) vibrations The band associated to (skel) has disappeared In the second one we have observed the red shift of r(CO2-) significant changes in the intensity of the bands associated to the sc(CO2-) and w(CH2) vibrations and the splits of (CCN) + (CC) and r(NH2+) that also has lost intensity These modifications were interpreted as conformational changes of molecules in the unit cell Because these changes involve moieties that participate in hydrogen bonds we suppose that these hydrogen bonds have also been modified Modifications of hydrogen bonds can trigger some molecular rearrangements that lead to structural phase transitions In our work this hypothesis was supported by the changes that were observed in the region of the lattice modes for both phase transitions Therefore the results suggested two structural phase transitions one between 00 and 11 GPa and another between 65 and 78 GPa accompanied by significant conformational changes of molecules in the L-proline monohydrated crystal The results also suggest that HHM crystal undergoes a phase transition between 27 and 31 GPa when it is submitted to high pressure conditions up to 75 GPa The main changes observed in the Raman spectra was the splitting of the band in the low-wavenumber lattice range change in the number of bands associated to internal modes and wavenumber shifts with discontinuities Having described the behavior of two amino acid crystals under pressure and looked back at the past fourteen years of research we can ask to ourselves what does the future hold Based on the studies performed we believe that the use of several techniques such as neutron and Raman scattering as well as thermal and infrared analyses can help us to give a complete picture about hydrogen bond and the behavior of amino acids under pressure Maybe the study of peptide under similar external conditions should be the next road to be walked
6 Acknowledgment
Authors acknowledge CAPES CNPq and FUNCAP for financial support
7 References
Barthes M Bordallo HN Deacutenoyer F Lorenzo J-E Zaccaro J Robert A amp Zontone F (2004) Micro-transitions or breathers in L-alanine The European Physical Journal B Vol 37 No 3 (February 2004) pp 375-382 ISSN 1434-6028
Boldyreva EV Drebushchak VA Drebushchak TN Paukov IE Kovalevskaya YA amp Shutova ES (2003a) Polymorphism of glycine Part I Journal of Thermal Analysis and Calorimetry Vol 73 No 2 (August 2003) pp 409-418 ISSN 1388-6150
wwwintechopencom
Vibrational Spectroscopy
56
Boldyreva EV Drebushchak VA Drebushchak TN Paukov IE Kovalevskaya YA amp Shutova ES (2003b) Polymorphism of glycine Part II Journal of Thermal Analysis and Calorimetry Vol 73 No 2 (August 2003) pp 419-428 ISSN 1388-6150
Boldyreva EV Ivashevskaya SN Sowa H Ahsbahs H amp Weber H-P (2004) Effect of High Pressure on Crystalline Glycine A New High-Pressure Polymorph Doklady Physical Chemistry Vol 396 No 1 (May 2004) pp 111-114 ISSN 0012-5016
Boldyreva EV Ivashevskaya SN Sowa H Ahsbahs H amp Weber H-P (2005a) Effect of hydrostatic pressure on the -polymorph of glycine 1 A polymorphic transition into a new -form Zeitschrift fuumlr Kristallographie Vol 220 No 1 ( January 2005) pp 50- 57 ISSN 0044-2968
Boldyreva EV Kolesnik EN Drebushchak TN Ahsbahs H Beukes JA amp Weber H-P (2005b) A comparative study of the anisotropy of a lattice strain induced in the crystals of L-serine by cooling down to 100 K or by increasing pressure up to 44 GPa Zeitschrift fuumlr Kristallographie Vol 220 No 1 (January 2005) pp 58- 65 ISSN 0044-2968
Boldyreva EV Kolesnik EN Drebushchak TN Ahsbahs H amp Seryotkin YV (2006a) A comparative study of the anisotropy of a lattice strain induced in the crystals of DL-serine by cooling down to 100 K or by increasing pressure up to 86 GPa A comparison with L-serine Zeitschrift fuumlr Kristallographie Vol 221 No 2 (2006) pp 150- 161 ISSN 0044-2968
Boldyreva EV Sowa H Seryotkin YV Drebushchak TN Ahsbahs H Chernyshev V amp Dmitriev V (2006b) Pressure-induced phase transitions in crystalline L-serine studied by single crystal and gigh-resolution powder X-ray diffraction Chemical Physics Letters Vol 429 No 4-6 (October 2006) pp 474-478 ISSN 0009-2614
Boldyreva E (2007a) Cristalline Amino Acids A Link between Chemistry Materials Science and Biology In Models Mysteries and Magic of Molecules Boeyens JCA amp Ogilvie JF pp 167-192 Springer ISBN 978-1-4020-5940-7 Netherlands
Boldyreva E (2007b) High-Pressure Polymorphs of Molecular Solids When Are They Formed and When Are They Not Some Examples of the Role of Kinetic Control Crystal Growth amp Design Vol 7 No 9 (August 2007) pp 1662-1668 ISSN 1528-7483
Dawson A Allan DR Belmonte SA Clark SJ David WIF McGregor PA Parsons S Pulham CR amp Sawyer L (2005) Effect of high pressure on the crystal structures of polymorphs of glycine Crystal Growth amp Design Vol 5 No 4 (May 2005) pp 1415-1427 ISSN 1528-7483
Destro R Marsh RE amp Bianchi R (1988) A low-temperature (23K) study of L-alanine The Journal of Physical Chemistry Vol 92 No 4 (February 1988) pp 966-973 ISSN 0022-3654
De Sousa GP Freire PTC Lima Jr JA Mendes Filho J amp Melo FEA (2011) High-pressure Raman spectra of L-histidine hydrochloride monohydrate cristal Vibrational Spectroscopy Vol 57 No 1 (September 2011) pp 102-107 ISSN 0924-2031
Donohue J amp Caron A (1964) Refinement of cristal structure of histidine hydrochloride monohydrate Acta Crystallographica Vol 17 No 9 (September 1964) pp 1178-amp ISSN 0108-7673
wwwintechopencom
High Pressure Raman Spectra of Amino Acid Crystals
57
Faccedilanha Filho PF Freire PTC Lima KCV Mendes Filho J Melo FEA amp Pizani PS (2008) High temperature Raman spectra of L-leucine crystals Brazilian Journal of Physics Vol 38 No 1 (March 2008) pp 131-137 ISSN 0103-9733
Faccedilanha Filho PF Freire PTC Melo FEA Lemos V Mendes Filho J Pizani PS amp Rossatto DZ (2009) Pressure-induced phase transitions in L-leucine crystal Journal of Raman Spectroscopy Vol 40 No 1 (January 2009) pp 46-51 ISSN 1097-4555
Freire PTC (2010) Pressure-Induced Phase Transitions in Crystalline Amino Acids In High Pressure Crystallography ndash From Fundamental Phenomena to Technological Applications Boldyreva E amp Dera P pp 559-572 Springer ISBN 978-904-8192-60-1 New York USA
Funnel NP Dawson A Francis D Lennie DR Marshall WG Moggach SA Warren JE amp Parsons S (2010) The effect of pressure on the crystal structure of l-alanine CrystEngComm Vol 12 No 9 (September 2010) pp 2573-2583 ISSN 1466-8033
Goryainov SV Kolesnik EN amp Boldyreva EV (2005) A reversible pressure-induced phase transition in -glycine at 076 GPa Physica B Condensed Matter Vol 357 No 3-4 (March 2005) pp 340-347 ISSN 0921-4526
Goryainov SV Kolesnik EN amp Boldyreva EV (2006) Raman observation of a new (ζ) polymorph of glycine Chemical Physics Letters Vol 419 No 4-6 (February 2006) pp 496-500 ISSN 0009-2614
Harding MM amp Howieson RM (1976) L-Leucine Acta Crystallographica Section B Vol 32 No 2 (February 1976) pp 633-634 ISSN 1600-5740
Herlinger AW amp Long TV (1970) Laser Raman and infrared spectra of amino acids and their metal complexes 3 Proline and bisprolinato complexes Journal of the American Chemical Society Vol 92 No 22 (November 1970) pp 6481-6486 ISSN 0002-7863
Hermiacutenio da Silva J Lemos V Freire PTC Melo FEA Mendes Filho J Lima Jr JA amp Pizani PS (2009) Stability of the crystal structure of L-valine under high pressure Physica Status Solidi B Vol 246 No 3 (March 2009) pp 553-557 ISSN 0370-1972
Lima JA Freire PTC Melo FEA Lemos V Mendes Filho J amp Pizani PS (2008) High pressure Raman spectra of L-methionine Crystal Journal of Raman Spectroscopy Vol 39 No 10 (October 2008) pp 1356-1363 ISSN 1097-4555
Migliori A Maxton PM Clogston AM Zirngiebl E amp Lowe M (1988) Anomalous temperature dependence in the Raman spectra of l-alanine Evidence for dynamic localization Physical Review B Vol 38 No 18 (December 1988) pp 13464-13467 ISSN 1098-0121
Minkov VS Krylov AS Boldyreva EV Goryainov SN Bizyaev SN amp Vtyurin AN (2008) Pressure-Induced Phase Transitions in Crystalline L- and DL-Cysteine The Journal of Physical Chemistry B Vol 112 No 30 (July 2008) pp 8851-8854 ISSN 1520-6106
Minkov VS Goryainov SV Boldyreva EV amp Goumlrbitz CH (2010) Raman study of pressure-induced phase transitions in the crystals of orthorhombic and monoclinic polymorphs of L-cysteine dynamics of the side-chain Journal of Raman Spectroscopy Vol 41 No 12 (December 2010) pp 1458-1468 ISSN 1097-4555
Moggach SA Allan DR Morrison PA Parsons S amp Sawyer L (2005) Effect of pressure on the crystal structure of L-serine-I and the crystal structure of L-serine-II
wwwintechopencom
Vibrational Spectroscopy
58
at 54 GPa Acta Crystallographica Section B Vol 61 No 1 (February 2005) pp 58-68 ISSN 0108-7681
Moggach SA Marshall WG amp Parsons S (2006) High-pressure neutron diffraction study of L-serine-I and L-serine-II and the structure of L-serine-III at 81 GPa Acta Crystallographica Section B Vol 62 No 5 (October 2006) pp 815-825 ISSN 0108-7681
Moreno AJD Freire PTC Melo FEA Arauacutejo-Silva MA Guedes I Mendes Filho J (1997) Pressure-induced phase transitions in monohydrated l-asparagine aminoacid crystals Solid State Communications Vol 103 No 12 (September 1997) pp 655-658 ISSN 0038-1098
Murli C Sharma SK Karmakar S amp Sikka SK (2003) -Glycine under high pressures a Raman scattering study Physica B Condensed Matter Vol 339 No 1 (November 2003) pp 23-30 ISSN 0921-4526
Murli C Vasanthi R amp Sharma SM (2006) Raman spectroscopic investigations of DL-serine and DL-valine under pressure Chemical Physics Vol 331 No 1 (December 2006) pp 77-84 ISSN 0301-0104
Olsen JS Gerward L Freire PTC Mendes Filho J Melo FEA amp Souza Filho AG (2008) Pressure-induced phase transitions in L-alanine crystals Journal of Physics and Chemistry of Solids Vol 69 No 7 (July 2008) pp 1641-1645 ISSN 0022-3697
Sabino AS De Sousa GP Luz-Lima C Freire PTC Melo FEA amp Mendes Filho J (2009) High-pressure Raman spectra of L-isoleucine crystals Solid State Communications Vol 149 No 37-38 (October 2009) pp 1553-1556 ISSN 0038-1098
Sasaki JM Freire PTC Moreno AJD Melo FEA Guedes I Mendes Filho J Shu J Hu J amp Matildeo HK (2000) Single crystal X-ray diffraction in monohydrate L-asparagine under hydrostatic pressure Science and Technology of High Pressure Proceedings of AIRAPT-17 Hyderabad India 2000
Seijas LE Delgado GE Mora AJ Fitch AN amp Brunelli M (2010) On the Crystal structures and hydrogen bond patterns in proline pseudopolymorphs Powder Diffraction Vol 25 No 3 (September 2010) pp 235-240 ISSN 0885-7156
Silva BL Freire PTC Melo FEA Mendes Filho J Pimenta MA amp Dantas MSS (2000) High-pressure Raman spectra of L-threonine crystal Journal of Raman Spectroscopy Vol 31 No 6 (June 2000) pp 519-522 ISSN 1097-4555
Teixeira AMR Freire PTC Moreno AJD Sasaki JM Ayala AP Mendes Filho J amp Melo FEA (2000) High-pressure Raman study of l-alanine crystal Solid State Communications Vol 116 No 7 (October 2000) pp 405-409 ISSN 0038-1098
Tumanov NA Boldyreva EV Kolesov BA Kurnosov AV amp Quesada Cabrera R (2010) Pressure-induced phase transitions in L-alanine revisited Acta Crystallographica Section B Vol 66 No 4 (August 2010) pp 458-371 ISSN 1600-5740
Yamashita M Inomata S Ishikawa K Kashiwagi T Matsuo H Sawamura S amp Kato M (2007) A high-pressure polymorph of L--leucine Acta Crystallographica Section E Vol 63 No 5 (May 2007) pp o2762-o2764 ISSN 1600-5368
wwwintechopencom
Vibrational SpectroscopyEdited by Prof Dominique De Caro
ISBN 978-953-51-0107-9Hard cover 168 pagesPublisher InTechPublished online 24 February 2012Published in print edition February 2012
InTech EuropeUniversity Campus STeP Ri Slavka Krautzeka 83A 51000 Rijeka Croatia Phone +385 (51) 770 447 Fax +385 (51) 686 166wwwintechopencom
InTech ChinaUnit 405 Office Block Hotel Equatorial Shanghai No65 Yan An Road (West) Shanghai 200040 China
Phone +86-21-62489820 Fax +86-21-62489821
The infrared and Raman spectroscopy have applications in numerous fields namely chemistry physicsastronomy biology medicine geology mineralogy etc This book provides some examples of the use ofvibrational spectroscopy in supramolecular chemistry inorganic chemistry solid state physics but also in thefields of molecule-based materials or organic-inorganic interfaces
How to referenceIn order to correctly reference this scholarly work feel free to copy and paste the following
Paulo de Tarso Cavalcante Freire Joseacute Alves Lima Juacutenior Bruno Tavares de Oliveira Abagaro Gardecircnia deSousa Pinheiro Joseacute de Arimateacutea Freitas e Silva Josueacute Mendes Filho and Francisco Erivan de Abreu Melo(2012) High Pressure Raman Spectra of Amino Acid Crystals Vibrational Spectroscopy Prof Dominique DeCaro (Ed) ISBN 978-953-51-0107-9 InTech Available from httpwwwintechopencombooksvibrational-spectroscopyhigh-pressure-raman-spectra-of-amino-acid-crystals
copy 2012 The Author(s) Licensee IntechOpen This is an open access articledistributed under the terms of the Creative Commons Attribution 30License which permits unrestricted use distribution and reproduction inany medium provided the original work is properly cited
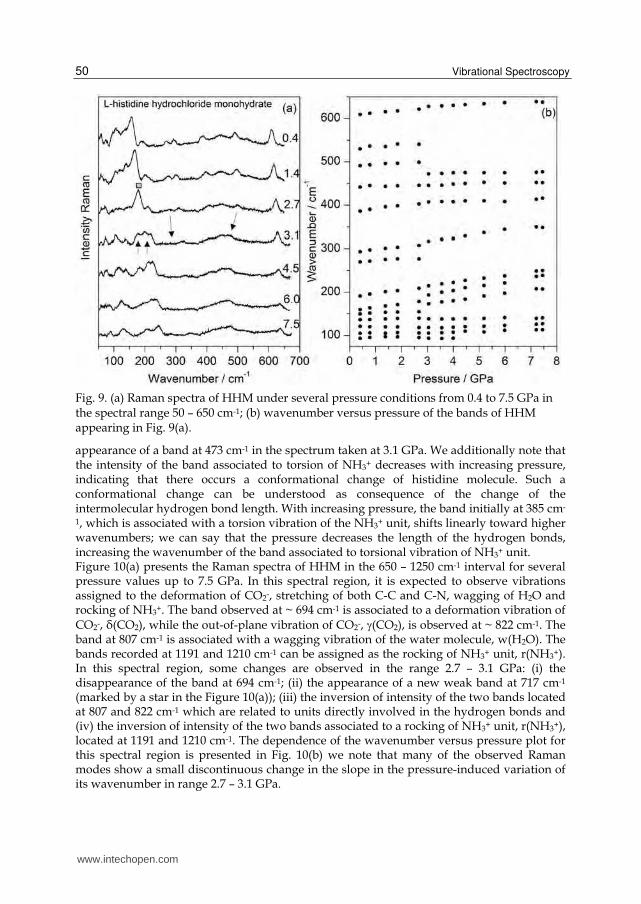
Vibrational Spectroscopy
50
Fig 9 (a) Raman spectra of HHM under several pressure conditions from 04 to 75 GPa in the spectral range 50 ndash 650 cm-1 (b) wavenumber versus pressure of the bands of HHM appearing in Fig 9(a)
appearance of a band at 473 cm-1 in the spectrum taken at 31 GPa We additionally note that the intensity of the band associated to torsion of NH3+ decreases with increasing pressure indicating that there occurs a conformational change of histidine molecule Such a conformational change can be understood as consequence of the change of the intermolecular hydrogen bond length With increasing pressure the band initially at 385 cm-
1 which is associated with a torsion vibration of the NH3+ unit shifts linearly toward higher wavenumbers we can say that the pressure decreases the length of the hydrogen bonds increasing the wavenumber of the band associated to torsional vibration of NH3+ unit Figure 10(a) presents the Raman spectra of HHM in the 650 ndash 1250 cm-1 interval for several pressure values up to 75 GPa In this spectral region it is expected to observe vibrations assigned to the deformation of CO2- stretching of both C-C and C-N wagging of H2O and rocking of NH3+ The band observed at ~ 694 cm-1 is associated to a deformation vibration of CO2- (CO2) while the out-of-plane vibration of CO2- (CO2) is observed at ~ 822 cm-1 The band at 807 cm-1 is associated with a wagging vibration of the water molecule w(H2O) The bands recorded at 1191 and 1210 cm-1 can be assigned as the rocking of NH3+ unit r(NH3+) In this spectral region some changes are observed in the range 27 ndash 31 GPa (i) the disappearance of the band at 694 cm-1 (ii) the appearance of a new weak band at 717 cm-1
(marked by a star in the Figure 10(a)) (iii) the inversion of intensity of the two bands located at 807 and 822 cm-1 which are related to units directly involved in the hydrogen bonds and (iv) the inversion of intensity of the two bands associated to a rocking of NH3+ unit r(NH3+) located at 1191 and 1210 cm-1 The dependence of the wavenumber versus pressure plot for this spectral region is presented in Fig 10(b) we note that many of the observed Raman modes show a small discontinuous change in the slope in the pressure-induced variation of its wavenumber in range 27 ndash 31 GPa
wwwintechopencom
High Pressure Raman Spectra of Amino Acid Crystals
51
Figure 11(a) shows the Raman spectra of the HHM crystal in the spectral range 1700-1400 cm-1 for pressure from 00 to 75 GPa Fig 11(b) shows the respective wavenumber vs pressure plots In this region one expects to observe vibrations assigned to a deformations of the imidazole ring of the histidine molecule asymmetric stretching of the CO2- units stretching of C=O among others In the Figure 11(a) two modifications are observed in the range 27 ndash 31 GPa The first change is the decreasing of the relative intensity of the band originally at 1433 cm-1 and the second one is the appearance of a band at 1642 cm-1 In the wavenumber versus pressure plot presented in Figure 11(b) a subtle discontinuity occurs in the range 27 ndash 31 GPa with appreciably differences in slopes where two modes change from positive to negative slopes
Fig 10 (a) Raman spectra of HHM under several pressure conditions from 04 to 75 GPa in the spectral range 650 ndash 1250 cm-1 (b) wavenumber versus pressure of the bands of HHM appearing in Fig 10(a)
The Raman spectra of HHM crystal in the range 3450-3125 cm-1 are shown in the Figure 12(a) and in the Figure 12(b) the respective wavenumber versus pressure plots are given In this region we expected to observe stretching vibrations of several units of the amino acids and of the water molecule (CH NH3+ and OH-) It is important to note that for wavenumbers lower than 3000 cm-1 there are some modes related to the mineral oil used as compression media In detail the band at 3111 cm-1 can be associated to a stretching vibration of NH3+ unit (NH3+) while the bands observed at 3155 and 3163 cm-1 are associated to a CH stretching vibration of imidazole ring The bands observed at 3374 and 3408 cm-1 are related to the OH- stretching of the water molecules In the pressure range 27 ndash 31 GPa main changes are observed such as the disappearance of the bands related to a OH- stretching vibration (initially located at 3367 and 3393 cm-1) the appearance of a band of weak intensity at 3424 cm-1 and discontinuities of the wavenumber curve of bands at 3155 and 3163 cm-1 which are associated with the CH stretching vibration
wwwintechopencom
Vibrational Spectroscopy
52
Fig 11 (a) Raman spectra of HHM under several pressure conditions from 04 to 75 GPa in the spectral range 1400 ndash 1670 cm-1 (b) wavenumber versus pressure of the bands of HHM appearing in Fig 11(a)
Fig 12 (a) Raman spectra of HHM under several pressure conditions from 04 to 75 GPa in the spectral range 2950 ndash 3450 cm-1 (b) wavenumber versus pressure of the bands of HHM appearing in Fig 12(a)
wwwintechopencom
High Pressure Raman Spectra of Amino Acid Crystals
53
Table 2 gives a quantitative analysis of the evolution of the Raman spectra of HHM crystal with pressure where fitting of all bands to a linear expression ω = ω0 + P is furnished In Table 2 the first column (ωobs) represents the wavenumber of the Raman bands observed at room pressure the second and third columns correspond to adjustment of data for pressure values between 0 and 27 GPa and the two last columns correspond to fitting of the high-pressure phase that observed between 31 and 75 GPa A resume of the modifications observed in all spectral regions of the Raman spectra of HHM is as follows (i) splitting of the band in the low-wavenumber lattice range (ii) change in the number of bands associated to internal modes (iii) wavenumber shifts with discontinuities (iv) changes in the relative intensities of the vibrational bands It is important to state that changes were observed for the deformation vibrations of the OH- of the water molecule as well as of the NH3+ and CO2- groups of the amino acid molecule This picture indicates large conformational changes of the molecules in the unit cell Related to HHM beyond the hydrogen bonds originated from the histidine molecule there are two hydrogen bonds from the water molecule It is interesting to note from Figure 12(b) that the wavenumber of OH- stretching (OH-) decreases with increasing pressure However the OH units participate of hydrogen bonds one to a carboxyl oxygen and another to the chloride ion This means that between 00 and 31 GPa the hydrogen bond strength increases and the wavenumber of(OH-) decreases in this pressure range Also after the phase transition the wavenumber of (OH-) suffers a jump and continues to decrease up to the highest pressure obtained in our experiments Such a picture indicates a further increase of the hydrogen bonds formed by the water molecules and confirms that these bonds are playing an important role in the mechanism of the transition It is interesting to note that similar changes in the low-wavenumber region were also observed for the same crystal when subjected to low temperatures
ωobs
(cm-1)
Phase 1
(0 le P le 27 GPa) Phase 2
(31 le P le 75 GPa)
ω0
(cm-1)
(cm-1)(GPa)-1 ω0
(cm-1)
(cm-1)(GPa)-1
94 945 0669 937 -0103
105 1052 0276 1002 1771
121 1214 -1087 1109 2092
136 1357 1616 1360 0623
149 1497 2128 - -
159 1568 8033 1483 8105
- - - 1639 9960
188 1891 7661 1902 8059
270 2697 3093 - -
293 2919 6118 2945 7683
385 3846 7236 4015 1675
442 4423 1223 4423 1461
wwwintechopencom
Vibrational Spectroscopy
54
ωobs
(cm-1)
Phase 1
(0 le P le 27 GPa) Phase 2
(31 le P le 75 GPa)
ω0
(cm-1)
(cm-1)(GPa)-1 ω0
(cm-1)
(cm-1)(GPa)-1
- - - 4707 0785
491 490 5 3319 - -
530 5304 4335 - -
609 6078 5312 6208 2463
693 6935 1529 - -
- - - 7064 3449
807 8067 2042 8047 1467
824 8240 -0498 8204 1442
838 8361 7335 8504 3124
875 8734 6438 8881 2777
917 9173 0810 9187 2356
963 9630 2757 9636 2411
980 9787 4489 9787 5206
1068 10667 4790 10732 3418
1141 11403 1890 11403 2744
1162 11619 2611 11674 1120
1190 11900 2277 11885 1637
1208 12079 2859 12101 1341
1434 14345 1316 14382 0846
1448 14481 3059 14554 1677
1463 14621 4415 14760 0778
1481 14813 4238 14970 -0619
1609 16093 2739 16166 -0374
- - - 16249 2736
3111 31110 0919 31045 2914
3154 31546 1287 31532 6564
3164 31626 5305 31593 7905
3375 33739 -2638 - -
3407 34081 -5745 - -
- - - 34371 -3169
Table 2 Wavenumber values of the bands appearing in the HHM spectrum at 00 GPa (ωobs) and adjustment data by linear fitting (P) for the two phases
wwwintechopencom
High Pressure Raman Spectra of Amino Acid Crystals
55
5 Conclusions
The results suggested that L-proline monohydrate undergoes two phase transitions one between 00 and 11 GPa and a second between 65 and 78 GPa In both transitions it was possible to observed changes in the spectrum profile discontinuities in the wavenumber versus pressure plots in the lattice region of the spectrum and the appearance of news bands By releasing the pressure after attaining a maximum of 118 GPa the atmospheric pressure spectrum was fully recovered showing that the pressure-induced transitions undergone by polycrystalline L-proline crystal are reversible In the first transition it was observed the splitting of bands associated to (CCN) (CO2-) and (CH) vibrations The band associated to (skel) has disappeared In the second one we have observed the red shift of r(CO2-) significant changes in the intensity of the bands associated to the sc(CO2-) and w(CH2) vibrations and the splits of (CCN) + (CC) and r(NH2+) that also has lost intensity These modifications were interpreted as conformational changes of molecules in the unit cell Because these changes involve moieties that participate in hydrogen bonds we suppose that these hydrogen bonds have also been modified Modifications of hydrogen bonds can trigger some molecular rearrangements that lead to structural phase transitions In our work this hypothesis was supported by the changes that were observed in the region of the lattice modes for both phase transitions Therefore the results suggested two structural phase transitions one between 00 and 11 GPa and another between 65 and 78 GPa accompanied by significant conformational changes of molecules in the L-proline monohydrated crystal The results also suggest that HHM crystal undergoes a phase transition between 27 and 31 GPa when it is submitted to high pressure conditions up to 75 GPa The main changes observed in the Raman spectra was the splitting of the band in the low-wavenumber lattice range change in the number of bands associated to internal modes and wavenumber shifts with discontinuities Having described the behavior of two amino acid crystals under pressure and looked back at the past fourteen years of research we can ask to ourselves what does the future hold Based on the studies performed we believe that the use of several techniques such as neutron and Raman scattering as well as thermal and infrared analyses can help us to give a complete picture about hydrogen bond and the behavior of amino acids under pressure Maybe the study of peptide under similar external conditions should be the next road to be walked
6 Acknowledgment
Authors acknowledge CAPES CNPq and FUNCAP for financial support
7 References
Barthes M Bordallo HN Deacutenoyer F Lorenzo J-E Zaccaro J Robert A amp Zontone F (2004) Micro-transitions or breathers in L-alanine The European Physical Journal B Vol 37 No 3 (February 2004) pp 375-382 ISSN 1434-6028
Boldyreva EV Drebushchak VA Drebushchak TN Paukov IE Kovalevskaya YA amp Shutova ES (2003a) Polymorphism of glycine Part I Journal of Thermal Analysis and Calorimetry Vol 73 No 2 (August 2003) pp 409-418 ISSN 1388-6150
wwwintechopencom
Vibrational Spectroscopy
56
Boldyreva EV Drebushchak VA Drebushchak TN Paukov IE Kovalevskaya YA amp Shutova ES (2003b) Polymorphism of glycine Part II Journal of Thermal Analysis and Calorimetry Vol 73 No 2 (August 2003) pp 419-428 ISSN 1388-6150
Boldyreva EV Ivashevskaya SN Sowa H Ahsbahs H amp Weber H-P (2004) Effect of High Pressure on Crystalline Glycine A New High-Pressure Polymorph Doklady Physical Chemistry Vol 396 No 1 (May 2004) pp 111-114 ISSN 0012-5016
Boldyreva EV Ivashevskaya SN Sowa H Ahsbahs H amp Weber H-P (2005a) Effect of hydrostatic pressure on the -polymorph of glycine 1 A polymorphic transition into a new -form Zeitschrift fuumlr Kristallographie Vol 220 No 1 ( January 2005) pp 50- 57 ISSN 0044-2968
Boldyreva EV Kolesnik EN Drebushchak TN Ahsbahs H Beukes JA amp Weber H-P (2005b) A comparative study of the anisotropy of a lattice strain induced in the crystals of L-serine by cooling down to 100 K or by increasing pressure up to 44 GPa Zeitschrift fuumlr Kristallographie Vol 220 No 1 (January 2005) pp 58- 65 ISSN 0044-2968
Boldyreva EV Kolesnik EN Drebushchak TN Ahsbahs H amp Seryotkin YV (2006a) A comparative study of the anisotropy of a lattice strain induced in the crystals of DL-serine by cooling down to 100 K or by increasing pressure up to 86 GPa A comparison with L-serine Zeitschrift fuumlr Kristallographie Vol 221 No 2 (2006) pp 150- 161 ISSN 0044-2968
Boldyreva EV Sowa H Seryotkin YV Drebushchak TN Ahsbahs H Chernyshev V amp Dmitriev V (2006b) Pressure-induced phase transitions in crystalline L-serine studied by single crystal and gigh-resolution powder X-ray diffraction Chemical Physics Letters Vol 429 No 4-6 (October 2006) pp 474-478 ISSN 0009-2614
Boldyreva E (2007a) Cristalline Amino Acids A Link between Chemistry Materials Science and Biology In Models Mysteries and Magic of Molecules Boeyens JCA amp Ogilvie JF pp 167-192 Springer ISBN 978-1-4020-5940-7 Netherlands
Boldyreva E (2007b) High-Pressure Polymorphs of Molecular Solids When Are They Formed and When Are They Not Some Examples of the Role of Kinetic Control Crystal Growth amp Design Vol 7 No 9 (August 2007) pp 1662-1668 ISSN 1528-7483
Dawson A Allan DR Belmonte SA Clark SJ David WIF McGregor PA Parsons S Pulham CR amp Sawyer L (2005) Effect of high pressure on the crystal structures of polymorphs of glycine Crystal Growth amp Design Vol 5 No 4 (May 2005) pp 1415-1427 ISSN 1528-7483
Destro R Marsh RE amp Bianchi R (1988) A low-temperature (23K) study of L-alanine The Journal of Physical Chemistry Vol 92 No 4 (February 1988) pp 966-973 ISSN 0022-3654
De Sousa GP Freire PTC Lima Jr JA Mendes Filho J amp Melo FEA (2011) High-pressure Raman spectra of L-histidine hydrochloride monohydrate cristal Vibrational Spectroscopy Vol 57 No 1 (September 2011) pp 102-107 ISSN 0924-2031
Donohue J amp Caron A (1964) Refinement of cristal structure of histidine hydrochloride monohydrate Acta Crystallographica Vol 17 No 9 (September 1964) pp 1178-amp ISSN 0108-7673
wwwintechopencom
High Pressure Raman Spectra of Amino Acid Crystals
57
Faccedilanha Filho PF Freire PTC Lima KCV Mendes Filho J Melo FEA amp Pizani PS (2008) High temperature Raman spectra of L-leucine crystals Brazilian Journal of Physics Vol 38 No 1 (March 2008) pp 131-137 ISSN 0103-9733
Faccedilanha Filho PF Freire PTC Melo FEA Lemos V Mendes Filho J Pizani PS amp Rossatto DZ (2009) Pressure-induced phase transitions in L-leucine crystal Journal of Raman Spectroscopy Vol 40 No 1 (January 2009) pp 46-51 ISSN 1097-4555
Freire PTC (2010) Pressure-Induced Phase Transitions in Crystalline Amino Acids In High Pressure Crystallography ndash From Fundamental Phenomena to Technological Applications Boldyreva E amp Dera P pp 559-572 Springer ISBN 978-904-8192-60-1 New York USA
Funnel NP Dawson A Francis D Lennie DR Marshall WG Moggach SA Warren JE amp Parsons S (2010) The effect of pressure on the crystal structure of l-alanine CrystEngComm Vol 12 No 9 (September 2010) pp 2573-2583 ISSN 1466-8033
Goryainov SV Kolesnik EN amp Boldyreva EV (2005) A reversible pressure-induced phase transition in -glycine at 076 GPa Physica B Condensed Matter Vol 357 No 3-4 (March 2005) pp 340-347 ISSN 0921-4526
Goryainov SV Kolesnik EN amp Boldyreva EV (2006) Raman observation of a new (ζ) polymorph of glycine Chemical Physics Letters Vol 419 No 4-6 (February 2006) pp 496-500 ISSN 0009-2614
Harding MM amp Howieson RM (1976) L-Leucine Acta Crystallographica Section B Vol 32 No 2 (February 1976) pp 633-634 ISSN 1600-5740
Herlinger AW amp Long TV (1970) Laser Raman and infrared spectra of amino acids and their metal complexes 3 Proline and bisprolinato complexes Journal of the American Chemical Society Vol 92 No 22 (November 1970) pp 6481-6486 ISSN 0002-7863
Hermiacutenio da Silva J Lemos V Freire PTC Melo FEA Mendes Filho J Lima Jr JA amp Pizani PS (2009) Stability of the crystal structure of L-valine under high pressure Physica Status Solidi B Vol 246 No 3 (March 2009) pp 553-557 ISSN 0370-1972
Lima JA Freire PTC Melo FEA Lemos V Mendes Filho J amp Pizani PS (2008) High pressure Raman spectra of L-methionine Crystal Journal of Raman Spectroscopy Vol 39 No 10 (October 2008) pp 1356-1363 ISSN 1097-4555
Migliori A Maxton PM Clogston AM Zirngiebl E amp Lowe M (1988) Anomalous temperature dependence in the Raman spectra of l-alanine Evidence for dynamic localization Physical Review B Vol 38 No 18 (December 1988) pp 13464-13467 ISSN 1098-0121
Minkov VS Krylov AS Boldyreva EV Goryainov SN Bizyaev SN amp Vtyurin AN (2008) Pressure-Induced Phase Transitions in Crystalline L- and DL-Cysteine The Journal of Physical Chemistry B Vol 112 No 30 (July 2008) pp 8851-8854 ISSN 1520-6106
Minkov VS Goryainov SV Boldyreva EV amp Goumlrbitz CH (2010) Raman study of pressure-induced phase transitions in the crystals of orthorhombic and monoclinic polymorphs of L-cysteine dynamics of the side-chain Journal of Raman Spectroscopy Vol 41 No 12 (December 2010) pp 1458-1468 ISSN 1097-4555
Moggach SA Allan DR Morrison PA Parsons S amp Sawyer L (2005) Effect of pressure on the crystal structure of L-serine-I and the crystal structure of L-serine-II
wwwintechopencom
Vibrational Spectroscopy
58
at 54 GPa Acta Crystallographica Section B Vol 61 No 1 (February 2005) pp 58-68 ISSN 0108-7681
Moggach SA Marshall WG amp Parsons S (2006) High-pressure neutron diffraction study of L-serine-I and L-serine-II and the structure of L-serine-III at 81 GPa Acta Crystallographica Section B Vol 62 No 5 (October 2006) pp 815-825 ISSN 0108-7681
Moreno AJD Freire PTC Melo FEA Arauacutejo-Silva MA Guedes I Mendes Filho J (1997) Pressure-induced phase transitions in monohydrated l-asparagine aminoacid crystals Solid State Communications Vol 103 No 12 (September 1997) pp 655-658 ISSN 0038-1098
Murli C Sharma SK Karmakar S amp Sikka SK (2003) -Glycine under high pressures a Raman scattering study Physica B Condensed Matter Vol 339 No 1 (November 2003) pp 23-30 ISSN 0921-4526
Murli C Vasanthi R amp Sharma SM (2006) Raman spectroscopic investigations of DL-serine and DL-valine under pressure Chemical Physics Vol 331 No 1 (December 2006) pp 77-84 ISSN 0301-0104
Olsen JS Gerward L Freire PTC Mendes Filho J Melo FEA amp Souza Filho AG (2008) Pressure-induced phase transitions in L-alanine crystals Journal of Physics and Chemistry of Solids Vol 69 No 7 (July 2008) pp 1641-1645 ISSN 0022-3697
Sabino AS De Sousa GP Luz-Lima C Freire PTC Melo FEA amp Mendes Filho J (2009) High-pressure Raman spectra of L-isoleucine crystals Solid State Communications Vol 149 No 37-38 (October 2009) pp 1553-1556 ISSN 0038-1098
Sasaki JM Freire PTC Moreno AJD Melo FEA Guedes I Mendes Filho J Shu J Hu J amp Matildeo HK (2000) Single crystal X-ray diffraction in monohydrate L-asparagine under hydrostatic pressure Science and Technology of High Pressure Proceedings of AIRAPT-17 Hyderabad India 2000
Seijas LE Delgado GE Mora AJ Fitch AN amp Brunelli M (2010) On the Crystal structures and hydrogen bond patterns in proline pseudopolymorphs Powder Diffraction Vol 25 No 3 (September 2010) pp 235-240 ISSN 0885-7156
Silva BL Freire PTC Melo FEA Mendes Filho J Pimenta MA amp Dantas MSS (2000) High-pressure Raman spectra of L-threonine crystal Journal of Raman Spectroscopy Vol 31 No 6 (June 2000) pp 519-522 ISSN 1097-4555
Teixeira AMR Freire PTC Moreno AJD Sasaki JM Ayala AP Mendes Filho J amp Melo FEA (2000) High-pressure Raman study of l-alanine crystal Solid State Communications Vol 116 No 7 (October 2000) pp 405-409 ISSN 0038-1098
Tumanov NA Boldyreva EV Kolesov BA Kurnosov AV amp Quesada Cabrera R (2010) Pressure-induced phase transitions in L-alanine revisited Acta Crystallographica Section B Vol 66 No 4 (August 2010) pp 458-371 ISSN 1600-5740
Yamashita M Inomata S Ishikawa K Kashiwagi T Matsuo H Sawamura S amp Kato M (2007) A high-pressure polymorph of L--leucine Acta Crystallographica Section E Vol 63 No 5 (May 2007) pp o2762-o2764 ISSN 1600-5368
wwwintechopencom
Vibrational SpectroscopyEdited by Prof Dominique De Caro
ISBN 978-953-51-0107-9Hard cover 168 pagesPublisher InTechPublished online 24 February 2012Published in print edition February 2012
InTech EuropeUniversity Campus STeP Ri Slavka Krautzeka 83A 51000 Rijeka Croatia Phone +385 (51) 770 447 Fax +385 (51) 686 166wwwintechopencom
InTech ChinaUnit 405 Office Block Hotel Equatorial Shanghai No65 Yan An Road (West) Shanghai 200040 China
Phone +86-21-62489820 Fax +86-21-62489821
The infrared and Raman spectroscopy have applications in numerous fields namely chemistry physicsastronomy biology medicine geology mineralogy etc This book provides some examples of the use ofvibrational spectroscopy in supramolecular chemistry inorganic chemistry solid state physics but also in thefields of molecule-based materials or organic-inorganic interfaces
How to referenceIn order to correctly reference this scholarly work feel free to copy and paste the following
Paulo de Tarso Cavalcante Freire Joseacute Alves Lima Juacutenior Bruno Tavares de Oliveira Abagaro Gardecircnia deSousa Pinheiro Joseacute de Arimateacutea Freitas e Silva Josueacute Mendes Filho and Francisco Erivan de Abreu Melo(2012) High Pressure Raman Spectra of Amino Acid Crystals Vibrational Spectroscopy Prof Dominique DeCaro (Ed) ISBN 978-953-51-0107-9 InTech Available from httpwwwintechopencombooksvibrational-spectroscopyhigh-pressure-raman-spectra-of-amino-acid-crystals
copy 2012 The Author(s) Licensee IntechOpen This is an open access articledistributed under the terms of the Creative Commons Attribution 30License which permits unrestricted use distribution and reproduction inany medium provided the original work is properly cited

High Pressure Raman Spectra of Amino Acid Crystals
51
Figure 11(a) shows the Raman spectra of the HHM crystal in the spectral range 1700-1400 cm-1 for pressure from 00 to 75 GPa Fig 11(b) shows the respective wavenumber vs pressure plots In this region one expects to observe vibrations assigned to a deformations of the imidazole ring of the histidine molecule asymmetric stretching of the CO2- units stretching of C=O among others In the Figure 11(a) two modifications are observed in the range 27 ndash 31 GPa The first change is the decreasing of the relative intensity of the band originally at 1433 cm-1 and the second one is the appearance of a band at 1642 cm-1 In the wavenumber versus pressure plot presented in Figure 11(b) a subtle discontinuity occurs in the range 27 ndash 31 GPa with appreciably differences in slopes where two modes change from positive to negative slopes
Fig 10 (a) Raman spectra of HHM under several pressure conditions from 04 to 75 GPa in the spectral range 650 ndash 1250 cm-1 (b) wavenumber versus pressure of the bands of HHM appearing in Fig 10(a)
The Raman spectra of HHM crystal in the range 3450-3125 cm-1 are shown in the Figure 12(a) and in the Figure 12(b) the respective wavenumber versus pressure plots are given In this region we expected to observe stretching vibrations of several units of the amino acids and of the water molecule (CH NH3+ and OH-) It is important to note that for wavenumbers lower than 3000 cm-1 there are some modes related to the mineral oil used as compression media In detail the band at 3111 cm-1 can be associated to a stretching vibration of NH3+ unit (NH3+) while the bands observed at 3155 and 3163 cm-1 are associated to a CH stretching vibration of imidazole ring The bands observed at 3374 and 3408 cm-1 are related to the OH- stretching of the water molecules In the pressure range 27 ndash 31 GPa main changes are observed such as the disappearance of the bands related to a OH- stretching vibration (initially located at 3367 and 3393 cm-1) the appearance of a band of weak intensity at 3424 cm-1 and discontinuities of the wavenumber curve of bands at 3155 and 3163 cm-1 which are associated with the CH stretching vibration
wwwintechopencom
Vibrational Spectroscopy
52
Fig 11 (a) Raman spectra of HHM under several pressure conditions from 04 to 75 GPa in the spectral range 1400 ndash 1670 cm-1 (b) wavenumber versus pressure of the bands of HHM appearing in Fig 11(a)
Fig 12 (a) Raman spectra of HHM under several pressure conditions from 04 to 75 GPa in the spectral range 2950 ndash 3450 cm-1 (b) wavenumber versus pressure of the bands of HHM appearing in Fig 12(a)
wwwintechopencom
High Pressure Raman Spectra of Amino Acid Crystals
53
Table 2 gives a quantitative analysis of the evolution of the Raman spectra of HHM crystal with pressure where fitting of all bands to a linear expression ω = ω0 + P is furnished In Table 2 the first column (ωobs) represents the wavenumber of the Raman bands observed at room pressure the second and third columns correspond to adjustment of data for pressure values between 0 and 27 GPa and the two last columns correspond to fitting of the high-pressure phase that observed between 31 and 75 GPa A resume of the modifications observed in all spectral regions of the Raman spectra of HHM is as follows (i) splitting of the band in the low-wavenumber lattice range (ii) change in the number of bands associated to internal modes (iii) wavenumber shifts with discontinuities (iv) changes in the relative intensities of the vibrational bands It is important to state that changes were observed for the deformation vibrations of the OH- of the water molecule as well as of the NH3+ and CO2- groups of the amino acid molecule This picture indicates large conformational changes of the molecules in the unit cell Related to HHM beyond the hydrogen bonds originated from the histidine molecule there are two hydrogen bonds from the water molecule It is interesting to note from Figure 12(b) that the wavenumber of OH- stretching (OH-) decreases with increasing pressure However the OH units participate of hydrogen bonds one to a carboxyl oxygen and another to the chloride ion This means that between 00 and 31 GPa the hydrogen bond strength increases and the wavenumber of(OH-) decreases in this pressure range Also after the phase transition the wavenumber of (OH-) suffers a jump and continues to decrease up to the highest pressure obtained in our experiments Such a picture indicates a further increase of the hydrogen bonds formed by the water molecules and confirms that these bonds are playing an important role in the mechanism of the transition It is interesting to note that similar changes in the low-wavenumber region were also observed for the same crystal when subjected to low temperatures
ωobs
(cm-1)
Phase 1
(0 le P le 27 GPa) Phase 2
(31 le P le 75 GPa)
ω0
(cm-1)
(cm-1)(GPa)-1 ω0
(cm-1)
(cm-1)(GPa)-1
94 945 0669 937 -0103
105 1052 0276 1002 1771
121 1214 -1087 1109 2092
136 1357 1616 1360 0623
149 1497 2128 - -
159 1568 8033 1483 8105
- - - 1639 9960
188 1891 7661 1902 8059
270 2697 3093 - -
293 2919 6118 2945 7683
385 3846 7236 4015 1675
442 4423 1223 4423 1461
wwwintechopencom
Vibrational Spectroscopy
54
ωobs
(cm-1)
Phase 1
(0 le P le 27 GPa) Phase 2
(31 le P le 75 GPa)
ω0
(cm-1)
(cm-1)(GPa)-1 ω0
(cm-1)
(cm-1)(GPa)-1
- - - 4707 0785
491 490 5 3319 - -
530 5304 4335 - -
609 6078 5312 6208 2463
693 6935 1529 - -
- - - 7064 3449
807 8067 2042 8047 1467
824 8240 -0498 8204 1442
838 8361 7335 8504 3124
875 8734 6438 8881 2777
917 9173 0810 9187 2356
963 9630 2757 9636 2411
980 9787 4489 9787 5206
1068 10667 4790 10732 3418
1141 11403 1890 11403 2744
1162 11619 2611 11674 1120
1190 11900 2277 11885 1637
1208 12079 2859 12101 1341
1434 14345 1316 14382 0846
1448 14481 3059 14554 1677
1463 14621 4415 14760 0778
1481 14813 4238 14970 -0619
1609 16093 2739 16166 -0374
- - - 16249 2736
3111 31110 0919 31045 2914
3154 31546 1287 31532 6564
3164 31626 5305 31593 7905
3375 33739 -2638 - -
3407 34081 -5745 - -
- - - 34371 -3169
Table 2 Wavenumber values of the bands appearing in the HHM spectrum at 00 GPa (ωobs) and adjustment data by linear fitting (P) for the two phases
wwwintechopencom
High Pressure Raman Spectra of Amino Acid Crystals
55
5 Conclusions
The results suggested that L-proline monohydrate undergoes two phase transitions one between 00 and 11 GPa and a second between 65 and 78 GPa In both transitions it was possible to observed changes in the spectrum profile discontinuities in the wavenumber versus pressure plots in the lattice region of the spectrum and the appearance of news bands By releasing the pressure after attaining a maximum of 118 GPa the atmospheric pressure spectrum was fully recovered showing that the pressure-induced transitions undergone by polycrystalline L-proline crystal are reversible In the first transition it was observed the splitting of bands associated to (CCN) (CO2-) and (CH) vibrations The band associated to (skel) has disappeared In the second one we have observed the red shift of r(CO2-) significant changes in the intensity of the bands associated to the sc(CO2-) and w(CH2) vibrations and the splits of (CCN) + (CC) and r(NH2+) that also has lost intensity These modifications were interpreted as conformational changes of molecules in the unit cell Because these changes involve moieties that participate in hydrogen bonds we suppose that these hydrogen bonds have also been modified Modifications of hydrogen bonds can trigger some molecular rearrangements that lead to structural phase transitions In our work this hypothesis was supported by the changes that were observed in the region of the lattice modes for both phase transitions Therefore the results suggested two structural phase transitions one between 00 and 11 GPa and another between 65 and 78 GPa accompanied by significant conformational changes of molecules in the L-proline monohydrated crystal The results also suggest that HHM crystal undergoes a phase transition between 27 and 31 GPa when it is submitted to high pressure conditions up to 75 GPa The main changes observed in the Raman spectra was the splitting of the band in the low-wavenumber lattice range change in the number of bands associated to internal modes and wavenumber shifts with discontinuities Having described the behavior of two amino acid crystals under pressure and looked back at the past fourteen years of research we can ask to ourselves what does the future hold Based on the studies performed we believe that the use of several techniques such as neutron and Raman scattering as well as thermal and infrared analyses can help us to give a complete picture about hydrogen bond and the behavior of amino acids under pressure Maybe the study of peptide under similar external conditions should be the next road to be walked
6 Acknowledgment
Authors acknowledge CAPES CNPq and FUNCAP for financial support
7 References
Barthes M Bordallo HN Deacutenoyer F Lorenzo J-E Zaccaro J Robert A amp Zontone F (2004) Micro-transitions or breathers in L-alanine The European Physical Journal B Vol 37 No 3 (February 2004) pp 375-382 ISSN 1434-6028
Boldyreva EV Drebushchak VA Drebushchak TN Paukov IE Kovalevskaya YA amp Shutova ES (2003a) Polymorphism of glycine Part I Journal of Thermal Analysis and Calorimetry Vol 73 No 2 (August 2003) pp 409-418 ISSN 1388-6150
wwwintechopencom
Vibrational Spectroscopy
56
Boldyreva EV Drebushchak VA Drebushchak TN Paukov IE Kovalevskaya YA amp Shutova ES (2003b) Polymorphism of glycine Part II Journal of Thermal Analysis and Calorimetry Vol 73 No 2 (August 2003) pp 419-428 ISSN 1388-6150
Boldyreva EV Ivashevskaya SN Sowa H Ahsbahs H amp Weber H-P (2004) Effect of High Pressure on Crystalline Glycine A New High-Pressure Polymorph Doklady Physical Chemistry Vol 396 No 1 (May 2004) pp 111-114 ISSN 0012-5016
Boldyreva EV Ivashevskaya SN Sowa H Ahsbahs H amp Weber H-P (2005a) Effect of hydrostatic pressure on the -polymorph of glycine 1 A polymorphic transition into a new -form Zeitschrift fuumlr Kristallographie Vol 220 No 1 ( January 2005) pp 50- 57 ISSN 0044-2968
Boldyreva EV Kolesnik EN Drebushchak TN Ahsbahs H Beukes JA amp Weber H-P (2005b) A comparative study of the anisotropy of a lattice strain induced in the crystals of L-serine by cooling down to 100 K or by increasing pressure up to 44 GPa Zeitschrift fuumlr Kristallographie Vol 220 No 1 (January 2005) pp 58- 65 ISSN 0044-2968
Boldyreva EV Kolesnik EN Drebushchak TN Ahsbahs H amp Seryotkin YV (2006a) A comparative study of the anisotropy of a lattice strain induced in the crystals of DL-serine by cooling down to 100 K or by increasing pressure up to 86 GPa A comparison with L-serine Zeitschrift fuumlr Kristallographie Vol 221 No 2 (2006) pp 150- 161 ISSN 0044-2968
Boldyreva EV Sowa H Seryotkin YV Drebushchak TN Ahsbahs H Chernyshev V amp Dmitriev V (2006b) Pressure-induced phase transitions in crystalline L-serine studied by single crystal and gigh-resolution powder X-ray diffraction Chemical Physics Letters Vol 429 No 4-6 (October 2006) pp 474-478 ISSN 0009-2614
Boldyreva E (2007a) Cristalline Amino Acids A Link between Chemistry Materials Science and Biology In Models Mysteries and Magic of Molecules Boeyens JCA amp Ogilvie JF pp 167-192 Springer ISBN 978-1-4020-5940-7 Netherlands
Boldyreva E (2007b) High-Pressure Polymorphs of Molecular Solids When Are They Formed and When Are They Not Some Examples of the Role of Kinetic Control Crystal Growth amp Design Vol 7 No 9 (August 2007) pp 1662-1668 ISSN 1528-7483
Dawson A Allan DR Belmonte SA Clark SJ David WIF McGregor PA Parsons S Pulham CR amp Sawyer L (2005) Effect of high pressure on the crystal structures of polymorphs of glycine Crystal Growth amp Design Vol 5 No 4 (May 2005) pp 1415-1427 ISSN 1528-7483
Destro R Marsh RE amp Bianchi R (1988) A low-temperature (23K) study of L-alanine The Journal of Physical Chemistry Vol 92 No 4 (February 1988) pp 966-973 ISSN 0022-3654
De Sousa GP Freire PTC Lima Jr JA Mendes Filho J amp Melo FEA (2011) High-pressure Raman spectra of L-histidine hydrochloride monohydrate cristal Vibrational Spectroscopy Vol 57 No 1 (September 2011) pp 102-107 ISSN 0924-2031
Donohue J amp Caron A (1964) Refinement of cristal structure of histidine hydrochloride monohydrate Acta Crystallographica Vol 17 No 9 (September 1964) pp 1178-amp ISSN 0108-7673
wwwintechopencom
High Pressure Raman Spectra of Amino Acid Crystals
57
Faccedilanha Filho PF Freire PTC Lima KCV Mendes Filho J Melo FEA amp Pizani PS (2008) High temperature Raman spectra of L-leucine crystals Brazilian Journal of Physics Vol 38 No 1 (March 2008) pp 131-137 ISSN 0103-9733
Faccedilanha Filho PF Freire PTC Melo FEA Lemos V Mendes Filho J Pizani PS amp Rossatto DZ (2009) Pressure-induced phase transitions in L-leucine crystal Journal of Raman Spectroscopy Vol 40 No 1 (January 2009) pp 46-51 ISSN 1097-4555
Freire PTC (2010) Pressure-Induced Phase Transitions in Crystalline Amino Acids In High Pressure Crystallography ndash From Fundamental Phenomena to Technological Applications Boldyreva E amp Dera P pp 559-572 Springer ISBN 978-904-8192-60-1 New York USA
Funnel NP Dawson A Francis D Lennie DR Marshall WG Moggach SA Warren JE amp Parsons S (2010) The effect of pressure on the crystal structure of l-alanine CrystEngComm Vol 12 No 9 (September 2010) pp 2573-2583 ISSN 1466-8033
Goryainov SV Kolesnik EN amp Boldyreva EV (2005) A reversible pressure-induced phase transition in -glycine at 076 GPa Physica B Condensed Matter Vol 357 No 3-4 (March 2005) pp 340-347 ISSN 0921-4526
Goryainov SV Kolesnik EN amp Boldyreva EV (2006) Raman observation of a new (ζ) polymorph of glycine Chemical Physics Letters Vol 419 No 4-6 (February 2006) pp 496-500 ISSN 0009-2614
Harding MM amp Howieson RM (1976) L-Leucine Acta Crystallographica Section B Vol 32 No 2 (February 1976) pp 633-634 ISSN 1600-5740
Herlinger AW amp Long TV (1970) Laser Raman and infrared spectra of amino acids and their metal complexes 3 Proline and bisprolinato complexes Journal of the American Chemical Society Vol 92 No 22 (November 1970) pp 6481-6486 ISSN 0002-7863
Hermiacutenio da Silva J Lemos V Freire PTC Melo FEA Mendes Filho J Lima Jr JA amp Pizani PS (2009) Stability of the crystal structure of L-valine under high pressure Physica Status Solidi B Vol 246 No 3 (March 2009) pp 553-557 ISSN 0370-1972
Lima JA Freire PTC Melo FEA Lemos V Mendes Filho J amp Pizani PS (2008) High pressure Raman spectra of L-methionine Crystal Journal of Raman Spectroscopy Vol 39 No 10 (October 2008) pp 1356-1363 ISSN 1097-4555
Migliori A Maxton PM Clogston AM Zirngiebl E amp Lowe M (1988) Anomalous temperature dependence in the Raman spectra of l-alanine Evidence for dynamic localization Physical Review B Vol 38 No 18 (December 1988) pp 13464-13467 ISSN 1098-0121
Minkov VS Krylov AS Boldyreva EV Goryainov SN Bizyaev SN amp Vtyurin AN (2008) Pressure-Induced Phase Transitions in Crystalline L- and DL-Cysteine The Journal of Physical Chemistry B Vol 112 No 30 (July 2008) pp 8851-8854 ISSN 1520-6106
Minkov VS Goryainov SV Boldyreva EV amp Goumlrbitz CH (2010) Raman study of pressure-induced phase transitions in the crystals of orthorhombic and monoclinic polymorphs of L-cysteine dynamics of the side-chain Journal of Raman Spectroscopy Vol 41 No 12 (December 2010) pp 1458-1468 ISSN 1097-4555
Moggach SA Allan DR Morrison PA Parsons S amp Sawyer L (2005) Effect of pressure on the crystal structure of L-serine-I and the crystal structure of L-serine-II
wwwintechopencom
Vibrational Spectroscopy
58
at 54 GPa Acta Crystallographica Section B Vol 61 No 1 (February 2005) pp 58-68 ISSN 0108-7681
Moggach SA Marshall WG amp Parsons S (2006) High-pressure neutron diffraction study of L-serine-I and L-serine-II and the structure of L-serine-III at 81 GPa Acta Crystallographica Section B Vol 62 No 5 (October 2006) pp 815-825 ISSN 0108-7681
Moreno AJD Freire PTC Melo FEA Arauacutejo-Silva MA Guedes I Mendes Filho J (1997) Pressure-induced phase transitions in monohydrated l-asparagine aminoacid crystals Solid State Communications Vol 103 No 12 (September 1997) pp 655-658 ISSN 0038-1098
Murli C Sharma SK Karmakar S amp Sikka SK (2003) -Glycine under high pressures a Raman scattering study Physica B Condensed Matter Vol 339 No 1 (November 2003) pp 23-30 ISSN 0921-4526
Murli C Vasanthi R amp Sharma SM (2006) Raman spectroscopic investigations of DL-serine and DL-valine under pressure Chemical Physics Vol 331 No 1 (December 2006) pp 77-84 ISSN 0301-0104
Olsen JS Gerward L Freire PTC Mendes Filho J Melo FEA amp Souza Filho AG (2008) Pressure-induced phase transitions in L-alanine crystals Journal of Physics and Chemistry of Solids Vol 69 No 7 (July 2008) pp 1641-1645 ISSN 0022-3697
Sabino AS De Sousa GP Luz-Lima C Freire PTC Melo FEA amp Mendes Filho J (2009) High-pressure Raman spectra of L-isoleucine crystals Solid State Communications Vol 149 No 37-38 (October 2009) pp 1553-1556 ISSN 0038-1098
Sasaki JM Freire PTC Moreno AJD Melo FEA Guedes I Mendes Filho J Shu J Hu J amp Matildeo HK (2000) Single crystal X-ray diffraction in monohydrate L-asparagine under hydrostatic pressure Science and Technology of High Pressure Proceedings of AIRAPT-17 Hyderabad India 2000
Seijas LE Delgado GE Mora AJ Fitch AN amp Brunelli M (2010) On the Crystal structures and hydrogen bond patterns in proline pseudopolymorphs Powder Diffraction Vol 25 No 3 (September 2010) pp 235-240 ISSN 0885-7156
Silva BL Freire PTC Melo FEA Mendes Filho J Pimenta MA amp Dantas MSS (2000) High-pressure Raman spectra of L-threonine crystal Journal of Raman Spectroscopy Vol 31 No 6 (June 2000) pp 519-522 ISSN 1097-4555
Teixeira AMR Freire PTC Moreno AJD Sasaki JM Ayala AP Mendes Filho J amp Melo FEA (2000) High-pressure Raman study of l-alanine crystal Solid State Communications Vol 116 No 7 (October 2000) pp 405-409 ISSN 0038-1098
Tumanov NA Boldyreva EV Kolesov BA Kurnosov AV amp Quesada Cabrera R (2010) Pressure-induced phase transitions in L-alanine revisited Acta Crystallographica Section B Vol 66 No 4 (August 2010) pp 458-371 ISSN 1600-5740
Yamashita M Inomata S Ishikawa K Kashiwagi T Matsuo H Sawamura S amp Kato M (2007) A high-pressure polymorph of L--leucine Acta Crystallographica Section E Vol 63 No 5 (May 2007) pp o2762-o2764 ISSN 1600-5368
wwwintechopencom
Vibrational SpectroscopyEdited by Prof Dominique De Caro
ISBN 978-953-51-0107-9Hard cover 168 pagesPublisher InTechPublished online 24 February 2012Published in print edition February 2012
InTech EuropeUniversity Campus STeP Ri Slavka Krautzeka 83A 51000 Rijeka Croatia Phone +385 (51) 770 447 Fax +385 (51) 686 166wwwintechopencom
InTech ChinaUnit 405 Office Block Hotel Equatorial Shanghai No65 Yan An Road (West) Shanghai 200040 China
Phone +86-21-62489820 Fax +86-21-62489821
The infrared and Raman spectroscopy have applications in numerous fields namely chemistry physicsastronomy biology medicine geology mineralogy etc This book provides some examples of the use ofvibrational spectroscopy in supramolecular chemistry inorganic chemistry solid state physics but also in thefields of molecule-based materials or organic-inorganic interfaces
How to referenceIn order to correctly reference this scholarly work feel free to copy and paste the following
Paulo de Tarso Cavalcante Freire Joseacute Alves Lima Juacutenior Bruno Tavares de Oliveira Abagaro Gardecircnia deSousa Pinheiro Joseacute de Arimateacutea Freitas e Silva Josueacute Mendes Filho and Francisco Erivan de Abreu Melo(2012) High Pressure Raman Spectra of Amino Acid Crystals Vibrational Spectroscopy Prof Dominique DeCaro (Ed) ISBN 978-953-51-0107-9 InTech Available from httpwwwintechopencombooksvibrational-spectroscopyhigh-pressure-raman-spectra-of-amino-acid-crystals
copy 2012 The Author(s) Licensee IntechOpen This is an open access articledistributed under the terms of the Creative Commons Attribution 30License which permits unrestricted use distribution and reproduction inany medium provided the original work is properly cited

Vibrational Spectroscopy
52
Fig 11 (a) Raman spectra of HHM under several pressure conditions from 04 to 75 GPa in the spectral range 1400 ndash 1670 cm-1 (b) wavenumber versus pressure of the bands of HHM appearing in Fig 11(a)
Fig 12 (a) Raman spectra of HHM under several pressure conditions from 04 to 75 GPa in the spectral range 2950 ndash 3450 cm-1 (b) wavenumber versus pressure of the bands of HHM appearing in Fig 12(a)
wwwintechopencom
High Pressure Raman Spectra of Amino Acid Crystals
53
Table 2 gives a quantitative analysis of the evolution of the Raman spectra of HHM crystal with pressure where fitting of all bands to a linear expression ω = ω0 + P is furnished In Table 2 the first column (ωobs) represents the wavenumber of the Raman bands observed at room pressure the second and third columns correspond to adjustment of data for pressure values between 0 and 27 GPa and the two last columns correspond to fitting of the high-pressure phase that observed between 31 and 75 GPa A resume of the modifications observed in all spectral regions of the Raman spectra of HHM is as follows (i) splitting of the band in the low-wavenumber lattice range (ii) change in the number of bands associated to internal modes (iii) wavenumber shifts with discontinuities (iv) changes in the relative intensities of the vibrational bands It is important to state that changes were observed for the deformation vibrations of the OH- of the water molecule as well as of the NH3+ and CO2- groups of the amino acid molecule This picture indicates large conformational changes of the molecules in the unit cell Related to HHM beyond the hydrogen bonds originated from the histidine molecule there are two hydrogen bonds from the water molecule It is interesting to note from Figure 12(b) that the wavenumber of OH- stretching (OH-) decreases with increasing pressure However the OH units participate of hydrogen bonds one to a carboxyl oxygen and another to the chloride ion This means that between 00 and 31 GPa the hydrogen bond strength increases and the wavenumber of(OH-) decreases in this pressure range Also after the phase transition the wavenumber of (OH-) suffers a jump and continues to decrease up to the highest pressure obtained in our experiments Such a picture indicates a further increase of the hydrogen bonds formed by the water molecules and confirms that these bonds are playing an important role in the mechanism of the transition It is interesting to note that similar changes in the low-wavenumber region were also observed for the same crystal when subjected to low temperatures
ωobs
(cm-1)
Phase 1
(0 le P le 27 GPa) Phase 2
(31 le P le 75 GPa)
ω0
(cm-1)
(cm-1)(GPa)-1 ω0
(cm-1)
(cm-1)(GPa)-1
94 945 0669 937 -0103
105 1052 0276 1002 1771
121 1214 -1087 1109 2092
136 1357 1616 1360 0623
149 1497 2128 - -
159 1568 8033 1483 8105
- - - 1639 9960
188 1891 7661 1902 8059
270 2697 3093 - -
293 2919 6118 2945 7683
385 3846 7236 4015 1675
442 4423 1223 4423 1461
wwwintechopencom
Vibrational Spectroscopy
54
ωobs
(cm-1)
Phase 1
(0 le P le 27 GPa) Phase 2
(31 le P le 75 GPa)
ω0
(cm-1)
(cm-1)(GPa)-1 ω0
(cm-1)
(cm-1)(GPa)-1
- - - 4707 0785
491 490 5 3319 - -
530 5304 4335 - -
609 6078 5312 6208 2463
693 6935 1529 - -
- - - 7064 3449
807 8067 2042 8047 1467
824 8240 -0498 8204 1442
838 8361 7335 8504 3124
875 8734 6438 8881 2777
917 9173 0810 9187 2356
963 9630 2757 9636 2411
980 9787 4489 9787 5206
1068 10667 4790 10732 3418
1141 11403 1890 11403 2744
1162 11619 2611 11674 1120
1190 11900 2277 11885 1637
1208 12079 2859 12101 1341
1434 14345 1316 14382 0846
1448 14481 3059 14554 1677
1463 14621 4415 14760 0778
1481 14813 4238 14970 -0619
1609 16093 2739 16166 -0374
- - - 16249 2736
3111 31110 0919 31045 2914
3154 31546 1287 31532 6564
3164 31626 5305 31593 7905
3375 33739 -2638 - -
3407 34081 -5745 - -
- - - 34371 -3169
Table 2 Wavenumber values of the bands appearing in the HHM spectrum at 00 GPa (ωobs) and adjustment data by linear fitting (P) for the two phases
wwwintechopencom
High Pressure Raman Spectra of Amino Acid Crystals
55
5 Conclusions
The results suggested that L-proline monohydrate undergoes two phase transitions one between 00 and 11 GPa and a second between 65 and 78 GPa In both transitions it was possible to observed changes in the spectrum profile discontinuities in the wavenumber versus pressure plots in the lattice region of the spectrum and the appearance of news bands By releasing the pressure after attaining a maximum of 118 GPa the atmospheric pressure spectrum was fully recovered showing that the pressure-induced transitions undergone by polycrystalline L-proline crystal are reversible In the first transition it was observed the splitting of bands associated to (CCN) (CO2-) and (CH) vibrations The band associated to (skel) has disappeared In the second one we have observed the red shift of r(CO2-) significant changes in the intensity of the bands associated to the sc(CO2-) and w(CH2) vibrations and the splits of (CCN) + (CC) and r(NH2+) that also has lost intensity These modifications were interpreted as conformational changes of molecules in the unit cell Because these changes involve moieties that participate in hydrogen bonds we suppose that these hydrogen bonds have also been modified Modifications of hydrogen bonds can trigger some molecular rearrangements that lead to structural phase transitions In our work this hypothesis was supported by the changes that were observed in the region of the lattice modes for both phase transitions Therefore the results suggested two structural phase transitions one between 00 and 11 GPa and another between 65 and 78 GPa accompanied by significant conformational changes of molecules in the L-proline monohydrated crystal The results also suggest that HHM crystal undergoes a phase transition between 27 and 31 GPa when it is submitted to high pressure conditions up to 75 GPa The main changes observed in the Raman spectra was the splitting of the band in the low-wavenumber lattice range change in the number of bands associated to internal modes and wavenumber shifts with discontinuities Having described the behavior of two amino acid crystals under pressure and looked back at the past fourteen years of research we can ask to ourselves what does the future hold Based on the studies performed we believe that the use of several techniques such as neutron and Raman scattering as well as thermal and infrared analyses can help us to give a complete picture about hydrogen bond and the behavior of amino acids under pressure Maybe the study of peptide under similar external conditions should be the next road to be walked
6 Acknowledgment
Authors acknowledge CAPES CNPq and FUNCAP for financial support
7 References
Barthes M Bordallo HN Deacutenoyer F Lorenzo J-E Zaccaro J Robert A amp Zontone F (2004) Micro-transitions or breathers in L-alanine The European Physical Journal B Vol 37 No 3 (February 2004) pp 375-382 ISSN 1434-6028
Boldyreva EV Drebushchak VA Drebushchak TN Paukov IE Kovalevskaya YA amp Shutova ES (2003a) Polymorphism of glycine Part I Journal of Thermal Analysis and Calorimetry Vol 73 No 2 (August 2003) pp 409-418 ISSN 1388-6150
wwwintechopencom
Vibrational Spectroscopy
56
Boldyreva EV Drebushchak VA Drebushchak TN Paukov IE Kovalevskaya YA amp Shutova ES (2003b) Polymorphism of glycine Part II Journal of Thermal Analysis and Calorimetry Vol 73 No 2 (August 2003) pp 419-428 ISSN 1388-6150
Boldyreva EV Ivashevskaya SN Sowa H Ahsbahs H amp Weber H-P (2004) Effect of High Pressure on Crystalline Glycine A New High-Pressure Polymorph Doklady Physical Chemistry Vol 396 No 1 (May 2004) pp 111-114 ISSN 0012-5016
Boldyreva EV Ivashevskaya SN Sowa H Ahsbahs H amp Weber H-P (2005a) Effect of hydrostatic pressure on the -polymorph of glycine 1 A polymorphic transition into a new -form Zeitschrift fuumlr Kristallographie Vol 220 No 1 ( January 2005) pp 50- 57 ISSN 0044-2968
Boldyreva EV Kolesnik EN Drebushchak TN Ahsbahs H Beukes JA amp Weber H-P (2005b) A comparative study of the anisotropy of a lattice strain induced in the crystals of L-serine by cooling down to 100 K or by increasing pressure up to 44 GPa Zeitschrift fuumlr Kristallographie Vol 220 No 1 (January 2005) pp 58- 65 ISSN 0044-2968
Boldyreva EV Kolesnik EN Drebushchak TN Ahsbahs H amp Seryotkin YV (2006a) A comparative study of the anisotropy of a lattice strain induced in the crystals of DL-serine by cooling down to 100 K or by increasing pressure up to 86 GPa A comparison with L-serine Zeitschrift fuumlr Kristallographie Vol 221 No 2 (2006) pp 150- 161 ISSN 0044-2968
Boldyreva EV Sowa H Seryotkin YV Drebushchak TN Ahsbahs H Chernyshev V amp Dmitriev V (2006b) Pressure-induced phase transitions in crystalline L-serine studied by single crystal and gigh-resolution powder X-ray diffraction Chemical Physics Letters Vol 429 No 4-6 (October 2006) pp 474-478 ISSN 0009-2614
Boldyreva E (2007a) Cristalline Amino Acids A Link between Chemistry Materials Science and Biology In Models Mysteries and Magic of Molecules Boeyens JCA amp Ogilvie JF pp 167-192 Springer ISBN 978-1-4020-5940-7 Netherlands
Boldyreva E (2007b) High-Pressure Polymorphs of Molecular Solids When Are They Formed and When Are They Not Some Examples of the Role of Kinetic Control Crystal Growth amp Design Vol 7 No 9 (August 2007) pp 1662-1668 ISSN 1528-7483
Dawson A Allan DR Belmonte SA Clark SJ David WIF McGregor PA Parsons S Pulham CR amp Sawyer L (2005) Effect of high pressure on the crystal structures of polymorphs of glycine Crystal Growth amp Design Vol 5 No 4 (May 2005) pp 1415-1427 ISSN 1528-7483
Destro R Marsh RE amp Bianchi R (1988) A low-temperature (23K) study of L-alanine The Journal of Physical Chemistry Vol 92 No 4 (February 1988) pp 966-973 ISSN 0022-3654
De Sousa GP Freire PTC Lima Jr JA Mendes Filho J amp Melo FEA (2011) High-pressure Raman spectra of L-histidine hydrochloride monohydrate cristal Vibrational Spectroscopy Vol 57 No 1 (September 2011) pp 102-107 ISSN 0924-2031
Donohue J amp Caron A (1964) Refinement of cristal structure of histidine hydrochloride monohydrate Acta Crystallographica Vol 17 No 9 (September 1964) pp 1178-amp ISSN 0108-7673
wwwintechopencom
High Pressure Raman Spectra of Amino Acid Crystals
57
Faccedilanha Filho PF Freire PTC Lima KCV Mendes Filho J Melo FEA amp Pizani PS (2008) High temperature Raman spectra of L-leucine crystals Brazilian Journal of Physics Vol 38 No 1 (March 2008) pp 131-137 ISSN 0103-9733
Faccedilanha Filho PF Freire PTC Melo FEA Lemos V Mendes Filho J Pizani PS amp Rossatto DZ (2009) Pressure-induced phase transitions in L-leucine crystal Journal of Raman Spectroscopy Vol 40 No 1 (January 2009) pp 46-51 ISSN 1097-4555
Freire PTC (2010) Pressure-Induced Phase Transitions in Crystalline Amino Acids In High Pressure Crystallography ndash From Fundamental Phenomena to Technological Applications Boldyreva E amp Dera P pp 559-572 Springer ISBN 978-904-8192-60-1 New York USA
Funnel NP Dawson A Francis D Lennie DR Marshall WG Moggach SA Warren JE amp Parsons S (2010) The effect of pressure on the crystal structure of l-alanine CrystEngComm Vol 12 No 9 (September 2010) pp 2573-2583 ISSN 1466-8033
Goryainov SV Kolesnik EN amp Boldyreva EV (2005) A reversible pressure-induced phase transition in -glycine at 076 GPa Physica B Condensed Matter Vol 357 No 3-4 (March 2005) pp 340-347 ISSN 0921-4526
Goryainov SV Kolesnik EN amp Boldyreva EV (2006) Raman observation of a new (ζ) polymorph of glycine Chemical Physics Letters Vol 419 No 4-6 (February 2006) pp 496-500 ISSN 0009-2614
Harding MM amp Howieson RM (1976) L-Leucine Acta Crystallographica Section B Vol 32 No 2 (February 1976) pp 633-634 ISSN 1600-5740
Herlinger AW amp Long TV (1970) Laser Raman and infrared spectra of amino acids and their metal complexes 3 Proline and bisprolinato complexes Journal of the American Chemical Society Vol 92 No 22 (November 1970) pp 6481-6486 ISSN 0002-7863
Hermiacutenio da Silva J Lemos V Freire PTC Melo FEA Mendes Filho J Lima Jr JA amp Pizani PS (2009) Stability of the crystal structure of L-valine under high pressure Physica Status Solidi B Vol 246 No 3 (March 2009) pp 553-557 ISSN 0370-1972
Lima JA Freire PTC Melo FEA Lemos V Mendes Filho J amp Pizani PS (2008) High pressure Raman spectra of L-methionine Crystal Journal of Raman Spectroscopy Vol 39 No 10 (October 2008) pp 1356-1363 ISSN 1097-4555
Migliori A Maxton PM Clogston AM Zirngiebl E amp Lowe M (1988) Anomalous temperature dependence in the Raman spectra of l-alanine Evidence for dynamic localization Physical Review B Vol 38 No 18 (December 1988) pp 13464-13467 ISSN 1098-0121
Minkov VS Krylov AS Boldyreva EV Goryainov SN Bizyaev SN amp Vtyurin AN (2008) Pressure-Induced Phase Transitions in Crystalline L- and DL-Cysteine The Journal of Physical Chemistry B Vol 112 No 30 (July 2008) pp 8851-8854 ISSN 1520-6106
Minkov VS Goryainov SV Boldyreva EV amp Goumlrbitz CH (2010) Raman study of pressure-induced phase transitions in the crystals of orthorhombic and monoclinic polymorphs of L-cysteine dynamics of the side-chain Journal of Raman Spectroscopy Vol 41 No 12 (December 2010) pp 1458-1468 ISSN 1097-4555
Moggach SA Allan DR Morrison PA Parsons S amp Sawyer L (2005) Effect of pressure on the crystal structure of L-serine-I and the crystal structure of L-serine-II
wwwintechopencom
Vibrational Spectroscopy
58
at 54 GPa Acta Crystallographica Section B Vol 61 No 1 (February 2005) pp 58-68 ISSN 0108-7681
Moggach SA Marshall WG amp Parsons S (2006) High-pressure neutron diffraction study of L-serine-I and L-serine-II and the structure of L-serine-III at 81 GPa Acta Crystallographica Section B Vol 62 No 5 (October 2006) pp 815-825 ISSN 0108-7681
Moreno AJD Freire PTC Melo FEA Arauacutejo-Silva MA Guedes I Mendes Filho J (1997) Pressure-induced phase transitions in monohydrated l-asparagine aminoacid crystals Solid State Communications Vol 103 No 12 (September 1997) pp 655-658 ISSN 0038-1098
Murli C Sharma SK Karmakar S amp Sikka SK (2003) -Glycine under high pressures a Raman scattering study Physica B Condensed Matter Vol 339 No 1 (November 2003) pp 23-30 ISSN 0921-4526
Murli C Vasanthi R amp Sharma SM (2006) Raman spectroscopic investigations of DL-serine and DL-valine under pressure Chemical Physics Vol 331 No 1 (December 2006) pp 77-84 ISSN 0301-0104
Olsen JS Gerward L Freire PTC Mendes Filho J Melo FEA amp Souza Filho AG (2008) Pressure-induced phase transitions in L-alanine crystals Journal of Physics and Chemistry of Solids Vol 69 No 7 (July 2008) pp 1641-1645 ISSN 0022-3697
Sabino AS De Sousa GP Luz-Lima C Freire PTC Melo FEA amp Mendes Filho J (2009) High-pressure Raman spectra of L-isoleucine crystals Solid State Communications Vol 149 No 37-38 (October 2009) pp 1553-1556 ISSN 0038-1098
Sasaki JM Freire PTC Moreno AJD Melo FEA Guedes I Mendes Filho J Shu J Hu J amp Matildeo HK (2000) Single crystal X-ray diffraction in monohydrate L-asparagine under hydrostatic pressure Science and Technology of High Pressure Proceedings of AIRAPT-17 Hyderabad India 2000
Seijas LE Delgado GE Mora AJ Fitch AN amp Brunelli M (2010) On the Crystal structures and hydrogen bond patterns in proline pseudopolymorphs Powder Diffraction Vol 25 No 3 (September 2010) pp 235-240 ISSN 0885-7156
Silva BL Freire PTC Melo FEA Mendes Filho J Pimenta MA amp Dantas MSS (2000) High-pressure Raman spectra of L-threonine crystal Journal of Raman Spectroscopy Vol 31 No 6 (June 2000) pp 519-522 ISSN 1097-4555
Teixeira AMR Freire PTC Moreno AJD Sasaki JM Ayala AP Mendes Filho J amp Melo FEA (2000) High-pressure Raman study of l-alanine crystal Solid State Communications Vol 116 No 7 (October 2000) pp 405-409 ISSN 0038-1098
Tumanov NA Boldyreva EV Kolesov BA Kurnosov AV amp Quesada Cabrera R (2010) Pressure-induced phase transitions in L-alanine revisited Acta Crystallographica Section B Vol 66 No 4 (August 2010) pp 458-371 ISSN 1600-5740
Yamashita M Inomata S Ishikawa K Kashiwagi T Matsuo H Sawamura S amp Kato M (2007) A high-pressure polymorph of L--leucine Acta Crystallographica Section E Vol 63 No 5 (May 2007) pp o2762-o2764 ISSN 1600-5368
wwwintechopencom
Vibrational SpectroscopyEdited by Prof Dominique De Caro
ISBN 978-953-51-0107-9Hard cover 168 pagesPublisher InTechPublished online 24 February 2012Published in print edition February 2012
InTech EuropeUniversity Campus STeP Ri Slavka Krautzeka 83A 51000 Rijeka Croatia Phone +385 (51) 770 447 Fax +385 (51) 686 166wwwintechopencom
InTech ChinaUnit 405 Office Block Hotel Equatorial Shanghai No65 Yan An Road (West) Shanghai 200040 China
Phone +86-21-62489820 Fax +86-21-62489821
The infrared and Raman spectroscopy have applications in numerous fields namely chemistry physicsastronomy biology medicine geology mineralogy etc This book provides some examples of the use ofvibrational spectroscopy in supramolecular chemistry inorganic chemistry solid state physics but also in thefields of molecule-based materials or organic-inorganic interfaces
How to referenceIn order to correctly reference this scholarly work feel free to copy and paste the following
Paulo de Tarso Cavalcante Freire Joseacute Alves Lima Juacutenior Bruno Tavares de Oliveira Abagaro Gardecircnia deSousa Pinheiro Joseacute de Arimateacutea Freitas e Silva Josueacute Mendes Filho and Francisco Erivan de Abreu Melo(2012) High Pressure Raman Spectra of Amino Acid Crystals Vibrational Spectroscopy Prof Dominique DeCaro (Ed) ISBN 978-953-51-0107-9 InTech Available from httpwwwintechopencombooksvibrational-spectroscopyhigh-pressure-raman-spectra-of-amino-acid-crystals
copy 2012 The Author(s) Licensee IntechOpen This is an open access articledistributed under the terms of the Creative Commons Attribution 30License which permits unrestricted use distribution and reproduction inany medium provided the original work is properly cited

High Pressure Raman Spectra of Amino Acid Crystals
53
Table 2 gives a quantitative analysis of the evolution of the Raman spectra of HHM crystal with pressure where fitting of all bands to a linear expression ω = ω0 + P is furnished In Table 2 the first column (ωobs) represents the wavenumber of the Raman bands observed at room pressure the second and third columns correspond to adjustment of data for pressure values between 0 and 27 GPa and the two last columns correspond to fitting of the high-pressure phase that observed between 31 and 75 GPa A resume of the modifications observed in all spectral regions of the Raman spectra of HHM is as follows (i) splitting of the band in the low-wavenumber lattice range (ii) change in the number of bands associated to internal modes (iii) wavenumber shifts with discontinuities (iv) changes in the relative intensities of the vibrational bands It is important to state that changes were observed for the deformation vibrations of the OH- of the water molecule as well as of the NH3+ and CO2- groups of the amino acid molecule This picture indicates large conformational changes of the molecules in the unit cell Related to HHM beyond the hydrogen bonds originated from the histidine molecule there are two hydrogen bonds from the water molecule It is interesting to note from Figure 12(b) that the wavenumber of OH- stretching (OH-) decreases with increasing pressure However the OH units participate of hydrogen bonds one to a carboxyl oxygen and another to the chloride ion This means that between 00 and 31 GPa the hydrogen bond strength increases and the wavenumber of(OH-) decreases in this pressure range Also after the phase transition the wavenumber of (OH-) suffers a jump and continues to decrease up to the highest pressure obtained in our experiments Such a picture indicates a further increase of the hydrogen bonds formed by the water molecules and confirms that these bonds are playing an important role in the mechanism of the transition It is interesting to note that similar changes in the low-wavenumber region were also observed for the same crystal when subjected to low temperatures
ωobs
(cm-1)
Phase 1
(0 le P le 27 GPa) Phase 2
(31 le P le 75 GPa)
ω0
(cm-1)
(cm-1)(GPa)-1 ω0
(cm-1)
(cm-1)(GPa)-1
94 945 0669 937 -0103
105 1052 0276 1002 1771
121 1214 -1087 1109 2092
136 1357 1616 1360 0623
149 1497 2128 - -
159 1568 8033 1483 8105
- - - 1639 9960
188 1891 7661 1902 8059
270 2697 3093 - -
293 2919 6118 2945 7683
385 3846 7236 4015 1675
442 4423 1223 4423 1461
wwwintechopencom
Vibrational Spectroscopy
54
ωobs
(cm-1)
Phase 1
(0 le P le 27 GPa) Phase 2
(31 le P le 75 GPa)
ω0
(cm-1)
(cm-1)(GPa)-1 ω0
(cm-1)
(cm-1)(GPa)-1
- - - 4707 0785
491 490 5 3319 - -
530 5304 4335 - -
609 6078 5312 6208 2463
693 6935 1529 - -
- - - 7064 3449
807 8067 2042 8047 1467
824 8240 -0498 8204 1442
838 8361 7335 8504 3124
875 8734 6438 8881 2777
917 9173 0810 9187 2356
963 9630 2757 9636 2411
980 9787 4489 9787 5206
1068 10667 4790 10732 3418
1141 11403 1890 11403 2744
1162 11619 2611 11674 1120
1190 11900 2277 11885 1637
1208 12079 2859 12101 1341
1434 14345 1316 14382 0846
1448 14481 3059 14554 1677
1463 14621 4415 14760 0778
1481 14813 4238 14970 -0619
1609 16093 2739 16166 -0374
- - - 16249 2736
3111 31110 0919 31045 2914
3154 31546 1287 31532 6564
3164 31626 5305 31593 7905
3375 33739 -2638 - -
3407 34081 -5745 - -
- - - 34371 -3169
Table 2 Wavenumber values of the bands appearing in the HHM spectrum at 00 GPa (ωobs) and adjustment data by linear fitting (P) for the two phases
wwwintechopencom
High Pressure Raman Spectra of Amino Acid Crystals
55
5 Conclusions
The results suggested that L-proline monohydrate undergoes two phase transitions one between 00 and 11 GPa and a second between 65 and 78 GPa In both transitions it was possible to observed changes in the spectrum profile discontinuities in the wavenumber versus pressure plots in the lattice region of the spectrum and the appearance of news bands By releasing the pressure after attaining a maximum of 118 GPa the atmospheric pressure spectrum was fully recovered showing that the pressure-induced transitions undergone by polycrystalline L-proline crystal are reversible In the first transition it was observed the splitting of bands associated to (CCN) (CO2-) and (CH) vibrations The band associated to (skel) has disappeared In the second one we have observed the red shift of r(CO2-) significant changes in the intensity of the bands associated to the sc(CO2-) and w(CH2) vibrations and the splits of (CCN) + (CC) and r(NH2+) that also has lost intensity These modifications were interpreted as conformational changes of molecules in the unit cell Because these changes involve moieties that participate in hydrogen bonds we suppose that these hydrogen bonds have also been modified Modifications of hydrogen bonds can trigger some molecular rearrangements that lead to structural phase transitions In our work this hypothesis was supported by the changes that were observed in the region of the lattice modes for both phase transitions Therefore the results suggested two structural phase transitions one between 00 and 11 GPa and another between 65 and 78 GPa accompanied by significant conformational changes of molecules in the L-proline monohydrated crystal The results also suggest that HHM crystal undergoes a phase transition between 27 and 31 GPa when it is submitted to high pressure conditions up to 75 GPa The main changes observed in the Raman spectra was the splitting of the band in the low-wavenumber lattice range change in the number of bands associated to internal modes and wavenumber shifts with discontinuities Having described the behavior of two amino acid crystals under pressure and looked back at the past fourteen years of research we can ask to ourselves what does the future hold Based on the studies performed we believe that the use of several techniques such as neutron and Raman scattering as well as thermal and infrared analyses can help us to give a complete picture about hydrogen bond and the behavior of amino acids under pressure Maybe the study of peptide under similar external conditions should be the next road to be walked
6 Acknowledgment
Authors acknowledge CAPES CNPq and FUNCAP for financial support
7 References
Barthes M Bordallo HN Deacutenoyer F Lorenzo J-E Zaccaro J Robert A amp Zontone F (2004) Micro-transitions or breathers in L-alanine The European Physical Journal B Vol 37 No 3 (February 2004) pp 375-382 ISSN 1434-6028
Boldyreva EV Drebushchak VA Drebushchak TN Paukov IE Kovalevskaya YA amp Shutova ES (2003a) Polymorphism of glycine Part I Journal of Thermal Analysis and Calorimetry Vol 73 No 2 (August 2003) pp 409-418 ISSN 1388-6150
wwwintechopencom
Vibrational Spectroscopy
56
Boldyreva EV Drebushchak VA Drebushchak TN Paukov IE Kovalevskaya YA amp Shutova ES (2003b) Polymorphism of glycine Part II Journal of Thermal Analysis and Calorimetry Vol 73 No 2 (August 2003) pp 419-428 ISSN 1388-6150
Boldyreva EV Ivashevskaya SN Sowa H Ahsbahs H amp Weber H-P (2004) Effect of High Pressure on Crystalline Glycine A New High-Pressure Polymorph Doklady Physical Chemistry Vol 396 No 1 (May 2004) pp 111-114 ISSN 0012-5016
Boldyreva EV Ivashevskaya SN Sowa H Ahsbahs H amp Weber H-P (2005a) Effect of hydrostatic pressure on the -polymorph of glycine 1 A polymorphic transition into a new -form Zeitschrift fuumlr Kristallographie Vol 220 No 1 ( January 2005) pp 50- 57 ISSN 0044-2968
Boldyreva EV Kolesnik EN Drebushchak TN Ahsbahs H Beukes JA amp Weber H-P (2005b) A comparative study of the anisotropy of a lattice strain induced in the crystals of L-serine by cooling down to 100 K or by increasing pressure up to 44 GPa Zeitschrift fuumlr Kristallographie Vol 220 No 1 (January 2005) pp 58- 65 ISSN 0044-2968
Boldyreva EV Kolesnik EN Drebushchak TN Ahsbahs H amp Seryotkin YV (2006a) A comparative study of the anisotropy of a lattice strain induced in the crystals of DL-serine by cooling down to 100 K or by increasing pressure up to 86 GPa A comparison with L-serine Zeitschrift fuumlr Kristallographie Vol 221 No 2 (2006) pp 150- 161 ISSN 0044-2968
Boldyreva EV Sowa H Seryotkin YV Drebushchak TN Ahsbahs H Chernyshev V amp Dmitriev V (2006b) Pressure-induced phase transitions in crystalline L-serine studied by single crystal and gigh-resolution powder X-ray diffraction Chemical Physics Letters Vol 429 No 4-6 (October 2006) pp 474-478 ISSN 0009-2614
Boldyreva E (2007a) Cristalline Amino Acids A Link between Chemistry Materials Science and Biology In Models Mysteries and Magic of Molecules Boeyens JCA amp Ogilvie JF pp 167-192 Springer ISBN 978-1-4020-5940-7 Netherlands
Boldyreva E (2007b) High-Pressure Polymorphs of Molecular Solids When Are They Formed and When Are They Not Some Examples of the Role of Kinetic Control Crystal Growth amp Design Vol 7 No 9 (August 2007) pp 1662-1668 ISSN 1528-7483
Dawson A Allan DR Belmonte SA Clark SJ David WIF McGregor PA Parsons S Pulham CR amp Sawyer L (2005) Effect of high pressure on the crystal structures of polymorphs of glycine Crystal Growth amp Design Vol 5 No 4 (May 2005) pp 1415-1427 ISSN 1528-7483
Destro R Marsh RE amp Bianchi R (1988) A low-temperature (23K) study of L-alanine The Journal of Physical Chemistry Vol 92 No 4 (February 1988) pp 966-973 ISSN 0022-3654
De Sousa GP Freire PTC Lima Jr JA Mendes Filho J amp Melo FEA (2011) High-pressure Raman spectra of L-histidine hydrochloride monohydrate cristal Vibrational Spectroscopy Vol 57 No 1 (September 2011) pp 102-107 ISSN 0924-2031
Donohue J amp Caron A (1964) Refinement of cristal structure of histidine hydrochloride monohydrate Acta Crystallographica Vol 17 No 9 (September 1964) pp 1178-amp ISSN 0108-7673
wwwintechopencom
High Pressure Raman Spectra of Amino Acid Crystals
57
Faccedilanha Filho PF Freire PTC Lima KCV Mendes Filho J Melo FEA amp Pizani PS (2008) High temperature Raman spectra of L-leucine crystals Brazilian Journal of Physics Vol 38 No 1 (March 2008) pp 131-137 ISSN 0103-9733
Faccedilanha Filho PF Freire PTC Melo FEA Lemos V Mendes Filho J Pizani PS amp Rossatto DZ (2009) Pressure-induced phase transitions in L-leucine crystal Journal of Raman Spectroscopy Vol 40 No 1 (January 2009) pp 46-51 ISSN 1097-4555
Freire PTC (2010) Pressure-Induced Phase Transitions in Crystalline Amino Acids In High Pressure Crystallography ndash From Fundamental Phenomena to Technological Applications Boldyreva E amp Dera P pp 559-572 Springer ISBN 978-904-8192-60-1 New York USA
Funnel NP Dawson A Francis D Lennie DR Marshall WG Moggach SA Warren JE amp Parsons S (2010) The effect of pressure on the crystal structure of l-alanine CrystEngComm Vol 12 No 9 (September 2010) pp 2573-2583 ISSN 1466-8033
Goryainov SV Kolesnik EN amp Boldyreva EV (2005) A reversible pressure-induced phase transition in -glycine at 076 GPa Physica B Condensed Matter Vol 357 No 3-4 (March 2005) pp 340-347 ISSN 0921-4526
Goryainov SV Kolesnik EN amp Boldyreva EV (2006) Raman observation of a new (ζ) polymorph of glycine Chemical Physics Letters Vol 419 No 4-6 (February 2006) pp 496-500 ISSN 0009-2614
Harding MM amp Howieson RM (1976) L-Leucine Acta Crystallographica Section B Vol 32 No 2 (February 1976) pp 633-634 ISSN 1600-5740
Herlinger AW amp Long TV (1970) Laser Raman and infrared spectra of amino acids and their metal complexes 3 Proline and bisprolinato complexes Journal of the American Chemical Society Vol 92 No 22 (November 1970) pp 6481-6486 ISSN 0002-7863
Hermiacutenio da Silva J Lemos V Freire PTC Melo FEA Mendes Filho J Lima Jr JA amp Pizani PS (2009) Stability of the crystal structure of L-valine under high pressure Physica Status Solidi B Vol 246 No 3 (March 2009) pp 553-557 ISSN 0370-1972
Lima JA Freire PTC Melo FEA Lemos V Mendes Filho J amp Pizani PS (2008) High pressure Raman spectra of L-methionine Crystal Journal of Raman Spectroscopy Vol 39 No 10 (October 2008) pp 1356-1363 ISSN 1097-4555
Migliori A Maxton PM Clogston AM Zirngiebl E amp Lowe M (1988) Anomalous temperature dependence in the Raman spectra of l-alanine Evidence for dynamic localization Physical Review B Vol 38 No 18 (December 1988) pp 13464-13467 ISSN 1098-0121
Minkov VS Krylov AS Boldyreva EV Goryainov SN Bizyaev SN amp Vtyurin AN (2008) Pressure-Induced Phase Transitions in Crystalline L- and DL-Cysteine The Journal of Physical Chemistry B Vol 112 No 30 (July 2008) pp 8851-8854 ISSN 1520-6106
Minkov VS Goryainov SV Boldyreva EV amp Goumlrbitz CH (2010) Raman study of pressure-induced phase transitions in the crystals of orthorhombic and monoclinic polymorphs of L-cysteine dynamics of the side-chain Journal of Raman Spectroscopy Vol 41 No 12 (December 2010) pp 1458-1468 ISSN 1097-4555
Moggach SA Allan DR Morrison PA Parsons S amp Sawyer L (2005) Effect of pressure on the crystal structure of L-serine-I and the crystal structure of L-serine-II
wwwintechopencom
Vibrational Spectroscopy
58
at 54 GPa Acta Crystallographica Section B Vol 61 No 1 (February 2005) pp 58-68 ISSN 0108-7681
Moggach SA Marshall WG amp Parsons S (2006) High-pressure neutron diffraction study of L-serine-I and L-serine-II and the structure of L-serine-III at 81 GPa Acta Crystallographica Section B Vol 62 No 5 (October 2006) pp 815-825 ISSN 0108-7681
Moreno AJD Freire PTC Melo FEA Arauacutejo-Silva MA Guedes I Mendes Filho J (1997) Pressure-induced phase transitions in monohydrated l-asparagine aminoacid crystals Solid State Communications Vol 103 No 12 (September 1997) pp 655-658 ISSN 0038-1098
Murli C Sharma SK Karmakar S amp Sikka SK (2003) -Glycine under high pressures a Raman scattering study Physica B Condensed Matter Vol 339 No 1 (November 2003) pp 23-30 ISSN 0921-4526
Murli C Vasanthi R amp Sharma SM (2006) Raman spectroscopic investigations of DL-serine and DL-valine under pressure Chemical Physics Vol 331 No 1 (December 2006) pp 77-84 ISSN 0301-0104
Olsen JS Gerward L Freire PTC Mendes Filho J Melo FEA amp Souza Filho AG (2008) Pressure-induced phase transitions in L-alanine crystals Journal of Physics and Chemistry of Solids Vol 69 No 7 (July 2008) pp 1641-1645 ISSN 0022-3697
Sabino AS De Sousa GP Luz-Lima C Freire PTC Melo FEA amp Mendes Filho J (2009) High-pressure Raman spectra of L-isoleucine crystals Solid State Communications Vol 149 No 37-38 (October 2009) pp 1553-1556 ISSN 0038-1098
Sasaki JM Freire PTC Moreno AJD Melo FEA Guedes I Mendes Filho J Shu J Hu J amp Matildeo HK (2000) Single crystal X-ray diffraction in monohydrate L-asparagine under hydrostatic pressure Science and Technology of High Pressure Proceedings of AIRAPT-17 Hyderabad India 2000
Seijas LE Delgado GE Mora AJ Fitch AN amp Brunelli M (2010) On the Crystal structures and hydrogen bond patterns in proline pseudopolymorphs Powder Diffraction Vol 25 No 3 (September 2010) pp 235-240 ISSN 0885-7156
Silva BL Freire PTC Melo FEA Mendes Filho J Pimenta MA amp Dantas MSS (2000) High-pressure Raman spectra of L-threonine crystal Journal of Raman Spectroscopy Vol 31 No 6 (June 2000) pp 519-522 ISSN 1097-4555
Teixeira AMR Freire PTC Moreno AJD Sasaki JM Ayala AP Mendes Filho J amp Melo FEA (2000) High-pressure Raman study of l-alanine crystal Solid State Communications Vol 116 No 7 (October 2000) pp 405-409 ISSN 0038-1098
Tumanov NA Boldyreva EV Kolesov BA Kurnosov AV amp Quesada Cabrera R (2010) Pressure-induced phase transitions in L-alanine revisited Acta Crystallographica Section B Vol 66 No 4 (August 2010) pp 458-371 ISSN 1600-5740
Yamashita M Inomata S Ishikawa K Kashiwagi T Matsuo H Sawamura S amp Kato M (2007) A high-pressure polymorph of L--leucine Acta Crystallographica Section E Vol 63 No 5 (May 2007) pp o2762-o2764 ISSN 1600-5368
wwwintechopencom
Vibrational SpectroscopyEdited by Prof Dominique De Caro
ISBN 978-953-51-0107-9Hard cover 168 pagesPublisher InTechPublished online 24 February 2012Published in print edition February 2012
InTech EuropeUniversity Campus STeP Ri Slavka Krautzeka 83A 51000 Rijeka Croatia Phone +385 (51) 770 447 Fax +385 (51) 686 166wwwintechopencom
InTech ChinaUnit 405 Office Block Hotel Equatorial Shanghai No65 Yan An Road (West) Shanghai 200040 China
Phone +86-21-62489820 Fax +86-21-62489821
The infrared and Raman spectroscopy have applications in numerous fields namely chemistry physicsastronomy biology medicine geology mineralogy etc This book provides some examples of the use ofvibrational spectroscopy in supramolecular chemistry inorganic chemistry solid state physics but also in thefields of molecule-based materials or organic-inorganic interfaces
How to referenceIn order to correctly reference this scholarly work feel free to copy and paste the following
Paulo de Tarso Cavalcante Freire Joseacute Alves Lima Juacutenior Bruno Tavares de Oliveira Abagaro Gardecircnia deSousa Pinheiro Joseacute de Arimateacutea Freitas e Silva Josueacute Mendes Filho and Francisco Erivan de Abreu Melo(2012) High Pressure Raman Spectra of Amino Acid Crystals Vibrational Spectroscopy Prof Dominique DeCaro (Ed) ISBN 978-953-51-0107-9 InTech Available from httpwwwintechopencombooksvibrational-spectroscopyhigh-pressure-raman-spectra-of-amino-acid-crystals
copy 2012 The Author(s) Licensee IntechOpen This is an open access articledistributed under the terms of the Creative Commons Attribution 30License which permits unrestricted use distribution and reproduction inany medium provided the original work is properly cited
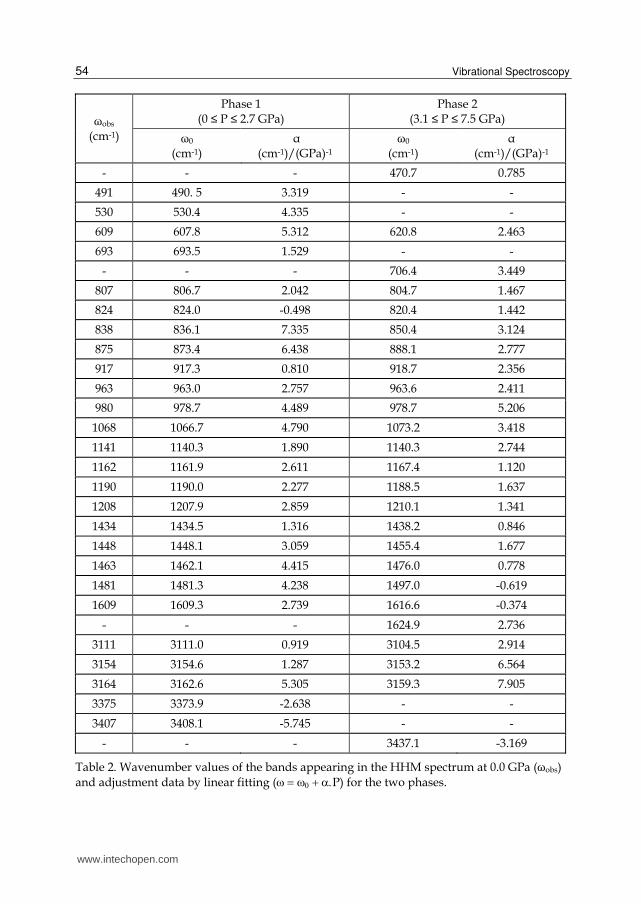
Vibrational Spectroscopy
54
ωobs
(cm-1)
Phase 1
(0 le P le 27 GPa) Phase 2
(31 le P le 75 GPa)
ω0
(cm-1)
(cm-1)(GPa)-1 ω0
(cm-1)
(cm-1)(GPa)-1
- - - 4707 0785
491 490 5 3319 - -
530 5304 4335 - -
609 6078 5312 6208 2463
693 6935 1529 - -
- - - 7064 3449
807 8067 2042 8047 1467
824 8240 -0498 8204 1442
838 8361 7335 8504 3124
875 8734 6438 8881 2777
917 9173 0810 9187 2356
963 9630 2757 9636 2411
980 9787 4489 9787 5206
1068 10667 4790 10732 3418
1141 11403 1890 11403 2744
1162 11619 2611 11674 1120
1190 11900 2277 11885 1637
1208 12079 2859 12101 1341
1434 14345 1316 14382 0846
1448 14481 3059 14554 1677
1463 14621 4415 14760 0778
1481 14813 4238 14970 -0619
1609 16093 2739 16166 -0374
- - - 16249 2736
3111 31110 0919 31045 2914
3154 31546 1287 31532 6564
3164 31626 5305 31593 7905
3375 33739 -2638 - -
3407 34081 -5745 - -
- - - 34371 -3169
Table 2 Wavenumber values of the bands appearing in the HHM spectrum at 00 GPa (ωobs) and adjustment data by linear fitting (P) for the two phases
wwwintechopencom
High Pressure Raman Spectra of Amino Acid Crystals
55
5 Conclusions
The results suggested that L-proline monohydrate undergoes two phase transitions one between 00 and 11 GPa and a second between 65 and 78 GPa In both transitions it was possible to observed changes in the spectrum profile discontinuities in the wavenumber versus pressure plots in the lattice region of the spectrum and the appearance of news bands By releasing the pressure after attaining a maximum of 118 GPa the atmospheric pressure spectrum was fully recovered showing that the pressure-induced transitions undergone by polycrystalline L-proline crystal are reversible In the first transition it was observed the splitting of bands associated to (CCN) (CO2-) and (CH) vibrations The band associated to (skel) has disappeared In the second one we have observed the red shift of r(CO2-) significant changes in the intensity of the bands associated to the sc(CO2-) and w(CH2) vibrations and the splits of (CCN) + (CC) and r(NH2+) that also has lost intensity These modifications were interpreted as conformational changes of molecules in the unit cell Because these changes involve moieties that participate in hydrogen bonds we suppose that these hydrogen bonds have also been modified Modifications of hydrogen bonds can trigger some molecular rearrangements that lead to structural phase transitions In our work this hypothesis was supported by the changes that were observed in the region of the lattice modes for both phase transitions Therefore the results suggested two structural phase transitions one between 00 and 11 GPa and another between 65 and 78 GPa accompanied by significant conformational changes of molecules in the L-proline monohydrated crystal The results also suggest that HHM crystal undergoes a phase transition between 27 and 31 GPa when it is submitted to high pressure conditions up to 75 GPa The main changes observed in the Raman spectra was the splitting of the band in the low-wavenumber lattice range change in the number of bands associated to internal modes and wavenumber shifts with discontinuities Having described the behavior of two amino acid crystals under pressure and looked back at the past fourteen years of research we can ask to ourselves what does the future hold Based on the studies performed we believe that the use of several techniques such as neutron and Raman scattering as well as thermal and infrared analyses can help us to give a complete picture about hydrogen bond and the behavior of amino acids under pressure Maybe the study of peptide under similar external conditions should be the next road to be walked
6 Acknowledgment
Authors acknowledge CAPES CNPq and FUNCAP for financial support
7 References
Barthes M Bordallo HN Deacutenoyer F Lorenzo J-E Zaccaro J Robert A amp Zontone F (2004) Micro-transitions or breathers in L-alanine The European Physical Journal B Vol 37 No 3 (February 2004) pp 375-382 ISSN 1434-6028
Boldyreva EV Drebushchak VA Drebushchak TN Paukov IE Kovalevskaya YA amp Shutova ES (2003a) Polymorphism of glycine Part I Journal of Thermal Analysis and Calorimetry Vol 73 No 2 (August 2003) pp 409-418 ISSN 1388-6150
wwwintechopencom
Vibrational Spectroscopy
56
Boldyreva EV Drebushchak VA Drebushchak TN Paukov IE Kovalevskaya YA amp Shutova ES (2003b) Polymorphism of glycine Part II Journal of Thermal Analysis and Calorimetry Vol 73 No 2 (August 2003) pp 419-428 ISSN 1388-6150
Boldyreva EV Ivashevskaya SN Sowa H Ahsbahs H amp Weber H-P (2004) Effect of High Pressure on Crystalline Glycine A New High-Pressure Polymorph Doklady Physical Chemistry Vol 396 No 1 (May 2004) pp 111-114 ISSN 0012-5016
Boldyreva EV Ivashevskaya SN Sowa H Ahsbahs H amp Weber H-P (2005a) Effect of hydrostatic pressure on the -polymorph of glycine 1 A polymorphic transition into a new -form Zeitschrift fuumlr Kristallographie Vol 220 No 1 ( January 2005) pp 50- 57 ISSN 0044-2968
Boldyreva EV Kolesnik EN Drebushchak TN Ahsbahs H Beukes JA amp Weber H-P (2005b) A comparative study of the anisotropy of a lattice strain induced in the crystals of L-serine by cooling down to 100 K or by increasing pressure up to 44 GPa Zeitschrift fuumlr Kristallographie Vol 220 No 1 (January 2005) pp 58- 65 ISSN 0044-2968
Boldyreva EV Kolesnik EN Drebushchak TN Ahsbahs H amp Seryotkin YV (2006a) A comparative study of the anisotropy of a lattice strain induced in the crystals of DL-serine by cooling down to 100 K or by increasing pressure up to 86 GPa A comparison with L-serine Zeitschrift fuumlr Kristallographie Vol 221 No 2 (2006) pp 150- 161 ISSN 0044-2968
Boldyreva EV Sowa H Seryotkin YV Drebushchak TN Ahsbahs H Chernyshev V amp Dmitriev V (2006b) Pressure-induced phase transitions in crystalline L-serine studied by single crystal and gigh-resolution powder X-ray diffraction Chemical Physics Letters Vol 429 No 4-6 (October 2006) pp 474-478 ISSN 0009-2614
Boldyreva E (2007a) Cristalline Amino Acids A Link between Chemistry Materials Science and Biology In Models Mysteries and Magic of Molecules Boeyens JCA amp Ogilvie JF pp 167-192 Springer ISBN 978-1-4020-5940-7 Netherlands
Boldyreva E (2007b) High-Pressure Polymorphs of Molecular Solids When Are They Formed and When Are They Not Some Examples of the Role of Kinetic Control Crystal Growth amp Design Vol 7 No 9 (August 2007) pp 1662-1668 ISSN 1528-7483
Dawson A Allan DR Belmonte SA Clark SJ David WIF McGregor PA Parsons S Pulham CR amp Sawyer L (2005) Effect of high pressure on the crystal structures of polymorphs of glycine Crystal Growth amp Design Vol 5 No 4 (May 2005) pp 1415-1427 ISSN 1528-7483
Destro R Marsh RE amp Bianchi R (1988) A low-temperature (23K) study of L-alanine The Journal of Physical Chemistry Vol 92 No 4 (February 1988) pp 966-973 ISSN 0022-3654
De Sousa GP Freire PTC Lima Jr JA Mendes Filho J amp Melo FEA (2011) High-pressure Raman spectra of L-histidine hydrochloride monohydrate cristal Vibrational Spectroscopy Vol 57 No 1 (September 2011) pp 102-107 ISSN 0924-2031
Donohue J amp Caron A (1964) Refinement of cristal structure of histidine hydrochloride monohydrate Acta Crystallographica Vol 17 No 9 (September 1964) pp 1178-amp ISSN 0108-7673
wwwintechopencom
High Pressure Raman Spectra of Amino Acid Crystals
57
Faccedilanha Filho PF Freire PTC Lima KCV Mendes Filho J Melo FEA amp Pizani PS (2008) High temperature Raman spectra of L-leucine crystals Brazilian Journal of Physics Vol 38 No 1 (March 2008) pp 131-137 ISSN 0103-9733
Faccedilanha Filho PF Freire PTC Melo FEA Lemos V Mendes Filho J Pizani PS amp Rossatto DZ (2009) Pressure-induced phase transitions in L-leucine crystal Journal of Raman Spectroscopy Vol 40 No 1 (January 2009) pp 46-51 ISSN 1097-4555
Freire PTC (2010) Pressure-Induced Phase Transitions in Crystalline Amino Acids In High Pressure Crystallography ndash From Fundamental Phenomena to Technological Applications Boldyreva E amp Dera P pp 559-572 Springer ISBN 978-904-8192-60-1 New York USA
Funnel NP Dawson A Francis D Lennie DR Marshall WG Moggach SA Warren JE amp Parsons S (2010) The effect of pressure on the crystal structure of l-alanine CrystEngComm Vol 12 No 9 (September 2010) pp 2573-2583 ISSN 1466-8033
Goryainov SV Kolesnik EN amp Boldyreva EV (2005) A reversible pressure-induced phase transition in -glycine at 076 GPa Physica B Condensed Matter Vol 357 No 3-4 (March 2005) pp 340-347 ISSN 0921-4526
Goryainov SV Kolesnik EN amp Boldyreva EV (2006) Raman observation of a new (ζ) polymorph of glycine Chemical Physics Letters Vol 419 No 4-6 (February 2006) pp 496-500 ISSN 0009-2614
Harding MM amp Howieson RM (1976) L-Leucine Acta Crystallographica Section B Vol 32 No 2 (February 1976) pp 633-634 ISSN 1600-5740
Herlinger AW amp Long TV (1970) Laser Raman and infrared spectra of amino acids and their metal complexes 3 Proline and bisprolinato complexes Journal of the American Chemical Society Vol 92 No 22 (November 1970) pp 6481-6486 ISSN 0002-7863
Hermiacutenio da Silva J Lemos V Freire PTC Melo FEA Mendes Filho J Lima Jr JA amp Pizani PS (2009) Stability of the crystal structure of L-valine under high pressure Physica Status Solidi B Vol 246 No 3 (March 2009) pp 553-557 ISSN 0370-1972
Lima JA Freire PTC Melo FEA Lemos V Mendes Filho J amp Pizani PS (2008) High pressure Raman spectra of L-methionine Crystal Journal of Raman Spectroscopy Vol 39 No 10 (October 2008) pp 1356-1363 ISSN 1097-4555
Migliori A Maxton PM Clogston AM Zirngiebl E amp Lowe M (1988) Anomalous temperature dependence in the Raman spectra of l-alanine Evidence for dynamic localization Physical Review B Vol 38 No 18 (December 1988) pp 13464-13467 ISSN 1098-0121
Minkov VS Krylov AS Boldyreva EV Goryainov SN Bizyaev SN amp Vtyurin AN (2008) Pressure-Induced Phase Transitions in Crystalline L- and DL-Cysteine The Journal of Physical Chemistry B Vol 112 No 30 (July 2008) pp 8851-8854 ISSN 1520-6106
Minkov VS Goryainov SV Boldyreva EV amp Goumlrbitz CH (2010) Raman study of pressure-induced phase transitions in the crystals of orthorhombic and monoclinic polymorphs of L-cysteine dynamics of the side-chain Journal of Raman Spectroscopy Vol 41 No 12 (December 2010) pp 1458-1468 ISSN 1097-4555
Moggach SA Allan DR Morrison PA Parsons S amp Sawyer L (2005) Effect of pressure on the crystal structure of L-serine-I and the crystal structure of L-serine-II
wwwintechopencom
Vibrational Spectroscopy
58
at 54 GPa Acta Crystallographica Section B Vol 61 No 1 (February 2005) pp 58-68 ISSN 0108-7681
Moggach SA Marshall WG amp Parsons S (2006) High-pressure neutron diffraction study of L-serine-I and L-serine-II and the structure of L-serine-III at 81 GPa Acta Crystallographica Section B Vol 62 No 5 (October 2006) pp 815-825 ISSN 0108-7681
Moreno AJD Freire PTC Melo FEA Arauacutejo-Silva MA Guedes I Mendes Filho J (1997) Pressure-induced phase transitions in monohydrated l-asparagine aminoacid crystals Solid State Communications Vol 103 No 12 (September 1997) pp 655-658 ISSN 0038-1098
Murli C Sharma SK Karmakar S amp Sikka SK (2003) -Glycine under high pressures a Raman scattering study Physica B Condensed Matter Vol 339 No 1 (November 2003) pp 23-30 ISSN 0921-4526
Murli C Vasanthi R amp Sharma SM (2006) Raman spectroscopic investigations of DL-serine and DL-valine under pressure Chemical Physics Vol 331 No 1 (December 2006) pp 77-84 ISSN 0301-0104
Olsen JS Gerward L Freire PTC Mendes Filho J Melo FEA amp Souza Filho AG (2008) Pressure-induced phase transitions in L-alanine crystals Journal of Physics and Chemistry of Solids Vol 69 No 7 (July 2008) pp 1641-1645 ISSN 0022-3697
Sabino AS De Sousa GP Luz-Lima C Freire PTC Melo FEA amp Mendes Filho J (2009) High-pressure Raman spectra of L-isoleucine crystals Solid State Communications Vol 149 No 37-38 (October 2009) pp 1553-1556 ISSN 0038-1098
Sasaki JM Freire PTC Moreno AJD Melo FEA Guedes I Mendes Filho J Shu J Hu J amp Matildeo HK (2000) Single crystal X-ray diffraction in monohydrate L-asparagine under hydrostatic pressure Science and Technology of High Pressure Proceedings of AIRAPT-17 Hyderabad India 2000
Seijas LE Delgado GE Mora AJ Fitch AN amp Brunelli M (2010) On the Crystal structures and hydrogen bond patterns in proline pseudopolymorphs Powder Diffraction Vol 25 No 3 (September 2010) pp 235-240 ISSN 0885-7156
Silva BL Freire PTC Melo FEA Mendes Filho J Pimenta MA amp Dantas MSS (2000) High-pressure Raman spectra of L-threonine crystal Journal of Raman Spectroscopy Vol 31 No 6 (June 2000) pp 519-522 ISSN 1097-4555
Teixeira AMR Freire PTC Moreno AJD Sasaki JM Ayala AP Mendes Filho J amp Melo FEA (2000) High-pressure Raman study of l-alanine crystal Solid State Communications Vol 116 No 7 (October 2000) pp 405-409 ISSN 0038-1098
Tumanov NA Boldyreva EV Kolesov BA Kurnosov AV amp Quesada Cabrera R (2010) Pressure-induced phase transitions in L-alanine revisited Acta Crystallographica Section B Vol 66 No 4 (August 2010) pp 458-371 ISSN 1600-5740
Yamashita M Inomata S Ishikawa K Kashiwagi T Matsuo H Sawamura S amp Kato M (2007) A high-pressure polymorph of L--leucine Acta Crystallographica Section E Vol 63 No 5 (May 2007) pp o2762-o2764 ISSN 1600-5368
wwwintechopencom
Vibrational SpectroscopyEdited by Prof Dominique De Caro
ISBN 978-953-51-0107-9Hard cover 168 pagesPublisher InTechPublished online 24 February 2012Published in print edition February 2012
InTech EuropeUniversity Campus STeP Ri Slavka Krautzeka 83A 51000 Rijeka Croatia Phone +385 (51) 770 447 Fax +385 (51) 686 166wwwintechopencom
InTech ChinaUnit 405 Office Block Hotel Equatorial Shanghai No65 Yan An Road (West) Shanghai 200040 China
Phone +86-21-62489820 Fax +86-21-62489821
The infrared and Raman spectroscopy have applications in numerous fields namely chemistry physicsastronomy biology medicine geology mineralogy etc This book provides some examples of the use ofvibrational spectroscopy in supramolecular chemistry inorganic chemistry solid state physics but also in thefields of molecule-based materials or organic-inorganic interfaces
How to referenceIn order to correctly reference this scholarly work feel free to copy and paste the following
Paulo de Tarso Cavalcante Freire Joseacute Alves Lima Juacutenior Bruno Tavares de Oliveira Abagaro Gardecircnia deSousa Pinheiro Joseacute de Arimateacutea Freitas e Silva Josueacute Mendes Filho and Francisco Erivan de Abreu Melo(2012) High Pressure Raman Spectra of Amino Acid Crystals Vibrational Spectroscopy Prof Dominique DeCaro (Ed) ISBN 978-953-51-0107-9 InTech Available from httpwwwintechopencombooksvibrational-spectroscopyhigh-pressure-raman-spectra-of-amino-acid-crystals
copy 2012 The Author(s) Licensee IntechOpen This is an open access articledistributed under the terms of the Creative Commons Attribution 30License which permits unrestricted use distribution and reproduction inany medium provided the original work is properly cited
High Pressure Raman Spectra of Amino Acid Crystals
55
5 Conclusions
The results suggested that L-proline monohydrate undergoes two phase transitions one between 00 and 11 GPa and a second between 65 and 78 GPa In both transitions it was possible to observed changes in the spectrum profile discontinuities in the wavenumber versus pressure plots in the lattice region of the spectrum and the appearance of news bands By releasing the pressure after attaining a maximum of 118 GPa the atmospheric pressure spectrum was fully recovered showing that the pressure-induced transitions undergone by polycrystalline L-proline crystal are reversible In the first transition it was observed the splitting of bands associated to (CCN) (CO2-) and (CH) vibrations The band associated to (skel) has disappeared In the second one we have observed the red shift of r(CO2-) significant changes in the intensity of the bands associated to the sc(CO2-) and w(CH2) vibrations and the splits of (CCN) + (CC) and r(NH2+) that also has lost intensity These modifications were interpreted as conformational changes of molecules in the unit cell Because these changes involve moieties that participate in hydrogen bonds we suppose that these hydrogen bonds have also been modified Modifications of hydrogen bonds can trigger some molecular rearrangements that lead to structural phase transitions In our work this hypothesis was supported by the changes that were observed in the region of the lattice modes for both phase transitions Therefore the results suggested two structural phase transitions one between 00 and 11 GPa and another between 65 and 78 GPa accompanied by significant conformational changes of molecules in the L-proline monohydrated crystal The results also suggest that HHM crystal undergoes a phase transition between 27 and 31 GPa when it is submitted to high pressure conditions up to 75 GPa The main changes observed in the Raman spectra was the splitting of the band in the low-wavenumber lattice range change in the number of bands associated to internal modes and wavenumber shifts with discontinuities Having described the behavior of two amino acid crystals under pressure and looked back at the past fourteen years of research we can ask to ourselves what does the future hold Based on the studies performed we believe that the use of several techniques such as neutron and Raman scattering as well as thermal and infrared analyses can help us to give a complete picture about hydrogen bond and the behavior of amino acids under pressure Maybe the study of peptide under similar external conditions should be the next road to be walked
6 Acknowledgment
Authors acknowledge CAPES CNPq and FUNCAP for financial support
7 References
Barthes M Bordallo HN Deacutenoyer F Lorenzo J-E Zaccaro J Robert A amp Zontone F (2004) Micro-transitions or breathers in L-alanine The European Physical Journal B Vol 37 No 3 (February 2004) pp 375-382 ISSN 1434-6028
Boldyreva EV Drebushchak VA Drebushchak TN Paukov IE Kovalevskaya YA amp Shutova ES (2003a) Polymorphism of glycine Part I Journal of Thermal Analysis and Calorimetry Vol 73 No 2 (August 2003) pp 409-418 ISSN 1388-6150
wwwintechopencom
Vibrational Spectroscopy
56
Boldyreva EV Drebushchak VA Drebushchak TN Paukov IE Kovalevskaya YA amp Shutova ES (2003b) Polymorphism of glycine Part II Journal of Thermal Analysis and Calorimetry Vol 73 No 2 (August 2003) pp 419-428 ISSN 1388-6150
Boldyreva EV Ivashevskaya SN Sowa H Ahsbahs H amp Weber H-P (2004) Effect of High Pressure on Crystalline Glycine A New High-Pressure Polymorph Doklady Physical Chemistry Vol 396 No 1 (May 2004) pp 111-114 ISSN 0012-5016
Boldyreva EV Ivashevskaya SN Sowa H Ahsbahs H amp Weber H-P (2005a) Effect of hydrostatic pressure on the -polymorph of glycine 1 A polymorphic transition into a new -form Zeitschrift fuumlr Kristallographie Vol 220 No 1 ( January 2005) pp 50- 57 ISSN 0044-2968
Boldyreva EV Kolesnik EN Drebushchak TN Ahsbahs H Beukes JA amp Weber H-P (2005b) A comparative study of the anisotropy of a lattice strain induced in the crystals of L-serine by cooling down to 100 K or by increasing pressure up to 44 GPa Zeitschrift fuumlr Kristallographie Vol 220 No 1 (January 2005) pp 58- 65 ISSN 0044-2968
Boldyreva EV Kolesnik EN Drebushchak TN Ahsbahs H amp Seryotkin YV (2006a) A comparative study of the anisotropy of a lattice strain induced in the crystals of DL-serine by cooling down to 100 K or by increasing pressure up to 86 GPa A comparison with L-serine Zeitschrift fuumlr Kristallographie Vol 221 No 2 (2006) pp 150- 161 ISSN 0044-2968
Boldyreva EV Sowa H Seryotkin YV Drebushchak TN Ahsbahs H Chernyshev V amp Dmitriev V (2006b) Pressure-induced phase transitions in crystalline L-serine studied by single crystal and gigh-resolution powder X-ray diffraction Chemical Physics Letters Vol 429 No 4-6 (October 2006) pp 474-478 ISSN 0009-2614
Boldyreva E (2007a) Cristalline Amino Acids A Link between Chemistry Materials Science and Biology In Models Mysteries and Magic of Molecules Boeyens JCA amp Ogilvie JF pp 167-192 Springer ISBN 978-1-4020-5940-7 Netherlands
Boldyreva E (2007b) High-Pressure Polymorphs of Molecular Solids When Are They Formed and When Are They Not Some Examples of the Role of Kinetic Control Crystal Growth amp Design Vol 7 No 9 (August 2007) pp 1662-1668 ISSN 1528-7483
Dawson A Allan DR Belmonte SA Clark SJ David WIF McGregor PA Parsons S Pulham CR amp Sawyer L (2005) Effect of high pressure on the crystal structures of polymorphs of glycine Crystal Growth amp Design Vol 5 No 4 (May 2005) pp 1415-1427 ISSN 1528-7483
Destro R Marsh RE amp Bianchi R (1988) A low-temperature (23K) study of L-alanine The Journal of Physical Chemistry Vol 92 No 4 (February 1988) pp 966-973 ISSN 0022-3654
De Sousa GP Freire PTC Lima Jr JA Mendes Filho J amp Melo FEA (2011) High-pressure Raman spectra of L-histidine hydrochloride monohydrate cristal Vibrational Spectroscopy Vol 57 No 1 (September 2011) pp 102-107 ISSN 0924-2031
Donohue J amp Caron A (1964) Refinement of cristal structure of histidine hydrochloride monohydrate Acta Crystallographica Vol 17 No 9 (September 1964) pp 1178-amp ISSN 0108-7673
wwwintechopencom
High Pressure Raman Spectra of Amino Acid Crystals
57
Faccedilanha Filho PF Freire PTC Lima KCV Mendes Filho J Melo FEA amp Pizani PS (2008) High temperature Raman spectra of L-leucine crystals Brazilian Journal of Physics Vol 38 No 1 (March 2008) pp 131-137 ISSN 0103-9733
Faccedilanha Filho PF Freire PTC Melo FEA Lemos V Mendes Filho J Pizani PS amp Rossatto DZ (2009) Pressure-induced phase transitions in L-leucine crystal Journal of Raman Spectroscopy Vol 40 No 1 (January 2009) pp 46-51 ISSN 1097-4555
Freire PTC (2010) Pressure-Induced Phase Transitions in Crystalline Amino Acids In High Pressure Crystallography ndash From Fundamental Phenomena to Technological Applications Boldyreva E amp Dera P pp 559-572 Springer ISBN 978-904-8192-60-1 New York USA
Funnel NP Dawson A Francis D Lennie DR Marshall WG Moggach SA Warren JE amp Parsons S (2010) The effect of pressure on the crystal structure of l-alanine CrystEngComm Vol 12 No 9 (September 2010) pp 2573-2583 ISSN 1466-8033
Goryainov SV Kolesnik EN amp Boldyreva EV (2005) A reversible pressure-induced phase transition in -glycine at 076 GPa Physica B Condensed Matter Vol 357 No 3-4 (March 2005) pp 340-347 ISSN 0921-4526
Goryainov SV Kolesnik EN amp Boldyreva EV (2006) Raman observation of a new (ζ) polymorph of glycine Chemical Physics Letters Vol 419 No 4-6 (February 2006) pp 496-500 ISSN 0009-2614
Harding MM amp Howieson RM (1976) L-Leucine Acta Crystallographica Section B Vol 32 No 2 (February 1976) pp 633-634 ISSN 1600-5740
Herlinger AW amp Long TV (1970) Laser Raman and infrared spectra of amino acids and their metal complexes 3 Proline and bisprolinato complexes Journal of the American Chemical Society Vol 92 No 22 (November 1970) pp 6481-6486 ISSN 0002-7863
Hermiacutenio da Silva J Lemos V Freire PTC Melo FEA Mendes Filho J Lima Jr JA amp Pizani PS (2009) Stability of the crystal structure of L-valine under high pressure Physica Status Solidi B Vol 246 No 3 (March 2009) pp 553-557 ISSN 0370-1972
Lima JA Freire PTC Melo FEA Lemos V Mendes Filho J amp Pizani PS (2008) High pressure Raman spectra of L-methionine Crystal Journal of Raman Spectroscopy Vol 39 No 10 (October 2008) pp 1356-1363 ISSN 1097-4555
Migliori A Maxton PM Clogston AM Zirngiebl E amp Lowe M (1988) Anomalous temperature dependence in the Raman spectra of l-alanine Evidence for dynamic localization Physical Review B Vol 38 No 18 (December 1988) pp 13464-13467 ISSN 1098-0121
Minkov VS Krylov AS Boldyreva EV Goryainov SN Bizyaev SN amp Vtyurin AN (2008) Pressure-Induced Phase Transitions in Crystalline L- and DL-Cysteine The Journal of Physical Chemistry B Vol 112 No 30 (July 2008) pp 8851-8854 ISSN 1520-6106
Minkov VS Goryainov SV Boldyreva EV amp Goumlrbitz CH (2010) Raman study of pressure-induced phase transitions in the crystals of orthorhombic and monoclinic polymorphs of L-cysteine dynamics of the side-chain Journal of Raman Spectroscopy Vol 41 No 12 (December 2010) pp 1458-1468 ISSN 1097-4555
Moggach SA Allan DR Morrison PA Parsons S amp Sawyer L (2005) Effect of pressure on the crystal structure of L-serine-I and the crystal structure of L-serine-II
wwwintechopencom
Vibrational Spectroscopy
58
at 54 GPa Acta Crystallographica Section B Vol 61 No 1 (February 2005) pp 58-68 ISSN 0108-7681
Moggach SA Marshall WG amp Parsons S (2006) High-pressure neutron diffraction study of L-serine-I and L-serine-II and the structure of L-serine-III at 81 GPa Acta Crystallographica Section B Vol 62 No 5 (October 2006) pp 815-825 ISSN 0108-7681
Moreno AJD Freire PTC Melo FEA Arauacutejo-Silva MA Guedes I Mendes Filho J (1997) Pressure-induced phase transitions in monohydrated l-asparagine aminoacid crystals Solid State Communications Vol 103 No 12 (September 1997) pp 655-658 ISSN 0038-1098
Murli C Sharma SK Karmakar S amp Sikka SK (2003) -Glycine under high pressures a Raman scattering study Physica B Condensed Matter Vol 339 No 1 (November 2003) pp 23-30 ISSN 0921-4526
Murli C Vasanthi R amp Sharma SM (2006) Raman spectroscopic investigations of DL-serine and DL-valine under pressure Chemical Physics Vol 331 No 1 (December 2006) pp 77-84 ISSN 0301-0104
Olsen JS Gerward L Freire PTC Mendes Filho J Melo FEA amp Souza Filho AG (2008) Pressure-induced phase transitions in L-alanine crystals Journal of Physics and Chemistry of Solids Vol 69 No 7 (July 2008) pp 1641-1645 ISSN 0022-3697
Sabino AS De Sousa GP Luz-Lima C Freire PTC Melo FEA amp Mendes Filho J (2009) High-pressure Raman spectra of L-isoleucine crystals Solid State Communications Vol 149 No 37-38 (October 2009) pp 1553-1556 ISSN 0038-1098
Sasaki JM Freire PTC Moreno AJD Melo FEA Guedes I Mendes Filho J Shu J Hu J amp Matildeo HK (2000) Single crystal X-ray diffraction in monohydrate L-asparagine under hydrostatic pressure Science and Technology of High Pressure Proceedings of AIRAPT-17 Hyderabad India 2000
Seijas LE Delgado GE Mora AJ Fitch AN amp Brunelli M (2010) On the Crystal structures and hydrogen bond patterns in proline pseudopolymorphs Powder Diffraction Vol 25 No 3 (September 2010) pp 235-240 ISSN 0885-7156
Silva BL Freire PTC Melo FEA Mendes Filho J Pimenta MA amp Dantas MSS (2000) High-pressure Raman spectra of L-threonine crystal Journal of Raman Spectroscopy Vol 31 No 6 (June 2000) pp 519-522 ISSN 1097-4555
Teixeira AMR Freire PTC Moreno AJD Sasaki JM Ayala AP Mendes Filho J amp Melo FEA (2000) High-pressure Raman study of l-alanine crystal Solid State Communications Vol 116 No 7 (October 2000) pp 405-409 ISSN 0038-1098
Tumanov NA Boldyreva EV Kolesov BA Kurnosov AV amp Quesada Cabrera R (2010) Pressure-induced phase transitions in L-alanine revisited Acta Crystallographica Section B Vol 66 No 4 (August 2010) pp 458-371 ISSN 1600-5740
Yamashita M Inomata S Ishikawa K Kashiwagi T Matsuo H Sawamura S amp Kato M (2007) A high-pressure polymorph of L--leucine Acta Crystallographica Section E Vol 63 No 5 (May 2007) pp o2762-o2764 ISSN 1600-5368
wwwintechopencom
Vibrational SpectroscopyEdited by Prof Dominique De Caro
ISBN 978-953-51-0107-9Hard cover 168 pagesPublisher InTechPublished online 24 February 2012Published in print edition February 2012
InTech EuropeUniversity Campus STeP Ri Slavka Krautzeka 83A 51000 Rijeka Croatia Phone +385 (51) 770 447 Fax +385 (51) 686 166wwwintechopencom
InTech ChinaUnit 405 Office Block Hotel Equatorial Shanghai No65 Yan An Road (West) Shanghai 200040 China
Phone +86-21-62489820 Fax +86-21-62489821
The infrared and Raman spectroscopy have applications in numerous fields namely chemistry physicsastronomy biology medicine geology mineralogy etc This book provides some examples of the use ofvibrational spectroscopy in supramolecular chemistry inorganic chemistry solid state physics but also in thefields of molecule-based materials or organic-inorganic interfaces
How to referenceIn order to correctly reference this scholarly work feel free to copy and paste the following
Paulo de Tarso Cavalcante Freire Joseacute Alves Lima Juacutenior Bruno Tavares de Oliveira Abagaro Gardecircnia deSousa Pinheiro Joseacute de Arimateacutea Freitas e Silva Josueacute Mendes Filho and Francisco Erivan de Abreu Melo(2012) High Pressure Raman Spectra of Amino Acid Crystals Vibrational Spectroscopy Prof Dominique DeCaro (Ed) ISBN 978-953-51-0107-9 InTech Available from httpwwwintechopencombooksvibrational-spectroscopyhigh-pressure-raman-spectra-of-amino-acid-crystals
copy 2012 The Author(s) Licensee IntechOpen This is an open access articledistributed under the terms of the Creative Commons Attribution 30License which permits unrestricted use distribution and reproduction inany medium provided the original work is properly cited
Vibrational Spectroscopy
56
Boldyreva EV Drebushchak VA Drebushchak TN Paukov IE Kovalevskaya YA amp Shutova ES (2003b) Polymorphism of glycine Part II Journal of Thermal Analysis and Calorimetry Vol 73 No 2 (August 2003) pp 419-428 ISSN 1388-6150
Boldyreva EV Ivashevskaya SN Sowa H Ahsbahs H amp Weber H-P (2004) Effect of High Pressure on Crystalline Glycine A New High-Pressure Polymorph Doklady Physical Chemistry Vol 396 No 1 (May 2004) pp 111-114 ISSN 0012-5016
Boldyreva EV Ivashevskaya SN Sowa H Ahsbahs H amp Weber H-P (2005a) Effect of hydrostatic pressure on the -polymorph of glycine 1 A polymorphic transition into a new -form Zeitschrift fuumlr Kristallographie Vol 220 No 1 ( January 2005) pp 50- 57 ISSN 0044-2968
Boldyreva EV Kolesnik EN Drebushchak TN Ahsbahs H Beukes JA amp Weber H-P (2005b) A comparative study of the anisotropy of a lattice strain induced in the crystals of L-serine by cooling down to 100 K or by increasing pressure up to 44 GPa Zeitschrift fuumlr Kristallographie Vol 220 No 1 (January 2005) pp 58- 65 ISSN 0044-2968
Boldyreva EV Kolesnik EN Drebushchak TN Ahsbahs H amp Seryotkin YV (2006a) A comparative study of the anisotropy of a lattice strain induced in the crystals of DL-serine by cooling down to 100 K or by increasing pressure up to 86 GPa A comparison with L-serine Zeitschrift fuumlr Kristallographie Vol 221 No 2 (2006) pp 150- 161 ISSN 0044-2968
Boldyreva EV Sowa H Seryotkin YV Drebushchak TN Ahsbahs H Chernyshev V amp Dmitriev V (2006b) Pressure-induced phase transitions in crystalline L-serine studied by single crystal and gigh-resolution powder X-ray diffraction Chemical Physics Letters Vol 429 No 4-6 (October 2006) pp 474-478 ISSN 0009-2614
Boldyreva E (2007a) Cristalline Amino Acids A Link between Chemistry Materials Science and Biology In Models Mysteries and Magic of Molecules Boeyens JCA amp Ogilvie JF pp 167-192 Springer ISBN 978-1-4020-5940-7 Netherlands
Boldyreva E (2007b) High-Pressure Polymorphs of Molecular Solids When Are They Formed and When Are They Not Some Examples of the Role of Kinetic Control Crystal Growth amp Design Vol 7 No 9 (August 2007) pp 1662-1668 ISSN 1528-7483
Dawson A Allan DR Belmonte SA Clark SJ David WIF McGregor PA Parsons S Pulham CR amp Sawyer L (2005) Effect of high pressure on the crystal structures of polymorphs of glycine Crystal Growth amp Design Vol 5 No 4 (May 2005) pp 1415-1427 ISSN 1528-7483
Destro R Marsh RE amp Bianchi R (1988) A low-temperature (23K) study of L-alanine The Journal of Physical Chemistry Vol 92 No 4 (February 1988) pp 966-973 ISSN 0022-3654
De Sousa GP Freire PTC Lima Jr JA Mendes Filho J amp Melo FEA (2011) High-pressure Raman spectra of L-histidine hydrochloride monohydrate cristal Vibrational Spectroscopy Vol 57 No 1 (September 2011) pp 102-107 ISSN 0924-2031
Donohue J amp Caron A (1964) Refinement of cristal structure of histidine hydrochloride monohydrate Acta Crystallographica Vol 17 No 9 (September 1964) pp 1178-amp ISSN 0108-7673
wwwintechopencom
High Pressure Raman Spectra of Amino Acid Crystals
57
Faccedilanha Filho PF Freire PTC Lima KCV Mendes Filho J Melo FEA amp Pizani PS (2008) High temperature Raman spectra of L-leucine crystals Brazilian Journal of Physics Vol 38 No 1 (March 2008) pp 131-137 ISSN 0103-9733
Faccedilanha Filho PF Freire PTC Melo FEA Lemos V Mendes Filho J Pizani PS amp Rossatto DZ (2009) Pressure-induced phase transitions in L-leucine crystal Journal of Raman Spectroscopy Vol 40 No 1 (January 2009) pp 46-51 ISSN 1097-4555
Freire PTC (2010) Pressure-Induced Phase Transitions in Crystalline Amino Acids In High Pressure Crystallography ndash From Fundamental Phenomena to Technological Applications Boldyreva E amp Dera P pp 559-572 Springer ISBN 978-904-8192-60-1 New York USA
Funnel NP Dawson A Francis D Lennie DR Marshall WG Moggach SA Warren JE amp Parsons S (2010) The effect of pressure on the crystal structure of l-alanine CrystEngComm Vol 12 No 9 (September 2010) pp 2573-2583 ISSN 1466-8033
Goryainov SV Kolesnik EN amp Boldyreva EV (2005) A reversible pressure-induced phase transition in -glycine at 076 GPa Physica B Condensed Matter Vol 357 No 3-4 (March 2005) pp 340-347 ISSN 0921-4526
Goryainov SV Kolesnik EN amp Boldyreva EV (2006) Raman observation of a new (ζ) polymorph of glycine Chemical Physics Letters Vol 419 No 4-6 (February 2006) pp 496-500 ISSN 0009-2614
Harding MM amp Howieson RM (1976) L-Leucine Acta Crystallographica Section B Vol 32 No 2 (February 1976) pp 633-634 ISSN 1600-5740
Herlinger AW amp Long TV (1970) Laser Raman and infrared spectra of amino acids and their metal complexes 3 Proline and bisprolinato complexes Journal of the American Chemical Society Vol 92 No 22 (November 1970) pp 6481-6486 ISSN 0002-7863
Hermiacutenio da Silva J Lemos V Freire PTC Melo FEA Mendes Filho J Lima Jr JA amp Pizani PS (2009) Stability of the crystal structure of L-valine under high pressure Physica Status Solidi B Vol 246 No 3 (March 2009) pp 553-557 ISSN 0370-1972
Lima JA Freire PTC Melo FEA Lemos V Mendes Filho J amp Pizani PS (2008) High pressure Raman spectra of L-methionine Crystal Journal of Raman Spectroscopy Vol 39 No 10 (October 2008) pp 1356-1363 ISSN 1097-4555
Migliori A Maxton PM Clogston AM Zirngiebl E amp Lowe M (1988) Anomalous temperature dependence in the Raman spectra of l-alanine Evidence for dynamic localization Physical Review B Vol 38 No 18 (December 1988) pp 13464-13467 ISSN 1098-0121
Minkov VS Krylov AS Boldyreva EV Goryainov SN Bizyaev SN amp Vtyurin AN (2008) Pressure-Induced Phase Transitions in Crystalline L- and DL-Cysteine The Journal of Physical Chemistry B Vol 112 No 30 (July 2008) pp 8851-8854 ISSN 1520-6106
Minkov VS Goryainov SV Boldyreva EV amp Goumlrbitz CH (2010) Raman study of pressure-induced phase transitions in the crystals of orthorhombic and monoclinic polymorphs of L-cysteine dynamics of the side-chain Journal of Raman Spectroscopy Vol 41 No 12 (December 2010) pp 1458-1468 ISSN 1097-4555
Moggach SA Allan DR Morrison PA Parsons S amp Sawyer L (2005) Effect of pressure on the crystal structure of L-serine-I and the crystal structure of L-serine-II
wwwintechopencom
Vibrational Spectroscopy
58
at 54 GPa Acta Crystallographica Section B Vol 61 No 1 (February 2005) pp 58-68 ISSN 0108-7681
Moggach SA Marshall WG amp Parsons S (2006) High-pressure neutron diffraction study of L-serine-I and L-serine-II and the structure of L-serine-III at 81 GPa Acta Crystallographica Section B Vol 62 No 5 (October 2006) pp 815-825 ISSN 0108-7681
Moreno AJD Freire PTC Melo FEA Arauacutejo-Silva MA Guedes I Mendes Filho J (1997) Pressure-induced phase transitions in monohydrated l-asparagine aminoacid crystals Solid State Communications Vol 103 No 12 (September 1997) pp 655-658 ISSN 0038-1098
Murli C Sharma SK Karmakar S amp Sikka SK (2003) -Glycine under high pressures a Raman scattering study Physica B Condensed Matter Vol 339 No 1 (November 2003) pp 23-30 ISSN 0921-4526
Murli C Vasanthi R amp Sharma SM (2006) Raman spectroscopic investigations of DL-serine and DL-valine under pressure Chemical Physics Vol 331 No 1 (December 2006) pp 77-84 ISSN 0301-0104
Olsen JS Gerward L Freire PTC Mendes Filho J Melo FEA amp Souza Filho AG (2008) Pressure-induced phase transitions in L-alanine crystals Journal of Physics and Chemistry of Solids Vol 69 No 7 (July 2008) pp 1641-1645 ISSN 0022-3697
Sabino AS De Sousa GP Luz-Lima C Freire PTC Melo FEA amp Mendes Filho J (2009) High-pressure Raman spectra of L-isoleucine crystals Solid State Communications Vol 149 No 37-38 (October 2009) pp 1553-1556 ISSN 0038-1098
Sasaki JM Freire PTC Moreno AJD Melo FEA Guedes I Mendes Filho J Shu J Hu J amp Matildeo HK (2000) Single crystal X-ray diffraction in monohydrate L-asparagine under hydrostatic pressure Science and Technology of High Pressure Proceedings of AIRAPT-17 Hyderabad India 2000
Seijas LE Delgado GE Mora AJ Fitch AN amp Brunelli M (2010) On the Crystal structures and hydrogen bond patterns in proline pseudopolymorphs Powder Diffraction Vol 25 No 3 (September 2010) pp 235-240 ISSN 0885-7156
Silva BL Freire PTC Melo FEA Mendes Filho J Pimenta MA amp Dantas MSS (2000) High-pressure Raman spectra of L-threonine crystal Journal of Raman Spectroscopy Vol 31 No 6 (June 2000) pp 519-522 ISSN 1097-4555
Teixeira AMR Freire PTC Moreno AJD Sasaki JM Ayala AP Mendes Filho J amp Melo FEA (2000) High-pressure Raman study of l-alanine crystal Solid State Communications Vol 116 No 7 (October 2000) pp 405-409 ISSN 0038-1098
Tumanov NA Boldyreva EV Kolesov BA Kurnosov AV amp Quesada Cabrera R (2010) Pressure-induced phase transitions in L-alanine revisited Acta Crystallographica Section B Vol 66 No 4 (August 2010) pp 458-371 ISSN 1600-5740
Yamashita M Inomata S Ishikawa K Kashiwagi T Matsuo H Sawamura S amp Kato M (2007) A high-pressure polymorph of L--leucine Acta Crystallographica Section E Vol 63 No 5 (May 2007) pp o2762-o2764 ISSN 1600-5368
wwwintechopencom
Vibrational SpectroscopyEdited by Prof Dominique De Caro
ISBN 978-953-51-0107-9Hard cover 168 pagesPublisher InTechPublished online 24 February 2012Published in print edition February 2012
InTech EuropeUniversity Campus STeP Ri Slavka Krautzeka 83A 51000 Rijeka Croatia Phone +385 (51) 770 447 Fax +385 (51) 686 166wwwintechopencom
InTech ChinaUnit 405 Office Block Hotel Equatorial Shanghai No65 Yan An Road (West) Shanghai 200040 China
Phone +86-21-62489820 Fax +86-21-62489821
The infrared and Raman spectroscopy have applications in numerous fields namely chemistry physicsastronomy biology medicine geology mineralogy etc This book provides some examples of the use ofvibrational spectroscopy in supramolecular chemistry inorganic chemistry solid state physics but also in thefields of molecule-based materials or organic-inorganic interfaces
How to referenceIn order to correctly reference this scholarly work feel free to copy and paste the following
Paulo de Tarso Cavalcante Freire Joseacute Alves Lima Juacutenior Bruno Tavares de Oliveira Abagaro Gardecircnia deSousa Pinheiro Joseacute de Arimateacutea Freitas e Silva Josueacute Mendes Filho and Francisco Erivan de Abreu Melo(2012) High Pressure Raman Spectra of Amino Acid Crystals Vibrational Spectroscopy Prof Dominique DeCaro (Ed) ISBN 978-953-51-0107-9 InTech Available from httpwwwintechopencombooksvibrational-spectroscopyhigh-pressure-raman-spectra-of-amino-acid-crystals
copy 2012 The Author(s) Licensee IntechOpen This is an open access articledistributed under the terms of the Creative Commons Attribution 30License which permits unrestricted use distribution and reproduction inany medium provided the original work is properly cited

copy 2012 The Author(s) Licensee IntechOpen This is an open access articledistributed under the terms of the Creative Commons Attribution 30License which permits unrestricted use distribution and reproduction inany medium provided the original work is properly cited