high-q microsphere biosensor - analysis for adsorption … · gorodetsky, a. savechnkov, and v. s....
TRANSCRIPT

High-Q microsphere biosensor - analysis for adsorption of rodlike bacteria
Hai-Cang Ren1, Frank Vollmer2,*, Stephen Arnold3 and Albert Libchaber4
1. Physics Department, The Rockefeller University, New York, NY 10021, USA 2. The Rowland Institute, Harvard University, Cambridge, MA 02142, USA
3. MicroParticle PhotoPhysics Lab, Polytechnic University, Brooklyn, NY 11201, USA 4. Physics Department, The Rockefeller University, New York, NY 10021, USA
*Corresponding author: [email protected]
Abstract: Theory is developed for frequency shift and linewidth-broadening induced by rodlike bacteria bound to micro-optical resonators. Optical shift of whispering gallery modes (WGMs) is modeled by introducing a form factor that accounts for random horizontal orientation of cylindrical bacteria bound by their high refractive index cell walls. Linewidth-broadening is estimated from scattering losses. Analytic results are confirmed by measurement using E.Coli as model system (~102 bacteria/mm2 sensitivity), establishing the WGM biosensor as sensitive technique for detection and analysis of micro-organisms.
©2007 Optical Society of America
OCIS codes: (170.1530) Cell analysis; (170.1420) Biology; (230.5750) Resonators; (240.0310) Thin films.
References and links
1. M. L. Gorodetsky, A. Savechnkov, and V. S. Ilchenko, “Ultimate Q of optical microsphere resonators,” Opt. Lett. 21, 453-455 (1996).
2. A.M. Armani, K.J. Vahala, “Heavy water detection using ultra-high-Q microcavities,” Opt. Lett. 31, 1896-1898 (2006).
3. N. M. Hanumegowda, C .J. Stica, B. C. Patel, I. M. White, and X. Fan, “Refractometric sensors based on microsphere resonators,” Appl. Phys. Lett. 87, 201107-201107-3 (2005).
4. F. Vollmer, D. Braun, A. Libchaber, M. Khoshsima, I. Teraoka, and S. Arnold, “Protein Detection by Optical Shift of a Resonant Microcavity,” Appl. Phys. Lett. 80, 4057-4059 (2002).
5. S. Arnold, M. Khoshsima, I. Teraoka, S. Holler, and F. Vollmer, “Shift of Whispering-Gallery-Modes in Microspheres by Protein Adsorption,” Opt. Lett. 28, 272-274 (2003).
6. I. Teraoka, S. Arnold, and F. Vollmer, “Perturbation Approach to Shift of Whispering-Gallery-Modes in Microspheres by Protein Adsorption,” J. Opt. Soc. Am. B 20, 1937-1946 (2003).
7. I. Teraoka, S. Arnold, “Theory of resonance shifts in TE and TM whispering gallery modes by nonradial perturbations for sensing applications,” J. Opt. Soc. Am. B 23, 1381-1389 (2006).
8. M. Noto, F. Vollmer, I. Teraoka, and S. Arnold, “Nanolayer characterization through wavelength multiplexing of a microsphere resonator,” Opt. Lett. 30, 510-512 (2005).
9. F. Vollmer, S. Arnold, D. Braun, I. Teraoka, and A. Libchaber, “Multiplexed DNA Quantification by Spectroscopic Shift of Two Microsphere Cavities,” Biophys. J. 85, 1974-1979 (2003).
10. J. Topolancik, F. Vollmer, “Photoinduced Transformations in Bacteriorhodopsin Membrane Monitored with Optical Microcavities,” Biophys. J. 92, 2223-2229 (2007).
11. C.-Y. Chao, W. Fung, L.J. Guo, “Polymer Microring Resonators for Biochemical Sensing Applications,” IEEE J. Selected Topics Quantum Electron. 12, 134-142 (2006).
12. A.M. Armani, R.P. Kulkarni, S.E. Fraser, R.C. Flagan, K.J. Vahala, “Label-Free, Single-Molecule Detection with Optical Microcavities,” Science 10, 783-787 (2007).
13. W. Knoll, “Interfaces and thin films as seen by bound electromagnetic waves,” Annu. Rev. Phys. Chem. 49, 569-638 (1998).
14. R. Karlsson, R. Stahlberg, “Surface-plasmon resonance detection and multispot sensing for direct monitoring of interactions involving low-molecular weight analytes for determination of low affinities,” Anal. Biochem. 228, 274-280 (1995).
15. J. W. Costerton, Z. Lewandowski, D. E. Caldwell, D. R. Korber, and H. M. Lappin-Scott, “Microbial Biofilms,” Annu. Rev. Microbiol. 49, 711-45 (1995).
16. P. S. Mead, P. M. Griffin, “Escherichia coli O157:H7,” Lancet 352, 1207-1212 (1998).
#85737 - $15.00 USD Received 27 Jul 2007; revised 29 Aug 2007; accepted 19 Sep 2007; published 10 Dec 2007
(C) 2007 OSA 10 December 2007 / Vol. 15, No. 25 / OPTICS EXPRESS 17410

17. J. W. Costerton, P. S. Stewart, E. P. Greenberg, “Bacterial Biofilms: A Common Cause of Persistent Infections,” Science 284, 1318-1322 (1999).
18. K. H. Seo, J. F. Frank, “Attachement of E.Coli O157:H7 to lettuce leaf surface and bacterial viability in response to chlorine treatment as demonstrated by using confocal scanning laser microscopy,” J. Food Protect. 62, 3-9 (1999).
19. C. Lam, P. T. Leung and K. Young, “Explicit asymptotic formulas for the position, width and strength of resonances in Mie scattering,” J. Opt. Soc. Am. B 9, 1585-1590 (1992).
20. J. D. Jackson, Classical electrodynamics (John Wiley & Son Inc, 1975), Chap. 9 and Chap. 16. 21. N. Nanninga, Molecular Cytology of Escherichia coli (Academic Press, 1985), Chap. 1ff. 22. D. S. Goodsell, “Inside a Living Cell,” Trends. Biochem. Sci. 16, 203-206 (1991). 23. M. Ardhammer, P. Lincoln, B. Norden, “In visible liposomes: Refractive index matching with sucrose
enables flow dichroism assessment of peptide orientation in lipid vesicle membrane,” Proc. Natl. Acad. Sci. USA 99, 15313-15317 (2002).
24. P. J. Wyatt, “Cell Wall Thickness, Size Distribution, Refractive Index Ratio and Dry Weight Content of Living Bacteria,” Nature 226, 277-279 (1970).
25. H. C. Berg, in E.Coli in Motion (Springer, 2003) Chap. 1ff. 26. F. Vollmer, “Taking Detection to the Limit,” B.I.F. Futura 20, 239-244 (2005).
http://www.bifonds.de/public/inhaltf4.htm 27. A. M. Armani, D. K. Armani, B. Min, K. J. Vahala, S. M. Spillane, “Ultra-high-Q microcavity operation in
H20 and D20,” Appl. Phys. Lett. 87, 151118-151118-3 (2005). 28. G. N. Watson, A Treatise on the Theory of Bessel functions (Cambridge University Press, 1966), Chapter
VIII.
1. Introduction
Photon recirculation in optical microcavities significantly enhances interaction of the propagating field with the resonator material as well as interaction of the evanescent field with the surrounding medium. The evanescent field provides possibility to exploit giant photon lifetimes in spherical and toroidal microcavities (quality factor up to Q~109, [1]) for ultra-sensitive detection of liquid samples [2,3] and biomolecules [4-12]. The detection method, based on measuring shift of resonance frequency, is particularly adept at recognition of biomolecules directly adsorbed on the cavity surface. Label-free biomolecular detection [4,9,12] has been demonstrated with sensitivity that rivals state-of-the-art surface plasmon resonance (SPR) [13,14]. Experiments are complemented by analytic theory [4-7] which relates changes in resonance frequency to evanescently induced polarization of nanometer-sized molecules. Detection of biomolecules from optical shift of resonant microcavities [4-6] promises single molecule sensitivity which has recently been achieved in microtoroidal resonators [12] where heat generated from adsorbed molecules exposed to a large circulating power provides added sensitivity. Here, we examine microcavities operated in the low-power regime where the established theory [4-7] is applicable for analysis of a wide range of biomolecules, polymers and viral particles that are small compared to the probing (visible or near-infrared) wavelength. Microcavity sensors, however, may also provide a useful tool to study biologically important surface coatings and aggregates which are formed from larger particles such as micrometer-sized bacteria [15-18]. The established theory [5-7] is then no longer valid since a form-factor is necessary to account for well-defined size, shape and orientation of inhomogeneous, micron-sized bacterial particles, and one can no longer disregard scattering in the analysis.
Here we develop theory that analyzes perturbations to optical microcavity sensors induced by random horizontal adsorption of bacteria with rodlike shape, a shape ubiquitous for various important bacterial and viral species [15-18]. Analytic theory is derived using Born-and Rayleigh-Gans approximations, and we introduce a form factor to model cylindrical bacteria shape with high refractive index cell wall (n~1.42) and low refractive index protoplasm (n~1.35). Theoretical results are confirmed in measurements taken with E.coli bacteria as model system. Adsorption of the micrometer-sized bacteria induces not only a large shift of resonance frequency, but also a significant increase in linewidth due to scattering; both effects are measured in good agreement with predictions. We also estimate the effective cell-wall
#85737 - $15.00 USD Received 27 Jul 2007; revised 29 Aug 2007; accepted 19 Sep 2007; published 10 Dec 2007
(C) 2007 OSA 10 December 2007 / Vol. 15, No. 25 / OPTICS EXPRESS 17411
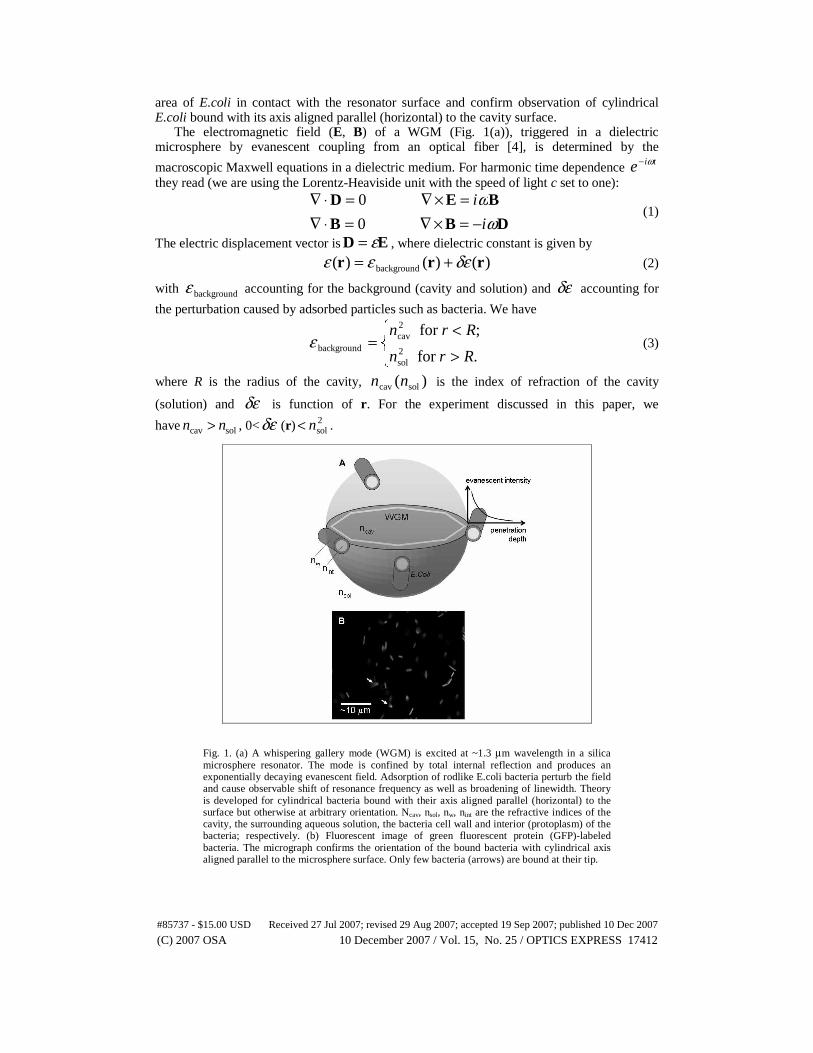
area of E.coli in contact with the resonator surface and confirm observation of cylindrical E.coli bound with its axis aligned parallel (horizontal) to the cavity surface.
The electromagnetic field (E, B) of a WGM (Fig. 1(a)), triggered in a dielectric microsphere by evanescent coupling from an optical fiber [4], is determined by the
macroscopic Maxwell equations in a dielectric medium. For harmonic time dependence tie ω− they read (we are using the Lorentz-Heaviside unit with the speed of light c set to one):
DBB
BED
ωωi
i
−=×∇=⋅∇=×∇=⋅∇
0
0 (1)
The electric displacement vector is ED ε= , where dielectric constant is given by
)()()( background rrr δεεε += (2)
with backgroundε accounting for the background (cavity and solution) and δε accounting for
the perturbation caused by adsorbed particles such as bacteria. We have
⎪⎩
⎪⎨⎧
>
<=
.for
;for 2sol
2cav
backgroundRrn
Rrnε (3)
where R is the radius of the cavity, )( solcav nn is the index of refraction of the cavity
(solution) and δε is function of r. For the experiment discussed in this paper, we
have solcav nn > , 0<δε (r) 2soln< .
Fig. 1. (a) A whispering gallery mode (WGM) is excited at ~1.3 μm wavelength in a silica microsphere resonator. The mode is confined by total internal reflection and produces an exponentially decaying evanescent field. Adsorption of rodlike E.coli bacteria perturb the field and cause observable shift of resonance frequency as well as broadening of linewidth. Theory is developed for cylindrical bacteria bound with their axis aligned parallel (horizontal) to the surface but otherwise at arbitrary orientation. Ncav, nsol, nw, nint are the refractive indices of the cavity, the surrounding aqueous solution, the bacteria cell wall and interior (protoplasm) of the bacteria; respectively. (b) Fluorescent image of green fluorescent protein (GFP)-labeled bacteria. The micrograph confirms the orientation of the bound bacteria with cylindrical axis aligned parallel to the microsphere surface. Only few bacteria (arrows) are bound at their tip.
#85737 - $15.00 USD Received 27 Jul 2007; revised 29 Aug 2007; accepted 19 Sep 2007; published 10 Dec 2007
(C) 2007 OSA 10 December 2007 / Vol. 15, No. 25 / OPTICS EXPRESS 17412

The WGM corresponds to the propagation of a light along the inner wall of the cavity
because of the totally internal reflection under the resonance condition Rl πλ 22
1cav ≈⎟
⎠
⎞⎜⎝
⎛ +
with cavλ the wavelength inside the cavity and l a large integer. The intensity of a WGM is
highly concentrated in the vicinity of the wall of the cavity, and its polarization can be either transverse electric (TE) or transverse magnetic (TM) [19]. The WGM couples to the adsorbed particles via its evanescent field. Because the energy density of an electromagnetic wave is
proportional to ε E 2 , the excess dielectric constant of the adsorbed particles ‘pulls’ the energy distribution of a WGM slightly outward. This in turn increases the optical length of the WGM and induces a red shift of its wavelength. The spectral width is also broadened by the radiation of the adsorbed particles driven by evanescent field. The wavelength shift will be calculated in the following section, and the line width will be estimated in the section 3. In this section, we shall also describe the experiment and compare the result with theory. The section 5 concludes the paper.
2. The wavelength shift
The shift of the WGM wavelength is calculated by means of the Born approximation to the solution of the Maxwell equations Eq. (1) [20] and we shall outline the major steps for a TE mode below. The treatment of a TM mode together with some technical details will be deferred to the Appendices A and B. To the leading order approximation, the dielectric excess δε of Eq. (2) is replaced with its
average over the ensemble distribution of the adsorbed particles, 2soln<<δε , which occupies
a thin shell outside the cavity. For a typical bacteria cell of an index of refraction wn for the
cell wall and an index of refraction intn for the protoplasm we have
( )[ ],AA ′Δ−′Δ+Δ= εεεσδε (4)
where 2sol
2w nn −=Δε , 2
sol2int nn −=′Δε , )(AA ′ is the average cross sectional area of the
outer(inner) surface of the wall cut by a sphere of radius r, and σ is the average surface density of the cells. Upon replacing δε of Eq. (3) by εδ , the dielectric function becomes spherically symmetric with respect to the center of the resonance cavity and the standard multipole analysis applies. The electromagnetic field of a TE mode of the order (l,m) is given by:
( ) ( )rXrE ˆ)( lmllm rg ω=
( ) ( )rErB lmlm
i ×∇−=ω
, (5)
where the vector spherical harmonics
)ˆ()1(
)ˆ( rrrX lmlm Yll
i ∇×+
−=
with )ˆ(rlmY the ordinary spherical harmonics. Substituting into the Maxwell equation Eq.
(1), we find that the function lg satisfies the ordinary differential equation
0)1(1 2
22
2=−++⎟
⎠
⎞⎜⎝
⎛− lll gg
r
ll
dr
dgr
dr
d
rεω (6)
#85737 - $15.00 USD Received 27 Jul 2007; revised 29 Aug 2007; accepted 19 Sep 2007; published 10 Dec 2007
(C) 2007 OSA 10 December 2007 / Vol. 15, No. 25 / OPTICS EXPRESS 17413

with δεεε += background . It follows from the joining condition of the electromagnetic field
across a dielectric discontinuity that both lg and its derivative are continuous functions of r.
In the absence of adsorbed particles, the Eq. (6) becomes
0)1(1 )0(2
background)0(
2
)0(2
2=−++⎟⎟
⎠
⎞⎜⎜⎝
⎛− ll
l ggr
ll
dr
dgr
dr
d
rωε (7)
The solution to the Eq. (7) can be expressed in terms of spherical Bessel functions, i.e.
( )
( ) ( )[ ]⎪⎩
⎪⎨⎧
≥+
<=
Rrrnnrnje
RrrnAjg
lllli
l
ll for sincos
for
)0(sol
)0(sol
cav)0()0(
δωδω
ωδ
(8)
For ∞→r , we have
⎟⎠
⎞⎜⎝
⎛ +−≅ )0(sol.
sol.
)0(
2
1sin
1ll lrn
rng δπω
ω. (9)
The quantity )0(lδ is the phase shift of the TE mode scattered by the cavity and is determined
by the continuity of )0(lg and its derivative across the wall of the cavity. We have
)(
)(*2 )0(
ωωδ
l
li
D
De l −= (10)
where
( )( ) ( )( ) ( )
)1(
)1(
zzhj
zhjD
ll
ll
l ′′=ςς
ςω . (11)
with Rn ως cav= , Rnz ωsol= and )()()()1( zinzjzh lll += . A WGM corresponds to
)( 3
1
cav ννω ORn += , (12)
with 12
1 >>+= lν . The explicit form of the )( 3
1
νO term can be found in [19]. In the
immediate vicinity outside the wall, the spherical Bessel functions take the approximate form (see Appendix A for the derivation)
)(
cav
2sol
2cav)()( Rrnn
ll ezjrnj −−≅ ωω (13)
and
)(
cav
2sol
2cav)()( Rrnn
ll eznrnn −−−≅ ωω (14)
for RRr <<−<0 . The )( 3
1
νO term on RHS of Eq. (12) is chosen to satisfy the
resonance condition, i.e. 2
)0( πδ =l . Then the solution immediately outside the wall consists
of only exponential decay behavior, corresponding to a trapped field configuration by the totally internal reflection. It was shown that the width of the resonance is extremely narrow. In the presence of adsorbed particles, the large r behavior of the solution to Eq. (6) remains
given by Eq. (9) but with a modified phase shift lll δδδ Δ+= )0( . The WGM frequency is
#85737 - $15.00 USD Received 27 Jul 2007; revised 29 Aug 2007; accepted 19 Sep 2007; published 10 Dec 2007
(C) 2007 OSA 10 December 2007 / Vol. 15, No. 25 / OPTICS EXPRESS 17414

shifted accordingly in order for 2
πδ =l . As long as 1|| <<Δ lδ , the amount of shift is
given by
ωδδω
d
d l
l)0(
Δ−=Δ (15)
with the RHS evaluated at the unperturbed WGM frequency. To calculate lδΔ , we multiply
Eq. (6) by )0(lg and Eq. (7) by lg . Then we take their difference and integrate the result with
respect to r, i. e.
[ ]∫∞
×−×0
)0(2 Eq.7Eq.6 ll ggdrr (16)
Upon using the asymptotic behavior Eq. (9) and that of lg , we end up with
∫∞
=ΔR
lll rgrgrdrrn )()()(sin )0(23sol. δεωδ , (17)
which is rigorous up to now. To the leading order perturbation, we may approximate
ll δδ Δ≅Δsin and replace lg of the integrand on RHS by )( sol.)0( rnng ll ω= .
Substituting the approximate expression thus obtained for lδΔ and the explicit expression for
ωδd
d l)0(
derived in the Appendix A Eq. (15), we find that
)()(
)()(
222
sol.223
sol.
znzz
rnnrdrrn
l
R
l
−=Δ−=Δ ∫
∞
ς
ωδεω
ωω
λλ
(18)
Substituting Eq. (4) into Eq. (18), and the parallel expression for a TM mode developed in the Appendix B, we end up with:
( )[ ] κρεεεσ
λλ
Rnn
vv
)( 2sol
2cav −
′Δ−′Δ+Δ=⎟⎠
⎞⎜⎝
⎛ Δ (19)
where v is the total volume of the cell and v′ is that of the interior. The fractional wavelength shift expressed by Eq. (19) is dimensionless and will not change if the speed of light is not set
to one. The polarization factor 1=ρ for TE mode and 18.1)/(2 2cavsol ≈−= nnρ for
TM mode. The form factor κ relates the evanescent field penetration depth with the size of the bacteria. In the long wavelength limit, where the penetration depth is much larger than the bacteria diameter, 1→κ and the formula is then equivalent to the perturbative dipole approximation derived in (5-7). The higher value of the TM mode is caused by the jump of the electric field amplitude across the cavity wall [7]. For our analysis, we model the E.coli as a cylindrical cell with its axis aligned parallel
(horizontal) to the surface of the cavity upon binding. We have 22 abv π= and 22 bav ′′=′ π with a the half length of the cylinder and b the radius. The primed quantities
stand for the corresponding size of the interior. The form factor κ in this case is given by
#85737 - $15.00 USD Received 27 Jul 2007; revised 29 Aug 2007; accepted 19 Sep 2007; published 10 Dec 2007
(C) 2007 OSA 10 December 2007 / Vol. 15, No. 25 / OPTICS EXPRESS 17415
zevv
zfzvf −
′Δ−′Δ+Δ′′Δ−Δ+Δ=
)(
)()()(
εεεεεεκ (20)
where 14
2cav
2sol −=
n
nbz
λπ
and 14
2cav
2sol −
′=′
n
nbz
λπ
with λ the wavelength in the
solution. The function )(xf is related to the modified Bessel function as )(2
)( 1 xIx
xf = .
3. The line width To estimate the line width broadening, we employ the Rayleigh-Gans approximation. Let us consider first an adsorbed particle located at R. In the coordinate system with its origin at the
center of the spherical cavity, RR ˆR≅ . The induced dipole density inside the particle is given by
( ) )()( 0 rErrd δε= (21)
with )(0 rE the incident evanescent field. Neglecting the reflection at the cavity wall, the
secondary electromagnetic field from the induced dipole density in the radiation zone reads
[ ])(4
)(2
rad. npnnrE ××−= ikrerπ
ω (22)
and
)()( rad.sol.rad. rEnrB ×−= n (23)
where r
rn = is the unit vector in the direction of r.
)()( sol.3 rdrnp rn ′′= ∫′⋅−
v
ined ω (24)
with the integral restricted within the volume of the particle. The radiated power from the particle is then
( ) ∫∫ ⋅−⋅=×= ∞→ )||(32
)()(lim2
1ˆ 2*22
43sol.*22 pnppnrBrnER d
ndrP r π
ω. (25)
Averaging with respect to the orientation of the particle and summing up the contribution from all adsorbed particles, we obtain the total power radiation
∫= )ˆ(ˆ22 RRPdRP σ (26)
and the line width W
P=Γ , where W is the total energy of the WGM considered. For the
geometry considered in the last section
[ ] ρη
λεεεσπRnnn
vv42
sol2cavsol.
23
)(3
)(16
−′Δ−′Δ+Δ=Γ (27)
with η another form factor whose explicit expression is displayed in the Appendix C. The line width of Eq. (27) carries a dimension of 1/time but the right hand side of Eq. (27) carries a dimension of 1/length. Therefore it will acquire a factor c if we do not set c=1.
#85737 - $15.00 USD Received 27 Jul 2007; revised 29 Aug 2007; accepted 19 Sep 2007; published 10 Dec 2007
(C) 2007 OSA 10 December 2007 / Vol. 15, No. 25 / OPTICS EXPRESS 17416

4. Experiment
WGMs are excited in a silica microsphere ~340 μm in diameter (Fig. 1(a)). The microspheres are fabricated by melting the tip of an optical fiber in a butane/nitrous-oxide flame and selected by size after fabrication. Surface tension produces a sphere on a stem structure [4]. WGM are excited along the equator of the sphere by coupling from tapered optical fiber which is thinned by hydrofluoric acid erosion to a final diameter ~2-4 μm at the region where it evanescently couples to the microsphere cavity. The resonances are detected with an InGaAs photodiode as Lorentzian-shaped dips in the fiber transmission spectrum obtained by scanning a tunable coherent source (~1.311 μm center wavelength) coupled to one fiber end. Spectra containing 1000 points per scan are recorded every 10 ms at a resolution of 0.1 pm/point with a computer running Labview program. The resonance wavelength is determined from the minimum of the resonant line by polynomial fitting algorithm. The microsphere is immersed in a liquid sample cell filled with phosphate buffered saline (PBS) solution equilibrated at room temperature [4]. After acquiring baseline spectra, a bacterial PBS suspension is injected into the sample cell from where the bacteria start to adsorb to the microsphere surface.
Prior to use, the ampicillin resistant E.coli K12 bacteria are grown to saturation in Liquid Broth growth medium where most of them appear un-flagellated. They are then concentrated in an Eppendorf tube and washed three times in PBS by alternating sedimentation (~8000 rpm) and re-suspended with a micro-pipette. To promote bacterial adsorption, the silica microsphere is modified with a poly-l-lysine coating. For lysine coating, the microsphere is first cleaned for 4 minutes in an oxygen plasma sterilizer (Harrick). It is then immersed in a hanging drop of 0.01% poy-l-lyisine solution (Sigma) until dry, rinsed 5 minutes in PBS and immediately mounted in the sample cell. A charge coupled device (CCD) camera is fixed on an upright microscope and monitors bacterial adhesion by imaging of the microsphere surface with a 40× long working distance objective. Free-floating bacteria are unambiguously identified from the bound ones by discerning their Brownian motion. Bacterial surface densities are determined by counting the number of bacteria (typically between 0 and 100 counts) identified in the imaged surface area of ~10-5 cm2, which is only a fraction of the ~0.36 mm2 total sphere surface. The concentration of the bacteria is adjusted so that adsorption increases surface density at initial rate of ~5 × 10³ cells / (cm2 × seconds). The orientation and random distribution of the bacteria is confirmed by high-resolution images of green-fluorescent protein labeled bacteria (Fig. 1(b)). It is seen that the cylindrical bacteria are mostly bound with their axes aligned parallel (horizontal) to the surface. A few exceptions are indicated by arrows. Bacteria are irreversibly bound, and no unbinding events were observed over the time course of this experiment. We also would like to point out that our measurements do not discriminate between live and dead bacteria cells. It is, however, unlikely that the bacteria experience significant radiation damage upon binding since >94% of the mode energy resides in the silica cavity [5] and since the laser is not locked to a critically coupled resonance.
Figure 2 shows a series of transmission spectra obtained for successive time points (100 s intervals) during adsorption of E.coli. For each spectrum, the surface density of bound bacteria is determined from microscopic images. The overall wavelength shift is then plotted versus the surface density (data points in Fig. 3). The lines show the plots of analytic predictions (Eq. (19)) using the following parameters [21-25]: E.coli cylinder radius b = 0.4 μm and cylinder half length a = 1 μm, which corresponds to an average E.coli volume ~ 1
μm3. The cell wall thickness is estimated at a-a’ = b-b’ = 42 nm, wn =1.42, int.n = 1.35
(which results in an average refractive index of E.coli n ≈ 1.37); nsol = 1.33 and ncav = 1.467, center wavelength λ = 1.311 μm, microcavity radius R = 170 μm. It is seen that the theory fits reasonably well with the measurement. The plot shows results of Eq. (19) for both polarizations (TE and TM).
#85737 - $15.00 USD Received 27 Jul 2007; revised 29 Aug 2007; accepted 19 Sep 2007; published 10 Dec 2007
(C) 2007 OSA 10 December 2007 / Vol. 15, No. 25 / OPTICS EXPRESS 17417

Fig. 2. Shift of resonance wavelength and broadening of linewidth of a WGM due to adsorption of E.coli bacteria. The spectra were recorded in 100 s intervals. In parallel, bacteria surface densities where determined from optical micrographs.
In Fig. 3 we also plotted Eq. (19) in the long wavelength limit, where the size to wavelength ratio is small and the form factor κ=1 (only TE mode is shown). Given a wavelength shift that can be detected with sensitivity ~1/50th of the linewidth [4,9] and given the Q measured ~4.3 ×10⁵ for low bacterial surface density (Fig. 2), we estimate the current detection limit of our setup at ~1.2 × 10² E.coli/mm2, which corresponds to ~44 bacteria bound to the ~0.36 mm2 total area of the sphere. With the average dry weight of an E.coli bacteria ~2.8 × 10⁻¹³ g, this corresponds to sensitivity for bacterial dry-mass loading ~3.4 × 10⁻¹¹ g/mm2.
0.0E+00
1.0E-05
2.0E-05
3.0E-05
4.0E-05
0 0.005 0.01 0.015 0.02 0.025
surface density [μm-2
]
fractional wavelength shift
Δλ/λ
Measurement
Theory, TE mode
Theory, TM
long wavelengthlimit, TE
Fig. 3. The plot shows the linear relationship between measured fractional wavelength shift and surface density of adsorbed E.coli bacteria (data points). Analytic theory is plotted for TE and TM modes (lines). Also plotted are analytic results in the long wavelength limit (κ=1, TE mode).
In order to confirm the orientation of the E.coli bacteria on the resonators surface it would be interesting to estimate the effective footprint area which can be calculated by solving a thin film problem similar to [8]. If we consider a thin patch (thickness, t) of excess dielectric
#85737 - $15.00 USD Received 27 Jul 2007; revised 29 Aug 2007; accepted 19 Sep 2007; published 10 Dec 2007
(C) 2007 OSA 10 December 2007 / Vol. 15, No. 25 / OPTICS EXPRESS 17418

constant Δε = solw nn 22 − , and foot print area Afp to represent the effective E.coli cell wall patch that is in contact with the silica microsphere cavity (radius R and refractive index ncav), we have the starting point for a simple model. Beyond this patch, but contained within its foot
print, is protoplasm having an excess dielectric constant 22int solnn −=′Δε . Of course there are
many patches on the surface (surface density bσ ), and the evanescent intensity penetrates
only a characteristic length L ≈ (λ/4π)(n2cav - n
2sol)
-1/2. With this picture the wavelength shift for a TE mode is
( ) ( )])1[()(
22int
/22/22 sol
Ltsolw
Lt
solcav
bfpnnenne
Rnn
LA−+−−
−≈ −−σ
λδλ
(28)
This equation is easy to solve for Afp. For the case at hand, we calculate the effective footprint area of E.coli at Afp ~0.16 μm2, only about 1/10th of its largest cylindrical area projection (2a × 2b = 2 μm × 0.8 μm). In comparison, for E.coli bound to the surface by one of its disc-shaped side walls, we would expect a much larger footprint πb2~0.5 μm2. The result is therefore consistent with the observation of E.coli bound with its axis aligned parallel (horizontal) to the surface (Fig. 1).
The coupling between the evanescent field and the adsorbed particles broadens the spectral line of a WGM, which is a second order effect in εΔ and ε ′Δ (Eq. (27)). Figure 4 shows the increase in line width, the slope of which can be estimated from the incoherent radiations from the adsorbed E.coli driven by the evanescent field of the incident WGM, Eq. (27). As in the case of the wavelength shift, we have η =1 in the long wavelength limit. The agreement with the observation is up to the order of magnitude.
0.0E+00
5.0E-06
1.0E-05
1.5E-05
2.0E-05
0 0.005 0.01 0.015 0.02 0.025
surface density [μm-2
]
fractional linewidth shift Δ
λline
/λ
Measurement
Theory, TE mode
Theory, TM mode
long wavelengthlimit, TE
Fig. 4. Measured fractional linewidth shift versus E.coli surface density (data points). The lines are plots of the analytic results for TE and TM modes. Also plotted is the calculated increase of fractional linewidth in the long wavelength limit (κ=1, TE mode).
5. Discussion and conclusion
In conclusion, we have shown experimentally that adhesion of cylindrical bacteria at random horizontal orientation on high-Q optical microsphere sensors perturb resonance frequency as well as linewidth. The magnitude of the perturbations can be derived using Born-and Rayleigh-Gans approximations by introducing a form factor to account for the cylindrical bacteria shape. In the long wavelength limit, the theory is equivalent to the already established perturbative dipole approximation valid for nanometer-sized biomolecules. Horizontal
#85737 - $15.00 USD Received 27 Jul 2007; revised 29 Aug 2007; accepted 19 Sep 2007; published 10 Dec 2007
(C) 2007 OSA 10 December 2007 / Vol. 15, No. 25 / OPTICS EXPRESS 17419

alignment of bound bacteria is confirmed from fluorescent images and consistent with an estimate of cell wall area in contact with the resonator. The resonance frequency shifts linearly with increase of bacteria surface density which establishes microsphere sensors as sensitive tool to detect bacteria and large viral species, label-free and in real time. The sensitivity of the current setup is measured at 1.2 × 10² E.coli/mm2, which corresponds to ~34 pg/mm2 dry-mass loading or a total of 44 bacteria bound to the sphere surface at random location. With increase of Q-factor, decrease of mode volume and operation at favorable wavelength [26,27], such measurements can be performed on the single cell level; possibly in multiplexed, high-throughput experiments. Modification of the cavity surface with antibodies will allow for the specific detection of bacterial and viral species of ubiquitous cylindrical shape.
Acknowledgements
F.V. was supported by a Rowland Junior Fellowship. H-C.R. was supported in part by US Department of Energy under grant no. DE-FG02-91ER40651-TASKB and NSFC under grant no. 10575043. S.A. was supported by NSF Grant BES 0522668. Appendix A The Asymptotic behavior of spherical Bessel functions Eqs. (13) and (14): Combining the definition of a spherical Bessel function and the Debye formula for a Bessel function of a large argument and a large order [28], we have
( ) )(tanh2
1
tanhsech2
1)sech( ααναα
ναν −−≅ ejl (A1)
and
( ) )tanh(2
1
tanhsech2
1)sech( ααναα
ναν −−−≅ enl . (A2)
We have
⎟⎠
⎞⎜⎝
⎛ −+==R
Rr
n
nrn1sech
cav.
sol.sol.
νωα (A3)
at a WGM. In a vicinity just outside the cavity wall, RRr <<−<0 ,
00 cothαααR
Rr −−≅ (A4)
where cav.
sol.0sech
n
n=α and Rn ωαν sol.0sech = . Substituting Eq. (A4) into Eqs. (A1) and
(A2), we derive Eqs. (13) and (14). Note that the second term of Eq. (A4) has to be retained in the exponent because of the large multiplicative factor ν .
The Calculation of ω
δd
d l)0(
at a WGM of TE polarization:
It follows from Eq. (10) and Eq. (11) that at the resonance
0)( )(
)( )( =′′ zznj
znj
ll
ll
ςς
ς (A5)
and then
)()( * ωω ll DD = (A6)
#85737 - $15.00 USD Received 27 Jul 2007; revised 29 Aug 2007; accepted 19 Sep 2007; published 10 Dec 2007
(C) 2007 OSA 10 December 2007 / Vol. 15, No. 25 / OPTICS EXPRESS 17420
Therefore, the derivative of lδ with respect to ω at the resonance reads
)( )(
)( )(
)( )(
)( )(
)0(
zzjj
zjj
zznj
znj
d
d
d
d
ll
ll
ll
ll
l
′′
′′−=
ςς
ςςς
ς
ω
ωδ
(A7)
Eq. (A5) implies that
)()(
)()( ςςς ′
′= l
l
ll j
zzn
znj . (A8)
For the denominator of Eq. (A7) , we have
)(
)(
)( )(
)( )(
)(
)()()()()(
)( )(
)( )(
2zn
j
z
znj
znj
zn
jzjjzjzj
zzjj
zjj
l
l
ll
ll
l
lllll
ll
ll
′
′−=
′′′
′−=′−′=′′
ςς
ς
ςςςςςςςς
ς
(A9)
where the Wronskian of spherical Bessel functions
2
1
)( )(
)( )(
zznj
znj
ll
ll=′′ ς
ς (A10)
is substituted in the last step. Using the spherical Bessel equation
[ ] 0)()1(
1)(1
2=⎥⎦
⎤⎢⎣
⎡ +−+″ zjz
llzzj
z ll (A11)
for )(zjl and the same equation for )(znl , we find
)(1)1(
)()(2
ςς
ςςςς lll jll
jj ⎥⎦
⎤⎢⎣
⎡−++′−=
′⎥⎦⎤
⎢⎣⎡ ′
(A12)
and
)(1)1(
)()(2
znz
llzznzzn lll ⎥⎦
⎤⎢⎣
⎡ −++′−=′
⎥⎦⎤
⎢⎣⎡ ′
. (A13)
The numerator of Eq. (A7) becomes
)()(
)()()()()(
)()()()(1
)( )(
)( )(
22222 znzzn
jzznjz
zznjzznjzznj
znj
d
d
l
l
lll
llll
ll
ll
′
′−=−=
⎪⎭
⎪⎬⎫
⎪⎩
⎪⎨⎧ ′
⎥⎦⎤
⎢⎣⎡ ′−
′⎥⎦⎤
⎢⎣⎡ ′=′′
ςςςςς
ςςςςωςς
ς
ω (A14)
where the resonance condition Eq. (A5) is used in the last two steps. Combining Eq. (A9) and Eq. (A14), we obtain that
#85737 - $15.00 USD Received 27 Jul 2007; revised 29 Aug 2007; accepted 19 Sep 2007; published 10 Dec 2007
(C) 2007 OSA 10 December 2007 / Vol. 15, No. 25 / OPTICS EXPRESS 17421

)()(1 222
)0(
znzzd
dl
l −= ςωω
δ (A15)
Appendix B
The electromagnetic field of a TM mode of the order (l,m) reads:
( ) ( )rXrB ˆ)( lmllm rf ω=
( ) ( )rBrE lmlm
i ×∇=εω
(B1)
The Maxwell equation implies that the radial function lf satisfies the equation
( ) 011)1(1 2
22
2=+−++⎟
⎠
⎞⎜⎝
⎛− llll rf
dr
d
rdr
dff
r
ll
dr
dfr
dr
d
r
δεε
εω (B2)
subject to the joining condition at Rr = ,
+− ===
RrlRrl ff (B3)
and
+− ==
=Rr
l
Rr
l rfdr
drf
dr
d)(
1)(
1
sol.cav. εε (B4)
Repeating the procedure for a TE mode in the section 2, we find that
( )∫∞
⎥⎦
⎤⎢⎣
⎡−=Δ
R
llll rfdr
d
dr
d
rffdrrn
δεε
δεωωδ 1sin 2)0(2
sol. (B5)
where )0(lf is the radial function in the absence of δε . Perturbatively, we may write
ωω
δδδ Δ≅Δ≅Δd
d lll
)0(
sin and set sol.)0( and εε == ll ff on RHS, where the zeroth
order phase shift of a TM mode is given by
)(
)(*
2 )0(
ωωδ
′
′−=
l
li
D
De l (B6)
with
( )( ) ( )
( ) ( ) ][1
][1
)1(22
)1(
′′=′
zzhz
j
zhjD
ll
ll
l ςςς
ςω . (B7)
Upon integrating the 2nd term inside the bracket on RHS of Eq. (B5) and substituting the
equation satisfied by )0(lf , we end up with the formula
( )
ωδ
δε
ωω
λλ
d
dn
rfdr
dflldrr
l
R
ll
)0(
sol.
2)0(2)0(2 )1(∫
∞
⎥⎥⎦
⎤
⎢⎢⎣
⎡⎟⎠
⎞⎜⎝
⎛++=Δ−=Δ
. (B8)
#85737 - $15.00 USD Received 27 Jul 2007; revised 29 Aug 2007; accepted 19 Sep 2007; published 10 Dec 2007
(C) 2007 OSA 10 December 2007 / Vol. 15, No. 25 / OPTICS EXPRESS 17422

After a lengthy manipulation but straightforward with the aids of the approximations Eqs. (13) and (14), we find that the RHS. of Eq. (B8) is simply that of a TE mode multiplied by the
factor cav.
sol.2n
n− .
Appendix C The explicit expressions of the form factor of line width of a WGM of TE polarization is given by
θεεε
ςηξεεςηξεθφαηππ
21
1
22
0
2
0
sin)(
),,()(),,(cos
16
3 zevv
gvvgddd −
−∫∫∫ ′Δ−′Δ+Δ
′′′′Δ−′Δ+Δ= ,
where ( ),sinhcossin2 γφθλπξ i
b −=
( )[ ],coscoshsinsinsincos2 αγφθαθλπη −+−= b
and
( )[ ],sincoshsinsincoscos2 αγφθαθλπς −+= a
with sol
cavcoshn
n=γ . The
quantities ςηξ ′′′ ,, are obtained from ςηξ ,, by replacing a and b with a’ and b’. The
function g is related to the Bessel function as ς
ςηξηξ
ςηξ sin)(2),,(
22
221
+
+=
Jg .
#85737 - $15.00 USD Received 27 Jul 2007; revised 29 Aug 2007; accepted 19 Sep 2007; published 10 Dec 2007
(C) 2007 OSA 10 December 2007 / Vol. 15, No. 25 / OPTICS EXPRESS 17423