high-resolution baroclinic ocean simulations for the east florida shelf: frontal eddies to reef...
Post on 19-Dec-2015
216 views
TRANSCRIPT

High-Resolution Baroclinic OceanSimulations for the East Florida Shelf:
Frontal Eddies to Reef Scale Processes
Jerome Fiechter and Christopher N.K. Mooers
Ocean Prediction Experimental Laboratory
Rosenstiel School of Marine and Atmospheric Science
University of Miami
2003 Terrain-Following Ocean Models Users Workshop
Seattle, 06-AUG-2003

• Geographical domain
– Straits of Florida
– East Florida Shelf
– Florida Keys reef tract
• Circulation features
– Florida Current
– Gulf Stream
– Loop Current
– Tortugas gyre
– Frontal eddies
Region of interest
Source: NASA (MODIS image)

• Princeton Ocean Model (POM)
• Curvilinear grid
• Vertical sigma levels
• SEA-COOS program– COMPS (USF)– EFSIS (UM) – SABSOON (UNC)
Regional of interest
East Florida Shelf coastal ocean model (EFS-POM)
(www.seacoos.org; www.efsis.rsmas.miami.edu)

Horizontal: 251x101 nodes (~2-20km)Vertical: 25 σ-levels (~0.1-100m) – clustering in surface and bottom layersMin. depth: 5m (extended to physical coastline location)
EFS-POM ocean model
Domain grid - Resolution

EFS-POM ocean model
Forcing Boundary condition
UA, VA (external)from U, V
(30Sv, constant)
in: inflow
out: Flather radiation
U, V (internal)thermal wind balance
(inflow only)
in: inflow
out: Orlanski radiation
T, SLevitus
(monthly, 1ºx1º)
in: Orlanski radiation
out: Orlanski radiation
Wind stressETA winds
(6-hourly, 2ºx2º)
quadratic drag law
(drag coef. = 10-3)
Heat fluxEsbensen & Kushnir
(monthly, 4ºx5º)long wave rad., latent, sensible,
(penetrating) short wave rad.
Open and surface boundary conditions - Summary

SST and SSH daily animation
1999 Hindcast simulation - Seasonal cycle
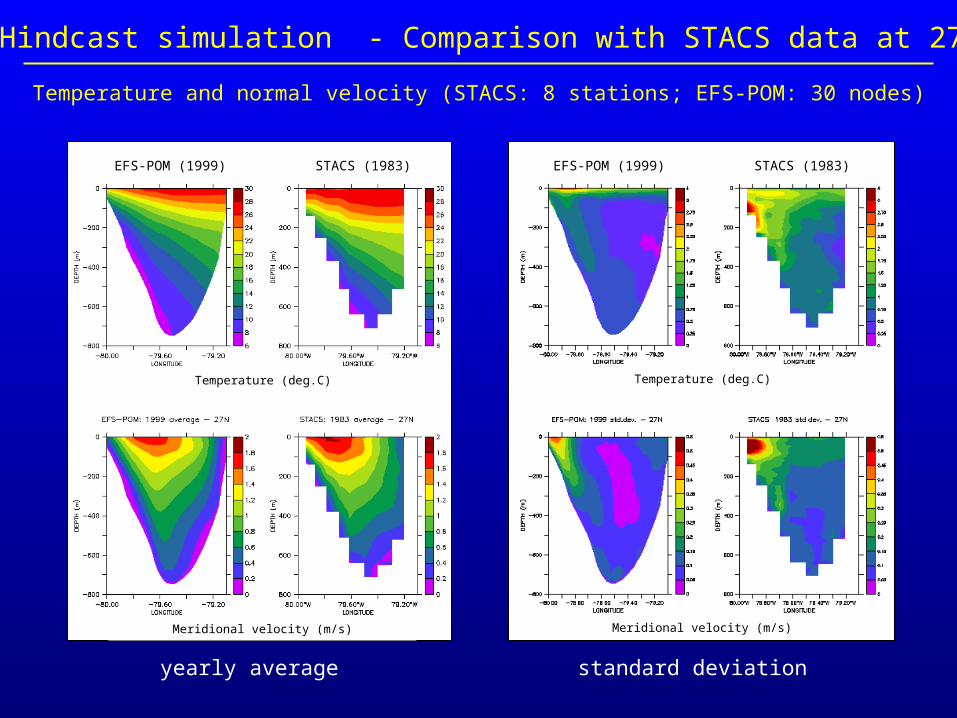
Temperature and normal velocity (STACS: 8 stations; EFS-POM: 30 nodes)
1999 Hindcast simulation - Comparison with STACS data at 27N
standard deviationyearly average
EFS-POM (1999) STACS (1983) EFS-POM (1999) STACS (1983)
Temperature (deg.C)
Meridional velocity (m/s)
Temperature (deg.C)
Meridional velocity (m/s)

SST and SSHA daily animation
Frontal spin-off eddy event, February 1999

Eddy propagation along EFS shelf break (200m isobath)
Frontal spin-off eddy event, February 1999

Summary
Simulation Observations
alongshore diameter 60-120 km 100-200 km *
cross-shore diameter20-30 km (26N)
50-80 km (29N)
10-30 km (26N) *
30-50 km (30N) *
propagation speed 40 km/day 36 km/day #
recurrence period
(wavelength)
4-7 days
(160-210 km)
5 days #
(170 km)
* Lee et al., 1991 # Johns and Schott, 1987
Frontal spin-off eddy event, February 1999

Remaining issues
• Formation and evolution– origin– decay and growth rates– “gap closure paradox”
• Cross-shelf transport– heat, momentum– biochemical tracers
• Sensitivity to forcing and numerical parameters– seasonal transport cycle– HORCON, TPRNI– grid type and resolution
Frontal spin-off eddy event, February 1999

Dry Tortugas high-resolution nested model (DT-POM)
Domain grid - Resolution
Horizontal: 65x57 nodes (~1-2km)Vertical: 21 σ-levels (~0.1-10m) – clustering in surface and bottom layersMin. depth: 2m (no coastline)

Forcing Boundary condition
UA, VA (external)mapping from
EFS-POM
E, W: Flather radiation
N, S: Flather radiation
U, V (internal)mapping from
EFS-POM
E, W: Marchesiello radiation
N, S: Marchesiello radiation
T, Smapping from
EFS-POM
E, W: Orlanski radiation
N, S: Orlanski radiation
Wind stressC-MAN winds
(hourly, uniform)
quadratic drag law
(drag coef. = 10-3)
Heat fluxEsbensen & Kushnir
(monthly, 4ºx5º)long wave rad., latent, sensible,
(penetrating) short wave rad.
Open and surface boundary conditions - Summary
Dry Tortugas high-resolution nested model (DT-POM)

Bottom temperature and velocity
1999 Hindcast simulation - DT model

Vertical temperature and velocity structure at 24.7N
1999 Hindcast simulation - DT model
AUGUST 1999FEBRUARY 1999
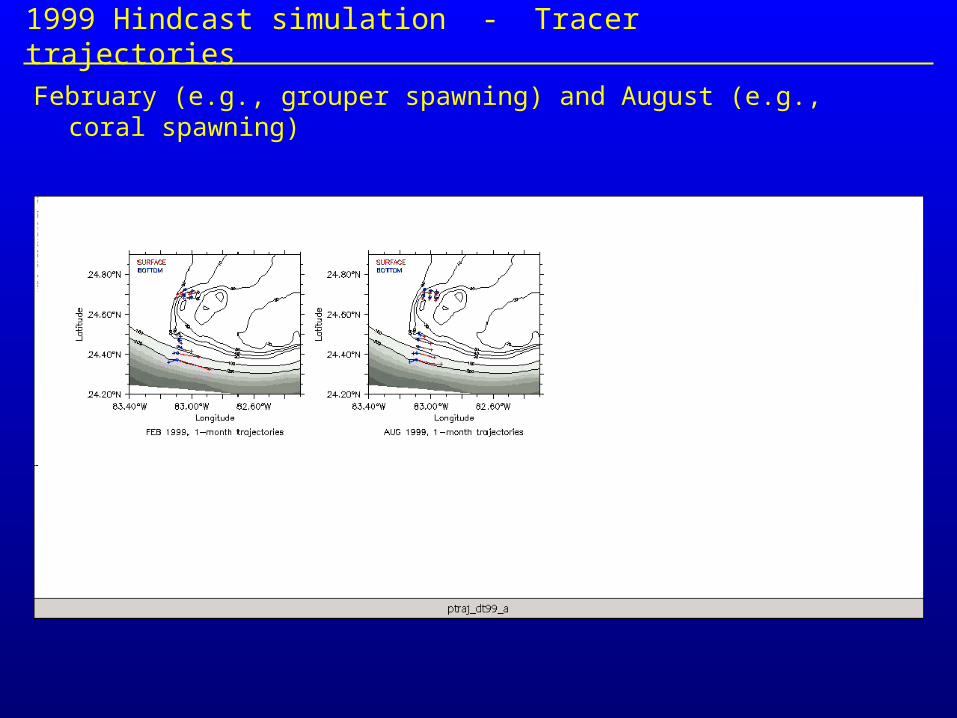
February (e.g., grouper spawning) and August (e.g., coral spawning)
1999 Hindcast simulation - Tracer trajectories

• East Florida Shelf model (EFS-POM) is qualified to:
– study large scale to mesoscale processes
– investigate regional connectivity and recruitment
(i.e., long-range dispersion processes)
• Dry Tortugas model (DT-POM) is qualified to:
– study submesoscale and reef scale processes
– investigate self-seeding vs. export conditions
(i.e., local retention processes)
– relate benthic communities to flow dynamics
Conclusions

• East Florida Shelf model (EFS-POM)
– improve open boundary and surface forcing
– increase horizontal and vertical resolution
– validate further against observations
– sensitivity study (num. param., forcing, resolution)
– add ecosystem model (e.g., NPZD)
• Dry Tortugas model (DT-POM)
– improve nesting method
– increase horizontal and vertical resolution
– validate against observations
– 3-D trajectories / biological behavior
Future Work

Questions and comments