high resolution deep imaging of a bright radio quiet qso at€¦ · · 2015-04-08on a bright...
TRANSCRIPT

Research in Astron. Astrophys. 201x Vol. X No. XX, 000–000http://www.raa-journal.org http://www.iop.org/journals/raa
Research inAstronomy andAstrophysics
High resolution deep imaging of a bright radio quiet QSO atz ∼ 3 ∗
Yi-Ping Wang1, Wei He1, Toru Yamada2, Ichi Tanaka3, Masanori Iye4 and Tuo Ji5
1 Key Laboratory of Optical Astronomy, National Astronomical oObservatories, ChineseAcademy of Sciences, Beijing 100012, China; [email protected]
2 Tohoku University, Aramaki, Aoba, Sendai 980-8578, Japan3 Subaru telescope, National Astronomical Obs. of Japan4 National Astronomical Obs. of Japan, Mitaka, Japan5 Antarctic Astronomy Division, Polar Research Institute of China
:::::Please
::::give
:::the
:::::postal
:::::::address
::of
::::each
::::::author.
Received 2014 June 27; accepted 2014 September 25
Abstract:::Do
::::you
:::::mean We have obtained deep J and &Ks-band images centered
on a bright radio quiet QSO UM 402 (zem = 2.856) using anthe IRCS camera andAOadaptive optics systems onthat are part of the Subaru Telescope, as well as retrievedWFC3/F140W archive images of this object.
:::::Note:
::in:::an
:::::online
::::::search,
:::we
:::::found
::::that
::::other
::::::authors
::::refer
::to::::this
::::QSO
::as
:::::“UM
::::402”
:::so
::we
:::::made
:::this
:::::::change
:::::::::throughout
::::your
:::::article.
::::::Please
::::::confirm
::::that
:::you
:::::agree
::::with
::::this
::::::change. A faint galaxy (mk = 23.32±
0.05 in the Vega magnitude system) that lies ∼ 2′′. 4∼ 2.4′′ north of the QSO sightlinehas been clearly resolved in all three deep high resolution datasets, and appears asan irregular galaxy with two close components in the Ks-band images (separation∼ 0.3′′′′. 3).
:? Given the small impact parameter (b = 19.6 kpc, at zlls = 2.531), as
well as the red color of (J −Ks)vVega ∼ 1.6, it might be a candidate galaxy giving
rise to the Lyman Limit system absorption at zabs = 2.531 seen in the QSO spectrum.After carefully subtracting the PSFpoint spread function from the QSO images, thehost galaxy of this bright radio quiet QSO at z ∼ 3 was marginally revealed. Weplaced a lowlower limit ofon the host component of mk ∼ 23.3 according to ouranalyses.
Key words: galaxies: active — galaxies: high redshift — quasars: general — instru-mentation: adaptive optics
1 INTRODUCTION
Recent cosmological simulations have made significant progress on the understanding of the physi-cal properties of quasar absorption line systems and their implications for the ionizing background.
::Do
::::you
:::::mean Lyman Limit systems (LLSs), as a member of the quasar absorption line (QAL) fam-
ily, are defined to be optically thick at the Lyman limit(λ < 912 A) and ofhave a neutral hydrogen
∗ Supported by the National Natural Science Foundation of China.*Based on data collected at the Subaru Telescope, which is operated by the NationalAstronomical Observatory of Japan.
* We acknowledge the use of HST WFC3 archive data.
2 Y. P. Wang et al.
column density of NHI > 1017cm−2,. attractThese objects have attracted much attention withinoverthese years. The numerical simulations by Fumagalli et al. (2011) suggest that cold gas streams of acircumgalactic medium mostly appear as LLSs (NHI > 1017 cm−2), while gas clumps in the streamsgive rise to damped Lyman Alpha systems (DLAs) (NHI > 1020.3 cm−2) as well.
:? Meanwhile, the
simulations show that cold streams are unlikely to produce the large equivalent widths of low-ionmetal absorption lines, indicating they may arise from outflows.
Although sophisticated numerical simulations with much higher resolution are available theseyearstoday, the questions on the physical origin of the absorption lines, i.e. whether the absorbinggas primarily traces the cool extended regions of dark matter halos, dwarf satellite galaxies, galacticdiscsdisks or supernovae-driven outflows, remain stillstill remain in dispute (Katz et al. 1996; Kohler& Gnedin 2007; Prochaska et al. 2010; Dekel et al. 2009; Fumagalli et al. 2011; Rahmati & Schaye2014). For example, Erkal (2014) studied LLSs using simulations which had higher spatial and massresolution than that of Kohler & Gnedin (2007), and concluded that the majority of LLSs reside inlow-mass halos, opposite to what Kohler & Gnedin (2007) have found. However, we understand thatthe treatment of the complicated physical processes in the simulation would cause uncertainties, andobservational evidences and good statistics would set constraints to these models in this case.
Deep imaging and spectroscopy of close QSO/galaxy pairs would provide a unique opportu-nity to study both the gas flows around galaxies and their stellar population, as well as to determinethe morphology and orientation of the galacticxy disks in space.
::Do
::::you
:::::mean
:By performing a
kinematic comparison of these absorber galaxies and the QSO aborptionabsorption line systems, wehopefully could effectively investigate the matter ofin the circumgalactic medium (CGM), whichareis being accreteding ointo galaxies or being expelled by galactic wind.
:? Therefore, identifying
LLS absorbers using high resolution deep imaging would be a crucial first step ofin thethis study,and there has already been a definite improvement nowadays on the detection power of faint inter-vening galaxies in the QSO sightline both from space and AO-assistedadaptive optics (AO)-assistedground-based large facilities, especially towards the peak epoch of galaxy formation (z ∼ 3).
:::Do
:::you
:::::mean Recent work on nearby Lyman Limit SystemsLLSs shows the example anddemonstrates
the importance toof extending such a study to the under-exploitedinvestigated high-zhigh-z universe,withwhich has an feastabundance of galaxy formation activities (Stocke et al. 2010; Ribaudo et al.2011).
:?
On the other hand, the studies on theof high-zhigh-z quasar hosts have also received increasingattention lately, since they open an important avenue to studyfor understanding the assembly andevolution of massive galaxies, in particular in relation to the growth of their central black holes.
::Do
::::you
:::::mean
:Although deblending the host components of high-zhigh-z QSOs from the bright
central AGNs is non-trivial, previous efforts on this subjectin this endeavor have made significantprogress depending onby utilizing high resolution images from space (HSTHST) and AO techniquesof ground-based largelarge ground-based facilities. A sample of faint or medium-bright QSOs, in-cluding radio loud QSOs (RLQs) and radio quiet QSOs (RQQs) at z ∼ 2 − 3, have been observed,especially with the NICMOS camera on HSTHST (Ridgway et al. 2001; Kukula et al. 2001; Penget al. 2006).
:? Moreover, ground-based 8 m class telescopes, especially with adaptive opticsAO, offer
a high spatial resolution for a powerful detection of high-zhigh-z QSO host galaxies (Falomo et al.2008; Schramm et al. 2008; Wang et al. 2013).
:::Do
:::you
:::::mean
:However, host properties of the hosts
from the studies onof the current sample have been the subject of some debate. Except thatfor thestudy by Falomo et al. (2008) that resolved a large host galaxy of a medium-bright RLQ at z ∼ 2.9,we lack evidences towardsabout the peak epoch of galaxy formation at z ∼ 3, especially forrelatedto luminous QSOs.
:?
UM 402 is a bright, high redshift radio-quiet QSORQQ discovered by MacAlpine & Lewis(1978).
::Do
::::you
::::::mean
:It is bright enough to permit detailed spectroscopic observations with
a resolution ranging from a few to hundreds of km s−1, and showing clearly theshows strongand sharp Lyman α and CIV emission lines, as well as a Lyman Limit systeman LLS at

AO Deep Imaging of QSO UM 402 Field 3
z = 2.531 (NHI > 4.6× 1017 cm2NHI > 4.6× 1017 cm−2) even with a low-resolution spectrum(Sargent et al. 1989). Previous deep imaging in the optical band of the field for this QSO fieldreportedindicated the detection of several close neighbors (θ ∼ 4′′. 7− 7′′θ ∼ 4.7′′ − 7′′), whicharewere all spectroscopically confirmed at redshift z < 1 (Le Brun et al. 1993; Guillemin &Bergeron 1997). Thus, the galaxy counterpart of the LLS seen in the QSO spectrum ishas stillnot been identified, indicating i. It might be much fainter than the previous detection limit ofmr(3σsky) = 25.2, or much closer to the QSO sightline.
:?
:::Do
:::you
:::::mean
:UM 402 again is also one of the high-z QSOs which we selected for a pilot study,
using the IRCS camera and AO system ofthat are part of the Subaru telescope. Several issues werecarefully considered during the target selection, 1) high-z QSOs near the era of peak QSO activityand cosmic star formation history at z ∼ 2− 3, are especially selected due to their importance oninthe understanding of the galaxy formation scenario; 2) there should be a bright guide star (R < 15)sufficiently close to the QSO sightline (< 30′′), in order to be observed with the IRCS+ and AO36system on the Subaru telescope; 3) the emission lines Hα (6563 A), Hβ (4861 A), OII (3727 A) andOIII (5007 A) should be avoided to be included in thewhen acquiring the observeding bands. Thisis important for studies that estimate the host mass estimation and properties of the host continuumproperty studies; 4) there exists a suitable PSF calibration star that can be used for point spreadfunction (PSF) calibration the so that the PSF can be subtractedion from the QSO images.
:? We will
elaborate on this point in Section 2.1.
:::Do
:::you
:::::mean
:In this paper, we present the initial results from the deep J and &Ks-band images
centered on QSO UM 402 (zem = 2.856) using the IRCS camera and AO systems on the SubaruTelescope, as well as thearchived images of this object taken by WFC3/F140W archived images (PI:Dawn Erb, HSTHST proposal ID 12471).
:? The cosmological parameters Ω = 0.27, Λ = 0.73 and
H = 71 km s−1 Mpc−1H = 71 km s−1 Mpc−1 are adopted throughout.
::::::Please
::::::provide
:a::::plan
:::for
:::the
::::::article
::in
:::the
::::form
:::::::Section
:2:::::gives
::...
::::::Section
::3
::::::::describes
::...
:::etc.
2 OBSERVATIONS
2.1 Selection of an AO Guide Star and PSF Calibration Star
For the Subaru AO36 adaptive optics systems, a natural guide star(NGS) sufficiently close to thesightline of the target is required to act as a reference source to assess the degradation of the wave-fronts due to theatmospheric turbulencet atmosphere.
:::Do
::::you
:::::mean There is a bright star with a
magnitude of R = 13.8 and an angulare distance to UM 402 of θGS ∼ 31′′. We selected this brightstar as our AO guide star, and expected to obtain thean AO corrected PSF better than 0′′. 20.2′′ if thenatural seeing is < 0′′. 6< 0.6′′ (Takami et al. 2004).?
Usually, the guide star could not be used to directly model the PSF. This is because the PSFis expected to change with the angular distance from the AO guide star, and the actual PSF at theposition of the target will be degraded.
::Do
::::you
::::mean
:On the other hand, there will be thea problem
with saturation problem for a very bright guide star required by thefor optimal AO correction. In thiscase, we have to select another PSF calibration star which could be observed at ain conditions assimilar as possible to that of the QSO, i.e. similar magnitude, similar direction and angular distancetofrom the guide star. We selected a suitable PSF calibration star for UM 402, which is ofhas similarbrightness, and similar guide star distance, but with a guide star angle offset of ∼ 180 with respectto that ofthe QSO (see Fig. 1 left). We understand that the decrease in Strehl ratio is not isotropic, andthe shape of the PSF varies over the whole field of view (FOV). However, Kamann (2008) suggestedthat it is possibly a good choice to select a calibration star around the mirrorcorresponding oppositeposition of the quasar to largely overcome the variability ofin the PSF in a large part,. This approachwill allow some improvement based on detailed studies onof the residuals ofin AO-corrected imagesafter the subtraction of the central PSF ofin the field of view(FOV). The details of the QSO, the

4 Y. P. Wang et al.
guide star and the PSF calibration star are listed in Table 1. The guide star used for AO correction isthe same one used for QSO and the PSF calibration star.
:?
2.2 Observations and Data Reduction
The AO-assisted Ks band deep imaging of UM 402 was made on Sept.17-19, 2003 (UT)2003September 17-19 (UT), using the IRCS camera on the Subaru 8.2 m telescope at Mauna Kea and theSubaru Cassegrain AO system with a 36 element curvature wave front sensor, as well as a bimorph-type deformable mirror with the same number of elements (AO36; Takami et al. 2004).
:::Do
::::you
::::mean
:The camera uses one 1024 × 1024 InSb Alladdin III detector and has two imaging modes
with different pixel scales. We adopted iIn the observation, we adopted a pixel scale of 0′′. 0230.023′′
(23mas mode), providing an FOV field size of 23′′× 23′′ (IRCS; Kobayashi et al. 2000).:? In or-
der to remove the bad pixels, we adopted nine-point dithering in a 3 × 3 grid with a dithering stepof 5′′, 6′′. 56.5′′ or 7′′.
:::Do
:::you
:::::mean
:To reduce the readout noise, 16 times nondestructive readout
(16-NDR) was applied forto each readoutraw image from the camera.:?:::::Note:
:::our
::::::::editorial
::::staff
::::does
:::not
:::::::::understand
::::how
:::“16
::::::times”
:is::::::related
::to:::::::::::::“nondestructive
::::::::readout”.
:::Do
::::you
::::mean
::::that
:::you
:::::::applied
:::::::::::::“nondestructive
:::::::readout”
:::16
:::::times
::to
::::each
::::::image?
:::::Why
:::::would
::::you
::::have
::to:::::
apply::::
this::::::::operation
:::16
:::::times?
::::::Please
::::::explain
::::your
::::::::meaning
::::more
:::::::clearly. Dark frames and dome flats were taken at the end
of each nights. Most of the observing nights were clear and photometric. The median seeing sizewas ∼ 0′′. 5∼ 0.5′′, and the airmass was mostly smaller than 1.4.
::Do
::::you
:::::mean
:After an optimal
functionality of the AO system was achieved, we offset the FOV of the telescope to put the QSO orthe PSF calibrationr star in the center of the FOV.?
:::Do
:::you
:::::mean
:Similar asSimilar to the other currently available AO systems, weour observations
suffered from the small FOVfield view of the AO detectors, and we were not able to include simul-taneously include a suitable PSF calibration star in the QSO exposures to directly evaluate the PSF.In order to monitor and assess the temporal variability of the PSF, we observed the PSF calibrationstar just before and after the observations of the QSO. More specifically, we observed the QSO itselfin an exposure set of 9× 80 s, or 9× 70 s using the 3× 3 dithering pattern, nested between similardithering observations of the PSF calibration star. Such interleaveding observations could provide uswith information on the temporal variation of the PSF during the target observations. MeanwhileInaddition, such non-simultaneous PSF calibration would provide very similar correction quality offorthe AO systems to the QSO images, since the variability applies to both the PSF star exposuresand the QSO images displaying similar values for the Strehl valuesratio.
:?
:::::Note:
::::::::according
:::to
:::the
:::::::::::understanding
:::of
:::our
:::::::editorial
::::staff
::::and
::an
::::::online
::::::search,
:::the
:::::::correct
::::term
::to
:::use
:::in
:::this
:::::::context
::is
::::::“Strehl
:::::ratio”.
::::::Please
:::::::confirm
:::this
::is
::::your
:::::::intended
::::::::meaning.
We adopt the “core width r20,”, which is defined to encircle 20% of the total flux of a pointsource, as the image quality indicator based on a close relation between r20 and the Strehl ratiogiven by Kuhlbrodt et al. (2005). We measured the r20 value of the QSO and the PSF calibration starfor each exposure frame of all three observing nights, and only adopted only good exposures withr20 < 3.5 pix
::::Does
:::::“pix”
:::::mean
:::::::“pixels”
:::::here?
::If:::so,
::::can
:::we
::::write
:::::::“pixels”
::::::::instead?
:::Our
::::::::editorial
::::staff
:::::thinks
::::this
:::::would
:::be
::::::clearer
::to
:::the
::::::reader. (Strehl ratio S ∼ 50% according to the empirical
relation onof the r20 vs. Strehl ratio). Our further analysis and discussion on properties of the hostgalaxy properties mostly relyies on these good exposures.
:::Do
:::you
:::::mean
:We used tThe package “IRCS-IMGRED” was used to makeand the acquired dark
frame, flat framefield, bad pixel mask and sky frame, as well asto perform flat fielding correction andsky subtraction (Minowa 2008).
:?
:::::Note:
::::::::according
::to
:::the
::::::::::::understanding
::of
::::our
:::::::editorial
::::staff,
::::this
::is
::the
::::way
:::::::images
::in
:::::::::astronomy
:::are
:::::::::processed.
:If::::
you:::::::disagree
::::with
::::this
::::::::::::interpretation,
:::::please
:::::::express
::::your
:::::::meaning
::::more
:::::::clearly. Finally, the dithered frames of the QSO and the PSF calibration star were
aligned and averaged respectively, using an outlier rejection algorithm.:::Do
:::you
:::::mean Values for tThe

AO Deep Imaging of QSO UM 402 Field 5
full width at half maximum (FWHM) of the AO-corrected and combined QSO image byfrom this runisare ∼ 0′′. 13∼ 0.13′′, and ∼ 0′′. 11∼ 0.11′′ for calibration star images respectively (see Table 1).
:?
:::Do
:::you
:::::mean In order to constrain the redshift range of the resolved faint galaxy ofnear the QSO
sightline, we obtained further deep J-imagingJ-band imaging of the field centered on UM 402 usingthe IRCS camera and AO188 on the Subaru telescope on Oct. 5, 2012 (UTC)2012 October 5 (UTC)
:::UT
::or
:::::UTC?
::::You
::::used
:::UT
::at
:::the
::::::::beginning
::of
::::::::Sect.2.2., in a service mode. In this run, wWe adopted
in this run a pixel scale of 0′′. 0520.052′′ (52mas mode), providing an FOV field of view of 54′′× 54′′.The weather conditions during the observation waswere very good and the achieved FWHM in theJ-bandJ-band iswas ∼ 0′′. 2∼ 0.2′′. Total exposure time for the target iswas two hours. We show thefinal combined J-band and Ks-bandJ-band and Ks-band QSO images in Figure 2 (upper right).
:?
:::Do
:::you
:::::mean
:To estimate the value of the Strehl ratiovalue of in the AO-corrected images
:::::Note:
:::::please
:::see
:::the
:::::::previous
::::note
:::::about
::::::“Strehl
::::::ratio”., we assume that the PSF iscan be approximated by
a double 2d-gaussian profile as:
fpsf =fcore
2πσ2core
exp[−
( x2
2σ2core
+y2
2σ2core
)]+
fhalo2πσ2
halo
exp[−( x2
2σ2halo
+y2
2σ2halo
)],
where fcore is the ratio of flux ratio offrom the diffraction corethat is:::::Note:
:::our
:::::::editorial
::::staff
:::::does
:::not
:::::::::understand
:::::what
:::you
:::::mean
:::by
::::::::::“diffraction
:::::core”
:::and
::in:::
an::::::online
::::::search,
:::we
:::did
:::not
::::find
::::this
::::term
::::used
:::by
::::other
:::::::authors.
::If::::
our:::::::::::interpretation
::is
:::not
:::::::correct,
::::::please
::::::explain
::::your
::::::::meaning
:::::more
::::::clearly. corrected by the AO system to the total flux; fhalo is the flux ratio of the uncorrected (seeinglimited) halo to the total flux, and fhalo + fcore = 1; σcore and σhalo are the spatial broadening of anAO-corrected core and an uncorrected halo respectively. We fitted the AO-corrected and combinedJ& and Ks-band QSO or calibration star images using a Markov Chains Monte Carlo method.
:? The
Strehl ratio is estimated as: Strehl = fcore + fhalo × (σcore
σhalo)2, which gives a value of ∼ 39% for
the J-bandJ-band image and ∼ 41% for the Ks-bandKs-band image.
:::Do
::::you
:::::mean The standard stars FS 110, pP533-dD and pP338-cC were observed as thefor
photometric calibrationr, which were selected from Hawarden et al. (2001).:?:::::Note:
::::::::according
::to
:::an
:::::online
::::::search,
:::::these
:::are
::the
::::::correct
::::::names
::of
:::::these
:::::::standard
:::::stars.
:::::Please
:::::::confirm
:::that
::::you
:::::agree
::::with
:::this.
2.3 PSF Construction and Subtraction
Our goal with the high resolution AO images is to detect faint galaxies along the QSO sightline,as well as the faint extended host galaxy hidden in the glare of light from the central bright QSOlight.
::Do
::::you
:::::mean
:Therefore, it is mandatory to estimate properlyproperly estimate the AO PSF
and subtract the light contribution from the bright central point source ofin the QSO images, in orderto unveil the underneath faint objectsthe faint objects underneath, and to reduce their bad effects totheirin photometric measurements.
:?
For the deep Ks-bandKs-band images, the PSF calibration star was observed as we have de-scribed in Section 2.2. Thus, we can create a PSF using interleaved exposures of the PSF calibrationstar between QSO observations in two ways as following:as follows.
(1):::Do
:::you
:::::mean
:Firstly, we constructed a sigma-clipping averaged PSF from the series of star
images that used PSF calibration star images.:? To detect the host galaxy, we subtracted the PSF from
the QSO image using a very conservative and simple method, which is the same as other studies onthe high-zhigh-z QSO host galaxies. We scaled the PSF flux to the QSO central peak intensityand aligned them. Such a method implies an oversubtraction of the nuclear component from theinner region, and provides a model independent host detection and a lowlower limit on the hostflux (Sanchez et al. 2004).
:::Do
:::you
:::::mean
:After PSF subtraction, tThe PSF subtracted residual image
of this bright QSO in the Ks-band wasis shown in Figure 3 (right). The contour plots of the PSFsubtracted QSO images after PSF subtraction for each observing night ofduring Sept. 17 - Sept. 19,

6 Y. P. Wang et al.
Table 1 Observed QSO, PSF Star and the Guide Star
Obj. Type RA(J2000) Dec(J2000) z Rmag texp(hrsh)a FWHMb KcsKsc GS(d)d
UM 402 RQQ 02 09 50.71 –00 05 06.6 2.855 15.8 3.0 0.13 14.54 31PSF star 02 09 54.51 –00 05 34.0 16.6 1.0 0.11 15.47 30Guide star 02 09 52.84 –00 05 15.2 13.8
Notes: a Good exposure times; b::Do
:::you
::::mean
:Image quality as measured asby the FWHM for the coadded Ks
images of all good exposures in arcseconds;:? c Observed K magnitude of the target for the coadded KsKs images;
d Distance in arcsec from the QSO (PSF star) to the Gguide star.
as well as the coadded residual images offrom all three nights, are shown in Figure 4 and Figure 5(left).
:?
(2):::Do
::::you
:::::mean Secondly, we applied a principale component analysis (PCA) based on the
Karhunen-Loeve (KL) transform to construct a PSF from the series of interleaving exposures of thecalibration star (Karhunen 1947; Loeve 2006).
:? This algorithm is adopted to quantify the modes
in which the PSF varies with time by a basis function that characterizes the temporal variationsof the calibration star as well as the QSO images (Chun et al. 2006; Soummer et al. 2012). A ∼2′′. .5′′ × 2′′. .5′′ region centered on each reduced frame of the calibration star image was selected asa search area, which is considered to be free from any other astronomical signal. We computed thebasis function by calculating the KL transform of the set of calibration PSFs over the ensemble ofsearching areas. The first 20 modes with the largest eigenvalues of the basis function were selectedto construct athe best estimation of the actual PSF of the QSO image from the projection of the QSOimage on the KL basis. We understand that the light from the QSO host galaxy or absorbing galaxiesmight be mistakenly interpreted as components of the PSF, and thus be oversubtracted from the QSOimage. Detailed simulation and discussion onof this point will be presented byin our next paper (Heet al. in preparation). In this work, we simply scale the QSO and the PSF model to make their peakfluxes to be equal. In this way, it is consistent with the analysis using the first approach, as wellas previous studies on high-zhigh-z QSO host galaxies. The results of this analysis wereare shownin Figure 4 and Figure 5 (right).
::Do
::::you
:::::mean We noticed that the residuals of the PSF subtracted
images are mostly similar in theterms of morphological structure for the two different approachesofto PSF reconstruction, as well as among three consecutive observing nights, although slightlyshrinkedshrunk in the case of the principle component analysisPCA. We thus considerbelieve thatthe host galaxy of this bright radio-quiet QSORQQ towards the peak epoch of galaxy formation atz ∼ 3 has been marginally resolved.
:?
In the interest of obtaining onlyonly obtaining the J − Ks color of the resolved objects alongthe QSO sightline, the PSF calibration star was not observed exclusively for the deep J-bandJ-bandimaging using IRCS+AO188, during the service run on Oct.5, 2012(UTC)2012 October 5 (UTC)
::Do
::::you
:::::mean
:::::“UT”
::or
::::::“UTC”
:::::here?
::::::Please
:::::check
::::that
:::the
::::way
:::::times
:::are
::::::::expressed
::is
:::::::::consistent
::in
::::your
:::::article. Given that IRCS J-bandJ-band imaging is looking at the wavelength blueward of the
4000 A Balmer break, we assume that the extended emission from the host galaxy of this QSO isnegligible within 2hr2h exposures.
:::Do
:::you
:::::mean
:In this case, a PSF could be constructed from the
series of QSO images after carefully masking out the resolved faint galaxies in the QSO field, usinga principle component analysisPCA.
:? We finally subtracted the model PSF from the coadded QSO
image in a similar way toas the one we used for the Ks-band images. The PSF subtracted QSOimage in the J-band is shown in Figure 3 (left)
::Do
::::you
:::::mean
:::::upper
::::left?.

AO Deep Imaging of QSO UM 402 Field 7
2.4 Archived WFC3/F140W Images
WFC3/F140W imaging of this QSO field with the HSTHST is available from the MAST archive (PI:Dawn Erb, HSTHST proposal ID 12471).
:::Do
:::you
:::::mean The IR wide F140W filter (1.2–1.6µm) cov-
ers the gap between the J and H bandJ and H band which is inaccessible from the ground. The pixelscale of WFC3 images is 0′′. .13′′/pixel. We retrieved the four calibrated, flat-fielded four exposuresfrom the archive (2two orientations offor a single orbit, and 2two dithers for each orientation), wherethe exposure time is 202.934 seconds for each exposure.
:? Thus, the total exposure time is 811.736
seconds for the WFC/F140W images.
:::Do
::::you
:::::mean
:We reduced the WFC3/F140W images inusing two situationsmethods: 1)
combined directly combining the 4four frames after de-rotating the two dithereding frames offromthe second orientation by 30 degrees and aligning all the four frames (see Fig. 2 bottom); 2)performedapplying PSF subtraction to the QSO images in the classical method presented by Rajanet al. (2011). Specifically, we generated one QSO image by combining the two aligned two dithersoffrom each orientation. A PSF image was constructed by median combinecombining ofthe alignedframes of other orientations, and subtractinged from the QSO image. The PSF subtracted QSO im-ages were combined into a final image after de-rotating the second orientation by 30 degrees.? Weshow the processed coadded images in Figure 3 (bottom).
3 ANALYSIS
3.1 Galaxies Near the QSO Sightline and the Luminosity
The high resolution images in the J& and Ks bands, as well as the WFC3/F140W filter, have twoclearly resolved two galaxies within a ∼ 5′′× 5′′field around UM 402 (see Fig. 2). They are a fuzzygalaxy about 4′′. 7 southern4.7′′ south of the QSO, and a close object ∼ 2′′. 4 northern∼ 2.4′′ northof the QSO sightline. In the deep Ks-band images (Fig. 2 upper right), the faint object which lies∼ 2′′. 4 northern∼ 2.4′′ north of the QSO sightline, appears as a double system with a separationofbetween the two components of ∼ 0′′. 3∼ 0.3′′. Meanwhile, there seems to be a faint tidal-tail likefeature towards the southeast forof the left component of this double system, suggesting a possiblemerging system for this object.
:::Do
:::you
:::::mean
:The fuzzy galaxy southernsouth of the QSO sightline
has been detected by the Sloan Digital Sky Survey (SDSS) and other optical deep imaging projectsas a nearby irregular galaxy at z ∼ 0.36 (Le Brun et al. 1993; Guillemin & Bergeron 1997).
:?
:::Do
:::you
:::::mean
:Using the program SExtractor, we measured the photometry of this faint object
in the coadded and PSF subtracted images of all three datasets shown in Figure 3, with a detectionthreshold of 2.5σ over the sky level for the Ks-band image, a detection threshold of 2σ for theWFC3/F140W image, as well as a 1.5σ detection threshold for the deep J-bandJ-band imaging.
:?
The photometric results of this faint galaxy measured with a small diameter aperture (0′′. 60.6′′) anda large diameter aperture (1′′. 21.2′′) are presented in Table 2.
:::Do
:::you
:::::mean However, we noticed that
the accuracy onof PSF subtraction would cause systematics errors toin the photometry of the faintobjects along the QSO sightline.
:?
:::Do
:::you
:::::mean
:For a more reliable photometric measurement againstwithout contamination from
a neighboring contaminationQSO in the QSOa nearby field, we also performedapplied athe 2-Ddecomposition algorithm GALFIT onto the coadded Ks-band image, where the QSO(moffat)
::::Our
:::::::editorial
::::staff
::::does
:::not
:::::::::understand
::::why
:::you
:::::write
:::::::::“(moffat)”
::::here.
::Is
:::this
::::::::supposed
::to
:::be
:a:::::::::reference?
:If::::
so,::::::please
::::give
:::::more
:::::::detailed
:::::::::::information,
::::like
::::the
:::::::author’s
:::::name
::::and
:::::year
::of
:::::::::::publication.
:::::::::Otherwise,
::::::explain
::::what
::::this
:::::means
:::::more
::::::clearly., and any other nearby galaxies (Seersic profiles) in
the field were fitted simultaneously to deblend everything togetherthe components, in order to reducethe contaminating flux from the wing in the PSF of the QSO (Peng et al. 2002).
:? The best fitting gives
an apparent magnitude of mk = 23.32± 0.05 for the faint galaxy which lies ∼ 2′′. 4 northern∼ 2.4′′

8 Y. P. Wang et al.
Fig. 1 Left:::Do
:::you
::::mean
:Finding chart offor the QSO, guide star (GS) and PSF calibration star from
the STScI POSS2UKSTU-Red;. Right: A dither-combined WFC3/F140W image of a region ofwitharea ∼ 2′ × 2′ around QSO UM 402, from one orientation in of a single orbit. The pixel scale is0′′. 130.13′′.? North is up and East is to the left.
Table 2 Photometric Results of the LLS Absorber Candidate
aper. diameter J app. mag. J abs. mag. F140W app. mag. F140W abs. mag. Ks app. mag. Ks abs. mag.
0.6′′ 26.40± 0.14 –20.21 24.01± 0.37 –22.60 24.25± 0.07 –22.001.2′′ 25.43± 0.10 –21.18 23.65± 0.32 –22.96 23.52± 0.05 –22.63
north of the QSO sightline, mostly consistent with the measurements using the SExtractor which wediscussed above.
:::Do
:::you
:::::mean
:To estimate the color of this faint object, we adopted the coadded and PSF sub-
tracted Ks-band image as the detection image and a detection threshold of µ = 2.5σ offor theskylevel background (Bertin & Arnouts 1996). The J −Ks colors were determined by re-runningthe SExtractor in the double-image mode, in which the faint object detected on the “detection image”(in the Ks-band) was measured with the same aperture inas the registered JJ-band image, giving aresult of (J −Ks)vVega ∼ 1.6.
:?
According to the impact parameter versus column density relation (b − logNHI) forall confirmed DLA and LLS absorbers given by Moller & Wallen (1998)Moller & Warren(1998), we suspect this close double system might be a candidate galaxy giving riseto the Lyman Limit absorption at zabs ∼ 2.5 previously seen in the QSO spectrum(NHI > 4.6× 1017 cm2NHI > 4.6× 1017 cm−2).
::Do
::::you
:::::mean Considering that the apparent KK-
band magnitude versus. stellar mass relation for objects at 2.3 < z < 2.6 from the MOIRCS DeepSurvey (MODS), this galaxy would have a stellar mass of ∼ 3× 10⁹ M⊙, at the low-mass end of theMODS sample (Tanaka et al. 2011).
:?
Further observations forof the spectroscopic redshift as well as kinematics of both componentsofin this faint object are strongly required.
:::Do
:::you
:::::mean
:If confirmed, it would be important high-z
evidence of a merging system at high-z that acts as a Lyman Limit absorber.:?
AO Deep Imaging of QSO UM 402 Field 9
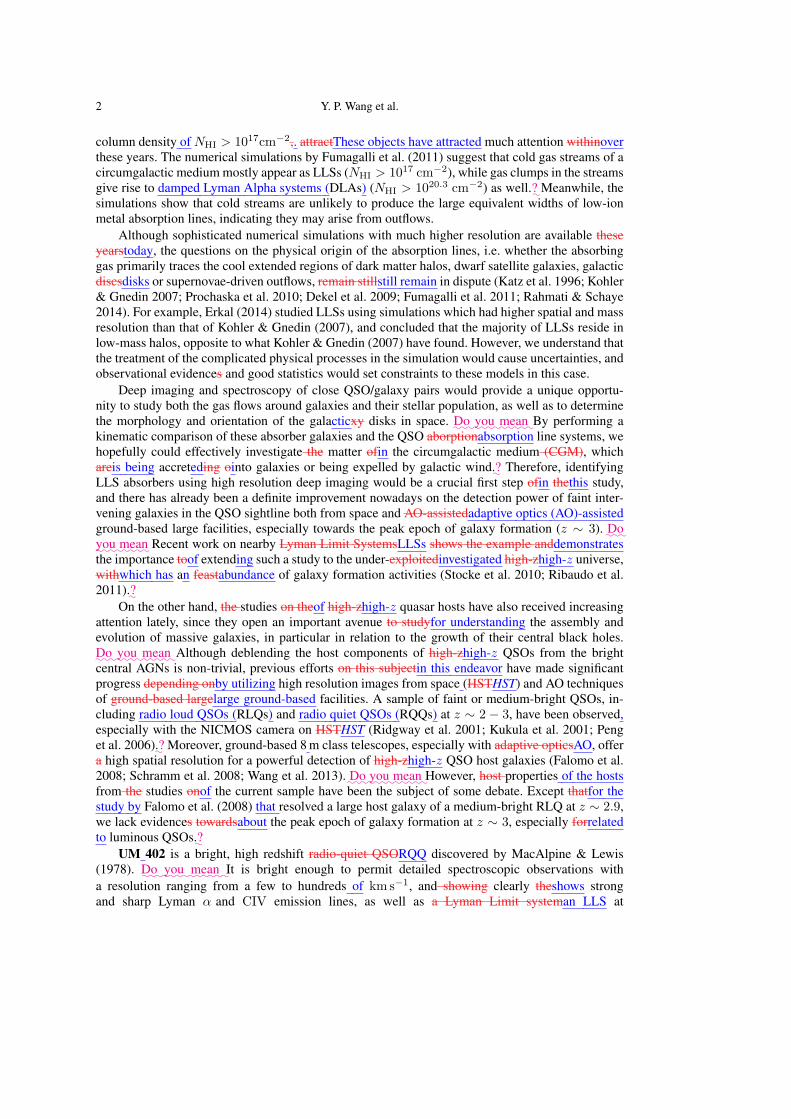
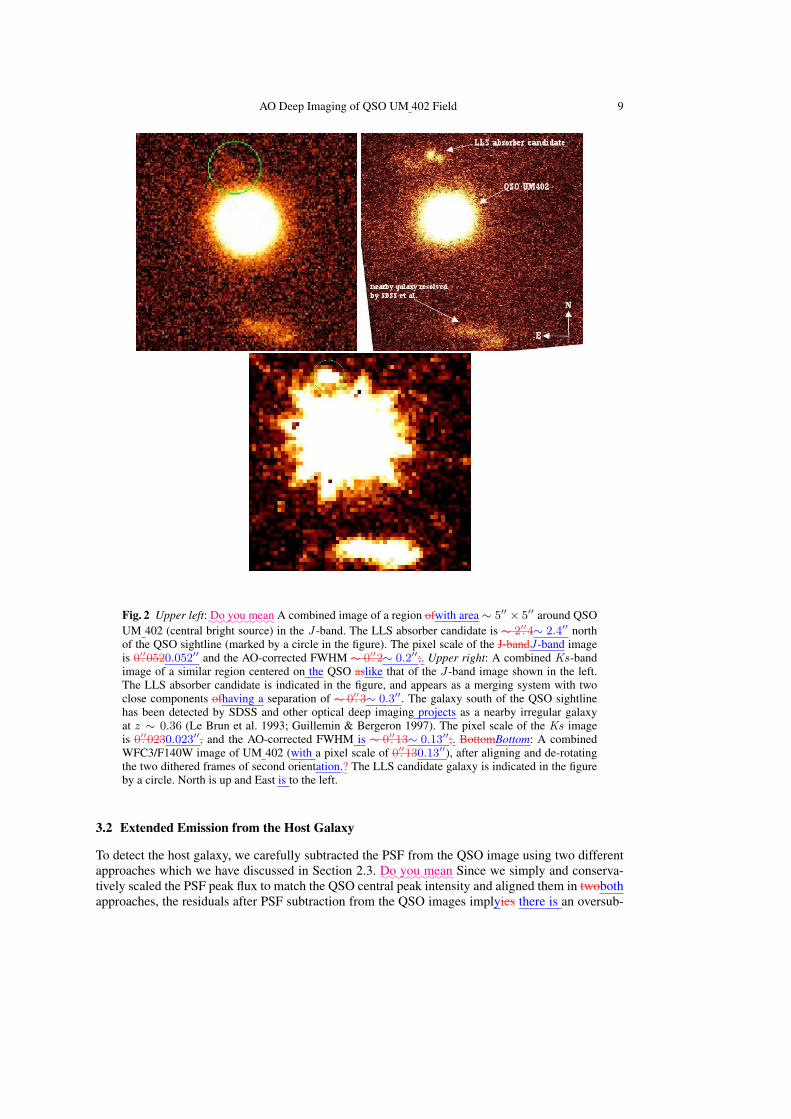
Fig. 2 Upper left:::Do
::::you
::::mean A combined image of a region ofwith area ∼ 5′′ × 5′′ around QSO
UM 402 (central bright source) in the J -band. The LLS absorber candidate is ∼ 2′′. 4∼ 2.4′′ northof the QSO sightline (marked by a circle in the figure). The pixel scale of the J-bandJ-band imageis 0′′. 0520.052′′ and the AO-corrected FWHM ∼ 0′′. 2∼ 0.2′′;. Upper right: A combined Ks-bandimage of a similar region centered on the QSO aslike that of the J-band image shown in the left.The LLS absorber candidate is indicated in the figure, and appears as a merging system with twoclose components ofhaving a separation of ∼ 0′′. 3∼ 0.3′′. The galaxy south of the QSO sightlinehas been detected by SDSS and other optical deep imaging projects as a nearby irregular galaxyat z ∼ 0.36 (Le Brun et al. 1993; Guillemin & Bergeron 1997). The pixel scale of the Ks imageis 0′′. 0230.023′′, and the AO-corrected FWHM is ∼ 0′′. 13∼ 0.13′′;. BottomBottom: A combinedWFC3/F140W image of UM 402 (with a pixel scale of 0′′. 130.13′′), after aligning and de-rotatingthe two dithered frames of second orientation.
:? The LLS candidate galaxy is indicated in the figure
by a circle. North is up and East is to the left.
3.2 Extended Emission from the Host Galaxy
To detect the host galaxy, we carefully subtracted the PSF from the QSO image using two differentapproaches which we have discussed in Section 2.3.
::Do
::::you
:::::mean Since we simply and conserva-
tively scaled the PSF peak flux to match the QSO central peak intensity and aligned them in twobothapproaches, the residuals after PSF subtraction from the QSO images implyies there is an oversub-

10 Y. P. Wang et al.
-0.3 -0.22 -0.14 -0.062 0.018 0.099 0.18 0.26 0.34 0.42 0.5-0.3 -0.22 -0.14 -0.062 0.018 0.099 0.18 0.26 0.34 0.42 0.5
-0.3 -0.22 -0.14 -0.062 0.018 0.099 0.18 0.26 0.34 0.42 0.5
Fig. 3 Upper left: A PSF subtracted and coadded J-band image (0′′. 052/pix0.052′′/pix) aroundQSO UM 402. The construction of the PSF model was described in the last paragraph of Section2.3;. Upper right: A PSF subtracted and coadded Ks-band image of a similar region centered onthe QSO as that of the J-band image shown in the left (0′′. 023/pix0.023′′/pix). We constructed anaveraged PSF from thea series of PSF star images as described in Section 2.3 (the first approach);.BottomBottom:
::Do
:::you
:::::mean
:A PSF subtracted and coadded WFC3/F140W image of UM 402
(0′′. 13/pix0.13′′/pix), after aligning and de-rotating the images after PSF subtractioned images.The PSF was constructed in a classical way by median combininge of the aligned frames of otherorientations (Rajan et al. 2011). The LLS candidate galaxy is indicated in the figure by a circle. Thefield of viewFOV of the image is ∼ 7′′. 5× 7′′. 5∼ 7.5′′ × 7.5′′.
:?
tracted nuclear component ofin the inner region, which is a model independent host detection of thehost and a lowlower limit on the host flux (Sanchez et al. 2004).
:?
:::Do
::::you
:::::mean
:The cContour plots of the extended emission from the coadded QSO images
after PSF subtractioned coadded QSO images in the Ks-band using the first approach described inSection 2.3 for each observing night from Sept. 17 - Sept. 19, as well as that of the PSF subtractedcoadded residual images of all three nights wereare given in Figure 4 (left) and Figure 5 (left).A lowlower limit offor the host magnitude was estimated to be mk = 22.3, mk = 23.2, mk =22.5 and mk = 22.4 for the images taken on Sept. 17–19 respectively, as well as thatthose offrom

AO Deep Imaging of QSO UM 402 Field 11
all three observing nights, by photometry on the PSF subtracted QSO image using the SExtractorpackageprogram (a diameter aperture of 1′′. 21.2′′).
:? The systematic errors on the photometry of
the host galaxy for different observing nights from Sept.17-19 reach about one magnitude. Thisindicates that PSF variation ofon different observing nights significantly affects the host detectionand its photometric measurement. On the other hand, a more reliable PSF reconstruction algorithmis required in this case.
In Figure 4 (right) and Figure 5 (right), we showed the contour plots of the extended emissionfrom the PSF subtracted coadded QSO images using the second approach introduced in Section2.3 for each observing night from Sept. 17 - Sept. 19, as well as that of all three nights. Here, amodel PSF was constructed using principle component analysis based on the Karhunen-Loeve (KL)transform, and was subtracted from the coadded Ks-band QSO images in a consistent way as thatof the first approach discussed in Section 2.3, in order to double-check the results. A low limit ofthe host magnitude was estimated to be mk = 23.6, mk = 23.3, mk = 23.4, and mk = 23.3 for theimages taken on Sept. 17-19 respectively, as well as that of all three observing nights, by photometryon the PSF subtracted QSO image using the SExtractor package (a diameter aperture of 1′′. 2).
:::::Note:
::::This
:::text
:::::::appears
::to
::be
::::::::repeated
::::from
:::the
::::::::previous
:::::::::paragraph.
::If
::::there
::is:::::::::something
::::::::different
::in
:::the
:::two
::::::::::paragraphs,
::::::please
::::point
::it:::out
:::::more
::::::clearly.
::Do
::::you
:::::mean
:We noticed that the measured host
magnitudes of the three consecutive observing nights are basically consistent, and the systematicerrors oin the photometric measurement of the host galaxy using a PSF reconstruction algorithmbased on the principle component analysis (PCA) are reduced by more than a half. This is probablybecause the PSF reconstrucedreconstructed using PCA would account for most of PSF’s temporalvariation, which might be smeared out in the case of an averagely combined PSF.
:?
:::Do
:::you
:::::mean
:We measured the radial profiles of the coadded images of the QSO and the PSF
star (r20 < 3.5 pix) using the STSDAS task ELLIPSE, after masking outidentifying the close com-panions. The radial profiles of the coadded QSO images offrom each observing night are comparedwith the PSF based on stellar profiles acquired during QSO exposures of that night, and thatthose ofthe coadded QSO and PSF exposures of all three nights, as well as their residuals are presented inFigure 4 and Figure 5 (middle).
:?
:::Do
:::you
:::::mean We noticed from Figure 4 and Figure 5 that the extended emission offrom the QSO
host galaxy at the radii > 0′′. 2> 0.2′′ is consistently resolved for almost all three nights using threedifferent analyses, indicating there is a marginally resolved host galaxy ofassociated with this brightradio quiet quasarRQQ towards the peak epoch of QSO activity. We can accept a roughly a lowlowerlimit ofon the host magnitude to be ∼ 23.3 based on the analyses whichthat we have discussed.
:?
Finally, we zoomed out the contour plot on the left bottom of Figure 5, to provide a largersize offor the PSF subtracted residual image after PSF subtraction with the faint LLS candidategalaxy visible in the field of viewFOV. The LLS candidate galaxy is seen at the bottom of the plot,∼ 2′′. 4∼ 2.4′′ below the extended emission of the quasar host.
4 SUMMARY
::Do
::::you
:::::mean We have presented analyses of adaptive optics deep images in the J & and Ks bands
centered on QSO UM 402 at zem = 2.856 using the IRCS camera and the AO systems on the Subarutelescope, as well as the WFC3/F140W archived images of this object.
:?
A faint galaxy (∼ 2′′. .4′′ north of the QSO sightline) has been clearly resolved by all threehigh resolution datasets. Especially forin the deep Ks-imaging, it appears asto be a double systemwith a separation of the two components ∼ 0′′. 3′′, while; the faint tidal-tail like feature from theleft component of the double system indicates that it is probably a merging system. According tothe empirical relation onof the impact parameter versus. the neutral hydrogen column density ofall confirmed DLA and LLS absorbers given by Moller & Warren (1998), as well as its red color(J−Ks)vVega ∼ 1.6(J −Ks)vVega ∼ 1.6, we suspect that this faint object might be a candidate

12 Y. P. Wang et al.
Contours of PSF subtracted residual image on Sept.17
-0.6 -0.4 -0.2 0.0 0.2 0.4 0.6Column (arcsec)
-0.6
-0.4
-0.2
0.0
0.2
0.4
0.6
Row
(ar
csec
)
20
22
24
26
0 0.1 0.2 0.3 0.4 0.5 0.6 0.7 0.8
µ (
ma
g/a
rc2)
QSOPSF
-1
-0.5
0
0.5
1 0 0.1 0.2 0.3 0.4 0.5 0.6 0.7 0.8
∆ µ
a(arcsec)Contours of PSF subtracted residual image on Sept.17
-0.6 -0.4 -0.2 0.0 0.2 0.4 0.6Column (arcsec)
-0.6
-0.4
-0.2
0.0
0.2
0.4
0.6
Ro
w (
arc
sec)
Contours of PSF subtracted residual image on Sept.18
-0.6 -0.4 -0.2 0.0 0.2 0.4 0.6Column (arcsec)
-0.6
-0.4
-0.2
0.0
0.2
0.4
0.6
Row
(ar
csec
)
20
22
24
26
0 0.1 0.2 0.3 0.4 0.5 0.6 0.7 0.8
µ (
ma
g/a
rc2)
QSOPSF
-1
-0.5
0
0.5
1 0 0.1 0.2 0.3 0.4 0.5 0.6 0.7 0.8
∆ µ
a(arcsec)
Contours of PSF subtracted residual image on Sept.18
-0.6 -0.4 -0.2 0.0 0.2 0.4 0.6Column (arcsec)
-0.6
-0.4
-0.2
0.0
0.2
0.4
0.6
Ro
w (
arc
sec)
Fig. 4 Left: From top to bottom, we show the plots of the extended emission of the quasar hostrevealed after subtracting a PSF from the combined Ks-band images taken on Sept. 17 –19 respec-tively, and thatthose of all three nights. The PSF was contructedconstructed by averaging the PSFstar images using an outlier rejection algorithm;. MiddleMiddle: The observed radial surface bright-ness profiles of the QSO (red pluses) and the PSF star (green crosses) are shown from top to bottom,for the coadded good images of each observing night from Sept. 17 to Sept. 19, as well as thatthoseof all three observing nights;. Right:
:::Do
:::you
::::mean
:From top to bottom, we show the plots of the
extended emission from the PSF subtracted good QSO images after PSF subtraction using approach2) in Section 2.3 for each observing night from Sept. 17 - Sept. 19, as well as thatthose of all threenights. The PSF was constructed from the series of PSF star images using principle componentanalysisPCA.
:? The contour levels are from pixel values of –0.5 to 3.5 in counts, with an interval of
0.2. We plot out the negative contours in dashed lines.

AO Deep Imaging of QSO UM 402 Field 13
Contours of PSF subtracted residual image on Sept.19
-0.6 -0.4 -0.2 0.0 0.2 0.4 0.6Column (arcsec)
-0.6
-0.4
-0.2
0.0
0.2
0.4
0.6
Row
(ar
csec
)
20
22
24
26
0 0.1 0.2 0.3 0.4 0.5 0.6 0.7 0.8
µ (
ma
g/a
rc2)
QSOPSF
-1
-0.5
0
0.5
1 0 0.1 0.2 0.3 0.4 0.5 0.6 0.7 0.8
∆ µ
a(arcsec)Contours of PSF subtracted residual image on Sept.19
-0.6 -0.4 -0.2 0.0 0.2 0.4 0.6Column (arcsec)
-0.6
-0.4
-0.2
0.0
0.2
0.4
0.6
Ro
w (
arc
sec)
Contours of PSF subtracted residual image of all three nights
-0.6 -0.4 -0.2 0.0 0.2 0.4 0.6Column (arcsec)
-0.6
-0.4
-0.2
0.0
0.2
0.4
0.6
Row
(ar
csec
)
20
22
24
26
0 0.1 0.2 0.3 0.4 0.5 0.6 0.7 0.8
µ (
ma
g/a
rc2)
QSOPSF
-1
-0.5
0
0.5
1 0 0.1 0.2 0.3 0.4 0.5 0.6 0.7 0.8
∆ µ
a(arcsec)
Contours of PSF subtracted residual image of all three nights
-0.6 -0.4 -0.2 0.0 0.2 0.4 0.6Column (arcsec)
-0.6
-0.4
-0.2
0.0
0.2
0.4
0.6
Ro
w (
arc
sec)
Fig. 5 Fig. 4 continued.:If:::
the::::plots
:::are
:::Fig.
::4::::::::continued
::::from
::the
:::::::previous
:::::figure,
::::they
:::::should
:::be
:::::named
:::Fig.
:4::::::instead
::of
:::Fig.
::5.
:::::Please
:::::adjust
::the
::::text
:::::::::accordingly.

14 Y. P. Wang et al.
Contours of PSF subtracted image of all three nights
-3 -2 -1 0 1 2 3Column (arcsec)
-3
-2
-1
0
1
2
3
Row
(ar
csec
)
Fig. 6::Do
:::you
:::::mean The contour plot of a region ofwith area ∼ 6′′× 6′′centered on QSO UM 402
in the Ks-band, after subtracting a PSF from the co-added images of all three observing nights. ThePSF was contructedconstructed by coadding the series of nested exposures of the PSF star using anoutlier rejection algorithm (the first approach ofdescribed in Sect. 2.3).
:? The extended emissions of
the quasar host are marginally revealed, and the LLS candidate galaxy is visible at the bottom of theplot (∼ 2′′. 4∼ 2.4′′ below the extenedextended emission offrom the quasar host).
::Do
:::you
::::mean
:The
orientation, as well as the contour levels and interval offor:::::Note:
:::::::according
::to:::the
:::::::::::understanding
::of
::our
:::::::editorial
::::staff,
:::::::“contour
:::::levels”
:::and
::::::::“interval”
:::are
::::::basically
:::the
::::same
:::::thing.
::If
:::our
::::::::::interpretation
:is:::not
::::::correct,
:::::please
::::::explain
:::your
:::::::meaning
::::more
::::::clearly. the plot are the same as those of Figures 4
and 5. South is up, and East is to the left.:?:::The
:::last
::::word
::in
::the
:::top
::::label
:is::::::‘nights’
::::::instead
::of
::::::‘nighs’.
galaxy giving rise to the Lyman Limit absorption at zabs = 2.531 previously seen in the QSOspectrum. If the redshift and the kinematics of both components ofin the double system are spectro-scopically confirmed in the future, it would be an important high-z evidence of a merging system athigh-z that acts as thea Lyman Limit absorber.
After carefully subtracting the PSF using two different approaches to PSF reconstructionapproaches, we are able to see marginallymarginally see the extended emission from the quasarhost galaxy. Since we simply and conservatively scaled the PSF peak flux to match the QSO centralpeak intensity and aligned them in both approaches, we would obtain an oversubtracted extendedemission from the quasar host, and can only place a lower limit foron the host flux.
Although the PSF subtracted residual images after PSF subtraction are mostly similar in terms ofthe morphological structure for the two adopted approaches to PSF construction approaches, as wellas among three consecutive observing nights, we noticed that different PSF subtraction algorithms

AO Deep Imaging of QSO UM 402 Field 15
would have large systematic errors on the photometry of the extended host emission. The systematicerrors oin the photometry of the extended host galaxy amongduring three consecutive observingnights from Sept. 17-19, using the first approach of Section 2.3, reach about one magnidemagnitude,where the PSF was constructed by averagelyaveraging the coadded interleaving exposures of thePSF star.
::Do
::::you
:::::mean
:On the other hand, a more reliable PSF reconstruction algorithm, such as
PCA (the second approach ofdescribed in Sect. 2.3), presented a relatively consistent photometricmeasurement for the host galaxy amongfor the three consecutive observing nights, and possiblyplace a lower limit of mk = 23.3 for the host galaxy (see the detailed discussion in Sect. 3.2).
:?
Further analyses and simulations on how to properly estimate properties of the host properties arebeing developed and will be presented byin our next work (He et al. in preparation).
Acknowledgements::Do
::::you
:::::mean
:This project/publication was made possible through the sup-
port of a grant from the John Templeton Foundation and the National Astronomical Observatories,of the Chinese Academy of Sciences. The opinions expressed in this publication are those ofthe author(s) and do not necessarily reflect the views of the John Templeton Foundation or theNational Astronomical Observatories, of the Chinese Academy of Sciences.
:? The funds from the
John Templeton Foundation were awarded in a grant to The University of Chicago, which alsomanaged the program in conjunction with the National Astronomical Observatories, the ChineseAcademy of Sciences. YPW would like to thank Dr. Chien Peng for the support on the GALFITfitting process. YPW acknowledges the Subaru team and Dr. Yosuke Minowa for the hospitality, andNational Scientific Fundation of China (NSFC,the National Natural Science Foundation of China(Grant Nos. 10173025, 10673013 and 10778709) and the Chinese 973 project (the National BasicResearch Program of China (973 Program, TG 2000077602
::::This
::is
:::not
:a:::::::regular
:::973
:::::grant
:::::::number.
:::::Please
::::::check. ).
:? We would like to thank our referee Dr. Michael Strauss for the helpful comments.
References
Bertin, E., & Arnouts, S. 1996, A&AS, 117, 393Cheun, M. R., Gharanfoli, S., Kulkarni, V. P., & Takamiya, M. 2006, AJ, 131, 686Dekel, A., Birnboim, Y., Engel, G., et al. 2009, Nature, 457, 451Erkal, D. 2014, arXiv:1401.6705Falomo, R., Treves, A., Kotilainen, J. K., Scarpa, R., & Uslenghi, M. 2008, ApJ, 673, 694Fumagalli, M., Prochaska, J. X., Kasen, D., et al. 2011, MNRAS, 418, 1796Guillenmin, P., & Bergeron, J. 1997, A&A, 328, 499Hawarden, T. G., Leggett, S. K., Letawsky, M. B., Ballantyne, D. R., & Casali, M. M. 2001, MNRAS, 325,
563Kamann, N. 2008, Observing Quasars with Adaptive Optics, PhD thesis, Diplomarbeit of Universitat Potsdam,
“Observing Quasars with Adaptive Optics”Karhunen, K. 1947, Uber lineare Methoden in der Wahrscheinlichkeitsrechnung, Ann. Acad. Science. Fenn,
Ser. A.I., Vol. 37, 1Katz, N., Weinberg, D. H., Hernquist, L., & Miralda-Escude, J. 1996, ApJ, 457, L57Kobayashi, N., Tokunaga, A. T., Terada, H., et al. 2000, in Society of Photo-Optical Instrumentation Engineers
(SPIE) Conference Series, Vol. 4008, Optical and IR Telescope Instrumentation and Detectors, ed. M. Iye &A. F. Moorwood, 1056
Kohler, K., & Gnedin, N. Y. 2007, ApJ, 655, 685Kuhlbrodt, B., Orndahl, E., Wisotzki, L., & Jahnke, K. 2005, A&A, 439, 497Kukula, M. J., Dunlop, J. S., McLure, R. J., et al. 2001, MNRAS, 326, 1533Le Brun, V., Bergeron, J., Boisse, P., & Christian, C. 1993, A&A, 279, 33Loeve, M. 2006, in Processes Stochastigues et Mouvement Brownien, ed. P. Levy (Paris: Hermann)
Some/all of the data presented in this paper were obtained from the Mikulski Archive for Space Telescopes (MAST). STScI is operated by the Association of Universities for Research in Astronomy, Inc., under NASA contract NAS5-26555. Support for MAST for non-HST data is provided by the NASA Office of Space Science via grant NNX13AC07G and by other grants and contracts."
"

16 Y. P. Wang et al.
MacAlpine, G. M., & Lewis, D. W. 1978, ApJS, 36, 587Minowa, Y. 2008, Subaru Data Reduction Cook Book: Imaging Observation with IRCS
:::Can
:::not
:::::found
::::from
::::ADS,
::::::::validation
:is:::not
::::::::confirmed,
:::::please
::::::::AUTHOR
::::give
:a:::link
::or
:::pdf!
Moller, P., & Warren, S. J. 1998, MNRAS, 299, 661Peng, C. Y., Ho, L. C., Impey, C. D., & Rix, H.-W. 2002, AJ, 124, 266Peng, C. Y., Impey, C. D., Rix, H.-W., et al. 2006, ApJ, 649, 616Prochaska, J. X., O’Meara, J. M., & Worseck, G. 20092010, ApJ, 718, 392Rahmati, A., & Schaye, J. 2014, MNRAS, 438, 529Rajan, A., Soummer, R., Hagan, J., Gilliland, R., & Pueyo, L. 2011, “WFC3 Instrument Science Report
2011-07”High Contrast Imaging using WFC3/IR, Space Telescope WFC Instrument Science ReportRibaudo, J., Lehner, N., Howk, J. C., et al. 2011, ApJ, 473743, 207Ridgway, S. E., Heckman, T. M., Calzetti, D., & Lehnert, M. 2001, ApJ, 550, 122Sanchez, S. F., Jahnke, K., Wisotzki, L., et al. 2004, ApJ, 614, 586Sargent, W. L. W., Steidel, C. C., & Boksenberg, A. 1989, ApJS, 69, 703Schramm, M., Wisotzki, L., & Jahnke, K. 2008, A&A, 478, 311Soummer, R., Pueyo, L., & Larkin, J. 2012, ApJ, 755, L28Stocke, J. T., Keeney, B. A., & Danforth, C. W. 2010, PASA, 27, 256Takami, H., Takato, N., Hayano, Y., et al. 2004, PASJ, 56, 225Tanaka, I., Breuck, C. D., Kurk, J. D., et al. 2011, PASJ, 63, 415Wang, Y. P., Yamada, T., Tanaka, I., Iye, M., & Ji, T. 2013, in IAU Symposium, Vol. 292, ed. T. Wong & J. Ott,
195
http://www.naoj.org/Observing/DataReduction/index.html