high-resolution imaging in male germ cell-associated kinase...
TRANSCRIPT
SAccepted fo
From theA.T.M., T.Cand the ProFrancisco, SVision ScieBerkeley, Ca
�Young Ju
Hospital, Seo
Guangdong,Inquiries
University oFrancisco, C
32
High-resolution Imaging in Male GermCell–Associated Kinase (MAK)-related Retinal
Degeneration
YOUNG JU LEW*, NICHOLAS RINELLA, JIA QIN*, JOANNA CHIANG, ANTHONY T. MOORE,TRAVIS C. PORCO, AUSTIN ROORDA, AND JACQUE L. DUNCAN
� PURPOSE: To describe the characteristics of MAK-related retinal degeneration using optical coherencetomography angiography (OCTA) and adaptive opticsscanning laser ophthalmoscopy (AOSLO).� DESIGN: Cross-sectional study.� METHODS: Six patients with rod-cone degeneration anddisease-causing mutations inMAK were evaluated with vi-sual acuity, spectral-domain OCT, confocal AOSLO, andOCTA. Foveal avascular zone (FAZ) area, vessel densities,and perfusion densities of the superficial capillary plexus(SCP) and deep capillary plexus (DCP) in the central mac-ula in all 6 patients were compared with 5 normal subjects.Cone spacing was measured in 4 patients from AOSLO im-ages and compared with 37 normal subjects.� RESULTS: Patients ranged from 25 to 81 years of age(mean, 52 years). Visual acuity varied from 20/13 to 20/40D2, except in 1 patient with cystoid macular edema whosevision was 20/60L and 20/70D1. The SCP (P[ .012) andDCP (P [ .013) vessel density and perfusion density(P [.015 and .013, respectively) were significantly lowerin patients compared to normal subjects in the parafoveal re-gion 1.0–3.0 mm from the fovea, but were similar to normalsubjects within 1.0 mm of the fovea. The FAZ area was notsignificantly different fromnormal (allP‡ .24).Cone spacingwas normal at almost all locations in 2 patients with early dis-ease and increased in 2 patients with advanced disease.� CONCLUSIONS: Although retinal vascular densities arereduced and cone spacing is increased in advanced dis-ease, central foveal structure is maintained until latestages of disease, which may contribute to preservationof foveal vision in eyes with MAK-related retinal
upplemental Material available at AJO.com.r publication Oct 25, 2017.Departments of Ophthalmology (Y.J.L., N.R., J.Q., J.C.,.P., J.L.D.) and Epidemiology and Biostatistics (T.C.P.),ctor Foundation (T.C.P.), University of California, Sanan Francisco, California; and School of Optometry andnce Graduate Group, University of California, Berkeley,lifornia (A.R.).Lew is now at Department of Ophthalmology, Kim’s Eye
ul, South Korea. Jia Qin is now at FoshanUniversity, Foshan,
China.to Jacque L. Duncan, Department of Ophthalmology,f California, San Francisco, 10 Koret Way, K113, SanA 94143-0730; e-mail: [email protected]
© 2017 ELSEVIER INC. A
degeneration. (Am J Ophthalmol 2018;185:32–42. �2017 Elsevier Inc. All rights reserved.)
INHERITED RETINAL DEGENERATIONS CAUSE RELENTLESS,
progressive loss of vision through a variety of mechanisms,affecting photoreceptors, retinal pigment epithelial (RPE)
cells, and vascular perfusion of the retina or choroid. Retinitispigmentosa (RP) is one of themost common inherited retinaldegenerations; patients with RP typically present with nycta-lopia followed by progressive constriction of visual field andeventual loss of central vision.1–3 Inherited retinaldegenerations display heterogeneity in phenotype andgenotype.2 Well over 300 genes have been implicated so farand mutations in more than 80 genes have been associatedwith RP (https://sph.uth.edu/retnet/sum-dis.htm, accessedJuly 29, 2017).2,4
Histopathologic studies of eyes from subjects with RP,donated after death, show progressive loss of photoreceptorsand RPE cells, as well as extensive vascular and neural remod-eling in the retina and choroid.5–7 Although it is possible tostudy vascular changes in RP patients with fluorescein andindocyanine green angiography, both have thedisadvantages of exposure to intravenous dye, as well aslimited resolution incapable of imaging the finestcapillaries.8 Optical coherence tomography angiography(OCTA) noninvasively provides high-resolution images ofthe capillary network and the foveal avascular zone(FAZ).8,9 Quantification of microvascular structures such asvascular densities and avascular zone areas has been reportedusing OCTA in normal eyes and in various retinaldiseases.10–12 In RP, vascular densities of the superficial anddeep retinal capillary plexus are reported to be significantlydecreased compared to normal subjects.13–17
Adaptive optics scanning laser ophthalmoscopy(AOSLO) uses adaptive optics (AO) to compensate for op-tical aberrations, permitting observation of cellular struc-tures in living human eyes.18,19 Confocal AOSLO imagesreveal retinal microstructures that directly backscatterlight, such as the nerve fiber layer, photoreceptors, RPEcells, and retinal vasculature.18,20–22 AOSLO has beenused to characterize photoreceptor structure in healthyeyes and in eyes with inherited retinal degeneration.23–25
Autosomal recessive RP associated with mutations inthe male germ cell–associated kinase (MAK) gene is
0002-9394/$36.00https://doi.org/10.1016/j.ajo.2017.10.023
LL RIGHTS RESERVED.
associated with preservation of foveal vision even inadvanced stages of retinal degeneration despite similarrates of peripheral visual field loss to other forms of auto-somal recessive RP.7 However, cystoid macular edema(CME) and intraretinal cystoid spaces (ICS) can occur,which can reduce visual acuity.26 In mice,MAK is involvedin outer segment morphogenesis, regulation of connectingcilium length, and photoreceptor survival.27 MAK isexpressed in the inner segments, cell bodies, and axons ofhuman photoreceptors, including foveal cones.28 AlthoughMAK has not been identified in vascular tissues, RPE andchoriocapillaris atrophy have been reported in patientswith MAK-related RP.7,29 In this study we used high-resolution OCTA and AOSLO to investigate the hypoth-esis that preserved retinal vasculature and cone spacingnear the fovea may contribute to preservation of fovealvision in eyes with MAK-related RP.
METHODS
� STUDY PARTICIPANTS: The study and data collectionwere carried out with approval from the University of Cal-ifornia, San Francisco Institutional Review Board in a pro-spective manner. Informed consent was obtained and thestudy was in accordance with HIPAA regulations. Thisinstitutional, cross-sectional study included 5 patientsfrom 5 families with rod-cone degeneration and 1 asymp-tomatic sibling (I-2, 40126; sibling of I-1, 40116). Allsubjects underwent genetic testing, which revealeddisease-causing mutations in the MAK gene. Patientswere clinically evaluated, with visual acuity measured ac-cording to the Early Treatment Diabetic RetinopathyStudy (ETDRS) protocol,30 kinetic perimetry using a Gold-mann perimeter, full-field electroretinography according tothe International Society for Clinical Electrophysiology ofVision,31 color fundus photographs (TRC 50DX; TopconMedical Systems, Inc, Oakland, New Jersey, USA) in 4of the 6 patients; spectral-domain optical coherence to-mography (SDOCT) and infrared photographs in all 6 pa-tients; fundus autofluorescence fundus images (SpectralisHRAþOCT; Heidelberg Engineering, Vista, California,USA) in 1 of the 6 patients; and high-resolution retinal im-ages using a swept-source OCTA system, and a custom-designed confocal AOSLO as described below, in 4 of the6 patients. Five normal subjects were imaged for the vesseldensity analysis, while previously reported cone spacingdata from 37 normal eyes were used to compare withcone spacing measures from patients.32
� OPTICAL COHERENCE TOMOGRAPHY ANGIOGRAPHY:
OCTA was performed using a swept-source system (PLEXElite 9000; Carl Zeiss Meditec, Inc, Dublin, California,USA); the technical aspects of the system have beendescribed elsewhere.33 Briefly, the system provides
VOL. 185 HIGH-RESOLUTION IMAGING IN MAK
transverse imaging resolution of 15 mm, with a centralwavelength of 1060 nm and a speed of 100 000 A-scansper second. Three-dimensional OCTA slab images wereformed by scanning a 3 mm 3 3 mm area consisting of300 A-scans per B-scan, and 300 B-scans were obtainedin a horizontal raster pattern, with each B-scan repeated4 times consecutively with a scanning depth of 3 mmover 1536 pixels.Quantitative analyses of the FAZ and vessel density at the
level of the superficial capillary plexus (SCP) and deep capil-lary plexus (DCP)wereperformedusing customsoftware inor-der to binarize and skeletonize the images.10,12 To quantify thevessel densities, all OCTA images were exported into theAdvanced Retinal Imaging collaboration network portal(www.zeiss.com/arinetwork) (Tumlinson AR, et al. IOVS2017;58:ARVO E-Abstract 1864). A thresholdingalgorithm was applied to the SCP and DCP en face imagesto create a binary slab that assigns to each pixel a 1(perfused) or 0 (background). The skeletonized slab wascreated from this binary image. Using skeletonized imageswhere each blood vessel was shown as a 1-pixel-wide line,vessel densitywas defined as the total length of perfused vascu-lature per unit area in a region of measurement. It was calcu-lated by averaging regions of the skeletonized images inmm�1
[(pixels of vessels) 3 (3 mm/300 pixels)/(area in a region ofmeasurement in mm2)].10,34 The average of the skeletonizedslab is only a first-order estimate of the length of perfusedvasculature. A more accurate calculation would requireconsidering the relationship between neighboring pixelswith value 1 in the skeletonized slab. Perfusion density wascalculated as total area of perfused vessels observed per unitarea, producing a value ranging from 0 (nonperfused) to 1(fully perfused); typical perfusion density values remain below0.5. There may be sources of error in the perfusion densitymeasurement, including the large transverse resolution ascompared to the size of the smallest capillaries, and the sensi-tivity of the thresholding step in the binarization process tonoise in the image. In particular, perfusion density may notbe sensitive to changes in vessel caliber. But, vessels that arenonperfused should cause a reduction in the observed perfu-sion density, as well as the vessel density, so both measuresare expected to be reduced in the presence of capillary loss.To investigate foveal perfusion, we analyzed the central1.0 mm surrounding the center of the FAZ separately fromthe parafoveal ring extending from 1.0–3.0 mm from the cen-ter of the FAZ for both the SCP and the DCP, and alsoanalyzed the FAZ area, in patients and normal controls. TheFAZ area was manually outlined in SCP and DCP images,calculated as pixels and converted to mm2 [(pixels ofFAZ)3 (3 mm/300 pixels)2].10
� ADAPTIVE OPTICS SCANNING LASER OPHTHALMOS-COPY: High-resolution images of central macular coneswere obtained using confocal AOSLO. The AOSLO uses alow-coherence, 840-nm light source, a Shack-Hartmannwavefront sensor, and a 140-actuatormicroelectromechanical
33-RELATED RETINAL DEGENERATION
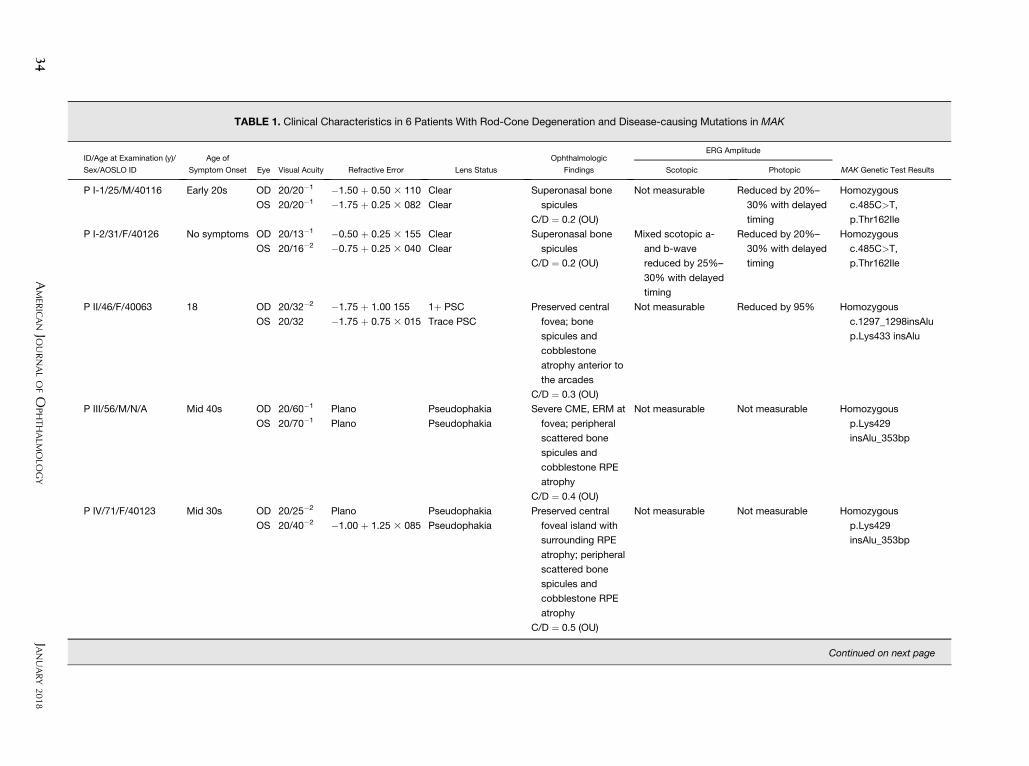
TABLE 1. Clinical Characteristics in 6 Patients With Rod-Cone Degeneration and Disease-causing Mutations in MAK
ID/Age at Examination (y)/
Sex/AOSLO ID
Age of
Symptom Onset Eye Visual Acuity Refractive Error Lens Status
Ophthalmologic
Findings
ERG Amplitude
MAK Genetic Test ResultsScotopic Photopic
P I-1/25/M/40116 Early 20s OD 20/20�1 �1.50 þ 0.50 3 110 Clear Superonasal bone
spicules
C/D ¼ 0.2 (OU)
Not measurable Reduced by 20%–
30% with delayed
timing
Homozygous
c.485C>T,
p.Thr162Ile
OS 20/20�1 �1.75 þ 0.25 3 082 Clear
P I-2/31/F/40126 No symptoms OD 20/13�1 �0.50 þ 0.25 3 155 Clear Superonasal bone
spicules
C/D ¼ 0.2 (OU)
Mixed scotopic a-
and b-wave
reduced by 25%–
30% with delayed
timing
Reduced by 20%–
30% with delayed
timing
Homozygous
c.485C>T,
p.Thr162Ile
OS 20/16�2 �0.75 þ 0.25 3 040 Clear
P II/46/F/40063 18 OD 20/32�2 �1.75 þ 1.00 155 1þ PSC Preserved central
fovea; bone
spicules and
cobblestone
atrophy anterior to
the arcades
C/D ¼ 0.3 (OU)
Not measurable Reduced by 95% Homozygous
c.1297_1298insAlu
p.Lys433 insAlu
OS 20/32 �1.75 þ 0.75 3 015 Trace PSC
P III/56/M/N/A Mid 40s OD 20/60�1 Plano Pseudophakia Severe CME, ERM at
fovea; peripheral
scattered bone
spicules and
cobblestone RPE
atrophy
C/D ¼ 0.4 (OU)
Not measurable Not measurable Homozygous
p.Lys429
insAlu_353bp
OS 20/70�1 Plano Pseudophakia
P IV/71/F/40123 Mid 30s OD 20/25�2 Plano Pseudophakia Preserved central
foveal island with
surrounding RPE
atrophy; peripheral
scattered bone
spicules and
cobblestone RPE
atrophy
C/D ¼ 0.5 (OU)
Not measurable Not measurable Homozygous
p.Lys429
insAlu_353bp
OS 20/40�2 �1.00 þ 1.25 3 085 Pseudophakia
Continued on next page
34
JANUARY
2018
AMER
ICANJO
URNALOFO
PHTHALM
OLO
GY
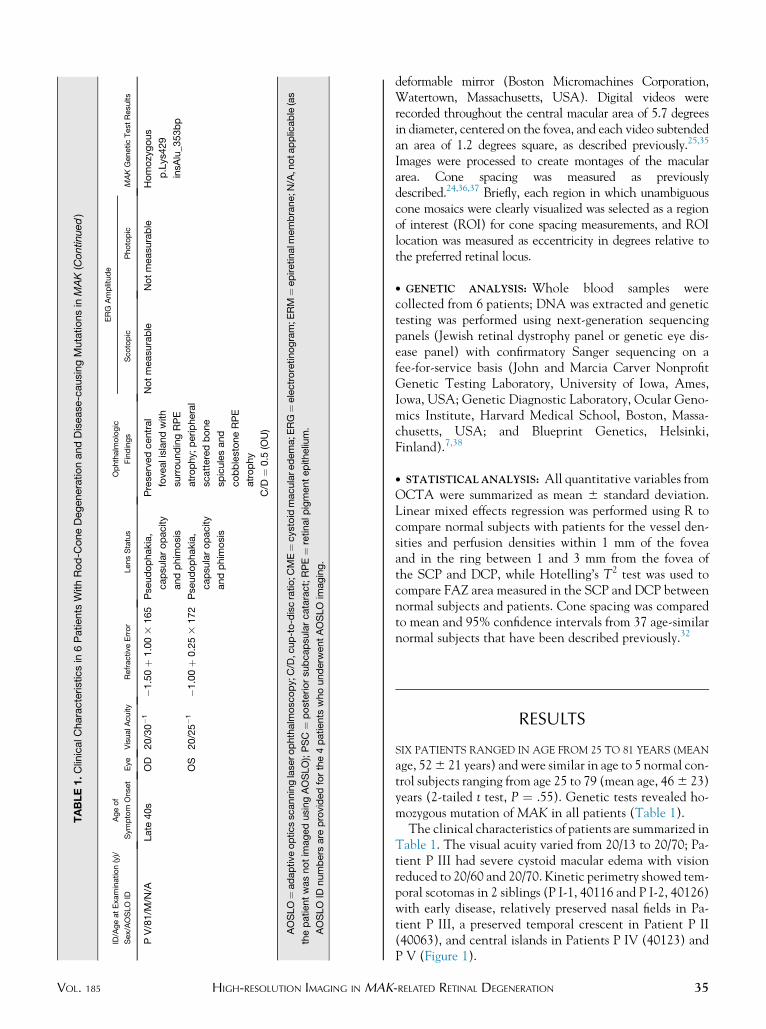
TABLE1.ClinicalC
haracteristicsin
6Patients
WithRod-C
oneDegenerationandDisease
-causingMutationsin
MAK(Continued)
ID/AgeatExamination(y)/
Sex/AOSLO
ID
Ageof
Symptom
Onset
Eye
VisualA
cuity
RefractiveError
LensStatus
Ophthalm
ologic
Findings
ERG
Amplitude
MAKGeneticTestResults
Scotopic
Photopic
PV/81/M
/N/A
Late
40s
OD
20/30�1
�1.50þ
1.003
165
Pseudophakia,
capsularopacity
andphim
osis
Preservedcentral
fovealislandwith
surroundingRPE
atrophy;peripheral
scatteredbone
spiculesand
cobblestoneRPE
atrophy
C/D
¼0.5
(OU)
Notmeasurable
Notmeasurable
Homozygous
p.Lys429
insAlu_353bp
OS
20/25�1
�1.00þ
0.253
172
Pseudophakia,
capsularopacity
andphim
osis
AOSLO¼adaptiveopticsscanninglaserophthalm
oscopy;C
/D,c
up-to-discratio;C
ME¼cystoid
macularedema;E
RG¼electroretinogram;E
RM
¼epiretinalm
embrane;N
/A,n
otapplicable(as
thepatientwasnotim
agedusingAOSLO);PSC
¼posteriorsubcapsularcataract;RPE¼
retinalpigmentepithelium.
AOSLO
IDnumbers
are
providedforthe4patients
whounderw
entAOSLO
imaging.
VOL. 185 HIGH-RESOLUTION IMAGING IN
MAKdeformable mirror (Boston Micromachines Corporation,Watertown, Massachusetts, USA). Digital videos wererecorded throughout the central macular area of 5.7 degreesin diameter, centered on the fovea, and each video subtendedan area of 1.2 degrees square, as described previously.25,35
Images were processed to create montages of the maculararea. Cone spacing was measured as previouslydescribed.24,36,37 Briefly, each region in which unambiguouscone mosaics were clearly visualized was selected as a regionof interest (ROI) for cone spacing measurements, and ROIlocation was measured as eccentricity in degrees relative tothe preferred retinal locus.
� GENETIC ANALYSIS: Whole blood samples werecollected from 6 patients; DNA was extracted and genetictesting was performed using next-generation sequencingpanels (Jewish retinal dystrophy panel or genetic eye dis-ease panel) with confirmatory Sanger sequencing on afee-for-service basis (John and Marcia Carver NonprofitGenetic Testing Laboratory, University of Iowa, Ames,Iowa, USA; Genetic Diagnostic Laboratory, Ocular Geno-mics Institute, Harvard Medical School, Boston, Massa-chusetts, USA; and Blueprint Genetics, Helsinki,Finland).7,38
� STATISTICALANALYSIS: All quantitative variables fromOCTA were summarized as mean 6 standard deviation.Linear mixed effects regression was performed using R tocompare normal subjects with patients for the vessel den-sities and perfusion densities within 1 mm of the foveaand in the ring between 1 and 3 mm from the fovea ofthe SCP and DCP, while Hotelling’s T2 test was used tocompare FAZ area measured in the SCP and DCP betweennormal subjects and patients. Cone spacing was comparedto mean and 95% confidence intervals from 37 age-similarnormal subjects that have been described previously.32
RESULTS
SIX PATIENTS RANGED IN AGE FROM 25 TO 81 YEARS (MEAN
age, 526 21 years) and were similar in age to 5 normal con-trol subjects ranging from age 25 to 79 (mean age, 466 23)years (2-tailed t test, P ¼ .55). Genetic tests revealed ho-mozygous mutation of MAK in all patients (Table 1).The clinical characteristics of patients are summarized in
Table 1. The visual acuity varied from 20/13 to 20/70; Pa-tient P III had severe cystoid macular edema with visionreduced to 20/60 and 20/70. Kinetic perimetry showed tem-poral scotomas in 2 siblings (P I-1, 40116 and P I-2, 40126)with early disease, relatively preserved nasal fields in Pa-tient P III, a preserved temporal crescent in Patient P II(40063), and central islands in Patients P IV (40123) andP V (Figure 1).
35-RELATED RETINAL DEGENERATION
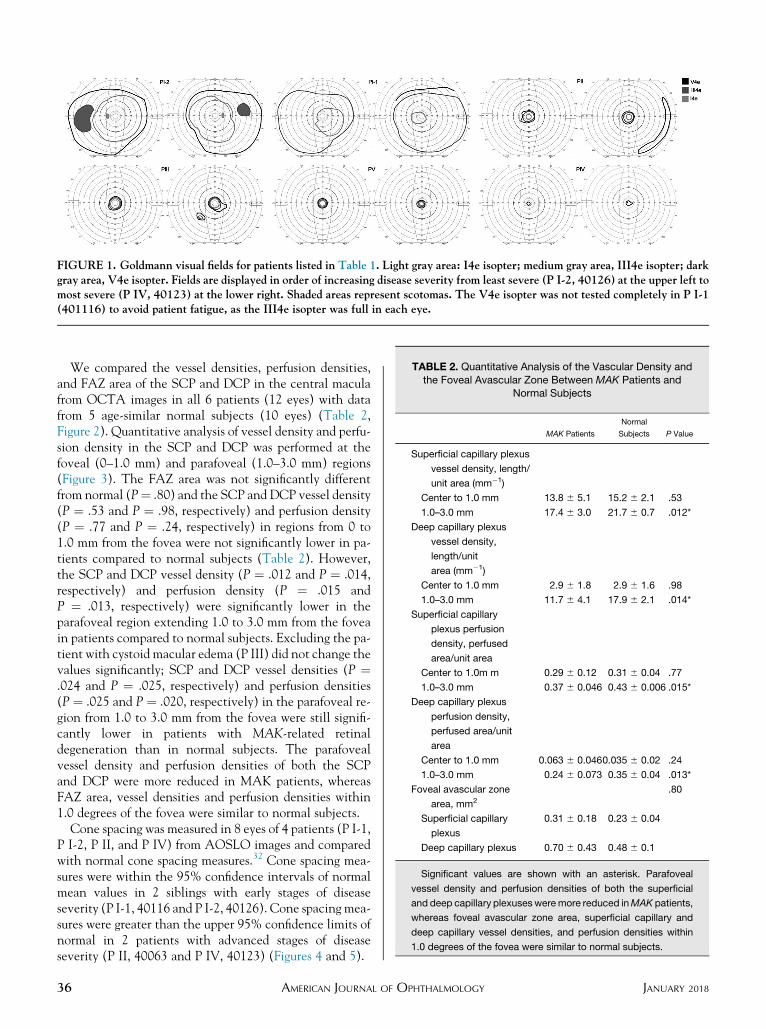
FIGURE 1. Goldmann visual fields for patients listed in Table 1. Light gray area: I4e isopter; medium gray area, III4e isopter; darkgray area, V4e isopter. Fields are displayed in order of increasing disease severity from least severe (P I-2, 40126) at the upper left tomost severe (P IV, 40123) at the lower right. Shaded areas represent scotomas. The V4e isopter was not tested completely in P I-1(401116) to avoid patient fatigue, as the III4e isopter was full in each eye.
TABLE 2. Quantitative Analysis of the Vascular Density and
the Foveal Avascular Zone Between MAK Patients andNormal Subjects
MAK Patients
Normal
Subjects P Value
Superficial capillary plexus
vessel density, length/
unit area (mm�1)
Center to 1.0 mm 13.8 6 5.1 15.2 6 2.1 .53
1.0–3.0 mm 17.4 6 3.0 21.7 6 0.7 .012*
Deep capillary plexus
vessel density,
length/unit
area (mm�1)
Center to 1.0 mm 2.9 6 1.8 2.9 6 1.6 .98
1.0–3.0 mm 11.7 6 4.1 17.9 6 2.1 .014*
Superficial capillary
plexus perfusion
density, perfused
area/unit area
Center to 1.0m m 0.29 6 0.12 0.31 6 0.04 .77
1.0–3.0 mm 0.37 6 0.046 0.43 6 0.006 .015*
Deep capillary plexus
perfusion density,
perfused area/unit
area
Center to 1.0 mm 0.063 6 0.0460.035 6 0.02 .24
1.0–3.0 mm 0.24 6 0.073 0.35 6 0.04 .013*
Foveal avascular zone
area, mm2
.80
Superficial capillary
plexus
0.31 6 0.18 0.23 6 0.04
Deep capillary plexus 0.70 6 0.43 0.48 6 0.1
Significant values are shown with an asterisk. Parafoveal
vessel density and perfusion densities of both the superficial
and deep capillary plexusesweremore reduced inMAK patients,
whereas foveal avascular zone area, superficial capillary and
deep capillary vessel densities, and perfusion densities within
1.0 degrees of the fovea were similar to normal subjects.
We compared the vessel densities, perfusion densities,and FAZ area of the SCP and DCP in the central maculafrom OCTA images in all 6 patients (12 eyes) with datafrom 5 age-similar normal subjects (10 eyes) (Table 2,Figure 2). Quantitative analysis of vessel density and perfu-sion density in the SCP and DCP was performed at thefoveal (0–1.0 mm) and parafoveal (1.0–3.0 mm) regions(Figure 3). The FAZ area was not significantly differentfrom normal (P¼ .80) and the SCP and DCP vessel density(P ¼ .53 and P ¼ .98, respectively) and perfusion density(P ¼ .77 and P ¼ .24, respectively) in regions from 0 to1.0 mm from the fovea were not significantly lower in pa-tients compared to normal subjects (Table 2). However,the SCP and DCP vessel density (P ¼ .012 and P ¼ .014,respectively) and perfusion density (P ¼ .015 andP ¼ .013, respectively) were significantly lower in theparafoveal region extending 1.0 to 3.0 mm from the foveain patients compared to normal subjects. Excluding the pa-tient with cystoid macular edema (P III) did not change thevalues significantly; SCP and DCP vessel densities (P ¼.024 and P ¼ .025, respectively) and perfusion densities(P ¼ .025 and P ¼ .020, respectively) in the parafoveal re-gion from 1.0 to 3.0 mm from the fovea were still signifi-cantly lower in patients with MAK-related retinaldegeneration than in normal subjects. The parafovealvessel density and perfusion densities of both the SCPand DCP were more reduced in MAK patients, whereasFAZ area, vessel densities and perfusion densities within1.0 degrees of the fovea were similar to normal subjects.
Cone spacing was measured in 8 eyes of 4 patients (P I-1,P I-2, P II, and P IV) from AOSLO images and comparedwith normal cone spacing measures.32 Cone spacing mea-sures were within the 95% confidence intervals of normalmean values in 2 siblings with early stages of diseaseseverity (P I-1, 40116 and P I-2, 40126). Cone spacing mea-sures were greater than the upper 95% confidence limits ofnormal in 2 patients with advanced stages of diseaseseverity (P II, 40063 and P IV, 40123) (Figures 4 and 5).
36 JANUARY 2018AMERICAN JOURNAL OF OPHTHALMOLOGY
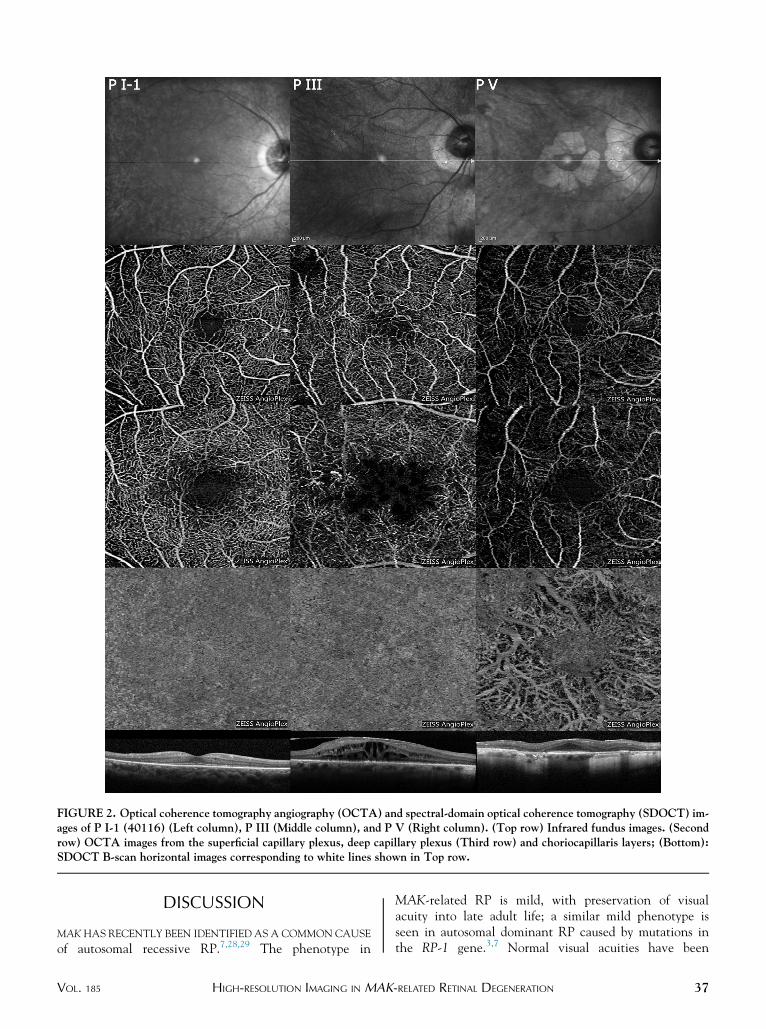
FIGURE 2. Optical coherence tomography angiography (OCTA) and spectral-domain optical coherence tomography (SDOCT) im-ages of P I-1 (40116) (Left column), P III (Middle column), and P V (Right column). (Top row) Infrared fundus images. (Secondrow) OCTA images from the superficial capillary plexus, deep capillary plexus (Third row) and choriocapillaris layers; (Bottom):SDOCT B-scan horizontal images corresponding to white lines shown in Top row.
DISCUSSION
MAKHAS RECENTLY BEEN IDENTIFIED AS A COMMONCAUSE
of autosomal recessive RP.7,28,29 The phenotype in
VOL. 185 HIGH-RESOLUTION IMAGING IN MAK
MAK-related RP is mild, with preservation of visualacuity into late adult life; a similar mild phenotype isseen in autosomal dominant RP caused by mutations inthe RP-1 gene.3,7 Normal visual acuities have been
37-RELATED RETINAL DEGENERATION
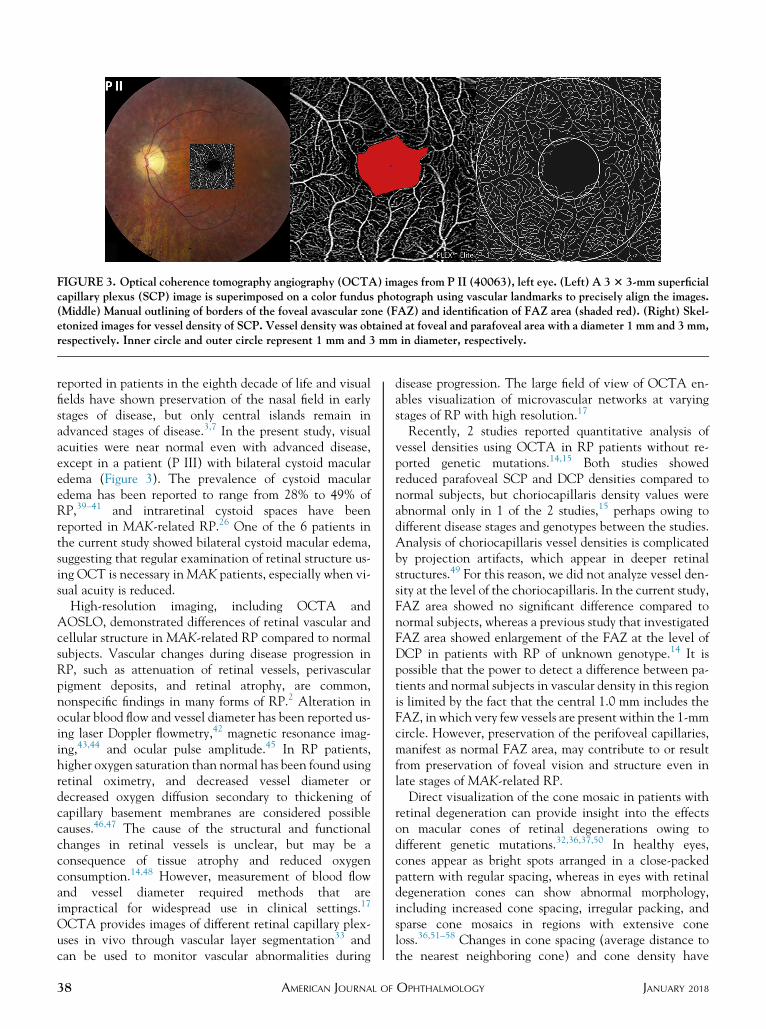
FIGURE 3. Optical coherence tomography angiography (OCTA) images from P II (40063), left eye. (Left) A 33 3-mm superficialcapillary plexus (SCP) image is superimposed on a color fundus photograph using vascular landmarks to precisely align the images.(Middle) Manual outlining of borders of the foveal avascular zone (FAZ) and identification of FAZ area (shaded red). (Right) Skel-etonized images for vessel density of SCP. Vessel density was obtained at foveal and parafoveal area with a diameter 1 mm and 3 mm,respectively. Inner circle and outer circle represent 1 mm and 3 mm in diameter, respectively.
reported in patients in the eighth decade of life and visualfields have shown preservation of the nasal field in earlystages of disease, but only central islands remain inadvanced stages of disease.3,7 In the present study, visualacuities were near normal even with advanced disease,except in a patient (P III) with bilateral cystoid macularedema (Figure 3). The prevalence of cystoid macularedema has been reported to range from 28% to 49% ofRP,39–41 and intraretinal cystoid spaces have beenreported in MAK-related RP.26 One of the 6 patients inthe current study showed bilateral cystoid macular edema,suggesting that regular examination of retinal structure us-ing OCT is necessary inMAK patients, especially when vi-sual acuity is reduced.
High-resolution imaging, including OCTA andAOSLO, demonstrated differences of retinal vascular andcellular structure in MAK-related RP compared to normalsubjects. Vascular changes during disease progression inRP, such as attenuation of retinal vessels, perivascularpigment deposits, and retinal atrophy, are common,nonspecific findings in many forms of RP.2 Alteration inocular blood flow and vessel diameter has been reported us-ing laser Doppler flowmetry,42 magnetic resonance imag-ing,43,44 and ocular pulse amplitude.45 In RP patients,higher oxygen saturation than normal has been found usingretinal oximetry, and decreased vessel diameter ordecreased oxygen diffusion secondary to thickening ofcapillary basement membranes are considered possiblecauses.46,47 The cause of the structural and functionalchanges in retinal vessels is unclear, but may be aconsequence of tissue atrophy and reduced oxygenconsumption.14,48 However, measurement of blood flowand vessel diameter required methods that areimpractical for widespread use in clinical settings.17
OCTA provides images of different retinal capillary plex-uses in vivo through vascular layer segmentation33 andcan be used to monitor vascular abnormalities during
38 AMERICAN JOURNAL OF
disease progression. The large field of view of OCTA en-ables visualization of microvascular networks at varyingstages of RP with high resolution.17
Recently, 2 studies reported quantitative analysis ofvessel densities using OCTA in RP patients without re-ported genetic mutations.14,15 Both studies showedreduced parafoveal SCP and DCP densities compared tonormal subjects, but choriocapillaris density values wereabnormal only in 1 of the 2 studies,15 perhaps owing todifferent disease stages and genotypes between the studies.Analysis of choriocapillaris vessel densities is complicatedby projection artifacts, which appear in deeper retinalstructures.49 For this reason, we did not analyze vessel den-sity at the level of the choriocapillaris. In the current study,FAZ area showed no significant difference compared tonormal subjects, whereas a previous study that investigatedFAZ area showed enlargement of the FAZ at the level ofDCP in patients with RP of unknown genotype.14 It ispossible that the power to detect a difference between pa-tients and normal subjects in vascular density in this regionis limited by the fact that the central 1.0 mm includes theFAZ, in which very few vessels are present within the 1-mmcircle. However, preservation of the perifoveal capillaries,manifest as normal FAZ area, may contribute to or resultfrom preservation of foveal vision and structure even inlate stages of MAK-related RP.Direct visualization of the cone mosaic in patients with
retinal degeneration can provide insight into the effectson macular cones of retinal degenerations owing todifferent genetic mutations.32,36,37,50 In healthy eyes,cones appear as bright spots arranged in a close-packedpattern with regular spacing, whereas in eyes with retinaldegeneration cones can show abnormal morphology,including increased cone spacing, irregular packing, andsparse cone mosaics in regions with extensive coneloss.36,51–58 Changes in cone spacing (average distance tothe nearest neighboring cone) and cone density have
JANUARY 2018OPHTHALMOLOGY
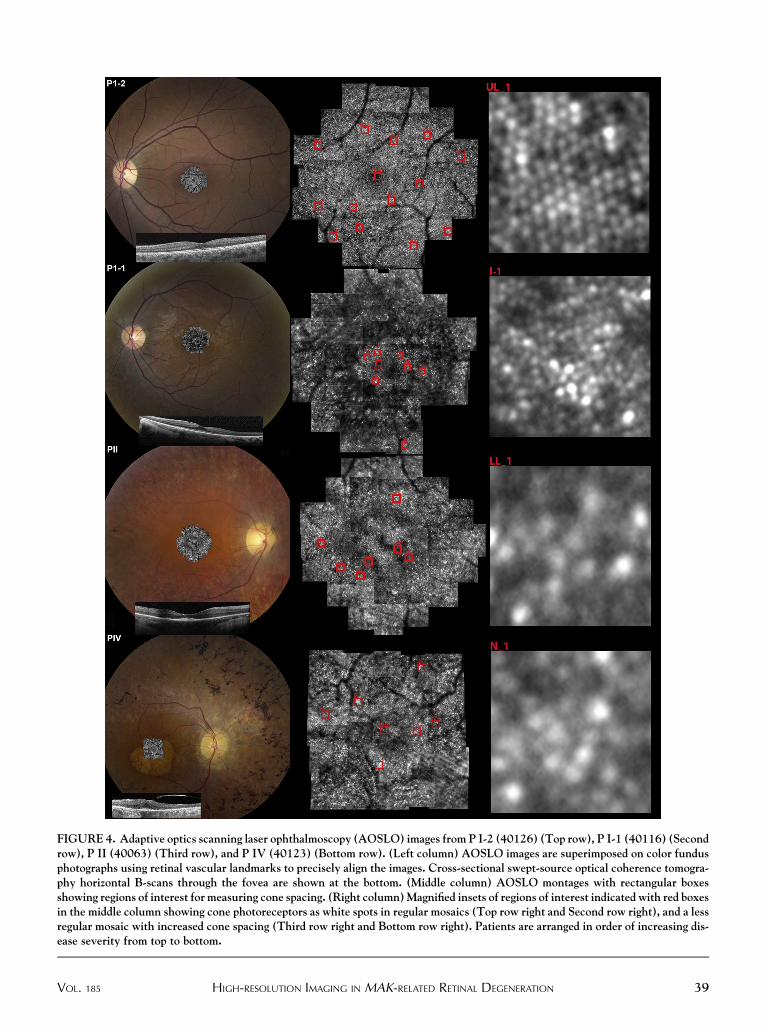
FIGURE 4. Adaptive optics scanning laser ophthalmoscopy (AOSLO) images from P I-2 (40126) (Top row), P I-1 (40116) (Secondrow), P II (40063) (Third row), and P IV (40123) (Bottom row). (Left column) AOSLO images are superimposed on color fundusphotographs using retinal vascular landmarks to precisely align the images. Cross-sectional swept-source optical coherence tomogra-phy horizontal B-scans through the fovea are shown at the bottom. (Middle column) AOSLO montages with rectangular boxesshowing regions of interest for measuring cone spacing. (Right column)Magnified insets of regions of interest indicated with red boxesin the middle column showing cone photoreceptors as white spots in regular mosaics (Top row right and Second row right), and a lessregular mosaic with increased cone spacing (Third row right and Bottom row right). Patients are arranged in order of increasing dis-ease severity from top to bottom.
VOL. 185 39HIGH-RESOLUTION IMAGING IN MAK-RELATED RETINAL DEGENERATION
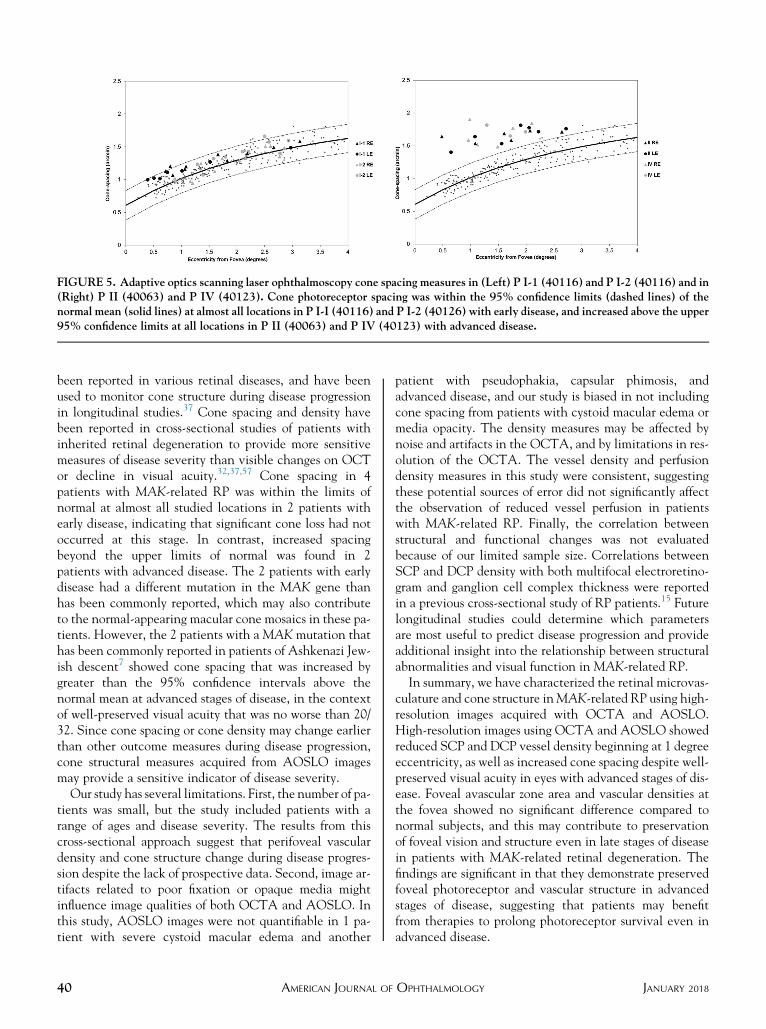
FIGURE 5. Adaptive optics scanning laser ophthalmoscopy cone spacing measures in (Left) P I-1 (40116) and P I-2 (40116) and in(Right) P II (40063) and P IV (40123). Cone photoreceptor spacing was within the 95% confidence limits (dashed lines) of thenormal mean (solid lines) at almost all locations in P I-I (40116) and P I-2 (40126) with early disease, and increased above the upper95% confidence limits at all locations in P II (40063) and P IV (40123) with advanced disease.
been reported in various retinal diseases, and have beenused to monitor cone structure during disease progressionin longitudinal studies.37 Cone spacing and density havebeen reported in cross-sectional studies of patients withinherited retinal degeneration to provide more sensitivemeasures of disease severity than visible changes on OCTor decline in visual acuity.32,37,57 Cone spacing in 4patients with MAK-related RP was within the limits ofnormal at almost all studied locations in 2 patients withearly disease, indicating that significant cone loss had notoccurred at this stage. In contrast, increased spacingbeyond the upper limits of normal was found in 2patients with advanced disease. The 2 patients with earlydisease had a different mutation in the MAK gene thanhas been commonly reported, which may also contributeto the normal-appearing macular cone mosaics in these pa-tients. However, the 2 patients with aMAK mutation thathas been commonly reported in patients of Ashkenazi Jew-ish descent7 showed cone spacing that was increased bygreater than the 95% confidence intervals above thenormal mean at advanced stages of disease, in the contextof well-preserved visual acuity that was no worse than 20/32. Since cone spacing or cone density may change earlierthan other outcome measures during disease progression,cone structural measures acquired from AOSLO imagesmay provide a sensitive indicator of disease severity.
Our study has several limitations. First, the number of pa-tients was small, but the study included patients with arange of ages and disease severity. The results from thiscross-sectional approach suggest that perifoveal vasculardensity and cone structure change during disease progres-sion despite the lack of prospective data. Second, image ar-tifacts related to poor fixation or opaque media mightinfluence image qualities of both OCTA and AOSLO. Inthis study, AOSLO images were not quantifiable in 1 pa-tient with severe cystoid macular edema and another
40 AMERICAN JOURNAL OF
patient with pseudophakia, capsular phimosis, andadvanced disease, and our study is biased in not includingcone spacing from patients with cystoid macular edema ormedia opacity. The density measures may be affected bynoise and artifacts in the OCTA, and by limitations in res-olution of the OCTA. The vessel density and perfusiondensity measures in this study were consistent, suggestingthese potential sources of error did not significantly affectthe observation of reduced vessel perfusion in patientswith MAK-related RP. Finally, the correlation betweenstructural and functional changes was not evaluatedbecause of our limited sample size. Correlations betweenSCP and DCP density with both multifocal electroretino-gram and ganglion cell complex thickness were reportedin a previous cross-sectional study of RP patients.15 Futurelongitudinal studies could determine which parametersare most useful to predict disease progression and provideadditional insight into the relationship between structuralabnormalities and visual function in MAK-related RP.In summary, we have characterized the retinal microvas-
culature and cone structure inMAK-related RP using high-resolution images acquired with OCTA and AOSLO.High-resolution images using OCTA and AOSLO showedreduced SCP and DCP vessel density beginning at 1 degreeeccentricity, as well as increased cone spacing despite well-preserved visual acuity in eyes with advanced stages of dis-ease. Foveal avascular zone area and vascular densities atthe fovea showed no significant difference compared tonormal subjects, and this may contribute to preservationof foveal vision and structure even in late stages of diseasein patients with MAK-related retinal degeneration. Thefindings are significant in that they demonstrate preservedfoveal photoreceptor and vascular structure in advancedstages of disease, suggesting that patients may benefitfrom therapies to prolong photoreceptor survival even inadvanced disease.
JANUARY 2018OPHTHALMOLOGY
FUNDING/SUPPORT: THIS WORK WAS SUPPORTED BY THE NATIONAL INSTITUTES OF HEALTH (NIH GRANTS NIH EY002162, EY024239); the US Food and Drug Administration Office of Orphan Product Development (FDA R01-41001); The Foundation Fighting Blindness,Columbia, MD; Research to Prevent Blindness, New York, NY (Nelson Trust Award for Retinitis Pigmentosa and unrestricted grant toUCSF); The Bernard A. NewcombMacular Degeneration Fund, San Francisco, CA; ThatManMay See, Inc, San Francisco, CA; Hope for Vision, Miami,FL; The Claire Giannini Fund, San Francisco, CA; The Larry L. Hillblom Foundation, Petaluma, CA (Research Network Grant 2014-A-003-NET); andThe Hedco Foundation, Danville, CA. Financial Disclosures: Austin Roorda holds 2 patents on technology related to the Adaptive Optics Scanning LaserOphthalmoscope (USPTO #7,118,216, #6,890,076). These patents are assigned to both the University of Rochester and the University of Houston. Thepatents are currently licensed to Canon, Inc, Japan. Both Austin Roorda and the company may benefit financially from the publication of this research.Jacque L. Duncan serves on the data safety monitoring board for clinical trials sponsored by Spark Therapeutics, Inc (Philadelphia, Pennsylvania, USA),AGTC, Inc (Alachua, Florida, USA), and The California Institute for Regenerative Medicine (Oakland, California, USA). She is on the Scientific Advi-sory Board of SparingVision (Paris, France) and serves as Chair of the Scientific Advisory Board for The Foundation Fighting Blindness (Columbia, Mary-land, USA), and has served as a consultant to Novelion Therapeutics (Vancouver, BC, Canada), Ionis Pharmaceuticals, Inc (Carlsbad, California, USA),Ocugen, Inc (Malvern, Pennsylvania, USA), Shire (Lexington, Massachusetts, USA), and Editas Medicine, Inc (Cambridge, Massachusetts, USA). Shereceives material support for an unrelated clinical trial from Neurotech Pharmaceuticals, Inc (Cumberland, Rhode Island, USA). The following authorshave no financial disclosures: Young Ju Lew, Nicholas Rinella, Jia Qin, Joanna Chiang, and Travis C. Porco.
Other Acknowledgments: The authors collaborated with Nathan Shemonski and Mary K. Durbin, Carl Zeiss Meditec, Inc (Dublin, California, USA),for OCTA analysis and manuscript revision.
REFERENCES
1. Berson EL. Retinitis pigmentosa. The Friedenwald Lecture.Invest Ophthalmol Vis Sci 1993;34(5):1659–1676.
2. Hartong DT, Berson EL, Dryja TP. Retinitis pigmentosa. Lan-cet 2006;368(9549):1795–1809.
3. van Huet RA, Siemiatkowska AM, Ozgul RK, et al. Retinitispigmentosa caused by mutations in the ciliary MAK gene isrelatively mild and is not associated with apparent extra-ocular features. Acta Ophthalmol 2015;93(1):83–94.
4. Wright AF, Chakarova CF, Abd El-Aziz MM,Bhattacharya SS. Photoreceptor degeneration: genetic andmechanistic dissection of a complex trait. Nat Rev Genet2010;11(4):273–284.
5. Marc RE, Jones BW,Watt CB, Strettoi E. Neural remodelingin retinal degeneration. Prog Retin Eye Res 2003;22(5):607–655.
6. Milam AH, Li ZY, Fariss RN. Histopathology of the humanretina in retinitis pigmentosa. Prog Retin Eye Res 1998;17(2):175–205.
7. Stone EM, Luo X, Heon E, et al. Autosomal recessive retinitispigmentosa caused by mutations in the MAK gene. InvestOphthalmol Vis Sci 2011;52(13):9665–9673.
8. Schwartz DM, Fingler J, KimDY, et al. Phase-variance opticalcoherence tomography: a technique for noninvasive angiog-raphy. Ophthalmology 2014;121(1):180–187.
9. Jia Y, Tan O, Tokayer J, et al. Split-spectrum amplitude-decorrelation angiography with optical coherence tomogra-phy. Opt Express 2012;20(4):4710–4725.
10. Iafe NA, Phasukkijwatana N, Chen X, Sarraf D. Retinalcapillary density and foveal avascular zone area are age-dependent: quantitative analysis using optical coherence to-mography angiography. Invest Ophthalmol Vis Sci 2016;57(13):5780–5787.
11. Kang JW, Yoo R, Jo YH, Kim HC. Correlation of microvas-cular structures on optical coherence tomography angiog-raphy with visual acuity in retinal vein occlusion. Retina2017;37(9):1700–1709.
12. Li M, Yang Y, Jiang H, et al. Retinal microvascular networkand microcirculation assessments in high myopia. Am J
Ophthalmol 2017;174:56–67.
VOL. 185 HIGH-RESOLUTION IMAGING IN MAK
13. Murakami Y, Ikeda Y, AkiyamaM, et al. Correlation betweenmacular blood flow and central visual sensitivity in retinitispigmentosa. Acta Ophthalmol 2015;93(8):e644–e648.
14. Battaglia Parodi M, Cicinelli MV, Rabiolo A, et al. Vesseldensity analysis in patients with retinitis pigmentosa bymeans of optical coherence tomography angiography. Br J
Ophthalmol 2017;101(4):428–432.15. Toto L, Borrelli E, Mastropasqua R, et al. Macular features in
retinitis pigmentosa: correlations among ganglion cell com-plex thickness, capillary density, and macular function. InvestOphthalmol Vis Sci 2016;57(14):6360–6366.
16. Sugahara M, Miyata M, Ishihara K, et al. Optical coherencetomography angiography to estimate retinal blood flow ineyes with retinitis pigmentosa. Sci Rep 2017;7:46396.
17. Rezaei KA, Zhang Q, Chen CL, Chao J, Wang RK. Retinaland choroidal vascular features in patients with retinitispigmentosa imaged by OCT based microangiography.GraefesArch Clin Exp Ophthalmol 2017;255(7):1287–1295.
18. Roorda A, Duncan JL. Adaptive optics ophthalmoscopy.Annu Rev Vis Sci 2015;1:19–50.
19. Roorda A, Romero-Borja F, Donnelly W III, Queener H,Hebert T, Campbell M. Adaptive optics scanning laserophthalmoscopy. Opt Express 2002;10(9):405–412.
20. KurokawaK, Liu Z,MillerDT.Adaptive optics optical coherencetomography angiography for morphometric analysis of chorioca-pillaris [Invited]. Biomed Opt Express 2017;8(3):1803–1822.
21. Mo S, Krawitz B, Efstathiadis E, et al. Imaging foveal micro-vasculature: optical coherence tomography angiographyversus adaptive optics scanning light ophthalmoscope fluores-cein angiography. Invest Ophthalmol Vis Sci 2016;57(9):OCT130–OCT140.
22. Salas M, Augustin M, Ginner L, et al. Visualization of micro-capillaries using optical coherence tomography angiographywith and without adaptive optics. Biomed Opt Express 2017;8(1):207–222.
23. Duncan JL, Talcott KE, Ratnam K, et al. Cone structure inretinal degeneration associated with mutations in the periph-erin/RDS gene. Invest Ophthalmol Vis Sci 2011;52(3):1557–1566.
24. Yoon MK, Roorda A, Zhang Y, et al. Adaptive optics scan-ning laser ophthalmoscopy images in a family with the
41-RELATED RETINAL DEGENERATION
mitochondrial DNAT8993Cmutation. Invest Ophthalmol VisSci 2009;50(4):1838–1847.
25. Zayit-Soudry S, Sippl-Swezey N, Porco TC, et al. Repeatabilityof cone spacing measures in eyes with inherited retinal degener-ations. Invest Ophthalmol Vis Sci 2015;56(10):6179–6189.
26. Lai YH, Capasso JE, Kaiser R, Levin AV. Intraretinal cystoidspaces in a patient with retinitis pigmentosa due to mutationin the MAK gene. Ophthalmic Genet 2016;37(4):424–426.
27. Omori Y, Chaya T, Katoh K, et al. Negative regulation ofciliary length by ciliary male germ cell-associated kinase(Mak) is required for retinal photoreceptor survival. ProcNatl Acad Sci U S A 2010;107(52):22671–22676.
28. Tucker BA, Scheetz TE, Mullins RF, et al. Exome sequencingand analysis of induced pluripotent stem cells identify thecilia-related gene male germ cell-associated kinase (MAK)as a cause of retinitis pigmentosa. Proc Natl Acad Sci U S A
2011;108(34):E569–E576.29. Ozgul RK, Siemiatkowska AM, Yucel D, et al. Exome
sequencing and cis-regulatory mapping identify mutations inMAK, a gene encoding a regulator of ciliary length, as a causeof retinitis pigmentosa. Am J Hum Genet 2011;89(2):253–264.
30. Ferris FL 3rd, Kassoff A, Bresnick GH, Bailey I. New visualacuity charts for clinical research. Am J Ophthalmol 1982;94(1):91–96.
31. Marmor MF, Fulton AB, Holder GE, Miyake Y, Brigell M,Bach M. ISCEV Standard for full-field clinical electroreti-nography (2008 update).Doc Ophthalmol 2009;118(1):69–77.
32. Ratnam K, Carroll J, Porco TC, Duncan JL, Roorda A. Rela-tionship between foveal cone structure and clinical measuresof visual function in patients with inherited retinal degener-ations. Invest Ophthalmol Vis Sci 2013;54(8):5836–5847.
33. Rosenfeld PJ, Durbin MK, Roisman L, et al. ZEISS angioplexspectral domain optical coherence tomography angiography:technical aspects. Dev Ophthalmol 2016;56:18–29.
34. Durbin MK, An L, Shemonski ND, et al. Quantification ofretinal microvascular density in optical coherence tomo-graphic angiography images in diabetic retinopathy. JAMAOphthalmol 2017;135(4):370–376.
35. Zayit-Soudry S, Duncan JL, Syed R, Menghini M, Roorda AJ.Cone structure imaged with adaptive optics scanning laserophthalmoscopy in eyeswithnonneovascular age-relatedmaculardegeneration. Invest Ophthalmol Vis Sci 2013;54(12):7498–7509.
36. Duncan JL, Zhang Y, Gandhi J, et al. High-resolution imagingwith adaptive optics in patients with inherited retinal degen-eration. Invest Ophthalmol Vis Sci 2007;48(7):3283–3291.
37. Talcott KE, Ratnam K, Sundquist SM, et al. Longitudinalstudy of cone photoreceptors during retinal degenerationand in response to ciliary neurotrophic factor treatment.Invest Ophthalmol Vis Sci 2011;52(5):2219–2226.
38. Consugar MB, Navarro-Gomez D, Place EM, et al. Panel-basedgenetic diagnostic testing for inherited eye diseases is highly ac-curate and reproducible, and more sensitive for variant detec-tion, than exome sequencing. Genet Med 2015;17(4):253–261.
39. Adackapara CA, Sunness JS, Dibernardo CW, Melia BM,Dagnelie G. Prevalence of cystoid macular edema and stabil-ity in OCT retinal thickness in eyes with retinitis pigmentosaduring a 48-week lutein trial. Retina 2008;28(1):103–110.
40. Hajali M, Fishman GA, Anderson RJ. The prevalence ofcystoid macular oedema in retinitis pigmentosa patients
42 AMERICAN JOURNAL OF
determined by optical coherence tomography. Br J Ophthal-mol 2008;92(8):1065–1068.
41. Huckfeldt RM, Comander J. Management of cystoid macularedema in retinitis pigmentosa. Semin Ophthalmol 2017;32(1):43–51.
42. Grunwald JE,MaguireAM,Dupont J. Retinal hemodynamics inretinitis pigmentosa. Am J Ophthalmol 1996;122(4):502–508.
43. Li G, De La Garza B, Shih YY, Muir ER, Duong TQ. Layer-specific blood-flow MRI of retinitis pigmentosa in RCS rats.Exp Eye Res 2012;101:90–96.
44. Zhang Y, Harrison JM, Nateras OS, Chalfin S, Duong TQ.Decreased retinal-choroidal blood flow in retinitis pigmen-tosa as measured by MRI. Doc Ophthalmol 2013;126(3):187–197.
45. Schmidt KG, Pillunat LE, Kohler K, Flammer J. Ocular pulseamplitude is reduced in patients with advanced retinitispigmentosa. Br J Ophthalmol 2001;85(6):678–682.
46. Turksever C, Valmaggia C, Orgul S, Schorderet DF,Flammer J, Todorova MG. Retinal vessel oxygen saturationand its correlation with structural changes in retinitispigmentosa. Acta Ophthalmol 2014;92(5):454–460.
47. Zong Y, Lin L, Yi C, et al. Retinal vessel oxygen saturationand vessel diameter in retinitis pigmentosa at various ages.Graefes Arch Clin Exp Ophthalmol 2016;254(2):243–252.
48. Eysteinsson T, Hardarson SH, Bragason D, Stefansson E.Retinal vessel oxygen saturation and vessel diameter in reti-nitis pigmentosa. Acta Ophthalmol 2014;92(5):449–453.
49. Spaide RF, Fujimoto JG, Waheed NK. Image artifacts in op-tical coherence tomography angiography. Retina 2015;35(11):2163–2180.
50. Menghini M, Lujan BJ, Zayit-Soudry S, et al. Correlation ofouter nuclear layer thickness with cone density values in pa-tients with retinitis pigmentosa and healthy subjects. InvestOphthalmol Vis Sci 2014;56(1):372–381.
51. Choi SS, Doble N, Hardy JL, et al. In vivo imaging of thephotoreceptor mosaic in retinal dystrophies and correlationswith visual function. Invest Ophthalmol Vis Sci 2006;47(5):2080–2092.
52. Duncan JL, Biswas P, Kozak I, et al. Ocular phenotype of afamily with FAM161A-associated retinal degeneration.Ophthalmic Genet 2016;37(1):44–52.
53. Duncan JL, Roorda A, Navani M, et al. Identification of a novelmutation in the CDHR1 gene in a family with recessive retinaldegeneration. Arch Ophthalmol 2012;130(10):1301–1308.
54. Genead MA, Fishman GA, Rha J, et al. Photoreceptor struc-ture and function in patients with congenital achromatopsia.Invest Ophthalmol Vis Sci 2011;52(10):7298–7308.
55. Michaelides M, Rha J, Dees EW, et al. Integrity of the conephotoreceptor mosaic in oligocone trichromacy. Invest
Ophthalmol Vis Sci 2011;52(7):4757–4764.56. Morgan JI, HanG, Klinman E, et al. High-resolution adaptive
optics retinal imaging of cellular structure in choroideremia.Invest Ophthalmol Vis Sci 2014;55(10):6381–6397.
57. Sun LW, Johnson RD, Langlo CS, et al. Assessing photore-ceptor structure in retinitis pigmentosa and Usher syndrome.Invest Ophthalmol Vis Sci 2016;57(6):2428–2442.
58. Wolfing JI, Chung M, Carroll J, Roorda A, Williams DR.High-resolution retinal imaging of cone-rod dystrophy.Ophthalmology 2006;113(6):1014–1019.
JANUARY 2018OPHTHALMOLOGY