high school algebra ib curriculum · alg1.rei.c.1: explain that the graph of an equation in two...
TRANSCRIPT

High School Algebra IB Curriculum
Course Description: The course is designed to cover the second half of the Algebra I curriculum. This course will include operations on real numbers, solve equations and inequalities, analyze various forms of functions (linear, quadratic, absolute value, exponential and sequences) and use introductory statistics to organize and make predictions. This course is the foundation for further mathematical understanding. Scope and Sequence:
Timeframe Unit Instructional Topics
17 class periods
Linear Equations and Functions
Topic 1: Bellwork – review order of operations Topic 2: Solving Equations Topic 3: Linear Functions Topic 4: Systems of Equations
8 class periods Inequalities and Systems of Inequalities
Topic 1: 1 Variable Inequalities Topic 2: 2 Variable Inequalities
17 class periods
Exponentials Topic 1: Properties of Exponentials Topic 2: Growth and Decay Topic 3: Radical Expressions
34 class periods
Polynomials Topic 1: Polynomials Topic 2: Quadratics Topic 3: Rational Expressions
5 class periods Data Topic 1: Data

Board Approved: March 30, 2017 2 | P a g e
Unit 1: Linear Equations and Functions
Subject: Algebra 1B Grade: 9, 10, 11, 12 Name of Unit: Linear Equations and Functions Length of Unit: 17 class periods Overview of Unit: Students will form a deeper understanding on how to write, solve, graph, and compare linear equations and functions. They will also learn to use multiple methods of solving systems of linear equations. Priority Standards for unit:
● Alg1.SSE.A.1: Interpret the contextual meaning of individual terms or factors from a given problem that utilizes formulas or expressions.
● Alg1.LQE.A.1: Distinguish between situations that can be modeled with linear or exponential functions.
a. Determine that linear functions change by equal differences over equal intervals. b. Recognize exponential situations in which a quantity grows or decays by a
constant percent rate per unit interval. ● Alg1.CED.A.2: Create and graph linear, quadratic and exponential equations in two
variables. ● Alg1.LQE.A.3: Construct linear, quadratic and exponential equations given graphs,
verbal descriptions or tables. ● Alg1.IF.C.1: Graph functions expressed symbolically and identify and interpret key
features of the graph. ● Alg1.DS.A.6: Interpret the slope (rate of change) and the y-intercept (constant term) of a
linear model in the context of the data. ● Alg1.REI.C.1: Explain that the graph of an equation in two variables is the set of all its
solutions plotted in the Cartesian coordinate plane. ● Alg1.REI.A.1: Explain how each step taken when solving an equation or inequality in
one variable creates an equivalent equation or inequality that has the same solution(s) as the original.
● Alg1.REI.B.1: Solve a system of linear equations algebraically and/or graphically. ● Alg1.IF.A.1: Understand that a function from one set (domain) to another set (range)
assigns to each element of the domain exactly one element of the range. a. Represent a function using function notation. b. Understand that the graph of a function labeled f is the set of all ordered pairs (x, y)
that satisfy the equation y=f (x). ● Alg1.IF.B.1: Using tables, graphs and verbal descriptions, interpret key characteristics of
a function that models the relationship between two quantities.

Board Approved: March 30, 2017 3 | P a g e
● Alg1.CED.A.1: Create equations and inequalities in one variable and use them to model and/or solve problems.
Supporting Standards for unit: ● Alg1.NQ.B.2: Define and use appropriate quantities for representing a given context or
problem. ● Alg1.NQ.B.1: Use units of measure as a way to understand and solve problems involving
quantities. a. Identify, label and use appropriate units of measure within a problem. b. Convert units and rates. c. Use units within problems. d. Choose and interpret the scale and the origin in graphs and data displays.
● Alg1.BF.A.1: Analyze the effect of translations and scale changes on functions. ● Alg1.IF.B.2: Relate the domain and range of a function to its graph and, where
applicable, to the quantitative relationship it describes. ● Alg1.IF.B.4: Interpret the parameters of a linear or exponential function in terms of the
context. ● Alg1.IF.C.3: Compare the properties of two functions given different representations. ● Alg1.IF.B.3: Determine the average rate of change of a function over a specified interval
and interpret the meaning. ● Alg1.DS.A.1: Analyze and interpret graphical displays of data. ● Alg1.IF.C.2: Translate between different but equivalent forms of a function to reveal and
explain properties of the function and interpret these in terms of a context. ● Alg1.CED.A.4 Solve literal equations and formulas for a specified variable that
highlights a quantity of interest. ● Alg1.DS.A.7: Determine and interpret the correlation coefficient for a linear association. ● Alg1.DS.A.5: Construct a scatter plot of bivariate quantitative data describing how the
variables are related; determine and use a function that models the relationship. a. Construct a linear function to model bivariate data represented on a scatter plot that
minimizes residuals. b. Construct an exponential function to model bivariate data represented on a scatter
plot that minimizes residuals. ● Alg1.IF.A.2: Use function notation to evaluate functions for inputs in their domains, and
interpret statements that use function notation in terms of a context. ● Alg1.REI.B.3: Justify that the technique of linear combination produces an equivalent
system of equations. ● ISTE-COMPUTATIONAL THINKER.5.C - break problems into component parts,
extract key information, and develop descriptive models to understand complex systems or facilitate problem-solving.
Board Approved: March 30, 2017 4 | P a g e
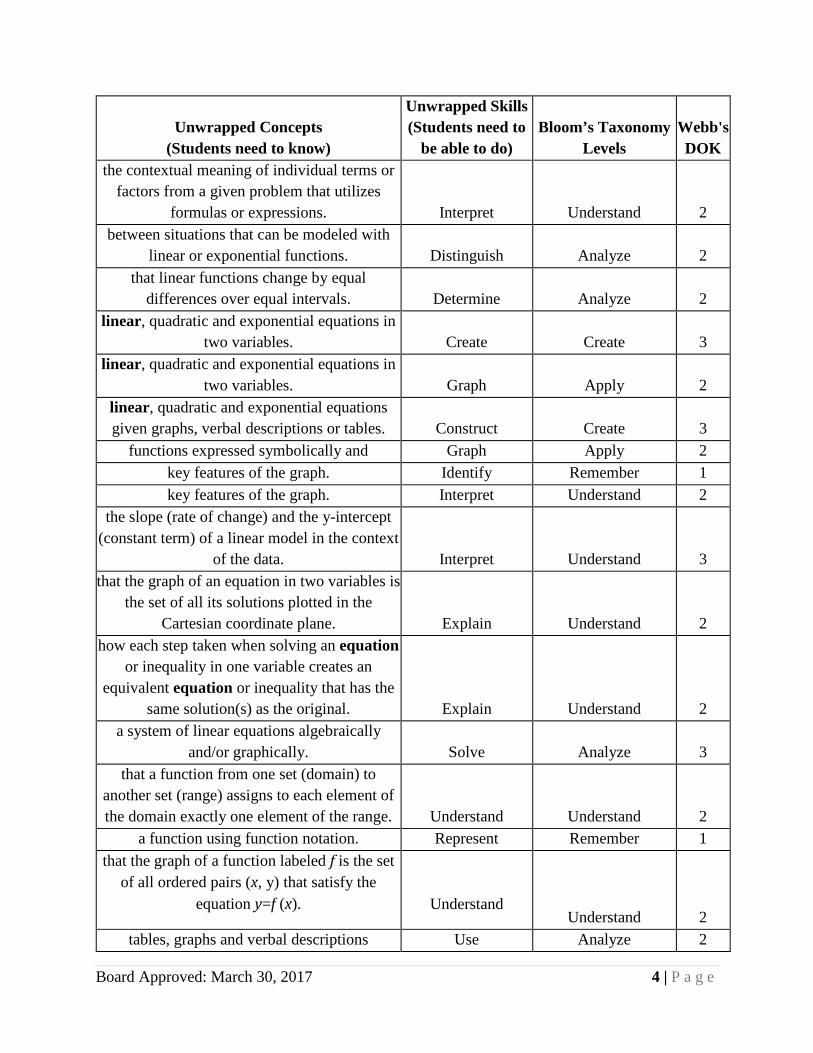
Unwrapped Concepts (Students need to know)
Unwrapped Skills (Students need to
be able to do) Bloom’s Taxonomy
Levels Webb's DOK
the contextual meaning of individual terms or factors from a given problem that utilizes
formulas or expressions. Interpret Understand 2 between situations that can be modeled with
linear or exponential functions. Distinguish Analyze 2 that linear functions change by equal
differences over equal intervals. Determine Analyze 2 linear, quadratic and exponential equations in
two variables. Create Create 3 linear, quadratic and exponential equations in
two variables. Graph Apply 2 linear, quadratic and exponential equations given graphs, verbal descriptions or tables. Construct Create 3
functions expressed symbolically and Graph Apply 2 key features of the graph. Identify Remember 1 key features of the graph. Interpret Understand 2
the slope (rate of change) and the y-intercept (constant term) of a linear model in the context
of the data. Interpret Understand 3 that the graph of an equation in two variables is
the set of all its solutions plotted in the Cartesian coordinate plane. Explain Understand 2
how each step taken when solving an equation or inequality in one variable creates an
equivalent equation or inequality that has the same solution(s) as the original. Explain Understand 2
a system of linear equations algebraically and/or graphically. Solve Analyze 3
that a function from one set (domain) to another set (range) assigns to each element of the domain exactly one element of the range. Understand Understand 2
a function using function notation. Represent Remember 1 that the graph of a function labeled f is the set
of all ordered pairs (x, y) that satisfy the equation y=f (x). Understand
Understand 2 tables, graphs and verbal descriptions Use Analyze 2

Board Approved: March 30, 2017 5 | P a g e
key characteristics of a function that models the relationship between two quantities. Interpret Understand 3
equations and inequalities in one variable Create Create 3 Equations and inequalities to model and/or
solve problems. Use Analyze 4 Essential Questions:
1. How do you evaluate algebraic expressions? 2. How do you solve linear equations with variables on both sides? 3. How do you represent functions? 4. How do you solve systems of linear equations? 5. How do you write a linear equation given two points?
Enduring Understanding/Big Ideas:
1. Substitute a value into the expression and follow order of operations. 2. Get the variables together on one side; isolate the variable by using inverse operations. 3. By using Tables, Rules, Graphs. 4. By using graphing, substitution and elimination methods. 5. Find the slope, then write equation in all three forms.
Unit Vocabulary:
Academic Cross-Curricular Words Content/Domain Specific
Ratios Rate of change
Solve Variable
Independent variable Dependent variable
Constant
Algebraic expression Equation Linear
Domain Range
Function Proportions
Evaluate Simplify Parallel
Perpendicular Solution
Slope Y-intercept
Standard form Point slope form
Slope intercept form

Board Approved: March 30, 2017 6 | P a g e
Line of Best Fit/Trend Line Scatter plot
Direct variation Rational Number Irrational Number
Real Number System Whole Number
Integer Percent of Change
Absolute Value Distribute Like terms Coefficient Square root
Perfect square Identity
System of equation
Resources for Vocabulary Development: textbook
Board Approved: March 30, 2017 7 | P a g e
Topic 1:Number Sense and Operations
Engaging Experience 1 Title: Bellwork - review order of operations Suggested Length of Time: 10 minutes Standards Addressed Priority:
● Alg1.SSE.A.1: Interpret the contextual meaning of individual terms or factors from a given problem that utilizes formulas or expressions.
Supporting: ● Alg1.NQ.B.2: Define and use appropriate quantities for representing a given
context or problem. Detailed Description/Instructions: Teachers will provide order of operation problems on student’s bellwork to review. Bloom’s Levels: Understand Webb’s DOK: 2 Rubric: N/A
Board Approved: March 30, 2017 8 | P a g e
Topic 2: Solving Equations
Engaging Experience 1 Title: Lotus Diagram - Solving Equations Suggested Length of Time: 25-30 minutes Standards Addressed Priority:
• Alg1.REI.A.1: Explain how each step taken when solving an equation or inequality in one variable creates an equivalent equation or inequality that has the same solution(s) as the original.
• Alg1.CED.A.1: Create equations and inequalities in one variable and use them to model and/or solve problems.
Detailed Description/Instructions: Students will choose a value for x, then create a problem for each of the 8 boxes (one-step, two step, multi-step, word problem, etc.) where the solution to the problem is the value they choose for x. This resource can be found in the Secondary Math Curriculum Group in Schoology. Bloom’s Levels: Understand Webb’s DOK: 2 Rubric: to be created

Board Approved: March 30, 2017 9 | P a g e
Topic 3: Linear Functions
Engaging Experience 1 Title: Worksheet - practice graphing linear equations and writing linear equations Suggested Length of Time: 2 class periods Standards Addressed
Priority: ● Alg1.CED.A.2: Create and graph linear equations in two variables. ● Alg1.LQE.A.3: Construct linear equations given graphs, verbal descriptions or
tables. ● Alg1.IF.A.1: Understand that a function from one set (domain) to another set
(range) assigns to each element of the domain exactly one element of the range. a. Represent a function using function notation. b. Understand that the graph of a function labeled f is the set of all ordered
pairs (x, y) that satisfy the equation y=f (x). ● Alg1.LQE.A.1: Distinguish between situations that can be modeled with linear
or exponential functions. a. Determine that linear functions change by equal differences over equal
intervals. b. Recognize exponential situations in which a quantity grows or decays by a
constant percent rate per unit interval. ● Alg1.IF.C.1: Graph functions expressed symbolically and identify and interpret
key features of the graph. ● Alg1.DS.A.6: Interpret the slope (rate of change) and the y-intercept (constant
term) of a linear model in the context of the data. ● Alg1.REI.C.1: Explain that the graph of an equation in two variables is the set of
all its solutions plotted in the Cartesian coordinate plane. ● Alg1.IF.B.1: Using tables, graphs and verbal descriptions, interpret key
characteristics of a function that models the relationship between two quantities. Detailed Description/Instructions: Students should be reviewing writing and graphing linear equations. They will show their knowledge by completing a practice worksheet that covers both topics. Bloom’s Levels: Create Webb’s DOK: 2 Rubric: to be created

Board Approved: March 30, 2017 10 | P a g e
Topic 4: Systems of Equations
Engaging Experience 1 Title: Alien systems picture Suggested Length of Time: 20-30 minutes Standards Addressed Priority:
• Alg1.REI.B.1: Solve a system of linear equations algebraically and/or graphically. Supporting:
• Alg1.REI.B.3: Justify that the technique of linear combination produces an equivalent system of equations.
Detailed Description/Instructions: Students will solve systems of equations problems and find their answers in the answer bank. Each answer will correspond with a certain letter. Students find that letter in the “picture” and color it a certain way. The resulting picture will show an image. This resource can be found in Secondary Math Curriculum Group in Schoology. Bloom’s Levels: Analyze Webb’s DOK: 3 Rubric: to be created
Board Approved: March 30, 2017 11 | P a g e
Engaging Scenario
Engaging Scenario (An Engaging Scenario is a culminating activity that includes the following components: situation, challenge, specific roles, audience, product or performance.) The Big Race: Students will be given data on six children who are participating in a race on tricycles. With this given information the students will create a graph to represent the data and write equations in slope-intercept form. After completing the graph, the students will work to analyze the data to answer questions such as who won, places tied, speed of the rider, and the total distance traveled. This activity can be found on in the Secondary Math Curriculum Group in Schoology. Students will need to track test scores throughout the course to be used in the Engaging Scenario in Unit 5.
Rubric for Engaging Scenario: to be created

Board Approved: March 30, 2017 12 | P a g e
Summary of Engaging Learning Experiences for Topics
Topic Engaging Experience Title
Description Suggested Length of
Time
Number and Sense Operations
Bellwork - review order of
operations
Teachers will provide order of operation problems on student’s bellwork to review.
10 minutes
Solving Equations
Lotus Diagram – Solving Equations
Students will choose a value for x, then create a problem for each of the 8 boxes (one-step,
two step, multi-step, word problem, etc.) where the solution to the problem is the value they
choose for x. This resource can be found in the Secondary Math Curriculum Group in
Schoology.
25-30 minutes
Linear Functions
Worksheet – practice graphing linear equations
and writing linear equations
Students should be reviewing writing and graphing linear equations. They will show their knowledge by completing a practice worksheet
that covers both topics.
2 class periods
Systems of Equations
Alien Systems Picture
Students will solve systems of equations problems and find their answers in the answer
bank. Each answer will correspond with a certain letter. Students find that letter in the
“picture” and color it a certain way. The resulting picture will show an image. This resource can be found in Secondary Math
Curriculum Group in Schoology.
20-30 minutes

Board Approved: March 30, 2017 13 | P a g e
Unit 2: Inequalities and Systems of Inequalities
Subject: Algebra 1B Grade: 9, 10, 11, 12 Name of Unit: Inequalities and Systems of Inequalities Length of Unit: 8 class periods Overview of Unit: Students will write, solve and graph one and two variable inequalities. Students will also graph Systems of Inequalities and solve and graph absolute value inequalities. Priority Standards for unit:
● Alg1.SSE.A.1: Interpret the contextual meaning of individual terms or factors from a given problem that utilizes formulas or expressions.
● Alg1.CED.A.2: Create and graph linear, quadratic and exponential equations in two variables.
● Alg1.IF.C.1: Graph functions expressed symbolically and identify and interpret key features of the graph.
● Alg1.REI.C.3: Solve problems involving a system of linear inequalities. ● Alg1.REI.C.2: Graph the solution to a linear inequality in two variables. ● Alg1.CED.A.1: Create equations and inequalities in one variable and use them to model
and/or solve problems. ● Alg1.REI.A.1: Explain how each step taken when solving an equation or inequality in
one variable creates an equivalent equation or inequality that has the same solution(s) as the original.
Supporting Standards for unit: ● Alg1.NQ.B.2: Define and use appropriate quantities for representing a given context or
problem. ● Alg1.NQ.B.1: Use units of measure as a way to understand and solve problems involving
quantities. a. Identify, label and use appropriate units of measure within a problem. b. Convert units and rates. c. Use units within problems. d. Choose and interpret the scale and the origin in graphs and data displays.
● Alg1.BF.A.1: Analyze the effect of translations and scale changes on functions. ● Alg1.IF.B.2: Relate the domain and range of a function to its graph and, where
applicable, to the quantitative relationship it describes. ● Alg1.IF.B.4: Interpret the parameters of a linear or exponential function in terms of the
context. ● Alg1.IF.C.3: Compare the properties of two functions given different representations.

Board Approved: March 30, 2017 14 | P a g e
● Alg1.IF.B.3: Determine the average rate of change of a function over a specified interval and interpret the meaning.
● Alg1.DS.A.1: Analyze and interpret graphical displays of data. ● Alg1.IF.C.2: Translate between different but equivalent forms of a function to reveal and
explain properties of the function and interpret these in terms of a context. ● Alg1.CED.A.3: Represent constraints by equations or inequalities and by systems of
equations or inequalities, and interpret the data points as a solution or non-solution in a modeling context.
● ISTE-EMPOWERED LEARNER1.C - use technology to seek feedback that informs and improves their practice and to demonstrate their learning in a variety of ways.
● ISTE-GLOBAL COLLABORATOR.7.C - contribute constructively to project teams, assuming various roles and responsibilities to work effectively toward a common goal.
Unwrapped Concepts (Students need to know)
Unwrapped Skills (Students need to be
able to do)
Bloom’s Taxonomy
Levels Webb's DOK
the contextual meaning of individual terms or factors from a given
problem that utilizes formulas or expressions. Interpret Understand 2
linear, quadratic and exponential equations in two variables. Create Create 3
linear, quadratic and exponential equations in two variables. Graph Apply 2
functions expressed symbolically and Graph Apply 2
key features of the graph. Identify Remember 1 key features of the graph. Interpret Understand 2
problems involving a system of linear inequalities. Solve Apply 2
the solution to a linear inequality in two variables. Graph Create 2
equations and inequalities in one variable Create Create 3
them to model and/or solve problems. Use Apply 2
how each step taken when solving an equation or inequality in one variable creates an equivalent
equation or inequality that has the same solution(s) as the original. Explain Understand 2
Board Approved: March 30, 2017 15 | P a g e
Essential Questions: 1. How do you solve and graph a multi-step linear inequality? 2. How do you solve and graph a compound inequality? 3. How do you solve and graph an absolute value inequality? 4. How do you determine the solution to a linear inequality with two variables?
Enduring Understanding/Big Ideas:
1. Isolate the variable by using inverse operations. Graph on a number line. 2. Use the rules for and/or to isolate the variable. Graph on a number line. 3. Isolate the absolute value part, then use the rules for compound inequalities. 4. Graph the lines and shade the appropriate region.
Unit Vocabulary:
Academic Cross-Curricular Words Content/Domain Specific
Inequality Compound Inequality
Absolute Value Absolute Deviation
Resources for Vocabulary Development:

Board Approved: March 30, 2017 16 | P a g e
Topic 1: 1 Variable Inequalities
Engaging Experience 1 Title: Inequalities Row Game Suggested Length of Time: 15-20 minutes Standards Addressed Priority:
● Alg1.SSE.A.1: Interpret the contextual meaning of individual terms or factors from a given problem that utilizes formulas or expressions.
● Alg1.CED.A.1: Create equations and inequalities in one variable and use them to model and/or solve problems.
● Alg1.REI.A.1: Explain how each step taken when solving an equation or inequality in one variable creates an equivalent equation or inequality that has the same solution(s) as the original.
Supporting: ● ISTE-EMPOWERED LEARNER1.C - use technology to seek feedback that
informs and improves their practice and to demonstrate their learning in a variety of ways.
Detailed Description/Instructions: Students complete a worksheet with a partner - one is partner A and one is partner B. One student solves and graphs their inequality - then compares their answer with their partner. Even though they started out with different questions, their answers (and graphs) should be the same. If they agree, they move on to the next problem. This resource can be found in Secondary Math Curriculum Group in Schoology. Bloom’s Levels: Understand, Create Webb’s DOK: 2, 3 Rubric: n/a

Board Approved: March 30, 2017 17 | P a g e
Topic 2: 2 Variable Inequalities
Engaging Experience 1 Title: Graphing Linear Inequalities Card Sort Suggested Length of Time: 45 minutes Standards Addressed Priority:
● Alg1.CED.A.2: Create and graph linear, quadratic and exponential equations in two variables.
● Alg1.IF.C.1: Graph functions expressed symbolically and identify and interpret key features of the graph.
Supporting: ● Alg1.IF.C.2: Translate between different but equivalent forms of a function to
reveal and explain properties of the function and interpret these in terms of a context.
● Alg1.CED.A.3: Represent constraints by equations or inequalities and by systems of equations or inequalities, and interpret the data points as a solution or non-solution in a modeling context.
Detailed Description/Instructions: This card sort consists of four types of cards - the graph, the inequality, the solution, and a description of the graph. Students will work to sort the cards in groups of four. This resource can be found in Secondary Math Curriculum Group in Schoology. Bloom’s Levels: Analyze Webb’s DOK: 3 Rubric: To be created Engaging Experience 2 Title: Systems of Inequalities Maze Activity Suggested Length of Time: 45 minutes Standards Addressed Priority:
● Alg1.REI.C.3: Solve problems involving a system of linear inequalities. ● Alg1.REI.C.2: Graph the solution to a linear inequality in two variables.
Detailed Description/Instructions: Students will graph systems of linear inequalities to get to the end of the maze. The worksheet for this activity can be found on Schoology in Secondary Math Curriculum group. Bloom’s Levels: Apply and Create Webb’s DOK: 2 Rubric: To be created

Board Approved: March 30, 2017 18 | P a g e
Engaging Scenario
Engaging Scenario Treasure Hunt: Solve the System of Inequalities to Find the Treasure In this cooperative activity, students are given a map of the country in order to find a missing treasure by solving and graphing linear inequalities. All of the inequalities have greater than or less than results, therefore none of the points on the lines are solutions. Colored pencils are recommended. Students will then critique the findings of other students and exchange reasoning in order to form a consensus about the correct location of the treasure. This scenario and all of its resources can be found in Schoology - Secondary Math Curriculum.
Rubric for Engaging Scenario: the rubric for this activity can be found in the Secondary Math Curriculum group in Schoology.

Board Approved: March 30, 2017 19 | P a g e
Summary of Engaging Learning Experiences for Topics
Topic Engaging Experience Title
Description Suggested Length of
Time
1 Variable Inequalities
Inequalities Row Game
Students complete a worksheet with a partner - one is partner A and one is partner B. One
student solves and graphs their inequality - then compares their answer with their partner. Even though they started out with different questions, their answers (and graphs) should be the same.
If they agree, they move on to the next problem. This resource can be found in Secondary Math
Curriculum Group in Schoology.
15-20 minutes
1 Variable Inequalities
Graphing Linear Inequalities Card
Sort
This card sort consists of four types of cards - the graph, the inequality, the solution, and a
description of the graph. Students will work to sort the cards in groups of four. This resource can be found in Secondary Math Curriculum
Group in Schoology.
45 minutes

Board Approved: March 30, 2017 20 | P a g e
Unit 3: Exponentials
Subject: Algebra 1B Grade: 9, 10, 11, 12 Name of Unit: Exponentials Length of Unit: 17 class periods Overview of Unit: Students will use properties of exponents to simplify algebraic expressions. Students will write and graph exponential functions. Students will also learn to simplify radical expressions and how to graph radical functions. Priority Standards for unit:
● Alg1.LQE.A.1: Distinguish between situations that can be modeled with linear or exponential functions.
a. Determine that linear functions change by equal differences over equal intervals. b. Recognize exponential situations in which a quantity grows or decays by a
constant percent rate per unit interval. ● Alg1.CED.A.2: Create and graph linear, quadratic and exponential equations in two
variables. ● Alg1.LQE.A.3: Construct linear, quadratic and exponential equations given graphs,
verbal descriptions or tables. ● Alg1.IF.C.1: Graph functions expressed symbolically and identify and interpret key
features of the graph. ● Alg1.NQ.A.2: Rewrite expressions involving radicals and rational exponents using the
properties of exponents. Limit to rational exponents with a numerator of 1.
Supporting Standards for unit: ● Alg1.NQ.B.2: Define and use appropriate quantities for representing a given context or
problem. ● Alg1.NQ.B.1: Use units of measure as a way to understand and solve problems involving
quantities. a. Identify, label and use appropriate units of measure within a problem. b. Convert units and rates. c. Use units within problems. d. Choose and interpret the scale and the origin in graphs and data displays.
● Alg1.BF.A.1: Analyze the effect of translations and scale changes on functions. ● Alg1.IF.B.2: Relate the domain and range of a function to its graph and, where
applicable, to the quantitative relationship it describes. ● Alg1.IF.B.4: Interpret the parameters of a linear or exponential function in terms of the
context. ● Alg1.IF.C.3: Compare the properties of two functions given different representations.

Board Approved: March 30, 2017 21 | P a g e
● Alg1.IF.B.3: Determine the average rate of change of a function over a specified interval and interpret the meaning.
● Alg1.DS.A.1: Analyze and interpret graphical displays of data. ● Alg1.NQ.A.1: Explain how the meaning of rational exponents extends from the
properties of integer exponents. ● Alg1.LQE.A.2: Describe, using graphs and tables, that a quantity increasing
exponentially eventually exceeds a quantity increasing linearly or quadratically. ● ISTE-GLOBAL COLLABORATOR.7.C - contribute constructively to project teams,
assuming various roles and responsibilities to work effectively toward a common goal. ● ISTE-EMPOWERED LEARNER1.C - use technology to seek feedback that informs and
improves their practice and to demonstrate their learning in a variety of ways.
Unwrapped Concepts (Students need to know)
Unwrapped Skills (Students need to be
able to do)
Bloom’s Taxonomy
Levels Webb's DOK between situations that can be
modeled with linear or exponential functions. Distinguish Analyze 2
that linear functions change by equal differences over equal intervals. Determine Analyze 2 exponential situations in which a
quantity grows or decays by a constant percent rate per unit interval. Recognize Remember 1
linear, quadratic and exponential equations in two variables. Create Create 3
linear, quadratic and exponential equations in two variables. Graph Apply 2
linear, quadratic and exponential equations given graphs, verbal
descriptions or tables. Construct Create 3 functions expressed symbolically and Graph Apply 2
key features of the graph. Identify Remember 1 key features of the graph. Interpret Understand 2
expressions involving radicals and rational exponents using the properties
of exponents. Limit to rational exponents with a numerator of 1 Rewrite Remember 1

Board Approved: March 30, 2017 22 | P a g e
Essential Questions: 1. How do you apply properties of exponents to simplify expressions? 2. How are exponents and scientific notation related? 3. How can exponential functions be represented? 4. How do you simplify a radical expression?
Enduring Understanding/Big Ideas:
1. Use the properties of exponents to decide whether to add, subtract, multiply. 2. Scientific notation uses powers of 10 to write very large or very small numbers. 3. By graphing and writing exponential growth and decay functions 4. By finding a perfect square factor.
Unit Vocabulary:
Academic Cross-Curricular Words Content/Domain Specific
Exponent Base
Scientific notation Growth Decay Radical
Square root Compound interest
Pythagorean theorem
Resources for Vocabulary Development: textbook

Board Approved: March 30, 2017 23 | P a g e
Topic 1: Properties of Exponents
Engaging Experience 1 Title: Exponents Tarsia Puzzle Suggested Length of Time: 15-20 minutes Standards Addressed Priority:
• Alg1.NQ.A.2: Rewrite expressions involving radicals and rational exponents using the properties of exponents. Limit to rational exponents with a numerator of 1.
Detailed Description/Instructions: Students will cut out the puzzle pieces and then work to put the puzzle pieces together - matching question and answer together. This resource can be found in Secondary Math Curriculum Group in Schoology. Bloom’s Levels: Remember Webb’s DOK: 1 Rubric: to be created Engaging Experience 2 Title: Four Square Game Suggested Length of Time: 30 minutes Standards Addressed Priority:
• Alg1.NQ.A.2: Rewrite expressions involving radicals and rational exponents using the properties of exponents. Limit to rational exponents with a numerator of 1.
Supporting: • Alg1.NQ.A.1: Explain how the meaning of rational exponents extends from the
properties of integer exponents Detailed Description/Instructions: Students are to be put into pairs. Player 1 chooses two boxes in the bottom row and both players multiply them together (white boards work well). If both players agree player 1 is correct, then player 1 places a chip on the answer. If there is a disagreement the two players rework until they agree. If player 2 is ultimately correct, they get to place the chip. The game continues until one player gets four chips in a row. Bloom’s Levels: Remember Webb’s DOK: 1 Rubric: to be created
Board Approved: March 30, 2017 24 | P a g e
Topic 2: Growth and Decay
Engaging Experience 1 Title: Penny Toss Lab Suggested Length of Time: 1 class period Standards Addressed Priority:
● Alg1.LQE.A.1: Distinguish between situations that can be modeled with linear or exponential functions.
a. Determine that linear functions change by equal differences over equal intervals.
b. Recognize exponential situations in which a quantity grows or decays by a constant percent rate per unit interval.
● Alg1.CED.A.2: Create and graph linear, quadratic and exponential equations in two variables.
● Alg1.IF.C.1: Graph functions expressed symbolically and identify and interpret key features of the graph.
Supporting: ● ISTE-GLOBAL COLLABORATOR.7.C - contribute constructively to project
teams, assuming various roles and responsibilities to work effectively toward a common goal.
Detailed Description/Instructions: Students work in groups to complete the penny lab. They do an experiment with tossing pennies and recording how many heads show up. They graph their data and see the connections between growth equations and decay equations. Bloom’s Levels: Analyze Webb’s DOK: 2 Rubric: to be created Engaging Experience 2 Title: Exponentials Jeopardy Review Suggested Length of Time: 1 class period Standards Addressed Priority:
● Alg1.LQE.A.1: Distinguish between situations that can be modeled with linear or exponential functions.
a. Determine that linear functions change by equal differences over equal intervals.
b. Recognize exponential situations in which a quantity grows or decays by a constant percent rate per unit interval.

Board Approved: March 30, 2017 25 | P a g e
● Alg1.LQE.A.3: Construct linear, quadratic and exponential equations given graphs, verbal descriptions or tables.
Supporting: ● ISTE-EMPOWERED LEARNER1.C - use technology to seek feedback that informs and
improves their practice and to demonstrate their learning in a variety of ways. Detailed Description/Instructions: Jeopardy review game covers exponent rules and exponential growth and decay functions. Students can play in small groups, or teachers can lead a class game. This resource can be found in Secondary Math Curriculum Group in Schoology. Bloom’s Levels: Remember Webb’s DOK: 1 Rubric: to be created
Board Approved: March 30, 2017 26 | P a g e
Topic 3: Radical Expressions
Engaging Experience 1 Title: Student whiteboard practice to simplify radical expressions Suggested Length of Time: 25 minutes Standards Addressed Priority:
• Alg1.NQ.A.2: Rewrite expressions involving radicals and rational exponents using the properties of exponents. Limit to rational exponents with a numerator of 1.
Supporting: • Alg1.NQ.A.1: Explain how the meaning of rational exponents extends from the
properties of integer exponents. Detailed Description/Instructions: Teacher will provide problems; students will solve those on individual white boards so teacher can check for understanding. Bloom’s Levels: Remember Webb’s DOK: 1 Rubric: N/A
Board Approved: March 30, 2017 27 | P a g e
Engaging Scenario
Engaging Scenario Exponents Project: Students will create a project to show mastery of the Rules/Laws of Exponents. Students can create a display either on a poster or digitally, create and perform a song, or create a children’s storybook. Refer to the Secondary Math Curriculum Group in Schoology for more information.
Rubric for Engaging Scenario: the rubric for this activity can be found in the Secondary Math Curriculum group in Schoology.

Board Approved: March 30, 2017 28 | P a g e
Summary of Engaging Learning Experiences for Topics
Topic Engaging Experience
Title
Description Suggested Length of
Time
Properties of
Exponents
Exponents Tarsia Puzzle
Students will cut out the puzzle pieces and then work to put the puzzle pieces together - matching question and answer together. This resource can
be found in Secondary Math Curriculum Group in Schoology.
15-20 minutes
Properties of
Exponents
Four Square Game
Students are to be put into pairs. Player 1 chooses two boxes in the bottom row and both players
multiply them together (white boards work well). If both players agree player 1 is correct, then
player 1 places a chip on the answer. If there is a disagreement the two players rework until they
agree. If player 2 is ultimately correct, they get to place the chip. The game continues until one
player gets four chips in a row.
30 minutes
Growth and Decay
Penny Toss Lab
Students work in groups to complete the penny lab. They do an experiment with tossing pennies and recording how many heads show up. They
graph their data and see the connections between growth equations and decay equations.
1 class period
Growth and Decay
Exponentials Jeopardy Review
Jeopardy review game covers exponent rules and exponential growth and decay functions. Students
can play in small groups, or teachers can lead a class game. This resource can be found in
Secondary Math Curriculum Group in Schoology.
1 class period
Radical Expression
Student whiteboard practice to simplify radical
expressions
Teacher will provide problems; students will solve those on individual white boards so teacher
can check for understanding.
25 minutes

Board Approved: March 30, 2017 29 | P a g e
Unit 4: Polynomials
Subject: Algebra 1B Grade: 9, 10, 11, 12 Name of Unit: Polynomials Length of Unit: 34 class periods Overview of Unit: Students will form a deeper understanding of adding, subtracting, and multiplying polynomials and learn to divide polynomials. Students will learn all methods of factoring. They will also write, solve and graph quadratic functions. Students will learn to simplify, add, subtract, multiply, and divide rational expressions. Priority Standards for unit:
● Alg1.SSE.A.1: Interpret the contextual meaning of individual terms or factors from a given problem that utilizes formulas or expressions.
● Alg1.CED.A.2: Create and graph linear, quadratic and exponential equations in two variables.
● Alg1.LQE.A.3: Construct linear, quadratic and exponential equations given graphs, verbal descriptions or tables.
● Alg1.REI.A.2: Solve problems involving quadratic equations. a. Use the method of completing the square to create an equivalent quadratic
equation. b. Derive the quadratic formula. c. Analyze different methods of solving quadratic equations.
● Alg1.SSE.A.2: Analyze the structure of polynomials to create equivalent expressions or equations.
● Alg1.SSE.A.3: Choose and produce equivalent forms of a quadratic expression or equations to reveal and explain properties. a. Find the zeros of a quadratic function by rewriting it in factored form. b. Find the maximum or minimum value of a quadratic function by completing the
square. ● Alg1.APR.A.1: Add, subtract and multiply polynomials, and understand that polynomials
follow the same general rules of arithmetic and are closed under these operations.
Supporting Standards for unit: ● Alg1.NQ.B.2: Define and use appropriate quantities for representing a given context or
problem. ● Alg1.NQ.B.1: Use units of measure as a way to understand and solve problems involving
quantities. a. Identify, label and use appropriate units of measure within a problem. b. Convert units and rates.
Board Approved: March 30, 2017 30 | P a g e
c. Use units within problems. d. Choose and interpret the scale and the origin in graphs and data displays.
● Alg1.BF.A.1: Analyze the effect of translations and scale changes on functions. ● Alg1.IF.B.2: Relate the domain and range of a function to its graph and, where
applicable, to the quantitative relationship it describes. ● Alg1.IF.B.4: Interpret the parameters of a linear or exponential function in terms of the
context. ● Alg1.IF.C.3: Compare the properties of two functions given different representations. ● Alg1.IF.B.3: Determine the average rate of change of a function over a specified interval
and interpret the meaning. ● Alg1.DS.A.1: Analyze and interpret graphical displays of data. ● Alg1.IF.C.2: Translate between different but equivalent forms of a function to reveal and
explain properties of the function and interpret these in terms of a context. ● Alg1.APR.A.2: Divide polynomials by monomials.
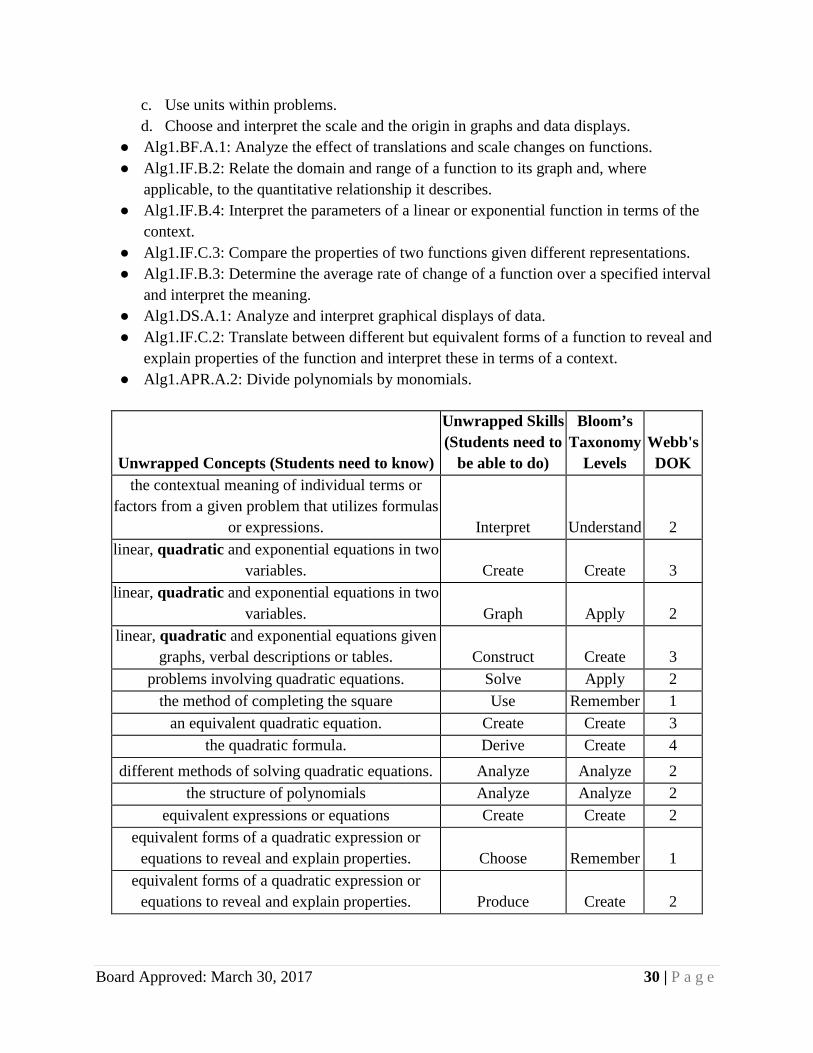
Unwrapped Concepts (Students need to know)
Unwrapped Skills (Students need to
be able to do)
Bloom’s Taxonomy
Levels Webb's DOK
the contextual meaning of individual terms or factors from a given problem that utilizes formulas
or expressions. Interpret Understand 2 linear, quadratic and exponential equations in two
variables. Create Create 3 linear, quadratic and exponential equations in two
variables. Graph Apply 2 linear, quadratic and exponential equations given
graphs, verbal descriptions or tables. Construct Create 3 problems involving quadratic equations. Solve Apply 2
the method of completing the square Use Remember 1 an equivalent quadratic equation. Create Create 3
the quadratic formula. Derive Create 4
different methods of solving quadratic equations. Analyze Analyze 2 the structure of polynomials Analyze Analyze 2
equivalent expressions or equations Create Create 2 equivalent forms of a quadratic expression or
equations to reveal and explain properties. Choose Remember 1 equivalent forms of a quadratic expression or
equations to reveal and explain properties. Produce Create 2

Board Approved: March 30, 2017 31 | P a g e
the zeros of a quadratic function by rewriting it in factored form. Find Apply 2
the maximum or minimum value of a quadratic function by completing the square. Find Apply 2
Polynomials Add, subtract and
multiply Apply 2 that polynomials follow the same general rules of arithmetic and are closed under these operations. Understand Understand 3
Essential Questions:
1. How do you classify polynomials? 2. How do you simplify polynomial expressions? 3. How do you factor polynomials? 4. How do you use a quadratic function to solve a real-world problem? 5. How do you simplify rational expressions?
Enduring Understanding/Big Ideas:
1. Number of terms (monomial, binomial, trinomial) and degree (linear, quadratic, cubic) 2. Add, subtract, multiply, divide 3. GCF, difference of squares, grouping, factoring trinomials, perfect square trinomials 4. Write a quadratic equation, solve the equation using the method of choice (square roots,
factoring, completing the square, quadratic formula) and graph. 5. Add, subtract, multiply, divide
Unit Vocabulary:
Academic Cross-Curricular Words Content/Domain Specific
Polynomial Monomial Binomial Trinomial
Linear Quadratic
Cubic Degree
Like terms Leading coefficient
Roots Vertical motion model
Factor

Board Approved: March 30, 2017 32 | P a g e
Perfect square trinomial Terms
Rational expressions Difference of squares
Greatest common factor Quadratic formula
Completing the square max/min value
Parabola Vertex
zeros/roots/x-intercepts/solutions Axis of symmetry
Discriminant
Resources for Vocabulary Development: textbook

Board Approved: March 30, 2017 33 | P a g e
Topic 1: Polynomials
Engaging Experience 1 Title: Polynomial Dice Activity Suggested Length of Time: 20-30 minutes Standards Addressed
Priority: • Alg1.SSE.A.1: Interpret the contextual meaning of individual terms or factors
from a given problem that utilizes formulas or expressions. ● Alg1.SSE.A.2: Analyze the structure of polynomials to create equivalent
expressions or equations. ● Alg1.APR.A.1: Add, subtract and multiply polynomials, and understand that
polynomials follow the same general rules of arithmetic and are closed under these operations.
Detailed Description/Instructions: Students will use a Smart Notebook file to roll two different colored dice. A chart will be provided which relates each of the two colored dice to a certain polynomial expression. Teachers will decide whether the students will use those two polynomials to add, subtract, or multiply. This Smart Notebook file can be found in the Secondary Math Curriculum group located in Schoology. Bloom’s Levels: Apply, Understand Webb’s DOK: 2, 3 Rubric: N/A Engaging Experience 2 Title: Polynomial Search Suggested Length of Time: 20 minutes Standards Addressed
Priority: • Alg1.SSE.A.1: Interpret the contextual meaning of individual terms or factors
from a given problem that utilizes formulas or expressions. ● Alg1.SSE.A.2: Analyze the structure of polynomials to create equivalent
expressions or equations. ● Alg1.APR.A.1: Add, subtract and multiply polynomials, and understand that
polynomials follow the same general rules of arithmetic and are closed under these operations.

Board Approved: March 30, 2017 34 | P a g e
Detailed Description/Instructions: Students can work on this activity individually or in small groups. They will need to add or subtract the polynomials and find the answer in the search at the bottom. This resource file can be found in the Secondary Math Curriculum group located in Schoology. Bloom’s Levels: Apply, Understand Webb’s DOK: 2, 3 Rubric: N/A Engaging Experience 3 Title: FACEing Math Polynomial Operations Suggested Length of Time: 30 minutes Standards Addressed Priority:
● Alg1.SSE.A.1: Interpret the contextual meaning of individual terms or factors from a given problem that utilizes formulas or expressions.
● Alg1.SSE.A.2: Analyze the structure of polynomials to create equivalent expressions or equations.
● Alg1.APR.A.1: Add, subtract and multiply polynomials, and understand that polynomials follow the same general rules of arithmetic and are closed under these operations.
Detailed Description/Instructions: Students complete the polynomial problems and find the answer from the two choices. The answer designates which “item” they draw on the attached face. The result is a picture of a face created and colored. This resource can be found in the Secondary Math Curriculum group located in Schoology. Bloom’s Levels: Apply, Understand Webb’s DOK: 2, 3 Rubric: N/A
Board Approved: March 30, 2017 35 | P a g e
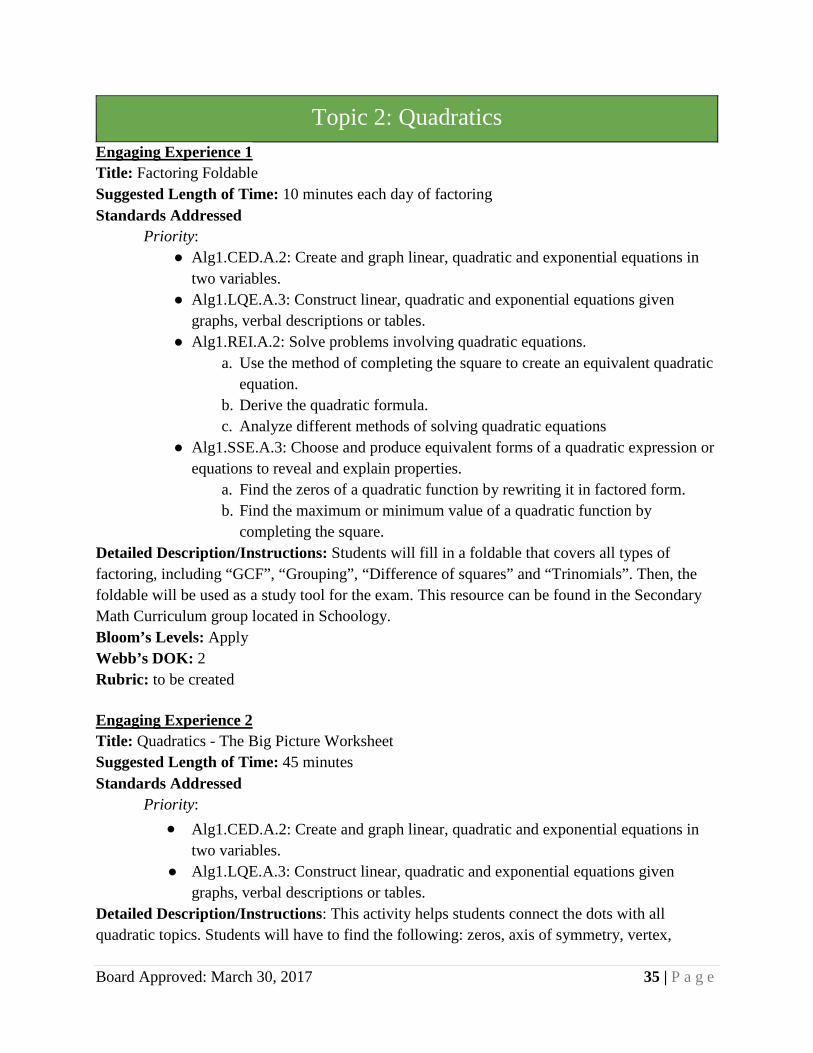
Topic 2: Quadratics
Engaging Experience 1 Title: Factoring Foldable Suggested Length of Time: 10 minutes each day of factoring Standards Addressed Priority:
● Alg1.CED.A.2: Create and graph linear, quadratic and exponential equations in two variables.
● Alg1.LQE.A.3: Construct linear, quadratic and exponential equations given graphs, verbal descriptions or tables.
● Alg1.REI.A.2: Solve problems involving quadratic equations. a. Use the method of completing the square to create an equivalent quadratic
equation. b. Derive the quadratic formula. c. Analyze different methods of solving quadratic equations
● Alg1.SSE.A.3: Choose and produce equivalent forms of a quadratic expression or equations to reveal and explain properties.
a. Find the zeros of a quadratic function by rewriting it in factored form. b. Find the maximum or minimum value of a quadratic function by
completing the square. Detailed Description/Instructions: Students will fill in a foldable that covers all types of factoring, including “GCF”, “Grouping”, “Difference of squares” and “Trinomials”. Then, the foldable will be used as a study tool for the exam. This resource can be found in the Secondary Math Curriculum group located in Schoology. Bloom’s Levels: Apply Webb’s DOK: 2 Rubric: to be created Engaging Experience 2 Title: Quadratics - The Big Picture Worksheet Suggested Length of Time: 45 minutes Standards Addressed Priority:
• Alg1.CED.A.2: Create and graph linear, quadratic and exponential equations in two variables.
● Alg1.LQE.A.3: Construct linear, quadratic and exponential equations given graphs, verbal descriptions or tables.
Detailed Description/Instructions: This activity helps students connect the dots with all quadratic topics. Students will have to find the following: zeros, axis of symmetry, vertex,

Board Approved: March 30, 2017 36 | P a g e
max/min, discriminant, x and y-intercepts, and graph. This resource can be found in the Secondary Math Curriculum group located in Schoology. Bloom’s Levels: Apply Webb’s DOK: 2 Rubric: to be created Engaging Experience 3 Title: Factoring Bingo Suggested Length of Time: 45 minutes Standards Addressed
Priority: • Alg1.CED.A.2: Create and graph linear, quadratic and exponential equations in
two variables. • Alg1.LQE.A.3: Construct linear, quadratic and exponential equations given
graphs, verbal descriptions or tables. Detailed Description/Instructions: Students are given a polynomial and must factor it. The factors are found on their bingo board. Some problems only have one factor on the board, while others have both factors. This resource can be found in the Secondary Math Curriculum group located in Schoology. Bloom’s Levels: Apply Webb’s DOK: 2 Rubric: to be created Engaging Experience 4 Title: Football Frenzy - Factoring Suggested Length of Time: 45 minutes Standards Addressed Priority:
• Alg1.CED.A.2: Create and graph linear, quadratic and exponential equations in two variables.
• Alg1.LQE.A.3: Construct linear, quadratic and exponential equations given graphs, verbal descriptions or tables.
Detailed Description/Instructions: Students work in groups and each group selects a football at random. They must factor the problem on the card. If they check with the teacher and are correct, the group may move their football player a certain number of yards across the football field. The first team to get all the way across the field wins. This resource can be found in the Secondary Math Curriculum group located in Schoology. Bloom’s Levels: Apply Webb’s DOK: 2 Rubric: to be created
Board Approved: March 30, 2017 37 | P a g e
Engaging Experience 6 Title: Quadratics scavenger hunt Suggested Length of Time: 30 minutes Standards Addressed Priority:
• Alg1.CED.A.2: Create and graph linear, quadratic and exponential equations in two variables.
• Alg1.LQE.A.3: Construct linear, quadratic and exponential equations given graphs, verbal descriptions or tables.
Detailed Description/Instructions: Students will travel around the room where they are looking at different quadratic equations. Their job is to match the equation with the appropriate statement. This resource can be found in the Secondary Math Curriculum group located in Schoology. Bloom’s Levels: Apply Webb’s DOK: 2 Rubric: to be created

Board Approved: March 30, 2017 38 | P a g e
Topic 3: Rational Expressions
Engaging Experience 1 Title: Rational Expressions Row Game Suggested Length of Time: 20-30 minutes Standards Addressed Priority:
• Alg1.APR.A.2: Divide polynomials by monomials. Supporting:
• ISTE-GLOBAL COLLABORATOR.7.C - contribute constructively to project teams, assuming various roles and responsibilities to work effectively toward a common goal.
Detailed Description/Instructions: Students will work in partners to complete a worksheet. The partners are working on different examples but will end up with the same answer. Students must make sure their answers match before moving on. This resource can be found in the Secondary Math Curriculum group located in Schoology. Bloom’s Levels: Apply Webb’s DOK: 2 Rubric: to be created
Board Approved: March 30, 2017 39 | P a g e
Engaging Scenario
Engaging Scenario (An Engaging Scenario is a culminating activity that includes the following components: situation, challenge, specific roles, audience, product or performance.) Quadratics Matching Activity: Students are given a worksheet packet for this activity. They will cut out all of the pieces on the second page, and sort them in groups according to the equations on the first page. The pieces which are cut out include a graph, factors, zeros, discriminant and vertex. This resource can be found in the Secondary Math Curriculum group located in Schoology.
Rubric for Engaging Scenario: to be created
Board Approved: March 30, 2017 40 | P a g e
Summary of Engaging Learning Experiences for Topics
Topic Engaging Experience
Title
Description Suggested Length of
Time
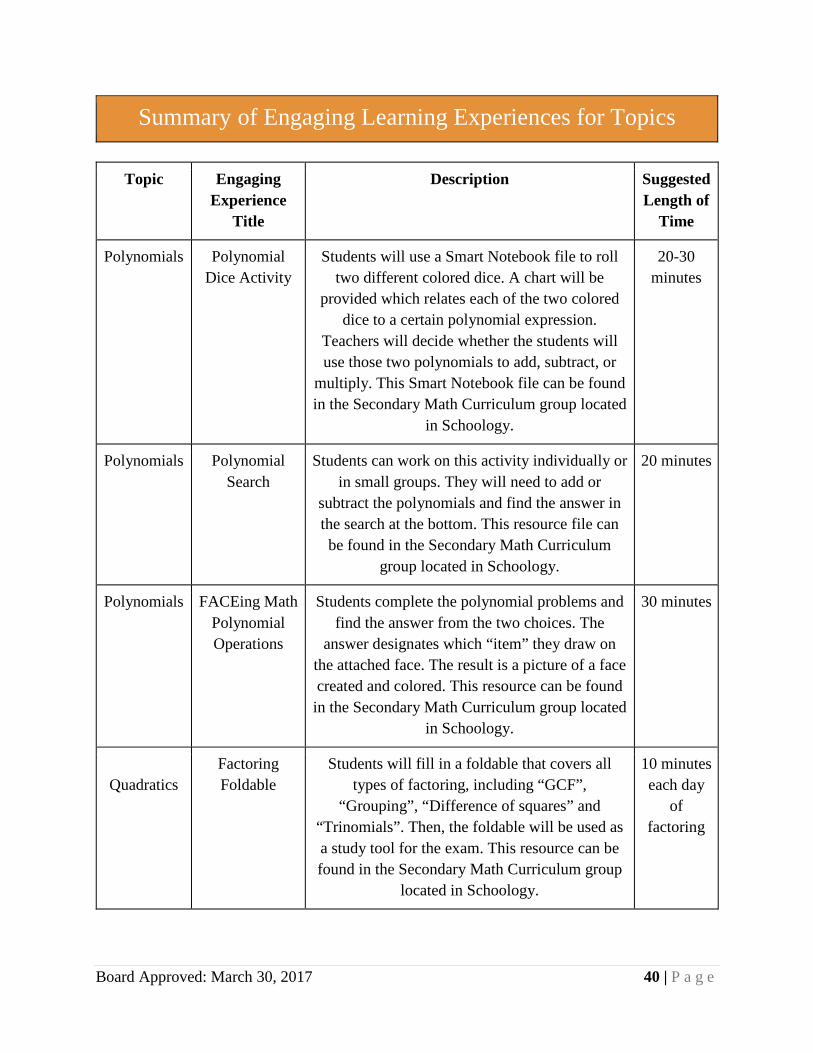
Polynomials Polynomial Dice Activity
Students will use a Smart Notebook file to roll two different colored dice. A chart will be
provided which relates each of the two colored dice to a certain polynomial expression.
Teachers will decide whether the students will use those two polynomials to add, subtract, or
multiply. This Smart Notebook file can be found in the Secondary Math Curriculum group located
in Schoology.
20-30 minutes
Polynomials Polynomial Search
Students can work on this activity individually or in small groups. They will need to add or
subtract the polynomials and find the answer in the search at the bottom. This resource file can be found in the Secondary Math Curriculum
group located in Schoology.
20 minutes
Polynomials FACEing Math Polynomial Operations
Students complete the polynomial problems and find the answer from the two choices. The
answer designates which “item” they draw on the attached face. The result is a picture of a face created and colored. This resource can be found in the Secondary Math Curriculum group located
in Schoology.
30 minutes
Quadratics
Factoring Foldable
Students will fill in a foldable that covers all types of factoring, including “GCF”,
“Grouping”, “Difference of squares” and “Trinomials”. Then, the foldable will be used as a study tool for the exam. This resource can be found in the Secondary Math Curriculum group
located in Schoology.
10 minutes each day
of factoring
Board Approved: March 30, 2017 41 | P a g e
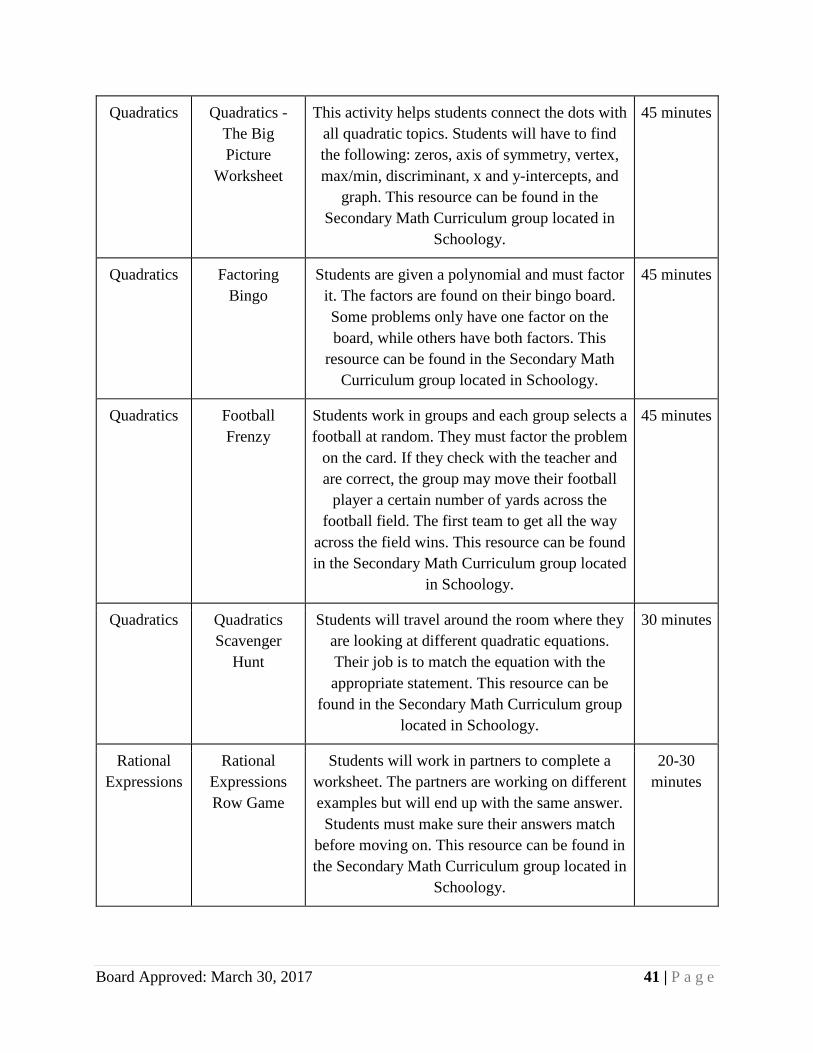
Quadratics Quadratics - The Big Picture
Worksheet
This activity helps students connect the dots with all quadratic topics. Students will have to find the following: zeros, axis of symmetry, vertex, max/min, discriminant, x and y-intercepts, and
graph. This resource can be found in the Secondary Math Curriculum group located in
Schoology.
45 minutes
Quadratics Factoring Bingo
Students are given a polynomial and must factor it. The factors are found on their bingo board. Some problems only have one factor on the board, while others have both factors. This
resource can be found in the Secondary Math Curriculum group located in Schoology.
45 minutes
Quadratics Football Frenzy
Students work in groups and each group selects a football at random. They must factor the problem
on the card. If they check with the teacher and are correct, the group may move their football
player a certain number of yards across the football field. The first team to get all the way
across the field wins. This resource can be found in the Secondary Math Curriculum group located
in Schoology.
45 minutes
Quadratics Quadratics Scavenger
Hunt
Students will travel around the room where they are looking at different quadratic equations. Their job is to match the equation with the appropriate statement. This resource can be
found in the Secondary Math Curriculum group located in Schoology.
30 minutes
Rational Expressions
Rational Expressions Row Game
Students will work in partners to complete a worksheet. The partners are working on different examples but will end up with the same answer. Students must make sure their answers match
before moving on. This resource can be found in the Secondary Math Curriculum group located in
Schoology.
20-30 minutes

Board Approved: March 30, 2017 42 | P a g e
Unit 5: Data
Subject: Algebra 1B Grade: 9, 10, 11, 12 Name of Unit: Data Length of Unit: 5 class periods Overview of Unit: Students will review how to find measures of center and create different data displays. They will also review how to write recursive, explicit and continuous forms. Priority Standards for unit:
● Alg1.DS.A.8: Distinguish between correlation and causation.
Supporting Standards for unit: ● Alg1.DS.A.3: Interpret differences in shape, center and spreads in the context of the data
sets, accounting for possible effects of outliers. ● Alg1.DS.A.4: Summarize data in two-way frequency tables.
a. Interpret relative frequencies in the context of the data. b. Recognize possible associations and trends in the data
● Alg1.DS.A.2: Use statistics appropriate to the shape of the data distribution to compare center and spread of two or more different data sets.
● Alg1.NQ.B.3: Choose a level of accuracy appropriate to limitations on measurement when reporting quantities.
● Alg1.REI.B.2: Solve a system consisting of a linear equation and a quadratic equation algebraically and/or graphically.
● Alg1.LQE.B.1: Write arithmetic and geometric sequences in recursive and explicit forms, and use them to model situations and translate between the two forms.
● Alg1.LQE.B.2: Recognize that sequences are functions, sometimes defined recursively, whose domain is a subset of the set of integers.
● Alg1.LQE.B.3: Find the terms of sequences given an explicit or recursive formula. ● ISTE-EMPOWERED LEARNER1.A - articulate and set personal learning goals, develop
strategies leveraging technology to achieve them and reflect on the learning process itself to improve learning outcomes.
● ISTE-EMPOWERED LEARNER1.B - build networks and customize their learning environments in ways that support the learning process.
Unwrapped Concepts (Students need to know)
Unwrapped Skills (Students need to be able to do)
Bloom’s Taxonomy
Levels Webb's DOK
between correlation and causation Distinguish Analyze 2
Board Approved: March 30, 2017 43 | P a g e
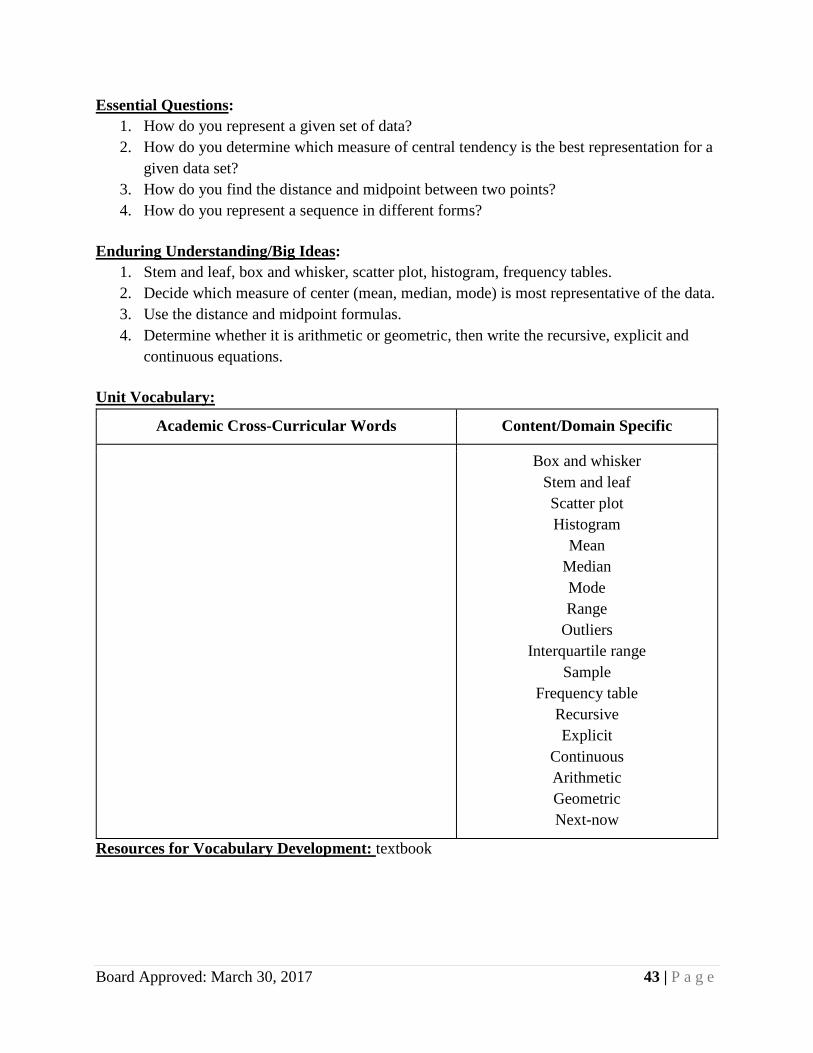
Essential Questions: 1. How do you represent a given set of data? 2. How do you determine which measure of central tendency is the best representation for a
given data set? 3. How do you find the distance and midpoint between two points? 4. How do you represent a sequence in different forms?
Enduring Understanding/Big Ideas:
1. Stem and leaf, box and whisker, scatter plot, histogram, frequency tables. 2. Decide which measure of center (mean, median, mode) is most representative of the data. 3. Use the distance and midpoint formulas. 4. Determine whether it is arithmetic or geometric, then write the recursive, explicit and
continuous equations. Unit Vocabulary:
Academic Cross-Curricular Words Content/Domain Specific
Box and whisker Stem and leaf Scatter plot Histogram
Mean Median Mode Range
Outliers Interquartile range
Sample Frequency table
Recursive Explicit
Continuous Arithmetic Geometric Next-now
Resources for Vocabulary Development: textbook

Board Approved: March 30, 2017 44 | P a g e
Topic 1: Data
Engaging Experience 1 Title: Around the Room Rotation Stations Suggested Length of Time: 45 minutes Standards Addressed Priority:
• Alg1.DS.A.8: Distinguish between correlation and causation. Supporting:
• Alg1.DS.A.3: Interpret differences in shape, center and spreads in the context of the data sets, accounting for possible effects of outliers.
Detailed Description/Instructions: Students will walk around the classroom/hallway solving measures of central tendency or finding the graph to match that measure. Once they find their solution they will need to search around the room/hallway to find their next equation Bloom’s Levels: Analyze Webb’s DOK: 2 Rubric: Answer Key for questions with matching graph will need to be teacher made.
Board Approved: March 30, 2017 45 | P a g e
Engaging Scenario
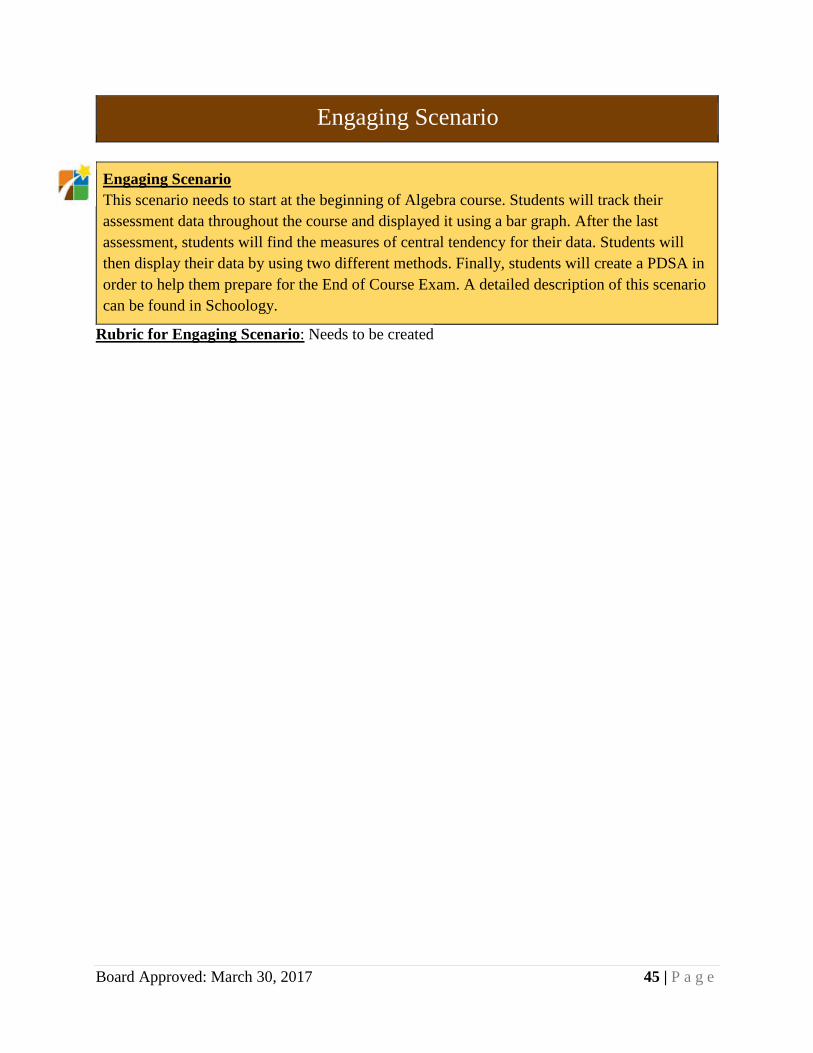
Engaging Scenario This scenario needs to start at the beginning of Algebra course. Students will track their assessment data throughout the course and displayed it using a bar graph. After the last assessment, students will find the measures of central tendency for their data. Students will then display their data by using two different methods. Finally, students will create a PDSA in order to help them prepare for the End of Course Exam. A detailed description of this scenario can be found in Schoology.
Rubric for Engaging Scenario: Needs to be created
Board Approved: March 30, 2017 46 | P a g e
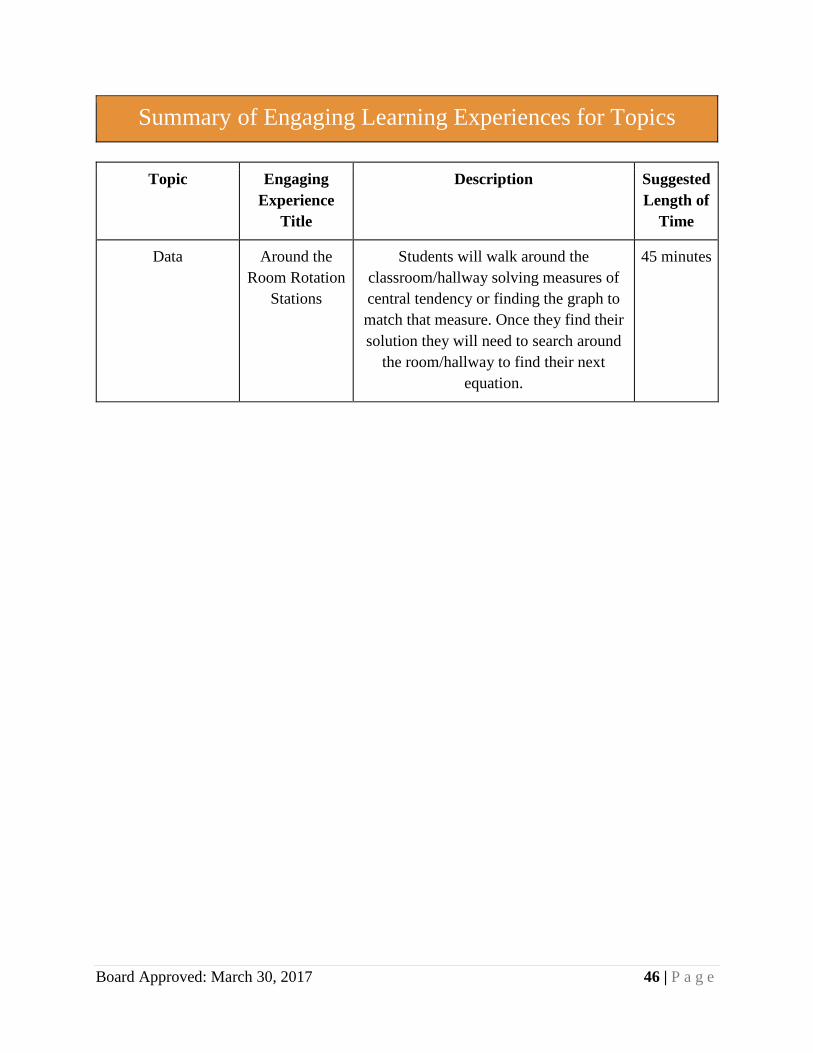
Summary of Engaging Learning Experiences for Topics
Topic Engaging Experience
Title
Description Suggested Length of
Time
Data Around the Room Rotation
Stations
Students will walk around the classroom/hallway solving measures of central tendency or finding the graph to match that measure. Once they find their solution they will need to search around
the room/hallway to find their next equation.
45 minutes

Board Approved: March 30, 2017 47 | P a g e
Unit of Study Terminology
Appendices: All Appendices and supporting material can be found in this course’s shell course in the District’s Learning Management System.
Assessment Leveling Guide: A tool to use when writing assessments in order to maintain the appropriate level of rigor that matches the standard.
Big Ideas/Enduring Understandings: Foundational understandings teachers want students to be able to discover and state in their own words by the end of the unit of study. These are answers to the essential questions.
Engaging Experience: Each topic is broken into a list of engaging experiences for students. These experiences are aligned to priority and supporting standards, thus stating what students should be able to do. An example of an engaging experience is provided in the description, but a teacher has the autonomy to substitute one of their own that aligns to the level of rigor stated in the standards.
Engaging Scenario: This is a culminating activity in which students are given a role, situation, challenge, audience, and a product or performance is specified. Each unit contains an example of an engaging scenario, but a teacher has the ability to substitute with the same intent in mind.
Essential Questions: Engaging, open-ended questions that teachers can use to engage students in the learning.
Priority Standards: What every student should know and be able to do. These were chosen because of their necessity for success in the next course, the state assessment, and life.
Supporting Standards: Additional standards that support the learning within the unit.
Topic: These are the main teaching points for the unit. Units can have anywhere from one topic to many, depending on the depth of the unit.
Unit of Study: Series of learning experiences/related assessments based on designated priority standards and related supporting standards.
Unit Vocabulary: Words students will encounter within the unit that are essential to understanding. Academic Cross-Curricular words (also called Tier 2 words) are those that can be found in multiple content areas, not just this one. Content/Domain Specific vocabulary words are those found specifically within the content.
Symbols:
This symbol depicts an experience that can be used to assess a student’s 21st Century Skills using the rubric provided by the district.
This symbol depicts an experience that integrates professional skills, the development of professional communication, and/or the use of professional mentorships in authentic classroom learning activities.