high school closures in new york city...high school closures in new york city impacts on students’...
TRANSCRIPT
High School Closures in New York City Impacts on Students’ Academic Outcomes, Attendance, and Mobility
REPORT
James J. Kemple
November 2015
James J. Kemple
November 2015
© 2015 Research Alliance for New York City Schools. All rights reserved. You may make copies of and distribute this work for non-commercial educational and scholarly purposes. For any other uses, including the making of derivative works, permission must be obtained from the Research Alliance for New York City Schools, unless fair use exceptions to copyright law apply.
High School Closures in New York City: Impacts on Students’ Academic Outcomes, Attendance, and Mobility
HIGH SCHOOL CLOSURES IN NYC
ACKNOWLEDGMENTS This report has been more than two years in the making and benefited greatly from guidance, insights, and critique provided by colleagues at the Research Alliance and elsewhere. At the Research Alliance, Michael Segeritz was instrumental in clarifying the statistical models and many features of the analytic design. Christy Baker-Smith provided many hours of assistance with data management, early versions of the analysis, and the initial presentations of the empirical findings. Adriana Villavicencio offered constructive feedback on multiple iterations of the findings and drafts of the report. The author is especially grateful for the innumerable discussions with Saskia Levy Thompson about the broader context of high school reform in New York City over the past decade. Saskia’s extraordinary insights were drawn from her more than 15 years of work with the City’s schools as a practitioner at the Urban Assembly, a Research Fellow at MDRC, a Deputy Chancellor at the Department of Education, and Deputy Director for the Research Alliance.
The Research Alliance Steering Committee provided feedback and insights both at an early stage of the report’s development and after the findings had been refined and tested for robustness. Their guidance was instrumental is shaping the nuance and balance with which the findings and policy implications are presented.
Many staff at the New York City Department of Education reviewed iterations of the analysis and provided feedback on drafts of the report. The author is especially grateful for the insights and feedback from Phil Weinberg, Ailish Brady, Michelle Paladino, Josh Winters, and Alice Brown. The author also wishes to thank Rebecca Unterman and Marie-André Somers at MDRC for their careful review and generous feedback on the technical analyses.
Finally, any clarity or coherence in the presentation of the information in this report owes an incalculable debt to Chelsea Farley, the Research Alliance Director of Communications, and Shifra Goldenberg, our Communications Coordinator. Chelsea read and edited multiple drafts of the report and helped craft the discussion section of the report and the brief. Shifra formatted every detail of the text and exhibits, in addition to providing thoughtful input throughout the editorial process. Any remaining problems with clarity and coherence, as well as errors of commission or omission, remain with the author.
Research Alliance publications are made possible by the support of a generous group of funders who underwrite the Research Alliance’s core operations, including flexible research capacity, communications, and public engagement efforts.
These include Carnegie Corporation of New York, the Ford Foundation, the Spencer Foundation, The Wallace Foundation, and the William T. Grant Foundation.
This publication reflects the findings, interpretations, and conclusions of the Research Alliance for NYC Schools, and not necessarily those of our funders.
CONTENTS
Acknowledgments ......................................................................................................................... ii
Contents ........................................................................................................................................ iii
Chapter 1: Introduction ................................................................................................................. 1
About This Report .................................................................................... 3
Important Considerations ........................................................................... 4
Chapter 2: High School Closures in NYC .................................................................................... 6
High School Reform in New York City ........................................................... 6
The Process of Closing Schools ..................................................................... 7
Identifying Students Who Were Most Directly Affected by Closures ....................... 8
Chapter 3: Characteristics of Schools Designated for Closure .............................................. 11
Sample and Data .................................................................................... 11
Identifying Low-Performing Schools ............................................................ 12
Past Performance of Schools ................................................................... 15
Performance Trends ............................................................................. 17
The Interaction Between Student Characteristics and School Performance ............ 20
Chapter Summary .................................................................................. 26
Chapter 4: Impacts on Student Outcomes During the Phaseout Process ............................. 27
Estimating Impacts of the Phaseout Process .................................................... 28
Impacts on Attendance and Academic Outcomes ............................................. 31
Impacts on Student Mobility ...................................................................... 33
“Impacts” for Non-Mobile Students ........................................................... 35
“Impacts” for Mobile Students ................................................................. 37
Chapter Summary .................................................................................. 38
Chapter 5: Impacts on Student Outcomes After Schools Closed ........................................... 40
Identifying Students in the Post-Closure Cohort .............................................. 41

HIGH SCHOOL CLOSURES IN NYC
Where Did Students Attend High School When Their Most Likely Option Closed? .... 43
Were Students Better Off (in Terms of Academic Performance and Attendance) After Their Most Likely High School Option Closed? ....................................................... 45
Chapter Summary .................................................................................. 48
Chapter 6: Discussion ................................................................................................................. 49
What Should Readers Consider When Interpreting These Results? ........................ 50
What Do the Findings Suggest for Policy? ...................................................... 51
Table and Figure Notes ............................................................................................................. 53
Endnotes .................................................................................................................................... 58
References ................................................................................................................................. 62
Find this report online at: http://steinhardt.nyu.edu/research_alliance/publications/hs_closures_in_nyc
1
CHAPTER 1: INTRODUCTION The dismal results of some of America’s large urban high schools have been well documented. In his seminal 2004 report, Johns Hopkins University researcher Robert Balfanz identified more than 2,000 “dropout factories” around the country—schools that were failing to graduate a large proportion of the 2.6 million students they were serving. This report singled out New York City as having the highest concentration of “dropout factories” in the nation. A decade later, Balfanz reported that the number of “dropout factories” in the U.S. had dropped substantially, to about 1,300 schools, with the reduction coming from a combination of school closings and successful turnaround efforts. Still, in spite of this progress, approximately 1.4 million students, mostly students of color from low-income families, continue to be funneled into “dropout factories,” where at least 4 in 10 will not earn a high school diploma.1
The prolonged track record of poor performance at these and other schools came under intense scrutiny with the passage of the No Child Left Behind Act (NCLB) in 2001.2 NCLB reflected a national movement to shine a bright light on chronically low-performing schools, invest in intensive efforts to turn them around, and then hold them accountable if they failed to improve. Under the law, schools not making “adequate yearly progress” were subject to sanctions ranging from state-imposed school improvement plans to restructuring, including the possibility of outright closure.
Many districts, including New York City, responded with large-scale efforts to transform or eliminate persistently struggling schools. Policymakers used a range of terms to describe these efforts, including “redesigns,” “restarts,” “reconstitution,” “phase out,” or simply “closure.” This constellation of approaches gained additional momentum in 2009, when the federal government provided a $3.5 billion infusion to the School Improvement Grant (SIG) program as part the stimulus package. SIG grants could be used to implement four possible turnaround models, including “restart” and “closure.”3
The strategy of closing schools has been accompanied by intense politically and emotionally charged controversy. In cities around the country, school closures have sparked lawsuits and protests, with advocates arguing that their district hadn’t invested enough in school improvement efforts, and that students would be harmed by the elimination of an important neighborhood institution. Students enrolled in schools designated for closure were often described in the press as casualties—bearing

2 HIGH SCHOOL CLOSURES IN NYC
the brunt of persistent school failure and having their lives further disrupted when officials decided to close their school. In New York City, where the district elected to close high schools by phasing them out over time, a New York Times writer described “the purgatory of schools marked for closing,” with “elective classes and after-school programs falling away” and “favorite teachers seeking new jobs.”4
However, despite the general sense that closure policies are controversial and painful, there is little rigorous evidence about what actually happens to students during and after a performance-based school closure. Our search turned up four studies of school closures (Carlson and Lavertu, 2015; Brummet, 2014; Engberg, Gill, Zamarro, and Zimmer, 2012, and de la Torre and Gwynne, 2009).5 None of these studies focused on high schools; thus, they offer little insight into the distinctive consequences of school closures for the developmental and academic needs of this population.
The studies differ from ours in other ways as well. They include a mix both enrollment-driven and performance-based closures. As a result, the studies offer limited information about the efficacy of school closures as a tool for school or system improvement. In addition, all of these studies focus on strategies in which schools were designated for closure at the end of one school year, with students being forced to transfer to another school the following year. Thus, the main question they address is whether forcing students to transfer to another school helps or harms student performance. These studies do not examine school closures as a phaseout process and offer no evidence on whether such a phaseout strategy might have particular negative consequences (e.g., students “languishing” in schools as they are phased out) or, conversely, benefits (e.g., increased personalized attention as the school gradually shrinks in size).
Finally, findings, both within and across these studies, offer a mix of positive, negative, and null effects. It is not clear whether this mix of results is an artifact of the different rationales for closure, differences across the populations of students being affected, or the methodologies that were used. In short, none of the existing studies of school closure focus explicitly on the effects of performance-based closures for high school students, nor do they focus on closures that occurred as a phaseout process, in which students were given the option to stay in their high school until their scheduled graduation or transfer to another school before then.
As the U.S. Congress debates the future of NCLB,6 and districts continue to grapple with the 1,300 “dropout factories” that remain, it is imperative that we build better evidence about the range of options available for dealing with chronically low-
3
performing high schools. Does a phaseout process help or harm students who are enrolled in a high school while it is being phased out? Are prospective enrollees better off if they no longer have the option of attending a high school that was shut down because of low performance? Answers to these questions can help inform the work of policymakers, practitioners, advocates, and school communities around the country.
About This Report To begin building this evidence, the Research Alliance for New York City Schools has undertaken a rigorous study of high school closures that occurred between 2002 and 2008 in New York City. NYC provides a unique opportunity to examine the impact of school closures, both because of the relatively large number of high schools that have been phased out (a total of 44 between 2000 and 2012) and because of the rich longitudinal data base that is available to follow the cohorts of students who entered high schools before, during, and after the phaseout process. This report presents the full results of our analyses; a summary highlighting key findings is also available on our website.
Chapter 2 of the report describes the unique context in which New York City’s high school closures transpired. First, the chapter describes the magnitude of the school reform challenge in New York City at the outset of the 21st century—when 40 percent of high school students were enrolled in a high school graduating fewer than half its students. Next, it outlines the City’s three-pronged high school reform strategy, which attempted to redistribute students from failing schools to a portfolio of new high school options. The chapter also discusses the phaseout process by which high schools were closed and replaced by new, small schools, often in spaces vacated by the closing schools. The chapter concludes with a discussion of the students who were most likely to be affected by the high school closures and who are the focus of the impact analysis presented in this report.
Chapter 3 compares the schools designated for closure with other schools throughout the City, to explore the following questions:
• Were high schools designated for closure really the lowest-performing high schools in New York City? Was their low performance a recent phenomenon or a general trend over several years?
• To what extent was their low performance an artifact of the background characteristics and prior performance of the students they served? And to what
4 HIGH SCHOOL CLOSURES IN NYC
extent did it reflect the relatively limited progress that students made during high school?
Because New York City’s closures were conducted as a phaseout process, rather than an immediate dissolution of the school, Chapter 4 looks at the impact of the process on the students who were enrolled in one of the high schools at the time it was designated for closure. Specifically, the chapter examines:
• To what extent did the phaseout process itself influence students’ likelihood of dropping out or moving to another school (mobility), their attendance, and their academic performance?
Chapter 5 focuses on students who were compelled to choose and attend other high school options, because their local school had been closed and was no longer available. This section addresses the following questions:
• Where did these students enroll instead?
• How did having to opt for a different school affect students’ mobility, attendance, and academic performance?
Lastly, Chapter 6 discusses potential implications of the findings for policy, practice, and future research.
Important Considerations While this report offers a uniquely rigorous analysis of the impact of performance-based school closures on student mobility, attendance, and performance during high school, there are several important factors that should inform readers’ understanding and interpretation of the findings presented here. First, this report focuses on the two groups of students who were most directly affected by the closure decision—that is, those enrolled in a school during the phaseout process and those who likely would have attended the school if it had not been closed. We recognize that a closure may also affect a school’s teachers, administrators, and surrounding community, not to mention the potential impact on other schools in the system (e.g., because they receive transfer students from a school that is being phased out or have to absorb new 9th graders who might otherwise have gone to the closing school). While assessing the impact on these groups lies beyond the scope of the current study, decisions about closing schools should certainly take into account these other potential effects, in addition to the impact on students attending or in line to attend a closing school.
5
Second, as discussed in the methodology sections of Chapters 3 and 4, the analyses undertaken for this study attempt to isolate the impact of the closure process over and above the many other factors that could influence students’ engagement and performance in school. For example, as we describe in Chapter 2, New York City was implementing a wide range of systemic reforms during this period.7 Some of these initiatives applied to all schools in the district, while others, such as the threat of closure, were applied largely to the City’s lowest-performing schools. Furthermore, students’ individual background characteristics and performance in middle school have strong influences on their engagement and performance during high school. The methods used for this study attempt to isolate the effects of the closure process from three sets of other important influences:
• Pre-existing policies and practices. The analysis examines student performance over the three or four years leading up to the closure decision to identify whether the closure process created a break in historical trends.
• Other school improvement efforts aimed at low-performing schools in New York City during the same period. The analysis compares trends in the phaseout schools with simultaneous trends in other low-performing schools that avoided closure.
• Students’ background characteristics and past performance. The analysis uses statistical models that control for observed differences between students in the closing schools and students from past cohorts and between students from the closing schools and from other low-performing schools. These models include both demographic characteristics and measures of students’ middle school attendance and performance.
Despite these rigorous analytic strategies, it is still possible that there were some other, unmeasured factors not fully accounted for in our analysis, which also impacted students’ outcomes.
Finally, while the analysis provides a reliable estimate of the overall impact of the closure process on student outcomes, it stops short of dissecting the influence of specific features of the phaseout process. Said differently, we cannot identify the precise mechanisms that explain closures’ impact or lack thereof. Future work on closures should examine such factors as staff composition and mobility, faculty and student morale, and interpersonal relationships, to achieve a richer understanding of how closures impact school communities and student outcomes.
6 HIGH SCHOOL CLOSURES IN NYC
CHAPTER 2: HIGH SCHOOL CLOSURES IN NYC Beginning in 2002, New York City implemented an expansive high-stakes accountability system with rewards and penalties based largely on student outcomes, most notably achievement test scores and high school graduation rates. The City’s new approach to accountability was accompanied by a systemic shift toward “principal empowerment,” whereby school leaders were given unprecedented autonomy and were expected to use it to innovate and improve their schools. City press releases at the time described “a new culture that places a premium on real empowerment and true accountability, a culture where leadership is valued, success is rewarded and failure is not accepted.”8
Primary among the areas targeted for improvement were New York City’s high schools, where the magnitude of what was being described nationally as a “high school crisis” was unparalleled and taking a heavy toll on the City’s most vulnerable adolescents. Robert Balfanz’s high-profile study used an indicator called “promoting power” (the size of the senior class relative to the freshman class three years earlier), to assess schools’ capacity to keep students in school through their expected, on-time graduation. Balfanz designated schools as “dropout factories” if their promoting power fell below 0.60. His 2004 report identified over 100 New York City high schools as “dropout factories” for the Class of 2002. Subsequent analysis by the Research Alliance found that approximately 7 in 10 high school students attended a school in 2001-2002 that met Balfanz’s criteria as a “dropout factory.”
The present study focuses on the 29 high schools that were designated for closure between the 2002-2003 and 2008-2009 academic years. All but two of these schools met Balfanz’s definition of a “dropout factory” in the 2001-2002 school year. 9 These 27 schools enrolled a total of just over 50,000 students, and 9th graders outnumbered 12th graders by approximately four to one (an average “promoting power” of .26). As discussed in more detail in Chapter 3, the socio-economic characteristics and prior performance of these students indicate that they were among the most vulnerable in the New York City public school system.
High School Reform in New York City New York City had previously closed low-performing high schools, and there was a burgeoning effort underway to transform large, comprehensive high schools into smaller learning communities. However, beginning in the 2003-2004 school year,
7
the New York City Department of Education (DOE) significantly expanded both of these strategies, making closure a signature element of a high school reform strategy built on three interlocking pillars:
• Eliminating the worst schools in the system by closing failing, “factory-style” high schools. During the time period of this study (2002 to 2008), the DOE initiated the closure of 29 low-performing high schools.
• Increasing the supply of better options by creating new, small high schools. These closures were accompanied by the creation of more than 200 new high schools, which were often located in the buildings that had housed the closed schools.10
• Enabling families to select their high school through a universal high school choice process. In 2004, the DOE introduced the High School Application Processing System, in which nearly 80,000 8th graders per year rank their preferred choices and are subsequently matched to a high school.11
Any effort to assess the impact of high school closures in New York City must be attentive to the fact that the closure process was not a standalone strategy for school reform, but rather one of three deeply connected approaches. By linking closures with the creation of new schools and the expansion of high school choice, district leaders aimed to upgrade the educational options of students who had historically been assigned to failing schools largely by virtue of their residence. For example, the impact of a high school closure on students who were compelled to attend a different high school once their local school was closed includes the effect of the new options available to those students due to the creation of new small schools and the open choice process. This has important implications for policymakers who may wish to draw on the New York City experience as they debate the efficacy of schools closures as a reform tool.
The Process of Closing Schools The measures and criteria the NYC DOE used to determine that a school would be closed were evolving during the period we studied. DOE central office leaders typically identified low-performing schools based on historical trends in graduation rates, as well as other factors. Schools that were deemed failing were then assessed to determine their capacity to turn around with additional resources and supports. This process for identifying and implementing school closures became more codified over
8 HIGH SCHOOL CLOSURES IN NYC
time, eventually incorporating multiple measures of school performance as well as documentation of school improvements made and action plans going forward. However, during the period covered by this report, the district was frequently critiqued for making closure decisions in a manner that was opaque and unregulated.12
Once the decision to close a school was finalized, the district began the process of phasing the school out by ceasing to admit new 9th graders. The existing student body was allowed to transfer to another high school or continue to attend the school until the year of their expected graduation.13 As a result, over the three years following the decision to close a school, enrollment declined steadily, as new students were no longer admitted and current students graduated, transferred, or dropped out. Typically, at the end of the three years, any remaining students were required to transfer to another school.
The gradual phaseout of closed schools concurrent to the gradual phase in of new schools in the same building had two important implications for the overall reform strategy. First, the new schools only admitted new 9th grade students. This meant that they did not serve students who had already fallen behind in their progress toward graduation and might need special accommodations to make up the course credits or Regents examinations they failed previously. Second, students from the closing schools were not able to enroll in the new schools because the new schools were not yet serving those grade levels. This meant that there was a clear break established between the closed schools and the replacement schools. This process ensured that the new, small schools were started from scratch—serving different grade levels, staffed with predominantly new principals, teachers, and others, and often organized around themes and educational philosophies that were distinct from the closed schools that preceded them.
Identifying Students Who Were Most Directly Affected by Closures As noted above, this study focuses on the 29 low-performing high schools designated for closure between the 2002-2003 and 2008-2009 school years.14 At the time of the closure decisions, these schools enrolled an average of nearly 1,750 students each, including an average of 330 first-time 9th graders.15 Because they were just beginning their high school careers when closure was announced, these 9th-grade students had maximum exposure to the phaseout process. Thus, the analyses undertaken for this study first examine the impact of the phaseout process on 9,600 first-time 9th graders

9
who were enrolled in one of these 29 schools when the DOE announced that it would be closed. For the purposes of this report, these students are referred to as the “phaseout cohort.” Chapter 4 begins by outlining several hypotheses about the potential impacts of the phaseout process on these students. The chapter goes on to present the results of the analyses we conducted to estimate the impact on a range of the short- and long-term outcomes, including graduation rates.
Our analyses also examine the impact of these 29 closures on students who likely would have enrolled in the closing schools if they had remained open, but who were forced to choose other options. We identified approximately 11,000 rising 9th graders who fell into this category. For the purposes of this report, these students are referred to as the “post-closure cohort.”
As with the phaseout cohort, there were many potential sources of influence on the post-closure cohort. Chapter 5 begins by outlining several hypotheses about the potential impacts of the school closures on these students. The chapter goes on to present the results of our analyses examining closure’s impact, again, on a range of short- and long-term outcomes for these students.
In general, the analyses presented in this report focus on the overall effect of school closures on student mobility, attendance, and performance, for both the phaseout and post-closure cohorts. In other words, the study examines the extent to which the confluence of potential negative and positive factors together resulted in a net reduction or improvement in student outcomes. As noted above, it is beyond the scope of the current study to trace the specific sources of influence that evolve from the phaseout process or from students being compelled to choose another school when their most likely option was taken off the table. We hope that further research will be able to pick up where this study leaves off to examine the key sources of any effects we uncover.
10 HIGH SCHOOL CLOSURES IN NYC
Definitions of Key Terms
Closure schools/phaseout schools: The 29 NYC high schools designated for closure between 2002 and 2008, and the focus of this report.
Phaseout process: School closures in NYC were implemented as a phaseout process. Once the decision to close a school was finalized, the district stopped admitting new 9th graders. The existing student body was allowed to transfer to another high school or continue to attend the closing school until the year of their expected graduation. As a result, over the three years following the decision to close a school, enrollment declined steadily, as new students were no longer admitted and current students graduated, transferred, or dropped out. Typically, at the end of the three years, any remaining students were required to transfer to another school.
Pre-phaseout cohort: Students who attended one of the 29 schools that was later designated for closure, but who enrolled in 9th grade before the closure decision was made for that school.
• For 9th grade outcomes, includes students who were in 9th grade in the four years leading up to the closure decision for a school.
• For 10th grade outcomes, includes students who were scheduled to be in 10th grade in the three or four years* leading up to the closure decision for a school.
• For 11th grade outcomes, includes students who were scheduled to be in 11th grade in the three or four years* leading up to the closure decision for a school.
• For 12th grade/cumulative outcomes, includes students who were scheduled to be in 12th grade in the three or four years* leading up to the closure decision for a school.
The analyses in this report use three or four pre-phaseout cohorts for each closure school, depending on the availability of data, to establish historical trends for each school (see Appendix B for further details).
Phaseout cohort: Students who began 9th grade in a school in the same year that a closure decision was announced (i.e., the final cohort of 9th graders admitted to a closing school); these are the students who had maximum exposure to the phaseout process.
Post-closure cohort(s): Students who likely would have enrolled in closed schools if they had remained open, but were forced to choose other options. See page 41 for a description of the methods used to identify the post-closure cohort. These students all enrolled in 9th grade in the year after the closure decision for the specific closure school they were matched to. For the purposes of this report, students in the post-closure cohort are also sometimes referred to as displaced students. Please note that our use of this term is distinct from other studies, where “displaced students” may refer to students who were displaced from a school they were already attending when it shut down between school years.
Comparison schools: We identified a set of very low-performing NYC schools that avoided a closure decision in the period between 2002 and 2008. Students who were enrolled in these schools at the same time as the pre-phaseout, phaseout, and post-closure cohorts are used as comparisons in the relevant sections of this report. Some of these schools were subsequently designated for closure. Schools are excluded from the comparison group for a given year if they were identified for closure within the following five years.
* Depending on data availability.
11
CHAPTER 3: CHARACTERISTICS OF SCHOOLS
DESIGNATED FOR CLOSURE This chapter examines the question of whether the schools identified for closure between 2002 and 2008 were, in fact, the lowest-performing schools at the time of those decisions. It does so by assessing the relative performance of the majority of New York City high schools during this period, based on multiple measures of student engagement and performance. The goal is to determine whether the schools identified for closure consistently ranked at the bottom of the distribution of these school performance indicators. The chapter also examines the degree to which low performance was a recent phenomenon or whether schools had been on a consistent trajectory of low performance over time. Finally, the chapter assesses the extent to which the schools’ low performance was a function of students’ background characteristics and academic achievement prior to arriving in high school, as opposed to the high schools’ inability to build on students’ strengths, support improvement, and fill gaps in students’ skills.
Sample and Data The sample used to address the questions in this chapter includes 322 high schools that admitted at least four cohorts of first-time 9th graders between 1999 and 2008.16 The number of schools in the sample increased dramatically over time: 170 high schools are included from 1999, while 295 high schools are included from 2008. During the same period, the average size of the high schools in New York City declined significantly, with an average of 348 9th graders entering each high school in 1999 and an average of 212 entering each school in 2008.
Our analyses of the characteristics and performance of the schools are based on the characteristics and outcomes of students who began their high school careers between 1999 and 2008. A total of 794,216 students first enrolled in these high schools during these years. The data include information about student demographic characteristics, their attendance and achievement during middle school, and the outcomes they achieved during high school. The specific data elements are described as they are introduced later in the chapter.
12 HIGH SCHOOL CLOSURES IN NYC
Identifying Low-Performing Schools As noted earlier, the criteria and process for identifying high schools for closure was evolving between 2002 and 2008. One constant, however, was a careful assessment of historical trends in student outcomes. While these were not the only considerations in the decision to close a school, the NYC DOE intended to focus on those schools with a persistent track record of student failure, including high dropout rates and low attendance, credit accumulation, and graduation rates. In this section of the report, we assess the extent to which the schools designated for closure actually exhibited this pattern of low performance.
Our analysis begins with a year-by-year ranking of the high schools in the sample, based on 10 performance indicators: 9th grade attendance rates; on-track rates at the end of the 9th, 10th, and 11th grade; credit and Regents test accumulation by grade 12; dropout and transfer rates; high school graduation rates; and rates of receiving a Regents diploma. These measures were averaged over two to four years prior to each of the district’s school closure decisions in 2002 through 2008. For each of these years, all schools in the sample were then ranked on each measure relative to the lowest performance for that measure in that year. The combination of these relative rankings yielded a “performance index” that reflects the overall difference between a school’s performance and the lowest performance in the system for a given year.17
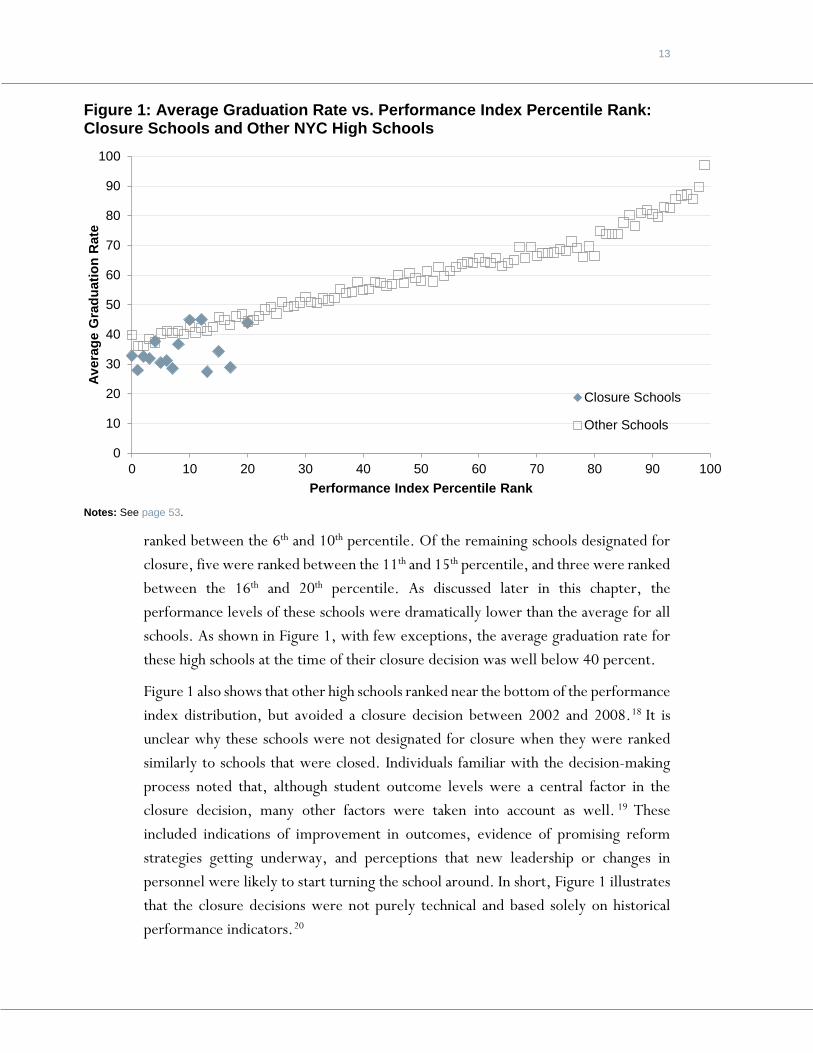
Figure 1 illustrates the relationship between the overall percentile ranking on the index and the school’s average graduation rate. Each point represents the group of schools that were ranked in a given percentile at least once between 2002 through 2008 (the diamonds represent the schools identified for closure between 2002 and 2008 and the squares represent other NYC high schools). Overall, Figure 1 shows a very strong association between graduation rates and the percentile ranking based on the 10-component index. In other words, schools with low graduation rates are ranked low on the overall index, while schools with high graduation rates are ranked high based on the index. This is not surprising since the graduation rate is included in the index—and is likely the culmination of many other outcomes included on the index as well.
More importantly, the figure shows that all the schools identified for closure were ranked in the bottom 20 percent of schools in the district at the time of the closure decision. In fact, 15 schools were ranked in the bottom 5 percent, and six others were
13
ranked between the 6th and 10th percentile. Of the remaining schools designated for closure, five were ranked between the 11th and 15th percentile, and three were ranked between the 16th and 20th percentile. As discussed later in this chapter, the performance levels of these schools were dramatically lower than the average for all schools. As shown in Figure 1, with few exceptions, the average graduation rate for these high schools at the time of their closure decision was well below 40 percent.
Figure 1 also shows that other high schools ranked near the bottom of the performance index distribution, but avoided a closure decision between 2002 and 2008.18 It is unclear why these schools were not designated for closure when they were ranked similarly to schools that were closed. Individuals familiar with the decision-making process noted that, although student outcome levels were a central factor in the closure decision, many other factors were taken into account as well. 19 These included indications of improvement in outcomes, evidence of promising reform strategies getting underway, and perceptions that new leadership or changes in personnel were likely to start turning the school around. In short, Figure 1 illustrates that the closure decisions were not purely technical and based solely on historical performance indicators.20
Figure 1: Average Graduation Rate vs. Performance Index Percentile Rank: Closure Schools and Other NYC High Schools
Notes: See page 53.
0
10
20
30
40
50
60
70
80
90
100
0 10 20 30 40 50 60 70 80 90 100
Aver
age
Gra
duat
ion
Rat
e
Performance Index Percentile Rank
Closure Schools
Other Schools

14 HIGH SCHOOL CLOSURES IN NYC
Table 1 below shows the number of schools in the sample for each closure decision year. The first row shows the number of schools that were identified for closure in each year. The second row shows the number of schools in the bottom 10 percent of the performance index that were not identified for closure. The third row shows all other high schools in the sample. The increase, over time, in the number of schools shown in the second and third rows reflects an increase in the total number of high schools in New York City during this period.
In this report, schools that were ranked at the bottom of the performance index for a given year, but not identified for closure that year, serve as the primary point of comparison for the closing schools. All of these comparison schools were ranked in the bottom 10 percent of schools, and all but eight were ranked in the bottom 5 percent. The number of schools in the comparison group is shown in parentheses in the second row of the table. As discussed later in this chapter, these schools exhibited similar outcome levels and trends as those seen for schools that were identified for closure during the same period.
Table 1: Sample of Schools by School Year
School Year
2001-2002
2002-2003
2003-2004
2004-2005
2005-2006
2006-2007
2007-2008
Schools designated for closure 8 5 2 2 5 5 2
Schools in the bottom 10% of performance index that were not designated for closure (Comparison Schools)
10 (9)
14 (8)
15 (3)
17 (3)
19 (6)
25 (8)
29 (3)
Other schools in the sample 153 155 160 174 202 257 290
Total 170 168 165 179 213 270 295
Notes: See page 53.
15
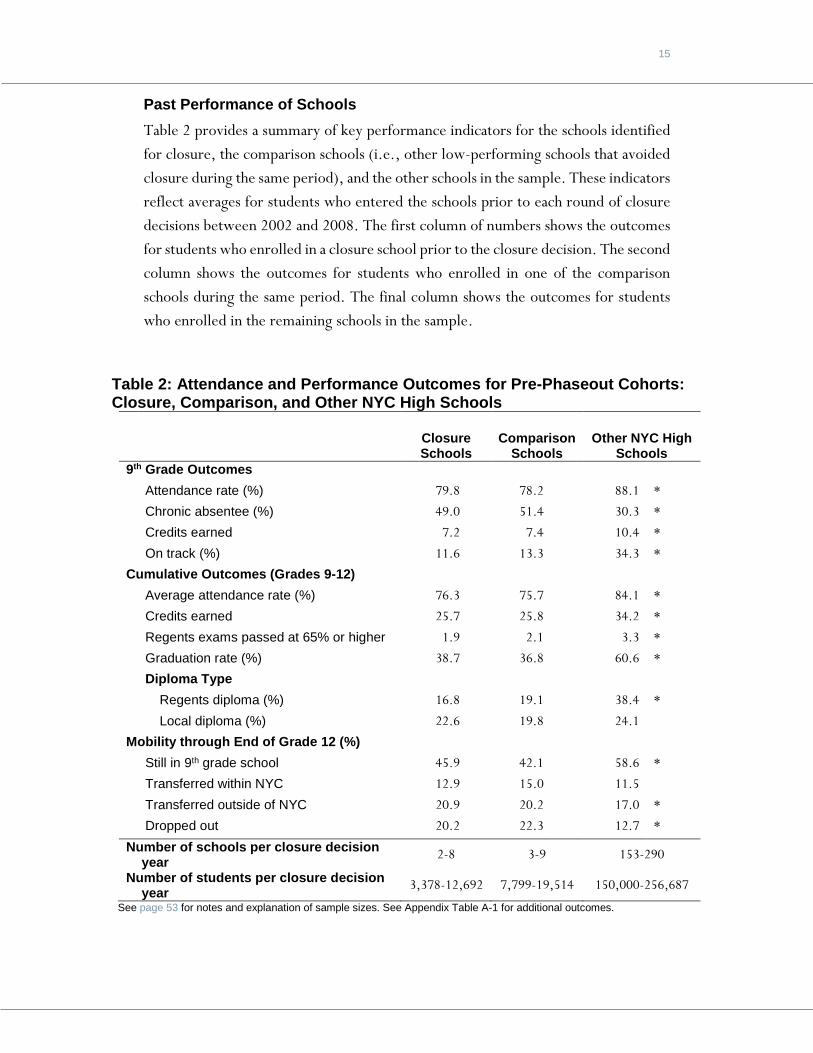
Past Performance of Schools Table 2 provides a summary of key performance indicators for the schools identified for closure, the comparison schools (i.e., other low-performing schools that avoided closure during the same period), and the other schools in the sample. These indicators reflect averages for students who entered the schools prior to each round of closure decisions between 2002 and 2008. The first column of numbers shows the outcomes for students who enrolled in a closure school prior to the closure decision. The second column shows the outcomes for students who enrolled in one of the comparison schools during the same period. The final column shows the outcomes for students who enrolled in the remaining schools in the sample.
Table 2: Attendance and Performance Outcomes for Pre-Phaseout Cohorts: Closure, Comparison, and Other NYC High Schools
Closure Schools
Comparison Schools
Other NYC High Schools
9th Grade Outcomes Attendance rate (%) 79.8 78.2 # 88.1 * Chronic absentee (%) 49.0 51.4 # 30.3 * Credits earned 7.2 7.4 # 10.4 *
On track (%) 11.6 13.3 # 34.3 *
Cumulative Outcomes (Grades 9-12) Average attendance rate (%) 76.3 75.7 0 84.1 * Credits earned 25.7 25.8 0 34.2 *
Regents exams passed at 65% or higher 1.9 2.1 0 3.3 * Graduation rate (%) 38.7 36.8 # 60.6 * Diploma Type Regents diploma (%) 16.8 19.1 # 38.4 *
Local diploma (%) 22.6 19.8 # 24.1 0
Mobility through End of Grade 12 (%) Still in 9th grade school 45.9 42.1 0 58.6 * Transferred within NYC 12.9 15.0 0 11.5 0
Transferred outside of NYC 20.9 20.2 0 17.0 * Dropped out 20.2 22.3 # 12.7 *
Number of schools per closure decision year 2-8 3-9 153-290
Number of students per closure decision year 3,378-12,692 7,799-19,514 150,000-256,687
See page 53 for notes and explanation of sample sizes. See Appendix Table A-1 for additional outcomes.
16 HIGH SCHOOL CLOSURES IN NYC
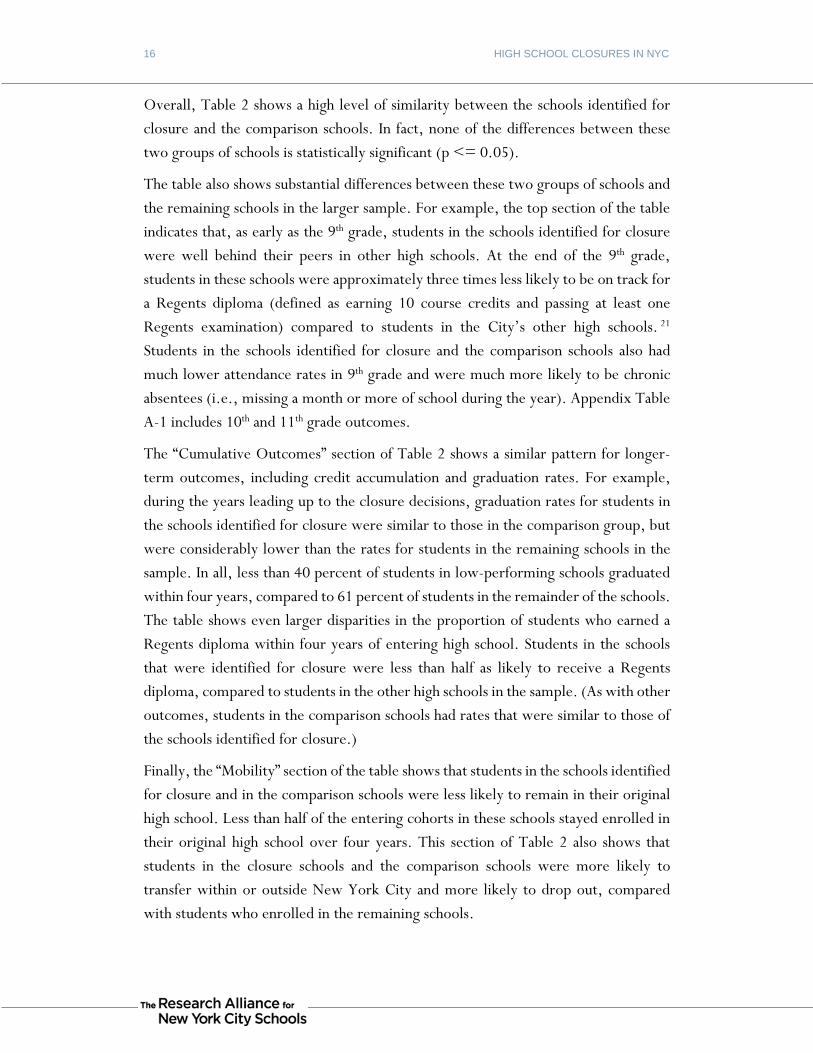
Overall, Table 2 shows a high level of similarity between the schools identified for closure and the comparison schools. In fact, none of the differences between these two groups of schools is statistically significant (p <= 0.05).
The table also shows substantial differences between these two groups of schools and the remaining schools in the larger sample. For example, the top section of the table indicates that, as early as the 9th grade, students in the schools identified for closure were well behind their peers in other high schools. At the end of the 9th grade, students in these schools were approximately three times less likely to be on track for a Regents diploma (defined as earning 10 course credits and passing at least one Regents examination) compared to students in the City’s other high schools. 21 Students in the schools identified for closure and the comparison schools also had much lower attendance rates in 9th grade and were much more likely to be chronic absentees (i.e., missing a month or more of school during the year). Appendix Table A-1 includes 10th and 11th grade outcomes.
The “Cumulative Outcomes” section of Table 2 shows a similar pattern for longer-term outcomes, including credit accumulation and graduation rates. For example, during the years leading up to the closure decisions, graduation rates for students in the schools identified for closure were similar to those in the comparison group, but were considerably lower than the rates for students in the remaining schools in the sample. In all, less than 40 percent of students in low-performing schools graduated within four years, compared to 61 percent of students in the remainder of the schools. The table shows even larger disparities in the proportion of students who earned a Regents diploma within four years of entering high school. Students in the schools that were identified for closure were less than half as likely to receive a Regents diploma, compared to students in the other high schools in the sample. (As with other outcomes, students in the comparison schools had rates that were similar to those of the schools identified for closure.)
Finally, the “Mobility” section of the table shows that students in the schools identified for closure and in the comparison schools were less likely to remain in their original high school. Less than half of the entering cohorts in these schools stayed enrolled in their original high school over four years. This section of Table 2 also shows that students in the closure schools and the comparison schools were more likely to transfer within or outside New York City and more likely to drop out, compared with students who enrolled in the remaining schools.
17
Performance Trends When identifying low-performing schools, district administrators should be cautious about assessing performance based on a single year or even an average over several years. This is because a single year or an average may mask more positive (or more negative) trends over time. For example, averages over several years may mask a trend of gradually improving (or declining) graduation rates, which might influence judgments about a school’s performance trajectory. An improving school might continue on its positive trajectory with additional supports, while a pattern of declining or stagnant outcomes might suggest that a school is beyond help, particularly if additional supports have already been made available. On the other hand, a relatively low graduation rate in any given year could be an aberration from a pattern of consistently higher or improving graduation rates. In such cases, it may be appropriate to discount the aberration and wait to see what happens to the graduation rate in future years.
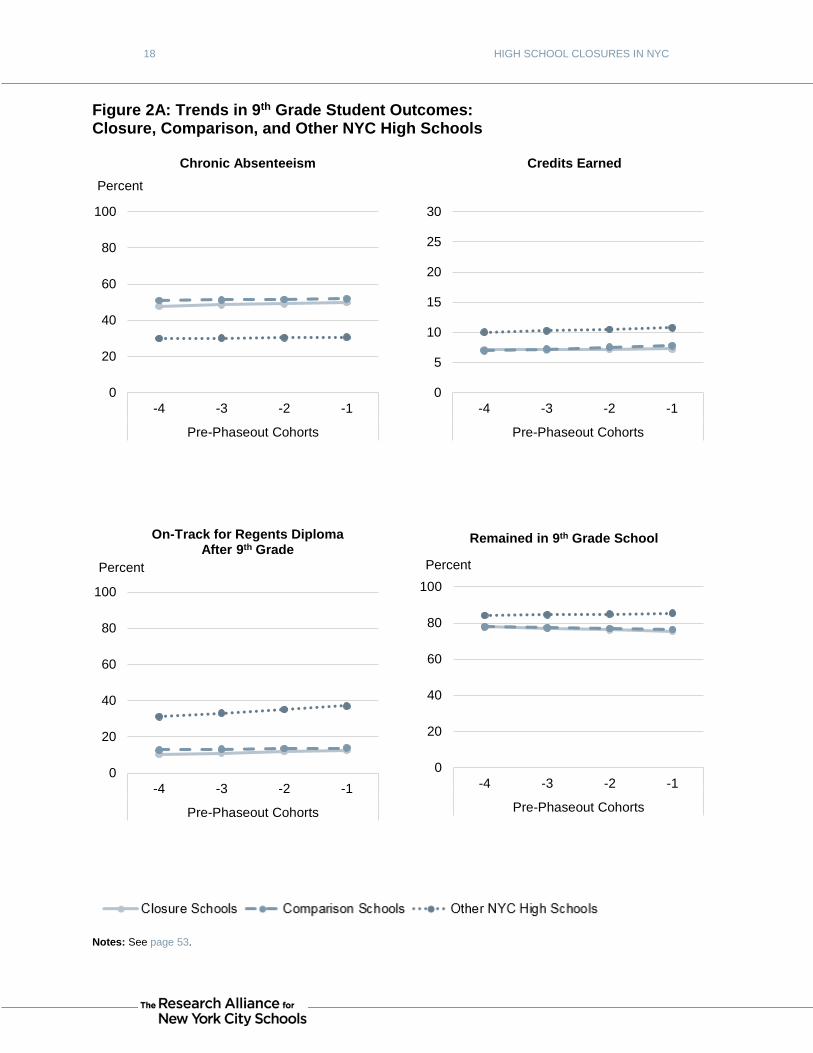
Figures 2a and 2b show trends over time in selected performance measures for each of the three groups of schools. The figures disaggregate the averages presented in Table 2 to illustrate changes that may have occurred over the four years leading up to the closure decisions. Figure 2a presents trends in selected 9th grade outcomes for students who entered high school over the four years leading up to the closure decisions. It shows consistently lower performance among the schools identified for closure and for comparison schools, versus the remaining schools in the sample. In general, the performance trends were stable for all three groups, with the exception of a slight increase in on-track rates for the comparison schools and the other schools.
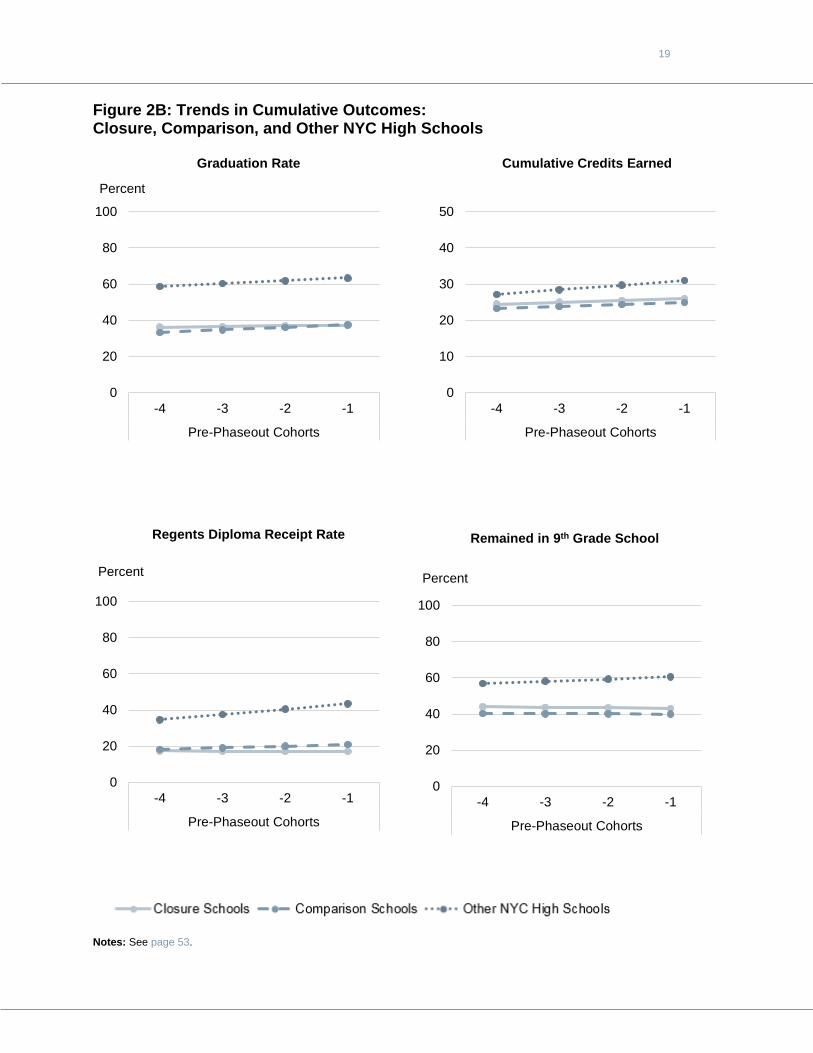
Figure 2b presents trends in selected cumulative outcomes over grades 9 through 12, including attendance, credit accumulation, graduation, and Regents diploma receipt rates. These trends reflect outcomes for students who were scheduled to complete high school over the four years leading up to the closure decision.22 In general, each graph shows that the trends for the schools identified for closure and for the comparison schools fall well below those of the remaining schools. With the exception of credit accumulation, the trends for schools identified for closure were generally stable, if not declining slightly. The graduation and Regents diploma receipt rates for the comparison schools and the remaining schools in the sample reflect a slight increase during the same period.
18 HIGH SCHOOL CLOSURES IN NYC
Figure 2A: Trends in 9th Grade Student Outcomes: Closure, Comparison, and Other NYC High Schools
Notes: See page 53.
0
20
40
60
80
100
-4 -3 -2 -1
Pre-Phaseout Cohorts
Percent
Chronic Absenteeism
0
5
10
15
20
25
30
-4 -3 -2 -1
Pre-Phaseout Cohorts
Credits Earned
0
20
40
60
80
100
-4 -3 -2 -1
Pre-Phaseout Cohorts
Percent
On-Track for Regents DiplomaAfter 9th Grade
0
20
40
60
80
100
-4 -3 -2 -1
Pre-Phaseout Cohorts
Percent
Remained in 9th Grade School
19
Figure 2B: Trends in Cumulative Outcomes: Closure, Comparison, and Other NYC High Schools
Notes: See page 53.
0
20
40
60
80
100
-4 -3 -2 -1
Pre-Phaseout Cohorts
Percent
Graduation Rate
0
10
20
30
40
50
-4 -3 -2 -1
Pre-Phaseout Cohorts
Cumulative Credits Earned
0
20
40
60
80
100
-4 -3 -2 -1
Pre-Phaseout Cohorts
Percent
Regents Diploma Receipt Rate
0
20
40
60
80
100
-4 -3 -2 -1
Pre-Phaseout Cohorts
Percent
Remained in 9th Grade School
20 HIGH SCHOOL CLOSURES IN NYC
The Interaction Between Student Characteristics and School Performance When assessing high school performance, particularly for high-stakes decisions about whether to close a school, it is important to take into account the characteristics and prior school performance that students bring into the school when they initially enroll. This is because students’ background characteristics and prior performance are especially strong predictors of their future performance, regardless of which high school they attend. For example, students with a history of chronic absenteeism or low achievement in middle school are at particularly high risk of being disengaged, failing courses, and not graduating from high school.
Consider a cohort of students who first entered a New York City high school in 2002. Of the students in this cohort, 57 percent of those with high levels of 8th grade attendance (95 percent or higher) graduated from high school within four years. By contrast, only 10 percent of students who very low 8th grade attendance (less than 85 percent) graduated on time. Similarly, 66 percent of students who scored in the top 20 percent of 8th grade test scores graduated from high school within four years, compared to 6 percent of those in the bottom 20 percent. Although graduation rates increased over time for most groups of students, this disparity persisted.23
While there is a strong relationship between middle school engagement and performance and high school outcomes, some struggling students succeed in high school and some high-performing students fail. More importantly, some schools are particularly effective at helping struggling students succeed, while others appear to hold high-achieving students back from the success that their promising prior performance would predict. This raises important questions about whether the low performance of schools that were identified for closure was an artifact of the backgrounds and prior performance of their entering students or more a function of the inability of these high schools to help students build on their strengths and overcome their weaknesses. Our analysis examined three specific questions about potential differences between the schools identified for closure and other New York City high schools:
• Did the schools identified for closure serve a higher concentration of high-need or low-achieving students, based on background characteristics and middle school attendance and performance measures?
• Had the concentration of high-need and low-achieving students in the closure schools changed over time?
21
• How did the performance of the closure schools compare with other New York City high schools, after accounting for differences in the background characteristics and prior performance of their students?
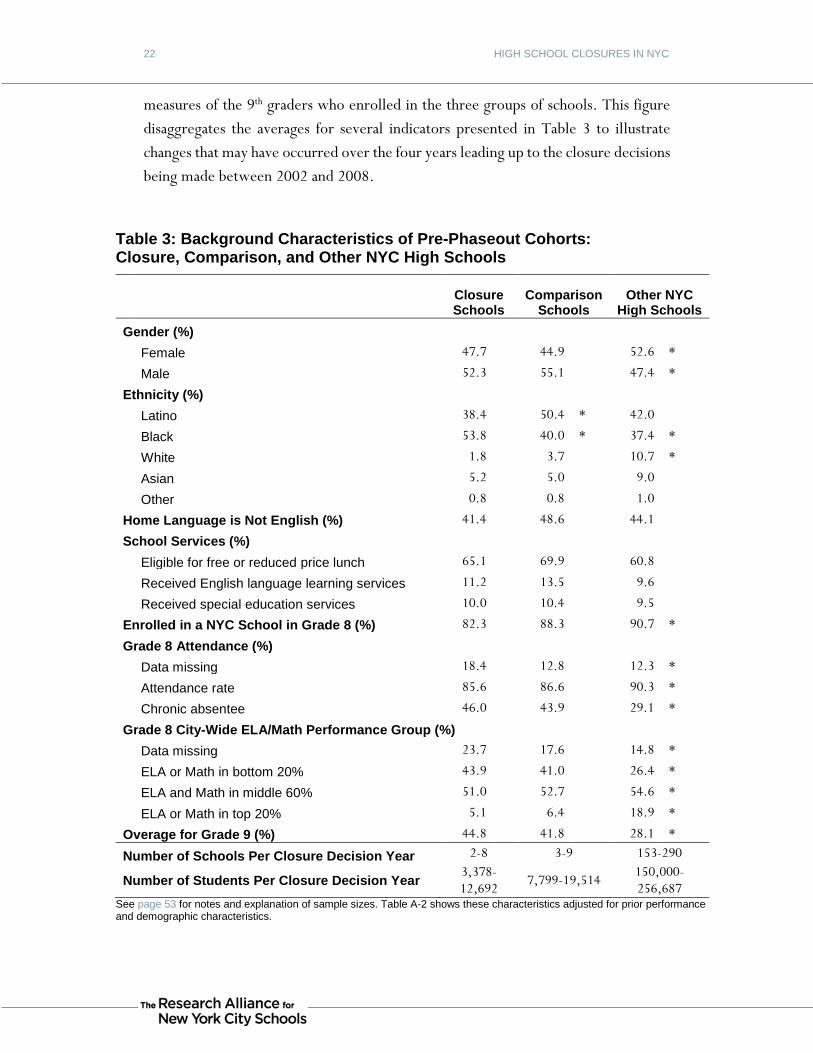
To address the first question, Table 3 presents background characteristics and 8th grade attendance and achievement levels among cohorts of 9th graders who enrolled in each of the three groups of schools prior to the closure decisions. Like Table 2, Table 3 on the next page shows a high degree of similarity between the schools identified for closure and the comparison schools. The primary exception is that the closure schools enrolled a somewhat lower percentage of Latino students and a higher percentage of Black students, in relation to the comparison schools. None of the other differences between the schools identified for closure and the comparison schools were statistically significant (p <= 0.05.)
Table 3 shows that there were no systematic differences among the three groups of schools in rates of student eligibility or receipt of school services, including free or reduced price lunch, English language learning services, and special education services. In other words, the schools identified for closure served a similar mix of students as the citywide average in terms of low-income students and students with special needs.
The bottom portions of Table 3 show more striking differences between the two groups of low-performing schools and the broader sample of schools. The schools identified for closure and the comparison schools had nearly one and a half times as many chronic absentees as the remaining schools, and they had a substantially higher percentage of students scoring in the bottom 20 percent of ELA or math achievement. The closure schools and comparison schools also had a much higher concentration of students who were overage for their grade (indicating that they were likely to have been retained in a prior grade).24
The averages presented in Table 3 may be masking trends over time in the mix of incoming 9th graders. Such changes, if they occurred, may have influenced the improvement or decline in subsequent measures of school performance. For example, if schools experienced a substantial increase in the number of students with limited math or literacy skills from middle school, the high school’s overall performance may have declined even when there were no other changes in the its staffing or operation. Thus, to address the second question listed above, Figure 3 on page 24 shows trends over time in selected characteristics and prior performance
22 HIGH SCHOOL CLOSURES IN NYC
measures of the 9th graders who enrolled in the three groups of schools. This figure disaggregates the averages for several indicators presented in Table 3 to illustrate changes that may have occurred over the four years leading up to the closure decisions being made between 2002 and 2008.
Table 3: Background Characteristics of Pre-Phaseout Cohorts: Closure, Comparison, and Other NYC High Schools
Closure Schools
Comparison Schools
Other NYC High Schools
Gender (%) Female 47.7 44.9 0.0 52.6 * Male 52.3 55.1 0.0 47.4 *
Ethnicity (%) Latino 38.4 50.4 * 42.0 0 Black 53.8 40.0 * 37.4 * White 1.8 3.7 0.0 10.7 * Asian 5.2 5.0 0.0 9.0 0
Other 0.8 0.8 0.0 1.0 0
Home Language is Not English (%) 41.4 48.6 0.0 44.1 0
School Services (%) Eligible for free or reduced price lunch 65.1 69.9 0.0 60.8 0
Received English language learning services 11.2 13.5 0.0 9.6 0 Received special education services 10.0 10.4 0.0 9.5 0
Enrolled in a NYC School in Grade 8 (%) 82.3 88.3 0.0 90.7 *
Grade 8 Attendance (%) Data missing 18.4 12.8 0.0 12.3 * Attendance rate 85.6 86.6 0.0 90.3 * Chronic absentee 46.0 43.9 0.0 29.1 *
Grade 8 City-Wide ELA/Math Performance Group (%) Data missing 23.7 17.6 0.0 14.8 * ELA or Math in bottom 20% 43.9 41.0 0.0 26.4 * ELA and Math in middle 60% 51.0 52.7 0.0 54.6 * ELA or Math in top 20% 5.1 6.4 0.0 18.9 *
Overage for Grade 9 (%) 44.8 41.8 0.0 28.1 *
Number of Schools Per Closure Decision Year 2-8 3-9 153-290
Number of Students Per Closure Decision Year 3,378-12,692 7,799-19,514
150,000-256,687
See page 53 for notes and explanation of sample sizes. Table A-2 shows these characteristics adjusted for prior performance and demographic characteristics.

23
Figure 3 shows that the concentration of students who were from low-income families (as indicated by current or prior eligibility for free or reduced priced lunch) was decreasing over time for all schools in the sample. For example, on average, over the four years leading up to each set of closure decisions, the concentration of low-income students decreased from 70 to 62 percent in the closure schools and from 77 to 67 percent in the comparison schools
The other panels in Figure 3 indicate stable patterns of special education enrollment, chronic absenteeism and students with low achievement levels in all three groups of schools. For example, the percentage of special education students in the schools identified for closure was steady at approximately 10 percent in the years leading up to the closure decisions. The representation of students receiving special education services in these schools increased slightly from 10 to 11 percent during these years. In addition, although not shown in this figure, the percentage of students who were overage for grade increased from 40 to 46 percent for the closure schools and from 39 to 42 percent for the comparison schools. These trends most likely reflect the implementation of a policy limiting promotion for elementary and middle school students who did not meet proficiency standards in ELA and math.
Finally, Figure 3 shows that the trends in student characteristics and prior performance were consistently and substantially different for the broader sample of schools compared to the schools identified for closure and the comparison schools. In general, the composition of the broader group of schools changed very little during the periods leading up to the closure decision between 2002 and 2008.
In light of the high concentration of high-need and low-achieving students in the schools identified for closure, there are important questions about the extent to which the low performance presented in Table 2 reflects the students’ incoming skill levels, versus schools’ limited ability to support student success. Put another way, were students with characteristics and prior performance levels similar to those of students in the closure schools succeeding in other schools, or did all such students achieve outcomes like those seen in the schools designated for closure?
To address this question, Appendix Table A-2 presents the outcomes shown in Table 2 after accounting for differences across the three groups of schools in terms of the demographic characteristics and prior performance of their students. Specifically, the table shows the estimated performance levels for the comparison schools and for all other schools in the district for the population of students with the same distribution of characteristics and prior performance as the students in the schools identified for

24 HIGH SCHOOL CLOSURES IN NYC
Figure 3: Background Characteristics and 8th Grade Performance Trends: Closure, Comparison, and Other NYC High Schools
Notes: See page 53.
0
20
40
60
80
100
-4 -3 -2 -1
Pre-Phaseout Cohorts
Percent
Eligible for Free or Reduced Price Lunch
0
20
40
60
80
100
-4 -3 -2 -1
Pre-Phaseout Cohorts
Percent
Receive Special Education Services (8th Grade)
0
20
40
60
80
100
-4 -3 -2 -1
Pre-Phaseout Cohorts
Percent
Chronic Absentee (8th Grade)
0
20
40
60
80
100
-4 -3 -2 -1
Pre-Phaseout Cohorts
Percent
Low Achievement in ELA or Math (8th Grade)
25
closure. (Like Table 2, the outcomes presented in Table A-2 are for students who enrolled in the schools prior to the closure decisions.)
Table A-2 shows that the differences between the closure schools and the comparison schools are nearly the same as those exhibited in Table 2. This is largely because these two groups of schools serve very similar populations of students. Also, to the extent that there are differences in the characteristics and prior performance of their students, these do not appear to result in differences in overall school performance.
It is worth noting, however, that adjusting for differences in student background characteristics and prior performance did have a modest effect on some of the trends in student performance in Figures 2a and 2b. Most notably, the rate of improvement in high school graduation and Regents diploma rates were somewhat larger for the comparison schools once the adjustment focused on students with the same characteristics and prior performance levels as those in the closure schools. In other words, during the years leading up to the closure decisions, the comparison schools were able to improve the performance levels of struggling students at a somewhat faster pace than the schools that were identified for closure.
Like Table 2, Table A-2 illustrates substantial and statistically significant differences between the closing schools and the broader sample of schools even after accounting for differences in the incoming characteristics of their students. This suggests that students with characteristics like those in the City’s lowest-performing schools tended to do better in the other schools throughout the district.
At the same time, Table A-2 shows that many outcomes are much lower for the broader sample of schools after accounting for the fact that they serve higher proportions of students who enter high school with relatively strong academic skills and attendance patterns. For example, the adjusted 9th grade on-track rate in Table A-2 is nearly 13 percentage points lower than the rate shown in Table 2 (21.5 percent versus 34.3 percent). Similarly, the adjusted graduation rate for these schools in Table A-2 is nearly 12 percentage points lower than the rate displayed in Table 2. In both cases, the change accounts for approximately half of the difference between the two groups of low-performing schools and the broader sample of schools. In other words, about half of the performance difference among schools can be attributed to the measurable incoming characteristics of the students.

26 HIGH SCHOOL CLOSURES IN NYC
Chapter Summary This chapter addressed several overarching questions about the schools designated for closure in New York City between 2002 and 2008. Examining a wide range of student outcome measures over the four years leading up to the decision to close these high schools, the analysis revealed the following:
• The 29 high schools identified for closure were among the lowest-performing schools in the City at the time of the closure decision. None of these schools were ranked above the 20th percentile citywide based on a composite of 10 performance indicators averaged over the four years prior to the closure decision. Less than 40 percent of the students entering these schools during this period graduated within four years, and less than half of graduates earned a Regents diploma. By contrast, more than 60 percent of those in the City’s other high schools graduated within four years, and nearly two-thirds of graduates earned Regents diplomas.
• The schools identified for closure served similar proportions of low-income students and students with special needs as other high schools across the City. However, based on their 8th grade test scores and attendance rates, the schools identified for closure enrolled higher concentrations of low-performing and chronically absent incoming students, compared to the broader sample of schools.
• Performance levels for the schools identified for closure changed very little (or improved more slowly than other schools in the district) over the four years before the closure decision. The performance levels and trends remained considerably lower than those of the broader sample of schools.
• About half of the difference in performance between the schools identified for closure and the broader sample of schools can be explained by differences in the incoming characteristics and prior achievement of their students. However, substantial performance gaps remain between the groups of schools, even after accounting for the differences in demographic and prior performance levels of the students they served. This suggests that struggling students were less likely to succeed in the City’s lowest-performing schools than they were in other schools throughout the City.
• Each year between 2002 and 2008, while some low-performing schools were closed, there were between 10 and 29 other low-performing high schools that were not designated for closure. A subsample of these schools serve as comparisons with the schools identified for closure throughout the remainder of the report. This subsample of schools exhibited prior performance levels and trends that were similar to the closing schools and provide a window into what might have happened at the closing schools had they remained open.
27
CHAPTER 4: IMPACTS ON STUDENT OUTCOMES
DURING THE PHASEOUT PROCESS The previous chapter focused on the characteristics and performance of students who were enrolled before schools were designated for closure. This chapter focuses on the more than 9,600 students who were just beginning their high school careers in one of the closing schools when the closure decision was announced. These 9th-grade students had maximum exposure to the phaseout process and were subject to a wide range of potential influences. We refer to this group as the phaseout cohort.
On the one hand, the students in the phaseout cohort may have stood to benefit from the phaseout process if the DOE, school leaders, and teachers provided extra resources to support them as they progressed through school. In addition, since each school’s enrollment declined during the phaseout process—as students transferred, graduated, or dropped out—the remaining students may have benefited from increased personal attention from the administration and faculty. It is also possible that administrators and teachers who remained in the school did so because they were especially committed to ensuring that the remaining students received the best possible instruction and support. Finally, some students may have benefited from the option to transfer to other, potentially better schools, which was not typically offered to NYC students after their 9th grade year.
On the other hand, the phaseout process was fraught with the potential for harmful effects on students who were enrolled in schools as they closed. For instance, students may have suffered if large numbers of the best teachers and administrators left the school for more secure positions. Also, the overall breakdown of continuity and school community could have had a negative effect on student engagement and performance. If the phaseout process resulted in many students leaving the school, this could have posed challenges including the disruption of peer groups or reductions in course offerings as the school dwindled in size. Finally, students’ motivation, self-image, and outlook could have been harmed by the possible perception that the school’s failure was somehow their responsibility.
This chapter will shed light on the viability of these hypotheses by assessing the net impact of the phaseout process on a range of student outcomes, including attendance, mobility, and indicators of performance, such as credit accumulation and graduation. To provide a valid estimate of these impacts, it is necessary to account for several competing influences that may mask or possibly amplify the effects of the phaseout
28 HIGH SCHOOL CLOSURES IN NYC
process. The methods we used to account for these competing influences are outlined below.
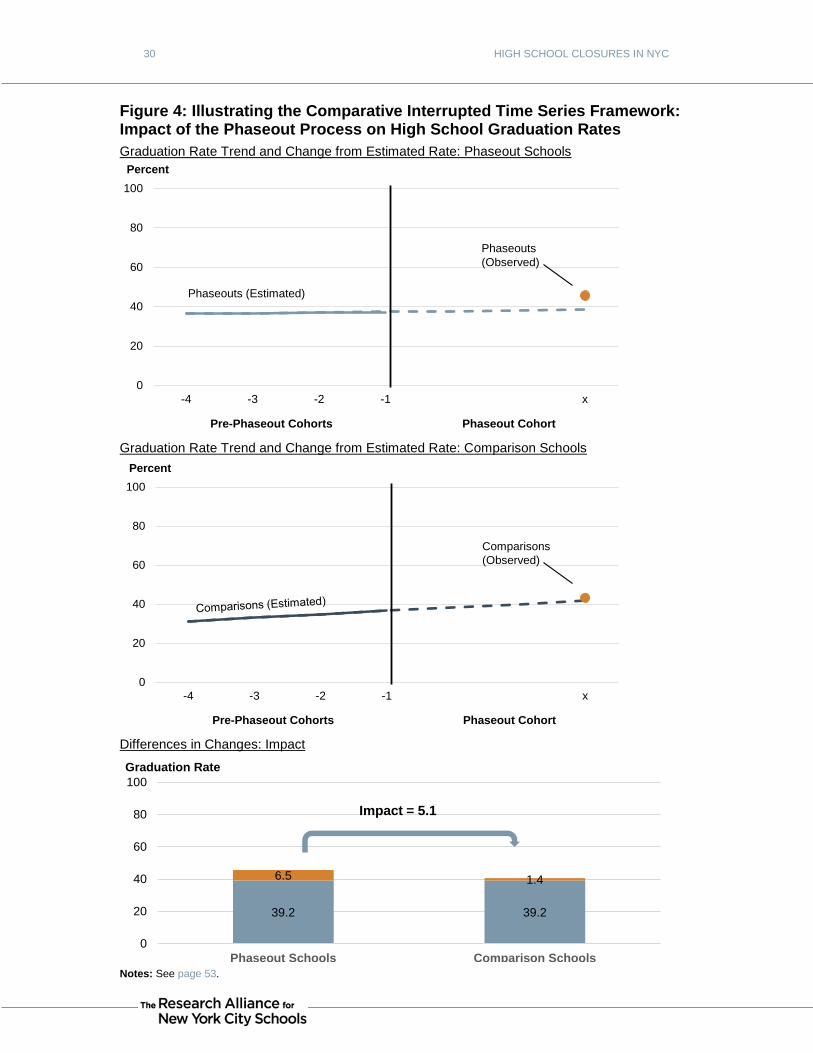
Estimating Impacts of the Phaseout Process The analysis we conducted to illuminate the impact of the phaseout process is known as Comparative Interrupted Time Series (CITS). Figure 4 helps to illustrate the CITS strategy. The first panels show the high school graduation rates for students who enrolled in the phaseout schools before and after the phaseout decision and also for students who enrolled in the group of other low-performing comparison high schools during the same time period.
Since both of these groups of schools were already low-performing, it is important to determine whether students who attended them during the phaseout process were placed a greater risk of school failure or, perhaps, were better able to succeed, relative to the school’s historical track record. Thus, the CITS framework begins by comparing outcomes for students who were enrolled in the schools during the phaseout process with those of students who entered those schools prior to the closure decision. The solid line in the top panel of Figure 4 shows the trend in graduation rates for the pre-phaseout cohorts at the 29 closing schools. The dashed line projects this trend to reflect the expected graduation rate, had the schools continued on their pre-phaseout trajectory. The point indicated on the right side of the figure shows the actual graduation rate for students who enrolled in the high schools during the year in which the closure decision was made (the phaseout cohort).
The top panel of Figure 4 shows that, on average, students who enrolled in the phaseout schools during the year of the closure decision were more likely to graduate than the projected trend. Specifically, the actual graduation rate for these students was 44.9 percent, compared to the projected graduation rate of 38.4 percent. In other words, the graduation rate for the phaseout cohort reflects a 6.5 percentage point improvement over the projected trend from the pre-phaseout cohorts. (This difference is statistically significant at p <= 0.05.)
It is important to recognize, however, that the higher graduation rates of the students enrolled in the schools during the phaseout process was not necessarily caused (or caused only) by the phaseout process itself. As noted above, during the period covered by this analysis, the landscape of New York City high schools was undergoing a dramatic transformation. This included major investments in school improvement
29
and increasing pressure to hold schools accountable for student performance. Much of the new investment and pressure was being applied to the City’s lowest-performing schools. Thus, it is possible that the improvement in graduation rates for students enrolled during the phaseout process was not unique to the schools identified for closure and could have been an artifact of these other reforms instead.
To shed light on these potential effects, the middle section of Figure 4 shows the trends in graduation rates for the comparison high schools that were identified in the previous chapter of the report. The figure shows that, in the years leading up to the closure decision, the graduation rates for these schools were improving at a slightly faster rate than at the schools identified for closure. More importantly, the actual graduation rates for the students who enrolled in the comparison schools at the time of the closure decisions were slightly higher than the projected trend. Specifically, the graduation rate for these schools was 43.3 percent, compared to the projected graduation rate of 41.9 percent. In other words, the graduation rate for this later cohort reflects a 1.4 percentage point improvement over the projected trend. (Note that this difference is not statistically significant at p <= 0.05.)
In short, both groups of schools showed some improvement in graduation rates compared to their trajectories, even though one group was designated for closure and the other group was not. This means that a portion of the increase in graduation rates for the phaseout schools could have been the result of broader reforms. Thus, a more valid estimate of the distinct influence of the phaseout process is represented by the difference between the increase for the phaseout schools and the increase for the other low-performing schools relative to their respective projections.
The bottom portion in Figure 4 distills this information into one graph. Specifically, the schools identified for closure experienced an increase of 6.5 percentage points relative to their projected graduation rate. During the same period, the other low-performing comparison schools experienced an increase of 1.4 percentage points.25 This means that net difference was a 5.1 percentage point increase in graduation rates over and above the influence of other factors that were affecting low-performing schools. It must be noted, however, that this difference is not statistically significant (p <= 0.05), indicating that the impact on graduation rates is likely to be due to chance. Using this standard, it is reasonable to conclude that the phaseout process did not have a systematic impact on the graduation rates of students enrolled in the schools during the process.
30 HIGH SCHOOL CLOSURES IN NYC
Figure 4: Illustrating the Comparative Interrupted Time Series Framework: Impact of the Phaseout Process on High School Graduation Rates Graduation Rate Trend and Change from Estimated Rate: Phaseout Schools
Graduation Rate Trend and Change from Estimated Rate: Comparison Schools
Differences in Changes: Impact
Notes: See page 53.
0
20
40
60
80
100
-4 -3 -2 -1 x
Phaseouts (Estimated)
Phaseouts(Observed)
Percent
Pre-Phaseout Cohorts Phaseout Cohort
0
20
40
60
80
100
-4 -3 -2 -1 x
Comparisons(Observed)
Percent
Pre-Phaseout Cohorts Phaseout Cohort
39.2 39.2
6.5 1.4
0
20
40
60
80
100
Phaseout Schools Comparison Schools
Impact = 5.1
Graduation Rate
31
The CITS methodology used in this report has additional features that account for other factors that may mask or exaggerate the impact of the phaseout process on student outcomes. These include statistical adjustments that account for changes over time and differences across schools and cohorts in student characteristics. The analytic models account for the modest differences between phaseout and comparison schools in the respective trajectories of student outcomes from the baseline period.
Using this methodology, the following sections summarize findings across a range of outcomes measured at each stage of students’ high school careers. They also examine the impact of the phaseout process on student mobility and on outcomes for students who transfer to other schools.
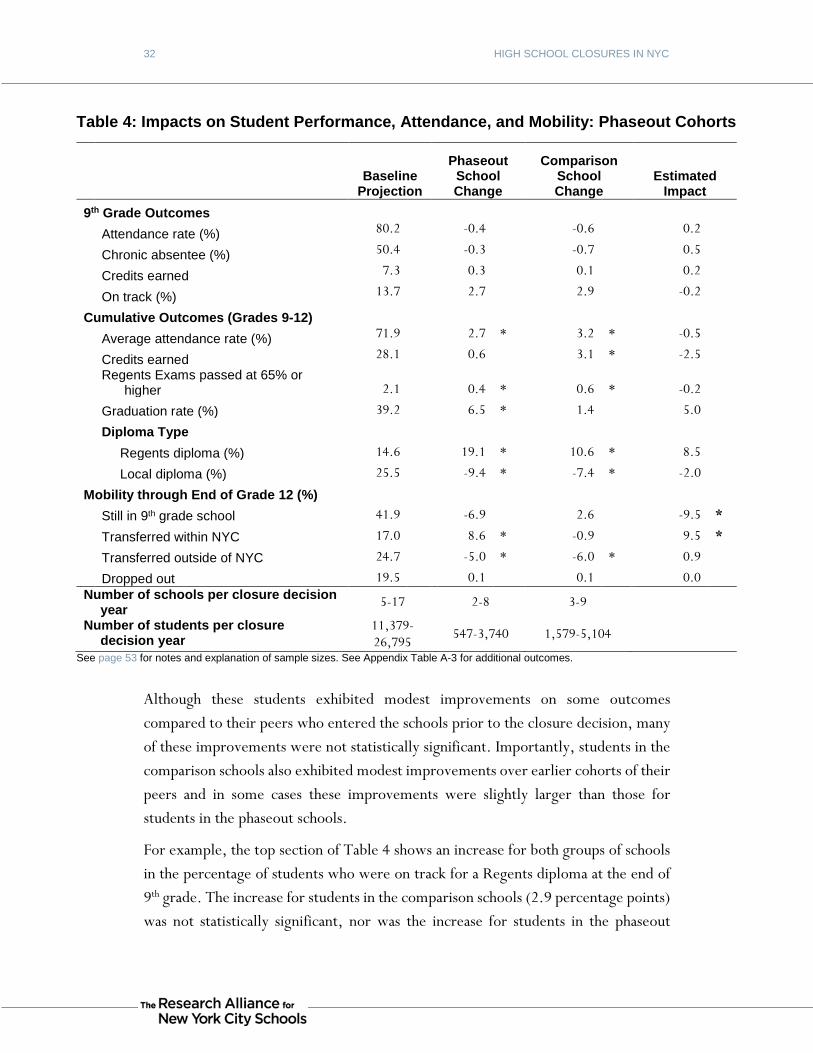
Impacts on Attendance and Academic Outcomes Table 4 presents the impact of the phaseout process on students who enrolled as 9th graders during the year in which it was decided that their school would be closed. The first section of the table presents outcomes through the end of these students’ scheduled 9th grade. (10th and 11th grade outcomes can be found in Appendix Table A-3.) The middle section of the table presents cumulative outcomes through grade 12, including graduation rates. The bottom section of the table presents impacts on students’ mobility, including whether they remained enrolled in their original 9th grade school through the end of their 12th grade year, dropped out, or transferred to another school within or outside of NYC.
The first column of numbers in Table 4 shows the projected outcome based on trends during the period prior to the closure decision.26 The second column of numbers shows the change in outcome levels, relative to the projection, for students in the phaseout schools. The third column shows the change in outcomes for students who enrolled in the comparison schools in the same year that the closure decisions were being made. The difference between these two changes is presented in the fourth column of numbers. This difference represents the impact of the phaseout process, over and above the influence of other factors affecting low-performing schools during the same period.
The findings presented in Table 4 show that the phaseout process did not have a systematic, statistically significant impact, positive or negative, on attendance and academic outcomes for students who were enrolled in the schools during the phaseout process.
32 HIGH SCHOOL CLOSURES IN NYC
Although these students exhibited modest improvements on some outcomes compared to their peers who entered the schools prior to the closure decision, many of these improvements were not statistically significant. Importantly, students in the comparison schools also exhibited modest improvements over earlier cohorts of their peers and in some cases these improvements were slightly larger than those for students in the phaseout schools.
For example, the top section of Table 4 shows an increase for both groups of schools in the percentage of students who were on track for a Regents diploma at the end of 9th grade. The increase for students in the comparison schools (2.9 percentage points) was not statistically significant, nor was the increase for students in the phaseout
Table 4: Impacts on Student Performance, Attendance, and Mobility: Phaseout Cohorts
Baseline
Projection
Phaseout School Change
Comparison School Change
Estimated Impact
9th Grade Outcomes
Attendance rate (%) 80.2 # -0.4 0.0 -0.6 0.0 0.2 #
Chronic absentee (%) 50.4 # -0.3 0.0 -0.7 0.0 0.5 #
Credits earned 7.3 # 0.3 0.0 0.1 0.0 0.2 #
On track (%) 13.7 # 2.7 0.0 2.9 0.0 -0.2 #
Cumulative Outcomes (Grades 9-12)
Average attendance rate (%) 71.9 # 2.7 * 3.2 * -0.5 #
Credits earned 28.1 # 0.6 0.0 3.1 * -2.5 #
Regents Exams passed at 65% or
higher 2.1 # 0.4 * 0.6 * -0.2 # Graduation rate (%) 39.2 # 6.5 * 1.4 0.0 5.0 # Diploma Type Regents diploma (%) 14.6 # 19.1 * 10.6 * 8.5 # Local diploma (%) 25.5 # -9.4 * -7.4 * -2.0 #
Mobility through End of Grade 12 (%) Still in 9th grade school 41.9 # -6.9 0.0 2.6 0.0 -9.5 * Transferred within NYC 17.0 # 8.6 * -0.9 0.0 9.5 * Transferred outside of NYC 24.7 # -5.0 * -6.0 * 0.9 # Dropped out 19.5 # 0.1 0.0 0.1 0.0 0.0 # Number of schools per closure decision
year 5-17 2-8 3-9
Number of students per closure decision year
11,379-26,795
547-3,740 1,579-5,104
See page 53 for notes and explanation of sample sizes. See Appendix Table A-3 for additional outcomes.
33
schools (2.7 percentage points). The net impact (-0.2 percentage points) also was not statistically significant.
As described in the previous section, both groups of schools exhibited improvements in overall graduation rates; Table 4 shows that these improvements were even more substantial when looking specifically at the percentage of students who received a Regents diploma.27 For example, students who were enrolled in the closing schools during the phaseout period were more than twice as likely to receive a Regents diploma (a 19.1 percentage point increase), compared to the projected rate for students who enrolled in the schools prior to the closure decision. During the same period, however, the Regents diploma rate for students enrolled in the comparison schools increased by 10.6 percentage points, compared to their peers from earlier cohorts. The 8.5 percentage point difference between the rate of improvement for the phaseout schools and that of the comparison schools was not statistically significant. This suggests that, despite overall improvements, the phaseout process in itself did not have a systematic impact on the receipt of Regents diplomas (nor on graduation rates, as noted above).28
Finally, the cumulative outcomes presented in Table 4 raise some potentially conflicting findings: Although graduation rates improved for students in the phaseout schools, credit accumulation exhibited a slight decline. This may suggest that graduates from the closing schools accumulated fewer course credits compared to their peers from earlier cohort and compared to those in the comparison schools. Further analysis indicates, however, that this was not the case. Credit accumulation among graduates from the phaseout schools was generally comparable, on average, to that of graduates from all other NYC schools during this period.29 It appears that the modest decline in credit accumulation was concentrated among students who did not graduate within four years. Further research will be needed to understand more about how the phaseout process may have impacted this particular group of students.
Impacts on Student Mobility The bottom section of Table 4 shows the rates at which students remained in their original 9th grade school (or transferred or dropped out) through the end of their scheduled 12th grade year. These numbers indicate that the phaseout process did have a systematic impact on student mobility. First, the table indicates a high rate of mobility among students in the sample even prior to the closure decisions: an average

34 HIGH SCHOOL CLOSURES IN NYC
of only 42 percent of students from the pre-phaseout period remained enrolled in their original 9th grade school. Nearly a quarter of the students from the pre-phaseout period transferred out of the New York City school system, and another 17 percent transferred to another NYC high school. The remaining 20 percent were recorded as dropouts.
The second column in Table 4 shows that the students who enrolled in the schools identified for closure were less likely to remain in their 9th grade school than the projected rate for their peers from earlier cohorts. This was a drop of nearly 7 percentage points. At the same time, students in the comparison schools were somewhat more likely to stay in their 9th grade school: an increase of nearly 3 percentage points. Overall, therefore, the phaseout process produced an increase in mobility of almost 10 percentage points.
Because students in the phaseout schools were given the option of transferring to another school in the City, it is not surprising that they were more likely to change schools compared to their peers from prior cohorts and compared to students in other low-performing schools during the same period. In fact, as shown in Table 4, most of the impact on mobility resulted from students transferring to other schools in New York City, rather than transferring to a school outside the city or dropping out. Specifically, among students in the closing schools, transfers within NYC increased by nearly 9 percentage points, while such transfers declined very slightly for students in the comparison schools. Thus, the net impact was an increase of almost 10 percentage points, identical to the impact on overall mobility.
Table 4 shows that both groups of schools experienced a decline in the percentage of students who transferred outside of NYC and that their dropout rates were nearly unchanged. The net impact of the phaseout process on these outcomes is not statistically significant.
The high rates of mobility overall and the increased mobility that resulted from the phaseout process raise questions about whether students were better off if they remained in the closing schools or transferred to other schools in the City. To address this, we conducted two sets of exploratory analyses. First, we examined outcomes for students who remained in their respective 9th grade school through the end of their scheduled 12th grade year, or until they dropped out or graduated. 30 As with the core impact analysis, we compared outcomes before and after the closure decision, for both the closing schools and comparison schools—to shed light on the degree to
35
which the phaseout process itself affected outcomes for non-mobile students specifically.
The second strand of analysis focused on students who transferred from their respective 9th grade schools to another NYC high school before the end of their 12th grade year, or before they dropped out or graduated. 31 Again, we compared outcomes before and after the closure decision, for both the phaseout schools and the comparison schools. The results of these exploratory analyses are presented below.
“Impacts” for Non-Mobile Students Before assessing potential impacts of the phaseout process on students who remained in closing schools, it was important to determine whether these students were different from the non-mobile students who started high school prior to the closure decision. In other words, we assessed whether the phaseout process induced different types of students to stay in their 9th grade school, compared to those who stayed prior to the closure decision.
Appendix Table A-4 presents findings from this analysis. The table indicates that there was very little change in the background characteristics of non-mobile students during the phaseout process, compared to the characteristics of non-mobile students prior to the closure decision. The marginal changes that occurred for the phaseout schools were roughly the same as those that occurred for the comparison schools. None of the estimated differences are statistically significant (p <= 0.05). In short, the phaseout process decreased the overall rate at which students stayed in the closing schools, but it did not induce different types of students to stay or leave. Put another way, the increase in mobility did not result in a higher concentration of high-need (or low-need) students in the schools as they were being phased out.32 Table 5 presents impact findings for students who remained in the phaseout schools until the end of their 12th grade year or until they dropped out or graduated. This table presents cumulative outcomes through grade 12, including graduation rates, for these students. (Outcomes for 9th, 10th, and 11th grades can be found in Appendix Table A-5.) The first column of numbers shows the projected outcome based on trends for non-mobile students who enrolled in the phaseout schools prior to the closure decision. The second column of numbers shows the change in outcome levels, relative to the projection, for students who remained enrolled in the phaseout schools starting with the year of the closure decision. The third column shows the change in outcomes for students who remained enrolled in the comparison schools during the same
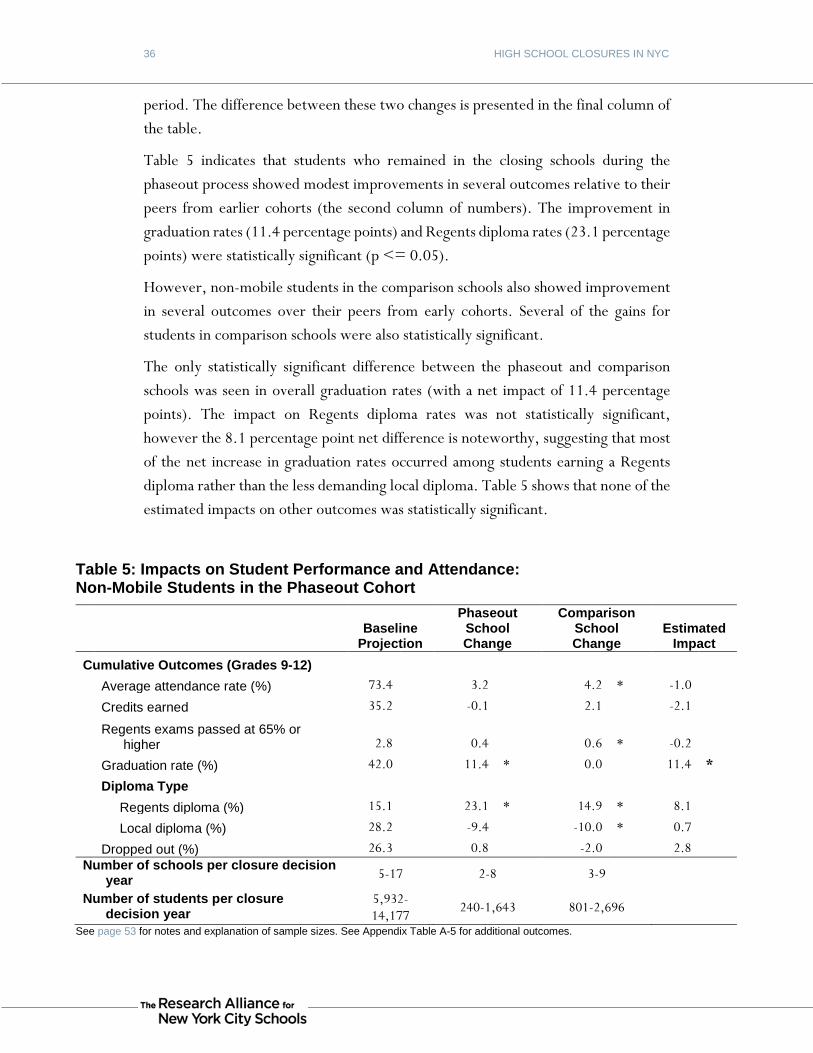
36 HIGH SCHOOL CLOSURES IN NYC
period. The difference between these two changes is presented in the final column of the table.
Table 5 indicates that students who remained in the closing schools during the phaseout process showed modest improvements in several outcomes relative to their peers from earlier cohorts (the second column of numbers). The improvement in graduation rates (11.4 percentage points) and Regents diploma rates (23.1 percentage points) were statistically significant (p <= 0.05).
However, non-mobile students in the comparison schools also showed improvement in several outcomes over their peers from early cohorts. Several of the gains for students in comparison schools were also statistically significant.
The only statistically significant difference between the phaseout and comparison schools was seen in overall graduation rates (with a net impact of 11.4 percentage points). The impact on Regents diploma rates was not statistically significant, however the 8.1 percentage point net difference is noteworthy, suggesting that most of the net increase in graduation rates occurred among students earning a Regents diploma rather than the less demanding local diploma. Table 5 shows that none of the estimated impacts on other outcomes was statistically significant.
Table 5: Impacts on Student Performance and Attendance: Non-Mobile Students in the Phaseout Cohort
Baseline
Projection
Phaseout School Change
Comparison School Change
Estimated Impact
Cumulative Outcomes (Grades 9-12) Average attendance rate (%) 73.4 ## 3.2 0.0 4.2 * -1.0 0.00
Credits earned 35.2 ## -0.1 0.0 2.1 0.0 -2.1 0.00
Regents exams passed at 65% or
higher 2.8 ## 0.4 0.0 0.6 * -0.2 0.00
Graduation rate (%) 42.0 ## 11.4 * 0.0 0.0 11.4 *
Diploma Type
Regents diploma (%) 15.1 ## 23.1 * 14.9 * 8.1 0.00
Local diploma (%) 28.2 ## -9.4 0.0 -10.0 * 0.7 0.00
Dropped out (%) 26.3 ## 0.8 0.0 -2.0 0.0 2.8 0.00 Number of schools per closure decision
year 5-17 2-8 3-9
Number of students per closure decision year
5,932-14,177 240-1,643 801-2,696
See page 53 for notes and explanation of sample sizes. See Appendix Table A-5 for additional outcomes.
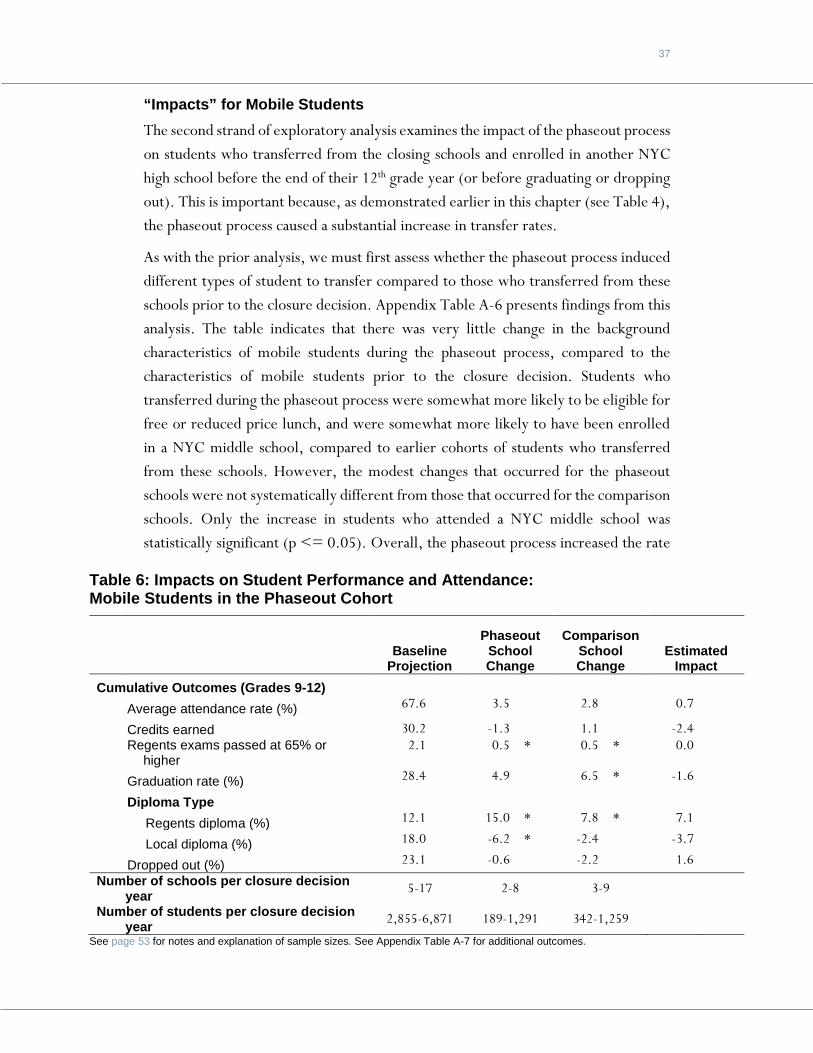
37
“Impacts” for Mobile Students The second strand of exploratory analysis examines the impact of the phaseout process on students who transferred from the closing schools and enrolled in another NYC high school before the end of their 12th grade year (or before graduating or dropping out). This is important because, as demonstrated earlier in this chapter (see Table 4), the phaseout process caused a substantial increase in transfer rates.
As with the prior analysis, we must first assess whether the phaseout process induced different types of student to transfer compared to those who transferred from these schools prior to the closure decision. Appendix Table A-6 presents findings from this analysis. The table indicates that there was very little change in the background characteristics of mobile students during the phaseout process, compared to the characteristics of mobile students prior to the closure decision. Students who transferred during the phaseout process were somewhat more likely to be eligible for free or reduced price lunch, and were somewhat more likely to have been enrolled in a NYC middle school, compared to earlier cohorts of students who transferred from these schools. However, the modest changes that occurred for the phaseout schools were not systematically different from those that occurred for the comparison schools. Only the increase in students who attended a NYC middle school was statistically significant (p <= 0.05). Overall, the phaseout process increased the rate
Table 6: Impacts on Student Performance and Attendance: Mobile Students in the Phaseout Cohort
Baseline
Projection
Phaseout School Change
Comparison School Change
Estimated Impact
Cumulative Outcomes (Grades 9-12) Average attendance rate (%) 67.6 # 3.5 0.0 2.8 0.0 0.7 ##
Credits earned 30.2 ## -1.3 0.0 1.1 0.0 -2.4 ###
Regents exams passed at 65% or
higher 2.1 # 0.5 * 0.5 * 0.0 ##
Graduation rate (%) 28.4 # 4.9 0.0 6.5 * -1.6 ##
Diploma Type
Regents diploma (%) 12.1 # 15.0 * 7.8 * 7.1 ##
Local diploma (%) 18.0 # -6.2 * -2.4 0.0 -3.7 ##
Dropped out (%) 23.1 # -0.6 0.0 -2.2 0.0 1.6 ##
Number of schools per closure decision year 5-17 2-8 3-9
Number of students per closure decision year 2,855-6,871 189-1,291 342-1,259
See page 53 for notes and explanation of sample sizes. See Appendix Table A-7 for additional outcomes.
38 HIGH SCHOOL CLOSURES IN NYC
at which students transferred to other NYC high schools, but it did not induce substantially different types of students to transfer.
Table 6 presents cumulative outcomes for students who transferred from phaseout and comparison schools before the end of their 12th grade year or before they dropped out or graduated. (Outcomes for 9th, 10th, and 11th grades can be found in Appendix Table A-7.) The table indicates that the phaseout process did not have a systematic net impact (positive or negative) on outcomes for mobile students. Students who transferred from the closing schools showed modest improvements in selected outcomes relative to their peers from earlier cohorts. Transfer students from the comparison schools also showed improvement over their peers from early cohorts. Overall, none of the estimated net differences were statistically significant.
Finally, a comparison between Table 5 and Table 6 highlights a striking contrast between students who remained in their 9th grade school and those who transferred to other NYC high schools. In general, mobile students had substantially lower outcomes than those who remained in their original 9th grade school. Most notably, the baseline projection of graduation rates among mobile students (28.4 percent) was substantially lower than the non-mobile students (42.0 percent). The tables show similar differences on attendance rates, credit accumulation and Regents examinations passing rates. Most of these differences persisted during and after the phaseout process. In fact, the difference in graduation rates grew during the phaseout process, because of the phaseout school’s positive impact on graduation rates for students who remained in their 9th grade schools. This may suggest that students were better off if they did not transfer out of a high school that was being phased out.
Chapter Summary The chapter examined the impact of high school closures in New York City on students who were enrolled in these schools during the phaseout process. Key findings include the following:
• The phaseout process itself did not have a systematic impact, positive or negative, on the academic outcomes and attendance of students enrolled in these high schools at the time. The gains made by students in the phaseout schools were generally similar to gains made by students in other low-performing schools.

39
• The phaseout process increased student mobility, predominantly through transfers to other NYC high schools, rather than through dropping out or transfers to other districts.
• The phaseout process appears to have had a positive impact on graduation rates for students who remained in their closing school. Most of this improvement appears to have resulted from an increase in the receipt of Regents diplomas, rather than local diplomas. These findings should be interpreted cautiously both because no other impact estimates were statistically significant and because there may be unobserved differences in the characteristics of those who remained in the school before and after the closure decisions.
40 HIGH SCHOOL CLOSURES IN NYC
CHAPTER 5: IMPACTS ON STUDENT OUTCOMES
AFTER SCHOOLS CLOSED This chapter turns to the question of whether closing a high school results in better outcomes for students who, by necessity, chose other options in the wake of the closure. As noted at the outset of this report, there is surprisingly little evidence on this high-stakes question, and no studies that focus on the impact of performance-based closures of high schools. A focus on high schools is particularly important because 9th grade marks a critical transition for students, both developmentally and academically. Developmentally, rising 9th graders are in the midst of early adolescence and facing the challenges of physical growth, self-identity, increasing autonomy, and evolving peer relationships. Academically, high school students are faced with greater demands on their core reading and reasoning skills as well as new challenges related to critical thinking, self-directed study and learning, and growing awareness of options for further education and careers.33 High school closures change the educational options available to students at this critical moment of transition. This study provides important new insight into the effects that closures have on students when their most likely high school option is taken away.
There are at least three plausible hypotheses about the potential impact of closures on students’ performance during high school. One is that closing the lowest-performing schools eliminates the weakest options for students. This should leave them with only better choices and thereby improve their outcomes (at least relative to how they would have performed at the closed school that they would otherwise have attended). Thus, we might find students benefitted by choosing or defaulting to a higher-performing high school when their most likely option became unavailable. In particular, they may have enrolled in one of the new small schools that were opened in New York City during this time period—often in the same buildings that had previously housed closing schools. There is good evidence that these new small schools improved short- and long-term outcomes for a wide range of students.34
A second hypothesis is that students who are most likely to attend one low-performing school would end up being concentrated in other low-performing schools when their local or preferred school is closed down. This would occur if high-need students were surrounded by low-performing schools, or if they did not choose or were not admitted to higher-performing schools that are close by. Also, students whose preferred school option closed might be forced to travel long distances to
41
another school. In addition to the possibility that the other school would not be higher performing, the distance itself could have an effect of student outcomes. Under this second hypothesis, high-need students would continue to be subject to the worst educational options after a school closure and would see no improvement in outcomes. Their performance might even suffer if they end up having to travel a longer distance to school or if the closure of their preferred option is disruptive in some other way.
Still a third hypothesis is that when a high school closes, the affected students may end up in a higher-performing school, but one that is not well suited to their needs. For example, students might struggle and their self-esteem and persistence might deteriorate if they entered a higher-performing high school without the preparation, skills, and supports that their peers brought with them. This would result in a continuation of relatively low performance or possibly even a decline from what was likely to occur had their preferred school stayed open.
To examine these hypotheses, this chapter addresses two related questions:
• What were the characteristics of the schools that students attended when they no longer had access to a school that had closed?
• Were students better off (in terms of academic performance and attendance) as a result of having their most likely high school option closed down?
Before turning to these questions, the following section discusses the key analytic steps used to assess the school attendance patterns and impacts for students whose most likely high school option closed down.
Identifying Students in the Post-Closure Cohort To assess the impact of school closures on students who no longer had the option of attending that school, the analysis first identified a cohort of 8th grade students who had very similar background characteristics to students who had attended the closed school, and who went to middle schools or lived in neighborhoods that fed into the school. This was done through a three-step process:
• In Step 1, we constructed a statistical model of the background characteristics and middle school attendance and achievement for the students who enrolled in each closed school during the year prior to the closure decision. This model resulted in a “propensity score” that was used to identify students in subsequent cohorts
42 HIGH SCHOOL CLOSURES IN NYC
with very similar characteristics but who were no longer able to enroll in the closed school.
• Step 2 identified the neighborhoods, community school districts, boroughs, middle schools, and destination high school buildings of the last cohort of students who entered each closed high school. This information provided the basis for replicating the geographic distribution of students who had previously enrolled in the closed high schools.
• Step 3 used the results from the prediction model to identify a future cohort of 8th grade students who were as similar as possible on two critical dimensions:
o They possessed similar demographic and middle school performance characteristics as students who previously attended the close high schools; and
o They attended a middle school that previously sent students to the closed high school, or they attended a high school in the same building as the closed high school, or they lived in the same zip code as students who previously attended the closed high school, or they attended a school in the same community school district or borough as the closed high school.35
For the purposes of the analyses presented in this chapter, the students identified through this three-step process are referred to as the “post-closure” cohort of 9th grade students or as “displaced” students.36 The three-step matching process was repeated separately for each of the 29 closed high schools, yielding a post-closure cohort for each school. Each group of students has a similar demographic and prior performance profile as the students who enrolled in the respective closed high school in the year prior to the closure decision.
Appendix Table A-8 compares the pre-phaseout and post-closure cohorts across a variety of demographic characteristics, as well as middle school attendance and achievement outcomes. The table shows that there were no systematic differences between the groups based on gender, race/ethnicity, home language, eligibility for free or reduced price lunch, or designation for English language or special education services. Although the matching process was designed to identify students who were as similar as possible to the pre-phaseout cohort, Appendix Table A-8 shows that there were still several modest but systematic differences between the groups. Overall, the post-closure cohort had somewhat higher attendance rates and were marginally more likely to fall into the small group of middle school students who
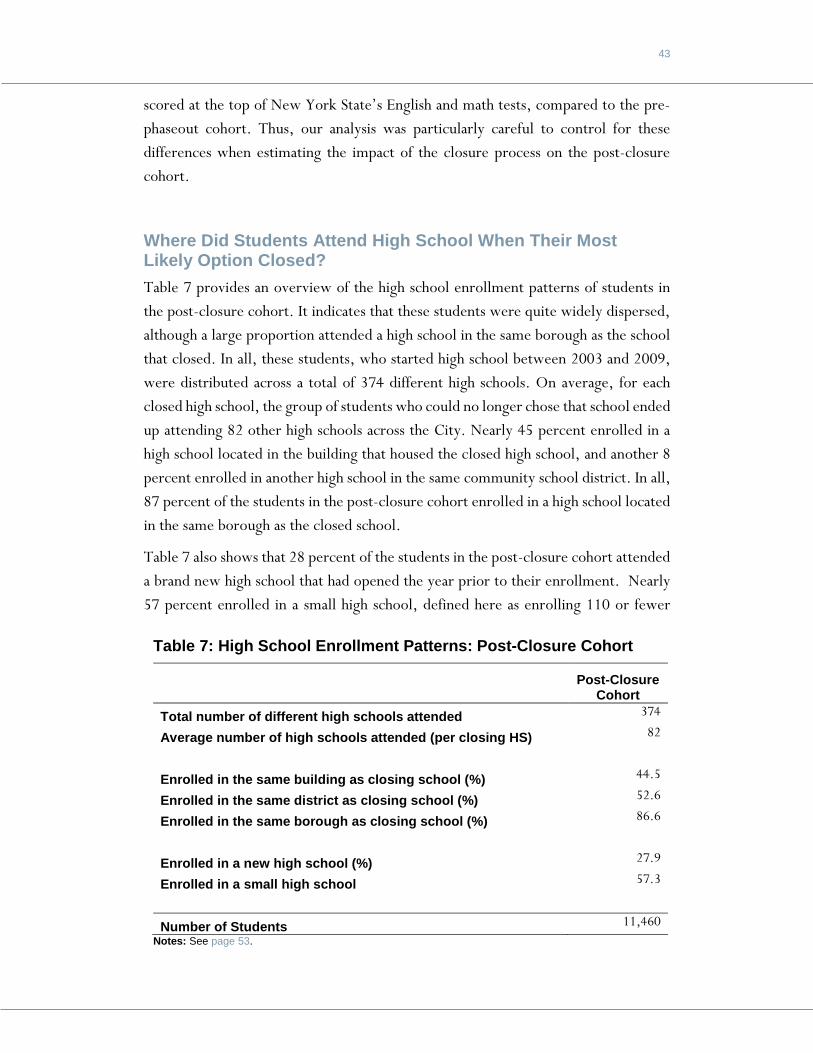
43
scored at the top of New York State’s English and math tests, compared to the pre-phaseout cohort. Thus, our analysis was particularly careful to control for these differences when estimating the impact of the closure process on the post-closure cohort.
Where Did Students Attend High School When Their Most Likely Option Closed? Table 7 provides an overview of the high school enrollment patterns of students in the post-closure cohort. It indicates that these students were quite widely dispersed, although a large proportion attended a high school in the same borough as the school that closed. In all, these students, who started high school between 2003 and 2009, were distributed across a total of 374 different high schools. On average, for each closed high school, the group of students who could no longer chose that school ended up attending 82 other high schools across the City. Nearly 45 percent enrolled in a high school located in the building that housed the closed high school, and another 8 percent enrolled in another high school in the same community school district. In all, 87 percent of the students in the post-closure cohort enrolled in a high school located in the same borough as the closed school.
Table 7 also shows that 28 percent of the students in the post-closure cohort attended a brand new high school that had opened the year prior to their enrollment. Nearly 57 percent enrolled in a small high school, defined here as enrolling 110 or fewer
Table 7: High School Enrollment Patterns: Post-Closure Cohort
Post-Closure
Cohort Total number of different high schools attended 374
Average number of high schools attended (per closing HS) 82
Enrolled in the same building as closing school (%) 44.5
Enrolled in the same district as closing school (%) 52.6
Enrolled in the same borough as closing school (%) 86.6
Enrolled in a new high school (%) 27.9
Enrolled in a small high school 57.3
Number of Students 11,460 Notes: See page 53.
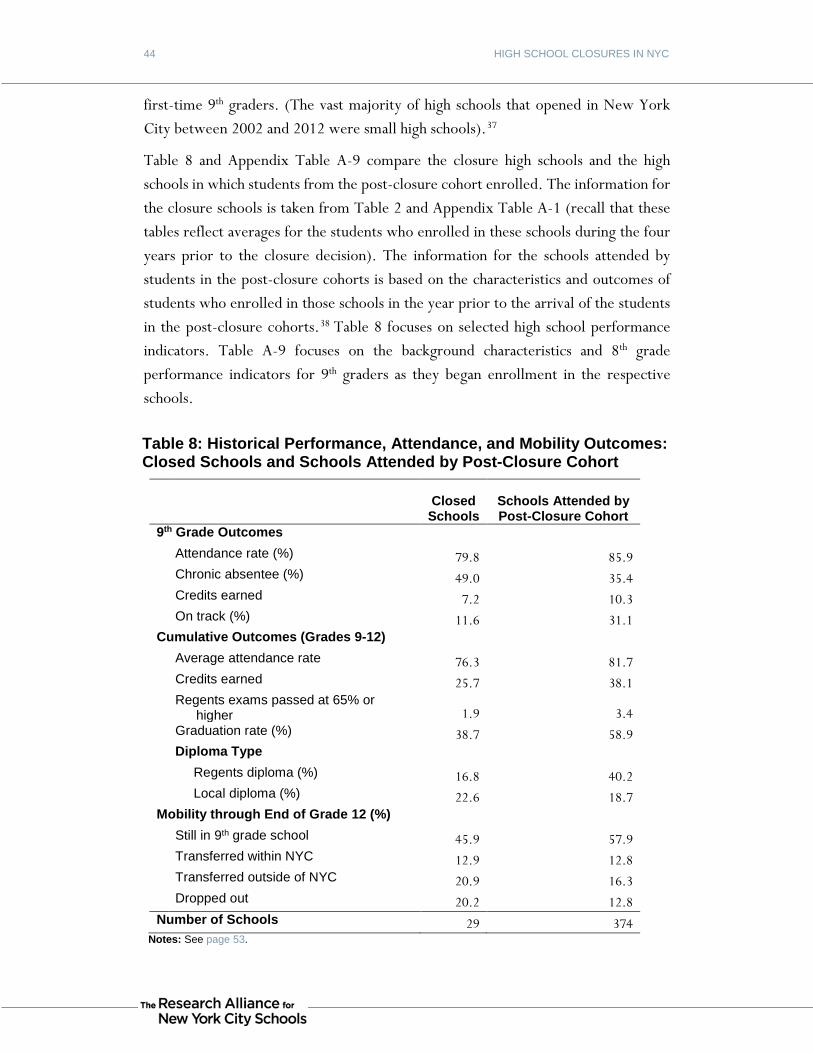
44 HIGH SCHOOL CLOSURES IN NYC
first-time 9th graders. (The vast majority of high schools that opened in New York City between 2002 and 2012 were small high schools).37
Table 8 and Appendix Table A-9 compare the closure high schools and the high schools in which students from the post-closure cohort enrolled. The information for the closure schools is taken from Table 2 and Appendix Table A-1 (recall that these tables reflect averages for the students who enrolled in these schools during the four years prior to the closure decision). The information for the schools attended by students in the post-closure cohorts is based on the characteristics and outcomes of students who enrolled in those schools in the year prior to the arrival of the students in the post-closure cohorts.38 Table 8 focuses on selected high school performance indicators. Table A-9 focuses on the background characteristics and 8th grade performance indicators for 9th graders as they began enrollment in the respective schools.
Table 8: Historical Performance, Attendance, and Mobility Outcomes: Closed Schools and Schools Attended by Post-Closure Cohort
Closed Schools
Schools Attended by Post-Closure Cohort
9th Grade Outcomes Attendance rate (%) 79.8 85.9 Chronic absentee (%) 49.0 35.4 Credits earned 7.2 10.3 On track (%) 11.6 31.1
Cumulative Outcomes (Grades 9-12) Average attendance rate 76.3 81.7 Credits earned 25.7 38.1 Regents exams passed at 65% or
higher 1.9 3.4 Graduation rate (%) 38.7 58.9 Diploma Type Regents diploma (%) 16.8 40.2 Local diploma (%) 22.6 18.7
Mobility through End of Grade 12 (%) Still in 9th grade school 45.9 57.9 Transferred within NYC 12.9 12.8 Transferred outside of NYC 20.9 16.3 Dropped out 20.2 12.8
Number of Schools 29 374 Notes: See page 53.
45
Overall, these two tables indicate that students from the post-closure cohort enrolled in higher-performing high schools compared to the closed schools in which they were likely to have enrolled had they remained open. For example, Table A-9 shows that students from the post-closure cohort attended high schools where the population of entering 9th graders was less likely to be overage for their grade, had higher middle school attendance rates, and higher 8th grade test scores than students who had enrolled in the closing high schools. Interestingly, the two groups of schools enrolled similar percentages of students eligible for free or reduced price lunch and students who received English language learning or special education services.
Table 8 indicates that students from the post-closure cohort enrolled in high schools where students achieved much higher outcomes than those in the closing schools that were no longer an option for them. For example, the high schools attended by the post-closure cohort had substantially higher 9th grade attendance rates and lower chronic absentee rates. The 9th grade on-track rate for the post-closure schools was nearly three times higher than the on-track rate in the closed schools. Graduation rates and Regents diploma rates were also substantially higher for the post-closure schools compared to the closed high schools. Finally, enrollment in the post-closure high schools was much more stable, with lower proportions of students dropping out or transferring outside of New York City.
In short, closing low-performing high schools appears to have enabled the displaced students to enroll in much higher-performing schools, both in terms of the characteristics and prior performance of their peers and on the basis of longer-term outcomes for students attending these high schools. Although students from the post-closure cohorts enrolled in better schools, this does not necessarily mean that they themselves performed better than their peers from earlier cohorts who enrolled in the closed schools or than students in the comparison schools. The next section explores this question.
Were Students Better Off (in Terms of Academic Performance and Attendance) After Their Most Likely High School Option Closed? To address this question, we utilized an extension of the CITS analysis described in the previous chapter. Specifically, the analysis continued the historical outcome trends for an additional year for both the closed schools and the comparison schools. For both groups of schools, the continuation of the trend provides an estimate of the
46 HIGH SCHOOL CLOSURES IN NYC
likely outcomes that would have occurred had the schools stayed on their historical trajectories. As with the earlier analysis, the closure decisions constitute a potential disruption or interruption in these historical trends, where one group of schools was identified for closure and the other was not.
In the case of the closing schools, outcomes for the post-closure cohort provide an estimate of the degree to which performance changed when students were forced to choose another option in the wake of a closure. In the case of the comparison schools, the analysis now includes students who enrolled at the same time as the post-closure cohort.
Differences between the two groups of schools’ changes in outcomes after the closure decision represents the net impact of the closure, over and above changes that occurred for low-performing schools that avoided closure. In other words, this analysis illuminates the impact of having to choose a different high school for the post-closure cohort.
Table 9 on the next page presents findings from this analysis. The table shows a consistent pattern of improvement for students in the post-closure cohort compared to the projected performance of their peers who enrolled in the closing schools prior to the closure decision. This includes reductions in chronic absenteeism in 9th grade and increases in on-track rates at the end of 9th grade. (Appendix Table A-10 presents outcomes for 10th and 11th grades). Graduation rates improved by 15.5 percentage points, with nearly all of this increase coming from an increase in the receipt of Regents diplomas.
Table 9 also indicates continued modest improvements for students in the comparison schools who began their high school career at the same time as students who were displaced by a school closure. For example, they experienced statistically significant improvements in on-track rates at the end of 9th grade, compared to their peers from earlier cohorts. Although there was no improvement in overall graduation rates, the later cohort of students in the comparison schools experienced a substantial improvement in the receipt of Regents diplomas. In general, the increases in outcomes for students in the comparison schools suggest that not all of the improvement for the displaced students in the post-closure cohort can be attributed directly to the closures themselves. In other words, there was likely to be some modest improvement for students in low-performing schools whether or not their school was identified for closure.
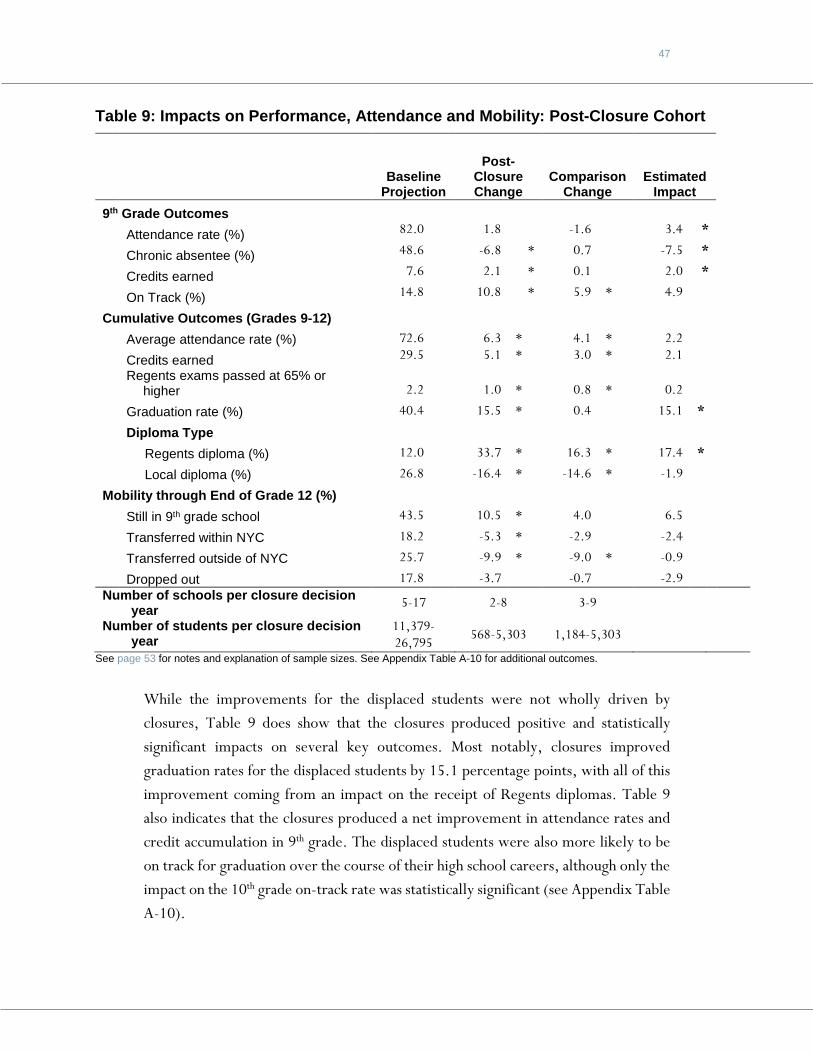
47
While the improvements for the displaced students were not wholly driven by closures, Table 9 does show that the closures produced positive and statistically significant impacts on several key outcomes. Most notably, closures improved graduation rates for the displaced students by 15.1 percentage points, with all of this improvement coming from an impact on the receipt of Regents diplomas. Table 9 also indicates that the closures produced a net improvement in attendance rates and credit accumulation in 9th grade. The displaced students were also more likely to be on track for graduation over the course of their high school careers, although only the impact on the 10th grade on-track rate was statistically significant (see Appendix Table A-10).
Table 9: Impacts on Performance, Attendance and Mobility: Post-Closure Cohort
Baseline
Projection
Post-Closure Change
Comparison Change
Estimated Impact
9th Grade Outcomes
Attendance rate (%) 82.0 1.8 # -1.6 # 3.4 *
Chronic absentee (%) 48.6 -6.8 * 0.7 # -7.5 *
Credits earned 7.6 2.1 * 0.1 # 2.0 *
On Track (%) 14.8 10.8 * 5.9 * 4.9 #
Cumulative Outcomes (Grades 9-12)
Average attendance rate (%) 72.6 # 6.3 * 4.1 * 2.2 #
Credits earned 29.5 5.1 * 3.0 * 2.1 #
Regents exams passed at 65% or
higher 2.2 # 1.0 * 0.8 * 0.2 #
Graduation rate (%) 40.4 # 15.5 * 0.4 0.0 15.1 *
Diploma Type
Regents diploma (%) 12.0 # 33.7 * 16.3 * 17.4 *
Local diploma (%) 26.8 # -16.4 * -14.6 * -1.9 #
Mobility through End of Grade 12 (%)
Still in 9th grade school 43.5 # 10.5 * 4.0 0.0 6.5 #
Transferred within NYC 18.2 # -5.3 * -2.9 0.0 -2.4 #
Transferred outside of NYC 25.7 # -9.9 * -9.0 * -0.9 #
Dropped out 17.8 # -3.7 0.0 -0.7 0.0 -2.9 # Number of schools per closure decision
year 5-17 2-8 3-9
Number of students per closure decision year
11,379-26,795
568-5,303 1,184-5,303
See page 53 for notes and explanation of sample sizes. See Appendix Table A-10 for additional outcomes.
48 HIGH SCHOOL CLOSURES IN NYC
Finally, students from the post-closure cohort were more likely to remain enrolled in their original 9th grade school (a 10.5 percentage point increase), compared to the projected trend for students in the closed schools. Although the net impact on this outcome (6.5 percentage points) was not statistically significant, this is a notably different pattern that seen for the phaseout cohort, who were less likely to remain in their 9th grade schools (a decline of 6.9 percentage points compared to the projected trend; see Table 4).
Chapter Summary This chapter examined the impact of closures on the students who had to choose other high schools when their most likely option was shuttered. Key findings include:
• Students who were most likely to be displaced by closing a high school enrolled in higher-performing high schools, compared to the closed schools, both in terms of the characteristics of the entering students and on the basis of longer-term outcomes.
• Students from the post-closure cohort achieved higher attendance, on-track rates, and graduation rates, compared to the performance of their peers who entered high school prior to the closure decision.
• Closing a high school had a systematic impact on graduation rates, including the rate at which students received the more rigorous Regents diploma, and on several precursors to these longer-term outcomes, including attendance and credit accumulation in the 9th grade.
49
CHAPTER 6: DISCUSSION After decades of stagnant graduation rates that hovered below 50 percent, the first decade of the 21st century saw notable improvements in the prospects of students in New York City’s high schools. Between 2003 and 2011, for example, on-time graduation rates increased from 51 percent to 69 percent. 39 This growth was concentrated among students earning the newly mandated New York State Regents diploma, which required passing five academic subject-based assessments, in addition to completing 44 course credits. Further, college enrollment rates during this period kept pace with the increasing number of high school graduates.40
Among the forces behind these trends were a set of interlocking systemic reforms that were implemented at an unprecedented pace and scale. These reforms were anchored in closing large, persistently low-performing high schools, opening new small schools, and extending high school choice to all students throughout the district. By implementing these changes together, district leaders aimed to upgrade the educational options available to students who had historically been assigned to failing schools largely by virtue of their residence.
While the high school closure process was the most politically charged and widely publicized feature of the reform effort, it has also been the least studied. The analyses presented in this report provide the only rigorous evidence to date about the impact of New York City’s performance-based closures on a range of student outcomes, including mobility, attendance, and performance.
Focusing on the 29 high schools that were designated for closure between 2002 and 2008, the report finds that meaningful benefits accrued to students who were displaced by the performance-based high school closures. These are the middle school students who were compelled to choose another option when their most likely high school choice was closed. The study shows that these students attended higher-performing high schools, compared to the closed schools they likely would have attended had those schools remained open. This shift in enrollment options led to improvements in students’ attendance, progress toward graduation, and ultimately, their graduation rates—with large increases in the share of students earning the more demanding Regents diploma.
Importantly, these benefits for future cohorts of students occurred without harming the academic performance of students who were enrolled in the schools as they were being phased out. This is noteworthy, because it has been widely speculated that the phaseout process did damage to the students who experienced it. Our study suggests that, at least in terms of measurable academic outcomes, this was not the case.
50 HIGH SCHOOL CLOSURES IN NYC
What Should Readers Consider When Interpreting These Results? Debates about the efficacy of school closures as a key element of educational improvement policies should be sensitive both to the limitations inherent in this study and to several critical issues that have not yet been addressed by this or other research:
First, high school closures are politically volatile and fraught with emotional backlash from the affected school communities. Our study does not examine closures’ effects on educators, parents, and neighborhoods (or on aspects of students’ experiences not reflected in their attendance, mobility and academic outcomes). For cities that elect to close low-performing schools, it is crucial to be attentive to the possibility of these collateral impacts, and to look for ways to mitigate the pain that closures may bring. It seems important to authentically engage local stakeholders in tracking a school’s performance over time; selecting and implementing improvement strategies; developing criteria for deciding to close a school; and, if absolutely necessary, phasing the school out in a way that maintains support for enrolled students.
Second, while our study shows that students who likely would have attended the closed schools fared better elsewhere, they still did not fare well. On average, just 56 percent of these students graduated from high school within four years, and less than half earned a Regents diploma. This highlights deeply entrenched inequalities in the City’s schools, where poor students of color lag far behind their more privileged peers on wide range of measures. Whether or not closures are part of the policy framework, there is a need to invest in these vulnerable students and identify structures and supports that maximize their odds of success.
Third, deciding how to deal with chronically low-performing schools demands a better understanding of the mechanisms that promote or impede school improvement. Notably, this study provides evidence of systematic gains among a broad swath of low-performing high schools, including those that avoided closure. It is not clear what accounts for this pattern. How did these schools make use of supports provided by the NYC DOE, and did these supports contribute to their improvement? While the report documents improvements in some of the City’s lowest performing schools, it cannot tell us whether similar gains in student outcomes could have been attained without closures. Did these schools feel pressure to improve lest they be next in line to be closed? If so, how did they respond, and what specific actions did they take to promote better student outcomes? These questions must await further research.
51
What Do the Findings Suggest for Policy? In spite of the considerations outlined above, many readers will still want to know: Should districts keep the option of closing very low-performing schools on the table? While there is no simple way of answering this question, our findings suggest two different, but equally important insights:
• School closures in New York City were a central part of a multi-dimensional, comprehensive effort to improve secondary education.
During this era, the City developed a portfolio of more than 200 new high schools, most of which are small and unscreened (i.e., admission is not based on prior performance), and implemented an open choice system making the options available on citywide basis. The growth of small schools was possible, in part, because of the physical space and “demand” created by closing many of the City’s large comprehensive high schools.
A rigorous and ongoing study of these small schools by the research firm MDRC has provided compelling evidence of their positive and persistent impact on a wide range of student outcomes, including attendance, credit accumulation, high school graduation, and college going.41 As the MDRC study notes, “it is rare to find such large effects for a rigorously evaluated large-scale education reform and rarer still to see such effects continue into college.”42 Other recent research suggests that the introduction of small schools in New York City “lifted all boats…improving outcomes for students in all types of schools: large, small, continuously operating, and new.”43
Collectively, therefore, recent studies provide rigorous evidence about the effectiveness of this constellation of reforms—showing the positive impacts of small high schools, meaningful benefits for students who were able to avoid attending a very low-performing school because it was closed, and a lack of harmful effects on academic performance for students who experienced the phaseout process directly. This accumulation of evidence offers support for the strategic use of school closures as part of a multi-dimensional high school reform strategy. That being said…
• The landscape and expectations of New York City’s high schools look very different today than they did at the turn of the 21st century.
The reform strategies that included high school closures were conceived and implemented at a time when 70 percent of New York City’s high school students
52 HIGH SCHOOL CLOSURES IN NYC
attended a school that met Robert Balfanz’s “dropout factory” criteria. Although the numbers are still high, we estimate that less than a third of the City’s students are currently enrolled in such schools. Dramatic actions like school closures may have set the system on a positive trajectory, but they may not be sufficient for the challenges of today and the future.
For example, expectations for high schools are very different than they were 15 years ago. Economic self-sufficiency is increasingly tied to the attainment of a post-secondary credential, preferably a four-year college degree. Thus, even a Regents diploma is no longer considered an acceptable end-point credential. High schools are now expected to produce “college and career ready” graduates, and a school’s performance is assessed, in part, based on the ability to get students enrolled in college. This is a new set of challenges, even for high schools with relatively strong graduation rates.
In addition, despite the improvements generated by recent reforms, large numbers of students are still being left behind. Approximately 30 percent of New York City’s entering high school students fail to graduate within four years, including more than half of the City’s Black and Latino young men.44 Thus, while the reforms of the last decade appear to have “lifted all boats,” the system is still characterized by wide disparities in student outcomes, based on race and socio-economic status. More targeted strategies are likely needed to move the needle on this problem.
In short, the current landscape and expectations for high schools may demand a different set of strategies for improvement. While the option of closing schools has not been taken off the table in New York City, the NYC DOE has deemphasized both high-stakes, outcomes-based consequences for low-performing schools and the creation of new options to replace those that do not measure up. The district’s current strategy for school improvement focuses on capacity-building through learning partnerships and tapping into community resources among geographically proximate schools that face common challenges. The NYC DOE has also placed a strong emphasis on family engagement and on increasing high school students’ access to advanced course work and college counseling.45 Looking ahead, it will be important to continue conducting rigorous analyses that shed light on whether these new approaches produce hoped-for gains in students’ performance.
53
Table and Figure Notes Source:
Research Alliance calculations using NYC Department of Education administrative records from the 1999-2000 to 2012-2013 school years.
Sample Information:
The sample for this report includes students who enrolled in 9th grade in a New York City high school for the first time between 1999 and 2009. The data include information on these students through the end of their 12th grade year (including scheduled graduation), the year in which they dropped out of high school, or the year in which they transferred outside of the New York City public schools. However, Regents and Local diploma attainment data are incomplete for students who entered high school prior to 2001.
With the following exceptions, the sample includes all schools that enrolled first-time 9th grade students between 1999 and 2009. The sample does not include: (1) High schools that were scheduled for closure prior to 2002, because our database does not include sufficient historical information on these schools. (2) New schools that had not yet enrolled at least two cohorts of incoming 9th graders between 2000 and 2008. This is because the primary analytic methods used in the study are based on trends in student outcomes over several years prior to a decision to close a school. (3) NYC’s nine specialized high schools, because we determined that these highly selective high schools do not provide relevant comparisons with the low-performing schools that serve as the main focus of this study. (4) Schools designated exclusively for students requiring full-time special education services (i.e., District 75 schools), which include ungraded students for whom it is not possible to identify a 9th-grade year.
Averages and trends for the periods prior to a closure decision are calculated based the expected grade levels of first-time 9th graders who enrolled in the schools prior to the closure decision year. For example, pre-phaseout 9th grade outcomes for the 2006 closure decision year are based on students who were in 9th grade in 2002, 2003, 2004, or 2005. Pre-phaseout 10th grade outcomes for the 2006 closure decision year are based on students who were scheduled to be in 10th grade in 2002, 2003, 2004, or 2005 (i.e., first-time 9th graders in 2001, 2002, 2003, or 2004, respectively). Because the earliest data available is for first-time 9th graders is 1999, the number of pre-phaseout cohorts for each expected grade level differs by the closure decision year. See Appendix B for specifics.
Variable Definitions and Notes: Attendance rate: The number of days a student was present divided by the number of days that a student was enrolled in a New York City public school times 100.
Chronic absentee: An attendance rate of less than 89 percent (equivalent to being absent for about one month of a full nine-month school year).
Credits earned: Calculated for all students through the point at which they graduated, dropped out or transferred outside of New York City.
Dropped out: Students who left the NYC public school system with no record of re-enrollment in another school, in or out of the NYC public school system.
Eligible for Free or Reduced Price Lunch: Includes students who: (1) have records documenting eligibility for free or reduced price lunch in grade 8 or 9, (2) provided documentation to the DOE of eligibility for federal public assistance, or (3) attended a school in which all students were provided with the option for free or reduced price lunch.
54 HIGH SCHOOL CLOSURES IN NYC
Grade 8 City-Wide ELA/Math Performance Group:
• ELA or math in bottom 20%: Student’s grade 8 ELA or math assessment scaled score was in the bottom 20th percentile of scores of first-time 9th graders from that cohort and the other grade 8 state test scaled score (math or ELA) was not above the 50th percentile of scores of first-time 9th graders from that cohort.
• ELA and math in middle 60%: Student’s grade 8 ELA and math assessment scaled scores were both between the bottom 20th percentile and the top 20th percentile of scores of first-time 9th graders in that cohort. Or, student was in top 20th percentile for either ELA or math and in the bottom 20th percentile for the other.
• ELA or math in top 20%: Student’s grade 8 ELA or math assessment scale score was in the top 20th percentile of scores of 9th graders from that cohort and the other grade 8 state test scaled score (math or ELA) was not below the 50th percentile of scores of first-time 9th graders from that cohort.
Graduation rates: Calculated using criteria consistent with the New York State Education Department and the New York City Department of Education. Graduates include those who earned a local diploma or a New York State Regents Diploma. Like the NYSED and NYC DOE calculations, graduates include those who earned a diploma over the summer following the scheduled 12th grade year. Students who transferred outside of the New York City school system are not included in the calculation of graduation rates. See Regents and local diploma requirements at http://schools.nyc.gov/RulesPolicies/GraduationRequirements/default.htm.
On track (9th grade): Earned 10 or more course credits and passed at least one Regents Examination with a 65 or higher during the first year of high school.
On track (10th grade): Earned 22 or more course credits and passed at least two Regents Examinations with a 65 or higher during the two years of high school.
On track (11th grade): Earned 33 or more course credits and passed at least three Regents Examinations with a 65 or higher during the first three years of high school. Overage for grade 9: Student was age 15 or older as of December 31 of the year in which the student first entered 9th grade. While some of these students may have entered school late (e.g., at age 6 or older in kindergarten), more that 95 percent had been retained in at least one grade prior to enrolling in high school. Received English Language Learning Services: Student’s school records indicate a referral for any English language learning services in grade 8 or 9. (Used 9th grade data if student was not enrolled in a NYC public school in 8th grade).
Received Special Education Services: Student school records include Individual Education Plans (IEPs) for learning or behavioral disabilities that can be accommodated in regular education classrooms. (Used 9th grade data if student was not enrolled in a NYC public school in 8th grade).
Regents examinations passed at 65% or higher: Calculated for all students through the point at which they graduated, dropped out or transferred outside of New York City.
Table Notes:
Table 1: See sample description on page 53.
Tables 2 and 3: Averages are calculated across schools for each year, up to four years prior to each closure decision year. These are then averaged across the closure decision years from 2002 through 2008.
55
Sample sizes are presented as ranges based on the number of schools in each closure decision year (see Table 1).
A two-tailed t-test was applied to differences between closure schools and comparison schools and between closure schools and other schools. The statistical significance level is indicated as * = p <= .05.
Tables 4, 5, and 6: Baseline trends were estimated for outcomes that were observed over two to four years prior to the closure decision. The baseline projections are estimates of the extension of these trends for up to three years following the closure decision. The baseline projection estimates in the table correspond to the year in which the last cohort of 9th graders to enroll in the closure schools reached the relevant grade level. Therefore, baseline projection estimates for Grade 9 outcomes are presented for the first year following the closure decision. Baseline projection estimates for Grade 10 outcomes are presented for the second year following the closure decision. Baseline projection estimates for Grade 11, 12, and cumulative outcomes are presented for the third year following the closure decision.
The baseline projections in the table have been regression adjusted to account for differences between closure schools and comparison schools in their respective trends during the pre-phaseout period. They are also adjusted for differences over time and between schools in student demographic and prior performance characteristics. For ease of comparison, the baseline projections are centered on the characteristics and trends of the schools designated for closure.
Sample sizes are presented as ranges based on the number of schools in each closure decision year (see Table 1).
A two-tailed t-test was applied to the phaseout school changes (relative to the baseline projection), to the comparison school change (relative to the baseline projection), and to the estimated impact (the difference between the phaseout and comparison school changes). The statistical significance level is indicated as * = p <= .05.
Due to data limitations, impacts on cumulative outcomes are only available for schools that faced a closure decision between 2003 and 2008. Due to data limitations, impacts on Regents and Local diploma receipt rates are only available for schools that faced a closure decision between 2005 and 2008.
Table 5: Non-mobile students include those who remained enrolled in their original 9th grade high school through graduation, the end of their 12th grade year, or the year in which they dropped out of high school.
Table 6: Mobile students include those who transferred from their original 9th grade high school to another New York City high school prior to graduation, the end of their 12th grade year, or dropping out. Mobile students do not include students who transferred to a high school outside of New York City.
Table 7: New high schools include those that began admitting first-time 9th graders no more than one year prior to the enrollment of a student from the post-closure cohort.
Small high schools include those that admitted 110 or fewer first-time 9th graders in the year prior to the enrollment of a student from the post-closure cohort.
Table 8: Outcomes for the closure schools are taken from Table 2. Outcomes for the schools attended by the post-closure cohort are based on outcomes for students who enrolled in those schools one year before the post-closure cohort. Averages are weighted by the number of post-closure cohort students in each school. This means that outcomes for schools which enrolled a
56 HIGH SCHOOL CLOSURES IN NYC
large number of students from the post-closure cohort are given more weight than those for schools with only a few students from the post-closure cohort. Tests of statistical significance were not performed for the comparison between the closure schools and the schools attended by the post-closure cohort.
Table 9: Baseline trends were estimated for outcomes at each expected grade level over two to four years prior to each closure decision year. The baseline projections are estimates of the extension of these trends for up to four years following the closure decision. The baseline projection estimates presented in the table correspond to the year in which the post-closure cohort reached the relevant grade level. Baseline projection estimates for Grade 9 outcomes are presented for the second year following the closure decision. Baseline projection estimates for Grade 10 outcomes are presented for the third year following the closure decision. Baseline projection estimates for Grade 11, 12, and cumulative outcomes are presented for the fourth year following the closure decision.
The baseline projections presented in the table have been regression adjusted to account for differences between closing schools and comparison schools in their respective trends during the pre-phaseout period. They are also adjusted for differences over time and between schools in student demographic characteristics and prior performance. For ease of comparison, the baseline projections are centered on the characteristics and trends of the schools designated for closure.
Sample sizes are presented as ranges based on the number of schools in each closure decision year (see Table 1). Students in the post-closure cohort are considered to be clustered based on the closed high schools on which the matched comparison was based. The sample sizes for the post-closure cohort reflect this clustering approach.
A two-tailed t-test was applied to the post-closure change (relative to the baseline projection), to the comparison change (relative to the baseline projection), and to the estimated impact (the difference between the post-closure and comparison school changes). The statistical significance level is indicated as * = p <= .05.
Due to data limitations, impacts on cumulative outcomes are only available for schools that were designated for closure between 2003 and 2008. Due to data limitations, impact on Regents and Local diploma receipt cumulative outcomes are only available for schools that were designated for closure between 2005 and 2008.
Figure Notes:
Figure 1: The index is based on 10 performance indicators: 9th grade attendance rates; on-track rates at the end of the 9th, 10th, and 11th grade; credit and Regents test accumulation by grade 12; dropout and transfer rates; high school graduation rates within four years of entering high school; and rates of receiving a Regents diploma within four years of entering high school. These measures were averaged over two to four years prior to each of the district’s school closure decisions between 2002 and 2008. For each of these years, all schools in the sample were then ranked on each measure relative to the lowest performance for that measure in that year. Combined, these relative rankings yielded a “performance index” that reflects the overall difference between a school’s performance and the lowest performance in the system for a given year. Each point on the graph represents the group of schools that were ranked in a given percentile at least once between 2002 through 2008 (the diamonds represent the schools identified for closure between 2002 and 2008, and the squares represent other NYC high schools).
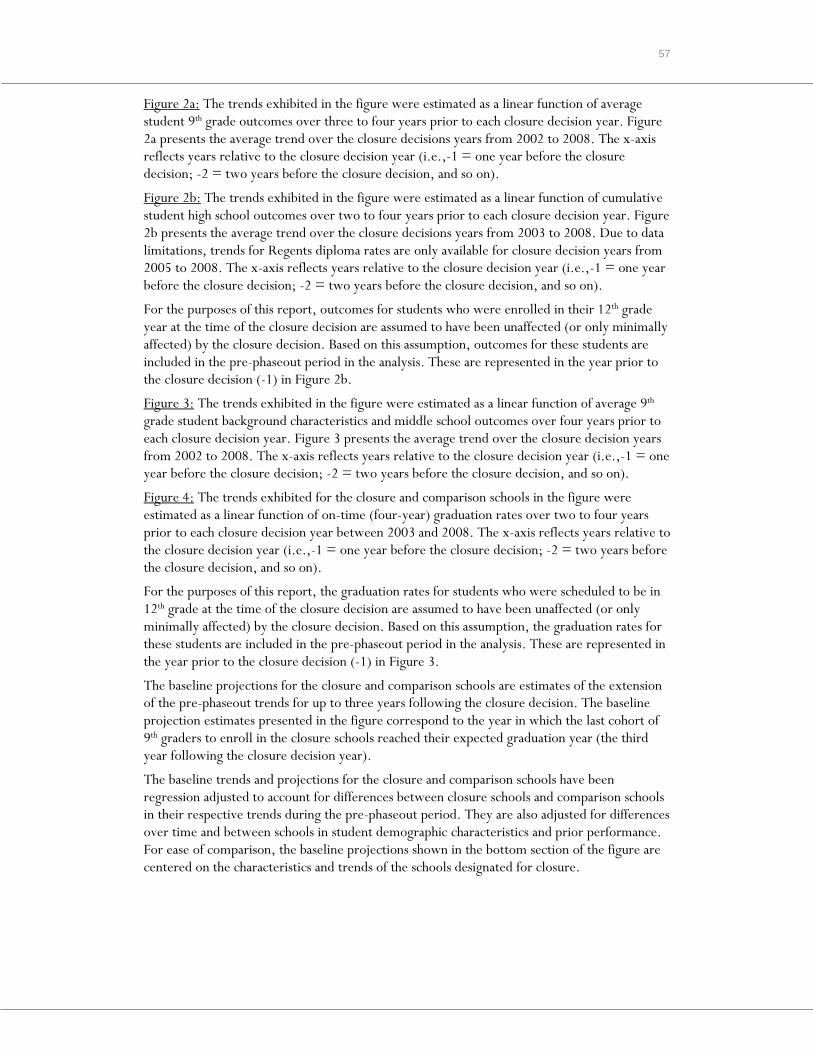
57
Figure 2a: The trends exhibited in the figure were estimated as a linear function of average student 9th grade outcomes over three to four years prior to each closure decision year. Figure 2a presents the average trend over the closure decisions years from 2002 to 2008. The x-axis reflects years relative to the closure decision year (i.e.,-1 = one year before the closure decision; -2 = two years before the closure decision, and so on).
Figure 2b: The trends exhibited in the figure were estimated as a linear function of cumulative student high school outcomes over two to four years prior to each closure decision year. Figure 2b presents the average trend over the closure decisions years from 2003 to 2008. Due to data limitations, trends for Regents diploma rates are only available for closure decision years from 2005 to 2008. The x-axis reflects years relative to the closure decision year (i.e.,-1 = one year before the closure decision; -2 = two years before the closure decision, and so on).
For the purposes of this report, outcomes for students who were enrolled in their 12th grade year at the time of the closure decision are assumed to have been unaffected (or only minimally affected) by the closure decision. Based on this assumption, outcomes for these students are included in the pre-phaseout period in the analysis. These are represented in the year prior to the closure decision (-1) in Figure 2b.
Figure 3: The trends exhibited in the figure were estimated as a linear function of average 9th grade student background characteristics and middle school outcomes over four years prior to each closure decision year. Figure 3 presents the average trend over the closure decision years from 2002 to 2008. The x-axis reflects years relative to the closure decision year (i.e.,-1 = one year before the closure decision; -2 = two years before the closure decision, and so on).
Figure 4: The trends exhibited for the closure and comparison schools in the figure were estimated as a linear function of on-time (four-year) graduation rates over two to four years prior to each closure decision year between 2003 and 2008. The x-axis reflects years relative to the closure decision year (i.e.,-1 = one year before the closure decision; -2 = two years before the closure decision, and so on).
For the purposes of this report, the graduation rates for students who were scheduled to be in 12th grade at the time of the closure decision are assumed to have been unaffected (or only minimally affected) by the closure decision. Based on this assumption, the graduation rates for these students are included in the pre-phaseout period in the analysis. These are represented in the year prior to the closure decision (-1) in Figure 3.
The baseline projections for the closure and comparison schools are estimates of the extension of the pre-phaseout trends for up to three years following the closure decision. The baseline projection estimates presented in the figure correspond to the year in which the last cohort of 9th graders to enroll in the closure schools reached their expected graduation year (the third year following the closure decision year).
The baseline trends and projections for the closure and comparison schools have been regression adjusted to account for differences between closure schools and comparison schools in their respective trends during the pre-phaseout period. They are also adjusted for differences over time and between schools in student demographic characteristics and prior performance. For ease of comparison, the baseline projections shown in the bottom section of the figure are centered on the characteristics and trends of the schools designated for closure.

58 HIGH SCHOOL CLOSURES IN NYC
Endnotes 1 See Balfanz (2004), page 14, “Spotlight on
New York City” and Balfanz (2014). 2 See U.S. Department of Education (2002)
for the text of the No Child Left Behind Act.
3 See U.S. Department of Education (2009). 4 See Powell (2012). 5 An earlier paper reviews the almost non-
existent evidence base on school closures prior to 2009 (Sunderman and Payne, 2009). This paper focuses mostly on Chicago work and draws on general studies of student mobility. The primary conclusion of this review is that “few studies examine the impact of closing a school on displaced students. Thus, until there is a body of research on school closures, the findings from these studies should be interpreted carefully” (p. 5).
6 The Elementary and Secondary Education Act (ESEA): http://www.ed.gov/blog/topic/esea-reauthorization/
7 See O’Day, Bitter, and Gomez (2011) for a more complete description of the reforms underway in New York City during this period.
8 See Bloomberg (2003). 9 The other two schools did not open until
the 2002-2003 and 2004-2005 schools years, respectively. They too met the definition of a “dropout factory” with similar rates of promoting power.
10 See Kemple (2013) for an overview of the high school landscape in New York City between 1999 and 2011.
11 See Nathanson, Corcoran, and Baker-Smith (2013).
12 In 2009, as part of the New York State Legislature’s review of mayoral control, a provision was added to NYS education law offering specific and extensive process requirements related to school closures: http://schools.nyc.gov/NR/rdonlyres/7D8147A2-7A0C-4BAC-A762-
33B69C137AD6/0/A190SignificantChangesinSchoolUtilizationRegulation.pdf
13 See, for example: http://www1.nyc.gov/office-of-the-mayor/news/400-07/mayor-bloomberg-chancellor-klein-release-first-ever-public-school-progress-reports
14 The NYC DOE identified 44 high schools for closure between 2000 and 2012. The current study focuses on the 29 high schools designated for closure between 2002 and 2008. These years were chosen to ensure that sufficient data were available for the analysis including: a) at least two entering cohorts of 9th grade students prior to the first phaseout year and b) four-year graduation rates for the last cohort of 9th grade students to enroll in a school designated for closure (at the time of writing, 2012-2013 is the last year for which data were available for analysis). In 2002, two other high schools were in the midst of being phased out after a decision was reached in 2001. A third was also in the process of being phased out in 2002, although the school admitted small groups of new 9th graders in 2002 and 2003. No high schools began the phaseout process in 2009 because of a court order that temporarily restricted the NYC DOE from closing schools. Fifteen additional high schools were identified for phaseout in 2010 and scheduled for full closure by 2014.
15 These schools also enrolled an average of approximately 340 repeating 9th grade students. Overall, 9th graders outnumbered 12th graders by an average of more than three to one.
16 The sample does not include: (1) High schools that were scheduled for closure prior to 2002, because our database does not include sufficient historical information on these schools. (2) New schools that had not yet enrolled at least two cohorts of incoming 9th graders
59
between 2000 and 2008. This is because the primary analytic methods used in the study are based on trends in student outcomes over several years prior to a decision to close a school. (3) NYC’s nine specialized high schools, because we determined that these highly selective high schools do not provide relevant comparisons with the low-performing schools that serve as the main focus of this study. (4) Schools designated exclusively for students requiring full-time special education services (i.e., District 75 schools), which include ungraded students for whom it is not possible to identify a 9th-grade year.
17 This ranking is based on what are known as Euclidean Distance calculations (Afifi, Clark, and May, 2004, pp.423-426). The performance index value represents a combination of the differences between the outcome values for that school and the lowest value for the sample of schools. The index is measured in standard deviation units in which smaller values indicate closer proximity to the lowest-performing school across all 10 indicators.
18 It is important to note that some of these schools near the bottom of the rankings were subsequently identified for closure. Schools were not included in the comparison group for a given year if they were identified for closure within the following five years.
19 Based on conversations with NYC DOE officials who were familiar with the school closure decisions.
20 In addition, as illustrated by findings presented later in this report, subsequent improvements seen in the performance of some struggling schools that avoided closure can serve as a counter point to the strategy of shuttering schools that are underperforming.
21 See Kemple, Segeritz, and Stephenson (2013) for analyses supporting this early indicator of students’ progress toward on-time graduation from high school.
22 For analyses in this report, cohorts of students who began their enrollment in the schools three years prior to the closure decision are assumed to have been unaffected (or only marginally affected) by the closure decision (which would have occurred in their expected 12th grade year). With this assumption in mind, these cohorts are considered part of the pre-phaseout period in the analysis.
23 See Table A-5.2 in Kemple (2013). 24 “Overage for grade” is defined as being 15
or older as of December 31st of the 9th grade year. While some of these students may have entered school late (e.g., at age 6 or older in kindergarten), more that 95 percent had been retained in at least one grade prior to enrolling in high school.
25 The baseline projections presented in the bottom panel of Figure 4 have been regression adjusted to account for the differences between closing schools and comparison schools in their respective graduation trends during the pre-phaseout period. They are also adjusted for differences over time and between schools in student demographic and prior-performance characteristics. For ease of comparison, the adjusted baseline projection levels are centered on the characteristics and trends of the schools designated for closure.
26 The baseline projections presented in Table 4 have been regression adjusted via the methods described in note 25 above.
27 During much of the period covered by this analysis, New York State was in the process of phasing out the less rigorous local diploma credential and requiring all students to earn a Regents diploma. Thus, all New York City high schools were experiencing substantial increases in the percent of students earning a Regents diploma. This highlights the importance of the Comparative Interrupted Time Series methods used for this report, which accounts for trends at comparison schools. Without this comparison, the significant
60 HIGH SCHOOL CLOSURES IN NYC
improvement in Regents diploma rates for the closing schools might appear to be of the result of the phaseout process.
28 The graduation rates presented in Table 4 reflect “on-time” graduation rates, defined as earning a diploma within four years of first entering high school. Unpublished analyses conducted by the Research Alliance indicate that an additional 5 to 10 percent of students earn a diploma within five years of entering high school. However, students who had not graduated by the end of the four-year phaseout process were forced to transfer and complete their graduation requirements elsewhere. One hypothesis is that the phaseout process may have produced a negative impact on later graduation rates for these students, if they simply dropped out rather than transition. Because of data limitations, we were only able to explore this hypothesis for five of the seven groups of closing high schools (those designated for closure starting in 2003, 2004, 2005, 2006, and 2007). These analyses indicated that the phaseout process had no net impact (positive or negative) on five-year graduation rates. This was true both for students who remained in the closing schools for four years and then transferred and for students who transferred prior to scheduled graduation.
29 Graduates from the phaseout schools earned an average of 50 course credits during their high school careers; 93 percent of them earned 44 or more credits. This is very similar to the citywide averages for all graduates during this period: graduates earned an average of 52 total course credits, and 94 percent of graduates earned 44 or more credits. The occurrence of graduates who did not receive 44 or more total course credits—the minimum needed to graduate from a NYC high school—is likely due to a gap in data reporting.
30 This group does not include students who transferred out of the New York City school system.
31 This group does not include students who transferred out of the New York City School system and never returned.
32 Our analysis of impacts on non-mobile students includes statistical controls for middle school attendance and test scores, demographic characteristics, age at entry to high school, and English language learning and special education statuses. Nonetheless, there may be other unmeasured characteristics that account for subsequent differences in outcomes between the students who remained enrolled in the schools during the phaseout process and those that had enrolled prior to the closure decision. Because of these potential confounding factors, the findings discussed below should be interpreted cautiously. In other words, although we refer to the estimates as impact, they should be interpreted as “associations with the phaseout process” rather than valid impact estimates.
33 See Roeser et al. (2000) and Felner et al. (1981) for an overview of research on the transition to high schools.
34 Unterman, 2014; and Bloom and Unterman, 2013.
35 The propensity score matching process was conducted using a “nearest neighbor” criterion (i.e., students with a predicted probability of attending the closed school that are within 0.10 standard deviations of each other). The nearest neighbor criteria applied without replacement (i.e., one unique comparison student identified for each student from the closed school). The matching process prioritized nearest neighbor matching students in the following order: 1) attended a high school in the same building as the closed high school; 2) attended a middle school that previously sent students to the closed high school; 3) lived in the same zip code as a student who previously attended the

61
closed school; or 4) attended a middle school or high school in the same community school district or borough as the closed high school. In all, 45 percent of the matches were found among students who attended a high school in the same building as the closed school; 33 percent were found among students who attended a middle school that previously sent students to the closed high schools; 11 percent were found among students who lived in the same zip code as a student who previously attended the closed school; 6 percent were found among students who attended a middle school in the same community school district as the closed high school; and 4 percent were found among students who attended a high school in the same community school district as the closed high school.
36 Please note that our use of this term is distinct from other studies, where “displaced students” may refer to students who were displaced from a school they were already attending when it shut down between school years. In this report, “displaced students” are students who had to choose another high school when their most likely option closed.
37 See Kemple (2012). 38 These characteristics are weighted by
number of students from the respective post-closure cohorts who attended these schools. In other words, characteristics and outcomes for schools that enrolled a large number of students from the post-closure cohorts are given more weight than those for schools with only a few students from the post-closure cohorts.
39 On-time graduation rates for 2003 and 2011 reflect the percentages of students who entered 9th grade in 1999 and 2008, respectively, who went on to earn a diploma within four years. See Kemple (2013).
40 See Coca (2014).
41 See Bloom, Thompson and Unterman (2010); Bloom and Unterman (2012); and Unterman (2014).
42 Unterman (2014), p. 8. 43 See Stiefel, Schwartz, and Wiswall (2015). 44 See Kemple (2013). 45 See NYC Mayor’s Office (2015).
62 HIGH SCHOOL CLOSURES IN NYC
References Afifi, A., Clark, V.A., & May, S. (2004). Computer-Aided Multivariate Analysis. (4th Edition). Boca Raton, FL: Chapman & Hall/CRC. Balfanz, R., Bridgeland, J. M., Fox, J. H., DePaoli, J., Ingram, E., & Maushard, M. (2014). Building a Grad Nation: Progress and Challenge in Ending the High School Dropout Epidemic. Baltimore, MD: Civic Enterprises.
Balfanz, R., & Letgers, N. (2004). Locating the Dropout Crisis: Which High Schools Produce the Nation's Dropouts? Where Are They Located? Who Attends Them? Baltimore, MD: Center for Research on the Education of Students Placed at Risk.
Bloom, H. S., Thompson, S. L., & Unterman, R. (2010). Transforming the High School Experience: How New York City’s New Small Schools Are Boosting Student Achievement and Graduation Rates. New York, NY: MDRC.
Bloom, H. S., & Unterman, R. (2012). Sustained Positive Effects on Graduation Rates Produced by New York City's Small Public High Schools of Choice. New York, NY: MDRC.
Bloomberg, M. (2003). Major Address on Education. Address Presented at New York Urban League’s Dr. Martin Luther King, Jr. Symposium. New York, NY. Retrieved from http://www.nyc.gov/portal/site/nycgov/menuitem.b270a4a1d51bb3017bce0ed101c789a0/index.jsp?pageID=nyc_blue_room&catID=1194&doc_name=http%3A%2F%2Fwww.nyc.gov%2Fhtml%2Fom%2Fhtml%2F2003a%2Faddress_education.html&cc=unused1978&rc=1194&ndi=1;
Brummet, Q. (2014). “The Effect of School Closings on Student Achievement.” Journal of Public Economics, 119, 108-124.
Carlson, D., & Lavertu, S. (2015). School Closures and Student Achievement: An Analysis of Ohio’s Urban District and Charter Schools. Columbus, OH: Thomas B. Fordham Institute.
Coca, V. (2014). New York City Goes to College: A First Look. New York, NY: The Research
Alliance for New York City Schools. http://steinhardt.nyu.edu/research_alliance/publications/nyc_goes_to_college_first_look
de la Torre, M., & Gwynne, J. (2009). When Schools Close: Effects on Displaced Students in Chicago Public Schools. Chicago, IL: Consortium on Chicago School Research.
Engberg, J., Gill, B., Zamarro, G., & Zimmer, R. (2012). “Closing Schools in a Shrinking District: Do Student Outcomes Depend on Which Schools are Closed?” Journal of Urban Economics, 71(2), 189-203.
Felner, R., Primavera, J., & Cauce, A. (1981). “The Impact of School Transitions: A Focus for Prevention Efforts.” American Journal of Community Psychology. 9(4), 449-459. Kemple, J. J. (2013). The Condition of New York City High Schools: Examining Trends and Looking Toward the Future. New York, NY: The Research Alliance for New York City Schools. http://steinhardt.nyu.edu/research_alliance/publications/condition_of_nyc_hs
Kemple, J. J., Segeritz, M. D., & Stephenson, N. (2013). “Building On-Track Indicators for High School Graduation and College Readiness: Evidence from New York City.” Journal of Education for Students Placed at Risk (JESPAR), 18(1), 7-28.
Nathanson, Lori, Sean Corcoran (IESP), and E. Christine Baker-Smith (2013). “High School Choice in New York City: A Report on the School Choices and Placements of Low-Achieving Students.” New York, NY: The Research Alliance for New York City Schools. http://steinhardt.nyu.edu/research_alliance/publications/hs_choice_low_achieving_students
New York City Mayor’s Office (2015). “Equity and Excellence: Mayor de Blasio Announces Reforms to Raise Achievement Across All Public Schools.” Retrieved from: http://www1.nyc.gov/office-of-the-mayor/news/618-15/equity-excellence-

63
mayor-de-blasio-reforms-raise-achievement-across-all-public
O'Day, J. A., Bitter, C. S., & Gomez, L. M. (2011). Education Reform in New York City: Ambitious Change in the Nation's Most Complex School System. Cambridge, MA: Harvard Education Press.
Powell, M. (2012). “In Schools Cut by the City Ax, Students Bleed.” The New York Times. Retrieved from: http://www.nytimes.com/2012/04/17/nyregion/in-schools-cut-by-new-york-citys-ax-students-bleed.html
Roeser, R.W., Eccles, J.S., & Sameroff, A.J. (2000). “School as a Context of Early Adolescents' Academic and Social-Emotional Development: A Summary of Research Findings.” The Elementary School Journal, 100(5), 443-471. Sunderman, G. L., & Payne, A. (2009). Does Closing Schools Cause Educational Harm? A Review of the Research. Information Brief. Arlington, VA: Mid-Atlantic Equity Center.
Stiefel, L., Schwartz, A. E., & Wiswall, M. (2015). “Does Small High School Reform Lift Urban Districts? Evidence from New York City.” Educational Researcher, 44(3), 161-172.
Unterman, R. (2014). Headed to College: The Effects of New York City's Small High Schools of Choice on Postsecondary Enrollment. New York, NY: MDRC.
U.S. Department of Education. (2002). “No Child Left Behind Act of 2001.” Retrieved from: http://www2.ed.gov/policy/elsec/leg/esea02/index.html
U.S. Department of Education. (2009). “Applications Now Available for $3.5 Billion in Title I School Improvement Grants to Turn Around Nation’s Lowest Achieving Public Schools.” Retrieved from http://www2.ed.gov/news/pressreleases/2009/12/12032009a.html
U.S. Department of Education. (2014). “The Elementary and Secondary Education Act (ESEA).” Retrieved from: http://www.ed.gov/blog/topic/esea-reauthorization/

The Research Alliance for
New York City Schools conducts
rigorous studies on topics that
matter to the city’s public schools.
We strive to advance equity and
excellence in education by
providing nonpartisan evidence
about policies and practices that
promote students’ development
and academic success.
285 Mercer Street, 3rd Floor | New York, New York 10003-9502
212 992 7697 | 212 995 4910 fax
[email protected] | www.steinhardt.nyu.edu/research_alliance