high school proficiency assessment spring 2014 … jersey high school proficiency assessment ......
TRANSCRIPT

New Jersey High School Proficiency Assessment Performance By Demographic Group
(Produced for First-time 11 Graders Only)
Statewide
CYCLE IIREPORT PRINTED: 7/18/2014TEST DATE: MARCH 2014
th
MATHEMATICSPerformance Data for Students with Valid Scale Scores
Enrolled VoidsNot PresentAPA
StudentsValid Scale
Scores% PartiallyProficient
%Proficient
% AdvancedProficient
Scale ScoreMean
Demographic Group2
1
Total Students 98,240 21.1 49.7663 96,9441295043 29.2 226.1 General Education 81,195 13.0 53.0340 80,771840 4 34.0 232.8 Special Education 14,918 60.7 34.2298 14,07442504 5.1 193.2 Not Exempt From Passing 10,201 51.9 41.1178 9,992310 6.9 199.3 Exempt From Passing 4,213 82.3 17.1120 4,082110 0.7 178.2 Exempt From Taking (APA) 504 -- ---- ----504 5 -- -- Limited English Proficient 2,782 61.1 32.233 2,73937 6 6.6 194.0 Current LEP 2,202 66.7 28.129 2,16832 5.1 190.2 Former LEP 580 39.8 47.84 57105 12.4 208.1Gender 7
Female 48,433 21.3 52.3291 47,89466182 26.4 224.9 Male 49,742 20.9 47.2371 48,98963319 31.9 227.3Migrant Status
Migrant 27 44.4 48.10 2700 7.4 205.6 Non-Migrant 98,213 21.1 49.7663 96,917129504 29.2 226.1Ethnicity White 53,302 12.1 51.7258 52,72478242 36.2 234.0 Black or African American 15,147 44.3 47.8207 14,8332384 7.9 204.2 Asian 9,074 6.7 32.918 9,010640 60.3 247.2 Native Hawaiian or Other Pacific Islander 160 19.0 49.41 15810 31.6 229.7 Hispanic or Latino 19,516 34.1 53.8162 19,21217125 8 12.2 211.7 American Indian or Alaska Native 204 26.9 55.23 20100 17.9 218.4 Other 837 28.0 47.914 806413 24.1 220.29
Economic Status
Economically Disadvantaged 30,027 37.4 51.5332 29,47442179 11.0 209.3 Non-Economically Disadvantaged 68,213 13.9 49.0331 67,47087325 37.1 233.4
Includes students coded Medical Emergency.Percentages may not total 100 due to rounding.Students are included in Total Students only once, but they appear in all other categories that apply. Includes students coded Former LEP who are not Special Education.Students coded IEP Exempt From Taking the HSPA are required to take the Alternate Proficiency Assessment (APA).Includes students coded Current and Former LEP.Excludes students who did not have Gender coded. Includes students coded Hispanic and/or Hispanic with other ethnic affiliations. Students who did not have Ethnicity coded and students with multiple non-Hispanic Ethnicities coded. Page 1 of 1
23
4
56
78
9
1

New Jersey High School Proficiency Assessment Performance By Demographic Group
(Produced for First-time 11 Graders Only)
Statewide
CYCLE IIREPORT PRINTED: 7/18/2014TEST DATE: MARCH 2014
th
LANGUAGE ARTS LITERACYPerformance Data for Students with Valid Scale Scores
Enrolled VoidsNot PresentAPA
StudentsValid Scale
Scores% PartiallyProficient
%Proficient
% AdvancedProficient
Scale ScoreMean
Demographic Group2
1
Total Students 98,240 6.7 60.4507 97,0911484943 32.8 236.8 General Education 81,195 1.8 59.9275 80,843770 4 38.3 242.0 Special Education 14,918 28.0 65.5214 14,14466494 6.5 212.8 Not Exempt From Passing 10,466 19.9 71.4132 10,286480 8.6 218.8 Exempt From Passing 3,958 49.5 49.782 3,858180 0.9 196.9 Exempt From Taking (APA) 494 -- ---- ----494 5 -- -- Limited English Proficient 2,782 45.8 53.023 2,74757 6 1.3 200.2 Current LEP 2,202 54.6 45.020 2,17552 0.4 194.8 Former LEP 580 12.2 83.23 57205 4.5 220.5Gender 7
Female 48,433 4.5 58.1218 47,98161173 37.4 239.8 Male 49,742 8.9 62.7289 49,04986318 28.3 233.8Migrant Status
Migrant 27 25.9 59.30 2700 14.8 217.4 Non-Migrant 98,213 6.7 60.4507 97,064148494 32.8 236.8Ethnicity White 53,302 3.3 55.3204 52,79074234 41.5 242.3 Black or African American 15,147 14.2 73.2159 14,8663785 12.6 224.2 Asian 9,074 2.9 43.013 9,020140 54.0 246.7 Native Hawaiian or Other Pacific Islander 160 5.1 61.41 15810 33.5 239.3 Hispanic or Latino 19,516 12.2 72.8118 19,24729122 8 15.1 226.7 American Indian or Alaska Native 204 7.5 73.12 20101 19.4 231.8 Other 837 11.0 61.310 809612 27.7 232.49
Economic Status
Economically Disadvantaged 30,027 13.6 73.8240 29,56056171 12.6 224.7 Non-Economically Disadvantaged 68,213 3.8 54.6267 67,53192323 41.7 242.0
Includes students coded Medical Emergency.Percentages may not total 100 due to rounding.Students are included in Total Students only once, but they appear in all other categories that apply. Includes students coded Former LEP who are not Special Education.Students coded IEP Exempt From Taking the HSPA are required to take the Alternate Proficiency Assessment (APA).Includes students coded Current and Former LEP.Excludes students who did not have Gender coded. Includes students coded Hispanic and/or Hispanic with other ethnic affiliations. Students who did not have Ethnicity coded and students with multiple non-Hispanic Ethnicities coded. Page 1 of 1
23
4
56
78
9
1

New Jersey High School Proficiency Assessment Performance By Demographic Group
(Produced for First-time 11 Graders Only)
DFG A
CYCLE IIREPORT PRINTED: 7/18/2014TEST DATE: MARCH 2014
th
MATHEMATICSPerformance Data for Students with Valid Scale Scores
Enrolled VoidsNot PresentAPA
StudentsValid Scale
Scores% PartiallyProficient
%Proficient
% AdvancedProficient
Scale ScoreMean
Demographic Group2
1
Total Students 11,988 47.2 44.3210 11,70016623 8.6 202.9 General Education 8,890 35.7 53.394 8,78790 4 11.0 210.8 Special Education 2,189 85.2 13.9102 2,019662 0.9 175.9 Not Exempt From Passing 1,103 81.5 17.143 1,05640 1.3 178.9 Exempt From Passing 1,024 89.2 10.459 96320 0.4 172.6 Exempt From Taking (APA) 62 -- ---- ----62 5 -- -- Limited English Proficient 1,168 69.8 27.620 1,14710 6 2.6 187.5 Current LEP 941 74.5 23.418 92210 2.1 184.6 Former LEP 227 50.7 44.42 22500 4.9 199.5Gender 7
Female 5,902 48.4 44.691 5,777925 7.0 201.9 Male 6,076 45.9 43.9119 5,916734 10.1 203.8Migrant Status
Migrant 9 * ** *** * * Non-Migrant 11,979 47.1 44.3210 11,6911662 8.6 202.9Ethnicity White 1,298 22.5 55.717 1,27155 21.8 222.0 Black or African American 4,361 59.4 36.5112 4,226617 4.0 194.1 Asian 279 32.0 46.80 27801 21.2 216.1 Native Hawaiian or Other Pacific Islander 8 * ** *** * * Hispanic or Latino 5,977 44.3 47.374 5,861438 8 8.4 204.4 American Indian or Alaska Native 12 33.3 50.00 1200 16.7 205.8 Other 53 62.2 33.36 4511 4.4 192.39
Economic Status
Economically Disadvantaged 9,178 49.3 43.3158 8,979536 7.5 201.3 Non-Economically Disadvantaged 2,810 40.2 47.652 2,7211126 12.2 207.8
Includes students coded Medical Emergency.Percentages may not total 100 due to rounding.Students are included in Total Students only once, but they appear in all other categories that apply. Includes students coded Former LEP who are not Special Education.Students coded IEP Exempt From Taking the HSPA are required to take the Alternate Proficiency Assessment (APA).Includes students coded Current and Former LEP.Excludes students who did not have Gender coded. Includes students coded Hispanic and/or Hispanic with other ethnic affiliations. Students who did not have Ethnicity coded and students with multiple non-Hispanic Ethnicities coded. Page 1 of 1
23
4
56
78
9
1
New Jersey High School Proficiency Assessment Performance By Demographic Group
(Produced for First-time 11 Graders Only)
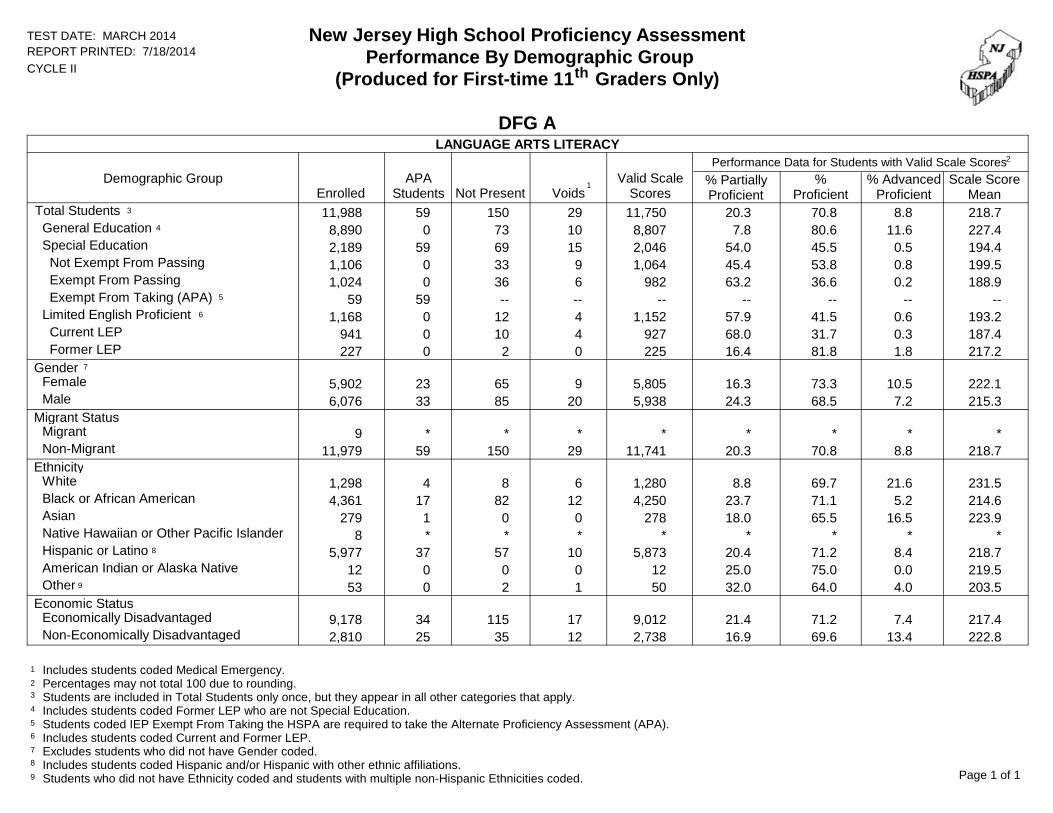
DFG A
CYCLE IIREPORT PRINTED: 7/18/2014TEST DATE: MARCH 2014
th
LANGUAGE ARTS LITERACYPerformance Data for Students with Valid Scale Scores
Enrolled VoidsNot PresentAPA
StudentsValid Scale
Scores% PartiallyProficient
%Proficient
% AdvancedProficient
Scale ScoreMean
Demographic Group2
1
Total Students 11,988 20.3 70.8150 11,75029593 8.8 218.7 General Education 8,890 7.8 80.673 8,807100 4 11.6 227.4 Special Education 2,189 54.0 45.569 2,0461559 0.5 194.4 Not Exempt From Passing 1,106 45.4 53.833 1,06490 0.8 199.5 Exempt From Passing 1,024 63.2 36.636 98260 0.2 188.9 Exempt From Taking (APA) 59 -- ---- ----59 5 -- -- Limited English Proficient 1,168 57.9 41.512 1,15240 6 0.6 193.2 Current LEP 941 68.0 31.710 92740 0.3 187.4 Former LEP 227 16.4 81.82 22500 1.8 217.2Gender 7
Female 5,902 16.3 73.365 5,805923 10.5 222.1 Male 6,076 24.3 68.585 5,9382033 7.2 215.3Migrant Status
Migrant 9 * ** *** * * Non-Migrant 11,979 20.3 70.8150 11,7412959 8.8 218.7Ethnicity White 1,298 8.8 69.78 1,28064 21.6 231.5 Black or African American 4,361 23.7 71.182 4,2501217 5.2 214.6 Asian 279 18.0 65.50 27801 16.5 223.9 Native Hawaiian or Other Pacific Islander 8 * ** *** * * Hispanic or Latino 5,977 20.4 71.257 5,8731037 8 8.4 218.7 American Indian or Alaska Native 12 25.0 75.00 1200 0.0 219.5 Other 53 32.0 64.02 5010 4.0 203.59
Economic Status
Economically Disadvantaged 9,178 21.4 71.2115 9,0121734 7.4 217.4 Non-Economically Disadvantaged 2,810 16.9 69.635 2,7381225 13.4 222.8
Includes students coded Medical Emergency.Percentages may not total 100 due to rounding.Students are included in Total Students only once, but they appear in all other categories that apply. Includes students coded Former LEP who are not Special Education.Students coded IEP Exempt From Taking the HSPA are required to take the Alternate Proficiency Assessment (APA).Includes students coded Current and Former LEP.Excludes students who did not have Gender coded. Includes students coded Hispanic and/or Hispanic with other ethnic affiliations. Students who did not have Ethnicity coded and students with multiple non-Hispanic Ethnicities coded. Page 1 of 1
23
4
56
78
9
1

New Jersey High School Proficiency Assessment Performance By Demographic Group
(Produced for First-time 11 Graders Only)
DFG B
CYCLE IIREPORT PRINTED: 7/18/2014TEST DATE: MARCH 2014
th
MATHEMATICSPerformance Data for Students with Valid Scale Scores
Enrolled VoidsNot PresentAPA
StudentsValid Scale
Scores% PartiallyProficient
%Proficient
% AdvancedProficient
Scale ScoreMean
Demographic Group2
1
Total Students 8,456 31.5 54.151 8,33211623 14.4 214.2 General Education 6,739 21.0 61.628 6,70560 4 17.4 221.5 Special Education 1,360 77.3 21.619 1,275462 1.2 182.9 Not Exempt From Passing 738 69.9 28.311 72520 1.8 188.5 Exempt From Passing 560 86.9 12.78 55020 0.4 175.5 Exempt From Taking (APA) 62 -- ---- ----62 5 -- -- Limited English Proficient 443 60.8 34.64 43612 6 4.6 193.3 Current LEP 365 66.7 29.74 36010 3.6 189.2 Former LEP 78 32.9 57.90 7602 9.2 212.4Gender 7
Female 4,176 32.2 55.723 4,117828 12.1 213.0 Male 4,275 30.8 52.628 4,210334 16.6 215.5Migrant Status
Migrant 7 * ** *** * * Non-Migrant 8,449 31.5 54.151 8,3251162 14.4 214.3Ethnicity White 3,340 22.5 57.618 3,302416 19.9 221.6 Black or African American 1,676 48.4 45.015 1,640417 6.6 201.5 Asian 497 16.4 49.51 49303 34.1 231.5 Native Hawaiian or Other Pacific Islander 15 33.3 33.30 1500 33.3 223.5 Hispanic or Latino 2,844 34.6 56.616 2,800325 8 8.8 210.1 American Indian or Alaska Native 14 28.6 42.90 1400 28.6 224.0 Other 70 44.1 44.11 6801 11.8 204.79
Economic Status
Economically Disadvantaged 4,392 37.3 52.937 4,303745 9.7 208.8 Non-Economically Disadvantaged 4,064 25.3 55.414 4,029417 19.3 220.0
Includes students coded Medical Emergency.Percentages may not total 100 due to rounding.Students are included in Total Students only once, but they appear in all other categories that apply. Includes students coded Former LEP who are not Special Education.Students coded IEP Exempt From Taking the HSPA are required to take the Alternate Proficiency Assessment (APA).Includes students coded Current and Former LEP.Excludes students who did not have Gender coded. Includes students coded Hispanic and/or Hispanic with other ethnic affiliations. Students who did not have Ethnicity coded and students with multiple non-Hispanic Ethnicities coded. Page 1 of 1
23
4
56
78
9
1

New Jersey High School Proficiency Assessment Performance By Demographic Group
(Produced for First-time 11 Graders Only)
DFG B
CYCLE IIREPORT PRINTED: 7/18/2014TEST DATE: MARCH 2014
th
LANGUAGE ARTS LITERACYPerformance Data for Students with Valid Scale Scores
Enrolled VoidsNot PresentAPA
StudentsValid Scale
Scores% PartiallyProficient
%Proficient
% AdvancedProficient
Scale ScoreMean
Demographic Group2
1
Total Students 8,456 10.4 72.935 8,34614613 16.7 228.5 General Education 6,739 2.3 77.224 6,70780 4 20.5 235.0 Special Education 1,360 41.5 56.87 1,286661 1.7 202.9 Not Exempt From Passing 750 33.1 64.44 74150 2.6 208.5 Exempt From Passing 549 53.0 46.43 54510 0.6 195.2 Exempt From Taking (APA) 61 -- ---- ----61 5 -- -- Limited English Proficient 443 42.8 56.84 43702 6 0.5 201.9 Current LEP 365 51.0 48.84 36100 0.3 197.3 Former LEP 78 3.9 94.70 7602 1.3 224.0Gender 7
Female 4,176 6.7 73.418 4,125726 20.0 232.1 Male 4,275 13.9 72.417 4,216735 13.6 225.0Migrant Status
Migrant 7 * ** *** * * Non-Migrant 8,449 10.3 72.935 8,3391461 16.8 228.5Ethnicity White 3,340 7.3 69.212 3,306616 23.5 233.5 Black or African American 1,676 16.1 74.712 1,642517 9.2 221.2 Asian 497 6.7 63.60 49403 29.8 235.1 Native Hawaiian or Other Pacific Islander 15 0.0 66.70 1500 33.3 233.7 Hispanic or Latino 2,844 11.1 78.110 2,807324 8 10.8 225.8 American Indian or Alaska Native 14 14.3 64.30 1400 21.4 230.4 Other 70 19.1 66.21 6801 14.7 224.49
Economic Status
Economically Disadvantaged 4,392 13.4 75.823 4,318843 10.8 224.1 Non-Economically Disadvantaged 4,064 7.1 69.712 4,028618 23.1 233.3
Includes students coded Medical Emergency.Percentages may not total 100 due to rounding.Students are included in Total Students only once, but they appear in all other categories that apply. Includes students coded Former LEP who are not Special Education.Students coded IEP Exempt From Taking the HSPA are required to take the Alternate Proficiency Assessment (APA).Includes students coded Current and Former LEP.Excludes students who did not have Gender coded. Includes students coded Hispanic and/or Hispanic with other ethnic affiliations. Students who did not have Ethnicity coded and students with multiple non-Hispanic Ethnicities coded. Page 1 of 1
23
4
56
78
9
1
New Jersey High School Proficiency Assessment Performance By Demographic Group
(Produced for First-time 11 Graders Only)
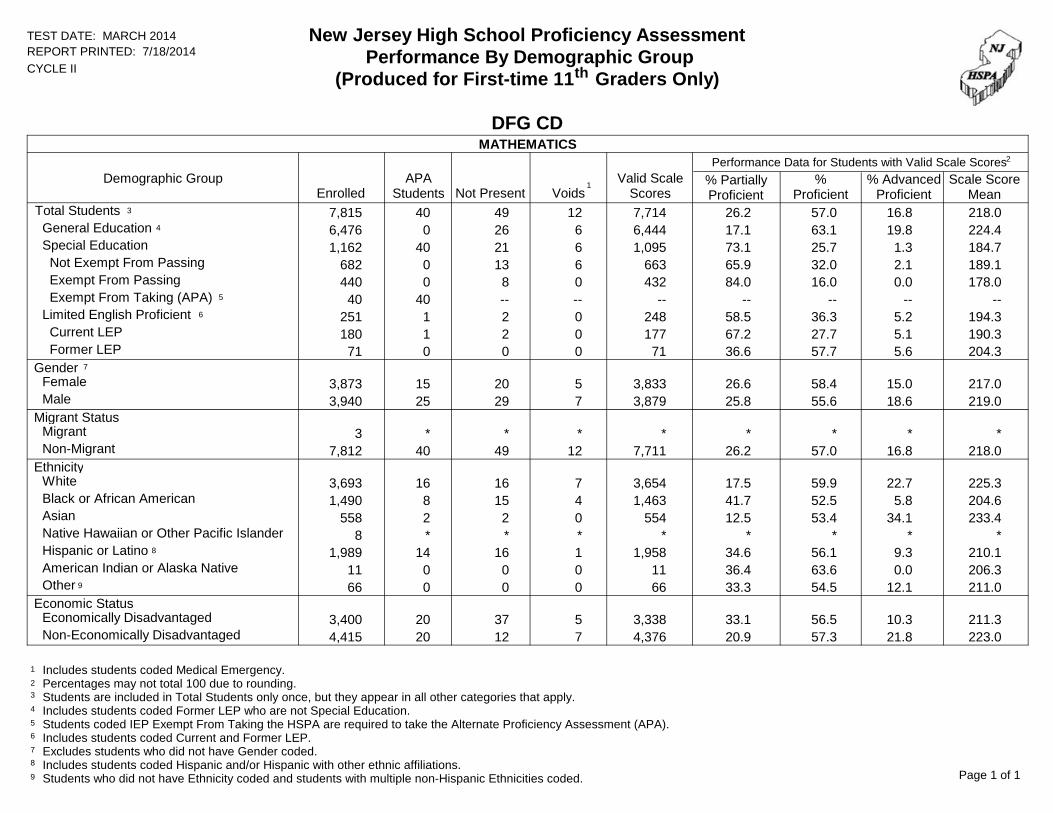
DFG CD
CYCLE IIREPORT PRINTED: 7/18/2014TEST DATE: MARCH 2014
th
MATHEMATICSPerformance Data for Students with Valid Scale Scores
Enrolled VoidsNot PresentAPA
StudentsValid Scale
Scores% PartiallyProficient
%Proficient
% AdvancedProficient
Scale ScoreMean
Demographic Group2
1
Total Students 7,815 26.2 57.049 7,71412403 16.8 218.0 General Education 6,476 17.1 63.126 6,44460 4 19.8 224.4 Special Education 1,162 73.1 25.721 1,095640 1.3 184.7 Not Exempt From Passing 682 65.9 32.013 66360 2.1 189.1 Exempt From Passing 440 84.0 16.08 43200 0.0 178.0 Exempt From Taking (APA) 40 -- ---- ----40 5 -- -- Limited English Proficient 251 58.5 36.32 24801 6 5.2 194.3 Current LEP 180 67.2 27.72 17701 5.1 190.3 Former LEP 71 36.6 57.70 7100 5.6 204.3Gender 7
Female 3,873 26.6 58.420 3,833515 15.0 217.0 Male 3,940 25.8 55.629 3,879725 18.6 219.0Migrant Status
Migrant 3 * ** *** * * Non-Migrant 7,812 26.2 57.049 7,7111240 16.8 218.0Ethnicity White 3,693 17.5 59.916 3,654716 22.7 225.3 Black or African American 1,490 41.7 52.515 1,46348 5.8 204.6 Asian 558 12.5 53.42 55402 34.1 233.4 Native Hawaiian or Other Pacific Islander 8 * ** *** * * Hispanic or Latino 1,989 34.6 56.116 1,958114 8 9.3 210.1 American Indian or Alaska Native 11 36.4 63.60 1100 0.0 206.3 Other 66 33.3 54.50 6600 12.1 211.09
Economic Status
Economically Disadvantaged 3,400 33.1 56.537 3,338520 10.3 211.3 Non-Economically Disadvantaged 4,415 20.9 57.312 4,376720 21.8 223.0
Includes students coded Medical Emergency.Percentages may not total 100 due to rounding.Students are included in Total Students only once, but they appear in all other categories that apply. Includes students coded Former LEP who are not Special Education.Students coded IEP Exempt From Taking the HSPA are required to take the Alternate Proficiency Assessment (APA).Includes students coded Current and Former LEP.Excludes students who did not have Gender coded. Includes students coded Hispanic and/or Hispanic with other ethnic affiliations. Students who did not have Ethnicity coded and students with multiple non-Hispanic Ethnicities coded. Page 1 of 1
23
4
56
78
9
1
New Jersey High School Proficiency Assessment Performance By Demographic Group
(Produced for First-time 11 Graders Only)
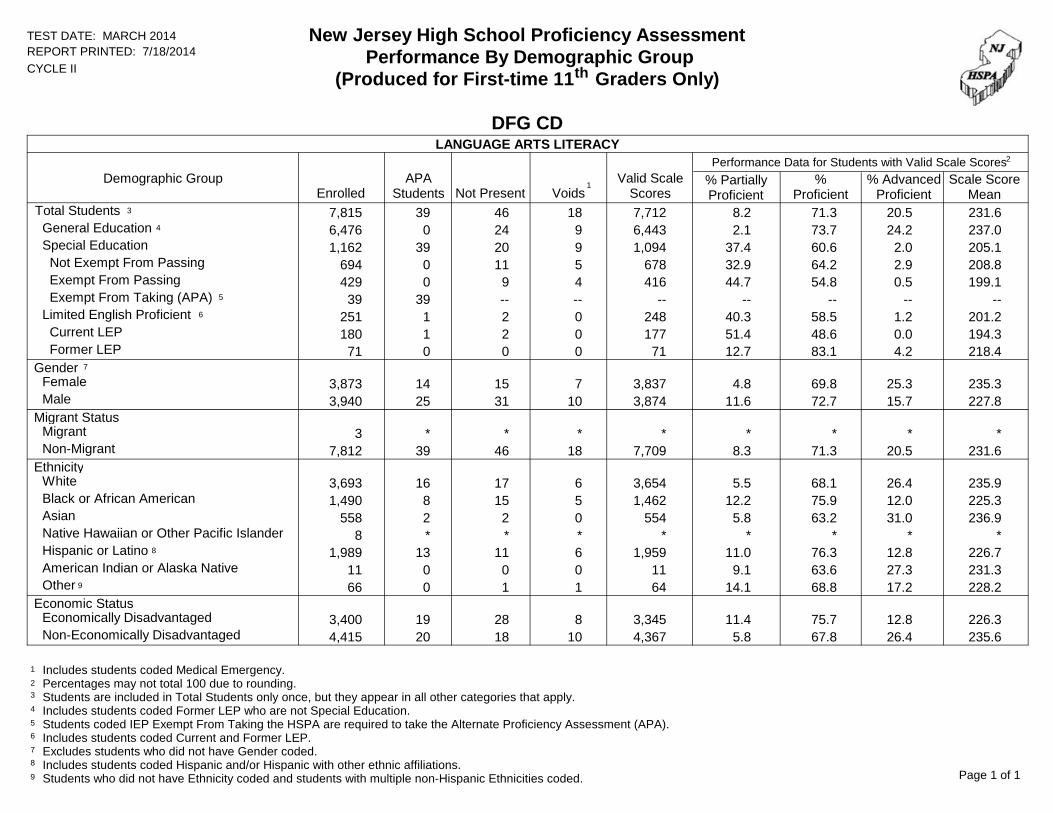
DFG CD
CYCLE IIREPORT PRINTED: 7/18/2014TEST DATE: MARCH 2014
th
LANGUAGE ARTS LITERACYPerformance Data for Students with Valid Scale Scores
Enrolled VoidsNot PresentAPA
StudentsValid Scale
Scores% PartiallyProficient
%Proficient
% AdvancedProficient
Scale ScoreMean
Demographic Group2
1
Total Students 7,815 8.2 71.346 7,71218393 20.5 231.6 General Education 6,476 2.1 73.724 6,44390 4 24.2 237.0 Special Education 1,162 37.4 60.620 1,094939 2.0 205.1 Not Exempt From Passing 694 32.9 64.211 67850 2.9 208.8 Exempt From Passing 429 44.7 54.89 41640 0.5 199.1 Exempt From Taking (APA) 39 -- ---- ----39 5 -- -- Limited English Proficient 251 40.3 58.52 24801 6 1.2 201.2 Current LEP 180 51.4 48.62 17701 0.0 194.3 Former LEP 71 12.7 83.10 7100 4.2 218.4Gender 7
Female 3,873 4.8 69.815 3,837714 25.3 235.3 Male 3,940 11.6 72.731 3,8741025 15.7 227.8Migrant Status
Migrant 3 * ** *** * * Non-Migrant 7,812 8.3 71.346 7,7091839 20.5 231.6Ethnicity White 3,693 5.5 68.117 3,654616 26.4 235.9 Black or African American 1,490 12.2 75.915 1,46258 12.0 225.3 Asian 558 5.8 63.22 55402 31.0 236.9 Native Hawaiian or Other Pacific Islander 8 * ** *** * * Hispanic or Latino 1,989 11.0 76.311 1,959613 8 12.8 226.7 American Indian or Alaska Native 11 9.1 63.60 1100 27.3 231.3 Other 66 14.1 68.81 6410 17.2 228.29
Economic Status
Economically Disadvantaged 3,400 11.4 75.728 3,345819 12.8 226.3 Non-Economically Disadvantaged 4,415 5.8 67.818 4,3671020 26.4 235.6
Includes students coded Medical Emergency.Percentages may not total 100 due to rounding.Students are included in Total Students only once, but they appear in all other categories that apply. Includes students coded Former LEP who are not Special Education.Students coded IEP Exempt From Taking the HSPA are required to take the Alternate Proficiency Assessment (APA).Includes students coded Current and Former LEP.Excludes students who did not have Gender coded. Includes students coded Hispanic and/or Hispanic with other ethnic affiliations. Students who did not have Ethnicity coded and students with multiple non-Hispanic Ethnicities coded. Page 1 of 1
23
4
56
78
9
1
New Jersey High School Proficiency Assessment Performance By Demographic Group
(Produced for First-time 11 Graders Only)
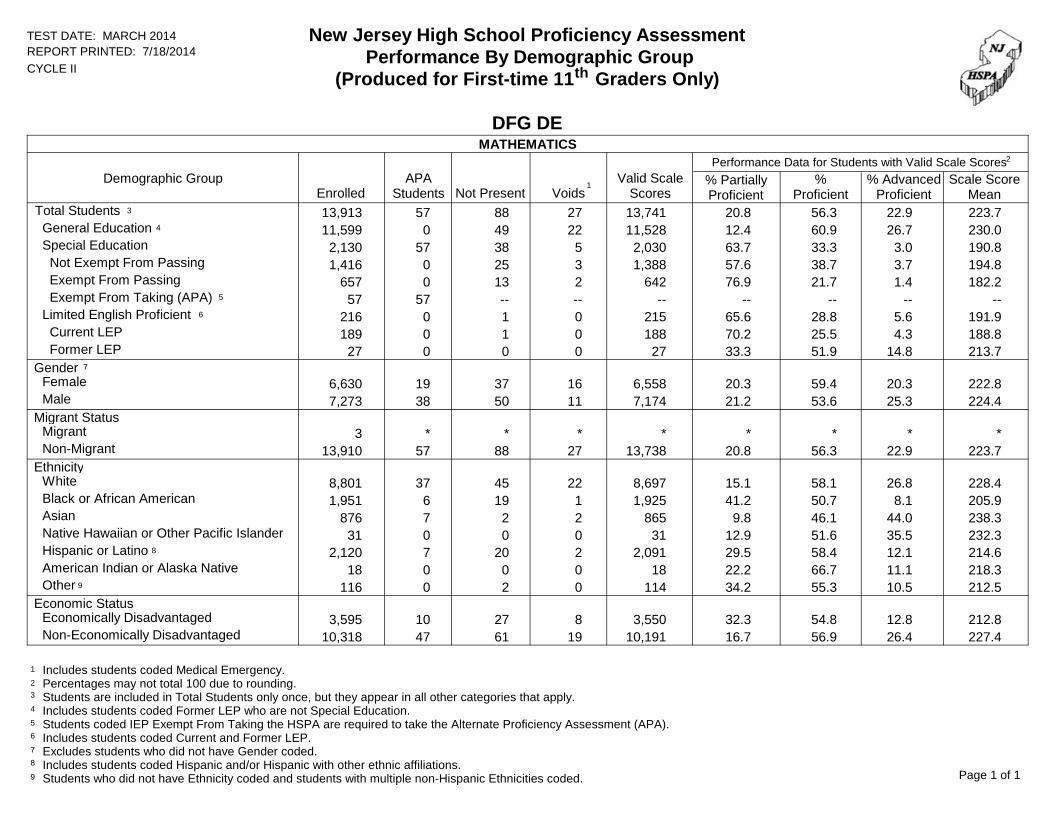
DFG DE
CYCLE IIREPORT PRINTED: 7/18/2014TEST DATE: MARCH 2014
th
MATHEMATICSPerformance Data for Students with Valid Scale Scores
Enrolled VoidsNot PresentAPA
StudentsValid Scale
Scores% PartiallyProficient
%Proficient
% AdvancedProficient
Scale ScoreMean
Demographic Group2
1
Total Students 13,913 20.8 56.388 13,74127573 22.9 223.7 General Education 11,599 12.4 60.949 11,528220 4 26.7 230.0 Special Education 2,130 63.7 33.338 2,030557 3.0 190.8 Not Exempt From Passing 1,416 57.6 38.725 1,38830 3.7 194.8 Exempt From Passing 657 76.9 21.713 64220 1.4 182.2 Exempt From Taking (APA) 57 -- ---- ----57 5 -- -- Limited English Proficient 216 65.6 28.81 21500 6 5.6 191.9 Current LEP 189 70.2 25.51 18800 4.3 188.8 Former LEP 27 33.3 51.90 2700 14.8 213.7Gender 7
Female 6,630 20.3 59.437 6,5581619 20.3 222.8 Male 7,273 21.2 53.650 7,1741138 25.3 224.4Migrant Status
Migrant 3 * ** *** * * Non-Migrant 13,910 20.8 56.388 13,7382757 22.9 223.7Ethnicity White 8,801 15.1 58.145 8,6972237 26.8 228.4 Black or African American 1,951 41.2 50.719 1,92516 8.1 205.9 Asian 876 9.8 46.12 86527 44.0 238.3 Native Hawaiian or Other Pacific Islander 31 12.9 51.60 3100 35.5 232.3 Hispanic or Latino 2,120 29.5 58.420 2,09127 8 12.1 214.6 American Indian or Alaska Native 18 22.2 66.70 1800 11.1 218.3 Other 116 34.2 55.32 11400 10.5 212.59
Economic Status
Economically Disadvantaged 3,595 32.3 54.827 3,550810 12.8 212.8 Non-Economically Disadvantaged 10,318 16.7 56.961 10,1911947 26.4 227.4
Includes students coded Medical Emergency.Percentages may not total 100 due to rounding.Students are included in Total Students only once, but they appear in all other categories that apply. Includes students coded Former LEP who are not Special Education.Students coded IEP Exempt From Taking the HSPA are required to take the Alternate Proficiency Assessment (APA).Includes students coded Current and Former LEP.Excludes students who did not have Gender coded. Includes students coded Hispanic and/or Hispanic with other ethnic affiliations. Students who did not have Ethnicity coded and students with multiple non-Hispanic Ethnicities coded. Page 1 of 1
23
4
56
78
9
1
New Jersey High School Proficiency Assessment Performance By Demographic Group
(Produced for First-time 11 Graders Only)
DFG DE
CYCLE IIREPORT PRINTED: 7/18/2014TEST DATE: MARCH 2014
th
LANGUAGE ARTS LITERACYPerformance Data for Students with Valid Scale Scores
Enrolled VoidsNot PresentAPA
StudentsValid Scale
Scores% PartiallyProficient
%Proficient
% AdvancedProficient
Scale ScoreMean
Demographic Group2
1
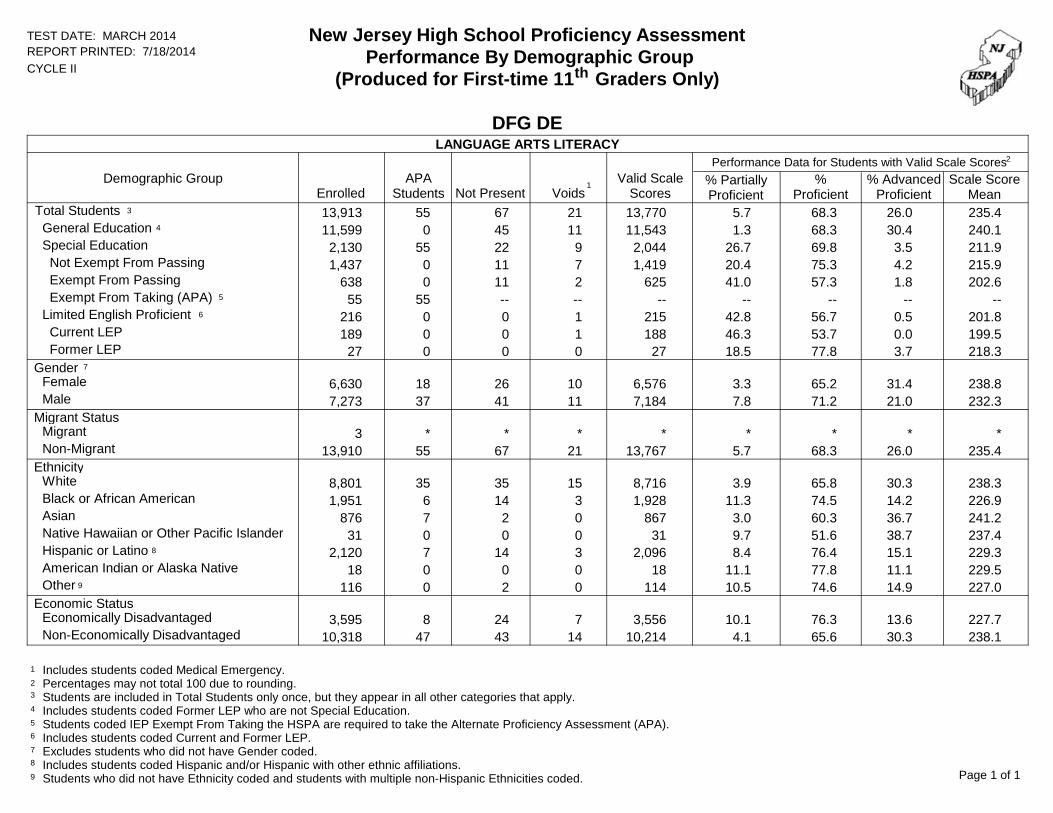
Total Students 13,913 5.7 68.367 13,77021553 26.0 235.4 General Education 11,599 1.3 68.345 11,543110 4 30.4 240.1 Special Education 2,130 26.7 69.822 2,044955 3.5 211.9 Not Exempt From Passing 1,437 20.4 75.311 1,41970 4.2 215.9 Exempt From Passing 638 41.0 57.311 62520 1.8 202.6 Exempt From Taking (APA) 55 -- ---- ----55 5 -- -- Limited English Proficient 216 42.8 56.70 21510 6 0.5 201.8 Current LEP 189 46.3 53.70 18810 0.0 199.5 Former LEP 27 18.5 77.80 2700 3.7 218.3Gender 7
Female 6,630 3.3 65.226 6,5761018 31.4 238.8 Male 7,273 7.8 71.241 7,1841137 21.0 232.3Migrant Status
Migrant 3 * ** *** * * Non-Migrant 13,910 5.7 68.367 13,7672155 26.0 235.4Ethnicity White 8,801 3.9 65.835 8,7161535 30.3 238.3 Black or African American 1,951 11.3 74.514 1,92836 14.2 226.9 Asian 876 3.0 60.32 86707 36.7 241.2 Native Hawaiian or Other Pacific Islander 31 9.7 51.60 3100 38.7 237.4 Hispanic or Latino 2,120 8.4 76.414 2,09637 8 15.1 229.3 American Indian or Alaska Native 18 11.1 77.80 1800 11.1 229.5 Other 116 10.5 74.62 11400 14.9 227.09
Economic Status
Economically Disadvantaged 3,595 10.1 76.324 3,55678 13.6 227.7 Non-Economically Disadvantaged 10,318 4.1 65.643 10,2141447 30.3 238.1
Includes students coded Medical Emergency.Percentages may not total 100 due to rounding.Students are included in Total Students only once, but they appear in all other categories that apply. Includes students coded Former LEP who are not Special Education.Students coded IEP Exempt From Taking the HSPA are required to take the Alternate Proficiency Assessment (APA).Includes students coded Current and Former LEP.Excludes students who did not have Gender coded. Includes students coded Hispanic and/or Hispanic with other ethnic affiliations. Students who did not have Ethnicity coded and students with multiple non-Hispanic Ethnicities coded. Page 1 of 1
23
4
56
78
9
1

New Jersey High School Proficiency Assessment Performance By Demographic Group
(Produced for First-time 11 Graders Only)
DFG FG
CYCLE IIREPORT PRINTED: 7/18/2014TEST DATE: MARCH 2014
th
MATHEMATICSPerformance Data for Students with Valid Scale Scores
Enrolled VoidsNot PresentAPA
StudentsValid Scale
Scores% PartiallyProficient
%Proficient
% AdvancedProficient
Scale ScoreMean
Demographic Group2
1
Total Students 11,269 17.8 55.657 11,14519483 26.6 226.9 General Education 9,472 9.7 59.431 9,426150 4 30.9 233.3 Special Education 1,663 63.1 34.126 1,586348 2.8 191.2 Not Exempt From Passing 1,108 54.9 40.915 1,09210 4.1 196.6 Exempt From Passing 507 81.0 19.011 49420 0.0 179.0 Exempt From Taking (APA) 48 -- ---- ----48 5 -- -- Limited English Proficient 177 50.0 40.90 17610 6 9.1 200.0 Current LEP 139 56.5 38.40 13810 5.1 196.1 Former LEP 38 26.3 50.00 3800 23.7 214.2Gender 7
Female 5,554 17.0 59.327 5,5021015 23.7 226.3 Male 5,714 18.6 52.030 5,642933 29.4 227.5Migrant Status
Migrant 1 * ** *** * * Non-Migrant 11,268 * ** *** * *Ethnicity White 7,618 13.9 56.940 7,5371328 29.2 230.1 Black or African American 1,066 39.1 52.48 1,04837 8.5 208.0 Asian 994 7.4 45.52 98228 47.0 240.9 Native Hawaiian or Other Pacific Islander 41 26.8 53.70 4100 19.5 221.1 Hispanic or Latino 1,438 29.0 57.97 1,42605 8 13.0 214.8 American Indian or Alaska Native 11 27.3 54.50 1100 18.2 218.1 Other 101 26.0 60.00 10010 14.0 217.59
Economic Status
Economically Disadvantaged 2,217 32.3 55.615 2,19237 12.0 212.4 Non-Economically Disadvantaged 9,052 14.3 55.642 8,9531641 30.1 230.4
Includes students coded Medical Emergency.Percentages may not total 100 due to rounding.Students are included in Total Students only once, but they appear in all other categories that apply. Includes students coded Former LEP who are not Special Education.Students coded IEP Exempt From Taking the HSPA are required to take the Alternate Proficiency Assessment (APA).Includes students coded Current and Former LEP.Excludes students who did not have Gender coded. Includes students coded Hispanic and/or Hispanic with other ethnic affiliations. Students who did not have Ethnicity coded and students with multiple non-Hispanic Ethnicities coded. Page 1 of 1
23
4
56
78
9
1

New Jersey High School Proficiency Assessment Performance By Demographic Group
(Produced for First-time 11 Graders Only)
DFG FG
CYCLE IIREPORT PRINTED: 7/18/2014TEST DATE: MARCH 2014
th
LANGUAGE ARTS LITERACYPerformance Data for Students with Valid Scale Scores
Enrolled VoidsNot PresentAPA
StudentsValid Scale
Scores% PartiallyProficient
%Proficient
% AdvancedProficient
Scale ScoreMean
Demographic Group2
1
Total Students 11,269 4.9 62.243 11,16413493 32.8 238.4 General Education 9,472 0.9 61.123 9,439100 4 38.0 243.2 Special Education 1,663 26.1 69.019 1,592349 4.8 213.0 Not Exempt From Passing 1,188 19.0 74.614 1,17220 6.4 218.4 Exempt From Passing 426 46.0 53.65 42010 0.5 198.1 Exempt From Taking (APA) 49 -- ---- ----49 5 -- -- Limited English Proficient 177 33.0 64.21 17600 6 2.8 208.5 Current LEP 139 39.9 59.41 13800 0.7 203.9 Former LEP 38 7.9 81.60 3800 10.5 225.3Gender 7
Female 5,554 2.7 59.623 5,508716 37.8 241.6 Male 5,714 7.1 64.920 5,655633 28.0 235.3Migrant Status
Migrant 1 * ** *** * * Non-Migrant 11,268 * ** *** * *Ethnicity White 7,618 3.5 59.828 7,5501228 36.6 240.6 Black or African American 1,066 9.9 75.68 1,05008 14.5 228.9 Asian 994 3.9 52.52 98408 43.6 243.1 Native Hawaiian or Other Pacific Islander 41 9.8 65.90 4100 24.4 235.6 Hispanic or Latino 1,438 8.7 71.55 1,42805 8 19.8 231.2 American Indian or Alaska Native 11 9.1 54.50 1100 36.4 235.9 Other 101 9.0 69.00 10010 22.0 234.49
Economic Status
Economically Disadvantaged 2,217 10.6 72.812 2,19627 16.7 228.8 Non-Economically Disadvantaged 9,052 3.5 59.731 8,9681142 36.8 240.8
Includes students coded Medical Emergency.Percentages may not total 100 due to rounding.Students are included in Total Students only once, but they appear in all other categories that apply. Includes students coded Former LEP who are not Special Education.Students coded IEP Exempt From Taking the HSPA are required to take the Alternate Proficiency Assessment (APA).Includes students coded Current and Former LEP.Excludes students who did not have Gender coded. Includes students coded Hispanic and/or Hispanic with other ethnic affiliations. Students who did not have Ethnicity coded and students with multiple non-Hispanic Ethnicities coded. Page 1 of 1
23
4
56
78
9
1
New Jersey High School Proficiency Assessment Performance By Demographic Group
(Produced for First-time 11 Graders Only)
DFG GH
CYCLE IIREPORT PRINTED: 7/18/2014TEST DATE: MARCH 2014
th
MATHEMATICSPerformance Data for Students with Valid Scale Scores
Enrolled VoidsNot PresentAPA
StudentsValid Scale
Scores% PartiallyProficient
%Proficient
% AdvancedProficient
Scale ScoreMean
Demographic Group2
1
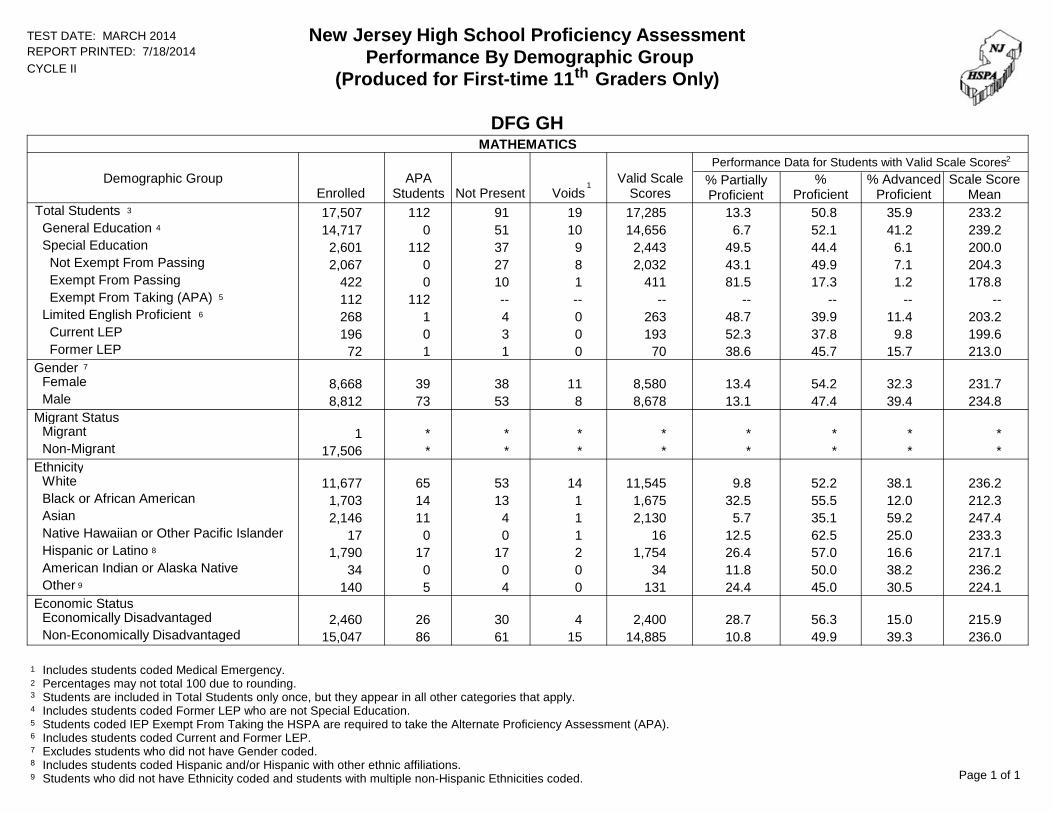
Total Students 17,507 13.3 50.891 17,285191123 35.9 233.2 General Education 14,717 6.7 52.151 14,656100 4 41.2 239.2 Special Education 2,601 49.5 44.437 2,4439112 6.1 200.0 Not Exempt From Passing 2,067 43.1 49.927 2,03280 7.1 204.3 Exempt From Passing 422 81.5 17.310 41110 1.2 178.8 Exempt From Taking (APA) 112 -- ---- ----112 5 -- -- Limited English Proficient 268 48.7 39.94 26301 6 11.4 203.2 Current LEP 196 52.3 37.83 19300 9.8 199.6 Former LEP 72 38.6 45.71 7001 15.7 213.0Gender 7
Female 8,668 13.4 54.238 8,5801139 32.3 231.7 Male 8,812 13.1 47.453 8,678873 39.4 234.8Migrant Status
Migrant 1 * ** *** * * Non-Migrant 17,506 * ** *** * *Ethnicity White 11,677 9.8 52.253 11,5451465 38.1 236.2 Black or African American 1,703 32.5 55.513 1,675114 12.0 212.3 Asian 2,146 5.7 35.14 2,130111 59.2 247.4 Native Hawaiian or Other Pacific Islander 17 12.5 62.50 1610 25.0 233.3 Hispanic or Latino 1,790 26.4 57.017 1,754217 8 16.6 217.1 American Indian or Alaska Native 34 11.8 50.00 3400 38.2 236.2 Other 140 24.4 45.04 13105 30.5 224.19
Economic Status
Economically Disadvantaged 2,460 28.7 56.330 2,400426 15.0 215.9 Non-Economically Disadvantaged 15,047 10.8 49.961 14,8851586 39.3 236.0
Includes students coded Medical Emergency.Percentages may not total 100 due to rounding.Students are included in Total Students only once, but they appear in all other categories that apply. Includes students coded Former LEP who are not Special Education.Students coded IEP Exempt From Taking the HSPA are required to take the Alternate Proficiency Assessment (APA).Includes students coded Current and Former LEP.Excludes students who did not have Gender coded. Includes students coded Hispanic and/or Hispanic with other ethnic affiliations. Students who did not have Ethnicity coded and students with multiple non-Hispanic Ethnicities coded. Page 1 of 1
23
4
56
78
9
1

New Jersey High School Proficiency Assessment Performance By Demographic Group
(Produced for First-time 11 Graders Only)
DFG GH
CYCLE IIREPORT PRINTED: 7/18/2014TEST DATE: MARCH 2014
th
LANGUAGE ARTS LITERACYPerformance Data for Students with Valid Scale Scores
Enrolled VoidsNot PresentAPA
StudentsValid Scale
Scores% PartiallyProficient
%Proficient
% AdvancedProficient
Scale ScoreMean
Demographic Group2
1
Total Students 17,507 3.4 55.177 17,299211103 41.5 242.2 General Education 14,717 0.6 51.944 14,662110 4 47.5 246.4 Special Education 2,601 17.0 74.631 2,45010110 8.4 220.2 Not Exempt From Passing 2,129 12.2 78.222 2,097100 9.6 223.8 Exempt From Passing 362 45.6 53.09 35300 1.4 199.0 Exempt From Taking (APA) 110 -- ---- ----110 5 -- -- Limited English Proficient 268 35.1 62.62 26501 6 2.3 206.6 Current LEP 196 43.8 55.22 19400 1.0 201.3 Former LEP 72 11.3 83.10 7101 5.6 221.1Gender 7
Female 8,668 2.0 50.630 8,5881238 47.3 245.1 Male 8,812 4.7 59.647 8,684972 35.7 239.4Migrant Status
Migrant 1 * ** *** * * Non-Migrant 17,506 * ** *** * *Ethnicity White 11,677 2.2 52.848 11,5521463 45.0 244.3 Black or African American 1,703 7.7 73.09 1,679213 19.4 231.8 Asian 2,146 2.4 42.52 2,132111 55.1 247.3 Native Hawaiian or Other Pacific Islander 17 0.0 68.80 1610 31.3 244.5 Hispanic or Latino 1,790 7.9 68.414 1,756317 8 23.7 232.7 American Indian or Alaska Native 34 3.0 63.60 3301 33.3 240.6 Other 140 6.9 61.14 13105 32.1 235.69
Economic Status
Economically Disadvantaged 2,460 8.5 72.020 2,408527 19.5 230.7 Non-Economically Disadvantaged 15,047 2.6 52.457 14,8911683 45.0 244.1
Includes students coded Medical Emergency.Percentages may not total 100 due to rounding.Students are included in Total Students only once, but they appear in all other categories that apply. Includes students coded Former LEP who are not Special Education.Students coded IEP Exempt From Taking the HSPA are required to take the Alternate Proficiency Assessment (APA).Includes students coded Current and Former LEP.Excludes students who did not have Gender coded. Includes students coded Hispanic and/or Hispanic with other ethnic affiliations. Students who did not have Ethnicity coded and students with multiple non-Hispanic Ethnicities coded. Page 1 of 1
23
4
56
78
9
1

New Jersey High School Proficiency Assessment Performance By Demographic Group
(Produced for First-time 11 Graders Only)
DFG I
CYCLE IIREPORT PRINTED: 7/18/2014TEST DATE: MARCH 2014
th
MATHEMATICSPerformance Data for Students with Valid Scale Scores
Enrolled VoidsNot PresentAPA
StudentsValid Scale
Scores% PartiallyProficient
%Proficient
% AdvancedProficient
Scale ScoreMean
Demographic Group2
1
Total Students 15,807 8.2 41.876 15,65815583 50.0 241.9 General Education 13,436 3.1 40.539 13,38980 4 56.4 247.4 Special Education 2,269 37.8 50.237 2,167758 12.0 209.5 Not Exempt From Passing 2,001 34.0 52.834 1,96160 13.2 212.2 Exempt From Passing 210 74.3 25.23 20610 0.5 183.5 Exempt From Taking (APA) 58 -- ---- ----58 5 -- -- Limited English Proficient 136 39.8 37.61 13302 6 22.6 212.3 Current LEP 107 41.5 34.90 10601 23.6 212.2 Former LEP 29 33.3 48.11 2701 18.5 212.9Gender 7
Female 7,779 8.2 45.339 7,722513 46.5 240.6 Male 8,023 8.1 38.437 7,9311045 53.5 243.2Migrant Status
Migrant 2 * ** *** * * Non-Migrant 15,805 * ** *** * *Ethnicity White 11,676 6.7 43.345 11,577846 50.0 242.7 Black or African American 915 26.9 55.719 89132 17.4 218.2 Asian 2,054 2.4 21.24 2,04703 76.4 256.1 Native Hawaiian or Other Pacific Islander 18 5.6 55.60 1800 38.9 242.8 Hispanic or Latino 1,000 20.2 54.08 98525 8 25.8 225.4 American Indian or Alaska Native 18 11.1 55.60 1800 33.3 234.2 Other 126 11.5 38.50 12222 50.0 240.29
Economic Status
Economically Disadvantaged 958 28.3 53.814 93536 17.9 217.6 Non-Economically Disadvantaged 14,849 6.9 41.062 14,7231252 52.1 243.5
Includes students coded Medical Emergency.Percentages may not total 100 due to rounding.Students are included in Total Students only once, but they appear in all other categories that apply. Includes students coded Former LEP who are not Special Education.Students coded IEP Exempt From Taking the HSPA are required to take the Alternate Proficiency Assessment (APA).Includes students coded Current and Former LEP.Excludes students who did not have Gender coded. Includes students coded Hispanic and/or Hispanic with other ethnic affiliations. Students who did not have Ethnicity coded and students with multiple non-Hispanic Ethnicities coded. Page 1 of 1
23
4
56
78
9
1

New Jersey High School Proficiency Assessment Performance By Demographic Group
(Produced for First-time 11 Graders Only)
DFG I
CYCLE IIREPORT PRINTED: 7/18/2014TEST DATE: MARCH 2014
th
LANGUAGE ARTS LITERACYPerformance Data for Students with Valid Scale Scores
Enrolled VoidsNot PresentAPA
StudentsValid Scale
Scores% PartiallyProficient
%Proficient
% AdvancedProficient
Scale ScoreMean
Demographic Group2
1
Total Students 15,807 1.9 43.160 15,66917613 55.1 247.8 General Education 13,436 0.3 37.929 13,39890 4 61.8 251.3 Special Education 2,269 10.5 73.431 2,169861 16.0 227.8 Not Exempt From Passing 2,026 8.2 74.627 1,99180 17.2 229.9 Exempt From Passing 182 36.5 60.74 17800 2.8 203.8 Exempt From Taking (APA) 61 -- ---- ----61 5 -- -- Limited English Proficient 136 24.1 72.91 13302 6 3.0 212.8 Current LEP 107 27.4 71.70 10601 0.9 209.8 Former LEP 29 11.1 77.81 2701 11.1 224.3Gender 7
Female 7,779 1.0 38.231 7,729415 60.8 250.3 Male 8,023 2.7 47.829 7,9351346 49.5 245.4Migrant Status
Migrant 2 * ** *** * * Non-Migrant 15,805 * ** *** * *Ethnicity White 11,676 1.5 42.137 11,584946 56.4 248.5 Black or African American 915 5.7 63.217 89143 31.1 236.5 Asian 2,054 1.4 30.52 2,04903 68.1 252.6 Native Hawaiian or Other Pacific Islander 18 0.0 61.10 1800 38.9 247.2 Hispanic or Latino 1,000 3.5 61.84 98727 8 34.7 240.1 American Indian or Alaska Native 18 0.0 66.70 1800 33.3 241.4 Other 126 6.6 41.00 12222 52.5 244.69
Economic Status
Economically Disadvantaged 958 6.8 71.111 93827 22.1 232.9 Non-Economically Disadvantaged 14,849 1.6 41.349 14,7311554 57.2 248.7
Includes students coded Medical Emergency.Percentages may not total 100 due to rounding.Students are included in Total Students only once, but they appear in all other categories that apply. Includes students coded Former LEP who are not Special Education.Students coded IEP Exempt From Taking the HSPA are required to take the Alternate Proficiency Assessment (APA).Includes students coded Current and Former LEP.Excludes students who did not have Gender coded. Includes students coded Hispanic and/or Hispanic with other ethnic affiliations. Students who did not have Ethnicity coded and students with multiple non-Hispanic Ethnicities coded. Page 1 of 1
23
4
56
78
9
1
New Jersey High School Proficiency Assessment Performance By Demographic Group
(Produced for First-time 11 Graders Only)
DFG J
CYCLE IIREPORT PRINTED: 7/18/2014TEST DATE: MARCH 2014
th
MATHEMATICSPerformance Data for Students with Valid Scale Scores
Enrolled VoidsNot PresentAPA
StudentsValid Scale
Scores% PartiallyProficient
%Proficient
% AdvancedProficient
Scale ScoreMean
Demographic Group2
1
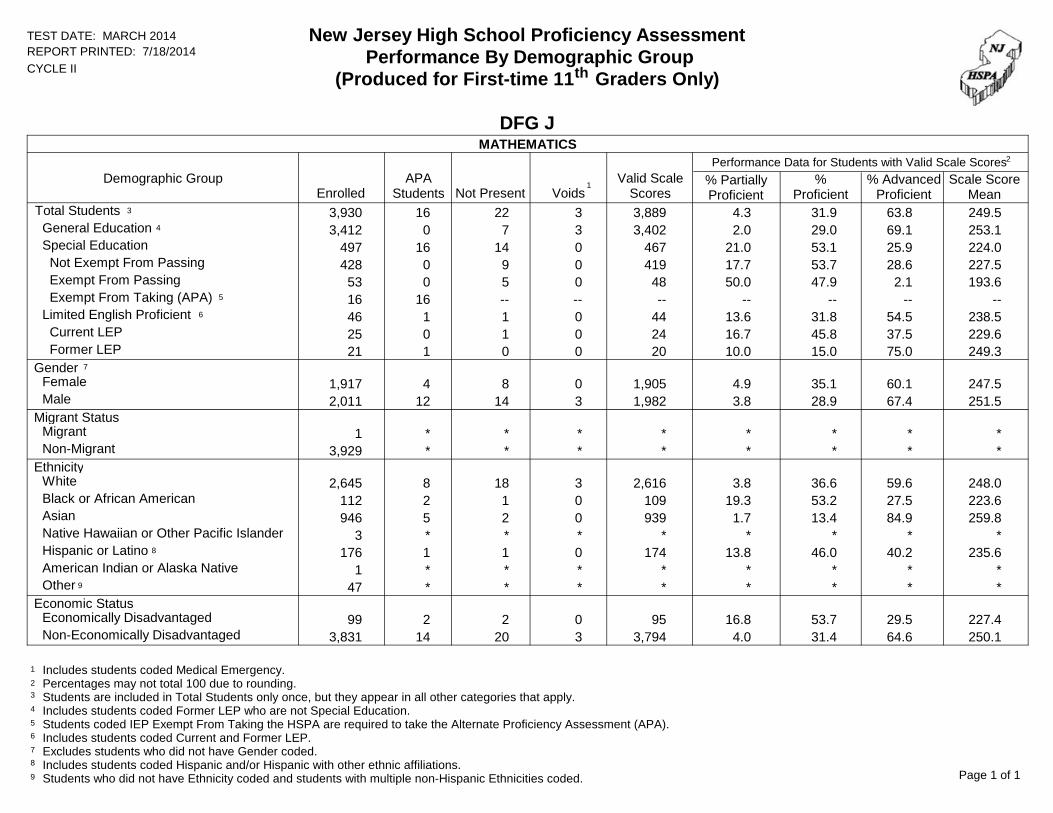
Total Students 3,930 4.3 31.922 3,8893163 63.8 249.5 General Education 3,412 2.0 29.07 3,40230 4 69.1 253.1 Special Education 497 21.0 53.114 467016 25.9 224.0 Not Exempt From Passing 428 17.7 53.79 41900 28.6 227.5 Exempt From Passing 53 50.0 47.95 4800 2.1 193.6 Exempt From Taking (APA) 16 -- ---- ----16 5 -- -- Limited English Proficient 46 13.6 31.81 4401 6 54.5 238.5 Current LEP 25 16.7 45.81 2400 37.5 229.6 Former LEP 21 10.0 15.00 2001 75.0 249.3Gender 7
Female 1,917 4.9 35.18 1,90504 60.1 247.5 Male 2,011 3.8 28.914 1,982312 67.4 251.5Migrant Status
Migrant 1 * ** *** * * Non-Migrant 3,929 * ** *** * *Ethnicity White 2,645 3.8 36.618 2,61638 59.6 248.0 Black or African American 112 19.3 53.21 10902 27.5 223.6 Asian 946 1.7 13.42 93905 84.9 259.8 Native Hawaiian or Other Pacific Islander 3 * ** *** * * Hispanic or Latino 176 13.8 46.01 17401 8 40.2 235.6 American Indian or Alaska Native 1 * ** *** * * Other 47 * ** *** * *9
Economic Status
Economically Disadvantaged 99 16.8 53.72 9502 29.5 227.4 Non-Economically Disadvantaged 3,831 4.0 31.420 3,794314 64.6 250.1
Includes students coded Medical Emergency.Percentages may not total 100 due to rounding.Students are included in Total Students only once, but they appear in all other categories that apply. Includes students coded Former LEP who are not Special Education.Students coded IEP Exempt From Taking the HSPA are required to take the Alternate Proficiency Assessment (APA).Includes students coded Current and Former LEP.Excludes students who did not have Gender coded. Includes students coded Hispanic and/or Hispanic with other ethnic affiliations. Students who did not have Ethnicity coded and students with multiple non-Hispanic Ethnicities coded. Page 1 of 1
23
4
56
78
9
1

New Jersey High School Proficiency Assessment Performance By Demographic Group
(Produced for First-time 11 Graders Only)
DFG J
CYCLE IIREPORT PRINTED: 7/18/2014TEST DATE: MARCH 2014
th
LANGUAGE ARTS LITERACYPerformance Data for Students with Valid Scale Scores
Enrolled VoidsNot PresentAPA
StudentsValid Scale
Scores% PartiallyProficient
%Proficient
% AdvancedProficient
Scale ScoreMean
Demographic Group2
1
Total Students 3,930 1.0 34.821 3,8867163 64.2 251.1 General Education 3,412 0.2 30.27 3,39960 4 69.6 253.4 Special Education 497 6.4 66.213 467116 27.4 236.0 Not Exempt From Passing 445 5.1 66.29 43510 28.7 237.4 Exempt From Passing 36 25.0 65.64 3200 9.4 216.6 Exempt From Taking (APA) 16 -- ---- ----16 5 -- -- Limited English Proficient 46 4.5 84.11 4401 6 11.4 227.3 Current LEP 25 8.3 87.51 2400 4.2 220.1 Former LEP 21 0.0 80.00 2001 20.0 236.0Gender 7
Female 1,917 0.6 29.87 1,90334 69.6 253.0 Male 2,011 1.3 39.714 1,981412 59.1 249.4Migrant Status
Migrant 1 * ** *** * * Non-Migrant 3,929 * ** *** * *Ethnicity White 2,645 0.7 35.717 2,61558 63.6 251.1 Black or African American 112 6.5 59.31 10812 34.3 237.7 Asian 946 0.2 27.42 93905 72.4 254.3 Native Hawaiian or Other Pacific Islander 3 * ** *** * * Hispanic or Latino 176 4.0 45.41 17401 8 50.6 245.0 American Indian or Alaska Native 1 * ** *** * * Other 47 * ** *** * *9
Economic Status
Economically Disadvantaged 99 6.3 65.32 9502 28.4 235.8 Non-Economically Disadvantaged 3,831 0.8 34.119 3,791714 65.1 251.5
Includes students coded Medical Emergency.Percentages may not total 100 due to rounding.Students are included in Total Students only once, but they appear in all other categories that apply. Includes students coded Former LEP who are not Special Education.Students coded IEP Exempt From Taking the HSPA are required to take the Alternate Proficiency Assessment (APA).Includes students coded Current and Former LEP.Excludes students who did not have Gender coded. Includes students coded Hispanic and/or Hispanic with other ethnic affiliations. Students who did not have Ethnicity coded and students with multiple non-Hispanic Ethnicities coded. Page 1 of 1
23
4
56
78
9
1
New Jersey High School Proficiency Assessment Performance By Demographic Group
(Produced for First-time 11 Graders Only)
DFG R (Charter Schools)
CYCLE IIREPORT PRINTED: 7/18/2014TEST DATE: MARCH 2014
th
MATHEMATICSPerformance Data for Students with Valid Scale Scores
Enrolled VoidsNot PresentAPA
StudentsValid Scale
Scores% PartiallyProficient
%Proficient
% AdvancedProficient
Scale ScoreMean
Demographic Group2
1
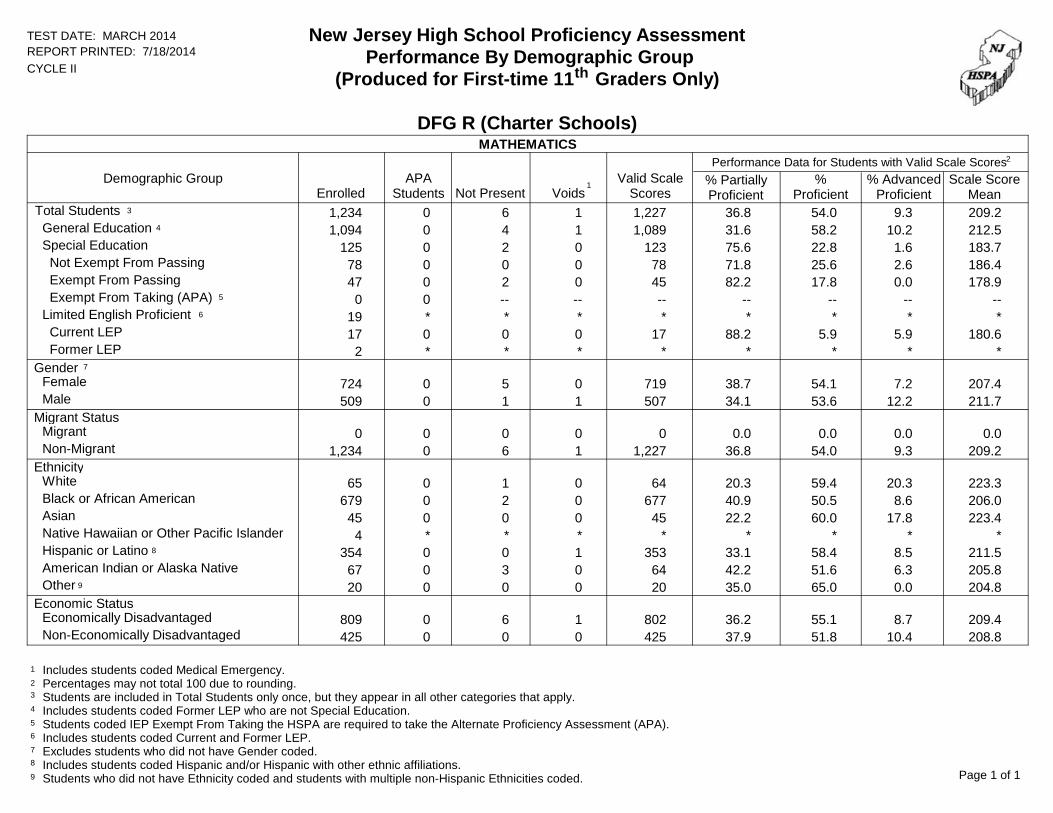
Total Students 1,234 36.8 54.06 1,227103 9.3 209.2 General Education 1,094 31.6 58.24 1,08910 4 10.2 212.5 Special Education 125 75.6 22.82 12300 1.6 183.7 Not Exempt From Passing 78 71.8 25.60 7800 2.6 186.4 Exempt From Passing 47 82.2 17.82 4500 0.0 178.9 Exempt From Taking (APA) 0 -- ---- ----0 5 -- -- Limited English Proficient 19 * ** *** 6 * * Current LEP 17 88.2 5.90 1700 5.9 180.6 Former LEP 2 * ** *** * *Gender 7
Female 724 38.7 54.15 71900 7.2 207.4 Male 509 34.1 53.61 50710 12.2 211.7Migrant Status
Migrant 0 0.0 0.00 000 0.0 0.0 Non-Migrant 1,234 36.8 54.06 1,22710 9.3 209.2Ethnicity White 65 20.3 59.41 6400 20.3 223.3 Black or African American 679 40.9 50.52 67700 8.6 206.0 Asian 45 22.2 60.00 4500 17.8 223.4 Native Hawaiian or Other Pacific Islander 4 * ** *** * * Hispanic or Latino 354 33.1 58.40 35310 8 8.5 211.5 American Indian or Alaska Native 67 42.2 51.63 6400 6.3 205.8 Other 20 35.0 65.00 2000 0.0 204.89
Economic Status
Economically Disadvantaged 809 36.2 55.16 80210 8.7 209.4 Non-Economically Disadvantaged 425 37.9 51.80 42500 10.4 208.8
Includes students coded Medical Emergency.Percentages may not total 100 due to rounding.Students are included in Total Students only once, but they appear in all other categories that apply. Includes students coded Former LEP who are not Special Education.Students coded IEP Exempt From Taking the HSPA are required to take the Alternate Proficiency Assessment (APA).Includes students coded Current and Former LEP.Excludes students who did not have Gender coded. Includes students coded Hispanic and/or Hispanic with other ethnic affiliations. Students who did not have Ethnicity coded and students with multiple non-Hispanic Ethnicities coded. Page 1 of 1
23
4
56
78
9
1

New Jersey High School Proficiency Assessment Performance By Demographic Group
(Produced for First-time 11 Graders Only)
DFG R (Charter Schools)
CYCLE IIREPORT PRINTED: 7/18/2014TEST DATE: MARCH 2014
th
LANGUAGE ARTS LITERACYPerformance Data for Students with Valid Scale Scores
Enrolled VoidsNot PresentAPA
StudentsValid Scale
Scores% PartiallyProficient
%Proficient
% AdvancedProficient
Scale ScoreMean
Demographic Group2
1
Total Students 1,234 7.1 80.32 1,232003 12.7 229.3 General Education 1,094 3.8 82.41 1,09300 4 13.8 231.9 Special Education 125 32.3 63.71 12400 4.0 209.3 Not Exempt From Passing 87 23.0 71.30 8700 5.7 215.1 Exempt From Passing 38 54.1 45.91 3700 0.0 195.8 Exempt From Taking (APA) 0 -- ---- ----0 5 -- -- Limited English Proficient 19 * ** *** 6 * * Current LEP 17 41.2 58.80 1700 0.0 204.9 Former LEP 2 * ** *** * *Gender 7
Female 724 4.6 81.11 72300 14.4 231.5 Male 509 10.6 79.11 50800 10.2 226.3Migrant Status
Migrant 0 0.0 0.00 000 0.0 0.0 Non-Migrant 1,234 7.1 80.32 1,23200 12.7 229.3Ethnicity White 65 6.2 64.60 6500 29.2 237.2 Black or African American 679 8.8 79.20 67900 11.9 227.7 Asian 45 6.7 77.80 4500 15.6 231.0 Native Hawaiian or Other Pacific Islander 4 * ** *** * * Hispanic or Latino 354 3.7 84.50 35400 8 11.9 231.3 American Indian or Alaska Native 67 6.2 87.72 6500 6.2 225.7 Other 20 15.0 75.00 2000 10.0 226.79
Economic Status
Economically Disadvantaged 809 7.7 80.72 80700 11.6 228.4 Non-Economically Disadvantaged 425 5.9 79.50 42500 14.6 231.1
Includes students coded Medical Emergency.Percentages may not total 100 due to rounding.Students are included in Total Students only once, but they appear in all other categories that apply. Includes students coded Former LEP who are not Special Education.Students coded IEP Exempt From Taking the HSPA are required to take the Alternate Proficiency Assessment (APA).Includes students coded Current and Former LEP.Excludes students who did not have Gender coded. Includes students coded Hispanic and/or Hispanic with other ethnic affiliations. Students who did not have Ethnicity coded and students with multiple non-Hispanic Ethnicities coded. Page 1 of 1
23
4
56
78
9
1

New Jersey High School Proficiency Assessment Performance By Demographic Group
(Produced for First-time 11 Graders Only)
DFG V (Vocational Schools)
CYCLE IIREPORT PRINTED: 7/18/2014TEST DATE: MARCH 2014
th
MATHEMATICSPerformance Data for Students with Valid Scale Scores
Enrolled VoidsNot PresentAPA
StudentsValid Scale
Scores% PartiallyProficient
%Proficient
% AdvancedProficient
Scale ScoreMean
Demographic Group2
1
Total Students 5,974 17.2 48.29 5,9244373 34.6 231.0 General Education 5,138 11.1 49.58 5,12730 4 39.3 236.3 Special Education 810 56.4 39.21 771137 4.4 196.4 Not Exempt From Passing 530 50.4 44.11 52810 5.5 200.3 Exempt From Passing 243 69.5 28.40 24300 2.1 188.0 Exempt From Taking (APA) 37 -- ---- ----37 5 -- -- Limited English Proficient 41 43.9 41.50 4100 6 14.6 208.1 Current LEP 30 53.3 43.30 3000 3.3 198.7 Former LEP 11 18.2 36.40 1100 45.5 233.6Gender 7
Female 3,085 17.5 50.73 3,060220 31.9 229.6 Male 2,888 16.9 45.56 2,863217 37.6 232.5Migrant Status
Migrant 0 0.0 0.00 000 0.0 0.0 Non-Migrant 5,974 17.2 48.29 5,924437 34.6 231.0Ethnicity White 2,460 13.6 44.55 2,435218 41.8 236.3 Black or African American 1,082 27.9 60.90 1,072010 11.2 215.1 Asian 679 1.9 17.31 67710 80.8 259.1 Native Hawaiian or Other Pacific Islander 14 14.3 35.70 1400 50.0 241.1 Hispanic or Latino 1,638 21.5 58.12 1,62718 8 20.3 222.0 American Indian or Alaska Native 16 6.3 75.00 1600 18.8 229.3 Other 85 24.1 45.81 8301 30.1 224.59
Economic Status
Economically Disadvantaged 2,650 23.6 58.64 2,621421 17.8 220.1 Non-Economically Disadvantaged 3,324 12.1 39.95 3,303016 48.0 239.7
Includes students coded Medical Emergency.Percentages may not total 100 due to rounding.Students are included in Total Students only once, but they appear in all other categories that apply. Includes students coded Former LEP who are not Special Education.Students coded IEP Exempt From Taking the HSPA are required to take the Alternate Proficiency Assessment (APA).Includes students coded Current and Former LEP.Excludes students who did not have Gender coded. Includes students coded Hispanic and/or Hispanic with other ethnic affiliations. Students who did not have Ethnicity coded and students with multiple non-Hispanic Ethnicities coded. Page 1 of 1
23
4
56
78
9
1

New Jersey High School Proficiency Assessment Performance By Demographic Group
(Produced for First-time 11 Graders Only)
DFG V (Vocational Schools)
CYCLE IIREPORT PRINTED: 7/18/2014TEST DATE: MARCH 2014
th
LANGUAGE ARTS LITERACYPerformance Data for Students with Valid Scale Scores
Enrolled VoidsNot PresentAPA
StudentsValid Scale
Scores% PartiallyProficient
%Proficient
% AdvancedProficient
Scale ScoreMean
Demographic Group2
1
Total Students 5,974 3.7 60.25 5,9343323 36.1 239.8 General Education 5,138 0.9 57.94 5,13310 4 41.1 243.6 Special Education 810 21.3 74.71 775232 4.0 215.6 Not Exempt From Passing 554 17.8 76.81 55210 5.4 218.9 Exempt From Passing 224 30.0 69.50 22310 0.4 207.3 Exempt From Taking (APA) 32 -- ---- ----32 5 -- -- Limited English Proficient 41 22.0 73.20 4100 6 4.9 215.4 Current LEP 30 26.7 73.30 3000 0.0 209.4 Former LEP 11 9.1 72.70 1100 18.2 231.6Gender 7
Female 3,085 2.1 58.42 3,066215 39.4 242.1 Male 2,888 5.3 62.13 2,867117 32.5 237.2Migrant Status
Migrant 0 0.0 0.00 000 0.0 0.0 Non-Migrant 5,974 3.7 60.25 5,934332 36.1 239.8Ethnicity White 2,460 3.7 52.92 2,442115 43.4 242.5 Black or African American 1,082 4.2 79.00 1,071110 16.8 232.4 Asian 679 0.1 25.51 67800 74.3 255.8 Native Hawaiian or Other Pacific Islander 14 0.0 50.00 1400 50.0 245.1 Hispanic or Latino 1,638 4.7 73.42 1,62916 8 21.9 234.0 American Indian or Alaska Native 16 0.0 68.80 1600 31.3 240.2 Other 85 6.0 59.50 8401 34.5 238.29
Economic Status
Economically Disadvantaged 2,650 4.6 76.53 2,627218 18.9 233.1 Non-Economically Disadvantaged 3,324 2.9 47.32 3,307114 49.8 245.0
Includes students coded Medical Emergency.Percentages may not total 100 due to rounding.Students are included in Total Students only once, but they appear in all other categories that apply. Includes students coded Former LEP who are not Special Education.Students coded IEP Exempt From Taking the HSPA are required to take the Alternate Proficiency Assessment (APA).Includes students coded Current and Former LEP.Excludes students who did not have Gender coded. Includes students coded Hispanic and/or Hispanic with other ethnic affiliations. Students who did not have Ethnicity coded and students with multiple non-Hispanic Ethnicities coded. Page 1 of 1
23
4
56
78
9
1

New Jersey High School Proficiency Assessment Performance By Demographic Group
(Produced for First-time 11 Graders Only)
Non Special Needs
CYCLE IIREPORT PRINTED: 7/18/2014TEST DATE: MARCH 2014
th
MATHEMATICSPerformance Data for Students with Valid Scale Scores
Enrolled VoidsNot PresentAPA
StudentsValid Scale
Scores% PartiallyProficient
%Proficient
% AdvancedProficient
Scale ScoreMean
Demographic Group2
1
Total Students 83,656 16.9 50.5442 82,6781104263 32.6 229.9 General Education 70,252 9.7 52.9239 69,942710 4 37.4 235.9 Special Education 12,355 55.7 38.3195 11,69737426 6.0 196.7 Not Exempt From Passing 8,972 48.0 44.3132 8,812280 7.7 202.1 Exempt From Passing 2,957 79.1 20.063 2,88590 0.9 180.4 Exempt From Taking (APA) 426 -- ---- ----426 5 -- -- Limited English Proficient 1,427 54.2 35.810 1,40827 6 10.0 199.2 Current LEP 1,092 60.7 31.48 1,08022 7.9 194.8 Former LEP 335 32.6 50.32 32805 17.1 213.5Gender 7
Female 41,167 16.9 53.5195 40,77054148 29.6 228.7 Male 42,434 16.8 47.7246 41,85456278 35.5 231.1Migrant Status
Migrant 17 35.3 52.90 1700 11.8 213.9 Non-Migrant 83,639 16.9 50.5442 82,661110426 32.6 229.9Ethnicity White 51,363 11.6 51.6242 50,81473234 36.7 234.5 Black or African American 9,958 37.7 52.887 9,8011456 9.5 208.6 Asian 8,582 5.6 32.318 8,520638 62.1 248.5 Native Hawaiian or Other Pacific Islander 142 17.7 50.40 14110 31.9 230.6 Hispanic or Latino 12,661 28.9 56.984 12,4781386 8 14.2 215.5 American Indian or Alaska Native 186 26.2 56.33 18300 17.5 219.0 Other 764 25.9 48.68 741312 25.5 222.09
Economic Status
Economically Disadvantaged 19,323 31.6 55.6162 19,00333125 12.8 213.3 Non-Economically Disadvantaged 64,333 12.5 49.0280 63,67577301 38.5 234.8
Includes students coded Medical Emergency.Percentages may not total 100 due to rounding.Students are included in Total Students only once, but they appear in all other categories that apply. Includes students coded Former LEP who are not Special Education.Students coded IEP Exempt From Taking the HSPA are required to take the Alternate Proficiency Assessment (APA).Includes students coded Current and Former LEP.Excludes students who did not have Gender coded. Includes students coded Hispanic and/or Hispanic with other ethnic affiliations. Students who did not have Ethnicity coded and students with multiple non-Hispanic Ethnicities coded. Page 1 of 1
23
4
56
78
9
1

New Jersey High School Proficiency Assessment Performance By Demographic Group
(Produced for First-time 11 Graders Only)
Non Special Needs
CYCLE IIREPORT PRINTED: 7/18/2014TEST DATE: MARCH 2014
th
LANGUAGE ARTS LITERACYPerformance Data for Students with Valid Scale Scores
Enrolled VoidsNot PresentAPA
StudentsValid Scale
Scores% PartiallyProficient
%Proficient
% AdvancedProficient
Scale ScoreMean
Demographic Group2
1
Total Students 83,656 4.6 58.6342 82,7761204183 36.7 239.6 General Education 70,252 1.0 56.8192 69,995650 4 42.1 244.1 Special Education 12,355 22.6 69.6143 11,74054418 7.8 216.5 Not Exempt From Passing 9,232 16.6 73.797 9,093420 9.7 221.3 Exempt From Passing 2,705 43.3 55.546 2,647120 1.2 200.3 Exempt From Taking (APA) 418 -- ---- ----418 5 -- -- Limited English Proficient 1,427 36.4 61.78 1,41117 6 1.9 205.8 Current LEP 1,092 44.4 55.27 1,08212 0.5 200.7 Former LEP 335 10.0 83.31 32905 6.7 222.7Gender 7
Female 41,167 2.7 55.5146 40,82753141 41.8 242.6 Male 42,434 6.5 61.7196 41,89566277 31.8 236.7Migrant Status
Migrant 17 17.6 58.80 1700 23.5 225.0 Non-Migrant 83,639 4.6 58.6342 82,759120418 36.7 239.6Ethnicity White 51,363 3.0 54.8192 50,87471226 42.2 242.8 Black or African American 9,958 10.1 74.069 9,8092357 15.9 228.4 Asian 8,582 2.4 41.913 8,530138 55.7 247.7 Native Hawaiian or Other Pacific Islander 142 5.0 61.00 14110 34.0 239.9 Hispanic or Latino 12,661 8.2 73.258 12,5001984 8 18.6 230.7 American Indian or Alaska Native 186 6.6 73.22 18301 20.2 232.1 Other 764 9.7 60.48 739512 29.9 234.49
Economic Status
Economically Disadvantaged 19,323 9.8 75.0116 19,05336118 15.2 228.3 Non-Economically Disadvantaged 64,333 3.1 53.7226 63,72384300 43.2 243.0
Includes students coded Medical Emergency.Percentages may not total 100 due to rounding.Students are included in Total Students only once, but they appear in all other categories that apply. Includes students coded Former LEP who are not Special Education.Students coded IEP Exempt From Taking the HSPA are required to take the Alternate Proficiency Assessment (APA).Includes students coded Current and Former LEP.Excludes students who did not have Gender coded. Includes students coded Hispanic and/or Hispanic with other ethnic affiliations. Students who did not have Ethnicity coded and students with multiple non-Hispanic Ethnicities coded. Page 1 of 1
23
4
56
78
9
1

New Jersey High School Proficiency Assessment Performance By Demographic Group
(Produced for First-time 11 Graders Only)
Special Needs
CYCLE IIREPORT PRINTED: 7/18/2014TEST DATE: MARCH 2014
th
MATHEMATICSPerformance Data for Students with Valid Scale Scores
Enrolled VoidsNot PresentAPA
StudentsValid Scale
Scores% PartiallyProficient
%Proficient
% AdvancedProficient
Scale ScoreMean
Demographic Group2
1
Total Students 14,584 45.4 45.1221 14,26619783 9.5 204.3 General Education 10,943 33.9 53.9101 10,829130 4 12.1 212.3 Special Education 2,563 85.7 13.6103 2,377578 0.7 175.9 Not Exempt From Passing 1,229 81.5 17.246 1,18030 1.3 178.9 Exempt From Passing 1,256 89.8 10.057 1,19720 0.2 173.0 Exempt From Taking (APA) 78 -- ---- ----78 5 -- -- Limited English Proficient 1,355 68.4 28.523 1,33110 6 3.1 188.5 Current LEP 1,110 72.7 24.921 1,08810 2.4 185.7 Former LEP 245 49.4 44.42 24300 6.2 200.7Gender 7
Female 7,266 46.3 45.796 7,1241234 8.0 203.6 Male 7,308 44.5 44.6125 7,135741 11.0 205.0Migrant Status
Migrant 10 * ** *** * * Non-Migrant 14,574 45.4 45.1221 14,2561978 9.5 204.3Ethnicity White 1,939 25.4 53.916 1,91058 20.6 220.0 Black or African American 5,189 57.2 38.0120 5,032928 4.8 195.7 Asian 492 26.3 44.30 49002 29.4 223.7 Native Hawaiian or Other Pacific Islander 18 29.4 41.21 1700 29.4 222.8 Hispanic or Latino 6,855 43.6 48.078 6,734439 8 8.4 204.8 American Indian or Alaska Native 18 33.3 44.40 1800 22.2 212.2 Other 73 52.3 40.06 6511 7.7 198.99
Economic Status
Economically Disadvantaged 10,704 48.0 44.2170 10,471954 7.8 202.1 Non-Economically Disadvantaged 3,880 38.2 47.751 3,7951024 14.2 210.1
Includes students coded Medical Emergency.Percentages may not total 100 due to rounding.Students are included in Total Students only once, but they appear in all other categories that apply. Includes students coded Former LEP who are not Special Education.Students coded IEP Exempt From Taking the HSPA are required to take the Alternate Proficiency Assessment (APA).Includes students coded Current and Former LEP.Excludes students who did not have Gender coded. Includes students coded Hispanic and/or Hispanic with other ethnic affiliations. Students who did not have Ethnicity coded and students with multiple non-Hispanic Ethnicities coded. Page 1 of 1
23
4
56
78
9
1

New Jersey High School Proficiency Assessment Performance By Demographic Group
(Produced for First-time 11 Graders Only)
Special Needs
CYCLE IIREPORT PRINTED: 7/18/2014TEST DATE: MARCH 2014
th
LANGUAGE ARTS LITERACYPerformance Data for Students with Valid Scale Scores
Enrolled VoidsNot PresentAPA
StudentsValid Scale
Scores% PartiallyProficient
%Proficient
% AdvancedProficient
Scale ScoreMean
Demographic Group2
1
Total Students 14,584 19.0 70.8165 14,31528763 10.3 220.1 General Education 10,943 6.8 79.883 10,848120 4 13.4 228.7 Special Education 2,563 54.2 45.371 2,4041276 0.5 194.5 Not Exempt From Passing 1,234 45.4 53.835 1,19360 0.8 199.7 Exempt From Passing 1,253 62.9 36.836 1,21160 0.2 189.4 Exempt From Taking (APA) 76 -- ---- ----76 5 -- -- Limited English Proficient 1,355 55.7 43.715 1,33640 6 0.6 194.2 Current LEP 1,110 64.7 34.913 1,09340 0.4 189.0 Former LEP 245 15.2 83.12 24300 1.6 217.6Gender 7
Female 7,266 14.7 72.972 7,154832 12.4 223.7 Male 7,308 23.2 68.693 7,1542041 8.1 216.4Migrant Status
Migrant 10 * ** *** * * Non-Migrant 14,574 19.0 70.8165 14,3052876 10.3 220.1Ethnicity White 1,939 10.0 66.612 1,91638 23.4 231.6 Black or African American 5,189 22.1 71.590 5,0571428 6.3 216.0 Asian 492 12.2 63.50 49002 24.3 229.5 Native Hawaiian or Other Pacific Islander 18 5.9 64.71 1700 29.4 234.2 Hispanic or Latino 6,855 19.6 71.960 6,7471038 8 8.5 219.2 American Indian or Alaska Native 18 16.7 72.20 1800 11.1 228.3 Other 73 24.3 71.42 7010 4.3 211.69
Economic Status
Economically Disadvantaged 10,704 20.4 71.7124 10,5072053 7.9 218.2 Non-Economically Disadvantaged 3,880 15.0 68.241 3,808823 16.8 225.3
Includes students coded Medical Emergency.Percentages may not total 100 due to rounding.Students are included in Total Students only once, but they appear in all other categories that apply. Includes students coded Former LEP who are not Special Education.Students coded IEP Exempt From Taking the HSPA are required to take the Alternate Proficiency Assessment (APA).Includes students coded Current and Former LEP.Excludes students who did not have Gender coded. Includes students coded Hispanic and/or Hispanic with other ethnic affiliations. Students who did not have Ethnicity coded and students with multiple non-Hispanic Ethnicities coded. Page 1 of 1
23
4
56
78
9
1