high spatial resolution and hyperspectral … · high spatial resolution and hyperspectral remote...
TRANSCRIPT
HIGH SPATIAL RESOLUTION AND HYPERSPECTRAL REMOTE SENSING
FOR MAPPING VEGETATION SPECIES IN TROPICAL RAINFOREST
ALVIN LAU MENG SHIN
A thesis submitted in fulfilment of the
requirements for the award of the degree of
Doctor of Philosophy (Remote Sensing)
Faculty of Geoinformation Science and Engineering
Universiti Teknologi Malaysia
DECEMBER 2009

For my wife and my family.

iv
ACKNOWLEDGEMENTS
I would like to express my heartiest thanks and profound gratitude to my
supervisor, Prof. Dr. Mazlan bin Hashim for his untiring guidance, invaluable
assistance, endless encouragement and strong support throughout the period of my
research. My sincere thanks to Prof. Dr. Toshinori Okuda, my external supervisor,
for giving me many useful advices during my research and throughout the period of
my six months’ attachment in the Graduate School of Integrated Art and Sciences,
Hiroshima University, Japan.
I must also express my heartfelt gratitude to Prof. Dr. Shatri Mansor, Prof.
Dr. Mohd Ibrahim Seeni Mohd and Assoc. Prof. Dr. Ab Latif Ibrahim (who kindly
sat on my viva voce panels) as well as Assoc. Prof. Dr. Md. Noor Kamaruddin
(chairman of the viva voce panel). They have all given me many kind and useful
advice during the viva voce for the improvement of my research.
I also wish to express my deepest appreciation to the staff of the Forest
Research Institute Malaysia, who have been helpful in providing me with census
data and assistance. I am truly indebted to the Universiti Teknologi Malaysia for the
award of the scholarship and the study leave granted to me, thus providing me such
a golden opportunity to pursue my post-graduate studies.
Last but not least, I wish to thank in particular my parents and my wife for
their unselfish and unfailing love, tender care, affectionate encouragement and
constant prayers. To all those whose names are too many to be mentioned here but
have rendered me their assistance in many wonderful ways during my research and
thesis writing, I also most sincerely acknowledge my thanks and gratitude.
V
ABSTRACT
The focus of this study is on vegetation species mapping using high spatial
resolution IKONOS-2 and digital Color Infrared (CIR) Aerial Photos (spatial
resolution 4 m for IKONOS-2 and 20 cm for CIR) and Hyperion Hyperspectral data
(spectral resolution 10 nm) in Pasoh Forest Reserve, Negeri Sembilan. Spatial and
spectral separability in distinguishing vegetation species were investigated prior to
vegetation species mapping to provide optimal vegetation species discrimination. A
total of 88 selected vegetation species and common timber groups of the dominant
family Dipterocarpaceae with diameter at breast height more than 30 cm were used
in this study, where trees spectra were collected by both in situ and laboratory
measurements of foliar samples. The trees spectra were analysed using first and
second order derivative analysis together with scatter matrix plot based on multi
objective optimization algorithm to identify the best separability and sensitive
wavelength portions for vegetation species mapping. Tn high spatial resolution data
mapping, both IKONOS-2 and CIR data were classified by supervised classification
approach using maximum likelihood and neural network classifiers, while the
Hyperion data was classified by spectral angle mapper and linear mixture modeling.
Results of this study indicate that only a total of ten common timber group of
dominant Dipterocarpaceae genus were able to be recognized at significant
divergence. Both high spatial resolution data (IKONOS-2 and CIR) gave very good
classification accuracy of more than 83%. The classified hyperspectral data at 30 m
spatial resolution gave a classification accuracy of 65%, hence confirming that
spatial resolution is more sensitive in identification of tree genus. However, for
species mapping, both high spatial and spectral remotely sensed data used are
marginally less sensitive than at genus level.
vi
ABSTRAK
Kajian ini memfokuskan pemetaan spesies tumbuhan dengan menggunakan
data resolusi spatial yang tinggi IKONOS-2 dan foto udara berdigit inframerah
berwama (CIR) (resolusi spatial 4 m bagi data IKONOS-2 dan 20 cm untuk CIR)
dan data Hyperion Hyperspectral (resolusi spektral 10 nm) di Hutan Simpanan
Pasoh, Negeri Sembilan. Untuk memberi perbezaan spesies tumbuhan yang
optimum, keupayaan pemisahan spatial dan spektral dikaji terlebih dahulu sebelum
pemetaan spesies tumbuhan dijalankan. Sejumlah 88 jenis spesies tumbuhan terpilih
dan tumbuhan dalam kumpulan balak umum untuk keluarga dominan
Dipterocarpaceae yang mempunyai diameter pada ketinggian paras dada lebih
daripada 30 cm telah digunakan di mana spektra pokok dikumpulkan dengan
penyampelan folia lapangan dan makmal. Untuk mengenalpasti pemisahan bahagian
panjang gelombang yang baik dan sensitif dalam pemetaan spesies tumbuhan,
spektra pokok dianalisis dengan analisa derivatif pertama dan kedua bersama dengan
plot matrik serakan berasaskan algoritma optimikasi multi-objektif. Dalam pemetaan
data resolusi spatial tinggi, data IKONOS-2 dan CIR dikelaskan dengan pendekatan
pengkelasan berpenyelia menggunakan pengkelas kemungkinan maksimum dan
rangkaian saraf manakala data Hyperion dikelaskan dengan pemeta spektra bersudut
dan model campuran berkadar langsung. Keputusan kajian ini menunjukkan bahawa
hanya sejumlah sepuluh jenis kumpulan balak umum dalam keluarga dominan
Dipterocarpaceae dapat dikenali dengan nyata perbezaannya pada peringkat genus.
Kedua-dua data resolusi spatial yang tinggi (IKONOS-2 dan CIR) memberi
ketepatan pengkelasan yang sangat baik, iaitu melebihi 83%. Data hyperspectal yang
telah dikelaskan pada resolusi spatial 30 m memberi ketepatan pengkelasan 65%,
maka disahkan bahawa resolusi spatial adalah lebih sensitif dalam mengenalpasti
genus pokok. Walau bagaimanapun, bagi pemetaan spesies, kedua-dua data remote
sensing yang mempunyai resolusi spatial dan spektral yang tinggi adalah kurang
sensitif jika berbanding dengan pemetaan tumbuhan pada peringkat genus.

TABLE OF CONTENTS
CHAPTER TITLE PAGE
DECLARATION ii
DEDICATION iii
ACKNOWLEDGEMENTS iv
ABSTRACT v
ABSTRAK vi
TABLE OF CONTENTS vii
LIST OF TABLES xi
LIST OF FIGURES xiii
LIST OF ABBREVIATIONS xix
LIST OF APPENDICES xxi
1 INTRODUCTION 1
1.1 Introduction 1
1.2 Importance of Vegetation Study 3
1.3 The Use of Remote Sensing Analysis in
Vegetation Studies 5
1.4 Problem Statement 7
1.5 Objectives of the Study 11
1.6 Scopes of the Study 12
1.7 Significance of Research 13
1.8 Study Area 14
1.9 Thesis Outline 17
2 LITERATURE REVIEW 18
2.1 Introduction 18
2.2 High Spatial Remote Sensing and Its Applications 18
2.3 Hyperspectral Remote Sensing and Its Applications 20
2.4 Remote Sensing in Vegetation Mapping 24
2.4.1 Spectral Characteristic of Vegetation 25
2.4.2 Spatial Characteristic of Vegetation 28
2.4.3 Modeling Canopy Reflectance 31
2.4.4 Temporal Characteristic of Vegetation 32
2.5 Inference on Previous Studies 34
2.6 Summary 42
3 DATA PREPARATION AND PRE-PROCESSING 47
3.1 Introduction 47
3.2 Data Acquisition 49
3.2.1 Remotely Sensed Data 49
3.2.1.1 High Spatial Remotely Sensed Data 49
3.2.1.2 Hyperspectral Remotely Sensed Data 56
3.2.1.3 Spectral Radiometer Data 58
3.2.2 Ancillary Data 58
3.3 Data Pre-processing 59
3.3.1 Radiometric Calibration using
Empirical Line Calibration Method 59
3.3.2 Geometric Correction and Data
Mosaicking 64
3.3.2.1 Geometric Rectification of
Hyperion Hyperspectral Data 65
3.3.2.2 Data Mosaicking 67
3.3.3 Clouds and Shadow Effects Masking 70
3.4 Image Enhancement of Hyperion
Hyperspectral Data 71
3.4.1 Minimum Noise Fraction 72
3.4.2 Pixel Purity Index 78
3.5 Census Data Plot of Study Area 81
3.5.1 Establish DBH to Crown Size Relationship 82
3.5.2 Derivative of Crown Data 85
3.6 Analysis and Discussion 88
3.7 Summary 90
4 CREATION AND ANALYSIS OF
SPECTRAL LIBRARY 91
4.1 Introduction 91
4.2 Role of Spectral Library in Hyperspectral Analysis 91
4.3 Creation of Spectral Library 92
4.3.1 Conceptual Design of Spectral Library 95
4.3.2 Creation of Spectral Library
by Field Campaign 96
4.3.3 Creation of Spectral Library
by Laboratory Analyses 99
4.3.4 Compiling of Spectral Library 103
4.4 Spectral Analysis and Discussion 107
4.4.1 Spectral Separability and Sensitivity Analyses 112
4.4.1.1 Spectral Separability by First and
Second Order Derivative Analysis 112
4.4.1.2 Spectral Separability by
Combination of Three or Four
Wavebands 115
4.4.1.3 Spectral Separability by
Scatter Matrix Plot Analyses 116
4.4.2 Compatibility Test of Spectral Library 125
4.4.3 Spatial Sensitivity Analysis 128
4.5 Summary 131
5 VEGETATION SPECIES MAPPING 132
5.1 Introduction 132
5.2 Vegetation Mapping using High Spatial Data 132
5.2.1 Vegetation Species Mapping using
Maximum Likelihood Classifier 133
5.2.2 Vegetation Species Mapping using
Neural Network Classifier 139
5.3 Vegetation Mapping using Hyperspectral Data 145
5.3.1 Feature Extraction from Hyperspectral Data 145
5.3.1.1 Band Selection 146
5.3.1.2 Feature Extraction 147
5.3.2 Spectral Angle Mapper 149
5.3.3 Linear Mixture Modelling 153
5.4 Classification Accuracy Assessment 157
5.5 Analysis and Discussion 161
5.6 Summary 164
6 CONCLUSIONS AND RECOMMENDATIONS 165
6.1 Conclusions 165
6.2 Recommendations 168
REFERENCES
Appendices A-B
169
190-211
xi
TABLE NO.
1.1
2.1
3.1
3.2
3.3
3.4
3.5
3.6
4.1
4.2
4.3
4.4
4.5
LIST OF TABLES
TITLE
The most important families for 50-ha plot of Pasoh
Forest Reserve
Summary of some vegetation and related studies done
using remote sensing techniques.
Specification of IKONOS-2 Data Used.
Detailed Specifications of the Z/I Imaging’s DMC.
Specification of ancillary data i.e. topographic maps
used in this study.
Summary of geometric correction control points used in
Hyperion data.
Eigenvalues for MNF bands.
DBH and mean crown area used to develop DBH-
crown size relationship for eight common species at
genus level.
Specifications of Spectroradiometer used in this study.
List of spectra collected from Pasoh Forest Reserve,
PFR according to family, genus and species.
List of spectra collected from 50-ha plot of Pasoh
Forest Reserve during second field campaign.
List of spectra collected from secondary forest, FRIM
during third field campaign.
Divergence analysis results of the scatter plots at
species and genus level.
PAGE
15
42
50
52
58
66
75
84
96
98
101
102
119

Lists of Species used in compatibility test of spectral
library.
Paired Samples Statistics of Spectra collected from
Pasoh Forest Reserve and FRIM, Kepong.
Paired samples correlations of selected vegetation
spectra collected from Pasoh Forest Reserve and FRIM,
Kepong
Paired sample test of selected vegetation spectra
collected from Pasoh Forest Reserve and FRIM,
Kepong.
Information extraction and classification accuracy with
different techniques used for high spatial resolution
data.
Information extraction and classification accuracy with
different techniques used for Hyperion hyperspectral
xiii
LIST OF FIGURES
FIGURES NO. TITLE
1.1 Study area; (a) location map, (b) the raw IKONOS
satellite image of the study area and (c) the detailed
plan of Pasoh Forest Reserve.
2.1 The hyperspectral concept.
2.2 Spectral reflectance characteristic of a healthy, green
vegetation for the wavelength interval 0.4-2.6 [j,m.
3.1 Data processing involved four main parts: (1) data
acquisition and preprocessing; (2) spectral
separability and sensitivity analysis, (3) building and
analysis of spectral library; and (4) vegetation species
mapping.
3.2 (a) and (b) Raw IKONOS-2 data, (c) Mosaiced
IKONOS data with which (d) the subset of the study
area are shown with clouds and its shadows being
masked in black color.
3.3 (a) optics frame, (b) mounting cameras on optics
frame, (c) camera sensors, (d) outlook view of camera
and (e) camera mounted on optics frame and (f) DMC
installed in airplane ready for data acquisition.
3.4 Flight index map for DMC mission over Pasoh Forest
Reserve.
3.5 Raw CIR data of study area- 50-ha plot of Pasoh
Forest Reserve in which Infra-red, Red, and Green
bands are loaded in RGB.
PAGE
16
21
26
48
51
53
54
55
3.6
3.7
3.8
3.9
3.10
3.11
3.12
3.13
3.14
3.15
3.16
3.17
3.18
XIV
(a) Raw Hyperion hyperspectral data, (b) subset of
Pasoh Forest Reserve (c) 50-ha plot of Pasoh Forest
Reserve in which bands 40, 31, 13 loaded in R, G, B. 57
Spectra extracted from reference and same target for
(a) dark area and (b) light area from Hyperion image. 60
Regression plot for reference and image spectra. 61
Image (a) before radiometric calibration and (b) after
radiometric calibration using Empirical Line
Calibration Method in which bands 40, 31, 13 were
loaded in R, G, B. 62
Spectra plots before and after radiometric calibration
for (a) plantation a, (b) plantation b, (c) forest a and
(d) forest b extracted from Hyperion image using
empirical radiometric calibration method. 63
Ground control points location selected from
Hyperion data. 65
Geometrically corrected Hyperion data in which
bands 40, 30, 13 are loaded in RGB. 67
Two sets of georeferenced IKONOS-2 images loaded
for mosaicking (scene pol4395_0000 loaded in green
frame and scene pol40395_0100 loaded in red
frame). 68
Two sets of IKONOS-2 data successfully mosaicked
in which bands 3, 2, 1 are loaded in RGB. 69
Mask built to IKONOS-2 data, in which the clouds
and shadow effects were being displayed in white
color. 70
IKONOS-2 image after masking out the clouds and
shadow areas. 71
The MNF process employed in this study. 74
MNF eigenvalues plot. 75

3.19
3.20
3.21
3.22
3.23
3.24
3.25
3.26
4.1
4.2
4.3
4.4
4.5
4.6
4.7
XV
The first six MNF Bands generated from MNF 76
Transformation for Hyperion data.
The PPI algorithm works by projecting points in the
data set onto random skewers. 79
Pixel Purity Index plot up to 100 000 iterations. 80
PPI result with white pixels representing pure
pixels. 81
The longest axis of crown and the longest axis
perpendicular to the first axis were measured
and the means were calculated to give the crown
size value in diameter. 83
Scatter plot and equation with coefficient of the
determination for the relationship between DBH
and crown size in Pasoh 50-ha plot. 85
Census plot of Pasoh 50-ha plot at genus level
for tree with DBH more than 30 cm. 86
Census plot has been converted into raster form
in various spatial resolutions to test its
sensitivity in spatial variation. 87
Methods employed for building the spectral library. 94
The data model of Spectral Library System of
featured vegetation species. 95
Field Spectral sampling configuration used in the
study. 97
Spectral sampling configuration used in the study. 99
Welcoming screen of spectral library. 103
Vegetation family selection screen of the spectral
library; in this demonstration, vegetation family
DIPTEROCARPACEAE is selected. 104
Vegetation genus selection screen of the spectral
library; in this example, vegetation genus Shorea was
selected. 104
4.8
4.9
4.10
4.11
4.12
4.13
4.14
4.15
4.16
4.17
4.18
4.19
XVI
Vegetation species selection screen of the spectral
library; in this example, vegetation species Multiflora
was selected. 105
Detailed spectral library plot for Shorea Multiflora. 106
Spectral plot of all 37 vegetation species of Pasoh
Forest Reserve acquired during field campaigns. 108
Spectra Plots of common timber species of Pasoh
Forest Reserve acquired during field campaigns. 109
Typical spectra plots of vegetation under various
sampling condition, to simulate natural sampling
environment analyses. 110
Spectra plots of Xerespernum noronhi showing that
mossy leaves gives higher reflectance values. 111
First order derivative (1/nm) of spectral reflectance
plot. 113
Second order derivative (1/nm) of spectral reflectance
plot. 114
Second order derivative (1/nm) of spectral reflectance
plot for genus Shorea. 114
The separability of genus Shorea analyzed by
choosing (a) three and (b) four bands combination. 115
Spectra plot for common timber groups of the
dominant family Diterocarpaceae with selected
wavelength portion, namely blue-green, green-peak,
yellow-edge, red-well and near infrared. 117
(a) Spectral matrix plot of common timber species of
the dominant family Diterocarpaceae of Pasoh Forest
Reserve at blue-green portions of wavelengths and
(b) closer zoom in of scatter matrix plot gives a
clearer view of good separability wavelengths. 120
4.20
4.21
4.22
4.23
4.24
4.25
5.1
5.2
5.3
5.4
5.5
XVll
(a) Spectral matrix plot of common timber groups of
the dominant family Diterocarpaceae of Pasoh Forest
Reserve at blue-green portions of wavelengths and
(b) closer zoom in of scatter matrix plot gives a
clearer view of good separability wavelengths. 122
Spectra plot of selected vegetation species collected
from Pasoh Forest Reserve and FRIM. 126
Spectra plot at leaf-scale for various vegetation
species 129
Leaf-scale spectra showing unhealthy leaves having
higher reflectance at visible and near infrared portion
of wavelength. 129
Leaf-scale vs. pixel-scale spectra plot for ELATTA
sp. 130
Spectra plot of ELATTA sp. at various scales. 130
Classification result of IKONOS-2 data for selected
vegetation species of Pasoh 50-ha plot (PFR) using
Maximum Likelihood Classifier. 135
Classification result of IKONOS-2 data for common
timber groups of the dominant family
Dipterocarpaceae in the Pasoh 50-ha plot (PFR) using
Maximum Likelihood Classifier. 136
Classification result of CIR data for selected
vegetation species of Pasoh 50-ha plot (PFR) using
Maximum Likelihood Classifier. 137
Classification result of CIR data for common timber
groups of the dominant family Dipterocarpaceae in
the Pasoh 50-ha plot (PFR) using Maximum 138
Likelihood Classifier.
Classification result of IKONOS-2 data for selected
vegetation species of Pasoh 50-ha plot (PFR) using
Neural Network Classifier. 141
5.6
5.7
5.8
5.9
5.10
5.11
5.12
5.13
5.14
Classification result of IKONOS-2 data for common
timber groups of the dominant family
Dipterocarpaceae in the Pasoh 50-ha plot (PFR) using
Neural Network Classifier.
Classification result of CIR data for selected
vegetation species of Pasoh 50-ha plot (PFR) using
Neural Network Classifier.
Classification result of CIR data for common timber
groups of the dominant family Dipterocarpaceae in
the Pasoh 50-ha plot (PFR) using Neural Network
Classifier.
20 vegetation classes successfully extracted from
Hyperion Image using Linear Discrimant Analysis.
Two dimensional example of the Spectral Angle
Mapper.
SAM classified Hyperion images for vegetation
genus classes with (a) 0.03, (b) 0.04, (c) 0.05, (d)
0.06, (e) 0.07 and (f) 0.08 spectral angles (radian).
Results of the unmixing analysis for endmembers (a)
Dacryodes, (b) Dipterocarpus, (c) Neobalanocarpus,
(d) Shorea, (e) Diypetes and (f) Euginia extracted
from Hyperion image of 50-ha plot of PFR. 155
Classification results from IKONOS-2 image
showing many pixels (highlighted area) nearby cloud
coverage have been wrongly classified as Shorea
class and contribute to lower accuracy if compared
with CIR data. 161
Classification results of Pasoh Forest Reserve 50-ha
plot for mapping selected vegetation species done by
(a) Maximum Likelihood Classifier and (b) Neural
Network Classifier, in which more unclassified area
were shown by Neural Network Classifier. 162
xviii
142
143
144
148
149
151

xix
APAR - Absorbed Photosynthetically Active Radiation
ASMS - Airborne Sensor Management System
BRDF - Bidirectional Reflectance Distribution Function
CASl - Compact Airborne Spectrographic Imager
CCD - Charge-Coupled Device
CIR - Colour Infrared
DBH - Diameter at Breast Height
DC - Dark Current
DMC - Digital Mapping Camera
DN - Digital Number
ETM+ - Enhanced Thematic Mapper Plus
FOV - Field-of-View
FRIM - Forest Research Institute Malaysia
GCP - Ground Control Point
GMT - Greenwich Mean Time
GPS - Global Positioning System
GRABS - Greenness Above Bare Soil
HRV - High Resolution Visible
II - Infrared Index
IFOV - Instantaneous Field-of-View
IR - Infrared
JERS - Japanese Earth Resources Satellite
JPL - Jet Propulsion Lab
LAI - Leaf Area Index
LDA - Linear Discriminant Analysis
LMM - Linear Mixture Modelling
MESSR - Multispectral Electronic Self-Scanning Radiometer
LIST OF ABBREVIATIONS
X X
MIR - Middle Infrared
MNF - Minimum Noise Fraction
MOS - Marine Observation Satellite
MSI - Moisture Stress Index
MSS - Multispectral Scanner
NASA - National Aeronautics and Space Administration
NIES - National Institute of Environmental Study
NIR - Near Infrared
NNC - Neural Network Classifier
OIF - Optimum Index Factor
PCA - Principal Components Analysis
PPI - Pixel Purity Index
PFR - Pasoh Forest Reserve
RMSE - Root Mean Square Error
ROI - Region of Interest
RWC - Relative Water Content
SAM - Spectral Angle Mapper
S/N - Signal-to-Noise
SAIL - Scattering by Arbitrarily Inclined Leaves
SAR - Synthetic Aperture Radar
SPOT - Satellite Pour l'Observation de la Terre
SWIR - Short-wave Infrared
TM - Thematic Mapper
USGS - United States Geological Survey
UTM - Universal Transverse Mercator
VNIR - Visible Near Infrared

LIST OF APPENDICES
APPENDIX
A
TITLE
Spectral Matrix Plot of Common Timber Species of the Dominant Family Dipterocarpaceae of Pasoh Forest Reserve
PAGE
190
B Spectral Matrix Plot of Common Timber Groups of the Dominant Family Dipterocarpaceae of Pasoh Forest Reserve 201
CHAPTER 1
INTRODUCTION
1.1 Introduction
Vegetation can be defined as plant life of a region (i.e. plant community),
which refers to land cover provided by plants without specific reference to any
structure, spatial extent, or any other specific botanical or geographical
characteristics (Jensen, 2000; Austin and Heyligers, 1991). Vegetation is broader
than the term flora which refers exclusively to species composition (Laubenfels,
1975). Vegetation is known to have a strong influence on land-atmosphere
interactions, and major changes in land cover, associated primarily with deforestation,
have been shown to have significant impacts on the local climate (Fuentes et al.,
2006). Vegetation is critical in local and global energy balances which helps in
regulating the flow of numerous biogeochemical cycles, including water, carbon, and
nitrogen.
Most people have an understanding that vegetation refers to forest, plantation
and grassland in which these terms conjure up an image of what such vegetation
looks like. However, ecologists discriminate vegetation structure at a much more
detailed level, whereby the vegetation structure is determined by an interacting
combination of environmental and historical factors, as well as species composition
(Kabat et al., 2004). In this study, the term vegetation is thus confined to the forest
vegetation that exists in the study area.
2
Vegetation studies over the forested area have become a great interest of
ecologists and scientists due to its importance in maintaining a sustainable biological
diversity in this complex ecosystem (Clark et al., 2005). Over 30 percent of the
Earth's surface is covered with forests, a community of plants, animals, and many
other micro-organisms with vegetation dominating the largest organism found on this
planet. Out of this 30 percent, 6.4 percent is covered by tropical rainforest. The
existing of tropical rainforest may not be so significant by looking at the percentage
of total forests exist on Earth but it maintain a large proportion of the world’s
biological diversity (Thomas et al., 2004; Whitmore, 1990). Tropical rainforest has
become the most notable storehouses of biological diversity on land, accumulating
two-thirds of known terrestrial species and protects the largest share of threatened
species. The type of forest in a given area depends on many elements, including the
climate, soil, water source, rainfall patterns, seed sources and human influence.
Forest can also be defined as a biological system with distinctively big numbers of
interrelationships of the living part of the environment (such as plants, animals and
micro-organisms) to each other and to the non-living, inorganic or abiotic parts (e.g.
soil, climate, water, organic debris, rocks) (Maarel, 2004).
The tropical rain forest of Malaysia is a highly complex ecosystem which is
rich and varied in plant and animal life. The forest maintains the environment
stability of the country and is a store house of plant and animal species in such a way
that their richness and diversity are considered as the centre of origin and diversity of
many present-day as well as future crop plants (Chin and Lai, 1993).
Vegetation studies, particularly the forests inventory and management,
including species richness mapping have always remained as an issue of concern by
all parties over the world (Revilla, 1994). It plays an important role in the economic
development of a country, generating much government revenues, especially in
terms of foreign exchange earnings, such as the development of local wood-based
and related industries and employment. The complex ecological relationships
involving forests could allow humans to benefit from them in a variety of ways (e.g.
processing the wood from trees, adopting nutrition from animals, making the forest
3
into a recreation park, as a medicinal source and so on) (WWF, 2005). The
importance of vegetation studies are further discussed in next section.
1.2 Importance of Vegetation Studies
Vegetation is one of the most important components in the biosphere.
Vegetation being the primary producer and capable of photosynthesis, its growth,
maintenance and development are sensitive to the environment. Therefore, it
provides evidence or clues for us to understand other processes of the ecosystem,
such as climate changes, carbon cycling, ecosystem evolution, and human-nature
interaction. Understanding the vegetation community (including its species richness
and evenness), alternations in vegetation phenological (growth) cycles, and
modifications in plant physiology and morphology also provide us with valuable
insight into the changing of climatic, geologic, and physiographic characteristics of
an area (Jensen, 2000).
The importance of vegetation study is getting more significant with the
establishment of the Kyoto Protocol. The Kyoto Protocol is a protocol to the United
Nations Framework Convention on Climate Change (UNFCCC or FCCC) and an
international environmental treaty produced at the United Nations Conference on
Environment and Development (UNCED) which is informally known as the Earth
Summit held in Rio de Janeiro, Brazil from 3-14 June 1992. During the convention,
the member countries (and Malaysia is one of the member countries) who signed the
treaty agreed and intended to achieve the "stabilization of greenhouse gas
concentrations in the atmosphere at a level that would prevent dangerous
anthropogenic interference with the climate system" (UNFCC, 2005). The Kyoto
Protocol establishes legally binding commitments for the reduction of four
greenhouse gases (carbon dioxide, methane, nitrous oxide, sulfur hexafluoride).
Vegetation plays an important role in reducing the emission of greenhouse gases and
the circulation of carbon (Smith, 2003). Wanner global temperatures which linked
directly to greenhouse gas emission may alter tree growth rates, recruitment and
4
mortality, thereby creating new assemblages of tree as global temperature increase
and extinction of some vegetation species (Laurance et al., 2004).
Some observations made have concluded that 80 percent of the nutrients in
the tropical ecosystem are in the vegetation and this should always be carefully
weighed in the design/formulation of forest management system in the tropics
(McGinley and Finegan, 2003; Mendoza et al., 1999; Prabhu et al., 1996). This
situation is more serious in cases where there is a danger of accelerated soil erosion
resulting in the loss of most nutrients in the soil, or, in the event where the original
vegetation has to give way to plantations (Zhang et al., 2003 and Revilla, 1994).
Tropical rainforest biodiversity is endangered by large scale (e.g., 10-500 ha)
deforestation and logging activities (Achard et al., 2002). Some vegetation species
are very sensitive to environmental changes. For example, wetland vegetation
species can be a good indicator of the environmental changes once the anticipated
biophysical parameters are determined. The importance of vegetation in biodiversity
has led to the concerns for forest inventories that include type of forest inventories
involving precision of estimates, accuracy of estimates, control of re-enumeration,
systematic sampling and monitoring of forest change.
Malaysia is fully aware of the need for effective forest management and
conservation, not only to ensure a sustained supply of timber but also to maintain
environmental stability, providing sanctuary for wildlife and to serve as an
invaluable storehouse of genetic resources useful for the improvement of its
indigenous tree species, agricultural crops and live stocks (Razak et al., 2002;
Appanah, 1999; Salleh and Musa, 1994). From individual crown to landscape scales,
vegetation in tropical rainforest has a dominant role in maintaining its rich
environment sustainability. Furthermore, vegetation of the tropical rainforest
represents a major pool of terrestrial carbon. In this instance, remote sensing can be
used as an effective tool to monitor, perform inventory mapping and detecting the
sustainable environment.
The growing needs to conserve and provide accurate information on forest
biophysical parameters implies the relative importance of different vegetation species,

5
their occurrence and distribution to be studied. Knowledge of vegetation species
composition and diversity is therefore the most useful tool in evaluating overall
species diversity and endemism in tropical forest, and it is critical for conservation
planning. Subsequently, there is a need to formulate sound management policies and
guidelines for the conservation of these species (Ashton, 1990). In order to meet this
need, remote sensing technology has been widely used in vegetation and its related
studies due to its advantages in wide coverage, cost effective and availability of multi
temporal archived data.
1.3 The Use of Remote Sensing Analysis in Vegetation Studies
According to Yamada (1997), the obstacles faced by foresters and ecologists
in studying the tropical rain forest can be categorized into three broad categories,
namely: 1) human factors, 2) natural factors and 3) biological factors. Among these
factors, one of the main problems in studying the tropical rain forest is accessibility.
This can be further explained as the understanding, monitoring and inventory
mapping of tropical rain forests are being influenced by a lack of spatially and
temporally extensive information on vegetation composition, species richness and
structure. Due to expensive costs and inaccessibility (as mentioned earlier), most
available data only comes from relatively small field plots with infrequent re
sampling intervals. With the existing plots, it is difficult to scale-up the field data to
the landscape, regional or global scales needed in sustainability analysis of
ecosystem in tropical rainforest (Tuomisto et al., 2003).
Since the launching of Landsat in 1972, remote sensing has become a
powerful means in providing data from which updated forest cover and related
information can be obtained. Passive remote sensing sensors provide multi-scale,
good spatial and temporal measurement of radiance from tropical rainforest canopies
which can be linked to species composition and richness mapping (Foody et al., 2006;
Nagendra, 2001). However, remote sensing studies in tropical rainforest have only
focused on the mapping of general forest cover classes for calculating the rate and
extent of regional deforestation and forest fragmentation relied upon medium spatial
6
resolution imagery from multispectral spacebome sensors due to the reasonable costs
and acceptable accuracy (Roberts et al., 2002; Steininger et al., 2001). Remote
sensing technology helps to resolve the accessibility problem as mentioned earlier in
mapping the forest vegetation species and its related studies with reasonable costs.
In vegetation studies that employ remote sensing techniques, two widely used
data are satellite and airborne colour infrared (CIR) images (Gould, 2000; Madden et
al., 1999; Welch, 1996). The first and second generation satellite data (i.e. the first
generation of satellite data refer to Landsat MSS and second generation of satellite
data refer to Landsat TM, SPOT HRV and other multispectral sensors with broad
bands spectral resolution ) mostly do not have adequate spatial resolution to
differentiate between detailed ground information. The airborne CIR images were
then used to complement the satellite data. Both of these data complement each other
when studying large areas where airborne data can be very costly to acquire, and are
mostly used when detailed studies involving smaller areas are of interest. However,
the complexity of the vegetation species composition in a tropical rainforest due to
high tree diversity and both natural and human disturbances results in complex
radiance signals that are difficult to discriminate using broad spectral and spatial
resolution sensors. Tn order to delineate vegetation properly, the recent high spatial
and hyperspectral remote sensing data therefore meet the needs in terms of both
spatial and spectral resolution.
A new generation of high spatial resolution multispectral sensor (less than 4
meters) permitted the mapping of individual tree crown at species level as a group of
image pixels (Gougeon & Leckie, 2003). Such advancement in remote sensing
technology could greatly improve multi-scale forest classifications of vegetation
species richness, habitat and disturbance history mapping. With the temporal data,
individual tree crown analyses may also provide a means to systematically monitor
changes in some special valuable species (e.g. common timber species) due to
logging and climate change. (Clark et al., 2004; Read et al., 2003 and Nagendra,
2001).

7
With the advancement in remote sensing technology, the development of
sensor has a great achievement in developing hand-held, airborne and spacebome
hyperspectral optical sensors which allow the spectral measurement over 50 narrow,
continuous bands spanning the visible (400 nm to 700 nm), near infrared (700-1327)
and two short wave infrared (1467-1771 nm and 1994-2435 nm respectively) regions
of electromagnetic spectrum (Asner, 1998). The automated vegetation classification
and species identification from tropical rainforest are now possible with
hyperspectral imagery which is fine enough in terms of spectral wise. However, the
accuracy may vary from different spatial resolution hyperspectral data and feature
extraction techniques used, which will be discussed in later chapters.
In Malaysia, the use of remote sensing techniques in mapping the tropical
rain forest has been explored since 1990s (Nuraznin and Hashim, 2007; Okuda et al.,
2004; Okuda et al., 2003; Hashim et al., 2002; Hashim et al, 1999; Khali et al., 1993,
Radzali, et al., 1992, Sawada et al., 1991). Series of researches had been earned out
by Forest Research Institute Malaysia (FRIM) with the aid of remote sensing
technology to extract forest and vegetation information. Khali et al. (1993) had
started a research at the North Selangor peat swamp forest to assess the forest
condition after logging by using remote sensing techniques. Landsat-TM data were
used and results showed that the peat swamp forest could be mapped using remote
sensing analysis and the area was differentiated into different classes of damage
severity and the area extent was calculated. (Khali et al, 1994). Because of the high
demand for assessing and monitoring vegetation change, vegetation observation has
long been an important application of remote sensing.
1.4 Problem Statement
Remote sensing is an important tool for measuring global biodiversity in
forest ecosystems. Remote sensing techniques offer to deliver structural information
about forest stands such as the nature of the canopy surface, the layering within the
canopy and even individual tree identification (Innes and Koch, 1998). In this study,
this information is being linked with ecological species information derived from
8
ground sampling to give estimates of species richness and distribution over much
larger scales than previously available.
Moderate spatial resolution systems such as Landsat TM are able to provide
valuable information on macro-level deforestation and fragmentation. It is used to
make measurements of ecosystem properties and correlate these properties with
‘invisible’ properties such as biodiversity and species distribution that serve as key
indicator of forest sustainable management. Since eight years ago, high resolution
remote sensing system with a spatial resolution finer than 4 m and spectral resolution
better than 10 nm are available commercially in the market. Tt provides detailed
information and shows great potential in providing information for many
applications especially in vegetation and its related studies. With the existence of the
new system, the ability to detect every single tree species, canopy structure and even
soil properties is now possible (Johnson, 2002; Newman et al. 1998).
However, the increase in spatial and spectral resolutions raises two common
issues for effective extraction of information in either high spatial or spectral
resolutions data respectively. In the case of high spatial resolution, the inherent
effectiveness of spatial information have somehow ensured ‘busyness’ or variation in
a ‘class of target’ hence preprocessing such as texture analysis need to be earned out
prior to information extraction (Schowengerdt, 2007). On the other hand, the high
spectral resolution such as found in hyperspectral data often face “Rayleigh
phenomenon” and problem in selecting optimum bands from the voluminous data set.
“Rayleigh phenomenon” refers to the fraction of light scattered are sensitive with the
narrow bands and sometimes give false information in interpreting the target object
(Borengasser et al., 2007). In selecting the optimum band for selected application,
the voluminous spectral resolution data will have a lot of redundancy. A total of
about 200 narrow bands may be available in hyperspectral data but only small
portion of narrow wavebands are useful (for example in case of vegetation species
recognition).
It appears that the advancement of high resolution system which provides
high spatial and hyperspectral data is having a dilemma - as the imagery is so
9
detailed that individual pixels often lose their representation of the landscape.
Consequently, a traditional pixel-based process becomes incapable due to
insufficient consideration of the rich amount of information on spatial and spectral
association. Vegetation information extraction, especially species mapping from high
spatial resolution imagery and hyperspectral remote sensing analysis is one of the
most important research topics in the field but not much effort has gone into this
topic so far, especially in tropical rainforest of this region.
Identification of individual crown species was traditionally performed by
using visual interpretation method from high spatial resolution aerial photographs
which are taken from film camera. New digital forms of high spatial resolution
imagery from airborne and spacebome multispectral sensors (i.e. Digital Color
Infrared Aerial photo and IKONOS-2 in this study) have stimulated the development
of automated techniques for individual crown species detection, delineation and
subsequent measurement of related information (Chubey et al. 2006). Automated
individual crown species identification from micro to macro (which can be further
explained as leaf to crown scale) algorithms have been optimized for species
mapping in some tropical forests, and it is not clear how these algorithms will
perform in tropical rainforest in Malaysia with high species diversity and complex
canopies. Consequently, this study is undertaken to further examine the algorithms
and techniques available for micro to macro level vegetation species mapping and to
suggest the algorithm and processing flow which would be suitable for use in tropical
rainforest region with some modifications of algorithm by selecting the suitable
spectral regions which were identified and tested in this study for the purpose of
species richness and forest health mapping. With all the selected algorithms and
techniques examined and tested using high spatial and hyperspectral remote sensing
analysis at micro level vegetation mapping, the challenge lies on how to implement
the best algorithm chosen for the macro-level analysis in order to enable large scale
biodiversity mapping so as to make full use of the algorithm for vegetation species
mapping and its related analysis.
There are some pre-processing requirements that should be first addressed
when applying the hyperspectral remote sensing analysis in vegetation species
10
mapping. These include the creation of a spectral library and the calibration of
hyperspectral data. A spectral library is needed to compare the spectra recorded by
the sensor to the spectra collected in the field work as a reference to find out the
endmember (known as class in multispectral analysis). Most of the spectral libraries
available created by Jet Propulsion Lab, (JPL) and United States Geological Survey,
(USGS) are more focused on geological study such as mineral exploration. Recently,
USGS has started developing spectral libraries for common vegetation types. In
Malaysia, a complete set of hyperspectral libraries has yet to be developed. Therefore,
to study Malaysian vegetations using hyperspectral data, a new set of spectral
libraries is needed. These libraries should be complete because different regions of
study may need a different spectral library to increase the accuracy of the study.
From the spectral library created, series of analysis need to be earned out to study the
separability of different species available in study area to make sure the species
identification at micro level (leaf scale) is possible and further scale-up the species
mapping to macro level (entire study area of this study).
With the doubts and problems discussed, it is worthwhile to carry out the
study and the detailed objectives and scope of this study are defined in the next two
sections.
11
The overall aim of this study is to perform vegetation species mapping in
tropical rainforest using high spatial resolution and hyperspectral remote sensing
analysis. In order to achieve the overall aim, the following sets of specific objectives
are formulated:
1 To create a spectral library for tropical rainforest and investigate the spectral
variation among tropical rainforest vegetation species, thereby permitting
spectral-based species discrimination;
2 To identify the spectral regions and spatial scale which provide optimal
vegetation species discrimination by the analysis of spatial and spectral
separability and variability in distinguishing vegetation species using high
spatial and hyperspectral remote sensing analysis;
3 To examine and identify the existing techniques in vegetation species
mapping of tropical rainforest and develop an analytical procedure to perform
species mapping of tropical rainforest using high spatial resolution and
hyperspectral remote sensing analysis;
1.5 Objectives of the Study
4 To perform accuracy assessment on results obtained in objectives (1), (2) and
(3) as compared to baseline information by using statistical approaches.
12
The scopes of the study are as follows:
1. Vegetation species mapping in this study is confined to the identification
of different types of vegetation, which means counting of the number of
different type of plants in the study area by mapping the vegetation
community in species, genus or family. The vegetation species mapping
in this study is further confined to big families (at least 100 trees in each
genus that existed in the study area with diameter at breast height, DBH >
30 cm). Trees with DBH larger than 30 cm were used so as to ensure that
the top layer of the canopy can be analysed by using remotely sensed data.
In addition to this, common timber species available in the study area will
also be identified.
2. The high spatial resolution remotely sensed data used in the study is
confined to multispectral IKONOS-2 data with 4 m spatial resolution and
digital color infrared aerial photo by Z/I Imaging’s Digital Mapping
Camera with 20 cm spatial resolution. Hyperspectral remotely sensed data
used in this study are confined to Hyperion (provides 220 continuous
spectral bands ranging in wavelength from 0.4 |im to 2.4 |im with spatial
resolution of 30 m). More details will be given in Chapter 3 on Data
Acquisition, Preprocessing and Data Enhancement.
3. The study area is confined to tropical rainforest located in Pasoh Forest
Reserve (PFR) 50 ha plot which contains 335,240 trees in 814 species,
290 genus and 78 families. On a per hectare basis, the species diversity of
trees at Pasoh is comparable with those recorded anywhere in the world
species-rich tropical rain forest similar to many seasonal forests of
Malaysia. The availability and continuous census used as ground truth is
the important selection factor apart from the scientific documents on tree
species mapping undertaken.
1.6 Scopes of the Study
13
The monitoring, conservation and management of tropical rainforests has
become a great challenge due to lack of spatially and temporally extensive
information on tree floristic composition and vegetation species mapping (Foody et
al., 2006 and Tuomisto et al., 2003). The vegetation species distribution map can be
an important tool for understanding the extent and pattern of old growth forests,
predicting rare plant habitat, modelling the spread of invasive species, and modelling
how vegetation might change under various climate change scenarios (Clark et al.,
2005). The introducing of high spatial resolution and hyperspectral remote sensing
provided a good solution in vegetation species mapping which was done earlier in
relatively small field plots with infrequent re-sampling intervals but involved
prohibitive costs and inaccessibility problems. Thus, this study is earned out to
perform vegetation species mapping of tropical rainforest using high spatial and
hyperspectral remotely sensed data. Furthermore such a study have not being
reported for tropical rainforest species or even at genus level due to the remoteness,
dense, complex multi-storey canopies.
Spectral library of tropical rainforest species even for common timber species
have not been reported to be available. Lack of this basic information, have cause
major set-back for not enabling hyperspectral data to be classified optimally at full
capacity to derive absolute forest information. Worst still, even the fine resolution
hyperspectral airborne data is only being relatively classified due to lack of the
spectral library. This study have successfully created spectral library which consists
of common timber species of the dominant family Dipterocarpaceae; thereby would
serve as baseline information for vegetation species identification in any tropical
rainforest of this region by using hyperspectral remote sensing analysis.
This study has also placed contribution to the assessment of the spatial and
spectral sensitivity of high spatial resolution and hyperspectral remotely sensed data
in mapping the vegetation species in tropical rainforest. In particular whole
electromagnetic spectrum from 400-1200 nm have been explored and had
successfully identified the wavelengths as well as spectral band for identification of
1.7 Significance of Research
14
all common timber groups of the dominant family Dipterocarpaceae. This
information is very vital for any mission and design of future sensing systems
including satellite for forestry and related vegetation studies in tropical rainforest.
Apart from the above, this thesis has also significantly contribute to new
knowledge on understanding of the vegetation species mapping and determine the
advantages and limitations of high spatial and hyperspectral remote sensing analysis
in vegetation species mapping in tropical rainforest environment. This research thus,
produces a series of accurate vegetation distribution maps of vegetation in genus and
species level for Pasoh Forest Reserve.
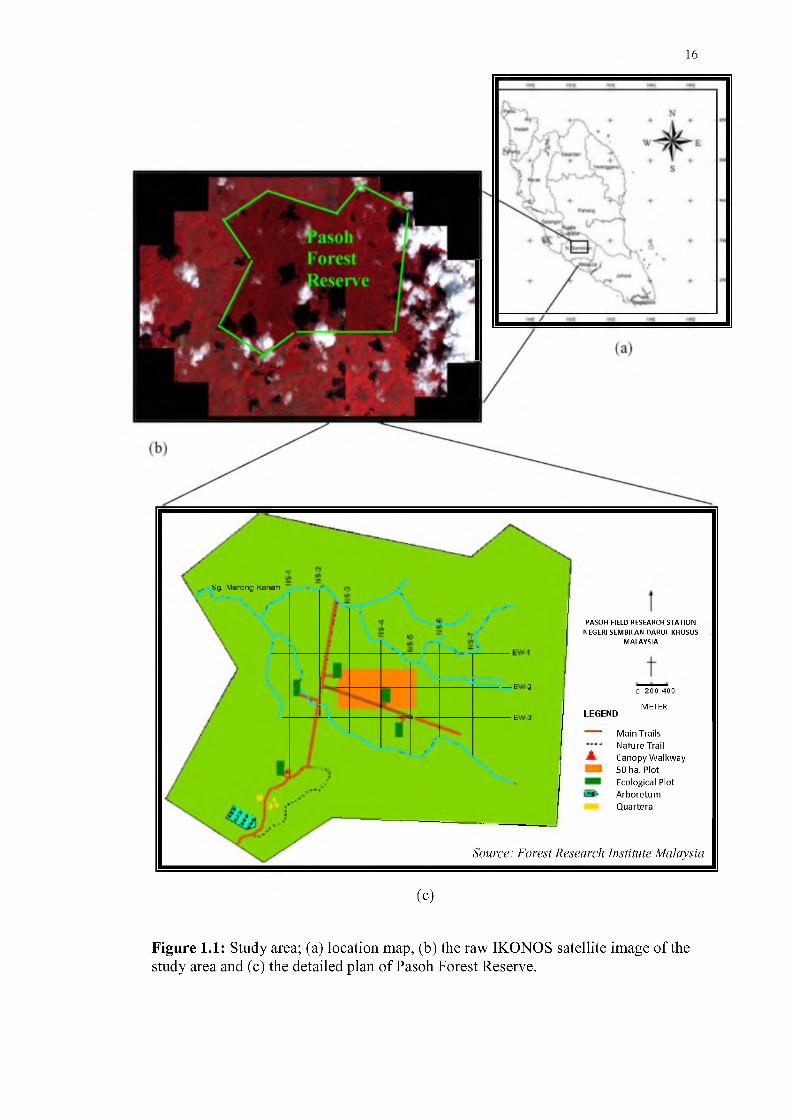
1.8 Study Area
The area of this study is confined to Pasoh Forest Reserve which located at 2°
55' N latitude and 102° 18' E longitude, about 8 km from the town of Simpang
Pertang, Negeri Sembilan, approximately 70 km southeast of Kuala Lumpur (Figure
1.1). The Pasoh Forest Reserve comprises of low hills and alluvium rising to a
granite ridge along its eastern border. A buffer zone of 700 ha within the western
and southern margins was logged in the 1950s. The study area was further confined
to 50-ha plot 1 km long by 0.5 km wide of Pasoh Forest Reserve. The plot was
established between 1985 and 1988 for research purposes. The first detailed
descriptions of the forest botany and stand structure were published in 1990
(Kochummen et al., 1990; Manokaran and LaFrankie 1990). The enumeration
included all free standing trees and shrubs > 30 cm diameter-at-breast-height (DBH)
excluding climbers. According to the details by which the plot was first surveyed, the
50-ha plot contains 335 240 trees in 814 species, 290 genus and 78 families. In 2000,
another detailed survey was carried out and there were 338 924 trees in 818 species
in 295 genus and 81 families. The number of trees has increased and the variety of
the vegetation community in the 50-ha plot of Pasoh Forest Reserve is enough to
represent any other tropical rain forest available within this region (Okuda et al.,
2003).
15
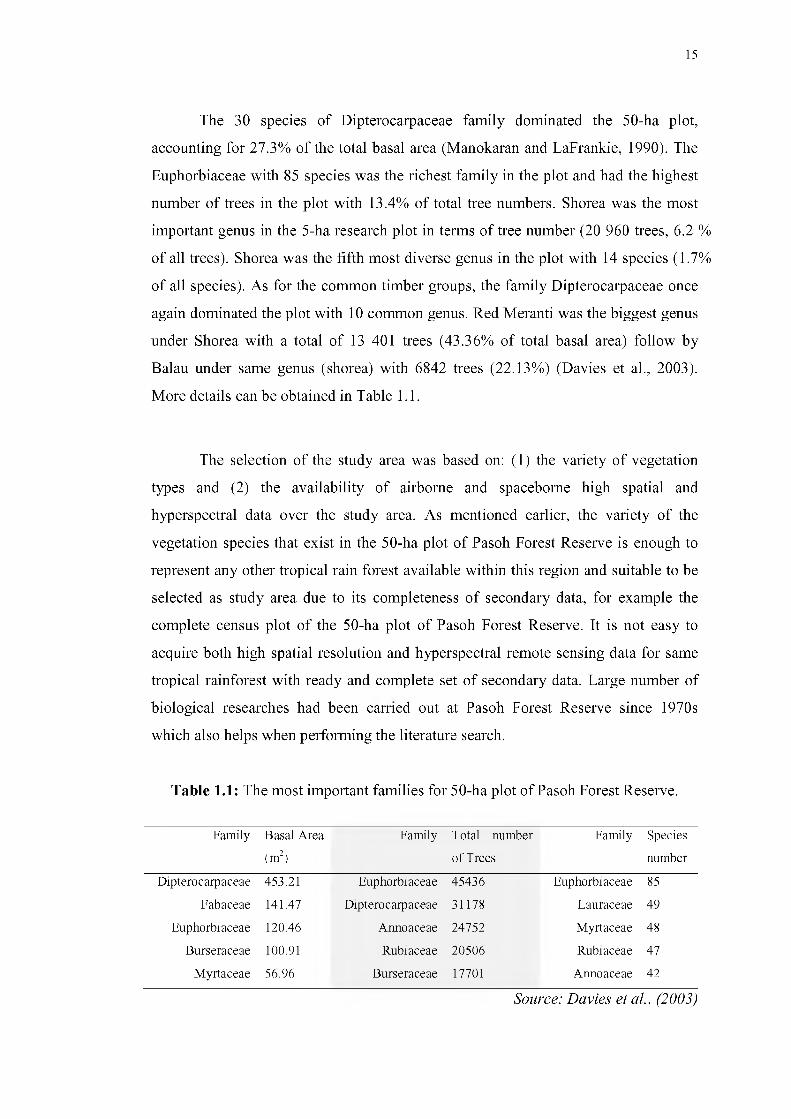
The 30 species of Dipterocarpaceae family dominated the 50-ha plot,
accounting for 27.3% of the total basal area (Manokaran and LaFrankie, 1990). The
Euphorbiaceae with 85 species was the richest family in the plot and had the highest
number of trees in the plot with 13.4% of total tree numbers. Shorea was the most
important genus in the 5-ha research plot in terms of tree number (20 960 trees, 6.2 %
of all trees). Shorea was the fifth most diverse genus in the plot with 14 species (1.7%
of all species). As for the common timber groups, the family Dipterocarpaceae once
again dominated the plot with 10 common genus. Red Meranti was the biggest genus
under Shorea with a total of 13 401 trees (43.36% of total basal area) follow by
Balau under same genus (shorea) with 6842 trees (22.13%) (Davies et al., 2003).
More details can be obtained in Table 1.1.
The selection of the study area was based on: (1) the variety of vegetation
types and (2) the availability of airborne and spacebome high spatial and
hyperspectral data over the study area. As mentioned earlier, the variety of the
vegetation species that exist in the 50-ha plot of Pasoh Forest Reserve is enough to
represent any other tropical rain forest available within this region and suitable to be
selected as study area due to its completeness of secondary data, for example the
complete census plot of the 50-ha plot of Pasoh Forest Reserve. It is not easy to
acquire both high spatial resolution and hyperspectral remote sensing data for same
tropical rainforest with ready and complete set of secondary data. Large number of
biological researches had been earned out at Pasoh Forest Reserve since 1970s
which also helps when performing the literature search.
Table 1.1: The most important families for 50-ha plot of Pasoh Forest Reserve.
Family Basal Area
(m2)
Family T otal number
of Trees
Family Species
number
Dipterocarpaceae 453.21 Euphorbiaceae 45436 Euphorbiaceae 85
Fabaceae 141.47 Dipterocarpaceae 31178 Lauraceae 49
Euphorbiaceae 120.46 Annoaceae 24752 Myrtaceae 48
Burseraceae 100.91 Rubiaceae 20506 Rubiaceae 47
Myrtaceae 56.96 Burseraceae 17701 Annoaceae 42
Source: Davies et al., (2003)
16
Sg. Msrong Kanan
5W 2
EW 3
PASOH FIELD RESEARCH STATION NEGERI SEMBILAN DARUL KHUSUS
MALAYSIA
LEGEND
0 2 0 0 400
METER
Main Trails Nature Trail Canopy Walkway 50 ha. Plot Ecological Plot Arboretum Quartera
Source: Forest Research Institute Malaysia
(c)
Figure 1.1: Study area; (a) location map, (b) the raw IKONOS satellite image of the study area and (c) the detailed plan of Pasoh Forest Reserve.
17
1.9 Thesis Outline
This thesis comprises of six chapters. Chapter 1 explains the research
background of the study and gives the problem statement, objectives and scope of the
study. The review of the high spatial and hyperspectral remote sensing techniques,
together with its applications and works previously done using remote sensing
techniques for vegetation and its related studies are addressed in Chapter 2. The
literature review on vegetation mapping, especially on vegetation health mapping
and species richness mapping (identification of different vegetation species), are also
addressed in this chapter. In Chapter 3, preparation of two sets of high spatial and
hyperspectral remote sensing data and pre-processing employed in the study are
discussed. Data preparation includes the collection of field and image spectra for
spectral library. All the pre-processing works including radiometric calibration,
geometric correction and data mosaic, data masking, and image enhancements
(Minimum Noise Fraction and Pixel Purity Index), which need to be done prior to
feature extraction and data classification of vegetation species mapping, are also
presented in this chapter. Chapter 4 presents the flow for creating a spectral library
for different vegetation species available in the study area, which will be used later in
the hyperspectral data processing. The sensitivity of high spatial resolution data and
hyperspectral remote sensing data used in this study were also analysed in the same
chapter. The feature extraction process and data classification, which are canned out
using different approaches (i.e. Band Selection Feature Extraction, Spectral Angle
Mapper, and Linear Mixture Modelling for hyperspectral data) on hyperspectral data
(neural network classifier and maximum likelihood for high spatial data) are
discussed in Chapter 5. Results and analyses of the feature extraction and
classification of the vegetation are also presented and discussed in this chapter.
Conclusions of the research and recommendations for future work are given in
Chapter 6.

REFERENCES
Aardt, J. A. N. and Wynne, R. H. (2007). Examining Pine Spectral Separability
using Hyperspectral Data from an Airborne Sensor: An Extension of Field-based
Results. International Journal o f Remote Sensing. Vol. 28 (2), pp. 431-436.
Achard, F., Eva, H. D., Stibig, H. J., Mayaux, P., Gallego, J. and Richards, T. (2002).
Determination of Deforestation Rates of the World’s Humid Tropical Forests.
Science. Vol. 297(5583), pp. 999- 1002.
Asner, G. P. (1998). Biophysical and Biochemical Sources of Variability in Canopy
Reflectance. Remote Sensing o f Environment. Vol. 64(3), pp. 234-253.
Appanah, S., Ismail Harun, P.F. Chong and M. Kleine (1999). Internal Assessment
Procedures fo r Sustainable Forest Management in Malaysia -Consultancy
Report to the Forest certification Project (GTZ). Kuala Lumpur, Malaysia.
Aschbancher, J., Often, R. S., Delsol, J. P., Suselo, T. B., Vibulsresth, S. and
Charrupat, T. (1995). An Integrated Comparative Approach to Mangrove
Vegetation Mapping using Remote Sensing and GTS Technologies: Preliminary
Results. Hydrobiologia. Vol. 295, pp. 285-294.
Ashton, P. (1990). Plant and Conservation in Tropical Asia. International
Conference on Conservation o f Tropical Biodiversity in Harmony with Nature.
12-16 June, 1990.
170
ASTER Spectral Library (2008). ASTER Digital Spectral Library. Retrieved on 7
June 2008, from http://astemeb.jpl.nasa.gov/.
Atkinson, P. M. (1993). The Effect of Spatial Resolution on the Experimental
Variogram of Airborne MSS Imagery. International Journal o f Remote Sensing,
Vol. 14, pp. 1005-1011.
Atkinson, P. M., Dunn, R., & Harrison, A. R. (1996). Measurement Error in
Reflectance Data and its Implications for Regularizing the Variogram.
International Journal o f Remote Sensing. Vol. 17, pp. 3735-3750.
Austin, M. P. and Heyligers, P. C. (1991). Vegetation Survey Design, a New
Approach: Gradsect sampling. In Nature Conservation: Cost Effective Biological
Surveys and Data Analysis. Proceedings o f CONCOM Workshop eds. C.R.
Margules and Austin, M.P., pp. 31-36.
Beaudemin, M. and Fung, K. B. (2001). On Statistical Band Selection for Image
Visualisation. Photogrammetric Engineering and Remote Sensing. Vol. 67(5),
pp. 571-574.
Bernstein, R., (1983). Image Geometry and Rectification. Manual o f Remote
Sensing. R. N. Colwell, ed., Bethesda, MD: American Society of
Photogrammetry, l,p p . 875-881.
Boardman J.W. (1989). Inversion of Imaging Spectrometry Data Using Singular
Value Decomposition. Proceedings, IGARSS ’89, 12th Canadian Symposium on
Remote Sensing. Vol. 4, pp. 2069-2072.
Boardman J. W., and Kruse, F. A. (1994). Automated Spectral Analysis: A Geologic
Example Using AVIRIS Data. North Grapevine Mountains, Nevada.
Proceedings, Tenth Thematic Conference on Geologic Remote Sensing. Ann
Arbor, MI: Environmental Research Institute of Michigan.
171
Boardman, J. W., Kruse, F. A. and Green, R. O. (1995). Mapping Target Signatures
via Partial Unmixing of AVIRIS Data. In Summaries, Fifth JPL Airborne Earth
Science Workshop. JPL Publication 95-1, Vol. 1.
Borengasser, M., Hungate, W. S. and Watkins, R. (2007). F[yperspectral Remote
Sensing Principles and Applications. CRC Press, Taylor & Francis Group.
Brown, L. and G. Borstad (1999). Mapping Wetland Breeding Habitats in the
Frazier River Delta, Backscatter. Association o f Marine Remote Sensing. Vol.
10(1), pp. 8-11.
Buckingham R., Staenz K, and Hollinger A (2002). Review of Canadian Airborne
and Space Activities in Hyperspectral Remote Sensing, Canadian Aeronautics
and Space Journal. Vol. 48, No. 1, March 2002 Vol. 48, No. 1.
Campbell, J.B. (1996). Introduction to Remote Sensing. Second edition. New York:
The Guildford Press.
Castro, E., K. L., Sa'nchez-Azofeifa, G. A. and Caelli, T. (2004). Discrimination of
Lianas and Trees with Leaf-level Hyperspectral Data. Remote Sensing o f
Environment. Vol. 90, pp. 353-372.
Center for the Study of Earth from Space (CSES) (1992). SIPS User’s Guide, The
Spectral Image Processing System. University of Colorado, Boulder. Vol. 1.1,
p. 74.
Chen, S. S., Fang; L. G., Liu, Q. H., Chen, L. F., Tong, Q. X. (2005). The Design
and Development of Spectral Library of Featured Crops of South China. IEEE
Transactions on Geoscience and Remote Sensing. Volume 2(25-29), 4 pp.
Chin. T. Y and Lai F.S. (1993). Challenges in Planning and Managing Forest
Catchments in Peninsular Malaysia. International Symposium on Management o f
Rivers fo r the Future, 16-18 Nov 1993, Kuala Lumpur.
172
Chubey, M. S., Franklin, S. E., & Wulder, M. A. (2006). Object-oriented Analysis
of IKONOS-2 Imagery for Extraction of Forest Inventory Parameters.
Photogrammetric Engineering and Remote Sensing. Vol. 72, pp. 383-394.
Clark, D. B., Read, J. M., Clark, M. L., Murillo Cruz, A., Fallas Dotti, M., and Clark,
D. A. (2004). Application of 1-m and 4-m Resolution Satellite Data to Studies of
Tree Demography, Stand Structure and Land-use Classification in Tropical Rain
Forest Landscapes. Ecological Applications. Vol. 14(1), pp. 61-74.
Clark, R.N., Swayze, G.A., Wise, R., Livo, E., Hoefen, T., Kokaly, R., Sutley, S.J.
(2007), USGS Digital Spectral Library SPLIB06A. U.S. Geological Survey,
Digital Data Series 231.
Clark, M. L., Roberts, D. A., Clark, D. B. (2005). Hyperspectral Discrimination of
Tropical Rain Forest Tree Species at Leaf to Crown Scales. Remote Sensing o f
Environment. Vol. 96, pp. 375 -398.
Clark, R. N., Swayze, G. A., Gallagher, A., King, T. V. and Calvin, W. M. (1993).
The U. S. Geological Survey, Digital Spectral Library 0.2 to 3[j,m. Li. S.
Geological Survey Open File Report, pp. 93-592.
Clark, R. N., King, T. V. V., Klejwa, M., and Swayze, G. A. (1990). High Spectral
Resolution Spectroscopy of Minerals. Journal o f Geophysical Research. Vol. 95,
No. B8,pp. 12653 - 12680.
Cleveland, William and Marylyn M. G. (1988). Dynamic Graphics fo r Statistics,
Wadsworth & Brooks.
Cochrane, M. A. (2000). Using Vegetation Reflectance Variability for Species Level
Classification of Hyperspectral Data. In ternational Journal o f Remote Sensing,
Vol. 21(10), pp. 2075-2087.
173
Conel, J. E.., Green, R.O., Vane, G., Bruegge, C. J., Alley, R E ., and Curtiss, B., J.,
(1987). Airborne Imaging Spectrometer-2: Radiometric Spectral Characteristic
and Comparison of Ways to Compensate For the Atmosphere. Proceedings o f
SPIE. Vol. 834, pp. 140-157.
Congalton, R., K. Birch, R. Jones, and J. Schriever (2002). Evaluating Remotely
Sensed Techniques for Mapping Riparian Vegetation. Computers and
Electronics in Agriculture. Vol. 37. pp. 113-126.
de Kok R., Schneider T., & Ammer U. (1999). Object-oriented Classification and
Applications in the Alpine Forest Environment. International Archives o f
Photogrammetry and Remote Sensing. Vol. 32, Part 7-4-3 W6, 3-4 June 1999,
Valladolid, Spain.
Danson, F. M. (1998). Teaching the Physical Principles of Vegetation Canopy
Reflectance using SAIL Model. Photogrammetric Engineering & Remote
Sensing. Vol 64(8), pp. 8010-812.
Daughtry, C.S.T. (2001). Discriminating Crop Residues from Soil by Short-Wave
Infrared Reflectance. Agronomy Journal. Vol. 93, pp. 125-131.
Davies S. J., Supardi, N Md. N, LaFrankie J. V. and Ashton P. S. (2003). The Trees
of Pasoh Forest: Stand Structure and Floristic Composition of the 50-ha Forest
Research Plot, Pasoh. Ecology o f Lowland Rain Forest in Southeast Asia.
Springer pp. 35-50.
Debinski, D. M., and Humphrey, P. S. (1997). An Integrated Approach to Biological
Diversity Assessment. Natural Areas Journal. Vol. 17, pp. 355-365.
Duchene, J. and Leclercq, S., (1988). An Optimal Transformation for Discriminant
and Principal Component Analysis. IEEE Transactions on Pattern Analysis and
Machine Intelligence. Vol. 10(6), pp. 978-983.
174
EO-1-NASA Web (2008). Earth Observation Mission 1. Retrieved on 15 August,
2008, from http://eol.gsfc.nasa.gov/.
ESA Earthnet (2007). IKONOS-22 Third Party Mission. Retrieved on 17 March,
2007, from http://earth.esa.int/object/index.cfm?fobjectid=5097.
Foody, G.M. and Cutler, M.E.J. (2006). Mapping the Species Richness and
Composition of Tropical Forests from Remotely Sensed Data with Neural
Networks. Ecological Modelling. Vol. 195, pp. 37-42.
Forsyth, F., G. Borstad, W. Homiak, and L. Brown (1998). Prince Rupert Intertidal
Habitat Inventory Project. Unpublished Report to Prince Rupert Port
Corporation, the Canadian Department o f Fisheries and Oceans, and the City o f
Prince Rupert.
Franklin, S. E. (1994). Discrimination of Subalpine Forest Species and Canopy
Density Using Digital CASI, SPOT PLA, and Landsat TM Data.
Photogrammetric Engineering and Remote Sensing. Vol. 60, pp. 1233-1241.
Frohn, R. C. (1998). Remote Sensing fo r Landscape Ecology. Boca Raton, FL:
Lewis Publishers, 99 pp.
Fuentes, D. A., Gamon, J. A., Cheng, Y. F., Helen C., Claudio, Qiu, H. L., Mao, Z.
Y. Sims, D. A., Rahman, A. F., Oechel, W., Luo, H. Y. (2006). Mapping Carbon
and Water Vapor Fluxes in a Chaparral Ecosystem Using Vegetation Indices
Derived from AVIRIS. Remote Sensing o f Environment. Volume 103, Issue
3, p p .312-323.
Fung, T., Ma, F. Y. and Siu, W. L. (1998). Hyperspectral Data Analysis for
Subtropical Tree Species Recognition. Symposium Proceedings, IGARSS ’98,
Sensing and Managing the Environment, Vol. 3, pp. 1298- 1300.

175
Gat, N., Subramanian, S., Barhen, J., Toomarian, N. (1997). Spectral Imaging
Applications: Remote Sensing, Environmental Monitoring, Medicine, Military
Operations, Factory Automation, and Manufacturing. Proceedings o f SPIE. Vol.
2962, pp. 63-77.
Gates, D. M., Keegan, J. J., Schleter, J. C. and Weidner, V. R. (1965), Spectral
Properties of Plants, Applied Optics. Vol. 4(1), pp. 11-20.
Gausman, H. W. (1985). Plant Leaf Optical Properties in Visible and Nearinfrared
Light. Lubbock, Texas’ Texas Tech Press.
Gaussmann, H. W., Allen, W. A. and Cardenas, R. (1969). Reflectance of Cotton
Leaves and their Structure. Remote Sensing o f Environment. Vol. 1, pp. 110-22.
Goel, N. S. (1988). Modes of Vegetation Canopy Reflectance and their Use in
Estimation of Biophysical Parameters from Reflectance Data. Remote Sensing
Review. Vol. 4, pp. 1-212.
Goetz, S. J., Wright, R., Smith, A. J., Zinecker, E.,& Schaub, E. (2003). IKONOS
Imagery for Resource Management: Tree Cover, Impervious Surfaces and
Riparian Buffer Analyses in the Mid-Atlantic Region. Remote Sensing o f
Environment. Vol. 88, pp. 195-208.
Goetz, A. F. H., and Srivastava, V. (1985). Mineralogical Mapping in the Cuprite
Mining District, Nevada. Proceedings o f the Airborne Imaging Spectrometer
Data Analysis Workshop. JPL Publication 85-41, Jet Propulsion Laboratory,
Pasadena, CA, pp. 22-29.
Gong P., Pu, R. and Yu, B. (1997). Conifer Species Recognition: An Exploratory
Analysis of In Situ Hyperspectral Data. Remote Sensing o f Environment. Vol.
62, p p .189-200
176
Gougeon, F. A., & Leckie, D. G. (2003). Forest Information Extraction from High
Spatial Resolution Images using an Individual Tree Crown Approach.
Information Report BC-X-396. Victoria, British Columbia, Canadian Pacific
Forestry Centre, Canadian Forest Service.
Gould, W. (2000). Remote Sensing of Vegetation, Plant Species Richness, and
Regional Biodiversity Hotspots. Ecological Applications, Vol. 10, No. 6, pp.
1861-187
Goward, S. N., Huemmrich, K. F. and Waring, R. H. (1994). Visible-near Infrared
Spectral Reflectance of Landscape Components in Western Oregon. Remote
Sensing o f Environment. Vol. 47, pp. 190-203.
Grant, L. (1987). Diffuse and Specular Characteristics of Leaf Reflectance. Remote
Sensing o f Environment. Vol. 22, pp. 309-322.
Green, A. A., Berman, M., Switzer, P, and Craig, M. D. (1988). A Transformation
for Ordering Multispectral Data in terms of Image Quality with Implications for
Noise Removal. IEEE Transactions on Geoscience and Remote Sensing. Vol.
26, No. l,p p . 65-74.
Green E.P., C.D. Clark, A.J. Edwards and A.C. Ellis (1998). Remote Sensing
Techniques for Mangrove Mapping. International Journal o f Remote Sensing.
Vol. 19, No. 5, pp. 935-956.
Gregory, P. A., Martin, R. E. (2008). Spectral and Chemical Analysis of Tropical
Forests: Scaling from Leaf to Canopy Levels. Remote Sensing o f Environment.
Volume 112, Issue 10, pp. 3958-3970.
Guerric, M., Francois, C., Soudani, K., Berveiller, D., Pontailler, J., Breda, N.,
Genet, H., Davi, H., Dufrene, E. (2008). Calibration and Validation of
Hyperspectral Indices for the Estimation of Broadleaved Forest Leaf Chlorophyll
Content, Leaf Mass per Area, Leaf Area Index and Leaf Canopy Biomass.
Remote Sensing o f Environment. Volume 112, Issue 10, pp. 3846-3864.
177
Hashim, M., Yoshida, K., Adachi, N., Okuda, T., and Bonkik, M. (2002). Applying
the Geographical Information System to Evaluate Land Use Options: Oil Palm
Plantation versus Tropical Forests in the Pasoh Forest Region. Annual Meeting
o f NIES-FFPRI-FRIM Joint Research Project- Toward the Sustainable
Management o f Tropical Rainforest. January 2002. Tsukuba, Japan.
Hashim, M., Wan Kadir, W. H. and Lee, K. Y. (1999). Global Rainforest Mapping
Activities in Malaysia (GRFM): Radar Remote Sensing for Forest Survey and
Biomass Indicators. Principal Investigator Report fo r Contract Research in
GRFM. Remote Sensing Centre of Japan, National Aerospace Administration of
Japan (NASDA).
Hay, G. J., Castilla, G., Wulder, M.,& Ruiz, J. R. (2005). An Automated Object
Oriented Approach for the Multiscale Image Segmentation of Forest Scenes.
International Journal o f Applied Earth Observation and Geoinformation. Vol. 7,
pp. 339-359.
Heiden, U., Segl, K., Roessner, S. and Kaufmann, H. (2007). Determination of
Robust Spectral Features for Identification of Urban Surface Materials in
Hyperspectral Remote Sensing Data, Remote Sensing of Environment. Vol. I l l ,
pp. 537-552
Huete, A. and Justice, C. (1999). Modis Vegetation Index (MOD 13) Algorithm
Theological Basis Documents, Greenbelt: NASA Goddard Space Center.
Retreived from http://modarch.gsfc.nasa.gov/MODIS/LAND/#vegetation-
indicies, 129 pp.
Innes, J. L. and Koch, B. (1998). Forest Biodiversity and its Assessment by Remote
Sensing. Global Ecology and Biogeography. Vol 7(6), pp. 397-419.
Jacquemoud, S., Baret, F., Andrieu, B., Danson, F. M. And Jagard, K. W. (1995).
Extraction of Vegetation Biophysical Parameteres by Inversion of PROSPECT+
SATL Models on Sugar Beet Canopy Reflectance Data: Application to TM and
AVIRIS Sensors. Remote Sensing o f Environment. Vol. 52, pp. 163-172.
178
Jensen, J.R. (2000). Remote Sensing o f the Environment: An Earth Resource
Perspective. (First Edition). United States of America: Prentice Hall.
Jensen J. R. (1999). Introductory Digital Image Processing: A Remote Sensing
Perspective. Second Edition. United States of America: Prentice Hall.
Johansen, K., Coops, N. C., Gergel, S. E., Stange, Y. (2007). Application of High
Spatial Resolution Satellite Imagery for Riparian and Forest Ecosystem
Classification. Remote Sensing o f Environment. Vol. 110 (2007) pp.29-44
Johansen, K., and Phinn, S. (2006). Linking Riparian Vegetation Spatial Structure in
Australian Tropical Savannas to Ecosystem Health Indicators: Semivariogram
Analysis of High Spatial Resolution Satellite Imagery. Canadian Journal o f
Remote Sensing. Vol. 32, pp. 228-243.
John C. Russ (1995). The Image Processing Handbook. Second Edition, CRC Press.
Johnson, J.V., Greenfield, P., Ellenwood, J. (2002). Using IKONOS Satellite
Imagery for Forest Pest Mapping. Proceedings o f Forest Service Remote Sensing
Conference. April 9-13, 2002. San Diego, Canada.
Jones, K. B., Ritters, K. H., Wickham, J. D., Tankersley, R. D. O ’Neill, R.V.,
Chaloud, D. J., Smith, E. R. and Neale, A. C. (1998). An Ecological Assessment
o f the United States: Mid-Atlantic Region. Washington: EPA, 103 pp.
JPL Spectral Library (2008). JPL Digital Spectral Library. Retrieved on 24 June
2008 from http://speclib.jpl.nasa.gov/.
Jusoff, K. (2007). Mapping Bamboo in Berangkat Forest Reserve, Kelantan,
Malaysia using Airborne Hyperspectral Imaging Sensor. International Journal
ofEnergy and Environment.Vol. l ,pp. 1-6.

179
Kabat, P., et al. (editors) (2004). Vegetation, Water, Humans and the Climate: A
New Perspective on an Interactive System. Heidelberg: Springer-Verlag.
Kalyanmoy D. (2001). Multi-objective Optimization using Evolutionary Algorithms.
John Wiley and Son Ltd., England.
Keshava, N. and Mustard, J.F. (2002). Spectral Unmixing. IEEE Signal Processing.
Vol. 19(1), pp. 4 4 - 5 7
Kelly, L. L. and Gregory, A. C. (2008). The Use of Hyperspectral Remote Sensing
to Assess Vascular Plant Species Richness on Horn Island, Mississippi. Remote
Sensing o f Environment. Vol. 112, Issue 10, pp. 3908-3915.
Key, T., Warner, T. A., McGraw, J. B. and Fajvan, M. A. (2001). A Comparison of
Multispectral and Multitemporal Information in High Spatial Resolution
Imagery for Classification of Individual Tree Species in a Temperate Hardwood
Forest. Remote Sensing o f Environment. Vol. 75(1), pp. 100- 112.
Khali, A., Azman, H. H. and Chong, P.F. (1993). Monitoring of Mangrove Forest
using High Resolution Satellite Imageries. In: Nyyssonen., A., S. Poso and J.
Rautala, (editors). Proceedings o f Ilvessalo Symposium on Natural Forest
Inventories. Department of Forest Resource Management, University of
Helsinki, Finland, pp 229-237.
Khali A., Rashid, M. F., Hassan, A. and Chong, P. F., (1994). The use of Digital
Remote Sensing Data for Determining Peat Swamp Forest Disturbance: A Case
Study in North Selangor Peat Swamp Forest. Proceedings o f ASEAN Institute o f
Forest Management International Conference. 21-24 November 1994. Kuala
Lumpur, pp. 61-1 A.
Kochummen, K. M., LaFrankie, J. V. and Manokaran, N. (1990). Floristic
Composition of Pasoh Forest Reserve, a Lowland Rainforest in Peninsular
Malaysia. Journal o f Tropical Science. Vol. 3, pp. 1-13.
180
Kondratyev, K. Y. (1998). Multidimensional Global Change. Chichester: Wiley/
PRAXTS Series in Remote Sensing.
Kruse, F. A., Kierein-Young, K. S., and Boardman, J. W. (1990). Mineral Mapping
at Cuprite, Nevada with a 63 Channel Imaging Spectrometer. Photogrammetric
Engineering and Remote Sensing. Vol. 56, No. 1, pp. 83-92.
Kruse, F. A., A. B. Lefkoff, J. B. Boardman, K. B. Heidebrecht, A. T. Shapiro, P. J.
Barloon and A. F. H. Goetz, 1993. The Spectral Image Processing System
(SIPS) - Interactive Visualization and Analysis of Imaging Spectrometer Data.
Remote Sensing o f the Environment. Vol. 44, pp. 145 - 163.
Landis, J.R. and Koch, G. G. (1977). The Measurement of Observer Agreement for
Categorical Data. Biometrics. Vol. 33, pp. 159-174
Lau, A. M. S. (2004). Pre-processing and Classification o f Hyperspectral Data fo r
Wetland Mapping. Master of Science Thesis. Universiti Teknologi Malaysia,
Skudai.
Laubenfels, D.J. de. (1975). Mapping the World's Vegetation: Regionalization o f
Formations and Flora. Syracuse N.Y.: Syracuse University Press, pp. 46-74.
Laurance, W. F. (2004). Forest-climate Interactions in Fragmented Tropical
Landscapes. Philosophical Transactions o f the Royal Society, London. Vol. B
359, pp. 345-352.
Lewis, H.G. and Brown, M. (2001). A Generalized Confusion Matrix for Assessing
Area Estimates from Remotely-sensed Data. International Journal o f Remote
Sensing. Vol. 22 (16), pp. 3223-35
Li, X. and Strahler, A. H. (1985). Geometric-optical Modeling of a Conifer Forest
Canopy. IEEE Trans. Geoscience Remote Sensing. GE-23(5), pp. 705-721.
181
Li, X. and Strahler, A. H. (1992). Geometric-optical Bidirectional Reflectance
Modeling of the Discrete-Crown Vegetation Canopy: Effect of Crown Shape and
Mutual Shadowing. IEEE Trans. Geoscience Remote Sensing. Vol. 30, pp. 276
292.
Liang, S. and Strahler, A. H. (1993). An Analytic BRDF model of Canopy Radiative
Transfer and its Inversion. IEEE Transaction o f Geoscience Remote Sensing.
Vol. 31(5), pp. 1081-1092.
Lillesand, T.M. and Kiefer, R.W. (2000). Remote Sensing and Image Interpretation.
Fourth Edition. New York: John Wiley and Son.
Lubchenco, J., Olson, A. M., Brubaker, L. B., Carpenter, S. R., Holland, M. M.,
Hubell, S. P., Levin, S. A., MacMahon, J. A., Matson, P. A., Melillo, J. M.,
Mooney, H. A., Peterson, C. H., Pullam, H. R., and Risser, P. G. (1991). The
Sustainable Biosphere Initiative: an Ecological Research Agenda. Ecology. Vol.
72, pp. 371—412.
Maarel, V. D. E. (2004). Vegetation Ecology. Oxford: Blackwell Publishers, pp. 68
135.
McGinleya, K. and Finegan, B. (2003). The Ecological Sustainability of Tropical
Forest Management: Evaluation of the National Forest Management Standards
of Costa Rica and Nicaragua, with Emphasis on the Need for Adaptive
Management. Forest Policy and Economics. Vol. 5 (2003), pp. 421-431
Madden, M., D. Jones, and L. Vilchek (1999). Photointerpretation Key for the
Everglades Vegetation Classification System. Photogrammetric Engineering
and Remote Sensing. 65(2), p. 171-177.
Manokaran, N., and LaFrankie, J. V. (1990). Stand Structure of Pasoh Forest
Reserve, a Lowland Rain Forest in Peninsular Malaysia. Journal o f Tropical
Forest Science. Vol. 3, pp. 14-24.

182
Martin, M.E., Plourde, L.C., Ollinger, S.V., Smith, M.-L., McNeil, B.E. (2008). A
Generalizable Method for Remote Sensing of Canopy Nitrogen across a Wide
Range of Forest Ecosystems. Remote Sensing o f Environment. Volume 112,
Issue 9, pp. 3511-3519.
Mausel, P. W., Kramberm W. J. and Lee, J. K. (1990). Optimum Band Selection for
Supervised Classification of Multispectral Data. Photogrammetric Engineering
and Remote Sensing. Vol. 56(1), pp. 55-60.
McKeown, D. (1988). Building Knowledge-Based Systems for Detecting Manmade
Structures from Remotely Sensed Imagery. Philosophical Transactions of the
Royal Society of London, Series A: Mathematical and Physical Sciences. Vol.
324(1579), pp. 423-435.
Miller, J.R., J. Freemantle, M.J. Belanger, C.D. Elvidge and M.G. Boyer (1991).
Potential for Determination of Leaf Chlorophyll Content Using
AVIRIS. Proceedings o f the Second Airborne Visible/Infrared Imaging
Spectrometer (AVIRIS) Workshop. Pasadena, Calif. USA, 4-8 June, 1990. pp. 72
-77.
Miller, J.R., and O ’Neill, N.T. (1997). Multi-Altitude Airborne Observations of the
Insolation Effects of Forest Fire Smoke Aerosols at BOREAS: Estimates of
Aerosol Optical Parameters. Journal o f Geophysics Resources. Vol. 102, No.
D24, pp. 729-736.
Myers, B. J. and Benson, M. L. (1981). Rainforest Species on Large-scale Colour
Photos. Photogrammetric Engineering and Remote Sensing, Vol. 47, pp. 505
513.
Nagendra, H. (2001). Using Remote Sensing to Assess Biodiversity. International
Journal o f Remote Sensing. Vol. 22, No. 12, pp. 2377-2400.

183
Newman, R. M., Thompson, D. C., and Richman, D. B. (1998). Conservation
Strategies for the Biological Control of Weeds. Conservation Biological
Control. Academic Press, New York, NY, 371-396.
Newstrom, L. E., Frankie, G. W., Baker, H. G. and Colwell, R. K. (1994). Diversity
of Long-term Flowering Patterns. Ecology and Natural History o f A Neotropical
Rain Forest, pp. 142- 160.
Nuraznin, A. and Hashim, M. (2007). Mapping of Urban above-ground Biomass
with High Resolution Remote Sensing Data. Proceedings of 28th Asian
Conference on Remote Sensing (ACRS). 12-16 November. Kuala Lumpur, 7pp.
Okada, T. and Tomita, S., (1985). An Optimal Orthonormal System for
Discriminant-Analysis. Pattern Recognition. Vol. 18(2), pp. 139-144.
Okuda, T., Hashim, M., Suzuki, M., Adachi, N., Yoshida, K , Niiyama, K , Nur
Supardi, M. N. and Manokaran, N.(eds.) (2003). Logging History and Its Impact
on Forest Structure and Species Composition in the Pasoh Forest Reserve-
Implication for the Sustainable Management of Natural Resources and
Landscapes. Ecology and Natural History o f a Southeast Asian Tropical
Rainforest. New York: Springer.
Okuda, T., Yoshida, K., Numata, S., Nishimura, S. and Hashim, M (2004).
Estimation of Above Ground Biomass in Logged and Primary Lowland Tropical
Rainforests using 3-D Photogrammetric Analysis. Journal o f Forest Ecology and
Management. Volume 203, pp. 63-75.
Peterson, D. L. and Running, S. W. (1989). Applications in Forest Science and
Management. Theory and Applications o f Optical Remote Sensing. Doghouses
Asrar, New York: John Wiley & Sons. pp. 4210-473.
Plaza, A., Martinez, P., Perez, R. & Plaza, J. (2002). Spatial/Spectral Endmember
Extraction by Multidimensional Morphological Operations. IEEE Transactions
on Geoscience and Remote Sensing. Vol. 40 (9), pp. 2025 - 2041.
184
Prabhu, R., Colfer, C.J.P., Venkateswarlu, P., Tan, L.C., Soekmadi, R., Wollenberg,
E. (1996). Testing Criteria and Indicators fo r the Sustainable Management o f
Forest, Phase 1 (Final Report). Bogor, Indonesia: CIFOR Special Publications.
Razak, A., M.A., Woon, W-C. & Lim, H-F (2002). Challenges in Implementing
Forestry-related Policies in Malaysia. International Workshop on Forest Science
and Forest Policy in the Asia Pacific Region: Building Bridges to Sustainable
Future. 16-19 July, 2002, Chennai, India.
Radzali, M.M., Ismail, A.B. and Razak, A. A. (1992). Application of Remote
Sensing Technique for Peatland Characterization and Mapping. In: Tan, S.L.,
B.Aziz, J. Samy, Z. Salmah, H. Siti Petimah and S.T. Choo (eds.). Proceedings
o f the International Symposium on Tropical Peatland. Kuching, Sarawak, pp
101-106.
Ravan, S. A., Roy, P. S., and Sharma, C. M. (1995). Space Remote Sensing for
Spatial Vegetation Characterization. Journal o f Bioscience. Vol. 20, 427^438.
Read, J. M., Clark, D. B., Venticinque, E. M., and Moreira, M. P. (2003).
Application of Merged 1-m and 4-m Resolution Satellite Data to Research and
Management in Tropical Forests. Journal o f Applied Ecology. Vol. 20, pp. 592
600.
Research Systems Inc (2000). ENVI Tutorials Version 3.4. September, 2000 Edition.
Revilla (1994). Issues on the Inventory and Management of Tropical Forests: Asia
Pacific Region. Proceedings o f ASEAN Institute o f Forest Management
International Conference. 21-24 November 1994. Kuala Lumpur, pp. 233-236.
Richards, J.A. (1999). Remote Sensing Digital Image Processing: An Introduction.
Berlin: Springer-Verlag.
185
Ritter, R. and E. L. Lanzer (1997). Remote Sensing of Nearshore Vegetation in
Washington State’s Puget Sound. Proceedings o f the 1997 Geospatial
Conference. Seattle, WA, Vol.3 pp. 527-539.
Roberts, D. A., Gardner, M., Church, R., Ustin, S., Scheer, G. and Green, R. O.
(1998). Mapping Chaparral in the Santa Monica Mountains using Multiple
Endmember Spectral Mixture Models. Remote Sensing o f Environment. Vol.
65(3), pp. 267-279.
Roberts, D. A., Ustin, S. L., Ogunjemiyo, S., Greenberg, J., Dobrowski, S. Z. and
Chen, J. (2004). Spectral and Structural Measures of Northwest Forest
Vegetation at Leaf to Landscape Scales. Ecosystems. Vol. 7(5), pp. 545-562.
Roberts, D. A., Numata, I., Holmes, K., Batista, G., Krug, T. and Moteiro, A.
(2002). Large Area Mapping of Land-Cover Change in Rondonia Using
Multitemporal Spectral Mixture Analysis and Decision Tree Classifiers. Journal
o f Geophysical Research. Vol. 107(20), pp. 8073.
Roberts, D. A., Yamaguchi, Y., and Lyon, R. J. P. (1985). Calibration of Airborne
Imaging Spectrometer Data to Percent of Reflectance Using Field
Measurements. Proceedings o f 19th International Symposium on Remote Sensing
o f Environment, Ann Arbor, MI, October 21-25, 1985.
Salleh, M. M. and Musa, S. (1994). Issues on the Inventory and Management of
Tropical Forests in Malaysia. Proceedings o f ASEAN Institute o f Forest
Management International Conference. 21-24 November 1994. Kuala Lumpur,
pp. 134-146.
Sawada, H., H., Khali, A., Nakakita, O., Takao, G., Awaya, Y. and Azman, H.
(1991). Development of Monitoring System for Tropical Rain Forest
Environment in Peninsular Malaysia. Technical Report o f Joint Research on the
Enhancement and Application o f the Remote Sensing Technology with ASEAN
countries. Science and Technology Agency of Japan, pp 97-118.
186
Schowengerdt R. A., (2007). Remote Sensing Models and Methods fo r Image
Processing. Academic Press, United States of America, Third Edition, pp. 16-30,
77-81.
Shafri., H. Z. M, Suhaili, A., and Mansor, S. (2007). The Performance of Maximum
Likelihood, Spectral Angle Mapper, Neural Network and Decision Tree
Classifiers in Hyperspectral Image Analysis. Journal o f Computer Science. Vol.
3(6), pp. 419-423.
Shakoor, A. (2003). Subpixel Classification of Ground Surface Features. GIS
Development. Vol. 7(11), pp. 20-24
Skov F. and Svenning J. S. (2003). Predicting Plant Species Richness in a Managed
Forest. Forest Ecology and Management. Vol. 180, pp. 583-593.
Smith, S. J. (2003). The Evaluation of Greenhouse Gas Indices. Climatic Change.
Vol. 58 (3), pp. 261-265
Staenz K., Neville R., J. Levesque, T. Szeredi, V. Singhroy, G. Borstad, P. Hauff.
(1999). Evaluation of CASI and SFSI Hyperspectral Data for Environmental and
Geological Applications - Two Case Studies. Canadian Journal of Remote
Sensing, Vol. 25, No. 3, 1999, pp. 311-322.
Steininger, M. K., Tucker, C. J., Townshend, J. R. G., Killeen, T. J., Desch, A. and
Bell, V. (2001). Tropical Deforestation in the Bolivian Amazon. Environmental
Conservation. Vol. 28(2), pp. 127-134.
Stoms, D. M., and Estes, J. E. (1993). A Remote Sensing Research Agenda for
Mapping and Monitoring Biodiversity. International Journal o f Remote Sensing.
Vol. 14, pp. 1839-1860.
187
Suhaili, A., Shafri., H. Z. M, Ainuddin, N. A., Noor, A. G. A. and Hanum, I. F.
(2006). Improving Species Spectral Discrimination using Derivatives Spectra for
Mapping of Tropical Forest from Airborne Hyperspectral Imagery. Proceeding
o f Map Malaysia 2006.
Theiler J. and Lavenier D. (2000). FPGA Implementation of the Pixel Purity Index
Algorithm for Hyperspectral Images. Tech Report. LA-UR-00-2426, Los
Alamos National Laboratory.
Thenkabail, P. S., Enclona, E. A., Ashton, M. S., Legg, C. (2004). Hyperion,
IKONOS, ALI, and ETM+ Sensors in the Study of African Rainforests. Remote
Sensing o f Environment. Vol. 90, pp. 23—43.
Thomas, C. D., Cameron, A., Green, R. E., Bakkenes, M., Beaumont, L. J., and
Collingham, Y. C. (2004). Extinction Risk from Climate Change. Nature, Vol.
427(6970), pp. 145- 148.
Tuomisto, H., Poulsen, A. D., Ruokolainen, K , Moran, R. C., Quintana, C. and Celi,
J. (2003). Linking Floristic Patterns with Soil Heterogeneity and Satellite
Imagery in Ecuadorian Amazonia. Ecological Applications. Vol 13(2), pp. 352
371.
UNFCCC (2005). Kyoto Protocol. Retrieved on 17 August, 2008 from
http: //unfccc. int/kyoto_protocol/items/283 0 .php
USGS Spectral Library (2008). LJSGS Digital Spectral Library. Retrieved on 24
June, 2008, from http://speclab.cr.usgs.gov/.
Vaughan, R. G., Hook, S. J., Calvin, W. M., Taranik, J. V. (2005). Surface Mineral
Mapping at Steamboat Springs, Nevada, USA, with Multi-Wavelength Thermal
Infrared Images. Remote Sensing o f Environment. Volume 99, Issues 1-2, pp.
140-158.
188
Verhoer, W. (1984). Light Scattering by Leaf Layers with Application to Canopy
Reflectance Modeling: The SAIL Model. Remote Sensing o f Environment. Vol.
16, pp. 125-141.
Wang, L., Wayne, P., Sousa, P.G. and Gregory, S.B. (2004). Comparison of
IKONOS and QuickBird Images for Mapping Mangrove Species on the
Caribbean Coast of Panama. Remote Sensing o f Environment. Vol. 91(3-4), pp.
432-440.
Wang, J., L. Zhang, and Q. Tong (1998). The Derivative Matching for Wetland
Vegetation Identification and Classification by Hyperspectral Data. Proceedings
ofSPIE, Hyperspectral Remote Sensing Application. Vol. 3502 p. 280-288.
Way, J., Paris, J., Kasischke, E., Slaughter, C., Viereck, L., Christensen, N.,
Dobson, M. C., Simonett, D., Hoffer, R. and Weber, J. (1990). The Effect of
Changing Environmental Conditions on Microwave Signatures of Forest
Ecosystems: Preliminary Results of the March 1988 Alaskan Aircraft SAR
Experiment. International Journal o f Remote Sensing. Vol. 11 Issue 7 1990, pp.
1119-1144.
Welch, R. (1996). GPS, Images Processing and GIS Techniques for Coastal Wetland
Mapping Applications. International Archives o f Photogrammetry and Remote
Sensing. 31 (B4), p.931-933.
Whitmore, T. C. (1990). An Introduction to Tropical Rain Forests. Oxford larendon
Press.
Williams, D. L. (1991). A Comparison of Spectral Reflectance Properties at the
Needle, Branch, and Canopy Level for Selected Conifer Species. Remote
Sensing o f Environment. Vol. 35, pp. 79-91.
Wilson, E. O. (1988). Biodiversity.Washington, D.C.: National Academy Press.

189
Woodcock, C. E., Collins, J. B., Jakabhazy, V. D., Li, X., Macomber, S. A. and Wu,
Y. (1997). Inversion of the Li-Strahler Canopy Reflectance Model for Mapping
Forest Structure. IEEE Transactions on Geoscience and Remote Sensing. GE-
35(2), pp. 405-414.
Woolley, J. T. (1971). Reflectance and Transmittance of Light by Leaves. Plant
Physiology, Vol. 47, pp. 656- 662.
Wulder, M. A., Hall, R. J., Coops, N., & Franklin, S. (2004). High Spatial
Resolution Remotely Sensed Data for Ecosystem Characterization. Bioscience.
Vol. 54, pp.511-521.
Wulder,M. A., LeDrew, E. L., Franklin, S. E., & Lavigne, M. B. (1998). Aerial
Tmage Texture Information in the Estimation of Northern Deciduous and Mixed
Wood Forest Leaf Area Index (LAI). Remote Sensing o f Environment. Vol. 64,
pp. 64-76.
WWF, World Wide Fund for Nature Web (2005). Forest Ecosystem. Retrieved on
12 December, 2005 from http://www.panda.org/about_wwf/what_we_do
/forests/about_forests/.
Yamada I. (1997). Tropical Rain Forest o f Southeast Asia: A Forest Ecologist’s
View, Honolulu: University of Hawaii Press, pp 292-299.
Yu, B., Ostland, I.M., Gong, P. and Pu, R.L., (1999). Penalized Discriminant
Analysis of in Situ Hyperspectral Data for Conifer Species Recognition. IEEE
Transactions On Geoscience And Remote Sensing. Vol. 37(5), pp. 2569-2577.
Zhang, Y., Zhang H., Zhuo, P. B. and Yang, H. (2003). Soil Erosion and its Impacts
on Environment in Yixing Tea Plantation of Jiangsu Province. Chinese
Geographical Science, Volume 13, Number 2. Science Press, pp. 43-57.
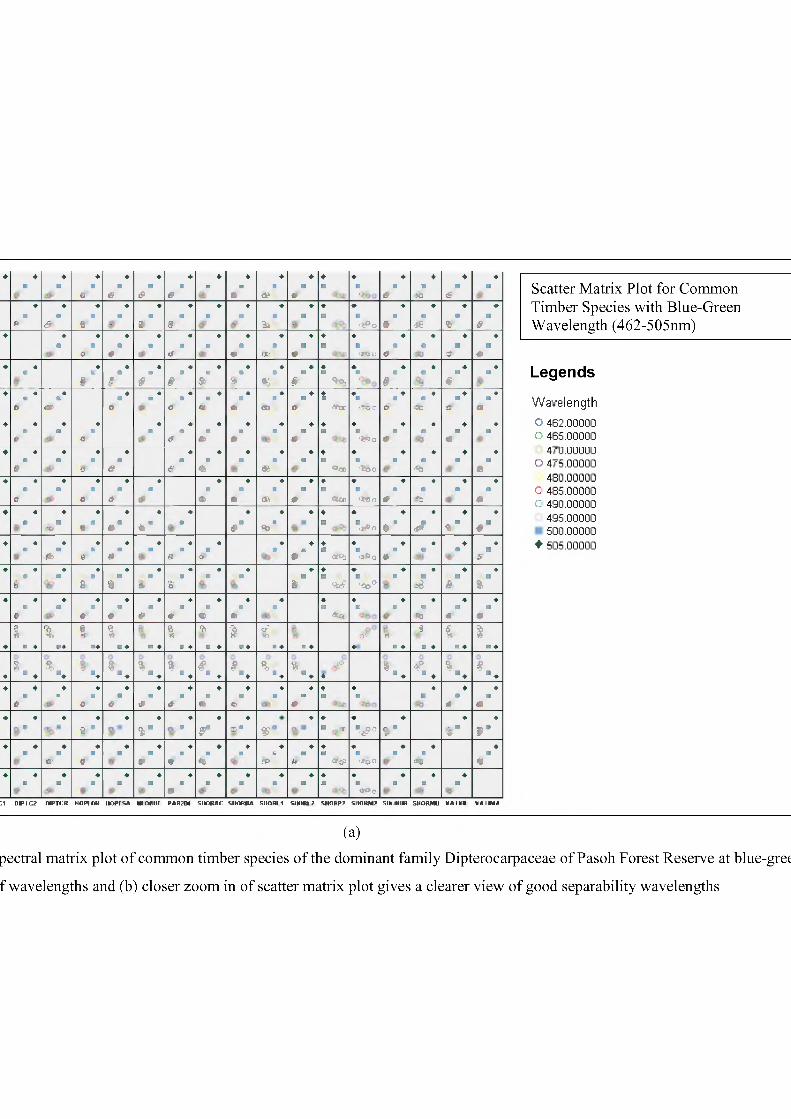
0 & <0 & ft de e ft K) # S c a tte r M a t r ix P lo t fo r C o m m o n
■0
m&
■ft
■-
■a
■0
■ ■ ■9»
■• *°o
m9
■48
■%
■&
T im b e r S p e c ie s w i t h B lu e -G re e n
W a v e le n g th (4 6 2 -5 0 5 n m )♦ ♦ ♦ ♦ ♦ ♦ ♦ ♦ ♦ ♦ ♦ ♦ ♦ ♦
o * ft ft a> a '!<JU ft <a #♦ ♦
§♦ •
£ £*
*♦
&♦ ♦
$♦
dP,♦
§ S*«v, 9
• •*♦
♦ Legends♦
o♦ ♦■
m>♦■
o■ ♦
o♦ m
ft♦ ♦■
ft♦■
00♦■
0 <y® ■700♦•
ft♦■
<ao♦■
<d♦■
ft Wavelength
♦#
♦ ♦■o
♦ ■ ♦ft
♦m
ft)♦ ♦■
ft♦
m ♦■ft ■£*>o
♦■ft
♦■ ♦■<#
♦■ O 462.00000 O 465.00000
♦0
♦ ♦■
0♦ ♦
■e €
♦■
•♦ ♦
■♦
■A
♦■
<*<!> '̂ OO♦
■♦
■<*b
■♦
■A
4^0.00000 C 475.00000
480.00000 C 485.00000 C 490.00000
495.00000500.00000
♦
6
♦ ♦■
0
♦ ♦■
*■
♦■
e>
♦ ♦■
•
♦■
eft
♦■
ft <auc *QO
*•
ft
♦■
<0
♦■
♦■
*♦ ♦ ♦
_ ■*6 a♦ •
# " _ ■&« ♦ ♦
9 m
♦q>"
♦.*Po
♦*■
♦4
♦<&"
♦
f "♦ ♦ ♦■
f t &♦ ♦■
•■ ♦
£♦ ■
ft>♦ ♦■ ♦M
ft CL<h oc>o♦■
ft♦■ ♦■ ♦■
&♦ 505.00000
♦d
♦ ♦■&
♦ ♦■8
■*
♦$
♦ ■ ♦ ♦■♦
■& <fc? \ °
♦■ •■<s8
♦■s
♦■
%
■0
■ ■*
■0
■*
■ft
■<r
■ft
■at®
■ ■so
■<0
■ft
♦1 \ e■* ea e« ?> § cPX) of
♦(9 9
% 1
♦% 9, « % 3 * 8 9, ft uf>
♦I , dP * *
m*
■ ■0
■#
■*
■#
■*
■ft
■ ■ft
□ ♦■♦
■♦
■<*
♦■
ft♦ ♦ ♦
9♦ ♦
%■♦ ♦
f♦ ♦
X>" 9 m♦ ♦
" , r♦v °
♦fc*fr
♦f
♦? •
■O '
■©
■ ■9
■9
■%
■ ■tP
■ft
■<*cP
m■*0°
■ ■*e
♦■«
ft <*o O:1 (NPTC7 INPTCR tlOPf DM HOPESA HI OIIII[ PAR01 SIIOKAC SIIOKIIA SIIOKI 1 SltO RI ? SHOHP? SIIO KM ? SIMiHlIH SHOMNU V A I If H V f l l W f l
(a)
pectral matrix plot of common timber species of the dominant family Dipterocarpaceae of Pasoh Forest Reserve at blue-gree
f wavelengths and (b) closer zoom in of scatter matrix plot gives a clearer view of good separability wavelengths
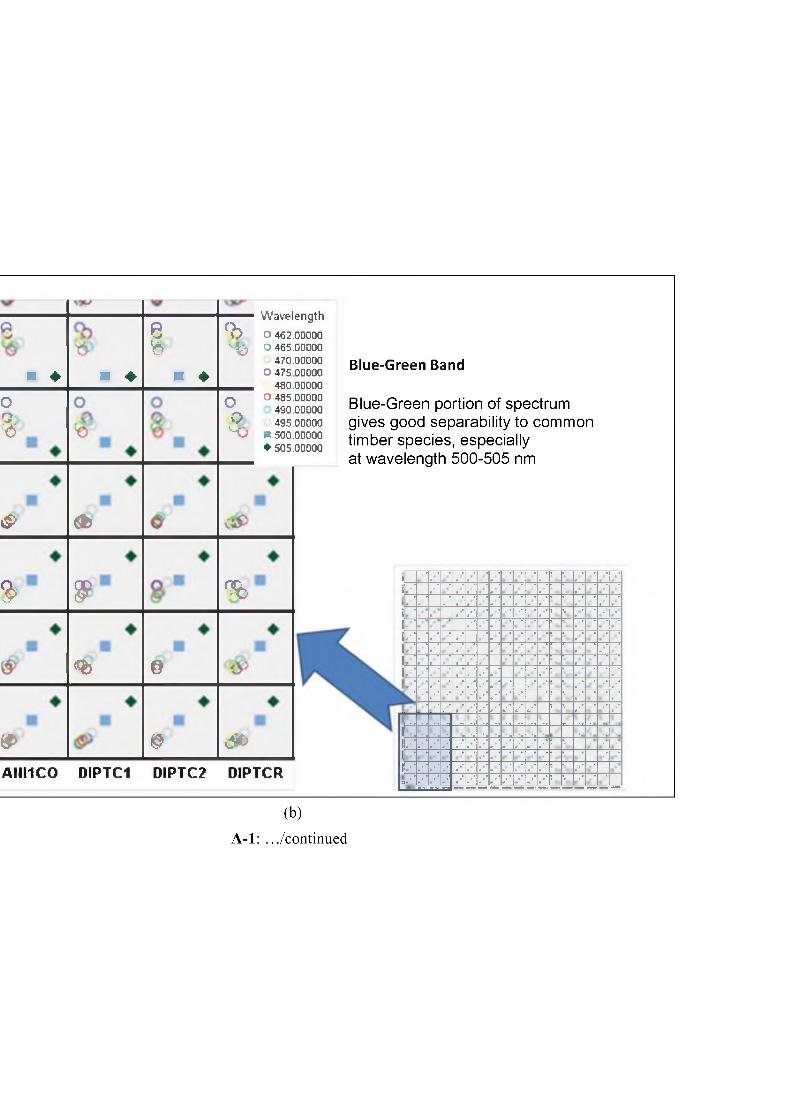
o%
&
&
&
t o
9
<%
db
©
©
:bW avelength
O 462.00000 "■ij C 465.00000
470.00000 O 475 00000
480.00000 O 485.00000
490.00000495.00000
■ 500.00000 ♦ 505.00000
OoS j
%
&>
AHI1C0 DIPTC1 DIPTC? DIPTCR
Blue-Green Band
Blue-Green portion of spectrum gives good separability to common timber species, especially at wavelength 500-505 nm
1 f * „ ;1. p* •
S.-' J *1 • ,*I.-' 4Z1 **1 rI.' # • j ' + '
j, '
I1II, '1 • • -II-' # 1
(b)
A -l: .../continued

<P
&
8
&
30
of>
C1 DIP1C2 DIPTCR HOPEDR HOPESA IIEOeHE
8
<?
d*>
O'-' ° °
,-,°0
>ce
<*>
<*>
rfs>
a?
. <y
d*
<*>
<P
<**>
#e
eft
sfp
4>
<t>
4>
<!>
d>
9
<*>
&
S
. T>
&
1f>
AR?DE SHORAC SHOPDA SHORL1 SHORL2 SHORP? SHORM2 SHORBR SHORMU VATIBE V A TIM A
Scatter Matrix Plot for Common Timber Species with Green-Peak Wavelength (536-580nm)
LegendsWavelengthO 536.00000 C 540.00000
545.000000 550.00000
555.00000 C 560.00000 C 565.00000
570.000001 575.00000 * 580.00000
(a)
jectral matrix plot of common timber species of the dominant family Dipterocarpaceae of Pasoh Forest Reserve at green-pea
■ wavelengths and (b) closer zoom in of scatter matrix plot gives a clearer view of good separability wavelengths
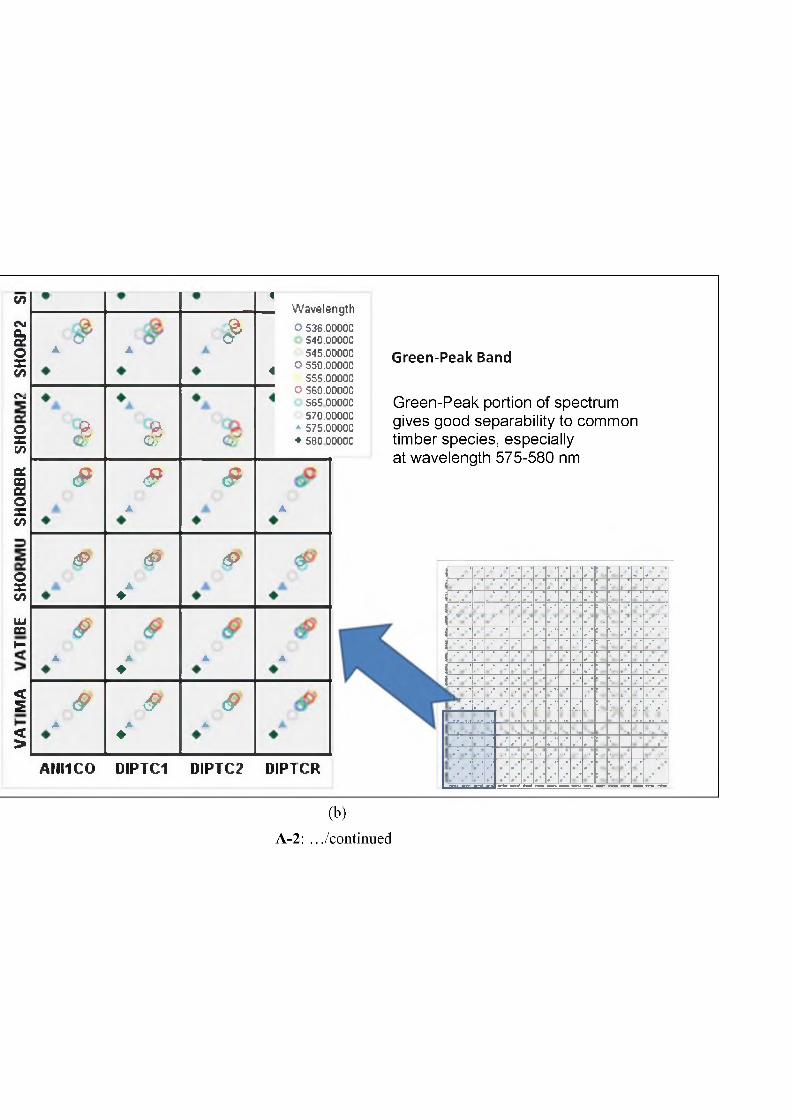
CflCM
s>oxCflr*.
Ox\rac§oxto
A
£
cP
6>oXtrtUJco>-
<S
<>
<$>A
A
Bc r
&A
<P
£
9
c?
<5>
(P
W avelength
O 536.00000540.00000545.00000
O 550.00000555.00000
O 560.00000565 00000570.00000
* 575.00000♦ 560 00000
A
ANI1CO DIPTC1 DIPTC2 DIPT CR
Green-Peak Band
Green-Peak portion of spectrum gives good separability to common timber species, especially at wavelength 575-580 nm
I
4
a A A
I*. .
(b)
A-2: .../continued