high speed rail lessons reason foundation
DESCRIPTION
This report examines the prospects for HSR in the U.S. It studies how this country differs from Europe and Japan in travel patterns, spatial structure, car ownership and other factors. The report also examines how well HSR works in countries such as France, Germany and Japan. It uses these results to determine whether HSR is a realistic prospect for the U.S.TRANSCRIPT

Policy Study 418 May 2013
High-Speed Rail in Europe and Asia:Lessons for the United States
By Baruch Feigenbaum

Reason Foundation
Reason Foundation’s mission is to advance a free society by developing, applying and promoting libertarian
principles, including individual liberty, free markets and the rule of law. We use journalism and public policy
research to influence the frameworks and actions of policymakers, journalists and opinion leaders.
Reason Foundation’s nonpartisan public policy research promotes choice, competition and a dynamic market
economy as the foundation for human dignity and progress. Reason produces rigorous, peer-reviewed
research and directly engages the policy process, seeking strategies that emphasize cooperation, flexibility,
local knowledge and results. Through practical and innovative approaches to complex problems, Reason
seeks to change the way people think about issues, and promote policies that allow and encourage individu-
als and voluntary institutions to flourish.
Reason Foundation is a tax-exempt research and education organization as defined under IRS code 501(c)(3).
Reason Foundation is supported by voluntary contributions from individuals, foundations and corporations.
Copyright © 2013 Reason Foundation. All rights reserved.
Reason Foundation
High-Speed Rail in Europe and Asia: Lessons for the United States
By Baruch Feigenbaum
Executive Summary Since 2009, the prospect of building high-speed rail (HSR) in the United States has received a great deal of attention. While building HSR in the U.S. has its proponents and its critics, little research has been conducted to examine how high-speed rail operates around the world and to determine whether a high-speed rail system could actually succeed in the United States. This report examines the prospects for HSR in the U.S. It studies how this country differs from Europe and Japan in travel patterns, spatial structure, car ownership and other factors. The report also examines how well HSR works in countries such as France, Germany and Japan. It uses these results to determine whether HSR is a realistic prospect for the U.S. From a financial standpoint, only two HSR lines in the world are profitable: Paris-Lyon in France and Tokyo-Osaka in Japan. A third line, Hakata-Osaka in Japan, breaks even. The majority of high-speed rail lines require large government subsidies from both general taxpayers and drivers. Even with generous subsidies, traveling by high-speed rail is still more expensive than flying for 12 of the 23 most popular high-speed rail routes in the world—regardless of whether the traveler purchases a ticket in advance or only a week before travel. Flying would be cheaper on some other routes if they were served by discount airlines. For routes that are less than 150 miles, intercity coach buses are much cheaper and take only slightly longer than high-speed trains. The evidence suggests that HSR can only be competitive on routes that are between 200 and 500 miles in length. HSR is very expensive to build. The earliest routes, such as Tokyo-Osaka, cost less than $5 million per mile. Most newer routes cost at least $10 million per mile to construct. Clearly, the more expensive the line is to build, the more difficult it will be to break even. While operating costs vary, the cheapest European rail line costs more than $50,000 per seat to operate annually. And U.S. rail ridership is not guaranteed. Rail experts estimate that a U.S. HSR line would need ridership of between 6 million and 9 million people per year to break even. Compare that to the high-speed Acela service, which despite operating in the busy Northeast Corridor averages only 3.4 million passengers per year. To make matters worse, the popularity of rail travel appears to be

declining throughout the world. In most countries high-speed and conventional rail service represent less than 10% of all passenger-miles traveled by land. This is a decrease of almost 10% over just the last 15 years. HSR advocates cite other advantages in support of HSR, but most of these fall apart under close examination:
§ Environment: HSR creates more pollution than it prevents because building a HSR line is very energy-intensive. The California Air Resources board estimated there are many more cost-effective ways to improve the environment than building HSR between Los Angeles and San Francisco.
§ Economic Development: HSR does not create much new development; it merely redirects development from one area to another.
§ Safety: While HSR is relatively safe, most potential rail passengers travel by an even safer mode—aviation. Thus HSR is unlikely to increase transportation safety.
§ Mobility: HSR is also unlikely to improve mobility since most of its potential passengers already travel by air. Moreover, aviation congestion will decrease significantly with the forthcoming implementation of the Next-Gen air traffic control system.
§ Choice: There is some value in providing travelers a choice of mode. However, customers can already choose between a low-cost bus, a fast plane or a personalized car trip. Is another choice necessary? Spending an equivalent amount of funds on aviation or highways could do much more to solve America’s transportation problems.
In addition, there are several factors that suggest high-speed rail’s limited success in France and Japan is not transferrable to the U.S. First, the United States rail network is mostly owned and used by freight companies. While these private companies offered passenger service until 1970, competition, labor laws and a lack of innovation pushed most railroads towards bankruptcy. As a result, Congress created Amtrak in 1970 to operate passenger service. As a result of shedding their money-losing passenger service and industry consolidation, freight rail companies are now profitable. However, the United States has little passenger rail service. Most countries have built high-speed rail to relieve overcrowding on their existing lines. The U.S. lacks this overcrowding; further, freight rail dominates track usage. Increasing passenger operations on these tracks would increase shipping costs and delays. It is also important to remember that any U.S. rail operator will have to compete on the same terms that cause Amtrak to lose large amounts of money each year. Railways are subject to outdated labor laws such as the Railway Labor Act of 1926, the Federal Employers Liability Act of 1908 and the Railroad Retirement Act of 1934. These outdated laws were enacted when railroads did not face competition from automobiles, buses and planes. Other current rules limit the types of tasks that rail workers can perform. While private competition might decrease costs, the government

would have to pay the private sector to become involved, since operating a passenger railroad in the existing U.S. regulatory environment is not a profitable proposition. Second, the U.S. has a different spatial structure than most countries. U.S. core cities, where people are most likely to board HSR trains, are substantially less dense than European or Asian cities. America has far higher rates of car ownership than most other countries, because the cost of using a personal vehicle is cheaper here. U.S. federal, state and local gas taxes average around $0.50 per gallon while many European and Asian countries charge more than $5.00 in tax for a gallon of gas. Most other countries also toll their highway network: China, France and Spain have tolled highway networks; Germany charges tolls for trucks on its autobahn. The U.S. Interstate system is the only 6,000 mile plus highway network free to both cars and trucks. The result is that many American cities, especially southern and western cities such as Atlanta, Houston, Los Angeles and Phoenix, have built up around the car. New York City, the densest U.S. city, is about half as dense as London or Barcelona and about a third as dense as Shanghai. Further, most European and Asian HSR riders take another form of transit to board a high-speed train. In the United States, only New York has a transit system that can shuttle enough people to a high-speed rail station. Most U.S. cities would have to build large parking garages to have enough ridership for HSR. And riders who begin their commute by car are more likely to drive or fly than riders who begin their commute by transit. Ultimately, high-speed rail falls into the “luxury” category for the U.S. It does provide another transport mode and can move people from one core city to another core city quickly and conveniently. But it is also very expensive and is utilized mostly by the wealthy. For less money the U.S. can create a world-class aviation and highway system with first-rate airplane and bus service. With the U.S. government facing a multi-trillion dollar debt, this is not the time to experiment with more expensive modes of transportation. U.S. policymakers should stop this train before it starts.

R e a s o n F o u n d a t i o n
Table of Contents
Introduction ............................................................................................................... 1
The Definition and History of High-Speed Rail ......................................................... 2
United States Rail History and Current High-Speed Program ................................... 6
Arguments for HSR .................................................................................................... 8
HSR Realities ............................................................................................................ 10
Fiscal Evaluation of World Wide High-Speed Rail Systems ..................................... 14
Variables Determining High-Speed Rail Success ..................................................... 22
Government Travel Policy ....................................................................................... 24
Analysis and Conclusion .......................................................................................... 29
About the Author ..................................................................................................... 32
Endnotes .................................................................................................................. 33

HIGH-SPEED RAIL IN EUROPE AND ASIA | 1
P a r t 1
Introduction
Since 2009, high-speed rail (HSR) has received a great deal of attention in the United States. Some transportation analysts contend that the United States needs a high-speed rail network to be economically competitive with countries in Europe and Asia. Much of the focus has centered on President Obama’s proposed high-speed rail network and the likely costs of that network. The 2009 plan featured 11 different regional networks, some of them connected to other networks, stretching from California to Northern New England. During the past four years, the Administration has provided grants and loans for some of those lines. This paper’s purpose is not to evaluate the Obama administration’s high-speed rail program, but rather to analyze whether a successful HSR program could work in the U.S. To do so, it examines high-speed rail in Europe and Asia and the potential for high-speed rail in the U.S. This study addresses the following issues:
§ Definition and history of high-speed rail
§ U.S. rail history and current high-speed program
§ Arguments in favor of building high-speed rail
§ Realities of HSR
§ Fiscal evaluation of world wide high-speed rail systems
§ Variables determining high-speed rail success
§ Government travel policy
§ Analysis of U.S. prospects for high-speed rail and conclusion
2 | Reason Foundation
P a r t 2
The Definition and History of High-Speed Rail
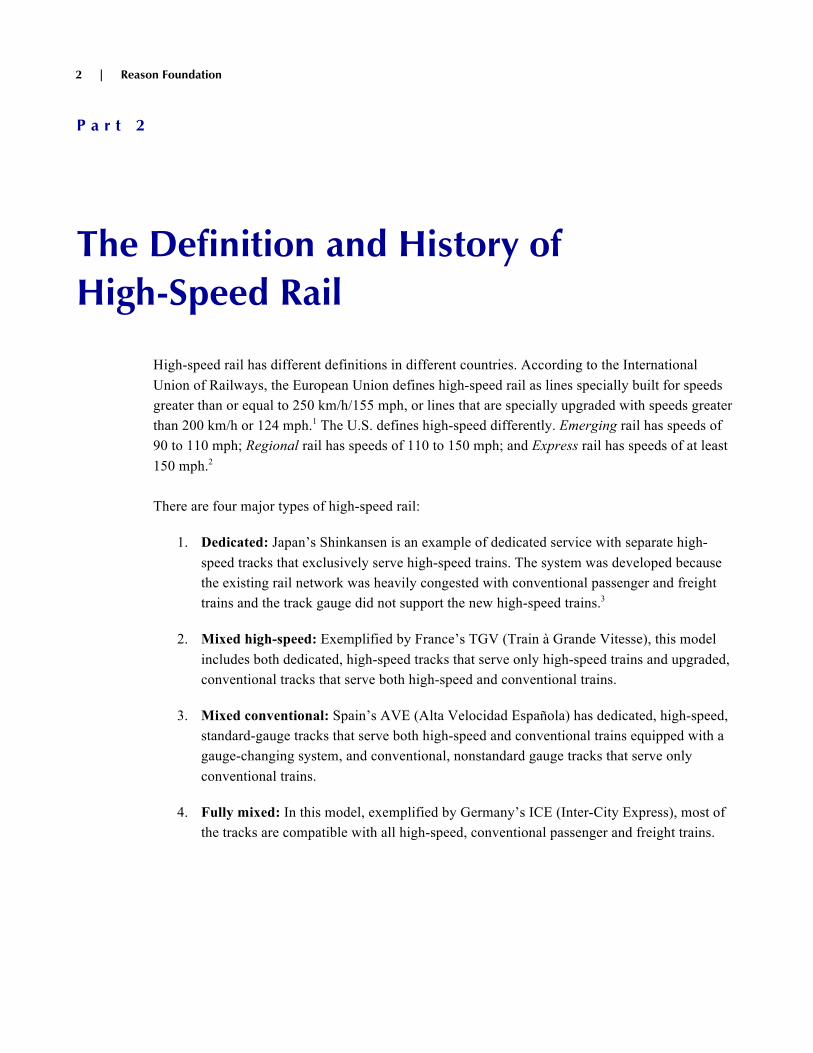
High-speed rail has different definitions in different countries. According to the International Union of Railways, the European Union defines high-speed rail as lines specially built for speeds greater than or equal to 250 km/h/155 mph, or lines that are specially upgraded with speeds greater than 200 km/h or 124 mph.1 The U.S. defines high-speed differently. Emerging rail has speeds of 90 to 110 mph; Regional rail has speeds of 110 to 150 mph; and Express rail has speeds of at least 150 mph.2 There are four major types of high-speed rail:
1. Dedicated: Japan’s Shinkansen is an example of dedicated service with separate high-speed tracks that exclusively serve high-speed trains. The system was developed because the existing rail network was heavily congested with conventional passenger and freight trains and the track gauge did not support the new high-speed trains.3
2. Mixed high-speed: Exemplified by France’s TGV (Train à Grande Vitesse), this model includes both dedicated, high-speed tracks that serve only high-speed trains and upgraded, conventional tracks that serve both high-speed and conventional trains.
3. Mixed conventional: Spain’s AVE (Alta Velocidad Española) has dedicated, high-speed, standard-gauge tracks that serve both high-speed and conventional trains equipped with a gauge-changing system, and conventional, nonstandard gauge tracks that serve only conventional trains.
4. Fully mixed: In this model, exemplified by Germany’s ICE (Inter-City Express), most of the tracks are compatible with all high-speed, conventional passenger and freight trains.

HIGH-SPEED RAIL IN EUROPE AND ASIA | 3
Table 1 lists all of the countries with high-speed rail according to the European Union definition.
Table 1-High Speed Rail Mileage by Country In Operation and Under Construction Country HSR Mileage Country HSR Mileage
Algeria 41 Poland 139
Austria 331 Portugal 657
Belgium 130 Russia 733
Bulgaria 286 Saudi Arabia 273
China 12,625 South Korea 444
Denmark 37 Spain 2,326
France 1,617 Sweden 537
Germany 876 Switzerland 66
Greece 354 Taiwan 749
Italy 891 Turkey 214
Japan 1,966 United Kingdom 978
Netherlands 75 Uzbekistan 214
Norway 39
Source: International Union of Railways
China, France, Germany, Italy, Japan and Spain have six of the most extensive high-speed rail systems in the world. The first high-speed rail line opened in Japan for the 1964 Olympics.4 Europe’s first high-speed rail line opened in Italy between Rome and Florence in 1978. In Europe, each country’s national rail company operates high-speed rail service. These operator-owned trains serve several countries creating a seamless network. For example, France’s TGV line also operates in Belgium. The world’s first high-speed rail line, known as the Shinkansen, was built in 1964 between Tokyo and Osaka, Japan.5 This line was built in a corridor well suited to rail travel, and the train was built to expand capacity on an overcrowded route. Construction was financed with loans from the World Bank and the Japanese government.6 The railway repaid the loans in seven years. After that, operating profits on the line were used to cross-subsidize local trains. The success of this line encouraged expansion, and the Japanese government continued to build high-speed lines throughout the country. The Sanyo, the second line, came close to breaking even, but none of the other lines generated enough passenger revenue to cover their operating costs, not to mention their capital costs. This expansion of the Japanese high-speed rail network included new lines that were not economically efficient, and were built in response to political pressure to extend the benefits of high-speed service to other parts of the nation. Partly as a result of large operating losses, Japan National Railways was privatized in 1987. Since 1987, extension of high-speed lines has continued, supported by the notion that infrastructure spending stimulates the economy.7 Some of the newer lines that end in smaller cities require Tokyo-bound commuters to transfer trains at least once. These lines have very low ridership totals. New lines constructed today are funded by public-private partnerships, with part of the funding coming from the now-privatized regional rail companies, and the rest from the national and local

4 | Reason Foundation
governments. The current network features almost 1,500 miles of track with top speeds of 149–183 miles per hour, and more lines under construction.8 The world’s second high-speed rail line opened in Italy between Rome and Florence in 1977.9 Italy now has two lines: one connecting Turin and Venice and the second linking Milan to Salerno. Parts of the Milan to Salerno line remain under construction. Italy has slowly expanded its track to connect most major cities by high-speed rail. However, it has not expanded rapidly over the past 20 years. Early in 2012, the Nuovo Trasporto Viaggiatori private train operator began competing with the state-run Trenitalia for domestic rail service.10 This makes Italy the first country in the world where two high-speed rail services compete against each other. It will be interesting to see if this competition reduces the costs of high-speed rail travel. France built the world’s third high-speed rail system. Referred to as TGV (Train à Grande Vitesse) the first line opened in 1981, between Paris and Lyon.11 As of 2011, the French system had approximately 1,270 miles of high-speed rail line.12 Unlike the Japanese system, which features a linear design where some lines do not connect with Tokyo, the French system has spokes radiating outward from the hub of Paris. According to the French rail operating company, SNCF, its TGVs have taken over 90% of the combined air-rail travel market for the Paris-Lyon route, which has a TGV travel time of less than two hours. TGV also has about 60% market share in corridors where the TGV travel time is around three hours.13 France’s system has been expanded to Belgium, Germany, Italy and Switzerland. As of 2011, the French system is the longest in Europe at more than 1,250 miles and operates at top speeds around 200 miles per hour.14 Encouraged by high-speed rail in France and Italy, German leaders made high-speed rail a national priority. As a result, Article 87 of the German Constitution makes rail transport a government responsibility.15 Construction on Germany’s InterCityExpress (ICE) high-speed rail system began two years after French construction. However, lawsuits slowed construction and the first high-speed rail line connecting Hamburg and Munich did not open until 1991.16 The German network varies significantly from that of its neighbor, France. As a result of political demands and a denser population, Germany’s high-speed rail service has been developed to connect many hubs, unlike the French network, which radiates out from Paris. Germany’s high-speed trains have more stops than those of France, where the system emphasizes connecting distant city-pairs with few intermediate stops. Initially, Germany preferred upgrading existing rail lines to accommodate higher speed service, rather than building new lines. In these cases, Germany’s high-speed trains have longer average trip times than French trains over comparable distances. As many of the older lines have now been upgraded, most of the lines built in the past 5–10 years are new lines. As of 2007, Germany had 11 different high-speed rail lines at a total length of more than 810 miles. Many of Germany’s upgraded lines have a top speed of 155 miles per hour. All new lines and some upgraded lines can reach 186 miles per hour.17 Spain opened its first high-speed rail line—AVE (Alta Velocidad Española)—in 1992.18 Spain has two separate rail networks. The country chose to build its conventional rail network using a wider gauge than the international standard. But in order for Spanish trains to function on other countries

HIGH-SPEED RAIL IN EUROPE AND ASIA | 5
rail lines, its high-speed rail network is being built to the international standard. As a result, many trains must have special equipment to allow them to operate on both networks. As of 2011, Spain’s high-speed rail system was 1,656 miles in length, making it the second longest system in the world after China.19 Spanish trains operate at top speeds between 155 and 200 miles per hour. Since 2003 Spain has been spending more money on rail than on roads.20 The Spanish government’s Ministry of Public Works has a Strategic Plan for Infrastructure and Transport for the period from 2005 to 2020.21 The largest spending category—$146 billion (44% of the total)—is for railways. Spain’s plan is to increase the size of the high-speed rail network to 6,200 miles by the year 2020, and place 90% of the population within 30 miles of a station.22 However, the recent election of a conservative government, coupled with spiraling materials costs, and the underperformance of other high-speed rail lines have put most new construction on hold. The previous government touted the high-speed rail network as a way of improving mobility with less environmental impact than automobile or air travel, and as a way to promote the development of Spain’s regions and create transportation-related employment. Independent analysts have argued that these economic development benefits are overstated. China is planning to develop the largest high-speed rail network in the world. China’s rationale is that HSR will (1) relieve the pressure of both passenger and freight demand on its overcrowded existing rail system; (2) improve transportation connections between the country’s different regions; and (3) promote the economies of less developed regions.23 China is upgrading existing lines and building new dedicated electrified lines. Some upgraded lines will have speeds of 120–150 mph, while other upgraded lines and all new dedicated lines will have speeds up to 186 mph.24 In 2008, China’s government announced plans to have approximately 10,000 miles of high-speed lines (including both upgraded existing lines and new dedicated electrified lines) in operation by 2020.25 However, in 2011 China reduced speeds on all lines from 217 miles per hour after officials found that some were constructed with faulty materials. Later that same year—after the Wenzhou crash killed 39 people—train speeds were further reduced. This is not the only setback China’s rail program has faced. A number of top Chinese officials were recently arrested for skimming $2.8 billion from the railway program.26 A total of $28 million was embezzled on the Beijing to Shanghai line alone. Currently China has more than 6,500 route-miles.

6 | Reason Foundation
P a r t 3
United States Rail History and Current High-Speed Program
Prior to 1970, private railroad companies provided both freight and passenger service. Rail was the dominant mode of intercity transportation from the latter part of the 19th century to the mid-20th century, but changing development patterns and new technology altered the dynamics after that. By the 1950s competition from motor vehicles using the public U.S. federal and interstate highway systems and a growing aviation system were pushing rail carriers toward bankruptcy. In 1967 New York Central’s Twentieth Century Limited made its last run. In 1970 Penn Central declared bankruptcy.27 Competition was not the only factor that pushed railroads toward bankruptcy. They also failed to adjust to changing business practices. The Railway Labor Act of 1926, which was intended to prevent the interruption of interstate commerce, was often used to protect workers from structural downsizing instead. For example, most railroads still employed firemen for locomotives despite technological advances that made such workers unnecessary. In 1970, Congress formed the National Railroad Passenger Corporation (Amtrak). Amtrak is a government-owned corporation, which was created to preserve a nationwide network of passenger rail service. It also helped the private rail companies by allowing them to transfer their loss-making passenger rail services to Amtrak. 28 But like the private rail companies before Amtrak and almost all intercity passenger rail operators in other countries, Amtrak continues to lose money on passenger rail service. This necessitates ongoing financial support from Congress—since its inception Amtrak has received a total of $36 billion in federal government subsidies, not counting contributions from states and cities.29 This makes Amtrak an ongoing source of controversy. Rail supporters urge more funding for rail while rail critics urge an end to federal support for passenger rail service. In the absence of a consensus on whether rail services should be determined by the market or continued as a government service, Congress has provided a consistent level of funding for passenger train service. The U.S. Congress established the current high-speed rail program framework in the 2008 and 2009 Appropriations Acts: The Passenger Rail Investment and Improvement Act of 2008 (PRIIA), and the American Recovery and Reinvestment Act of 2009 (ARRA).30 PRIIA, in 2008, established three new grant programs for funding High-Speed Rail/Intercity Passenger Rail capital

HIGH-SPEED RAIL IN EUROPE AND ASIA | 7
improvements that required a 20% non-federal match. ARRA, in 2009, awarded $8 billion to the states for planning and construction funds. The Federal Railroad Administration (FRA) provided funds under three different laws, all of which allowed public intercity rail agencies to apply for capital improvement grants that benefited all types of intercity passenger rail service.31
§ In 2008, under the Appropriations Act Capital Assistance to States program, FRA provided $30 million of federal funding on a competitive basis to support up to 50% of the capital cost of improving intercity passenger rail.32 Almost 10% of the $30 million was used for rail corridor planning grants.
§ ARRA appropriated another $90 million to Intercity Passenger Rail Service Corridor Capital Assistance (Section 301), funds that could be used for states, groups of states and Interstate compacts.33
§ Furthermore, High-Speed Rail Corridor Development funds (Section 501) support federally designated high-speed rail corridors with top travel speeds of at least 110 miles per hour.34
§ Congestion Grants (Section 302), meanwhile, are provided to states or to Amtrak for facilities, infrastructure and equipment for high priority rail corridor projects.35 Total program funding was $9.2 billion.
§ Finally, as part of SAFETEA-LU, section 1103f provided funds for Railway Highway Crossing Hazard Elimination in High-Speed Rail Corridors.36
All U.S. high-speed rail funding was appropriated in the 2009 stimulus, 2009 discretionary funding or 2010 discretionary funding.37 Eight billion dollars was appropriated in the 2009 stimulus, $200,000 in the 2009 budget, and $2.5 billion more in the 2010 budget. Approximately $500,000 of unspent funds was rescinded in April 2011 upon passage of the delayed 2011 budget. Non-partisan reports from the Congressional Research Service and Government Accountability Office in 2009 and 2010 questioned HSR’s costs and benefits.38 Many think tanks including the Cato Institute, Heritage Foundation and Reason Foundation also wrote reports critical of HSR.39 Increasing budget deficits and the popularity of the Tea Party also reduced support. Some newly elected governors even rejected federal funds for HSR. Governor Rick Scott of Florida rejected $2.4 billion, Governor John Kasich of Ohio rejected $400 million and Governor Scott Walker of Wisconsin rejected $810 million. As a result of the political make-up of the 112th Congress, funding for HSR was reduced to zero in the 2011 and 2012 budgets.

8 | Reason Foundation
P a r t 4
Arguments for HSR
High-speed rail has several supposed advantages over automotive and plane travel. The following are claims made by HSR supporters: Environmental: HSR uses one-third the energy of air travel and one-fifth the energy of automobile travel.40 Further, HSR will help reduce the $700 billion-a-year oil purchase trade deficit. HSR will reduce global warming by decreasing U.S. oil consumption and emissions. It will also end wars for oil and reduce our dependence on costly military operations. Economic Development: Planning, designing and building HSR will create many green jobs.41 HSR may therefore spur economic development and the creation of some jobs, particularly around high-speed rail stations. HSR is reliable and operates in all weather conditions. It can spur the revitalization of cities by encouraging high-density mixed-use development around stations. HSR can link cities into integrated regions that function as a stronger economy. HSR routes can increase tourism and visitor spending. Safety: Each year, 43,000 people die in car accidents.42 Rail is a safer form of transportation than road, and building HSR service will increase safety. Mobility: High-speed rail will reduce congestion on highways and at airport runways by shifting travel patterns.43 This can provide extra mobility without costly new capital expenditures. Trains will travel on uncongested rails faster than cars and with fewer delays than airline travelers. High-speed rail can deliver more passengers per hour than roads and runways at a lower cost. High-speed rail stations are more likely to be multi-modal, offering connections to other travel modes. Choice: HSR will provide travelers with a choice of transportation modes. In congested corridors, frequent and reliable HSR could provide travelers an attractive alternative to dealing with traffic bottlenecks and airline delays.44 Reliability: HSR increases the reliability and redundancy of the transportation system. Many different types of events, including floods, snowstorms and hurricanes, can dramatically disrupt a transportation system. Building redundancy into any system entails added costs, but the availability of alternatives tends to make the system as a whole more reliable during unusual events.45

HIGH-SPEED RAIL IN EUROPE AND ASIA | 9
Time Savings and Security Delays: HSR offers time savings since travelers arrive in the city center instead of the periphery. Train travel does not have the rigid security of aviation. This reduces total trip time as travelers do not have to include extra time to go through security. Comfort and Convenience: Rail is a more comfortable and convenient way to travel than plane. Rail stations are located downtown, closer to the city center than airports on the periphery.46 Trains feature more comfortable seats and more leg room. Productivity: High-speed rail allows people to work during their trips on laptops and cell-phones.47 Meeting space is also available on many trains. With better reliability and more frequent service, overnight stays are often not required. High-speed rail also allows travelers to take trips at the last minute or make changes to their schedule without large penalties. More Compact Development: High-speed rail can create more transit-oriented development (TOD).48 TOD creates compact, walkable communities adjacent to train stations. High-speed rail combined with regional rail will increase TODs and help residents save time and money.

10 | Reason Foundation
P a r t 5
HSR Realities
While the above arguments for building high-speed rail sound compelling, few of the arguments are supported by realities in countries with existing HSR service. Environmental: Firstly, even if HSR does succeed in reducing energy use and pollution, that alone does not mean that it is a cost-effective way of achieving such a policy objective. On the contrary, critical analysis suggests that the environmental benefits of HSR would be small relative to the very high cost of constructing and operating rail lines. While the California High Speed Rail Authority contends that HSR uses one-third the energy of air travel and one-fifth the energy of automobile travel, a non-partisan analysis by the California Air Resources Board of HSR in California estimated that HSR would only account for 1.5% of the state's goal for reducing emissions—and at a very substantial cost.49 A University of California at Berkeley study estimated that a network of U.S. high-speed rail lines would reduce transportation pollution 0.49%, a statistically insignificant number.50 Secondly, estimates of the reduced energy use and pollution arising from HSR often fail to consider its construction and maintenance costs, while also assuming that automotive and airplane engine technology will not become more energy efficient in the future. For example, the California High Speed Rail Authority’s uses its own environmental impact statement (EIS), to suggest that high-speed trains will produce large energy savings.51 According to the EIS, the energy savings from operating high-speed rail will repay the energy cost of construction in five years. However, this assumes that the energy efficiency of autos and planes will not improve. If, over the lifetime of a high-speed rail project, autos and planes become 30% more fuel-efficient (which is not an unreasonable assumption), then the energy payback period for high-speed rail rises to 30 years. And since rail lines require expensive (and energy-intensive) reconstruction about every 30 years, high-speed rail may not actually save energy at all. Thirdly, while rail can offer lower energy usage and fewer carbon emissions than highway or air travel, that is only the case when trains run at or near capacity.52 As noted above, that may not be a sensible assumption when it comes to high-speed rail in the U.S. Indeed, because HSR will only capture such a small share of total passenger trips, it is also unlikely to make much difference in either achieving greenhouse gas reduction targets, or in the amount of oil imported.53 Using realistic ridership numbers, the California and Midwestern high-speed rail lines will increase emissions.

HIGH-SPEED RAIL IN EUROPE AND ASIA | 11
Finally, it is not clear that high-speed rail is always an environmentally sensitive option. In 2005, Florida's High-Speed Rail Authority proposed a 125-mph rail line between Tampa and Orlando powered by gas turbine. The environmental impact statement for the proposal estimated that trains would produce more nitrogen oxide pollution and volatile organic compounds than would be saved by removing an equivalent number of cars from area highways.54 It also calculated that operating and maintaining the gas-turbine locomotives would consume 3.5 to 6.0 times as much energy as would be saved by removing the cars.55 The statement concluded that, "the environmentally preferred alternative is the No Build Alternative" because it “would result in less direct and indirect impact to the environment.” 56 Economic Development: HSR supporters argue that in the short term jobs will be created in planning, designing and building HSR. HSR may therefore spur economic development and the creation of some jobs, particularly around high-speed rail stations. However, economic development is better measured over the long term and over that time frame the benefits are questionable. The U.S. Government Accountability Office (GAO) has noted that “while benefits such as improvements in economic development and employment may represent real benefits for the jurisdiction in which a new high-speed rail service is located, from another jurisdiction’s perspective or from a national view they may represent a transfer or relocation of benefits.”57 On the question of whether HSR can provide economic benefits for the national economy as a whole by increasing labor markets and improving business travel, a UK policy study noted that, “such effects are quite limited in mature economies with well developed infrastructure.”58 This study goes on to point out that building a high-speed rail line between London and Glasgow and/or Edinburgh would probably provide modest economic benefits at best, as air carriers already provide fast and frequent service at a reasonable cost for business and leisure travelers. Transportation facilities are only likely to lead to real economic development if they induce more travel. Yet studies show that only 10–20% of total travel on high-speed rail is new.59 As such, spending money to encourage travelers to switch from low-cost automobiles and planes to high-cost trains will generate very little economic development. Safety: Aviation is the safest transport mode followed by train, bus and automobile.60 The ability of HSR to divert highway travelers to rail is likely to be limited, and the diversion of fliers will make little difference because air transportation is very safe. It is unlikely that HSR will significantly reduce the number of transportation-related deaths and injuries in the U.S. Mobility: High-speed rail is unlikely to reduce congestion on highways or at airports. Travelers would have to switch modes; travelers choose car-travel because of the flexibility it offers and air-travel because of its speeds. Even if car drivers switch to rail, induced demand on highways will lead to new trips on these roads reducing congestion very little. Even if 40% of travelers by car switched to trains, which is four times higher than is likely to happen in the U.S., highway travel would only decrease by 7%.61 Plane travelers are slightly more likely to switch to rail than

12 | Reason Foundation
automobile travelers. And while a forecasted 20–30% decrease in passengers is significant, less- congested skies would cause more people to fly, recreating the problem. And delays in plane travel are mostly due to a 60 year-old radar system, not to insufficient runways or terminals. Modernizing this system would eliminate most of the delays. Choice: There is value in providing travelers with a choice of transportation modes. However, many of these supposed comforts of high-speed rail are the result of government subsidies. Airlines could undoubtedly provide more seating room and food if they too received large subsidies. And while providing customers with different options is helpful, customers in most corridors can already choose between driving, taking a bus and flying. The better question is what is the opportunity cost? Spending an equivalent amount of money on Next Generation air traffic control or on solving highway bottlenecks would benefit many more travelers than building high-speed rail. Reliability: Building redundancy into the transportation system is a smart investment. But does the U.S. system need another layer of redundancy? The current American transportation system has a highway network that offers personalized transportation, an aviation network that offers fast transportation and a burgeoning inner city bus network that offers low-cost transportation. What new value would a high-speed rail network bring to the system? While HSR may provide some relief at congested airports, an unintended effect may be to reduce the profitability of air service. Air service is largely self-supporting through fares. By contrast, most studies show that (to be competitive) HSR fares will need to be substantially subsidized when both capital and operating costs are taken into account. Even in heavily congested areas, it is likely that it would be more effective, and possibly cheaper per passenger, to relieve air traffic congestion through using larger airplanes, expanding airport capacity, applying congestion pricing to takeoff and landing slots and/or implementing an enhanced air traffic control system, such as the Federal Aviation Administration’s Next Generation or “NextGen” system. Some rail proponents contend that high-speed trains will lack the delays associated with automotive and aviation systems. However, to avoid delays high-speed trains need to travel exclusively on dedicated tracks. The California rail system proposes to share tracks with commuter rail services in Los Angeles and California and use conventional tracks for 10% of its rural Los Angeles to San Francisco route.62 High-speed rail is only reliable when it uses a dedicated track. As most planned U.S. service will have to give priority to freight trains, reliability could be very problematic. Meanwhile, airports are implementing the next generation radar systems that will substantially reduce delays. Finally, even if high-speed rail would improve the reliability of the transportation system overall, it may be that spending the money on highway projects instead would have a far greater impact, given that they are used by so many more travelers. Time Savings and Security Delays: The high-speed rail industry has been fortunate to avoid any terrorist activities. However, while planes were once the top target, increased aviation security runs the risk of diverting malicious activity elsewhere—sadly, the hijacking of trains could easily

HIGH-SPEED RAIL IN EUROPE AND ASIA | 13
become a reality. A train bombing, chemical attack or derailment could cause significant destruction, especially at speeds of more than 100 miles per hour. A comprehensive high-speed rail system would almost inevitably end up subject to an extensive security system. This would negate many of the time and cost savings of trains compared to planes. Comfort and Convenience: Many rail proponents argue that rail is a more comfortable and convenient way to travel. But this is a matter of personal preference—many others regard the automobile as superior in this respect. Many high-speed rail services offer reclining seats, but the seats on buses can be just as comfortable. Planes have less leg room, but they aren’t as heavily subsidized as trains. And while train travel may be less hectic in the absence of security screenings, this may regrettably be a temporary benefit. Moreover, passengers still face limits on luggage and the size of carry-ons. Airports do tend to be located outside the central business district, but many residents and businesses, especially in the U.S., are located outside traditional downtowns. Depending on the number of airports in the region and where they are located this may be a slight advantage for trains. However, buses, which offer boardings both inside the CBD and in the suburbs, feature superior options to both rail and plane. Productivity: High-speed rail does allow people to work on the trains. But planes and buses offer the same feature. Some planes are equipped with wireless internet service that is available over 10,000 feet. Many intercity bus lines offer wireless access for the entire trip. More Compact Development: High-speed rail by itself does not create any transit-oriented development (TOD). TOD requires land use changes, an existing developed transit network and a real estate market that will support such development. Some of these factors cannot be controlled. And TOD is not a panacea, as it tends to increase housing costs for the low-income.

14 | Reason Foundation
P a r t 6
Fiscal Evaluation of World Wide High-Speed Rail Systems
There are many different costs to plan, construct, operate and maintain a high-speed rail line. Capital costs include the construction of the track including the sidings and terminal stations, and the train control system and the purchasing of the train vehicles. The operating costs include expenditures needed to run the trains every day. These include costs such as the employees and the power source. Maintenance costs are the funds expended to keep the train operating correctly. Planning costs are the buffer costs that need to be included to counter against inflation, minor changes in scope and unexpected occurrences (e.g. discovery of historical artifacts). All high-speed rail has each of these four costs. Any analysis that does not include all these costs is incomplete. The following tables detail each of these costs. Table 2 examines Europe and Japan. Tables 3, 4 and 5 examine different European countries. Table 6 examines the costs for a theoretical line. Table 2 (on the next page) displays high-speed rail capital costs for the most popular high-speed rail lines with available data. Capital costs vary significantly among different lines. The lines constructed before 1990, (Tokyo-Osaka and Paris-Lyon) built when land prices were lower, had lower construction costs. Generally France’s construction costs are lower than Spain’s or Italy’s. This is a result of the hub and spoke network and the earlier construction dates. It is not a coincidence that the two most fiscally successful lines have the two lowest construction costs per mile. Typically the first high-speed rail line a country builds makes the most economic sense. Politicians then place pressure on builders to construct additional lines that make less financial sense. Note the low cost per mile for the first Japanese line and the escalating costs for the subsequent lines. The third and fourth Japanese lines were 10 times as expensive as the original line per mile. All but three high-speed rail lines require significant subsidies. Even when revenue covers capital costs or operating and maintenance costs, it rarely covers both. When calculating subsidies this report totals construction, operating and maintenance costs compared with ticket revenue over the forecast life of the project, which is typically 40–50 years.

HIGH-SPEED RAIL IN EUROPE AND ASIA | 15
Table 2: Capital Costs of High-Speed Rail of the Most Popular Lines
HSR Line Construction Cost (billions) Miles Cost per Mile (millions)
Tokyo-Osaka $0.92 354 $2.6
Hakata-Osaka $2.95 388 $7.6
Tokyo-Aomori $11.02 335 $32.9
Omiya-Nagata $6.69 209 $32.0
Pairs-Lyon (Southeast) $2.06 623 $3.3
Paris-Tours (Atlantic) $1.72 451 $3.8
Valence-Marseille (Mediterranean) $4.05 497 $4.0
Paris-Baudrecourt (East) $4.37 671 $4.4
Hannover-Wurzberg $7.55 203 $37.2
Mannheim-Stuttgart $2.29 62 $36.9
Madrid-Valladolid $6.31 112 $56.0
Cordoba-Malaga $3.81 96 $40.0
Madrid-Barcelona $10.62 386 $28.0
Torino-Milano $11.68 78 $130.0
Milano-Bologna $10.73 115 $77.0
Bologna-Firenze $8.82 49 $163.0
Roma-Napoli $8.48 129 $58.0
Beijing-Shanghai $35.80 890 $40.0
Shanghai-Hangzhou $4.75 93 $51.0
Wuhan-Guangzhou $18.90 601 $31.4
Haikou-Sanya $3.27 191 $17.1
Sources: HighSpeedRail in Japan: A Review and Evaluation of the ShinkansenTrain, Economic Analysis of High Speed Rail in
Europe, Cost Benefit of the High Speed Train in Spain, HIGH SPEED PASSENGER RAIL: Future Development Will Depend on
Addressing Financial and Other Challenges and Establishing a Clear Federal Role, and China High Speed Rail Facts.
Table 3 displays operating costs of different European high-speed trains with available data. In some cases, multiple trains operate between the same city pair.
Table 3: Operating Costs of High-Speed Rail per Train Country Type of Train Per train (millions) Per Seat Per seat-mile Per train (millions) Per Seat Per Seat-mile
France TGV Reseau $22.1 $60,095 $.1953 $2.09 $5,544 $.018
France TGV Duplex $27.1 $53,394 $.1637 $2.09 $4,098 $.013
France Thalys $32.3 $86,122 $.3115 $2.49 $6,605 $.023
Germany ICE-1 $50.6 $81,224 $.2614 $4.06 $6,475 $.021
Germany ICE-2 $33.8 $92,498 $.3721 $1.83 $4,973 $.020
Germany ICE-3 $23.3 $56,468 $.2164 $2.09 $5,036 $.019
Germany ICE 3 Polyc. $26.5 $66,108 $.2533 $2.23 $5,520 $.021
Germany ICE-T $20.2 $56,842 $.2541 $2.36 $6,611 $.030
Italy ETR 500 $44.4 $75,667 $.3383 $5.24 $8,881 $.040
Italy ETR 480 $27.4 $57,550 $.3216 $4.19 $8,729 $.049
Spain AVE $30.8 $94,310 $.3229 $3.80 $11,550 $.040
Source: International Union of Railways

16 | Reason Foundation
The operating costs of high-speed rail are fairly consistent. Each country has lines that function efficiently and lines that do not perform as well. This is largely due to the political pressures to build additional lines that are not fiscally prudent, as discussed above. France’s operating costs are slightly lower than Germany’s and Italy’s. Table 4 displays the total and per-component maintenance costs.
Table 4: Maintenance Costs of High-Speed Rail
Belgium France Italy Spain
Miles of track 88 1,639 306 590
Track Maintenance $28,973 $40,065 $12,435 $28,324
Electrification $5,393 $8,813 $5,139 $6,251
Signaling $6,799 $10,614 $9,466 $18,115
Telecommunications $2,506 $0 $0 $11,800
Other Costs $22,652 $0 $0 $5,547
Total Costs $66,323 $59,492 $27,040 $70,037
Source: International Union of Railways (N.B. The California High Speed Rail Authority disputes the accuracy of this table.
However, Reason Foundation believes this table from the independent International Union of Railways is accurate, so we
have included it in this report.)
Some aspects of maintenance costs vary and some remain consistent across different countries. While electrification is relatively consistent, Italy spends much less on track maintenance than other countries. This may be a result of the private sector competition. Spain has considerably higher signaling costs than the other countries.
Some communications that are the responsibility of the government train operator in country A are the responsibility of a different party in country B. Both France and Italy report no costs for telecommunications or miscellaneous expenses. Both have such expenses but do not include them in their high-speed rail totals. This artificially lowers these countries’ rail costs.
The next two tables detail how high-speed rail costs are planned using general parameters for both construction and maintenance.
Table 5: Planning Costs for High-Speed Rail Construction Maintenance
Period t = 1 to t = 5 t = 6 to t = 40
Line Length (Miles) 311 311
Unit Value (Dollars per Mile)
§ Best Scenario $18,943,408 $16,914
§ Medium Scenario $37,886,817 $46,639
§ Worst Scenario $82,088,103 $93,804
§ Planning Cost (%) 10% --
Total Value (Dollars per Year)
§ Best Scenario $2,083,774,880 $8,401,872
§ Medium Scenario $4,167,549,870 $23,168,068
§ Worst Scenario $9,029,691,330 $46,597,578
Source: International Union of Railways

HIGH-SPEED RAIL IN EUROPE AND ASIA | 17
Table 5 assumes a construction period of five years and a maintenance timetable of 40 years. One of the major challenges of planning for high-speed rail systems is the variability in costs between the best and worst scenarios. There are several variables that affect these options including right-of-way costs, funding and environmental delays, and buried archeological relics. While it is reasonable to recommend a planning cost of 10% for these different variables, this does not explain large-scale fluctuations in price. High-speed rail is often deliberately underpriced for political reasons. California may have deliberately underpriced HSR so that voters would approve Proposition 1A in 2008. The cost of the California line tripled from its original estimate of $34 billion to $43 billion in 2008 to $98 billion in 2011.63 Many analysts believed that the $234 million proposed non-federal costs for the now-cancelled Florida rail line were underpriced for political reasons.64 Table 6 combines European and Japanese high-speed rail costs into a unified average.
Table 6: Estimated Costs of a 311-mile HSR Line in Europe Cost per unit (thousand) Units Total Cost ($ thousand)**
Capital costs
Infrastructure construction* (Miles) $25,339–$84,465 311 $7,855,000–$52,368,000
Rolling stock (Trains) $19,638 40 $785,520
Running costs (p.a.)
Infrastructure maintenance (Miles) $137 500 $68,500
Rolling stock maintenance (Trains) $1,178 40 $47,120
Energy (Trains) $1,168 40 $46,720
Labor (Employees) $47 550 $25,850
*Terminal Value = 50% of the investment in infrastructure **Total Cost ($ thousand) assumes two tracks
Source: International Union of Railways
Table 6 provides a summary of the total costs. It examines the cost per component, the number of components needed for an average high-speed rail line and the total cost for each component. This chart breaks down capital and operating costs into these respective components. This chart combines actual costs to provide general guidelines. In general, the maintenance of infrastructure and tracks represents 40–67% of total maintenance costs, whereas the signaling costs comprise between 10–35% of the costs in HSR. The relative weight of the electrification costs makes up the third major cost component.
Adding it up: There is no magic formula for predicting high-speed rail profitability but generally rail lines need low construction costs (generally $20 million per mile or less), low operating costs (generally less than $0.20 per occupied seat mile), and high ridership (generally at least 5,000,000 people per corridor).

18 | Reason Foundation
Considering capital, operating, maintenance and planning costs, two high-speed train lines are money-makers—Tokyo to Osaka and Paris to Lyon, one breaks even—Hakata to Osaka—with the potential to make money if it remains in operation for at least 10 more years. All other HSR lines throughout Europe and Japan lose money. Both France’s and Japan’s first high-speed rail lines were economically justified. However, success of those lines created political pressure and a constituency group that urged expansion of the system. Italy built its first rail line before France but slower speeds make it less effective. Germany’s HSR construction was delayed by lawsuits. However, no country has a high-speed rail system that is profitable. The U.S. inspector general estimated the government contributions to passenger operations for each of nine European nations, plus the United States, from 1995 through 2003.65 Comparing these subsidies with passenger-miles of rail ridership during those years reveals that the subsidies in most of these countries are between 20 and 30 cents per passenger-mile. It is conceivable that if France or Japan had stopped with their first or second high-speed line, their system might be profitable. However, neither did. French revenues for the other HSR lines may not even cover ongoing service costs; according to French economist Remy Prud’Homme, French taxpayers foot the bill for “about half the total costs of providing the service.”66 The French and Spanish central government paid the up-front construction costs of their country’s high-speed rail lines with no real expectation that its investment would be recouped through ticket revenues.67 Japan relied on capital recovery that, with the exception of the Tokyo-Osaka line, never materialized. China is a particularly interesting example. While the Chinese government will not release its exact data, nearly half of China’s program is funded by domestic bank loans and bonds. This includes 16% from provincial governments and 25% from a surcharge on freight.68 This spending is not sustainable. One of the problems with high-speed rail is that government money is needed because the private sector is unwilling to pay the exorbitant costs needed for the lines to break even. When Japan privatized its HSR lines, it received only an average of five million yen ($56,402) per km. As such, true public-private partnerships are unlikely because the public subsidies have to be very high for the risk to be acceptable to a private entity. While public-private partnerships are an excellent way to fund other infrastructure improvements, they are unlikely to work for U.S. passenger rail. There is considerable political pressure for both governments and consultants to underprice high-speed rail. If the accurate cost of the Los Angeles-San Francisco California line—$98 million for mostly true high-speed rail since reduced to $65 million for a blended approach—had been divulged to taxpayers, the California bond referendum would have been much less likely to pass. While any infrastructure project can be underpriced, a recent study indicates that rail projects are the most numerous and worst offenders. It is also clear that transportation project cost estimates should be rigorously scrutinized, especially

HIGH-SPEED RAIL IN EUROPE AND ASIA | 19
those authored by project sponsors.69 A study that examined 258 transportation infrastructure projects around the world found that in almost 90% of cases costs were underestimated, that actual costs on average were 28% higher than estimated, and that rail projects in particular were the most severely underestimated, costing on average 45% more than estimated.70 Another world-wide study, which included 27 rail projects, one of which was a high-speed rail project, found that ridership forecasts for over 90% of the rail projects were overestimated, and 67% were overestimated by more than two-thirds. Urban passenger rail projects on average, went 40% over their projected costs. At the same time, U.S. passenger rail planners typically overestimate ridership by an average of about 100%.71 A Reason Foundation review of the California rail authority’s plan called the ridership projections “the most unrealistic projections produced for a major transport project anywhere in the world.”72 One reason that high-speed rail loses money is project sponsors overestimate the number of travelers who will switch from car or plane. This will be an even bigger problem in the U.S. than in Europe and Japan. A 1997 study on the feasibility of high-speed rail in the U.S. conducted by FRA determined that in most cases rail improvements would divert only 3%–6% of intercity automobile trips. 73 The Department of Transportation’s Inspector General (IG) reached a similar conclusion in a more recent analysis of HSR in the Northeast Corridor. The IG examined two options: the first involved cutting 30 minutes from journey times between Boston and New York, and New York and Washington DC, to 3 hours and 3.5 hours respectively; the second option cut journey times on both routes by 60 minutes. In both scenarios the IG found that the improvements reduced automobile ridership along the NEC by less than 1%.74 The IG noted “automobile travel differs from air or rail travel in that it generally involves door-to-door service, offers greater flexibility in time of departure, and does not require travelers to share space with strangers. Consequently, rail travel must be extremely competitive in other dimensions, such as speed or cost, to attract automobile travelers.”75 Several of the previous high-speed rail studies have overestimated the number of automobile users who choose rail over highway or air by a factor of 10.76 Estimates of the level of ridership needed to justify the cost of high-speed systems similar to those in other countries range from six million to nine million riders per line in the first year.77 While this may be realistic in Europe and Japan, it would be challenging to reach such numbers in the U.S. To put that figure in context, Amtrak’s current high-speed service, the Acela, which began operating in 2000 in the most densely populated corridor in the United States, only carries a total of 3.4 million passengers per year.78 The following two tables detail the differences in travel time and ticket costs between train and plane for tickets purchased one week in advance and two months in advance. The train travel time is the time between leaving the origin station and arriving at the destination station. The plane travel time is the time between departing the gate at the origin city and arriving at the gate at the destination city. Customers traveling by plane must include time to travel through security. Since airline passengers must arrive much earlier for their flights than rail passengers due to the time needed to pass through security screening, it may be more accurate to add 15 minutes to the rail trip times and 45 minutes to the air trip times.

20 | Reason Foundation
Table 7: Round-Trip Ticket Prices to Selected Cities Purchased One Week in Advance
Travel Cities Distance Miles Travel-Time Price Train Round Trip Price Plane Round Trip
Tokyo-Osaka 246 2:17 train 1:05 plane $302 $104
Hakata-Osaka 300 2:39 train 1:05 plane $336 $110
Tokyo-Aomori 358 3:10 train 1:15 plane $362 $648
Omiya-Niigata 160 1:37 train 1:05 plane $212 $386
Paris-Lyon 264 2:10 train 1:10 plane $181 $159
Madrid-Barcelona 386 3:00 train 1:15 plane $339 $141
Paris-London 214 2:20 train 1:15 plane $199 $107
Brussels-London 198 2:05 train 1:10 plane $120 $197
Rome-Milan 296 3:30 train 1:10 plane $190 $89
London-Lille 151 1:40 train 4:10 plane* $183 $183
Paris-Marseille 411 3:15 train 1:15 plane $251 $118
Paris-Amsterdam 321 3:20 train 1:15 plane $157 $284
Brussels-Cologne 114 1:55 train 6:30 plane* $81 $259
Paris-Geneva 254 3:10 train 1:05 plane $188 $115
Amsterdam-Frankfurt 226 1:15 plane 3:56 train $155 $208
Berlin-Cologne 299 4:25 train 1:05 plane $362 $143
Naples-Florence 255 2:50 train 3:05 plane $102 $386
Madrid-Seville 241 1:10 plane 2:25 train $240 $197
Paris-Milan 399 1:30 plane 7:15 train $238 $101
Haikou-Sanya 140 2:05 train 8:00 plane* $28 $563
Wuhan-Guangzhou 520 1:30 plane 3:10 train $151 $198
Beijing-Shanghai 665 2:10 plane 5:10 train $175 $224
Shanghai-Hangzhou 110 4:00 plane 1:15 train $20 $420
* Plane trip includes stop or change of planes
Sources: RailEurope, TravelChinaGuide, Japan Guide, Lufthansa, Ryanair, Easyjet, Air France, Iberia Airlines, All Nippon
Airways and Japan Airways.
With the exception of China, in more than 50% of the cases, trips by plane are both faster and cheaper than trips by rail. Trips by rail are sometimes faster if plane travel requires connections. Trips by plane are typically more expensive without the presence of discount airlines. On both the Tokyo-Osaka and Paris-Lyon journey, plane travel is cheaper and faster than rail travel. The time difference in both cases is an hour or more, negating the flight security time of airplanes. Train travel is more expensive both in the short-term (1 week) and the long-term (2 months) although the price difference is smaller for tickets booked at the last minute (1 week).
HIGH-SPEED RAIL IN EUROPE AND ASIA | 21
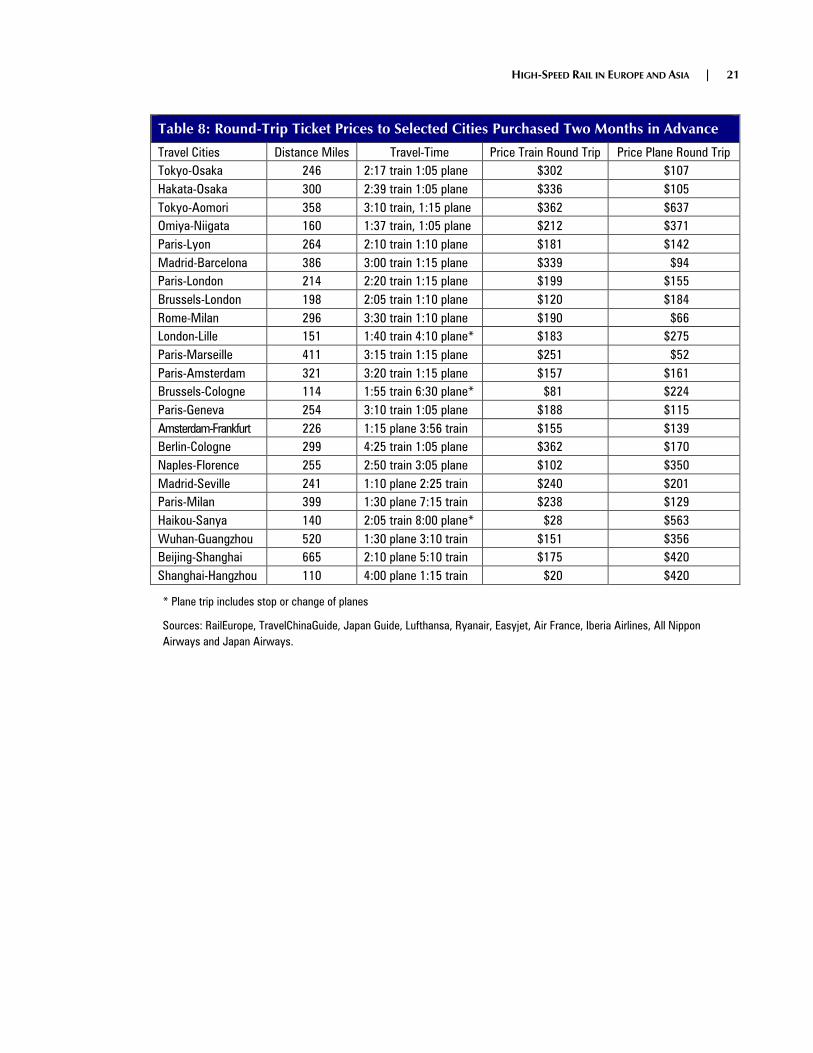
Table 8: Round-Trip Ticket Prices to Selected Cities Purchased Two Months in Advance
Travel Cities Distance Miles Travel-Time Price Train Round Trip Price Plane Round Trip
Tokyo-Osaka 246 2:17 train 1:05 plane $302 $107
Hakata-Osaka 300 2:39 train 1:05 plane $336 $105
Tokyo-Aomori 358 3:10 train, 1:15 plane $362 $637
Omiya-Niigata 160 1:37 train, 1:05 plane $212 $371
Paris-Lyon 264 2:10 train 1:10 plane $181 $142
Madrid-Barcelona 386 3:00 train 1:15 plane $339 $94
Paris-London 214 2:20 train 1:15 plane $199 $155
Brussels-London 198 2:05 train 1:10 plane $120 $184
Rome-Milan 296 3:30 train 1:10 plane $190 $66
London-Lille 151 1:40 train 4:10 plane* $183 $275
Paris-Marseille 411 3:15 train 1:15 plane $251 $52
Paris-Amsterdam 321 3:20 train 1:15 plane $157 $161
Brussels-Cologne 114 1:55 train 6:30 plane* $81 $224
Paris-Geneva 254 3:10 train 1:05 plane $188 $115
Amsterdam-Frankfurt 226 1:15 plane 3:56 train $155 $139
Berlin-Cologne 299 4:25 train 1:05 plane $362 $170
Naples-Florence 255 2:50 train 3:05 plane $102 $350
Madrid-Seville 241 1:10 plane 2:25 train $240 $201
Paris-Milan 399 1:30 plane 7:15 train $238 $129
Haikou-Sanya 140 2:05 train 8:00 plane* $28 $563
Wuhan-Guangzhou 520 1:30 plane 3:10 train $151 $356
Beijing-Shanghai 665 2:10 plane 5:10 train $175 $420
Shanghai-Hangzhou 110 4:00 plane 1:15 train $20 $420
* Plane trip includes stop or change of planes
Sources: RailEurope, TravelChinaGuide, Japan Guide, Lufthansa, Ryanair, Easyjet, Air France, Iberia Airlines, All Nippon
Airways and Japan Airways.

22 | Reason Foundation
P a r t 7
Variables Determining High-Speed Rail Success
There are several variables that help determine the success of high-speed rail. The first is population density near the rail station. While the Los Angeles metro area has the highest U.S. population density, it is dwarfed by European and Asian cities. The least dense major city in Europe, Berlin, has about twice the population density of New York City. Since HSR requires high urban densities, particularly those concentrated close to major rail stations, extending HSR to places without the ability or desire to encourage high densities is unlikely to be successful. Table 8 compares the population density of selected major world cities. Most U.S. cities are substantially less dense than their European counterparts. Trains depend on population density to operate efficiently. To compete with the airlines, trains must depart frequently but they must also fill, or nearly fill, their seats to generate enough ticket revenue to cover their operating costs. Both the population size of a city and the concentration of economic activity in the central business district and near the train station(s) are important determinants in the percentage of people who ride rail transit. This means that New York City is more suited for train travel than many other U.S. cities because of the high concentration of activity on the island of Manhattan. About 35% of the city’s jobs are within three miles of Wall Street, while in other American cities, on average, about 22% of employment is within a three-mile radius of the city’s center.79 Although the nation as a whole is becoming more urbanized, trends show that employment is steadily decentralizing in almost all U.S. cities.80
Table 9: Density of Selected World Cities
U.S. City People per Mile European City People per Mile Asian City People per Mile
Los Angeles 6,100 London 13,700 Mumbai 80,100
New York 4,600 Barcelona 13,600 Karachi 66,800
Washington 3,500 Paris 9,800 Shanghai 15,500
Chicago 3,400 Berlin 9,100 Tokyo 11,300
Source: Demographia, World Urban Areas (8th Annual Edition)
American affluence and its effect on the earlier availability of automobiles is another significant factor. Unlike Europe and Asia, which sustained major damage during World War II, U.S. infrastructure was not affected by the war. Post-World War II U.S. citizens were wealthier than

HIGH-SPEED RAIL IN EUROPE AND ASIA | 23
their counterparts in other countries. As a result average 1950 U.S. automobile ownership rates were higher than in other countries. Consequently there is a much higher percentage of post-World War II automobile-oriented development in the U.S. Connectivity of rapid transit is the third major factor. In Tokyo and Paris, passengers can arrive at stations and travel by heavy-rail or commuter-rail to nearly all the destinations in the urban area. A short taxi ride or bus ride may be necessary to reach one’s final destination. In the U.S. very few metro areas are sufficiently dense or have the extensive transit systems necessary to make this possible. And since transit usage is one of the greatest indicators for rail success, ridership is important: only in the New York urban area does transit account for more than 15% of total travel. In three of the 10 largest U.S. metro areas, it is less than 5%.81 Contrast this with Paris where it is 25% and Tokyo where it is 60%.82 This does not bode well for the success of high-speed rail in the U.S.

24 | Reason Foundation
P a r t 8
Government Travel Policy
Compared with the U.S., Asian and European cities have lower per capita levels of car ownership, higher gas prices, lower levels of car use (measured both by number of trips per day and average distance per trip) and higher levels of public transportation availability and use.83 It is important to note, however, that the main reason people drive fewer miles is not the option of public transit, but rather the higher costs of overall travel.84 Automobile travel is significantly more expensive in Europe than in the U.S. Gas prices are approximately 2.2 times higher in Europe.85 A significant portion of the higher prices are taxes that subsidize non-highway government operations including rail and transit. Gas taxes make up 60% of the cost of gasoline in Britain, and about 55% of the costs in Germany.86 In comparison, gas taxes range from 7 to 17% in the U.S.87 Table 5 compares average gas price in 2008. Between 2000 and 2009, the gas tax in real dollars has increased in 27 out of 28 EU countries. It has held steady in the United States. Between 2000 and 2009 the gas tax as a percentage of fuel costs has increased in 19 EU countries by an average of $0.41 and decreased in nine by an average of $0.47, but decreased in the United States by an average of $0.12. 88 Eight European countries have raised the gas tax since 2009 while the U.S. rate has remained steady.
Sources: International Energy Agency; Brookings Institution, Job Sprawl Revisited: The Changing Geography of Metropolitan
Employment.
Table 10: International Energy Agency’s Energy Prices and Taxes 2nd Quarter 2008 per Liter of Gasoline for 10 Randomly Surveyed Countries Country Price of Liter of
Gas Before Tax
Tax Total Price
in Dollars
Taxes as a Percent
of Total Prices
Percentage Increase in Base
Prices as a Result of Taxes
Mexico 0.571 0.085 0.656 13 15
United States 0.687 0.133 0.82 16 19
Canada 0.758 0.322 1.08 30 42
Australia 0.786 0.457 1.243 37 58
New Zealand 0.804 0.550 1.354 40 66
Japan 0.876 0.581 1.457 41 68
South Korea 0.823 0.910 1.733 53 111
Austria 0.807 1.010 1.817 56 125
Denmark 0.807 1.232 2.039 60 153
Germany 0.786 1.328 2.114 63 169

HIGH-SPEED RAIL IN EUROPE AND ASIA | 25
While many countries in the world have a limited access highway network, few rival the U.S. system in total length. And most of these international systems are tolled, which reduces traffic volumes. While tolling the U.S. system is possible, it is currently politically unpopular and realistic only for sections of highway that are substantially rebuilt. At 47,000 miles the Interstate system is the largest limited access highway network in the world.89 China’s tolled national trunk system at 46,000 miles is the second largest in the world.90 If you combine the European counties of Belgium France, Germany, Italy, the Netherlands, Portugal, Spain and Switzerland into a Western European network, both the population and the limited access highway mileage are slightly less than in the U.S. Spain’s tolled Autopista network, consisting of 8,620 miles, is the third largest limited access system in the world—but it would still take almost six Autopistas to equal the Interstate system.91 And while Spain does have an older, untolled Autovia system, this is very limited in size and is not being expanded. The fourth largest limited access highway system is Germany’s Autobahn network.92 The Autobahn is free for cars but tolled for trucks. France’s tolled Autoroute system includes 7,450 miles of toll road.93 Italy’s Autostrata tolled network is similar.
Table 11: Difference in Limited Access Highway Network in Selected Countries
Country or Region Mileage Limited Access Highways* Population Residents per Highway Mile
United States 47,000 315,000,000 6,702
China 46,000 1,300,000,000 28,260
European Combined** 41,000 286,000,000 6,975
* Limited Access Highway miles are rounded to the nearest thousand.
**European Combined consists of Belgium, France, Germany, Italy, Netherlands, Portugal, Spain and Switzerland.
More significant is the date these systems were built. With the exception of the Autobahn system, which was built in the 1930s, most highway systems were built after the Interstate system. China’s system was built exclusively over the past 20 years. China had no highway network before 1988.94 France’s system was built mainly in the 1960s and Spain’s system mainly in the 1970s. In other words, many systems were built at the same time or after conventional rail networks were established. Most European countries have substantially more rail mileage per capita than the U.S. As seen in Table 12, Spain has the least track per mile for any major European country. However, it still has 22% more track than the United States. Furthermore, passenger train service in Europe is substantially more integrated into modern life. Railways are more popular there than in the U.S. Many countries implemented high-speed rail to relieve over-crowded conventional trains.95 Other countries developed service to preserve existing high-ridership levels. As the U.S. has very low ridership levels for Amtrak, train conditions in the U.S. are not comparable with Europe and Japan. Even so, in most countries high-speed and conventional rail service still represent less than 10% of all passenger miles traveled by land.96

26 | Reason Foundation
Table 12: Amount of Rail Track by Square Mile
Country Square Area Length of Track Area in Square Miles per One Mile of Track
United States 9,826,675 224,793 43
European Union 4,324,782 228,710 19
Belgium 30,528 3,233 9.4
Britain 130,395 16,454 7.9
China 9,596,961 86,000 112
Denmark 43,094 2,667 16
France 643,801 29,640 22
Germany 357,022 41,981 8.5
Holland 41,543 2,896 14
Italy 301,340 20,254 15
Japan 377,915 26,435 14
Spain 505,370 15,293 33
Source: The World Bank, Rail lines (total route-km)
Most rail in Europe is not high-speed. In Europe as a whole, 20% of the total network is high-speed.97 France’s network, which has the highest percentage of high-speed tracks, is only 50% high-speed rail.98 The U.S. High Speed Rail Association calls for a 17,000-mile network by 2030.99 Amtrak’s total rail network today is only 21,000 miles.100 The High Speed Rail Association’s proposed mix of upgraded and new tracks would give the U.S. the largest percentage of high-speed rail as a percentage of total rail in the world. Many of the agency’s proposed high-speed rail routes, such as lines linking Salt Lake City, Boise, and Seattle and another line linking Albuquerque and Dallas do not presently have Amtrak service. As a result, demand estimates for high-speed rail are bound to be speculative at best. Another important factor is the tracks’ main use. In Europe railroads transport passengers; in the United States railroads transport goods. As the U.S. is proposing to run additional passenger trains on tracks owned by freight companies, increasing the number of passenger trains could hamper the operations of freight trains. Europe’s freight travels by truck, at a slower speed than in the United States. In Japan, less than 4% of freight travels by rail.101 In the last 30 years, the U.S. volume of goods transported by rail has grown 300%, and railroads represent about 40% of the total freight ton-miles, which is the most of any transportation mode.102 In Europe rail represents less than 10%.103 Based on purchasing power parity, the United States has the cheapest freight costs in the world. If the U.S. has a base rate of 100, Canada, China and Russia have freight costs between 100 and 200.104 Other major countries—including all European countries—have levels above 200. While much of U.S. freight is low value, like coal, and most European freight is higher value, the difference in freight costs is still enormous. Passenger rail using these existing tracks would increase track congestion leading to higher freight costs.

HIGH-SPEED RAIL IN EUROPE AND ASIA | 27
There is also a significant difference in the structure of the rail industry in most European and Asian countries compared with the United States. In most European countries and China, state-owned rail companies operate high-speed rail over a state-owned rail network—a network on which passenger rail service was far more prominent than freight service even before the introduction of high-speed rail. Only in Japan is the system privatized. Other countries such as the United Kingdom and Italy have nationalized networks with trains operated by private companies. By contrast, in the United States the rail network is almost entirely privately owned, and freight service is far more prominent than is passenger service. Even if HSR is widely introduced, and other factors that are more conducive to intercity passenger rail travel emerge, it will likely remain a small share of overall travel in the United States. In most European and Asian countries, intercity rail travel (including both conventional and high-speed rail) represents less than 10% of all passenger miles traveled on land.105 Eighty percent of European rail travel is on conventional rail. Rail’s share of passengers continues to decrease in Europe. In 1980, rail carried 8.2% of all intercity passengers.106 In 2000, rail carried 6.3% of all intercity passengers. The introduction of high-speed rail has not stopped commuters from shifting to automobile or plane travel. Residents of France use high-speed rail more than residents of any other country in the world. And the average citizen travels 7,600 miles by auto each year and only 400 miles by high-speed train.107 From 2004 to 2009 the number of passengers on German rail declined by 16 million despite the completion of hundreds of new miles of high-speed rail. European Union citizens average 100 miles of high-speed rail travel per year.108 Even where new high-speed rail services are being offered, automotive and plane usage has increased more quickly over the past 40 years. In Japan between 1965 and 2005, per capita driving increased by more than 900%, while per capita rail travel increased only 19%.109 The average Japanese person travels about 1,950 miles per year by train, which is more than people in any other country. But only about 20% of those rail-miles are by high-speed rail. Automobiles carry 60% of passenger travel, and the remainder is divided between bus and domestic air.110 In the European Union, the number of passenger cars grew 2.4% between 1990 and 2005.111 There are now two people for every car. Moreover, airline travel doubled worldwide between 1978 and 2000, largely as a result of deregulation, which lowered ticket prices and opened up additional routes.112 Such a scenario is highly unlikely in the case of high-speed rail. The make-up of Amtrak—the U.S. passenger rail provider—is also different from most European and Asian rail operators. Labor costs in the U.S. are typically lower than those in Europe. However, Amtrak’s labor costs are higher than many public sector European railways. Amtrak’s labor costs comprise about half of its total operating costs.113 Similar to airline staff, railway workers are heavily unionized. But unlike airlines, which have significantly restructured operating contracts over the last ten years, railways continue to rely on 50 year-old labor laws, like the Railway Labor Act of 1926, the Federal Employers Liability Act of 1908, and the Railroad Retirement Act of 1934, all of which were enacted when railroads did not

28 | Reason Foundation
face competition from automobiles, buses or planes.114 At that time, railroads provided the sole cargo and mass passenger transportation, and as such they were integral to the development of commerce. European railways do not operate under these outdated laws. It is clear that changing the laws governing railroad labor could significantly reduce costs, as current labor laws significantly restrict rail-worker productivity gains.115 About 9 out of 10 Amtrak employees are unionized and are covered by collective bargaining agreements. These collective bargaining agreements establish work rules limiting the type of work that employees can perform. For example, current rules specify that most Amtrak employees cannot perform tasks outside their enumerated work duties for more than two hours per day.116 Regardless of other factors, it would be challenging for any operator to provide high-quality cost-effective service under these rules. Furthermore, it is worth noting that unlike the airline and intercity bus industries, where competition among carriers is credited with spurring efficiencies such as the “low-cost” carrier phenomenon, Amtrak has often been criticized for complacency in pursuing cost savings. According to the Department of Transportation Inspector General, “Amtrak, as the sole provider of intercity passenger rail service has few incentives, other than the threat of budget cuts or elimination for cost control or delivery of services in a cost-effective way.”117 Opening rail service to competition is one potential way to decrease costs and increase service quality. However, there are several obstacles to opening rail service to competition. Outside the northeast corridor, passenger trains operate on freight-owned tracks. Congress has given Amtrak special access to these tracks; private companies would not necessarily have this access. Laws would need to be changed to allow private operators the same access as Amtrak. To accommodate multiple operators, there has to be some method for acquiring track rights or slots to operate trains. One option is to have rail operators bid on these slots. The United Kingdom solved this problem in another manner by providing concessions to train operators to provide service over specific routes for a period of several years.118 In both instances, competition occurs when prospective operators bid and compete amongst each other on the terms of their proposals, such as the level of service they promise to provide. However, since the profit potential in the U.S. is much more limited than it is in Europe, the opportunities for the private sector to become involved may be very limited. Passenger HSR users must support costs that aviation users do not have to pay and that road users share. In aviation, there are no costs to travel on air. As a result air travelers must pay for only the costs to build, maintain and operate the aircraft. Road users—such as cars, buses and trucks—must support road construction and maintenance. However, since they each use the same roads, they share the road costs. Passenger rail users must support both the capital and operating costs of the vehicle and the capital and maintenance costs of the track. And since true high-speed rail trains cannot safely share track with freight trains, passenger HSR users must pay the entire costs to build and maintain the track as well. And these costs do not account for required safety costs, such as positive train control, that are not necessarily required for other travel modes.

HIGH-SPEED RAIL IN EUROPE AND ASIA | 29
P a r t 9
Analysis and Conclusion
Most high-speed rail lines are major money losers. Based on data from Europe and Asia, most HSR lines in the United States are expected to lose substantial amounts of funds. Only the Northeast Corridor could potentially break even. And this would require United States construction costs to be in line with the rest of the world. Typically U.S. construction costs are two times higher. The U.S. lacks many of the factors that make high-speed rail successful in other countries. For starters, the U.S. has neither the population density nor the land-use regulations necessary to support the development of high-speed rail. It lacks a pre-existing, successful passenger rail system, and spends far less on urban transit than Europe and Japan. High-speed rail cannot work in a vacuum—in the absence of large urban populations clustered around city center rail terminals and extensive transit systems that allow passengers to easily complete their journeys, high-speed rail will never be an appealing transportation choice to most travelers. Secondly, the U.S. is a uniquely auto-centric country: it has a much lower gas tax, cheaper gas prices and a much more extensive free highway network than comparable countries around the world. The U.S. interstate network remains the only large-scale toll-free network in the world for both cars and trucks. As a result, car travel is deeply embedded in the American economy, culture and geography. Simply building new high-speed rail lines will do nothing to change that. Thirdly, it is important to remember that Europe and Japan built high-speed rail because their conventional lines were so successful that they needed to add capacity to increase train service. Many of these lines already had double or triple tracking. The high demand for conventional rail created a market for high-speed rail. This clearly cannot be said of the U.S. China, by contrast, is building high-speed rail to stimulate development and to improve its very limited transportation infrastructure. Whether high-speed rail actually produces lasting economic benefits in China remains to be seen. Moreover, China has long underinvested in infrastructure, and is also rapidly building a highway network. In other words, it is at a very different stage of infrastructure development than the U.S., and therefore does little to make the case for high-speed rail on U.S. soil. Another crucial difference between the U.S. and other countries when it comes to high-speed rail is that its railways are dominated by freight traffic. The U.S. freight rail system is one of the largest and least expensive in the world. Freight is four times more likely to travel by rail in the U.S. than

30 | Reason Foundation
in Europe and 10 times more likely than in Japan. In this context, using policy to shift more passenger travel onto rail may have the unintended consequence of displacing freight onto the highway system, increasing road congestion, producing pollution, and driving up the cost of goods. This is another blind spot in the case for high-speed rail in America. Crucially, high-speed rail also tends to be very expensive—for both travelers and taxpayers. Practically everywhere it operates, high-speed rail is more expensive (and slower) than plane travel. Those on a very tight budget would be better off traveling by bus, while those seeking flexibility would likely stick with the automobile. And yet despite high prices, only two of the world's high-speed rail lines have turned a profit. The rest lose substantial amounts of money and require taxpayer subsidy. Even the world's most successful high-speed line, which runs between Tokyo and Osaka in Japan, must be subject to a disclaimer: it was built when only 12% of the Japanese population had cars. As such, it might not be cost-effective if it were being proposed today. In the U.S., it is difficult to argue that any high-speed line beyond the Northeast Corridor stands a chance of paying for itself. Moreover, system-wide high-speed rail costs will undoubtedly escalate for political reasons. Politicians representing cities that are less appropriate for rail will demand routes or hold the process hostage. Such political realities were one of the negative aspects of the Interstate system. But while those unneeded Interstate highways cost millions in today’s dollars, extra high-speed rail lines will cost billions. As for the supposed advantages of high-speed rail over air travel and highways, few of these stand up to critical scrutiny. Firstly, its economic benefits are questionable at best: it may shift economic activity and development to the areas it affects, but there is scant evidence that it produces any new, positive-sum benefits. Moreover, if creating construction jobs is the goal, other infrastructure projects may make more economic sense: the U.S. has many unmet infrastructure needs that would rationally take priority over high-speed rail (like widening or modernizing highways). Secondly, rail only reaps environmental benefits if it is electrified. Otherwise it is no less polluting than modern cars or planes. The president’s proposal, however, uses old-fashioned heavy locomotives to offer higher speed rail at speeds of 110–150 miles per hour. These higher-speed locomotives will be more energy-intensive than today’s trains. Moreover, many of the presumed environmental benefits of high-speed rail rely on trains being full—this is not the case with existing Amtrak trains, so it is hard to see why it would be so for high-speed rail. Again, if environmental improvement is the goal, the money could be more efficiently spent elsewhere—a mere fraction of the HSR funds spent on pure pollution-reduction programs would be far more effective from an environmental perspective. Thirdly, high-speed rail is unlikely to make much of a dent in congestion elsewhere in the transportation system. According to the Federal Railroad Administration, only 5% of highway trips (at most) will be diverted to rail. And while HSR may slightly reduce air travel, it is likely to affect regional flights more than national flights. Since regional flights typically originate from smaller

HIGH-SPEED RAIL IN EUROPE AND ASIA | 31
airports, HSR will do little to reduce air delays. In fact, high-speed rail probably won't even ease rail congestion significantly—since most of the proposed routes involve sharing track with existing freight and passenger traffic, delays system-wide may actually increase. Ultimately, then, high-speed rail is not a compelling proposition for the U.S. A dispassionate examination of the case for high-speed rail, as well as an international comparison with high-speed experience in Europe and Asia, suggests that the U.S. government risks making a very costly mistake that will hit taxpayers for years to come, while delivering on few—if any— of its presumed benefits. Transportation policymakers need to go back to the drawing board and think again.

32 | Reason Foundation
About the Author
Baruch Feigenbaum is a Transportation Policy Analyst at Reason Foundation, researching and implementing transportation policy reforms. He wrote Getting Georgia Going, an in-depth transportation study detailing the Georgia 1% Special Purpose Local Option Sales Tax that was cited by leaders both for and against the tax. He has also written about public-private partnerships, the federal TIGER program, high-speed rail, and bicycle commuting. He is a member of the Transportation Research Board Intelligent Transportation Systems Committee and is actively involved with the Revenue and Finance, Bus Transit Systems, and Metropolitan Planning and Processes Committees. He is a Council Member of the Transportation and Research Forum Washington Chapter, the American Planning Association, Institute of Transportation Engineers, and Young Professionals in Transportation. His work has been featured in the Atlanta Journal-Constitution and the Washington Post. Prior to joining Reason he handled transportation issues on Capitol Hill for Representative Lynn Westmoreland. He earned his Master’s degree in City and Regional Planning from the Georgia Institute of Technology.

HIGH-SPEED RAIL IN EUROPE AND ASIA | 33
Endnotes 1 International Union of Railways, General Definitions of Highspeed, (Paris, 2012)
http://www.uic.org/spip.php?article971 2 U.S. Department of Transportation, Federal Railroad Administration, Vision for High-Speed
Rail in America, High-Speed Rail Strategic Plan (Washington D.C, 2009), http://www.fra.dot.gov/downloads/Research/FinalFRA_HSR_Strat_Plan.pdf.
3 J. Campos and G. de Ras, “Some stylized facts about high-speed rail: A review of HSR experiences around the world,” Transport Policy, volume 16 no. 1, (2009), pp. 19-28.
4 David Peterman, John Frittelli and William Mallett, Congressional Research Service, High Speed Rail in the United States, (Washington, D.C.: 2009), p. 6.
5 Ibid, p. 7. 6 Hiroki Matsumoto, “Shinkansen (Bullet Train) Systems in Japan,” testimony before House
Transportation and Infrastructure Committee meeting on International High-speed Rail, Washington, D.C., April 19, 2007, p. 2, http://republicans.transportation.house.gov/Media/File/Testimony/Rail/4-19-07-Matsumoto.pdf
7 Ibid. 8 ABB Railway, On the Fast Track, (Zurich: ABB Press, February 2010), pp. 15-16,
http://www05.abb.com/global/scot/scot271.nsf/veritydisplay/8af581a747e83e29c125777500325b3a/$file/14-18%202m035_eng_72dpi.pdf, accessed January 15, 2012.
9 European Commission, Panorama of Transport, (Luxembourg, 2009), p. 16. 10 Gaia Pianigiani, “On High-Speed Rails, a New Challenger in Italy,” The New York Times,
April 28, 2012, http://www.nytimes.com/2012/04/29/world/europe/on-high-speed-rails-a-new-challenger-in-italy.html
11 Beatriz Rutzen and C. Michael Walton, Center for Transportation Research, High Speed Rail: A Study of International Best Practices and Identification of Opportunities in the U.S., (College Station, TX: 2011), p. 10.
12 Ibid. 13 Takashi Endo, “Aiming at Higher Speeds for Shinkansen,” Japan Rail & Transport Review,
no. 36 (September, 2003), p. 33. 14 Lizzy Davies, “High-speed rail in France: Way out in Front—and Pushing Further Ahead,”
The Guardian, August 5, 2009. 15 Ibid. 16 Invensys, The Benefits of High-Speed Rail in Comparative Perspective, (Chippenham,
England: Invensys Publications, 2012), p. 18.

34 | Reason Foundation
17 Panorama of Transport, p. 17. 18 Peterman, Frittelli and Mallett, High Speed Rail in the United States, p. 9. 19 Michael Renner and Gary Gardner, Apollo Alliance, Global Competitiveness in the Rail and
Transit Industry (Boston, MA, 2010), p. 20. 20 Peterman, Frittelli and Mallett, High Speed Rail in the United States, p. 9. 21 Spanish Ministry of Public Works: Administrator of Railway Infrastructure, The Spanish
Railway Development Under the Strategic Plan for Infrastructure and Transport (Madrid Spain, 2004), p. 2. http://www.fomento.es/MFOMWeb/paginas/buscar.aspx.
22 Ibid. 23 European Transport Commission, EU Energy and Transport in Figures, (Luxembourg, 2009),
p. 105, http://ec.europa.eu/energy/publications/doc/2009_energy_transport_figures.pdf, accessed September 4, 2012.
24 David Feng, “A Complete Guide to China’s High-Speed Rail,” CNN GO, November 20, 2011. 25 “China to Operate 16,000 kilometers of passenger-dedicated lines by 2020,” Xingua News
Agency, November 27, 2008, http://www.china.org.cn/government/central_government/2008-11/27/content_16864800.htm, accessed September 4, 2012.
26 Malcolm Moore, “Chinese rail crash scandal: ‘official steals 2.8 billion,’” The Telegraph, August 1, 2011.
27 Ambrose Video Resources, Timelines for Railroads in U.S. History, 2011, http://www.ambrosevideo.com/resources/documents/Railroads%20in%20U%20S%20%20History%20Timeline.pdf, accessed March 1, 2012.
28 Peterman, Frittelli and Mallett, High Speed Rail in the United States, p. 10. 29 Joseph Vranich and Edward Hudgins, Help Passenger Rail by Privatizing Amtrak, Policy
Analysis 419, (Washington D.C.: Cato Institute, November, 2011), p. 7. 30 United States Department of Transportation, High Speed Intercity Passenger Rail Program:
Project Selection and Funding, (Washington D.C., November 2011), http://www.fra.dot.gov/rpd/passenger/2243.shtml, accessed January 15, 2012.
31 Ibid. 32 Ibid. 33 Ibid. 34 Ibid. 35 Ibid. 36 Federal Highway Administration, A Summary of Highway Provisions in SAFETEA-LU, August
25, 2005, http://www.fhwa.dot.gov/safetealu/summary.htm.. 37 United States Department of Transportation, High Speed Intercity Passenger Rail Program:
Project Selection and Funding, May 9, 2011, http://www.fra.dot.gov/rpd/passenger/2243.shtml.
38 These reports include: Peterman, Frittelli and Mallett, High Speed Rail in the United States, United States Government Accountability Office, High Speed Passenger Rail: Future

HIGH-SPEED RAIL IN EUROPE AND ASIA | 35
Development Will Depend on Addressing Financial and Other Challenges and Establishing a Clear Federal Role, (Washington, D.C., 2009), p. 24.
39 For more details see Wendell Cox and Robert Poole, The Tampa to Orlando High-Speed Rail Project: Florida Taxpayer Risk Assessment, Reason Foundation Policy Brief 95 (Los Angeles: Reason Foundation, January 2011); Randal O’Toole, High-Speed Rail The Wrong Road for America, Cato Institute Policy Analysis 625 (Washington, D.C.: Cato Institute, October 2008); Ron Utt, America’s Coming High-Speed Rail: Financial Disaster, The Heritage Foundation Backgrounder 2389 (Washington, D.C.: The Heritage Foundation, March 2010).
40 California High Speed Rail Authority, Sustainability (Sacramento CA, 2013), http://www.cahighspeedrail.ca.gov.
41 United States High Speed Rail Association, Numerous Benefits with Train Systems (Washington D.C: Government Printing Office, 2012, http://www.ushsr.com/benefits.html.
42 Ibid. 43 Ibid. 44 Peterman, Frittelli and Mallett, High Speed Rail in the United States, p. 18. 45 Ibid, p. 16. 46 United States High Speed Rail Association, Numerous Benefits with Train Systems. 47 Ibid. 48 Ibid. 49 U.S. Environmental Protection Agency, California Environmental Quality Act and National
Environmental Policy Act, Environmental Impact Statement (Washington, D.C.: Government Printing Office, 2004), pp. 6-10,
California Air Resources Board, Climate Change Proposed Scoping Plan, (Sacramento, CA: 2008), p. 56.
50 Andres Kosinski, Lee Schipper and Elizabeth Deakin, Analysis of High-Speed Rail’s Potential to Reduce CO2 Emissions from Transportation in the United States, (Washington D.C.: Transportation Research Record, 2012).
51 Environmental Protection Agency, California Environmental Quality Act and National Environmental Policy Act, Environmental Impact Statement.
52 Ibid. 53 Ibid, p. 17. 54 Federal Highway Administration, Federal Railroad Administration, Final Environmental
Impact Statement Florida High Speed Rail Tampa to Orlando (Washington D.C.: Government Printing Office, 2005), pp. 4-48.
55 Ibid, pp. 4-111. 56 Ibid, pp. 2-28. 57 United States Government Accountability Office, High Speed Passenger Rail: Future
Development Will Depend on Addressing Financial and Other Challenges and Establishing a Clear Federal Role, p. 27.
58 Ibid.

36 | Reason Foundation
59 Ibid. 60 National Highway Transportation Safety Administration, 2011 Database: Incidents by Mode,
(Washington, D.C: Government Printing Office, 2011), p. 14. 61 United States Government Accountability Office, High Speed Passenger Rail, p. 19. 62 California High-Speed Rail Authority, Revised 2012 Business Plan, (Sacramento, CA: April,
2012).
http://www.cahighspeedrail.ca.gov/Business_Plan_reports.aspx, accessed January 24, 2013. 63 Mike Rosenberg, “Bullet Train Project Nearly Triples in cost—$98.5 billion—from earlier
projections,” Silicon Valley Mercury News, October 31, 2011. 64 Wendell Cox and Robert Poole, The Tampa to Orlando High-Speed Rail Project: Florida
Taxpayer Risk Assessment, Policy Brief 95, (Los Angeles: Reason Foundation, January 2011), p. 3.
65 Amtrak Office of Inspector General, “Public Funding Levels of European Passenger Railroads,” (Washington D.C, 2008), p. 2.
66 Rémy Prud’Homme, “The Current EU Transport Policy in Perspective,” paper presented at the conference on European Transport policy in the European parliament, Brussels, July 12, 2005, p. 3.
67 United States Government Accountability Office, High Speed Passenger Rail. 68 Paul Amos, Dick Bullock and Jitendra Sondhi, “High-Speed Rail: The Fast Track to Economic
Development?” The World Bank, (July 2010), accessed August 27, 2012. 69 Bent Flyvbjerg, Mette Skamris Holm and Soren Buhl, “Underestimating Costs in Public
Works Projects: Error or Lie?,” Journal of the American Planning Association, vol. 68, no. 3. (Summer 2002), pp. 279-295.
70 Ibid. 71 Ibid. 72 Wendell Cox, Joseph Vranich and Adrian Moore, The California High-Speed Rail Proposal: A
Due Diligence Report, Policy Study No. 370 (Los Angeles: Reason Foundation, September 2008).
73 U.S. Department of Transportation, Federal Railroad Administration, High-Speed Ground Transportation for America, (Washington, D.C.: September 1997), p. 7-8, http://www.fra.dot.gov/Downloads/RRDev/cfs0997all2.pdf.
74 U.S. Department of Transportation, Office of the Secretary of Transportation, Office of the Inspector General, Analysis of the Benefits of High Speed Rail on the Northeast Corridor, (Washington, D.C.: June 2008).
http://www.oig.dot.gov/StreamFile?file=/data/pdfdocs/HSR_Final_7-1-08.pdf, accessed September 4, 2012.
75 Ibid. 76 Cox, Vranich and Moore, The California High-Speed Rail Proposal, p 43. 77 U.S. Department of Transportation: Transportation Research Board, In Pursuit of Speed: New
Options for Intercity Passenger Transport (Washington, DC, 1991), p. 113;

HIGH-SPEED RAIL IN EUROPE AND ASIA | 37
Ginés de Rus and Gustavo Nombela, “Is Investment in High Speed Rail Socially Profitable?,”
Journal of Transport Economics and Policy, vol. 41, no. 1 (January 2007), p. 15;
Ginés de Rus and Chris Nash, “In What Circumstances is Investment in HSR Worthwhile?,” Chapter 3 of Economic Analysis of High Speed Rail In Europe, ed. Ginés de Rus (Bilbao, Spain: BBVA Foundation, 2009), p. 70.
78 “Amtrak Sets New Ridership Record”, Amtrak News Release, October 10, 2012, http://www.amtrak.com/ccurl/636/294/Amtrak-Sets-New-Ridership-Record-FY2012-ATK-12-092.pdf
79 Elizabeth Kneebone, “Job Sprawl Revisited: The Changing Geography of Metropolitan Employment,” Brookings Metropolitan Policy Program, April 2009.
80 Ibid, pp-10-14. 81 U.S. Department of Commerce, U.S. Census Bureau, Table S0801 (Washington D.C., 2012). 82 Jean Vivier, “Millennium Cities Database for Sustainable Mobility: Analyses and
Recommendations,” UITP (International Union of Public Transport), (Brussels, 2001). 83 Peterman, Frittelli and Mallett, High Speed Rail in the United States, p. 20. 84 Eurostat, 2009 Panorama of Transport, 2006 Miles of Travel per Capita, (Brussels: European
Commission, 2009) 85 Romain Davoust, Gasoline and Diesel Prices and Taxes in Industrialized Countries, (Paris:
IFRI, December 2008,) http://ifri.org/files/Energie/Davoustang.pdf, p. 9. 86 Daniel Martin, “We’re the Fuel Tax Capital of Europe,” The Mail, August 27, 2012,
http://www.dailymail.co.uk/news/article-2107374/Fuel-tax-British-motorists-pay-60-duty-VAT-petrol.html, Derek Thompson, “Gas Prices Around the World,” The Atlantic, May 3, 2011, http://www.theatlantic.com/business/archive/2011/05/gas-prices-around-the-world-cheaper-than-water-i-and-i-10-a-gallon/238226/
87 U.S. Energy Information Administration, Gasoline and Diesel Fuel Update (Washington, D.C., 2012).
88 Eurostat, 2009 Panorama of Transport, 2006 Miles of Travel per Capita, (Brussels, 2009), U.S. Energy Information Administration, Federal Fuel Taxes, (Washington, D.C., 2012). http://www.eia.gov/oiaf/aeo/otheranalysis/fft.html
89 Federal Highway Administration, Office of Highway Policy Information, Highway Finance Data Collection, Our Nation’s Highways: 2011, (Washington, D.C., 2011), http://www.fhwa.dot.gov/policyinformation/pubs/hf/pl11028/chapter1.cfm, accessed November 15, 2011.
90 TravelChinaGuide.com, Highways in China, January 1, 2011, http://www.travelchinaguide.com/essential/highway.htm, accessed December 17, 2011.
91 Livinginspain.org, Driving in Spain, January 2011, http://www.livinginspain.org/Contents/Subjects/Cars/DrivinginSpain/DrivinginSpain.htm, December 17, 2011.
92 German Autobahn Page, Routes, January 2011, http://www.autobahn-online.de/auswahl_e.html, accessed December 2011.

38 | Reason Foundation
93 The Autoroutes in France, Driving on the Autoroutes in France, January 2011,
http://www.france-pub.com/autoroutes.htm, accessed December 2011. 94 TravelChinaGuide.com, Highways in China. 95 Peterman, Frittelli and Mallett, High Speed Rail in the United States, p. 6. 96 The European Commission, Directorate-General for Energy and Transport, EU Energy and
Transport in Figures 2009, p. 119, http://ec.europa.eu/energy/publications/statistics/doc/) 97 The European Commission. Panorama of Transport, (Luxembourg, 2007), p. 107. 98 Ibid. 99 U.S. High Speed Rail Association, US High Speed Rail Network Map, January 15, 2012,
http://www.ushsr.com/ushsrmap.html, accessed March 1, 2012. 100 Amtrak, Amtrak National Facts, 2010,
http://www.amtrak.com/servlet/ContentServer?c=Page&pagename=am%2FLayout&cid=1246041980246, accessed March 1, 2012.
101 European Commission, Key Facts and Figures about the European Union, (Luxembourg, 2006), p. 53, http://ec.europa.eu/publications/booklets/eu_glance/66/en.pdf, accessed September 4, 2012,
U.S. Department of Transportation, Bureau of Transportation Statistics, National Transportation Statistics 2010 (Washington, D.C., 2010), Table 1-46b.
102 Ibid. 103 Ibid. 104 “High-speed Railroading,” The Economist, July 22, 2010,
http://www.economist.com/node/16636101 105 Ibid, p. 7. 106 The European Commission, The Panorama of Transport, p 106. 107 Ibid, p 107. 108 Ibid, p 110. 109 Japanese Ministry of Land, Infrastructure and Transport, Summary of Transportation Statistics
Monthly Statistical Report on Motor Vehicle Transport and Monthly Statistical Report on Railway Transport," (Tokyo: 2008).
110 Ibid. 111 European Commission, Panorama of Transport, p 7,
http://epp.eurostat.ec.europa.eu/cache/ITY_OFFPUB/KS-DA-09-001/EN/KS-DA-09-001-EN.PDF.
112 O’Toole, High-Speed Rail. 113 Mark Dayton, Senior Economist, U.S. DOT IG, Intercity Passenger Rail and Amtrak, Senate
Committee on Appropriations, March 16, 2006, p. 9. 114 U.S. Department of Transportation, Federal Railroad Administration, Railroad Labor Act
Overview, 2011, http://www.fra.dot.gov/pages/955.shtml, accessed March 1, 2012. 115 Peterman, Frittelli and Mallett, High Speed Rail in the United States, p. 10.

HIGH-SPEED RAIL IN EUROPE AND ASIA | 39
116 U.S. Government Accountability Office, Intercity Passenger Rail, (Washington, D.C.,
November 2006), pp. 150-156. 117 Mark Dayton, “Intercity Passenger Rail and Amtrak,” testimony before the Senate Committee
on Appropriations, (Washington D.C., March 2006), p. 9. 118 Peterman, Frittelli and Mallett, High Speed Rail in the United States, p. 22.
Reason Foundation5737 Mesmer Ave.
Los Angeles, CA 90230310/391-2245
310/391-4395 (fax)www.reason.org