high temperature oxidation of sanergy ht
TRANSCRIPT

UNIVERSITY OF OSLODepartment of Chemistry
High TemperatureOxidation ofSanergy HT- oxidation kinetics andgrowth mechanism of ametallic interconnect
Master’s thesis inMaterials, Energyand Nanotechnology
Aina Øverås Skott
June 2013


Preface
This thesis fulfils the requirements for the Master of Science degree in Mate-rials Chemistry under the program Materials, Energy and Nanotechnologyat the University of Oslo. The experimental work in this thesis was con-ducted at the Centre for Materials Science and Nanotechnology (SMN) fromAugust 2011 to June 2013.
I would first like to thank my supervisor Reidar Haugsrud for greatguidance and encouragement. The group of Solid-State Electrochemistryis thanked for challenging discussions and advice, especially Truls Norby forvaluable feedback, Anna Magraso Sola for technical and emotional supportduring HT-ESEM experiments and Anders Werner Bredvei Skilbred forenthusiastically introducing me to the art of high temperature oxidation.Zuoan Li for guidance during two-stage oxidation experiments, and my fellowMaster students for all the good times during the last five years. Especially, Iwould like to thank my best friend Kari Nordholm for always being positive,never giving up and for spending more time with me the last two years thanwith her family and friends combined. Together we have achieved impossiblegoals, survived a tropical storm and planned enough adventures to last alifetime.
I am grateful to my parents, family and friends for support anddistractions. Tor-Erik is thanked for tolerating endless stories about theups and downs of my life as a student, and for kicking me out of airplaneswhen I complain too much. Finally, I would like to thank my sister Anettefor being my ultimate life coach and travel companion, and for starting earlyto prepare me for life by teaching me how to do fractions in kindergarten.
Oslo, June 2013
Aina Øverås Skott
i

ii

Abstract
Chromia forming alloys are regarded as promising interconnects materials forfuel cell applications.1,2 Under operating conditions metallic interconnectswill oxidise, forming a protective oxide layer which will affect the electricaland mechanical properties of the interconnect. Sanergy HT from SandvikMaterials Technology is a commercial multicomponent Fe-22Cr alloydeveloped specifically for fuel cells. In this work, the oxidation behaviourand growth kinetics of Sanergy HT were examined.
Samples of uncoated and 600 nm Co coated Sanergy HT were oxidizedat temperatures from 800 �C to 1000 �C in air, O2+Ar and 5 % H2+Ar.Thermogravimetry (TG) was used to examine oxide scale growth kinetics,and in-situ High Temperature Environmental Scanning Electron Microscopy(HT-ESEM ) was used to study formation and development of morphologicalfeatures. The chemical composition of the oxide scales was identified by X-ray diffraction (XRD) and Energy Dispersive Spectrometry (EDS) analysis.Microstructure and morphology of surfaces and cross sections were analysedby Scanning Electron Microscopy (SEM). Two-stage oxidation by 18O-16Oisotope exchange was conducted to investigate growth mechanisms of Cr2O3
and (Co, Mn)3O4 on coated samples. Secondary Ion Mass Spectrometry(SIMS) was used to obtain depth profiles of ion distributions in the formedoxide scales.
The formed oxide scales consist of duplex layers of Cr2O3 near theoxide-alloy interface, with an (A, B)3O4 spinel (A, B = Mn, Cr, Co, Fe)phase in the outer part of the scale, near the gas-oxide interface. Theoxides grow predominately by outward diffusion of cations. The oxidegrowth kinetics were generally observed to be parabolic, with growth ratesfor cobalt coated samples varying from 1.9�10�13 to 1.0�10�11 g2/cm4s attemperatures between 850 �C and 1000 �C in wet air. The activationenergy for cobalt coated samples was 320 kJ/mol. The growth rate constantsof uncoated samples exhibited non-linear temperature dependence, and noactivation energy could be calculated for the full temperature range. Therate constants of both cobalt coated and uncoated samples were also foundto be independent of pO2 . The irregular dependence of temperature and the
iii

independence of pO2 is assumed to result from alloying elements entering asaliovalent dopants in the growing oxide scales.
iv

List of Abbreviations
BSC Bias Supply Controller
EDS Energy Dispersive Spectroscopy
ESEM Environmental Scanning Electron Microscopy
ETD Everhart-Thornley Detector
HSA Heating Shield Assembly
HSM Heating Stage Module
HT-ESEM High Temperature Scanning Electron Microscopy
HT-GSED High Temperature Gaseous Secondary Electron Detector
HTSC High Temperature Stage Controller
HV High Vacuum
LFD Large-Field Detector
REO Reactive Element Oxides
SEM Scanning Electron Microscopy
SOFC Solid Oxide Fuel Cell
SSD Solid-State Detector
TEC Thermal Expansion Coefficient
TG Thermogravimetry
WFB Water Flow Box
XRD X-ray Diffraction
v

vi

Contents
Preface i
Abstract iii
List of Abbreviations v
Contents vii
1 Introduction 11.1 Background and motivation . . . . . . . . . . . . . . . . . . . 11.2 Fuel cells . . . . . . . . . . . . . . . . . . . . . . . . . . . . . 1
1.2.1 The Solid Oxide Fuel Cell . . . . . . . . . . . . . . . . 21.3 The interconnect . . . . . . . . . . . . . . . . . . . . . . . . . 21.4 Objective . . . . . . . . . . . . . . . . . . . . . . . . . . . . . 3
2 Theory 52.1 Oxidation of metals and alloys . . . . . . . . . . . . . . . . . 52.2 The thermodynamics of oxidation reactions . . . . . . . . . . 62.3 Defects in oxides . . . . . . . . . . . . . . . . . . . . . . . . . 9
2.3.1 Kröger-Vink notation . . . . . . . . . . . . . . . . . . 102.3.2 Formation of defects . . . . . . . . . . . . . . . . . . . 112.3.3 Defect structure of Cr2O3 . . . . . . . . . . . . . . . . 112.3.4 Defect structure of (Cr, Mn)3O4 . . . . . . . . . . . . 12
2.4 Diffusion . . . . . . . . . . . . . . . . . . . . . . . . . . . . . 132.5 Oxide scale growth . . . . . . . . . . . . . . . . . . . . . . . . 15
2.5.1 Wagner’s Oxidation Theory . . . . . . . . . . . . . . . 152.5.2 Oxidation kinetics and rate laws . . . . . . . . . . . . 162.5.3 Temperature dependence of reaction rates . . . . . . . 172.5.4 The activation energy . . . . . . . . . . . . . . . . . . 172.5.5 The effect of dopants . . . . . . . . . . . . . . . . . . . 18
3 Literature 213.1 The use of metals in society . . . . . . . . . . . . . . . . . . . 213.2 Fe-Cr alloys . . . . . . . . . . . . . . . . . . . . . . . . . . . . 21
vii

CONTENTS
3.3 Fuel cell interconnect materials . . . . . . . . . . . . . . . . . 223.3.1 Interconnect requirements . . . . . . . . . . . . . . . . 233.3.2 Ceramic interconnects . . . . . . . . . . . . . . . . . . 243.3.3 Metallic interconnects . . . . . . . . . . . . . . . . . . 243.3.4 Protective coatings . . . . . . . . . . . . . . . . . . . . 263.3.5 Volatile Cr species . . . . . . . . . . . . . . . . . . . . 27
3.4 Cr2O3 . . . . . . . . . . . . . . . . . . . . . . . . . . . . . . . 273.4.1 Electrical conductivity . . . . . . . . . . . . . . . . . . 283.4.2 Diffusion in chromia . . . . . . . . . . . . . . . . . . . 283.4.3 Growth mechanisms . . . . . . . . . . . . . . . . . . . 303.4.4 Impurities and dopants . . . . . . . . . . . . . . . . . 30
3.5 High Temperature Environmental Scanning Electron Mi-croscopy . . . . . . . . . . . . . . . . . . . . . . . . . . . . . . 30
4 Experimental 334.1 Introduction . . . . . . . . . . . . . . . . . . . . . . . . . . . . 334.2 Thermogravimetry . . . . . . . . . . . . . . . . . . . . . . . . 33
4.2.1 Instrumentation . . . . . . . . . . . . . . . . . . . . . 344.2.2 Sample preparation . . . . . . . . . . . . . . . . . . . . 34
4.3 The gas mixer . . . . . . . . . . . . . . . . . . . . . . . . . . . 344.4 High Temperature Environmental Scanning Electron Mi-
croscopy . . . . . . . . . . . . . . . . . . . . . . . . . . . . . . 354.4.1 Instrumentation setup . . . . . . . . . . . . . . . . . . 354.4.2 Sample preparation . . . . . . . . . . . . . . . . . . . . 364.4.3 Experimental execution . . . . . . . . . . . . . . . . . 37
4.5 Two-stage oxidation: 18,18O2-16,16O2 isotope exchange . . . . 384.5.1 Sample preparation and instrumentation . . . . . . . . 38
4.6 Characterization methods . . . . . . . . . . . . . . . . . . . . 384.6.1 X-ray diffraction . . . . . . . . . . . . . . . . . . . . . 384.6.2 Scanning Electron Microscopy . . . . . . . . . . . . . . 394.6.3 Secondary Ion Mass Spectrometry . . . . . . . . . . . 39
4.7 Sources of error . . . . . . . . . . . . . . . . . . . . . . . . . . 404.7.1 Sample preparation . . . . . . . . . . . . . . . . . . . . 404.7.2 Thermogravimetry . . . . . . . . . . . . . . . . . . . . 40
5 Results 435.1 Composition and morphology of oxide scales . . . . . . . . . . 43
5.1.1 Chemical composition . . . . . . . . . . . . . . . . . . 435.1.2 Surface morphology . . . . . . . . . . . . . . . . . . . 475.1.3 Metal-oxide interface properties . . . . . . . . . . . . . 50
5.2 Thermogravimetry . . . . . . . . . . . . . . . . . . . . . . . . 535.2.1 Temperature dependency . . . . . . . . . . . . . . . . 535.2.2 Activation energy . . . . . . . . . . . . . . . . . . . . . 57
viii

5.2.3 Correlation between expected oxide scale thicknessfrom kp,t and scale thickness measured by SEM . . . . 59
5.2.4 pO2 dependence of parabolic growth rate constants . . 615.2.5 Effect of cobalt coating . . . . . . . . . . . . . . . . . 635.2.6 Uncertainty of measured weight gain curves . . . . . . 65
5.3 Two-stage oxidation . . . . . . . . . . . . . . . . . . . . . . . 665.3.1 Cation distribution . . . . . . . . . . . . . . . . . . . . 695.3.2 Gas exchange in oxide scales during oxidation . . . . . 73
5.4 HT-ESEM . . . . . . . . . . . . . . . . . . . . . . . . . . . . . 745.4.1 Comparison TG . . . . . . . . . . . . . . . . . . . . . 78
6 Discussion 816.1 Microstructure, morphology and interface properties . . . . . 81
6.1.1 Effect of temperature and gas composition . . . . . . . 826.1.2 Oxide ridges, whiskers and blades . . . . . . . . . . . . 836.1.3 Morphology of the oxide-alloy interface . . . . . . . . 84
6.2 Oxidation behaviour of Sanergy HT . . . . . . . . . . . . . . 866.2.1 Oxide scale growth mechanisms . . . . . . . . . . . . . 866.2.2 Oxide growth rates . . . . . . . . . . . . . . . . . . . . 886.2.3 Protonic defects in oxides at high temperatures . . . . 956.2.4 Sanergy HT as interconnect material in fuel cell systems 956.2.5 Chromium evaporation and the effect of cobalt coating 96
6.3 Evaluation of in-situ HT-ESEM as an experimental methodin high temperature oxidation . . . . . . . . . . . . . . . . . . 97
7 Conclusions 997.1 Further work . . . . . . . . . . . . . . . . . . . . . . . . . . . 100
Bibliography 101
Appendix 107
ix

x

Chapter 1
Introduction
1.1 Background and motivation
The world is facing a great challenge. The global energy demand is expectedto double by 2050, even if improvements are made in increasing energyefficiency.3 This is a consequence of growth in the human population andalso the enhanced standard of living in highly populated countries withrapidly expanding economies. As of today, fossil fuels are by far the mostcommon energy source worldwide. However, as fossil fuels are a limitedresource, the available amounts of coal, oil and natural gas are not sufficientto meet the future energy demand. In addition, enormous stresses arecaused on the environment by the combustion of fossil fuels. Most climatescientists agree that the major changes in climate and increasing averagesurface temperature of the Earth are related to man-made emissions in theatmosphere. Thus, there is a great need of environmentally friendly andcompetitive alternatives to non-renewable energy sources. For new energytechnology to be commercialized, it is absolutely vital that it is economicallycompetitive, efficient and has an adequate lifetime. Fuel cells stand out as atechnology of great potential due to high efficiencies and versatile applicationpossibilities.
1.2 Fuel cells
A fuel cell is a device converting chemical energy directly to electricitythrough a chemical reaction. As no combustion is involved, the energyconversion is very efficient and with much less generated pollutants comparedto traditional power systems. Fuel cells are galvanic cells, similar to ordinarybatteries. But unlike batteries, fuel cells do not need recharging and will notrun down as long as fuel is available. A fuel cell consists of two electrodes,anode and cathode, separated by an electrolyte. Fuel is supplied to theanode, where it is oxidized and the electrons are transferred to an external
1

circuit. At the cathode, an oxidant such as oxygen gas, is reduced andelectrons are drawn from the external circuit, while ions are conductedthrough the electrolyte.
The fuel may either come from fossil resources, such as gases from coal,oil or natural gas, or from renewable energy sources. The most commonfuel from renewable resources is hydrogen, but also methanol, ammonia andbiofuels have become increasingly relevant.
To achieve usable power, individual fuel cells must be connected in series..This series of connected cells is referred to as a stack. Depending on theparticular application, the configuration of the fuel cell stack may vary.Several configurations, with differences in geometry and power density, havebeen reported.
1.2.1 The Solid Oxide Fuel Cell
The Solid Oxide Fuel Cell (SOFC) is regarded as the most effective andversatile fuel cell there is,4 suitable for various applications from vehicles tolarge-scale, stationary power stations.5 The SOFC is characterized by solid-state components only. The electrolyte is a solid inorganic ceramic, oftenyttria-stabilised zircona,6 in between two porous electrodes as seen in figure1.1. At the cathode, oxygen gas is reduced to oxygen ions. The oxygenions are then lead through the electrolyte, before reacting with the fuel atthe anode. The operating temperatures are high, typically from 750 �C to1000 �C.6 The high operating temperatures are due to slow oxygen transportthrough the electrolyte at lower temperatures.4
As SOFCs operate at elevated temperatures, the requirements for eachmaterial component are tough. However, due to their many advantages, suchas high efficiency and fuel flexibility, SOFCs are still the leading fuel cell typein regards to commercialization.5 The highest fuel efficiency for SOFCs hasbeen at 1000 �C,5 but at such high temperatures the cell life-time decreasessignificantly. One challenge is thus to reduce the operating temperature,while maintaining high efficiency. This would significantly reduce the totalcost of the fuel cell, especially for sealing materials and the interconnect.
1.3 The interconnect
A fuel cell interconnect is a material separating the individual cells in afuel cell stack, and has the most stringent requirements of all fuel cellcomponents. The interconnect has to separate the fuel on the anode sideof one cell from the air on the cathode side of the neighbouring cell. In
2

Figure 1.1: Schematic diagram of a flat plate fuel cell stack.
addition, the interconnect must provide electrical connection between thecells, good channels for gas flow and preferably be low-weight.
Naturally, there are few materials available that can fulfil theserequirements. The two main groups of suitable materials are ceramics andmetal alloys. Ceramics are brittle, have complicated fabrication routesand high cost, and metallic interconnects will thus be the focus of thissurvey. A disadvantage with metallic interconnects is that under operatingconditions, oxidation of the alloy surface is inevitable. The formation ofan oxide scale on the surface will alter both the mechanical and electricalproperties of the interconnect material, resulting in degradation and reducedperformance of the fuel cell. If metallic interconnects are to be used in fuelcell applications, the oxidation behaviour under operating conditions must beexamined thoroughly. The following chapter will give a brief introduction tohigh temperature oxidation of metals, especially for chromia-forming alloys.
1.4 Objective
The main objective of this study is to investigate the oxidation behaviour ofSanergy HT from Sandvik Materials Technology, an iron-chromium alloyto be used as interconnect material in fuel cell stacks. The work willinclude examination of oxide growth kinetics and scale properties under bothoxidizing and reducing conditions, and at high temperatures. Measurementswill be conducted on both uncoated and 600 nm Co coated samples ofSanergy HT to elucidate the effect of cobalt coating on oxidation properties.
3

Oxide growth rates of uncoated and cobalt coated samples at temperaturesfrom 800 �C to 1000 �C in air, O2+Ar mixtures and 5 % H2+Ar willbe studied by Thermogravimetry (TG). In addition, TG will be used toinvestigate the effect of temperature, time and oxygen activity on oxidegrowth rates. The effect of cobalt coating will be evaluated by ScanningElectron Microscopy (SEM) and two-stage oxidation in oxygen isotopes18,18O2 and 16,16O2. The chemical composition of the formed oxide scaleswill be determined by X-ray diffraction (XRD) and Energy DispersiveSpectroscopy (EDS) analysis. Microstructure and morphology of surfacesand cross sections will be analysed by Scanning Electron Microscopy (SEM).
Fe-Cr alloys with a sufficient amount of Mn will form duplex oxide scalesof Cr2O3 and a (Cr, Mn)3O4 spinel phase. The growth mechanisms ofthese two oxides will be investigated by two-stage oxidation in 18,18O2 and16,16O2. Secondary Ion Mass Spectrometry (SIMS) will be used to obtaindepth profiles of oxygen isotope and cation distributions in the formed oxidescales. Cross-sections of the oxidized samples will be examined by EDS spotanalyses and line scans to map possible temperature and time variations inthe concentrations of the scales.
The formation and development of oxide surface features in 600 Pa H2Oat temperatures from 600 �C to 900 �C will be studied in-situ by HighTemperature Environmental Scanning Electron Microscopy (HT-ESEM) andex-situ by SEM. HT-ESEM will also be evaluated as an experimental methodin the field of high temperature oxidation. The comparability with TG, whichis a far more conventional method, will be investigated by comparing samplesoxidized during HT-ESEM and by TG under similar conditions.
4
Chapter 2
Theory
2.1 Oxidation of metals and alloys
The theory in this chapter is retrieved from "High Temperature Corrosion"by Per Kofstad7 unless stated otherwise. Oxide scales form on metal surfacesunder most conditions, as long as the partial pressure of oxygen at the surfaceis sufficient. As oxidation can lead to drastically changed material properties,understanding and reducing this problem is of high importance in all parts ofthe industry where metals and alloys are used. It has therefore been a drivingforce to develop materials with high oxidation resistance and to investigatemethods for improving surfaces of already commercial alloys.
xM � py
2qO2 �MxOy (2.1)
Although the chemical reaction of forming a metal oxide, equation 2.1,may seem simple and straight-forward, the process itself is often highlycomplicated. Factors influencing the oxidation process include temperature,pressure, gas composition, the elapsed time of the reaction, pretreatmentand surface preparation.
The growth mechanism of an oxide scale is a combination of severalreactions. Initially, gas molecules are adsorbed on the surface and dissociateddue to the high reactivity of surface atoms. As the reaction continues, oxidenuclei will form and grow by surface diffusion until a continuous oxide filmis covering the surface completely. The nucleation site of the first oxide isbelieved to be lattice imperfections such as grain boundaries or dislocations,but could also be surface impurities.
When a continuous oxide film separates the metal surface from the oxygengas, the reaction can proceed further only by solid-state diffusion of thereactants through the film. This may occur by inward diffusion of oxygenreacting with metal at the oxide-metal interface, or by metal diffusing
5

Figure 2.1: Oxide formation and scale growth on metal surface by inwardand outward diffusing species.
outwards to react at the gas-oxide interface, as seen in figure 2.1. Thedriving force for these processes are generally the presence of an electric fieldor a gradient in chemical potential.
Metals and alloys generally oxidise following the same principles. However,due to the increased number of reactants present, the oxidation of alloys canbe complex. Variations in thermodynamic stability, properties of reactionproducts and differences in diffusivity for alloying elements through thealloy and the formed oxide are all contributing factors to complex oxidationbehaviour. As pure metals are seldom used as construction materials,understanding the oxidation mechanisms of important alloys is necessary.
2.2 The thermodynamics of oxidation reactions
When a metal reacts with oxygen gas to form a metal oxide, see equation2.1, the chemical reaction is driven by a change in Gibbs free energy.
∆Gr � ∆Hr � T∆Sr (2.2)
At constant temperature, a change in Gibbs free energy is directly relatedto the changes in enthalpy and entropy of the reaction, as seen in equation2.2. In equation 2.2, Gr is the Gibbs free energy, T is the temperature, Hr
is the enthalpy and Sr the entropy of the reaction. For a specific reaction atconstant pressure and temperature to happen spontaneously, the change inGibbs free energy must be negative. Any system will thus tend to react until∆Gr is at a minimum. When the change in Gibbs free energy of a reaction
6

is zero, the reaction is at equilibrium and thus not spontaneous in eitherdirection. The change in Gibbs free energy of a reaction at equilibrium,∆G�
r , can be expressed in terms of the equilibrium constant, K:
∆G�r � �RT lnKr (2.3)
R is the ideal gas constant and Kr is defined by the activities of the chemicalspecies involved in the reaction. For the oxidation reaction in equation 2.2,the Gibbs free energy can thus be written:
∆G�r � �RT lnKr � �RT ln
�apMxOyq
apMqxapO2qy2
�(2.4)
The activities, a, of pure solids and liquids can be approximated as unity,and the activity of gases may be approximated by their partial pressuresaJ � pJ{p
�.
∆G�r � �RT ln
�1
apO2qy{2
� �RT ln
�p�y{2o2
(2.5)
Equation 2.5 can be rearranged to:
pO2 � ep2∆G�
r{yRT q (2.6)
7

Figure 2.2: Ellingham-Richardson diagram. Standard free energy offormation for selected oxides as a function of temperature.8
8

The oxygen partial pressure where metal and oxide are in equilibrium iscalled the dissociation pressure. If the pO2 is higher than the dissociationpressure of the oxide, the oxide will be stable. Equation 2.6 can thus be usedto calculate the thermodynamical stability of metals or oxides at a set pO2
and temperature. The stability of oxides at different temperatures can becompared in an Ellingham-Richardson diagram. The Ellingham-Richardsondiagram is constructed by plotting the free energies for formation of differentoxides as a function of temperature, as seen in figure 2.2. The stability ofoxides increases in the negative direction of the y-axis in the diagram, andthe stability of metals will hence increase in the positive direction of they-axis.
2.3 Defects in oxides
Oxides and other crystalline materials will contain lattice imperfections, ordefects, at high temperatures. These defects will enable ion transport in thematerial, and thus influence both oxide growth mechanisms and rate kinetics.This section will first explain how the defect situation in a crystalline materialmay be described by defect chemical reactions, then the probable defectstructures in Cr2O3 and (Cr, Mn)3O4 will be deduced. Cr2O3 and (Cr,Mn)3O4 are the expected dominating phases in Fe-Cr alloys with an additionof Mn,9 similar to the alloy used in the experimental work of this study. Thedefect chemistry in this section is retrieved from "Defects and Transport inCrystalline Solids" by Per Kofstad and Truls Norby.10
To achieve a configuration of minimum energy, atoms or ions in crystallinesolids are assigned specific sites in the structure. At absolute zerotemperature there are as such no defects present, and the structure is definedas ideal. As the temperature rises, defects are introduced in the crystalstructure. The ideal structure is used as a reference state, and any deviationfrom it will be regarded as defective. This could be excess or deficiency byeither oxygen or metal, compared to what would be expected for a perfectlattice structure. Defects can be limited to one lattice site, extended overseveral sites or be electronic. Electronic defects, such as defect electronsor electron holes, are not constrained to specific lattice sites. Defectslimited to one lattice site are called point defects. Point defects includevacant lattice sites, or vacancies, interstitial atoms and substitutional atoms.Extended defects can either be one-dimensional, such as grain boundariesand dislocations, two-dimensional planes or three-dimensional precipitationsor pores. Grain boundaries or other extended defects are often rapid diffusionpaths for ion transport. An illustration of different defects present in acrystallographic lattice can be seen in figure 2.3.
9

Figure 2.3: Schematic illustration of selected defects in a crystallographiclattice, adapted from Kofstad and Norby.10
2.3.1 Kröger-Vink notation
The defect situation in a crystalline material can be described by defectchemical reactions, where reactants form to give products in a similar wayas conventional chemical reactions. In the bulk, ionic transport will proceedby point defects. These point defects may be formed either by interactionwith gases from the surroundings, for instance oxygen, or without externalinfluences. The resulting defect reactions are referred to as external orinternal defect reactions, respectively.
The notation used in defect chemistry to describe defect chemical speciesis Kröger-Vink notation, proposed by F. A. Kröger and H. J. Vink in 1956.11
Each defect is denoted as Acs, where A is the chemical species, s indicates thelattice site and c is the effective charge of the species. The effective chargeis the real charge of the defect, subtracted the charge the site would havein the ideal structure. A positive effective charge is denoted with a bulletsymbol , and negative effective charge with 1. Neutral effective charge isdenoted with the symbol X .In this way, oxygen vacancies may be writtenas vO and metal interstitials as Mi. If the oxygen vacancies have positiveeffective charges, the notation then will be v O or v O if the vacancy is singlyor doubly charged.
10

2.3.2 Formation of defects
When treating defect chemical equilibria, some assumptions must be made.It is assumed that defect concentrations are small enough for the defectsnot to interact. In addition, it is assumed that all sites are energeticallyequal. When these two requirements are fulfilled, we term the conditions asideal. Under ideal conditions the equilibrium constant for a defect chemicalreaction, K, can be given by the activities or site fractions of the defects. Anexample of a defect chemical reaction is the formation of oxygen vacanciesin equation 2.7.
OxO � v O � 2e1 �1
2O2 (2.7)
The equilibrium constant for this reaction can be expressed as following:
KvO �av O a
2e1a
12pO2
aOxO
�prv O srOs qp
nNC
q2ppO2
p0O2
q12
rOxOs
rOs
� prv O s
rOsqp
n
NCq2p
pO2
p0O2
q12 (2.8)
Further simplifications can be made by assuming rOxOs � 1 and p0O2
� 1
bar. It is also for simplicity common to neglect 1NC
. The resulting expressionwill then be:
K 1vO
� rv O sn2p12O2
(2.9)
2.3.3 Defect structure of Cr2O3
As previously mentioned, the transport in solids are enabled by defects. Incrystalline materials, defects can give rise to movement of atoms, ions andelectrons through the material, and electrical, magnetic and optic propertiesmay all vary due to the dominating defects present. As a large numberof high-temperature alloys, including the alloy investigated in this work,form a protective scale of Cr2O3, it is important to elucidate the defectsituation in chromia. The defects present in chromia is assumed to beinterstitial chromium and oxygen, chromium and oxygen vacancies, electronsand electron holes. The total electroneutrality of chromia is given in equation2.10.
3rCr i s � 2rv O s � p � 3rv3
Crs � 2rO2
i s � n (2.10)
Chromium defects The formation of cation vacancies in Cr2O3, seeequation 2.11, will occur at the normally occupied octahedral sites in thecorundum lattice. At high oxygen partial pressure, it is probable thatchromium vacancies and electron holes will dominate the defect structurein chromia:
3
2O2pgq � 2v
3
Cr � 6h � 3OxO (2.11)
11

Other defect concentrations can be considered minor, and the electroneu-trality in equation 2.10 is reduced to 3rv
3
Crs � p. At lower oxygen partialpressure, chromium interstials and electrons will most likely dominate:
2CrxCr � 3OxO � 2Cr i � 6e1
�3
2O2pgq (2.12)
The electroneutrality can then be reduced to 3rCr i s � n.
Oxygen defects Oxygen interstitials diffuse slowly in Cr2O3 and is thusregarded a minority defect. The presence of oxygen interstitials in the latticeis not likely due to the close packing and the size of an oxygen anion.However, in disordered regions such as grain boundaries and other interfacesthey may occur. The formation of oxygen interstitials:
1
2O2 � O
2
i � 2h (2.13)
The formation of oxygen vacancies:
OxO �1
2O2 � v O � 2e
1
(2.14)
By calculating the pO2 dependencies of the present defect concentrationsfrom the limiting equations above, a Brouwer diagram illustrating the defectconcentrations as a function of pO2 can be constructed. A Brouwer diagramfor Cr2O3 can be seen in figure 2.4.
2.3.4 Defect structure of (Cr, Mn)3O4
Many Fe-Cr alloys will in addition to a Cr2O3 scale grow a spinel phase,(A,B)3O4, during oxidation. This spinel phase will be located on top of thechromia scale, near the gas-oxide interface. For alloys with an addition ofMn, the spinel phase will generally be rich in manganese due to the rapiddiffusion of Mn ions through the alloy and the Cr2O3 scale.12 Spinels arein general resistive against oxygen defects, and the total electroneutrality ofthe spinel can thus be written:
2rMn i s � 3rCr i s � p � 2rv2
Mns � 3rv3
Crs � n (2.15)
Interstitial cations are assumed to dominate in spinel phases at low pO2 ,while cation vacancies dominates at higher pO2. The gradient in partialpressure of oxygen, from a maximum at the surface to a minimum in thealloy interior, will affect the spinel defect structure. At the chromia-spinelinterface, the oxygen activity is lower and interstitial cations will dominate.In regions of the spinel closer to the gas-spinel interface, pO2 increases andcation vacancies will eventually be in majority.
12
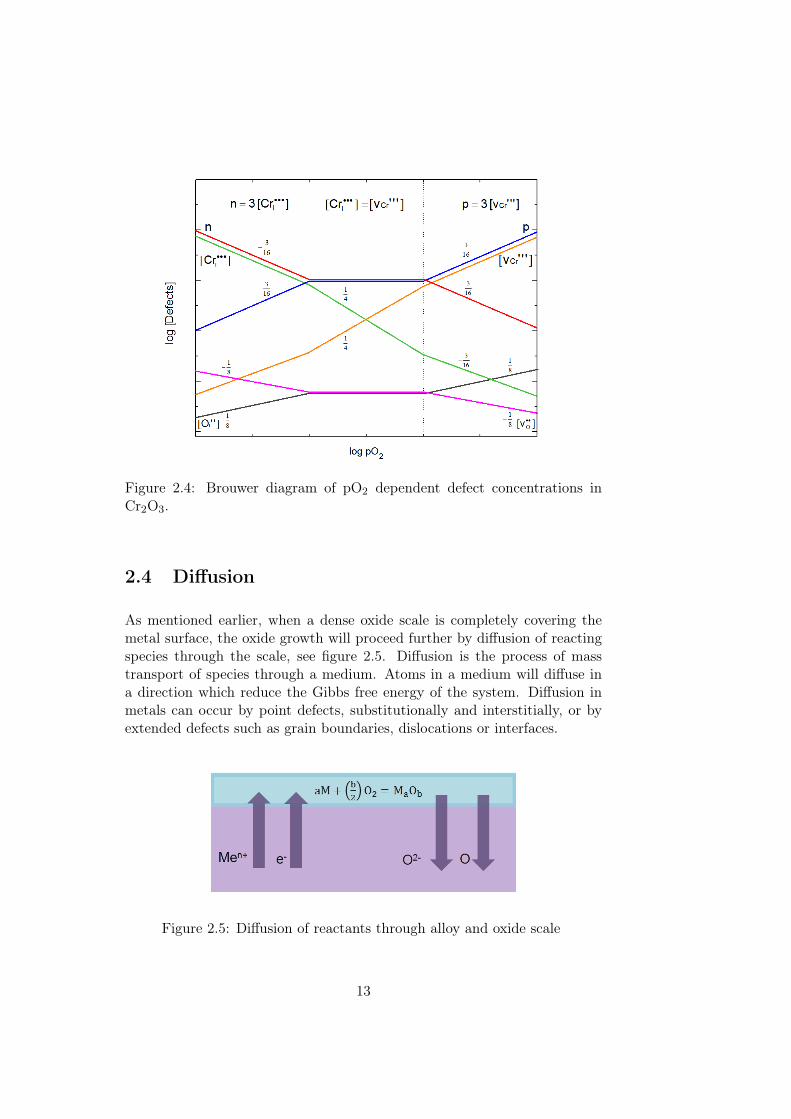
Figure 2.4: Brouwer diagram of pO2 dependent defect concentrations inCr2O3.
2.4 Diffusion
As mentioned earlier, when a dense oxide scale is completely covering themetal surface, the oxide growth will proceed further by diffusion of reactingspecies through the scale, see figure 2.5. Diffusion is the process of masstransport of species through a medium. Atoms in a medium will diffuse ina direction which reduce the Gibbs free energy of the system. Diffusion inmetals can occur by point defects, substitutionally and interstitially, or byextended defects such as grain boundaries, dislocations or interfaces.
Figure 2.5: Diffusion of reactants through alloy and oxide scale
13

The transport of atoms by diffusion can be expressed by Fick’s first law,which states that the flux, Ji of atoms through an area per time unit isproportional to the concentration gradient. Fick’s first law in one dimensioncan be seen in equation 2.16.
Ji � �DiδCiδx
(2.16)
In equation 2.16, Di is the diffusion coefficient of the diffusing species, Ciis the concentration and x is the distance. The direction of the flux is set bythe negative sign, as the particles diffuse from an area of higher concentrationto lower concentration. The validity of Fick’s first law is limited to neutralparticles diffusing in a constant concentration gradient. However, in oxidesmost diffusion particles are charged.
Diffusion of species in the lattice will generally happen by either vacanciesor interstitials. The vacancy mechanism can be viewed as ions jumping tovacant lattice sites, while interstitials jump between neighbouring interstitialvoids in the crystal structure. Interstitial diffusion is only likely to happenwhen the interstitial atom is small enough to fit in between atoms at normallattice sites. Both these mechanisms are illustrated in figure 2.6.
Figure 2.6: Left: Vacancy diffusion, right: Interstitial diffusion
14

In real materials, ionic transport will be effected by the presence ofinterfaces. Interfaces are regions structurally different from the bulkmaterial. In disordered regions, such as in grain boundaries, the structureis more open compared to the grain interior, enabling atoms to move morereadily. Extended lattice defects such as interfaces and grain boundaries aretherefore important rapid short-circuiting diffusion paths for ions in oxides.Due to higher mobilities in these disordered regions, the activation energy forgrain-boundary diffusion is in general much smaller than for lattice diffusion.Generally, the same laws can be used to describe lattice diffusion and grain-boundary diffusion. However, diffusion along grain boundaries and otherinterfaces in multicomponent alloys can be complicated, due to additionalsegregation effects. This is the tendency of certain metal components tosegregate into the grain boundaries13 or other interfaces, such as in theoxide-alloy interface between the grown oxide scale and the underlying metalsurface.
2.5 Oxide scale growth
2.5.1 Wagner’s Oxidation Theory
Wagner’s oxidation theory relates the parabolic oxidation rate observed formany metals and alloys with the diffusion of reactants through the scale. Inan ideal case, this oxide scale is dense, continuous and adherent, completelycovering the metal surface. Wagner derived a model for such an ideal case,based on a series of assumptions. However, a detailed description of Wagner’soxidation model will not be given in this work. Wagner’s theory is oneof the most important contributions in understanding and predicting hightemperature oxidation of metals and metal alloys.
Wagner’s model for parabolic oxidation is built on the assumption thatoxide scales grow by diffusion of reacting atoms through the oxide layer andthat this reaction is the rate limiting step in the overall oxidation. The reasonfor this diffusion to occur, is assumed to be the presence of lattice pointdefects. As the oxide scale grows, the diffusing distance will increase and thereaction rate therefore decreases with time. One prerequisite for diffusiondominating the oxidation rate, is that reactions occurring at metal-scale andscale-gas interfaces are so fast that they do not contribute significantly torate control.
One key aspect of Wagner’s theory, is that the parabolic rate constant isexpressed in terms of independently measurable properties.10 For instanceelectronic and ionic conductivity of the oxide, or by self-diffusion coefficientsof the reactants. The parabolic oxidation of an oxide MaOb by Wagner’s
15
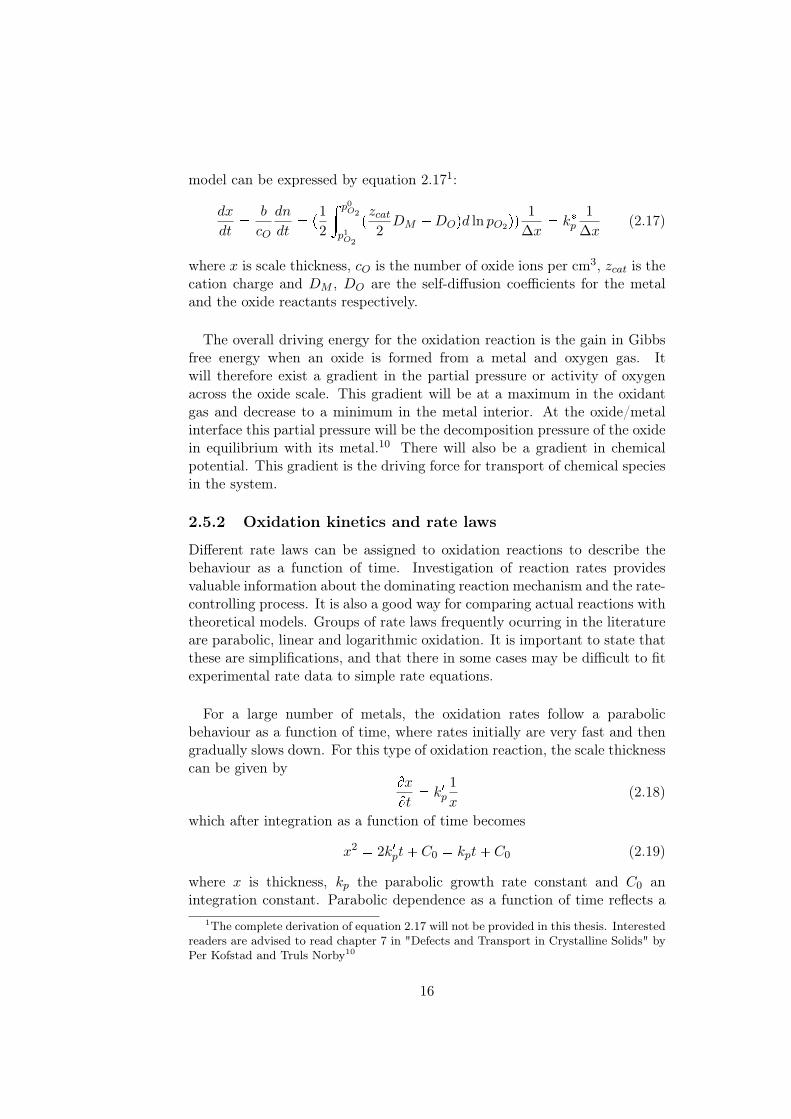
model can be expressed by equation 2.171:
dx
dt�
b
cO
dn
dt� p
1
2
» p0O2
p1O2
pzcat2DM �DOqd ln pO2qq
1
∆x� k�p
1
∆x(2.17)
where x is scale thickness, cO is the number of oxide ions per cm3, zcat is thecation charge and DM , DO are the self-diffusion coefficients for the metaland the oxide reactants respectively.
The overall driving energy for the oxidation reaction is the gain in Gibbsfree energy when an oxide is formed from a metal and oxygen gas. Itwill therefore exist a gradient in the partial pressure or activity of oxygenacross the oxide scale. This gradient will be at a maximum in the oxidantgas and decrease to a minimum in the metal interior. At the oxide/metalinterface this partial pressure will be the decomposition pressure of the oxidein equilibrium with its metal.10 There will also be a gradient in chemicalpotential. This gradient is the driving force for transport of chemical speciesin the system.
2.5.2 Oxidation kinetics and rate laws
Different rate laws can be assigned to oxidation reactions to describe thebehaviour as a function of time. Investigation of reaction rates providesvaluable information about the dominating reaction mechanism and the rate-controlling process. It is also a good way for comparing actual reactions withtheoretical models. Groups of rate laws frequently ocurring in the literatureare parabolic, linear and logarithmic oxidation. It is important to state thatthese are simplifications, and that there in some cases may be difficult to fitexperimental rate data to simple rate equations.
For a large number of metals, the oxidation rates follow a parabolicbehaviour as a function of time, where rates initially are very fast and thengradually slows down. For this type of oxidation reaction, the scale thicknesscan be given by
Bx
Bt� k1p
1
x(2.18)
which after integration as a function of time becomes
x2 � 2k1pt� C0 � kpt� C0 (2.19)
where x is thickness, kp the parabolic growth rate constant and C0 anintegration constant. Parabolic dependence as a function of time reflects a
1The complete derivation of equation 2.17 will not be provided in this thesis. Interestedreaders are advised to read chapter 7 in "Defects and Transport in Crystalline Solids" byPer Kofstad and Truls Norby10
16

reaction rate determined by thermal lattice diffusion of one or both reactantsthrough the scale. Parabolic oxide scale growth is often called protectiveoxidation.
The thickness related parabolic growth rate constant, kp,t and the weightrelated parabolic growth rate constant, kp,w, are related through equation2.20.
kp,t �
�MMxOy
b �MO � dMxOy
2
� kp,w (2.20)
Linear oxidation as a function of time is observed when the reaction rateis determined by surface reactions. The reaction rate is then constant withtime and independent of previously consumed reactants. A large number ofmetals oxidized at temperatures below 300 �C to 400 �C show an initiallyrapid reaction rate, which later is reduced to almost negligible rates.7 Thisbehaviour has been described by logarithmic rate equations. Linear andlogarithmic rate kinetics will not be discussed further in this work.
2.5.3 Temperature dependence of reaction rates
For most chemical reactions, an increase in temperature yields raisedreactions rates. In the late 1800s, the Swedish chemist Svante Arrheniusdetected that almost all reaction rates have a similar dependence oftemperature. The Arrhenius equation may be written as in equation 2.21 oralternatively as in equation 2.22.
ln kr � lnA�EaRT
(2.21)
kr � Ae�Ea{RT (2.22)
In these equations kr is the rate constant, the parameter A is the called thepre-exponential factor and Ea is the activation energy. R is the gas constantand T the temperature where kr is measured. By plotting ln kr as a functionof 1
T , the y-intercept is lnA and the slope is equal to � EaRT .
2.5.4 The activation energy
The activation energy, Ea, of a reaction may be calculated from the slopeof an Arrhenius plot. From equation 2.22 it can be noted that a reactionwith high activation energy will give an Arrhenius plot with a very steepslope, and the reaction is thus sensitive to temperature. Reactions withlow activation energies will be less sensitive to temperature. A general ruleis that the activation energy remains constant when the rate determiningmechanism is the same.7
17

2.5.5 The effect of dopants
When oxidizing Fe-Cr alloys at high temperatures, the formed chromiascale is rarely undoped. Alloys consist of various metal constituents, allcontributing to give certain desired material properties. These elementsmay dissolve in the Cr2O3 scale as dopants. The introduction of suchforeign species will alter the defect structure of the oxide. The effectivelycharged cations are compensated by oppositely charged defects to ensureelectroneutrality. This will thus vary the defect concentrations.
Mn, Ti, Mo, Nb and Ni are examples of common alloying elements. Theeffect of these constituents on a growing oxide scale will vary, due to factorssuch as oxygen affinity and mobility. As dopants, these cations may diffusethrough interstitial voids or by substitution. Mn can function as a lowervalent dopant in chromia, and at high pO2 the following situation may occur:
2MnOpsq �1
2O2pgq � 2Mn
1
Cr � 3OxO � 2h (2.23)
At high partial pressures of oxygen it is therefore assumed that lowervalent dopants, such as Mn, will increase the concentration of positiveelectron holes. Reversly, higher valent dopants such as Ti will increase theconcentrations of negative defects. For low levels of pO2, Mn may dissolveaccording to:
2MlOpsq � 2Ml1
Cr � v O � 2OxO (2.24)
Dopants can also interact with other point defects present in the materialand form complex defects. The formation of such complex defects are causedby coulombic attraction between the reacting elements and point defectsof opposite charge. To illustrate this phenomenon, one can consider theassociation between a lower valent dopant, such as Mn (Mn
1
Cr), and oxygenvacancies (v O ).
Mn1
Cr � v O � pMnCrvOq (2.25)
The complex defect will have an effective positive charge and a mobilitysimilar to that of the dopant alone. If the dopant is relatively immobile, theoxygen vacancy can be considered trapped in this complex defect.
Hydrogen and water
Hydrogen will dissolve in chromia as protons bound to oxide ions, formingsubstitutional hydroxide ions OH
O on oxygen sites, see equation 2.26.
1
2H2pgq �OxO � h � OH
O (2.26)
18
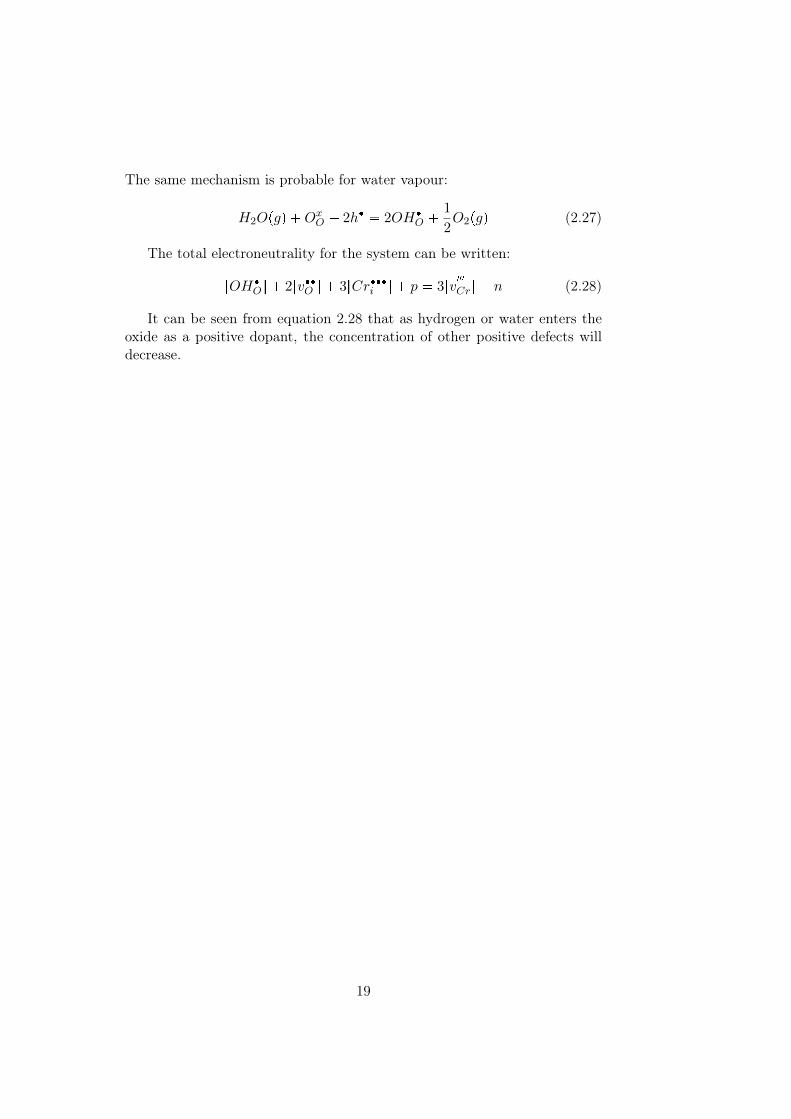
The same mechanism is probable for water vapour:
H2Opgq �OxO � 2h � 2OH O �
1
2O2pgq (2.27)
The total electroneutrality for the system can be written:
rOH Os � 2rv O s � 3rCr i s � p � 3rv
3
Crs � n (2.28)
It can be seen from equation 2.28 that as hydrogen or water enters theoxide as a positive dopant, the concentration of other positive defects willdecrease.
19

20

Chapter 3
Literature
3.1 The use of metals in society
As stages of human prehistory is referred to as the bronze age and theiron age, it is evident that metals and alloys have had a significant rolein the development of our society. 250 years ago, the industrial revolutiondrastically changed the daily lives of our ancestors. Machines and otheradvanced equipment were introduced to both agriculture and the industry,leading to more automated and efficient work. The human dependence uponmetals is obvious when taking a glance at our industry, homes or meansof transportation. The construction of airplanes, cars, buildings or electriclighting are all enabled by metal alloys.
Today the world’s most important construction material is steel, with aglobal production of above 1,414 million tons annually.14 Steel is made bycombining iron with other elements, of which carbon is the most common.The addition of carbon or elements such as Mn, Si, Ni or Cr prevent themovement of dislocations and will thus harden the steel. By varying theamount of alloying elements, and also the form in which they are present,material properties such as ductility and strength can be controlled.
3.2 Fe-Cr alloys
Iron is the cheapest and one of the most commonly used constructionmaterials in the world. However, iron is not suitable for high temperatureapplications due to its very low stability in oxidizing surroundings. If iron isto be used at high temperatures, a slow growing and protective oxide scaleshould be formed to avoid critical degradation of the material. This can beaccomplished by the addition of chromium. If the chromium content in thealloy is sufficiently high, the formation of the very stable oxide Cr2O3 will be
21

preferred. The process where oxidation of one alloy constituent to form anexternal protective scale is preferred, is referred to as selective oxidation.7
When an Fe-Cr alloy is exposed to oxidizing conditions, both iron andchromium will react to form oxides, but at different rates. Initially, theoxidation process is dominated by surface interactions between the alloyand the gaseous surroundings. For Fe-Cr alloys with a high chromiumcontent (20-27 wt.%), the formation of a protective chromia scale at thesurface becomes favourable. The critical level of Cr required to sustain thegrowth of a protective chromia scale is about 17 wt.%, but commercial hightemperature alloys contain an excess to ensure a sufficient level of Cr.15 Ifthe chromium concentration after a time is lower than the critical limit,there is an insufficient amount of Cr available to continue the formation of aprotective Cr2O3 scale. When this occurs an acceleration in oxidation rate,called breakaway oxidation may be observed.
Ferritic stainless steels usually have chromium contents of 12-30 wt.% andlow carbon levels, less than 0.25 wt.%. Ferritic stainless steels are usedin applications such as washing-machine drums and exhaust systems. It isalso evaluated as a candidate for fuel cell interconnects, which is the aimof this thesis. A common problem with chromium containing steel is theformation of volatile chromium species, such as CrO3 and CrO2(OH)2 underhigh temperature oxidation.7 These gaseous species lead to metal loss andsubsequently degradation of the steel.
Much work has been done on the oxidation of unalloyed Cr, to comparechromia growth mechanics of pure Cr to what is observed for chromiumcontaining alloys. The growth of Cr2O3 scales on pure chromium is similarto the chromia growth on Fe-Cr alloys, which could indicate that the sameoxidation mechanism is dominating both systems.7 The oxidation kineticsof chromium above 700 �C seem to follow the parabolic behaviour expectedin protective stages of oxidation.16
3.3 Fuel cell interconnect materials
A fuel cell stack consists of multiple cells connected in series to gain usablepower. Each individual cell is separated in the stack by plate componentscalled interconnects. The interconnect is designated to separate the fuel sidein one cell from the air side of the next, and in addition provide electricalcontact between the cells.
22

3.3.1 Interconnect requirements
The interconnect must withstand both oxidizing and reducing conditionsat high temperatures during the entire range of its lifetime. In addition,the material must have high electronic conductivity, sufficient mechanicalstrength and be completely gas tight. If a material is to perform satisfactoryas an interconnect in a fuel cell stack, certain requirements must befulfilled:1,17
• High electronic and low ionic conductivity
• Chemical stability under oxidizing and reducing conditions
• Chemical stability towards other cell components
• High mechanical strength
• Suitable thermal expansion coefficient
• High thermal conductivity
• Simple fabrication route and good machinability
• Low cost
The minimum electrical conductivity accepted by fuel cell interconnectmaterials is 1 S/cm.1 Ideally, resistance loss through the stack should beno more than through an individual cell. The conductivity of ions mustbe very low, as reduction in partial pressures of oxygen and hydrogen fromsuch a leakage would decrease the open circuit voltage, and thus seriouslyaffect the cell efficiency. Chemical stability under reducing and oxidizingconditions, and towards other cell components, is crucial as material changeswill introduce stresses, strains and also affect the electrical conductivity ofthe interconnect over time. The partial pressure of oxygen will vary from10�4-10�0.7 atm on the cathode side to 10�18-10�8 on the anode side.1 Anystructural change caused by these pO2 gradients could introduce enoughmechanical stress to cause cracking and eventually lead to cell malfunction.The thermal expansion coefficients (TEC) of all fuel cell components haveto match, as too large a difference could lead to mechanical and electricalbreakdown of the system. The thermal conductivity must also be relativelygood, and the lowest accepted value is 5 Wm�1K�1.18
As the interconnects are the main structural elements of the fuel cellstack, the mechanical strength must be sufficient to hold the other fuelcell components at operating temperatures. The last, and possibly thekey requirement, is to keep the cost of the interconnect at a minimum.This requires both low raw material cost and a cheap mass-production
23

manufacturing process. If fuel cell systems are to be successfullycommercialized, the total cost of the unit must be economically competitive.The two main groups of materials considered as of today, are ceramics andmetals. The following section will summarize the main advantages andchallenges regarding the two groups of potential interconnects.
3.3.2 Ceramic interconnects
In the early stages of solid-oxide fuel cells, operating temperatures exceeded1000 �C. This excluded the use of almost any material as interconnects,except ceramics. The demanding requirements for interconnect materialsstill eliminated almost all groups of oxides, except lanthanum chromites.LaCrO3 is the most common ceramic interconnect material due to highelectronic conductivity in both fuel and oxidant atmospheres, good chemicalstability and compatibility with other cell components.19
Ceramic interconnect materials have complicated fabrication routes, whichincrease the cost drastically. They are also very brittle and have limitedmechanical strength. As the development of fuel cells moves towards loweroperating temperatures, this will enable the use of cheaper materials suchas commercial alloys. Ceramic interconnect materials will therefore not bediscussed further in this work.
3.3.3 Metallic interconnects
Metallic interconnects have great potential due to high electronic andthermal conductivity, low cost and easy fabrication. One obviousproblem with metallic interconnects operating under oxidizing and reducingconditions is the formation of oxide scales. This is inevitable athigh temperatures under such conditions, and can drastically reduce theperformance of the fuel cell stack. To ensure satisfying performance andefficiency, it is vital to have the lowest possible resistance through the fuelcell stack. The oxide scales must also match the other requirements forinterconnect materials to ensure optimal performance.
The two most promising groups of candidates as of today, are nickel basedchromium bearing alloys and Fe-Cr alloys.20,21 Chromia forming alloys areless resistant against oxidation at high temperatures than Al2O3 formingalloys, but the electrical conductivity of chromia exceeds alumina by ordersof magnitude.20,22 The main problem with using chromium containing alloysas interconnects, is the evaporation of volatile Cr species under operatingconditions. The presence of chromium species at the electrodes, especiallythe cathode side, will seriously damage the electrochemical performance ofthe fuel cell. The volatilization of Cr2O3 can be inhibited by the addition of
24

alloying elements, or protective surface coatings, that favour the formationof a stable oxide on top of the chromia scale.
Alloys such as Inconel 600,Haynes 230 and Haynes 242 are amongthe best nickel based alloys for interconnect purposes.18 Generally, theoxidation rates of Ni-Cr alloys are slow and the electrical conductivities ofthe resulting oxide scales are quite high.23 The oxidation rates of Ni-basedalloys tend to be lower than those for Fe-Cr alloys.18 The main problemfor nickel based chromia forming alloys is that their thermal expansioncoefficients are generally too high to successfully match with other fuel cellcomponents.23 As a result, this group of alloys is essentially excluded aspotential interconnect materials and will not be further discussed in thiswork.
One of the most commonly used Fe-Cr alloys for SOFCs is Crofer 22 APUfrom ThyssenKrupp VDM, specifically designed to meet the requirementsfor metallic interconnect materials. Crofer 22 APU has a composition ofFe-22%Cr with additions of Mn, Ti and La.24 The parabolic growth rateconstant for Crofer 22 APU at 800 �C is reported in the range of 4.8�10�14
to 6.5�10�14g2/cm4s.25,26 The alloy chosen for this work, Sanergy HT, is aFe-22%Cr alloy also designed specifically for interconnect purposes.
Another group of potential interconnects are alloys based on chromium.Cr based alloys doped with dispersed oxides, such as Ducrolloy (Cr-5%Fe-1Y2O3), show especially low weight change as function of time.18
However, the fabrication process of Cr-based alloys are expensive. Ironbased chromium bearing alloys are therefore the best metallic interconnectmaterials so far, until the cost of Cr-based oxide-dispersion strengthened(ODS) alloys is sufficiently decreased.
Effect of alloying additives in Fe-Cr alloys
Small amounts of different elements are often added to alloys to achieve orimprove certain desired material properties. The effect these elements haveon the oxidation properties of Fe-Cr alloys is of great interest. Alloyingcomponents such as Si, Al, Mn or Ti can not only impact the properties ofthe Fe-Cr alloy, but also the crystal structure and composition of the oxideand the oxide-alloy interface. Adding minor amounts of certain elementshave proved to show various effects:27,28
• Formation of new oxide phase in the outer layer of the external oxidescale or in the inner layer of the material
• Change in defect concentrations, electrical conductivity or physicalproperties
25
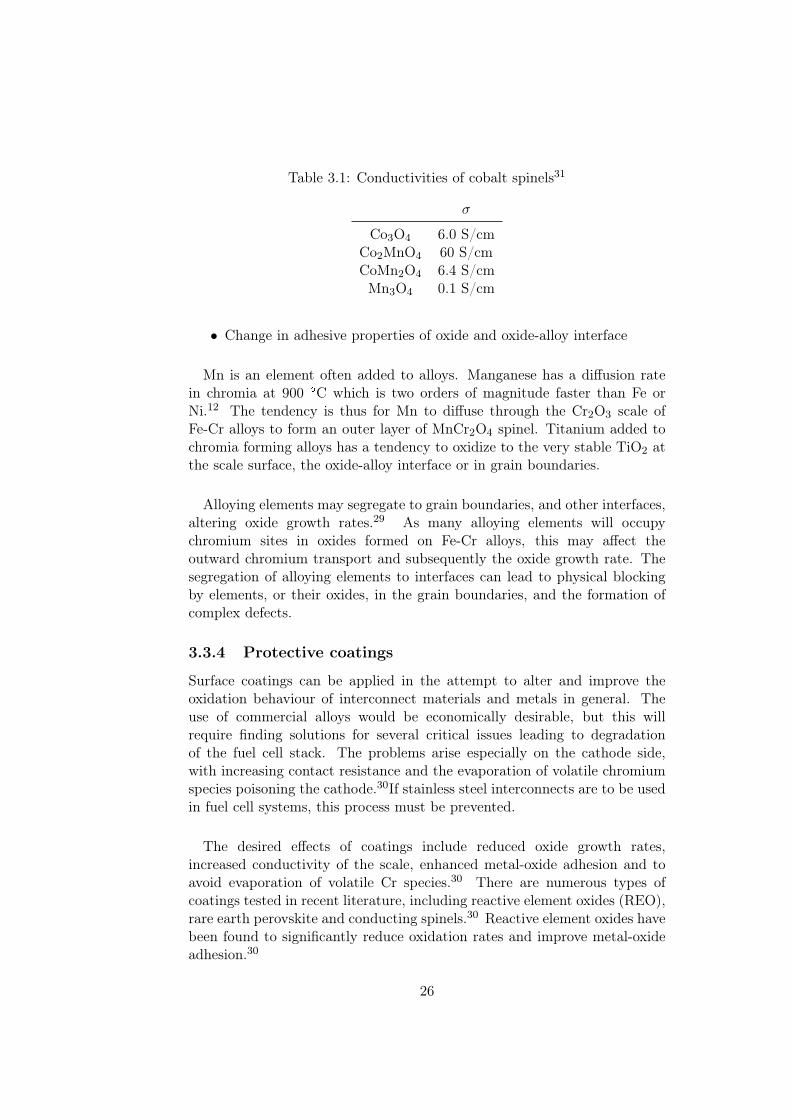
Table 3.1: Conductivities of cobalt spinels31
σ
Co3O4 6.0 S/cmCo2MnO4 60 S/cmCoMn2O4 6.4 S/cmMn3O4 0.1 S/cm
• Change in adhesive properties of oxide and oxide-alloy interface
Mn is an element often added to alloys. Manganese has a diffusion ratein chromia at 900 �C which is two orders of magnitude faster than Fe orNi.12 The tendency is thus for Mn to diffuse through the Cr2O3 scale ofFe-Cr alloys to form an outer layer of MnCr2O4 spinel. Titanium added tochromia forming alloys has a tendency to oxidize to the very stable TiO2 atthe scale surface, the oxide-alloy interface or in grain boundaries.
Alloying elements may segregate to grain boundaries, and other interfaces,altering oxide growth rates.29 As many alloying elements will occupychromium sites in oxides formed on Fe-Cr alloys, this may affect theoutward chromium transport and subsequently the oxide growth rate. Thesegregation of alloying elements to interfaces can lead to physical blockingby elements, or their oxides, in the grain boundaries, and the formation ofcomplex defects.
3.3.4 Protective coatings
Surface coatings can be applied in the attempt to alter and improve theoxidation behaviour of interconnect materials and metals in general. Theuse of commercial alloys would be economically desirable, but this willrequire finding solutions for several critical issues leading to degradationof the fuel cell stack. The problems arise especially on the cathode side,with increasing contact resistance and the evaporation of volatile chromiumspecies poisoning the cathode.30If stainless steel interconnects are to be usedin fuel cell systems, this process must be prevented.
The desired effects of coatings include reduced oxide growth rates,increased conductivity of the scale, enhanced metal-oxide adhesion and toavoid evaporation of volatile Cr species.30 There are numerous types ofcoatings tested in recent literature, including reactive element oxides (REO),rare earth perovskite and conducting spinels.30 Reactive element oxides havebeen found to significantly reduce oxidation rates and improve metal-oxideadhesion.30
26

A surface coating of cobalt can reduce oxidation rates and also form (Co,Mn)3O4 and Co3O4 which prevent chromium evaporation. In addition topreventing chromium evaporation, the formed cobalt spinel layer increasethe surface conductivity. The conductivities of different cobalt spinels aregiven in table 3.1. Although coatings can be used to modify and improvedesired oxidation properties, they may also affect the transport processesin the metal. The coatings can lead to doping of the scale, which maychange the the conduction mechanism compared to an uncoated alloy.18 Thetotal cost of an interconnect will not be significantly increased by applying asurface coating, as protective coatings may enable the use of less expensivealloys. Coatings can thus provide a relatively cheap and efficient methodto improve the oxidation properties of ferritic interconnect materials at hightemperatures.
3.3.5 Volatile Cr species
Cr2O3 is the only solid chromium oxide thermodynamically stable at hightemperatures.7 High temperature oxidation of chromium containing alloyscan thus lead to evaporation of volatile Cr species, such as CrO3 andCrO2(OH)2. The formation of CrO3 (g) in dry conditions:
CrxCr �3
2O2pgq � v
3
Cr � 3h � CrO3pgq (3.1)
The evaporation rate of CrO3 is proportional to p34O2
,7 and the CrO3
evaporation is thus most important at high partial pressures of oxygen. Inwet atmospheres, CrO2(OH)2 (g) is formed by:
CrxCr �3
2O2pgq �H2Opgq � v
3
Cr � 3h � CrO2pOHq2pgq (3.2)
The chromium loss caused by evaporation increases the degradation rate ofthe material, and evaporated chromium species may also lead to cathodepoisoning if the alloy is used as an interconnect in a fuel cell system.
3.4 Cr2O3
Many high-temperature applications use iron-based alloys with chromiumas a major constituent. This is largely due to the formation of the slowlygrowing, protective Cr2O3 scale on the metal surface. The crystal structureof chromia can be seen as hexagonally close-packed oxygen anions withchromium cations occupying two thirds of the octahedral sites. This isreferred to as the corundum structure.
27

3.4.1 Electrical conductivity
Cr2O3 is an electronic conductor. Young et al.32 found chromia to bea p-type conductor at high pO2 and a n-type conductor at low oxygenpartial pressures. However, Young et al. were unable to change from p-to n-conductivity by reducing the oxygen activity. Holt and Kofstad33,34
found the conductivity of Cr2O3 to be divided in one high temperatureregion (>1000-1200 �C) and one low temperature region (<1000-1200 �C)of lower activation energy. Conductivity measurements conducted by Holtand Kofstad showed no pO2 dependence at temperatures above 1000 �C,indicating that chromia at high temperatures is dominated by intrinsicelectronic equilibrium:
n � p � Ki (3.3)
Here n and p represent electron concentration and electron hole concentra-tion, and Ki is the equilibrium constant. At temperatures below 1000 �C,Holt and Kofstad found chromia to exhibit p-type conductivity.
3.4.2 Diffusion in chromia
The growth of chromia on alloys is governed by the diffusion of ions throughthe oxide scale. As ion transport in oxides are enabled by the presence ofcrystallographic defects, as discussed in section 2.3, understanding the defectstructure of Cr2O3 is necessary. Defect chemical equations regarding theformation of chromium and oxygen defects in chromia were given in section2.3.3.
In pure chromia, the diffusing species governing the oxide growth arechromium and oxygen ions. Early studies on the self-diffusion of chromiumand oxygen in polycrystalline samples of Cr2O3 at high temperatures,from 1100 �C to 1600 �C, have been reviewed by Kofstad.7 The self-diffusion of chromium was suggested to be about three orders of magnitudefaster than that of oxygen. Later studies on single crystals of Cr2O3 didhowever show that the self-diffusion coefficients of Cr go through very lowminimum values at certain oxygen activites. A summary of the Cr tracerdiffusion coefficients in chromia as a function of temperature and oxygenactivity can be seen in figure 3.1, retrieved from Kofstad.7 The activationenergy for Cr diffusion in Cr2O3 has been determined to approximately245 kJ/mol.35 The diffusion coefficients are believed to represent latticediffusion of chromium. As measurements on single crystal samples of Cr2O3
showed reduced Cr diffusion coefficients, it is suggested that the early studieson polycrystalline samples were significantly influenced by grain boundarydiffusion of chromium. Sabioni et al.36 suggest Cr diffusion coefficients inCr2O3 to be independent of pO2 . Although this is not confirmed by otherreports, the measurements in figure 3.1 also indicate large regions where
28

Figure 3.1: Chromium self-diffusion coefficients in Cr2O3 as a function oftemperature and oxygen activity.7
chromium diffusion coefficients are nearly independent of pO2 . The reasonfor this is unclear, and from the available experimental data no conclusionabout the pO2 dependency of chromium diffusion coefficients in Cr2O3 canbe made.
The diffusion of oxygen in chromia was initially found to be several ordersof magnitude slower than that of chromium.7,12 However, later studies bySabioni et al.36 found the oxygen self-diffusion coefficients, both in the latticeand in grain boundaries, to be greater than that of chromium. The activationenergy for oxygen diffusion in Cr2O3 was reported to 230 kJ/mol, which isslightly lower than that of chromium. Oxygen diffusion should thus becomeincreasingly important with decreasing temperature.
29

3.4.3 Growth mechanisms
The growth mechanism of Cr2O3 scales is a debated topic. The scale growthcan proceed by outward diffusion of chromium, inward diffusion of oxygen ora combination of the two. In addition, the inward and outward ion transportcan occur through lattice positions or by rapid diffusion paths such as grainboundaries and dislocations. Chromia scales are generally assumed to growby predominately outward Cr diffusion. Caplan and Sproule37 concludedthat the formation of a monocrystalline Cr2O3 oxide scale grows by outwarddiffusion of Cr ions. However, Atkinson and Taylor38 suggested that chromiagrowth rates are too fast for growth by outward Cr diffusion only. Lobnig etal.12 suggests a significant contribution by inward diffusing oxygen. Kofstad7
and Tsai et al39 indicate that Cr2O3 scales grow by counter-current diffusionof Cr and O, mainly along grain-boundaries. The oxide scale will grow bothnormal to and parallel with the metal surface, and the two-way diffusion ofanions and cations can lead to compressive stresses, strains and cracking ofthe scales.7
3.4.4 Impurities and dopants
As alloys contain a number of different alloying elements, the diffusion ofelements such as Mn, Fe, Ni or Co through chromia is also important toinvestigate. Ferritic alloys with an addition of elements such as Mn or Co willform a spinel phase on top of the stable Cr2O3 scale. This is suggested to bea result of very rapid diffusion of these elemens.12 Lobnig et al12 measureddiffusion coefficients through Cr2O3 grown on Fe-20Cr and Fe-20Cr-12Nialloys. The general trends in their measurements were that the diffusioncoefficients for Fe, Cr and Ni are in the same range, while the Mn diffusivityin the lattice is about two orders higher.12 Diffusion coefficients of Cr inH2+H2O mixtures are reported to be larger than in CO+CO2 mixtures,7
suggesting that hydrogen enters as a dopant in chromia and significantlyaffects the defect structure of the oxide, even at higher temperatures.
3.5 High Temperature Environmental ScanningElectron Microscopy
Much information can be provided by investigating a process as it happens,compared to only examining the inital state and end results. HighTemperature Environmental Scanning Electron Microscopy (HT-ESEM) isa technique of great potential, while it is not commonly used in corrosionstudies. Usually, samples are heated and oxidized, before later cooled downand examined. In such ex-situ experiments, it is impossible to tell exactlywhen or how an event occurs. In-situ experimental techniques, such as HT-ESEM, can provide knowledge in initial stages of growth and microstructural
30

changes that are previously unknown. A variety of in-situ techniques areavailable and widely used as of today, such as TG, in-situ XRD, conductivitymeasurements and Transmission Electron Microscopy (TEM). The use ofHT-ESEM is on the other hand quite limited.
Schmid et al.40 investigated the oxidation of pure nickel and chromiumin oxygen or water vapour at 700 �C using in-situ ESEM. They found theoxide formation in pure oxygen to be a fine-grained, dense layer, while watervapour atmosphere lead to the formation of chromium whiskers. Whiskersare believed to be favoured when cation lattice diffusion is very slow and anoxidant with the ability to decompose fast on the oxide is available.40 Thegrowth of whiskers in water vapour atmosphere was also reported by Schmidet al.41 for the oxidation of pure iron at 700 �C, and by Jonsson et al.42 forpure iron at 500 �C.
As the maximum pressure obtainable by ESEM is much lower thanambient pressure, it can be questioned if the results achieved during HT-ESEM experiments are comparable to ex-situ experiments under atmosphericconditions.43 In addition, the effect of a water vapour atmosphere,low vacuum and an electron beam on the oxidation behaviour must beacknowledged. The presence of water vapour is known to alter the oxide scalegrowth on alloy surfaces by increasing the corrosivity of the environment.42
The image quality obtained by HT-ESEM has also been reported to decreaseas a function of oxide scale thickness, due to the reduction in electricalconductivity.40
31

32

Chapter 4
Experimental
4.1 Introduction
This chapter will describe the methods and procedures used during theexperimental work of this thesis. The main experimental route includedsample preparation, oxidation and subsequently characterization of theformed oxide scales. All experiments in this thesis were conducted onsamples of a multicomponent Fe-Cr alloy, Sanergy HT from Sandvik. Thishigh-temperature alloy is specifically designed for interconnects in fuel cellapplications. The steel samples were either uncoated, or had an appliedprotective coating of 600 nm Co. The chemical composition of Sanergy HTis presented in table 4.1.
Table 4.1: Nominal Composition of Sandvik Sanergy HT (wt.%)
Cr Mn Si Mo Nb Add. Fe22 ¤ 0.50 ¤ 0.30 1.0 0.75 Ti Bal.
4.2 Thermogravimetry
Thermogravimetry (TG) is a method measuring the weight change of asample as a function of time or temperature, when a sample is exposedto a controlled atmosphere. This is one of the most common methods toinvestigate oxidation of metals. As a metal oxidizes, the measured weightchange will reflect the oxide scale growth. From the resulting data, the overallkinetics may be analysed to determine which processes are dominating thereaction rates.
Both temperature and gas composition could be varied during measure-ments. To enable the use of different gas compositions, the thermobalance
33

used in this work was connected to a gas mixer. All TG measurements wereconducted under isothermal conditions in the range of 800-1000 �C, in 5 %H2+Ar, O2+Ar and pure O2. The maximum water vapour content was apH2O of 0.025 atm. In this work, this is referred to as "wet" conditions.
4.2.1 Instrumentation
The TG measurements were done using a C.I. Electronics MK2 Microbalancewith a 0.1 µg sensitivity and a maximum load capacity of 5 grams. Thesample was hanging freely on a platinum wire connected to the instrument’sbalance arm, counterbalanced by weights. The counterweights were locatedinside a glass tube, while the sample was positioned inside a resistance heatedAC furnace. The conditions in the AC furnace were isothermal and isobaric.The temperature was monitored by a thermocouple, and the ambient gascomposition was given by the connected gas mixer. The flow rate from thegas mixer to the reaction chamber was controlled by a ball flow meter.
Measurements in reducing atmospheres required some additional steps tominimize the risk of leakages. The sample was suspended inside a long glasstube connected to the instrument, ensuring a gas-tight system. Prior tothe experiments, the entire system was flushed with inert gas (Ar) beforeintroducing the hydrogen containing gas mixture. The program LabWeighwas used to graphically display data while measuring. Later the data wasexamined using the graphing and data analysis software Origin.
4.2.2 Sample preparation
The samples were made from a 0.2 mm thick foil of Sanergy HT, measuredand cut to dimensions of 1.40 x 1.90 cm2. A hole of 2 mm in diameterwas drilled for suspension. Each sample was finally cleaned in ethanol anddried by compressed air before suspended into the furnace at isothermaltemperature.
4.3 The gas mixer
It is desirable being able to vary and control the surrounding atmosphereof samples during measurements. In this thesis the gas composition for allthermogravimetric measurements was controlled using a gas mixer. The gasmixer consists of several connected pressure meters, with the possibility toinlet various gases. By mixing oxygen and argon, the oxygen partial pressurein the system can be varied. As the argon gas used in this work is assumedto have an oxygen impurity level of about 10 ppm, the minimum partialpressure of oxygen in a oxygen-argon mixture is 1 � 10�5 atm.
34

The water vapour partial pressure can be varied by leading the gas mixturethrough a wetting or drying stage. The wetting stage consists of onecontainer of pure H2O and one container of a saturated KBr solution. ThepH2O of the gas mixture after passing through the KBr solution will be 0.025atm at 25 �C. The drying stage is a container of P2O5 salt which will absorbwater from the gas mixture. However, due to possible leakages elsewhere inthe system, it is assumed that approximately 30 ppm H2O can be presentalthough the gas mixture is lead through a drying stage. In this work, thegas mixtures used will hereafter be named "wet" or "dry" to specify theirwater vapour content. Under reducing conditions, a mixture of wet 5 % H2
and argon was used. The program GasMix was used in calculating partialpressures of gases by specifying the gases and types of flow meters presentin the system.
4.4 High Temperature Environmental ScanningElectron Microscopy
High Temperature Environmental Scanning Electron Microscopy was usedfor in situ investigation of the oxide growth on Sanergy HT. As many differentparameters influence the image quality and the results obtainable by HT-ESEM, both the instrumentation and the execution of the experiment canbe complex. This section will provide an overview of general principlesof the technique and the instrumental setup. Instructions and technicalspecifications given in this section is retrieved from "Options Manual FEIXL 30 SEM" by FEI Company.44
4.4.1 Instrumentation setup
Scanning electron microscopes are most commonly used for room tempera-ture experiments, and many of the components are not customized for ele-vated temperatures. High temperature experiments in a SEM will thereforeinvolve both exchanging temperature sensitive components and installinga complete high temperature system. The high temperature system itselfconsists of several components:
• Heating Stage Module (HSM)
• High Temperature Stage Controller (HTSC)
• Water Flow Box (WFB)
• Heat Shield Assembly for 1500 �C (HSA)
• Bias Supply Controller (BSC)
• High Temperature Gaseous Secondary Electron Detector (HT-GSED)
35

A schematic illustration of the components in the HT-ESEM system is givenin figure 4.1. The heating stage used was a resistance heated furnace custom
Figure 4.1: Schematic diagram of HT-ESEM instrumentation for FEIQuanta 200F44
build for FEI instruments. The heating stage module has a heating rate inthe range of 1-50 �C/min and can reach a maximum temperature of either1000 �C or 1500 �C. To measure the temperature, a thermocouple specific forthe furnace was used. The thermocouple for the 1000 �C furnace is B-type,while the 1500 �C furnace uses a K-type thermocouple. In this work, allexperiments were done using a 1500 �C HSM. The heating stage was cooledby water flow, monitored by a connected WFB.
Thermally excited electrons severely affect the image quality obtained forheated samples. To reduce the effect of thermal electrons, a bias was applied.Depending on whether the applied bias is positive or negative, electrons willbe promoted or suppressed. The high temperature system includes both aheat shield bias and a sample bias. For experiments at temperatures below400 �C, an applied heat shield bias is not necessary. The complete HT-ESEMsetup inside the Scanning Electron Microscope at high temperature can beseen in figure 4.2.
4.4.2 Sample preparation
The steel foil samples were cleaned with ethanol, dried by pressurized airand then cut in circular pieces of � 2 mm diameter. The sample wasmounted on top of an alumina crucible and glued in place by platinum inkto ensure connection between the sample and the applied bias. The alumina
36
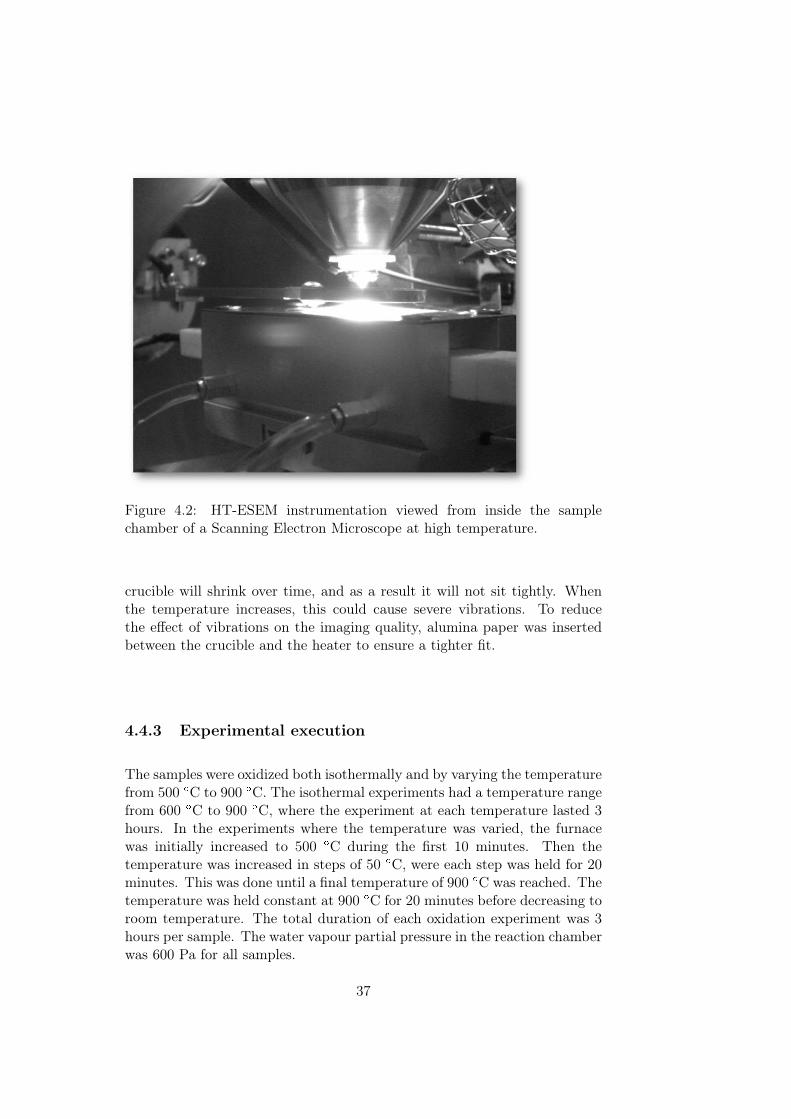
Figure 4.2: HT-ESEM instrumentation viewed from inside the samplechamber of a Scanning Electron Microscope at high temperature.
crucible will shrink over time, and as a result it will not sit tightly. Whenthe temperature increases, this could cause severe vibrations. To reducethe effect of vibrations on the imaging quality, alumina paper was insertedbetween the crucible and the heater to ensure a tighter fit.
4.4.3 Experimental execution
The samples were oxidized both isothermally and by varying the temperaturefrom 500 �C to 900 �C. The isothermal experiments had a temperature rangefrom 600 �C to 900 �C, where the experiment at each temperature lasted 3hours. In the experiments where the temperature was varied, the furnacewas initially increased to 500 �C during the first 10 minutes. Then thetemperature was increased in steps of 50 �C, were each step was held for 20minutes. This was done until a final temperature of 900 �C was reached. Thetemperature was held constant at 900 �C for 20 minutes before decreasing toroom temperature. The total duration of each oxidation experiment was 3hours per sample. The water vapour partial pressure in the reaction chamberwas 600 Pa for all samples.
37

4.5 Two-stage oxidation: 18,18O2-16,16O2 isotope ex-change
Two-stage oxidation by exchange of oxygen isotopes 18,18O2 and 16,16O2
is often used to investigate the growth mechanisms of oxides on alloys.Characterization methods such as Secondary Ion Mass Spectrometry (SIMS)can subsequently be used to obtain depth profiles showing the distributionof oxygen isotopes in the scale, and by this provide information about thedominating growth mechanisms. It is then possible to elucidate to whatextent outward cation diffusion, or inward diffusion of oxygen, is takingplace in the scale growth.
4.5.1 Sample preparation and instrumentation
Foil of Sanergy HT (0.2 mm thick) was cut into samples of dimensions 20x10mm2, cleaned in ethanol and dried by pressurized air. The samples whereplaced inside a closed quartz tube, inserted into a tube furnace at isothermaltemperature. The total pressure was monitored by a Pfeiffer CMR 261pressure gauge, and the gas composition by a Pfeiffer Prisma QME 200Quadropole Mass Spectrometer. The oxygen isotopes 18,18O2 and 16,16O2
were introduced by a connected gas supply system.
The samples were initially oxidized in 18,18O2 up to approximately halfthe desired scale thickness. Subsequently the gas was exchanged to 16,16O2.By using 16,16O2 in the final stage of oxidation, any small air leakages inthe system over time would not severely affect the experiment. All two-stage oxidation experiments of this work were conducted on cobalt coatedsamples.
4.6 Characterization methods
The samples in this work were characterized post oxidation by a numberof methods to retrieve information about the crystal structure, compositionand morphology of the oxide scales. X-ray diffraction, Scanning ElectronMicroscopy and Secondary Ion Mass Spectrometry can all provide differenttypes of information. This section will present the characterization methodsused to investigate the oxidized samples of this work.
4.6.1 X-ray diffraction
The oxide phases present in the scales grown on Sanergy HT were identifiedby X-ray diffraction (XRD). The instrument used was a Bruker D8 Discoverdiffractometer with monochromatic Cu-Kα1 radiation and Bragg-Brentanogeometry. Fluorescence suppression settings were used to avoid noise from
38

Fe fluorescence due to the copper radiation source. The resulting diffractionpatterns were compared to the ICDD 1 database in the program EVA (BrukerAXS Inc., USA).
4.6.2 Scanning Electron Microscopy
Analysis of chemical composition and morphology were conducted byScanning Electron Microscopy (SEM). The instrument used was a Quanta200F FEG-SEM (FEI Company, USA). This microscope has two differentdetectors for collecting secondary electrons. In high vacuum (HV), themicroscope uses an Everhart-Thornley detector (ETD), while in low vacuuma Large-Field detector (LFD). Backscattered electrons are collected by aSolid-State detector (SSD). In addition, an Energy-Dispersive detector isused to map chemical composition. Oxide scale thicknesses were measuredby the imaging program XT docu. To conduct cross sectional analysis ofoxidized samples by SEM, the samples were embedded in resin and preparedby wet water grinding on SiC grinding paper. Surface imaging in SEMrequired no further sample preparation.
4.6.3 Secondary Ion Mass Spectrometry
The distributions of oxygen isotopes 18,18O2 and 16,16O2 in oxide scales grownduring two-step oxidation experiments were investigated by Secondary IonMass Spectrometry (SIMS). SIMS is widely used in analysing tracer elementsin solid materials. The sample is sputtered by a focused ion beam, andthe ejected secondary ions are then collected and analysed. Depth profilescan be constructed by recording secondary ion intensities as a function ofsputter time. Converting ion intensities to concentration values involve usinga reference sample of known concentration. As no standard is available forthe samples analysed in this work, the measured ion intensities, Ii, wereconverted to normalized, fractional concentrations according to equation 4.1.
Ci1pxq �Ii1pxq
Ii1pxq � Ii2pxq(4.1)
Ci is the normalized ion concentration of the chemical species i, x isinward depth from the oxide surface and Ii is the measured ion intensity ofthe chemical species i. The sputter time was converted to depth by measuringthe depth of the sputtered crater with a profilometer. The instrument usedwas a Cameca IMS 7f with a 15 keV Cs� ion beam. The depths of thesputtered SIMS craters were measured by a Dekta 8 stylus profilometer. Fordepth calibration, the erosion rate was assumed to be constant. The SIMSanalysis was conducted in collaboration with Lasse Vines at the Departmentof Physics, University of Oslo.
1International Centre for Diffraction data
39
4.7 Sources of error
Obtaining exact measurements by experimental work is impossible. Scientificresults will always be susceptible to error, and the goal of any experimentalistshould thus be to minimize these errors and keep track of their sources. Thissection will provide some known inaccuracies and sources of errors in theexperimental methods used in this work.
4.7.1 Sample preparation
The alloy used in this work was provided by Sandvik Materials Technology.Compositional differences between alloy batches can occur, and it is thuspreferable that all compared samples originate from the same batch. Theinitial oxidation of metal surfaces are very affected by defects present atthe surface. To avoid grease and foreign impurities on the surfaces, glovesshould be worn while handling the samples. Bending the samples introducedefects such as dislocations into the material, which may affect the oxidationmechanisms. It is also important to consider the sample dimensions, asthinner samples are reported to oxidize faster.16
4.7.2 Thermogravimetry
The oxidation of metals is very much affected by temperature. Also, thethermobalance is sensitive to thermal vibrations. To ensure comparableconditions and minimal noise, temperature stability is important. Thesamples were suspended midway down and in the center of the cylindricalfurnace, this to minimize the effect of any gradient in temperature. Thethermocouple monitoring the temperature was mounted at the same heightas the samples. The thermobalance is also sensitive to mechanical vibrations,which can be reduced by placing the instrument on vibration absorbingmaterial.
The gas flow from the gas mixer will also contribute to noise. This noisewill vary depending on the weight and size of the present gas molecules. Dueto this noise, only the overall trends and oxidation kinetics were consideredwhen analysing the thermogravimetric data.
The flow meters of the gas mixer have high uncertainties (� 60 %) atflows below 20 mm. The uncertainty is reduced to � 5 % for flow ratesabove 60 mm. The flow rates in the experimental work of this thesis werethus constrained to higher levels, with an absolute minimum value of 30mm. The gas mixer consists of copper tubing and numerous connections,which are prone to leakages from the ambient. The entire gas mixer and
40

the thermobalance were checked for leakages at regular intervals to ensure agas-tight system.
Uncertainties of rate constants from thermogravimetric measure-ments
Growth rate constants are widely used in describing kinetics of oxidationreactions on metal or alloy surfaces. In this work, parabolic oxidationbehaviour is the most encountered and this section will thus discussuncertainties of parabolic growth rate constants. Uncertainties include:
• temperature uncertainty of the thermocouple
• temperature gradient inside furnace
• variance in the surrounding atmosphere
• mechanical disturbance and noise
• sample manufacturing and surface preparation
• surface area measurements and calculations
• fitting and analysis of experimental data
Oxidation kinetics are very dependent on temperature. It is therefore ofhigh importance to be in control of the temperature in which the oxidationexperiments proceed. As mentioned in section 4.2.1, the temperature insidethe furnace is monitored by a thermocouple. There will be a differencebetween the temperature measured and the true temperature the samplesare exposed to. The magnitude of this temperature difference should beexamined to verify how this may influence the measurements.
The parabolic weight related growth rate constant kp,w is calculated fromthermogravimetric experiments by plotting the weight gain of a samplesquared as a function of time. If the growth is parabolic, this will yielda straight line with a slope kp,w. The most common unit used for reportingkp,w values is g2
cm4s. The calculated kp,w values may vary as a function of
experimental duration. When comparing kp,w values of several experiments,it is preferable that all growth rate constants are calculated from a similarnumber of hours. Mechanical disturbance will also give rise to noise in themeasurement data, affecting the linear fit and hence the value of kp.
41

42

Chapter 5
Results
This chapter will present the results from the oxidation experimentsconducted on uncoated and cobalt coated samples of Sanergy HT. Thechapter is divided in four main parts:
• Composition and morphology
• Thermogravimetry
• Two-stage oxidation (18,18O2 -16,16O2 exchange)
• HT-ESEM
The first section will present the composition and morphology of the formedoxide scales, including results from XRD and SEM. The next sextionpresents measured weight gain curves, temperature dependencies and pO2
dependencies of parabolic rate constants for precoated and uncoated samplesof Sanergy HT. The third section, presenting the results from the two-stageoxidation experiments, will include characterization of the resulting oxidescales by SIMS. The HT-ESEM section will include series of images fromSEM, showing oxide scale development as a function of time. A CD includingvideo clips of the oxide scale growth observed during HT-ESEM will beincluded as an attachment to this thesis.
5.1 Composition and morphology of oxide scales
5.1.1 Chemical composition
The compositions of the oxide scales formed on uncoated and coated sampleswere characterized by XRD and EDS. EDS analysis of the oxide scales formedon samples of Sandvik Sanergy HT indicates a duplex oxide scale consistingof a Cr2O3 phase near the alloy-oxide interface and a (A,B)3O4 (A, B =Mn, Cr, Co and/or Fe) spinel phase near the gas-oxide interface. Thiswas confirmed by XRD. The oxide phases identified by XRD for uncoated
43

samples in wet air is presented in table 5.1. The exact chemical compositionof the spinel phase is difficult to determine, due to the small difference inionic radii for Fe, Mn and Cr cations. The most probable composition is amanganese rich spinel phase, as indicated by EDS. The spinel phase variesin composition depending on temperature, time and surface coating. Forcobalt coated samples, the spinel phase was found to be rich in cobalt anddeficient in chromium.
Table 5.1: Oxide phases identified by XRD in oxide scale on uncoatedSanergy HT samples, oxidized in wet air at 850 �C and 900 �C for 150hours.
Oxide phases
Cr2O3
FeMn2O4
MnFe2O4
CrMn1,5O4
Cr1,3Fe0,7O3
Fe2O3
The total thickness of the oxide scale, and the ratio between the spinelphase and chromia, varies as a function of time, temperature and reactionatmosphere. A linescan showing the distribution of O, Cr, Mn, Co and Feas a function of distance through the oxide scale of a cobalt coated sampleoxidized in wet 5 % H2+Ar at 975 �C for 40 hours, can be seen in figure 5.1.The outer layer of the oxide scale is the (Co, Mn)3O4 spinel phase and theinner layer is Cr2O3.
Surface concentrations of cations: Cr, Mn and Fe
The surface concentrations of Cr, Mn and Fe for uncoated and cobalt coatedsamples oxidized in wet 5 % H2+Ar and O2+Ar mixtures at temperaturesfrom 850 �C to 1000 �C for 150 hours were estimated by EDS-analysis, seetable 5.2.
Chromium concentrations on surfaces of uncoated samples are similarunder reducing and oxidizing conditions, indicating negligible dependence onpO2 . The variation with increasing temperature is also small. Cobalt coatedsamples show low concentrations of chromium at temperatures below 925 �C.At temperatures from 925 �C to 1000 �C, large precipitations of chromiumrich particle clusters are observed, see figure 5.2. The Cr concentrations inthese islands are significantly higher, from 38 at.% to 47 at.%.
44

Figure 5.1: Angled view of spinel and chromia oxide scales formed on Cocoated sample oxidized in wet 5 % H2+Ar at 975 �C for 40 hours. EDSlinescan results are included to show the distribution of selected elements asa function of distance.
Table 5.2: Surface concentrations of Cr, Mn and Fe under oxidizing andreducing conditions at temperatures from 850 �C to 1000 �C after 150 hours.
Atmosphere Sample Cr (at.%) Mn (at.%) Fe (at.%)
wet 5 % H2+Ar Uncoated 40-50 20-23 2-5wet 5 % H2+Ar 600 nm Co 3-9 4-16 6-7
O2+Ar Uncoated 43-45 11-20 2-5O2+Ar 600 nm Co 3-9 10-20 2-5
The concentration of manganese measured on oxide surfaces increases asa function of temperature and time. This is assumed to be a result of largeramounts of manganese reaching the surface after diffusion from the alloyinterior. For uncoated samples at 900 �C, large crystalline particles richin Mn were observed, see figure 5.3. These crystalline particles had a Mnconcentration of 65 at.%. The Mn rich particles had very low concentrationsof chromium, 3 at.%, which indicates the formation of a relatively puremanganese oxide phase.
Surface concentrations of Fe on uncoated and cobalt coated samples aregenerally low and constant. However, cobalt coated samples under reducingconditions show slightly increased surface concentrations of iron, as seen intable 5.2.
45

Figure 5.2: Surface of cobalt coated sample oxidized in wet 5 % H2+Ar for150 hours at 950 �C. Large precipitations of Cr rich particle clusters andprotruding oxide ridges are observed.
Figure 5.3: Surface image of the formed oxide scale on a uncoated sampleoxidized in wet 5 % H2+Ar at 900 �C for 150 hours. Large, Mn rich (65at.%) crystalline particles were observed.
46

Table 5.3: Concentrations of Cr, Mn, Fe and Co in chromia and spinelphases on uncoated and cobalt coated samples oxidized in wet 5 % H2+Arat temperatures from 850 �C to 1000 �C after 150 hours. In the spinel phase(A,B)3O4, A and B represent Cr, Mn, Co and Fe.
Cr2O3 Cr (at.%) Mn (at.%) Fe (at.%) Co (at.%)
Uncoated 60 < 1 6-8 -600 nm Co 60 < 1 6 < 1
(A,B)3O4 Cr (at.%) Mn (at.%) Fe (at.%) Co (at.%)
Uncoated 45 40 12 -600 nm Co 5-8 14 12-16 30-46
Cation concentrations in oxide scale cross sections
Uncoated samples and cobalt coated samples oxidized in wet 5 % H2+Ara temperatures between 900 �C and 1000 �C show duplex oxide scalesconsisting of Cr2O3 near the oxide-alloy interface and (Cr, Mn)3O4 spinelnear the gas-oxide interface. The concentrations of Cr, Mn, Fe and Co inchromia and spinel phases on uncoated and cobalt coated samples oxidizedunder reducing conditions at temperatures from 850 �C to 1000 �C for 150hours can be seen in table 5.3.
Some interesting features are:
• A selection of cobalt coated samples indicate Fe concentrations of 12-16at.% in the (Co, Mn)3O4 spinel phase. The observed Fe concentrationsdrop in the Cr2O3 layer, and is thus not caused by collected signalsfrom the underlying steel.
• EDS linescans indicate increased concentrations of Si (2-4 at.%),Ti (1 at.%) and Nb (1-2.7 at.%) in the spinel-Cr2O3 and Cr2O3-alloy interfaces. These elements are present in the alloy in smallconcentrations1.
5.1.2 Surface morphology
The surface morphologies of grown oxide scales were investigated by SEMimaging. Large variations were observed, confirming the complex relationbetween nucleation and growth of oxide particles, and external influencessuch as surface treatment, temperature and gas compositions.
1Nominal composition of Sanergy HT can be found in table 4.1 in chapter 4
47

(a) 45 hours at temperatures from 875 �C to 950 �C.
(b) 150 hours at temperatures from 850 �C to 1000 �C.
Figure 5.4: Surfaces of uncoated samples oxidized in wet 5 % H2+Ar for45-150 hours at temperatures from 850 �C to 1000 �C.
Uncoated samples oxidized in wet air and wet 5 % H2+Ar for 150 hoursat temperatures from 850 �C to 1000 �C generally show uniform, continuousscales. Figure 5.4 show uncoated samples oxidized under reducing conditionsfor 45-150 hours at temperatures from 850 �C to 1000 �C. In wet air larger,spherical particles are nucleated in the rolling direction of the steel foil. Thisis not observed under reducing conditions.
The microstructure of uncoated steel samples prior to and after oxidationin wet air at 900 �C for 150 hours can be seen in figure 5.5. The oxide scalesgenerally consist of homogeneous crystalline particles, with the exception oflarger nucleations on surface defects. With increasing temperature, uncoatedsamples show larger particle sizes and wider size distributions, see table 5.4.
48

Figure 5.5: Left: Surface of uncoated steel sample prior to oxidation. Right:Uncoated sample oxidized at 900 �C in wet air for 150 hours. Larger particlesgrow in the rolling direction of the steel foil.
Table 5.4: Particle sizes of oxide scales on uncoated samples oxidized in wetair at temperatures from 850 �C to 1000 �C for 150 hours.
Temperature (�C) Particle size (µm)
850 0.4900 0.71000 1-5
At lower temperatures, the oxide scales are relatively flat. However, thescales become more buckled with increasing temperature, indicating largergrowth stresses in the oxide scales at higher temperatures. Under reducingconditions, the scales at high temperatures are less buckled than underoxidizing conditions. A comparison of the oxide scale surfaces of uncoatedsamples oxidized at 900 �C for 150 hours under oxidizing and reducingconditions can be seen in figure 5.6.
Uncoated samples oxidized under reducing conditions at 850 �C exhibitsurfaces covered by whiskers of varying length and thickness, as seen in figure5.4b.
For cobalt coated samples oxidized under both oxidizing and reducingconditions, two temperature regions are observed. At temperatures from850 �C to 900 �C, the oxide scale is uniform and continuous with no second
49

Figure 5.6: Surfaces of uncoated samples oxidized in wet air (left) and wet 5% H2+Ar (right). The oxide scale formed under reducing conditions is lessbuckled.
phase precipitates. At 850 �C, the oxide particles are clearly defined andcrystalline. As temperature increases, the grains sinter to soft-edged particleswith wide distributions in shape and size.
The second temperature region begins at approximately 925 �C, wherethe oxide grains sinter further to large, flat grains from 1 µm to 8 µm indiameter. Gaps and pores are present at the grain boundaries, and the grainboundaries appear as ridges on otherwise flat oxide scales. The ridges at thegrain boundaries are most protruding at temperatures between 925 �C and975 �C. At 1000 �C, the grain boundaries appear more flat. For all samplesoxidised at temperatures from 925 �C to 1000 �C, large precipitations ofspherical particles are observed. These are identified as Cr2O3. Figure 5.7show the surfaces of cobalt coated samples oxidized in wet 5 % H2+Ar for150 hours at temperatures from 850 �C to 1000 �C.
5.1.3 Metal-oxide interface properties
Stress induced ballooning of the oxide-alloy interface was observed foruncoated samples oxidized in wet air at 1000 �C for 150 hours. This effectwas not observed for samples oxidized under reducing conditions at the sametemperature. Samples oxidized under reducing conditions exhibited flatoxide-alloy interfaces, indicating uniform growth without significant growthstresses. A comparison of the oxide-alloy interfaces under oxidizing andreducing conditions can be found in figure 5.8. White precipitations, seefigure 5.9 were observed at the oxide-alloy interface after oxidation in wet 5% H2+Ar and wet air at temperatures from 900 �C to 1000 �C. A selection
50

Figure 5.7: Cobalt coated samples oxidized in wet 5 % H2+Ar for 150 hoursat temperatures from 850 � to 1000 �C
Figure 5.8: Flat oxide-alloy interface for uncoated sample oxidized in wet 5% H2+Ar, ballooning of oxide-alloy interface for sample oxidized in wet air.Both samples are uncoated and oxidized at 1000 �C for 150 hours.
51

Figure 5.9: White precipitations inside oxide scale and at oxide-alloyinterface. 600 nm Co coated sample oxidized in wet 5 % H2+Ar at 900�C for 150 hours.
of samples showed increased concentrations of Si, Ti, Mo and Nb in theoxide-alloy interfaces. Due to the small amounts, determination of phasecompositions from is difficult. The same samples also exhibited gaps at theoxide-alloy interfaces. EDS linescans showed increased concentrations of Ti,Si in oxide-alloy interfaces.Increased concentration of Si in the spinel-chromiainterface and possibly inside the spinel layer, was also observed.
52

5.2 Thermogravimetry
Thermogravimetric measurements were conducted to measure the weightgain due to oxide growth of cobalt coated and uncoated Sanergy HT asa function of time. In this section the results of these experiments willbe presented. The parabolic growth rate constants are all calculated fromthe first 45 hours of oxidation, unless stated otherwise. Tables of weightrelated parabolic growth rate constants for thermogravimetric measurementsconducted in this work can be found in the Appendix.
5.2.1 Temperature dependency
Figure 5.10 shows the weight gain of 600 nm Co coated Sandvik Sanergy HTsamples at temperatures from 850 �C to 1000 �C in wet 5 % H2+Ar underatmospheric pressure. All samples show parabolic weight gain as a functionof time, indicating diffusion-controlled oxide scale growth. The weight gaincurve at 1000 �C show a rapid increase in reaction rate after approximately90 hours.
0 5 0 1 0 0 1 5 00
2
4
6
� � � � � �
� � � � � �
� � �
� � � � �
�
Weigh
t gain
, mg/c
m2
� � � � � �
� � � � � � � � � � � � � � � � � � � � � � � � � � � � � � �
� � � �
Figure 5.10: Weight gain of 600 nm Co coated Sandvik Sanergy HT attemperatures from 850 �C to 1000 �C in wet 5 % H2+Ar under atmosphericpressure.
The weight gain curves of uncoated samples at temperatures from 850�C to 1000 �C in wet 5 % H2+Ar and in wet air, both under atmosphericpressure, are given in figure 5.11 and figure 5.12. Under reducing conditions,
53

the oxidation kinetics for uncoated samples are parabolic at all measuredtemperatures. The weight gain curves in wet air are all initially parabolic,but at 1000 �C the oxidation rate accelerates after approximately 80 hours.This acceleration in reaction rate, often termed "breakaway oxidation", leadsto a change from parabolic to essentially linear growth kinetics.
0 5 0 1 0 0 1 5 00
1
2
3
� � � � �� � � � �
� � � � � �
�
Weigh
t gain
, mg/c
m2
� � � �
� � � � � � �� � � � � �� � � � � �
Figure 5.11: Weight gain as a function of time for uncoated Sanergy HToxidized in wet 5 % H2+Ar at 1000 �C, 900 �C and 850 �C for 150 hours.
The oxidation behaviour of uncoated samples oxidized in wet air andwet 5 % H2+Ar at 1000 �C for 150 hours can be seen in figure 5.13. In wetair, breakaway oxidation is observed, while in wet 5 % H2+Ar the oxidationfollows parabolic behaviour.
A comparison of the weight gain curves for cobalt coated and uncoatedSanergy HT oxidized in wet 5 % H2+Ar at 1000 �C for 150 hours can beseen in figure 5.14. At 1000 �C, the oxidation of the uncoated sample followsparabolic rate kinetics while the cobalt coated exhibits an acceleration inoxidation rate after approximately 80 hours.
54

0 5 0 1 0 0 1 5 00
2
4
6
8
� � � � �� � � � �
� � � � � �
�
Weigh
t gain
, mg/c
m2
� � � �
� � � � � � �� � � � � �� � � � � �
Figure 5.12: Weight gain as a function of time for uncoated Sanergy HToxidized in wet air at 1000 �C, 900 �C and 850 �C for 150 hours.
0 5 0 1 0 0 1 5 00
2
4
6
8
5 % H 2 + A r
w e t a i r
Weigh
t gain
, mg/c
m2
T i m e , h
w e t a i r 5 % H 2 + A r
Figure 5.13: Comparison of the weight gain for the oxidation of uncoatedSanergy HT at 1000 �C in wet air and wet 5 % H2+Ar for 150 hours.
55

0 5 0 1 0 0 1 5 00
2
4
6
U n c o a t e d
6 0 0 n m C o
Weigh
t gain
, mg/c
m2
T i m e , h
6 0 0 n m C o U n c o a t e d
Figure 5.14: Comparison of the weight gain for the oxidation of cobalt coatedand uncoated Sanergy HT at 1000 �C in wet 5 % H2+Ar for 150 hours.
56

5.2.2 Activation energy
The activation energy for oxidation was calculated from the slope of a linearfitting of weight related parabolic rate constants presented in an Arrheniusplot. All rate constants were calculated from the initial 45 hours of oxidationin both wet 5 % H2+Ar and wet air under isothermal conditions from 800�C to 1000 �C.
Cobalt coated Sanergy HT follows approximately linear Arrheniusbehaviour in wet 5 % H2+Ar at temperatures from 850 � to 1000 �C, seefigure 5.15, and the activation energy was calculated to 323 kJ/mol. Inwet air, the activation energy was calculated to 317 kJ/mol. The activationenergies for Co coated samples under oxidizing and reducing conditions differby 6 kJ/mol, which is well within the expected uncertainty. The activationenergy for oxidized Co coated samples is thus assumed to be equal underoxidizing and reducing conditions.
0 . 7 5 0 . 8 0 0 . 8 5 0 . 9 0 0 . 9 5- 1 3 . 0
- 1 2 . 5
- 1 2 . 0
- 1 1 . 5
- 1 1 . 0
- 1 0 . 5
� � � � � � � � � � � � � �� � � � � � � �
log k p,w
� � � � � � � � � �
1 0 0 0 9 5 0 9 0 0 8 5 0 8 0 0� � � � �
Figure 5.15: Arrhenius plot of kp,w, weight related parabolic rate constantsmeasured by thermogravimetry, for the oxidation of 600 nm Co coated inwet 5 % H2+Ar and wet air from 850 �C to 1000 �C.
57

0 . 7 5 0 . 8 0 0 . 8 5 0 . 9 0 0 . 9 5- 1 3 . 0
- 1 2 . 5
- 1 2 . 0
- 1 1 . 5
- 1 1 . 0
- 1 0 . 5
� � � � � � � ��� � � � �
� � � � � � � �
log k p,w
� � � � � � � � � � �
1 0 0 0 9 5 0 9 0 0 8 5 0 8 0 0� � � � �
Figure 5.16: Arrhenius plot of kp,w, weight related parabolic rate constantsmeasured by thermogravimetry, for the oxidation of uncoated Sanergy HTin wet 5 % H2+Ar and wet air from 850 �C to 1000 �C.
Uncoated samples in wet 5 % H2+Ar, see figure 5.16, do not follow linearArrhenius behaviour and the activation energy can thus not be calculatedfrom the full temperature range. The temperature dependence in wet airfollow a more linear Arrhenius-type behaviour and the activation energy wascalculated to 431 kJ/mol. A summary of the calculated activation energiesof both cobalt coated and uncoated samples can be found in table 5.5.
Table 5.5: Activation energies, Ea calculated for the oxidation of 600 nm Cocoated and uncoated samples in wet 5 % H2+Ar and wet air.
Sample Atmosphere Ea (kJ/mol)
600 nm Co wet 5 % H2+Ar 323wet air 317
Uncoated wet 5 % H2+Ar non-linear Arrhenius behaviourwet air 431
58

0 . 7 5 0 . 8 0 0 . 8 5 0 . 9 0 0 . 9 5- 1 2 . 5
- 1 2 . 0
- 1 1 . 5
- 1 1 . 0
- 1 0 . 5
� � � � � � � � � � � � � � � �� � � � � � � � � � � � � � � �
log k p,w
� � � � � � � � � �
1 0 0 0 9 5 0 9 0 0 8 5 0 8 0 0 � � � �
Figure 5.17: Arrhenius plot of kp,w, weight related parabolic rate constantsfor the oxidation of cobalt coated samples oxidized in wet 5 % H2+Ar. Eachrate constant is calculated from the time each sample is expected to havethe same oxide scale thickness. The assumed thickness used for calculationswas 3.4 µm.
The non-linear temperature dependence for uncoated samples underreducing conditions could result from the parabolic rate constants, eachcalculated from the initial 45 hours of oxidation, representing different stagesof the oxide growth. To investigate the effect of scale thickness on thedependence of temperature, parabolic growth rate constants calculated after45 hours are compared to rate constants calculated from the time were thesamples are expected to have similar oxide scale thickness. Figures 5.17 and5.18 show cobalt coated and uncoated samples, respectively.
5.2.3 Correlation between expected oxide scale thicknessfrom kp,t and scale thickness measured by SEM
An expected oxide scale thickness after 150 hours at a specific temperaturewas calculated by converting weight related parabolic growth rate constants(kp,w) measured by TG to thickness related rate constants (kp,t) usingequation 2.20 on page 17. A comparison of the calculated oxide scalethickness and the scale thickness measured by SEM for uncoated and cobaltcoated samples oxidized in wet 5 % H2+Ar for 150 hours at temperaturesfrom 850 �C to 1000 �C can be seen in table 5.6.
59

0 . 7 5 0 . 8 0 0 . 8 5 0 . 9 0 0 . 9 5
- 1 2 . 5
- 1 2 . 0
- 1 1 . 5
- 1 1 . 0
- 1 0 . 5
� � � � � � � � � � � � � � � � � � � �� � � � � � � � � � � � � � � � � �
log k p,w
� � � � � � � � � �
1 0 0 0 9 5 0 9 0 0 8 5 0 8 0 0 � � � �
Figure 5.18: Arrhenius plot of kp,w, weight related parabolic rate constantsfor the oxidation of cobalt coated and uncoated samples oxidized in wet 5 %H2+Ar. Each rate constant is calculated from the time where each sampleis expected to have the same oxide scale thickness. The assumed thicknessused for calculations was 1,4µm.
Table 5.6: Comparison of oxide scale thickness calculated from thicknessrelated parabolic growth rate constants (A) and scale thickness measured bySEM (B) for uncoated and cobalt coated samples oxidized in wet 5 % H2+Arat temperatures from 850 �C to 1000 �C for 150 hours.
T, �C A: calculated, µm B: measured, µm Ratio: A/B
Uncoated850 2.3 1.2 1.9900 2.8 3.0 0.91000 17 9.0 1.9
600 nm Co850 3.3 2.0 1.6900 5.9 4.5 1.3925 9.0 9.0 1.0950 13 8.0 1.6975 22 10 2.21000 23 17 1.4
60

The oxide scale thickness measured by SEM was similar to or lower thanthe calculated scale thickness for both uncoated and cobalt coated samplesat all temperatures. The reduced scale thickness could be due to samplepreparation. Cross sections are prepared by embedding the sample in resin,and the hardening of the resin could cause parts of the oxide scale to detach.If the cross sections are slightly tilted during preparation, this would affectthe scale thickness measured by SEM. However, as a tilted cross sectionwould increase the observed oxide scale thickness by SEM, this source oferror can be excluded. The reduced scale thickness can also be a resultof evaporation of volatile species from the oxide scales. The volatilizationof chromium is strongly dependent on pO2 ,20 and should not contribute tosignificant evaporation under reducing conditions.
5.2.4 pO2 dependence of parabolic growth rate constants
Undoped chromia is reported to have pO2 dependent defect concentrations,which will affect transport through the oxide and hence the oxide growthrate.
The pO2 dependence of parabolic rate constants measured isothermallyat 900 �C for uncoated and coated samples of Sanergy HT can be seen infigure 5.19. The growth rate constants show no significant dependence ofpO2 , and it is assumed that any small changes are caused by experimentaluncertainties.
61

- 2 0 - 1 5 - 1 0 - 5 0- 1 4
- 1 3
- 1 2
- 1 1
- 1 0
u n c o a t e d 6 0 0 n m C o
log k p,w
l o g p O 2
Figure 5.19: The pO2 dependence of parabolic growth rate constants (kp,w)measured isothermally at 900 � by TG for uncoated and coated samples ofSanergy HT .
62

0 5 0 0 0 0 1 0 0 0 0 0 1 5 0 0 0 00
1 x 1 0 - 7
2 x 1 0 - 7
3 x 1 0 - 7
U n c o a t e d
6 0 0 n m C o
Weigh
t gain
squa
red, g
2 /cm4
T i m e , s
6 0 0 n m C o U n c o a t e d 6 0 0 n m C o
U n c o a t e d
Figure 5.20: Weight gain squared (g2{cm4) as a function of time for cobaltcoated and uncoated samples oxidized in wet 5 % H2+Ar at 850 �C and 900�C. Curves have been smoothed to reduce noise.
5.2.5 Effect of cobalt coating
The effect of cobalt coating on oxidation kinetics and growth rates wereinvestigated. A comparison of the weight gain curves of cobalt coated anduncoated samples oxidized in wet 5 % H2+Ar at temperatures from 850 �Cto 900 �C, and at 1000 �C can be seen in figures 5.20 and 5.21 respectively.The weight gain of 600 nm Co coated samples is higher than that of uncoatedsamples in wet 5 % H2+Ar for all measured temperatures. The parabolicgrowth rate constants for cobalt coated and uncoated samples in wet 5 %H2+Ar and wet air at temperatures from 850 �C to 1000 �C can be seen intable 5.7.
63

0 5 0 0 0 0 1 0 0 0 0 0 1 5 0 0 0 00
1 x 1 0 - 6
2 x 1 0 - 6
3 x 1 0 - 6
4 x 1 0 - 6
U n c o a t e d
6 0 0 n m C o
6 0 0 n m C o U n c o a t e d
Weigh
t gain
squa
red, g
2 /cm4
T i m e , s
Figure 5.21: Weight gain squared (g2{cm4) as a function of time for cobaltcoated and uncoated samples oxidized in wet 5 % H2+Ar at 1000 �C. Curveshave been smoothed to reduce noise.
Table 5.7: Parabolic growth rate constants, kp,w (�10�13g2cm�4s�1), ofcobalt coated (A) and uncoated (B) samples oxidized in wet 5 % H2+Arand wet air.
Temperature, �C A: 600 nm Co B: Uncoated Ratio: A/B
wet 5 % H2+Ar850 �C 5.6 2.8 2.0900 �C 17 3.9 4.41000 �C 260 150 1.7
wet air850 �C 1.9 1.6 1.2900 �C 13 5.3 2.41000 �C 106 260 0.4
64

5.2.6 Uncertainty of measured weight gain curves
To estimate the uncertainty of weight gain curves obtained by thermo-gravimetry, 3 samples oxidized under identical conditions were compared.The weight gain curves are given in figure 5.22 and the parabolic growthrate constants, calculated from the initial 45 hours of oxidation, are givenin table 5.8. The estimated standard deviation of the series was 4.0�10�13
g2/cm4 s�1, or approximately 29 % of the measured average value.
0 1 0 2 0 3 0 4 00 . 0
0 . 2
0 . 4
0 . 6
S a m p l e 3
S a m p l e 2S a m p l e 1
Weigh
t gain
, mg/c
m2
T i m e , h
S a m p l e 1 S a m p l e 2 S a m p l e 3
Figure 5.22: Uncertainty in weight gain curves for 3 samples oxidized underidentical conditions.
Table 5.8: Comparison kp,w for 3 samples oxidized under identical conditions.
Sample kp,w, g2/cm4 s�1
1 1.4�10�12
2 1.0�10�12
3 1.8�10�12
When comparing different rate constants calculated from thermogravimet-ric data, rate constants should be corrected to a similar number of hours,or the same oxide scale thickness, if different measurements are to be com-pared. These to ensure that the rate constants represent the same stage in
65

the oxide growth, and to avoid the effect of noise or experimental artifactson calculated kp,w values over time.
5.3 Two-stage oxidation
Two-stage oxidation experiments were conducted at temperatures from 850�C to 1000 �C to investigate the distribution of oxygen isotopes and cationsin the formed scales of cobalt coated samples. Normalized SIMS depthprofiles were constructed, showing the measured concentrations as a functionof depth in the oxide scales. When converting ion intensities measured bySIMS to fractional concentration distributions, the following assumptionswere made:
• The secondary ion intensities of 16O and 18O are similar and thuscomparable.
• Cobalt and chromium are assumed to occupy the same crystallographicsites in the oxide structure, and thus have dependent concentrationdistributions.
• The differences in secondary ion intensities of Co and Cr are assumedto be small enough to compare general behaviour and trends in cationdistributions across the formed oxide scales.
Mn and Fe are also assumed to occupy the same crystallographic sites as Coand Cr, but very low secondary ion intensities increase the uncertainty of themeasured intensities significantly. The secondary ion intensities for Mn inthese measurements were too low to detect the distribution of manganese inthe formed oxide scales. However, the distribution of Mn is of great interestand should be investigated further. To accurately detect the secondary ionintensities of 18O and 16O, the ion sputtering in this work was conductedby a Cs ion beam. However, as positive ionization can be enhanced byelectronegative ions, sputtering with oxygen could possibly give better resultsfor Mn and similar elements.
The normalized SIMS depth profiles of the oxygen isotope distributionin oxide scales formed on cobalt coated samples during two-stage oxidationat temperatures from 850 �C to 1000 �C can be seen in figure 5.23. Theoxide scales generally show two distinct regions of well separated oxygendistributions. The inner part of the scale, close to the metal-oxide interface,consists mainly of 18O, while the outer region is dominated by 16O. The clearseparation of the two regions indicates oxide scale growth primarily from thegas-oxide interface by outward diffusion of cations.
66

Figure 5.23: Distribution of oxygen isotopes in oxide scale formed duringtwo-stage oxidation at temperatures from 1000 � to 850 �C for 80 min to 97hours.
67

At the lower temperatures, the innermost part of the oxide exhibits morenarrow oxygen distributions. Increased 16O in this region could indicateinward transport of oxygen, or the presence of an oxide phase formed on thealloy surface prior to oxidation in 18,18O2. At 1000 �C, the outer part ofthe scale show increased concentration of 18O, indicating significant oxygendiffusion in this region.
The depth profiles at lower temperatures show rounded distribution curvesin the inner part of the oxide, indicating a contribution to isotope variationapart from scale growth. This contribution could be isotope exchange withthe surrounding gas. Some general trends appear:
• Increased temperature broaden the 16O-18O switch area, indicatingmore rapid interdiffusion of oxygen ions.
• Features from possible isotope exchange with surrounding gas, to form16,18O2, in oxide scales formed prior to introduction of 18O appearmore steep as a function of temperature, indicating that the amountof oxygen exchanged is increasing with increasing temperature
68

Figure 5.24: Distribution of Cr and Co in oxide scale formed at temperaturesfrom 1000 � to 850 �C for 80 min to 97 hours.
5.3.1 Cation distribution
SIMS depth profiles showing Cr and Co distributions in the formed oxidescales can be seen in figure 5.24. The distributions show two regions, whereone is rich in Co and the other is rich in Cr. In the outer part of the oxidescale, cobalt is dominating the oxide scale distribution. This indicates acobalt rich oxide phase in the outer region, probably a spinel phase Co3O4
or (Co, Mn)3O4. The region where chromium is dominating is assumed toconsist of Cr2O3. Increased concentrations of cobalt are observed in the innerpart of the oxide scale, indicating that a cobalt oxide phase is formed prior tothe oxidation in 18,18O2, as was suggested from oxygen isotope depth profiles.At the lower temperatures, the distributions of Co and Cr are well separatedindicating a defined changeover from cobalt spinel to chromia. At 1000
69

Figure 5.25: Distribution of oxygen isotopes, Cr and Co in oxide scale formedat temperatures from 1000 � to 850 �C for 80 min to 97 hours.
�C, the transition region between the spinel phase and Cr2O3 is broadened,indicating more rapid interdiffusion of cations at this temperature.
Figure 5.25 show distributions of both oxygen isotopes and cations in theformed oxide scales. At 1000 �C, the reduced separation of 18O and 16O in theouter region of the oxide scale, in the cobalt rich region, could indicate inwarddiffusion of oxygen occurring in the spinel phase. The formation of oxide canthus occur within the oxide scale, and not only at the gas-oxide interface.The distribution profiles at lower temperatures have sharp transition regionsand are well separated, indicating oxide scale growth governed by outwarddiffusion of cations. At 850 �C, the outer scale appear to consist of Cr2O3
and not the cobalt rich spinel phase. This could be due to rapid formationof a Co3O4 phase prior to introducing 18,18O2, but no conclusions can be
70

Figure 5.26: Distribution of Fe in oxide scale formed at temperatures from1000 � to 850 �C for 80 min to 97 hours.
drawn without further investigations.
The distributions of Fe and Mn in the formed oxide scales are harderto detect due to lower secondary ion intensities. Iron distributions attemperatures from 850 �C to 1000 �C can be seen in figure 5.26. Attemperatures from 900 �C to 950 �C, significant amounts of Fe are present inthe outer part of the oxide scales. This is probable to occur in the cobalt richspinel phase, indicating a iron containing (Co,Fe)3O4 spinel. No dissolvediron appear to be present in the chromia phase. The distribution of Mn inthe oxide scale formed at 950 �C can be seen in figure 5.27. Due to thevery low intensity, the uncertainty is too high and the distribution of Mn inthe formed oxide scales is thus hard to determine. Sputtering by negativeoxygen ions could increase the signal count from Mn, but this will remove the
71

0 1 0 0 0 2 0 0 0 3 0 0 00 . 0
2 . 0 x 1 0 - 4
4 . 0 x 1 0 - 4
6 . 0 x 1 0 - 4
8 . 0 x 1 0 - 4
No
rmaliz
ed M
n con
centr
ation
D e p t h , n m
Figure 5.27: Distribution of Mn in oxide scale formed at 950 �C for 150 min.
possibility of simultaneously investigating the distribution of oxygen ions.
72

0 1 0 0 0 0 0 2 0 0 0 0 00 . 0
1 . 0 x 1 0 - 9
2 . 0 x 1 0 - 9
3 . 0 x 1 0 - 9
1 6 / 1 8 O 2
1 6 / 1 8 O 21 8 / 1 8 O 2
Ion cu
rrent,
A
T i m e , s
1 6 / 1 6 O 2 1 6 / 1 8 O 2 1 8 / 1 8 O 2
1 6 / 1 6 O 2
1 6 / 1 6 O 2
1 6 / 1 8 O 2
1 8 / 1 8 O 2
Figure 5.28: Ion current measured by mass spectrometry for 16,16O2, 16,18O2,and 18,18O2 as a function of time at 850 �C.
5.3.2 Gas exchange in oxide scales during oxidation
Gas exchange between the grown oxide scales and the surroundingatmosphere could occur during oxidation and influence the ion distributionsdetected by SIMS. A mass spectrometer was thus connected during theoxidation experiments to record the atmosphere development as a functionof time. Figure 5.28 show the detected ion currents at 850 �C as a functionof time. At both temperatures, small amounts of 16,18O2 is detected duringthe first stage of the oxidation. This indicates the presence of an 16O oxidescale prior to introducing 18,18O2, and that 16O to some extent is exchangedby 18O in the grown oxide. Due to the small amounts, gas exchange is notassumed to significantly affect the ion distributions.
73

5.4 HT-ESEM
HT-ESEM was used to observe the oxide growth on uncoated and cobaltcoated samples in-situ. All samples were oxidized in 0.006 atm pure H2O inlow vacuum at temperatures from 500 �C to 950 �C. The observed growthwas highly affected by surface defects and the microstructure of the alloy.The oxide scale development of an uncoated sample oxidized from 500 �Cto 900 �C can be seen in figure 5.29. The first visible oxide growth wasobserved at 650 �C, initially developing at surface defects, such as cracksand in the rolling direction of the steel foil. Due to the nature of HT-ESEMexperiments, it is difficult to determine the exact starting point for oxidation.
The morphology is observed as non-unform blade shaped grains. Duringthe first 90 minutes of oxidation, the grains undergo horizontal expansionand the edges of the grains are sharpened. Locations with negligible surfacedefects were dominated by the formation of thin protrusions often referredto as "whiskers". Whiskers formed during oxidation of an uncoated samplecan be seen in figure 5.31. The whiskers had relatively uniform length ofabout 0.5µm, with the exception of a small number of longer and thickerwhiskers of approximately 3µm.
The oxide growth on a cobalt coated sample under similar conditions canbe seen in figure 5.30. The first visible oxide growth was observed alreadyat 550 �C, and the overall growth appeared highly uniform.Unlike uncoatedsamples, the oxide growth on cobalt coated samples was not affected bysurface defects. The oxide scale morphology was generally blade formedgrains with sharp edges, seemingly growing in all observable directions.Thinwhiskers were also observed for cobalt coated samples after 80 minutes ofoxidation. After 100 minutes of oxidation, the observed whiskers expandedhorizontally and developed into blade like formations, identical to the restof the scale.
Oxide scales formed on cobalt coated samples exhibited less chargeaccumulation from the incident electron beam, indicating oxides with higherelectrical conductivity than the oxides formed on uncoated samples. Surfaceanalysis of samples oxidized during HT-ESEM indicated high concentrationsof iron (50 at.%). This could be a result of signals collected from theunderlying steel, or possibly due to formation of iron oxides caused by a watervapour atmosphere. Cross sections analysed by EDS line scans indicatedCr2O3 and an iron rich spinel phase. Both oxides were low in manganese.
74

Figure 5.29: Uncoated sample oxidized using HT-ESEM in 600 Pa H2O inthe temperature range of 500 �C to 900 �C.
75

Figure 5.30: 600 nm Co coated sample oxidized using HT-ESEM in 600 PaH2O in the temperature range of 500 �C to 900 �C.
76

Figure 5.31: Whiskers and blade structures observed during oxidation ofuncoated samples during HT-ESEM.
Figure 5.32: Blade structures observed during oxidation of 600 nm Co coatedsamples during HT-ESEM.
77

5.4.1 Comparison TG
To evaluate HT-ESEM as an experimental method in high temperature ox-idation, samples oxidized during HT-ESEM should be compared to samplesoxidized by more conventional methods, for instance thermogravimetry.
Samples oxidized in HT-ESEM are exposed to low vacuum, and thegaseous environment used for all samples in this study was 0.006 atm pureH2O. These conditions are difficult to replicate by the thermogravimetricequipment used in this work. The surface of cobalt coated samples oxidizedusing the TG setup, for 5 to 120 minutes in wet air at 900 �C, can be seen infigure 5.33. Wet conditions in the TG setup correspond to a pH2O of 0.025atm, as explained in chapter 4. This pH2O is approximately 4 times higherthan what samples oxidized using HT-ESEM are exposed to. In addition,the TG experiments were conducted at atmospheric pressure. The samplesoxidized using HT-ESEM are mounted flat, while those oxidized by TG arehanging freely and exposed to a gas flow. This could possibly affect theoxide scale morphology. The effect of temperature must also be taken intoconsideration, as samples oxidized using HT-ESEM is gradually heated fromroom temperature, and samples oxidized by TG is lowered directly from roomtemperature into the high temperature furnace. As two different furnacesare used in the HT-ESEM and TG setups, a deviation in temperature couldalso be present.
As mentioned, the samples oxidized by TG were exposed to wet air. Therewill thus also be a difference in pO2 for samples oxidized during HT-ESEMcompared to those oxidized in wet air. The weight related parabolic growthrate constants for cobalt coated and uncoated samples, see figure 5.19, werefound to be independent of pO2 . The carrier gas used to transport watervapour was therefore assumed not to significantly affect the oxidation kineticsfor the samples oxidized by TG. However, the carrier gas, air, could still affectthe morphology of the formed oxide scales.
The samples oxidized by TG for 5 minutes and 30 minutes show continuousand uniform oxide scales of flat, smooth-edged grains. The scales are inaddition porous with intragranular voids. The samples oxidized using HT-ESEM did not form similar grains or appear porous for the same oxidationtimes. The samples oxidized by TG for 60 minutes and 120 minutes formedcontinuous scales of flat, blade-like formations, similar to the morphologiesobserved for samples oxidized using HT-ESEM. A comparison of cobaltcoated samples oxidized during HT-ESEM and TG for 2 hours at 900 �Ccan be seen in figure 5.34.
78

Figure 5.33: 600 nm Co coated samples oxidized by TG at 900 �C for 5 min,30 min, 60 min and 120 min.
79

Figure 5.34: Comparison of oxide scales on cobalt coated samples oxidizedfor 2 hours at 900 �C using HT-ESEM and TG. Left: HT-ESEM, Right: TG
80

Chapter 6
Discussion
The discussion part of this work will be divided into the following sections:
• Microstructure, morphology and interface properties
• Oxidation behaviour of Sanergy HT
• Evaluation of HT-ESEM as experimental method
6.1 Microstructure, morphology and interface prop-erties
The microstructure and morphology of oxides scales are very sensitive toexternal influences such as temperature, surrounding atmosphere, time andsurface preparation. During oxidation of multicomponent alloys, multiplegrowth processes occur simultaneously, resulting in an infinite number ofmorphological variations. Due to this high complexity, a complete analysisand understanding of the nucleation and growth of surface features isregarded as nearly impossible. However, the morphology may provideimportant information about the mechanisms governing the oxide scalegrowth. This section will thus attempt to elucidate the general trends andsome of the important features occurring during high temperature oxidationof a multicomponent alloy. The following will be discussed:
• the effect of temperature and gas composition on scale microstructure
• formation of oxide ridges, whiskers and blades
• morphology of the oxide-alloy interface
The emphasis will be on the formation and development of these features,and how this can be related to dominating transport processes in the oxide.
81

6.1.1 Effect of temperature and gas composition
The microstructure and morphology of the oxide scales grown on Sanergy HThave shown to be dependent on both temperature and reaction atmosphere.The initial formation of oxide particles appears to grow epitaxially the metalsurface, and the resulting oxide scales are relatively dense and adherent.
Cobalt coated samples oxidized under reducing conditions show uniformgrowth of equiaxed, crystalline particles. The homogeneous, single phasescale is due to the preferential oxidation of Co at the surface. The submicron,equiaxed grains sinter with increasing temperature, leading to larger flatgrains with protruding oxide ridges and pores at the grain boundaries.Large islands of spherical precipitations, identified as Cr2O3, appear fortemperatures above 925 �C. Is is not known whether these large chromiaprecipitations occur only as a result of an increased diffusion coefficient ofchromium as a function of temperature, or due to reduced availability of Co.Most likely, the cause is a combination of the two. The Cr2O3 precipitationsappear to initially form as individual protruding features, growing bothwithin grains and at grain boundaries of the cobalt oxide surface. Thisindicates outward diffusion of Cr both through the oxide lattice and thegrain boundaries.
Uncoated samples show larger variations in morphology as a result ofthe direct interaction between oxygen and the number of different elementspresent in the alloy. For short oxidation times, around 45 hours, the oxidescales seem apparently one-phase, consisting of crystalline particles withincreasing size distribution as a function of temperature. After 150 hours,large differences are visible at the various temperatures. This indicates thatthe initially formed oxides are those of the main compositional elements,namely iron and chromium. Oxygen active elements present in smalleramounts, for instance Mn, are limited by diffusion from the alloy interiorand will reach the surface at a later stage. Early formation of these oxidesnear the oxide-alloy interface by inward diffusion of oxygen is not excluded,but is difficult to determine by surface analysis only. After longer oxidationtimes, the surface after oxidation under reducing conditions at 850 �C iscovered by whiskers. The formation of whiskers will be discussed further insection 6.1.2. At 900 �C, large crystalline grains rich in Mn are observed,indicating rapid diffusion of Mn in Cr2O3, compared to that of Cr, at thistemperature. With increasing temperature the size distribution of grainsreduces, and the growth of large Mn rich grains is no longer favoured. Theratio between the diffusion coefficient of Mn and the diffusion coefficient ofCr in Cr2O3 appear to reach a maximum at around 900 �C. This can indicatethat Mn is also transported through grain boundaries of Cr2O3, as is alsosuggested by other studies.36,45
82

Figure 6.1: Suggested growth mechanism of oxide ridges through grainboundary transport, modified from Polman et al.49
Oxide scales formed under oxidizing conditions are significantly morebuckled and deformed than under reducing conditions. There are severalsources for stresses and strains in oxides. Stresses will occur in a growingoxide scale as a result of crystallographic mismatch between the alloy surfaceand the oxide scale. Large growth stresses will also be introduced whencounter-current diffusion of cations and anions dominates the scale growth,as the oxide will form not only at the gas-oxide interface, but also at theoxide-alloy interface and within the oxide scale. Under reducing conditions,uniform growth with a more flat, stress free oxide scale indicates that theoxide growth occur mainly from the gas-oxide interface by outward cationdiffusion.
6.1.2 Oxide ridges, whiskers and blades
Oxide ridges are observed on the surface of cobalt coated samples oxidizedat temperatures above 925 �C for 150 hours under reducing conditions, seefigure 5.2. Although the specific morphology is not expected to extend farbelow the gas-oxide interface, morphological indications of certain growthprocesses can be used to support observations from other measurements.The oxide ridges appear to be located on top of grain boundaries, which isalso reported by Hsu et al.46 This localized scale thickening is suggested toresult from transport of chromium, oxygen, or both along grain boundaries inCr2O3.37,47 Raynaud and Rapp48 also report that shallow, dish-shaped oxidegrains with slight ridges at their grain boundaries are probable to result fromgrowth by grain-boundary diffusion. It is assumed that the grain boundariesextend through the ridge, enabling oxide formation and growth of the ridgeas ions migrate through the center, see figure 6.1. The grain-boundaryridges appear to become more protruding with decreasing temperature. Thiscould indicate that diffusion along grain boundaries is significant at lowertemperatures, but less important at higher temperatures when the latticediffusion of chromium is faster. A difference in image contrast is observed by
83

the ETD detector used in SEM, indicating a change in phase compositionbetween the bulk and the grain-boundary ridges. Due to the limitedresolution of EDS analysis in SEM, determining the phase composition atthe grain-boundary ridges is difficult. Preferential transport of oxygen alonggrain boundaries is also suggested to cause detachment of oxide scales fromthe alloy surface and scale cracking at high temperatures.37,47,50
Thin protrusions, often referred to as whiskers, are observed for uncoatedsamples oxidized under reducing conditions at 850 �C. The whiskers wereidentified to consist of Cr2O3. Whisker formation is also observed by HT-ESEM for all samples in the initial stages of oxidation. The thin geometryof the whiskers indicates that the growth occurs either at the tip or from thebase of the whisker. If the whiskers grow from the tip, chromium must betransported outwards from the alloy. This transport of chromium can occureither within the whisker, by surface diffusion or both. At the temperaturesmeasured in this work, the formation and growth of chromia whiskers duringthe first hour of oxidation appear too fast to be a result of lattice diffusion.Generally, whiskers are found to grow around screw dislocations51,52 and thushave a hollow core. It is assumed that the chromia whiskers formed in thisstudy also resemble this hollow structure. Takagi52 found that whiskers andblade-like platelets grow from the tip by surface diffusion from the base. Thisgrowth mechanism is supported by the development and growth of whiskersobserved by HT-ESEM in this work. If surface diffusion from the base occurs,lateral growth of the whiskers would be expected. This is confirmed by in-situHT-ESEM, where whiskers after some time expand to blade-like platelets.
Whiskers are mostly observed at the lower temperatures, around 850 �C.This could be due to the smaller activation energy for surface diffusion thanlattice diffusion at these temperatures. Lattice diffusion will become morefavourable as the temperature is increased, and eventually eliminate whiskerformation. Another possibility is that the chromia whiskers evaporate easilyfrom the surface at high temperatures due to their large surface areas. Theappearance of whiskers at the surface of uncoated samples after 150 hours ofoxidation at 850 �C under reducing conditions could indicate that the scaleformation happens predominately within the oxide scale, or at the oxide-alloyinterface, due to inward diffusing oxygen and not at the gas-oxide interfaceas a result of cation diffusion. It is also possible that evaporation of whiskersdo not occur under these conditions due to a combination of low temperatureand low pO2 .
6.1.3 Morphology of the oxide-alloy interface
Uncoated samples oxidized at elevated temperatures under oxidizingconditions show deformed oxide-alloy interfaces, see figure 6.2, while under
84

Figure 6.2: Schematic illustration of deformed oxide-alloy interface, as seenfor uncoated samples oxidized under oxidizing conditions at 1000 �C.
reducing conditions the oxide-alloy interface is flat. In their theoreticalapproach, Asaro and Tiller53 treated the interface between a material understress and its surroundings as a phase front. The phase front can eitherbe smooth and regular, which is observed for uniform oxide growth, orbuckled, which often lead to cracking. They also assume the phase frontto change position and shape through both surface and volume diffusion.Large introduced growth stresses and ballooning of oxide-alloy interfacescan indicate that the oxide growth is dominated by counter-diffusion ofboth anions and cations. This is also suggested by Kofstad.54 Oxide-alloyinterfaces of samples oxidized under reducing conditions are flat, indicatingscale growth predominately by outward cation diffusion.
Alloying elements can segregate to grain-boundaries and interfaces inthe metal-oxide system, affecting defect concentrations and mechanicalproperties in these regions. High concentrations of Mn at grain boundarieshave been reported for oxide scales grown on Fe-Cr alloys.55 The twointerface regions discussed in this section is the oxide-alloy interface andthe oxide-oxide interface between the spinel phase and Cr2O3 in the duplexoxide layer.
The oxides scales formed under reducing conditions at high temperaturesdid show indications of poor adherence and gaps at the alloy-oxide interface.Voids at the alloy-oxide interface are frequently encountered for oxide scalesgrowing predominately by outward diffusion metal ions. The outwarddiffusion of metal ions will lead to accumulations of metal vacancies nearthe alloy-oxide interface. The oxide scale will in addition grow from the gas-oxide interface, causing essentially no new oxide phase to form and fill voidswithin the scale. Oxide phases from alloying elements such as Si, Ti, Mn, Nband Mo to be present in the alloy-oxide and oxide-oxide interfaces of samplesoxidized in this work.The presence of such oxides at interfaces can influence
85

mechanical properties of the oxide scale, and also the transport of ionicspecies across these regions. Oxide scales formed under oxidizing conditionsrevealed no visible gap at the alloy-oxide interface. This could be due toinward diffusing oxygen, or other alloying elements, forming oxides near thealloy-oxide interface. It is thus probable that the interfacial gap observed atlow pO2 is caused by less precipitated oxide phases in the interface regionunder reducing conditions due to variations in solubility of these oxides inCr2O3.
6.2 Oxidation behaviour of Sanergy HT
The oxidation of Sanergy HT at temperatures between 850 �C and 1000 �Cunder oxidizing and reducing conditions show parabolic oxidation kineticsas a function of time. Parabolic rate kinetics indicate that the oxide growthis limited by diffusion of ions through the oxide scale. Diffusion-controlledrate kinetics are commonly observed for chromia forming alloys.7,56
A duplex oxide scale is formed during oxidation of uncoated samplesconsisting of a continuous inner layer of Cr2O3 near the oxide-alloy interfaceand a (Cr, Mn)3O4 spinel phase near the gas-oxide interface. Cobalt coatedsamples for similar duplex scales, but with a (Co, Mn)3O4 spinel phase. Theformation of a cobalt rich spinel phase in the outer part of the scale indicatesthat the oxidation of Co is favoured and more rapid than the oxidation ofoutward diffusing chromium. Increased concentration of Fe has been foundin (Co, Mn)3O4 compared to (Cr, Mn)3O4, indicating higher solubility ofiron in the cobalt spinel.
Pores are observed in the outer region of the alloy, and the pore densityincreases as the alloy-oxide interface is approached. These pores are expectedto be formed by accumulated metal vacancies by outward metal diffusionfrom the alloy. As the metal depletion is largest close to the alloy-oxideinterface, increased alloy porosity in this region would be expected. Poreformation in the outer part of Sanergy HT samples is also reported by othersources.45,57
6.2.1 Oxide scale growth mechanisms
From HT-ESEM it is observed that oxide particles initially nucleate at thealloy surface and rapidly increase in number and size until a continuousoxide film is completely covering the surface. Further growth then proceedsby outward diffusion of Fe, Mn and Cr ions and inward diffusion of oxygen.
86

The nucleation and growth on cobalt coated samples is observed to beuniform and seemingly unaffected by surface defects. Uncoated samplesexhibit less uniform growth, where the formation of oxide particles isfavoured at large surface defects. This difference could be explained by theinitially formed oxides on uncoated and cobalt coated samples. For uncoatedsamples, both Cr2O3 and (Cr, Mn)3O4 are assumed to be formed in theearly stages of oxidation, probably in addition to iron oxides such as Fe2O3
and Fe3O4. Surface defects are favourable nucleation centres due to highconcentrations of dislocations, which could explain the increased nucleationand growth in these locations. When uncoated samples are exposed tooxidizing atmospheres, oxygen molecules will adsorb and react with the alloydirectly. As the alloy consists of several elements with varying oxygen affinity,rapid surface reactions could lead to a number of different oxide phases. Forcobalt coated samples, the initial oxidation will occur between oxygen andmetallic cobalt. The oxide would thus essentially be one phase, and moreuniform growth is expected.
In uncoated samples, the formation of a (Cr, Mn)3O4 spinel phase isfavoured due to the oxygen affinity of Mn. The spinel phase is locatedon top of the Cr2O3 layer, presumably growing at the gas-oxide interface byoutward diffusing cations. The high concentration of Mn in the outer spinelindicates rapid diffusion of Mn in chromia , compared to that of Cr, in themeasured temperature range. High lattice diffusivity of Mn in chromia isalso reported by other studies.12,45,58,59 In addition, Mn can be transportedthrough rapid diffusion paths such as grain boundaries and interfaces, assuggested by other studies.45,60 Due to the large amounts of available Cr,it is assumed that the growth of (Cr, Mn)3O4 is limited by the diffusionrate of Mn from the alloy and in Cr2O3. The growth of the (Co,Mn)3O4
spinel layer formed on coated samples is more rapid at lower temperaturesthan the growth of (Cr, Mn)3O4, indicating that the growth rate is lessdependent on Mn diffusion rates. This is assumed to be caused by the accessto a finite source of cobalt at the surface. The concentration of chromium inthe cobalt spinel layer is small (3-9 at.%), indicating slow diffusion of Cr in(Co, Mn)3O4.
The Cr2O3 scale can either grow at the oxide-alloy interface by inwarddiffusion of oxygen or at the spinel-chromia interface by outward diffusion ofCr and inward transport of oxygen through the spinel layer. From SIMSdepth profiles obtained in this work, significant contributions of inwarddiffusing oxygen through the chromia layer are not observed. However, thereare indications of inward oxygen transport in the outer spinel oxide. TheCr2O3 scale is thus assumed to initially form at the scale-alloy interface whenthe spinel scale is very thin, and later grow at the spinel-chromia interface
87

predominately by outward diffusing Cr ions and inward transport of oxygenthrough the spinel layer.
In all oxidized samples, the Cr2O3 part of the oxide layer is observed to bethe thicker than the spinel phase. This is probably due to the high amount ofchromium available for oxidation in the alloy. The ratio between chromia andspinel in the oxide scale increases as a function of temperature, which couldindicate that the growth rate of Cr2O3 is more temperature dependent thanthat of the spinel phase. The increased growth rate of Cr2O3 as a functionof temperature could result from a higher activation energy for chromiumdiffusion than for Mn diffusion. Variations in defect concentrations as afunction of temperature can also occur, affecting the transport of reactingspecies in the scale.
6.2.2 Oxide growth rates
It is found that cobalt coated samples show larger weight gains as functionof time than uncoated samples at all measured temperatures, under bothoxidizing and reducing conditions. This is assumed to be a result of rapidoxidation of metallic cobalt, compared to that of Cr2O3 and (Cr, Mn)3O4
on uncoated samples. The volatilization of chromium on uncoated sampleswill also affect the weight gain under oxidizing conditions.
Accelerated growth kinetics are observed for cobalt coated samples after 90hours of oxidation at 1000 �C under reducing conditions. Uncoated samplesdo not exhibit non-parabolic kinetics under reducing conditions, but underoxidizing conditions breakaway oxidation is observed after 80 hours.
Breakaway oxidation can occur when the protective properties of theformed oxide scales are reduced. If the growing oxide has a larger volumethan the underlying alloy, compressive stresses will accumulate in the scale.Assuming the oxide scale grows by outward diffusing metal ions, the volumeof the alloy will reduce. As the oxide scale is adhered to the alloy surface,a reduction in the volume of the alloy will cause stresses both normal andparallel to the surface. For scales growing at the gas-oxide interface purelyby outward diffusion cations, or at the oxide-alloy interface purely by inwarddiffusion oxygen, the formation of new oxide will lead to small stresses.However, if the oxide scale grows by counter-diffusion of both cations andanions, large growth stresses will develop and affect the mechanical propertiesof the scale. To relieve the build-up of growth stresses in oxide scales, thescales may either deform, for instance by forming cracks, or detach from thealloy surface.
88

Cracks function as convenient diffusion paths for molecular oxygen inthe surrounding atmosphere, causing the growth rate to increase rapidly.The breakaway oxidation observed for uncoated samples under oxidizingconditions could thus be caused by significant cracking of the scale andsubsequently inward transport of oxygen along these cracks. Under reducingconditions, the amount of available oxygen is significantly less, which couldexplain why breakaway oxidation do not occur. It is also possible thatthe starting point for breakaway oxidation of uncoated samples underreducing conditions is prolonged to after 150 hours, which was the maximumhours measured. Morphological observations support the suggestion ofless available oxygen for transport along cracks under reducing conditions.Oxide scales formed under reducing conditions are less buckled than oxidescales formed under oxidizing conditions, see figure 5.6, which indicates thatreduced amounts of compressive growth stresses accumulate in the scalesduring oxide growth. Less introduced growth stresses could indicate thatoxide growth under reducing conditions occur predominately by outwarddiffusion of cations, while counter-current diffusion of both anions andcations contribute under oxidizing conditions. Contributions from inwarddiffusing oxygen were confirmed by SIMS depth profiles of cobalt coatedsamples at high temperatures, see figure 5.23.
A complicating factor for deformation mechanisms in oxide scales at hightemperatures is the presence of a chemical potential gradient. The gradientin chemical potential will lead to varying defect concentrations across theoxide scale. Due to these variations, the rates and degree of deformationwill also vary. Under reducing conditions, the gradient in pO2 from the gas-oxide interface to the oxide-alloy interface is small. As nonstoichiometry inoxides can vary significantly as a function of pO2 , one could thus assumethat the largest variations in defect concentrations across the oxide scale arepresent under oxidizing conditions. As deformation processes often involvediffusion of both anions and cations, regions with increased concentrations ofdefects contributing to anion transport, such as interstitial oxygen or oxygenvacancies, could be more prone to deformation than regions governed bycation defects only. Generally, oxygen defects are assumed to be minoritydefects in chromia.7
In addition, the oxide scale formed on Sanergy HT consists of more thanone oxide phase. If the growth of one oxide phase is favoured under certainconditions, this could dominate the overall oxidation kinetics. Also, theamount of compressive stresses may vary for the different phases. Thecrystallographic mismatch between the alloy surface and Cr2O3, and betweenCr2O3 and the spinel phase could thus be considered.
89

pO2 and temperature dependence of parabolic rate constants
Commercial high temperature alloys, such as Sanergy HT, contain numerousalloying components to achieve desirable mechanical properties. In additionto Fe and Cr, Sanergy HT consists of Mn, Si, Ti, Mo and Nb, all affectingthe oxidation of the alloy. Due to the highly complex oxidation behaviourof multicomponent alloys, a complete and detailed analysis of all reactionproducts and diffusion processes in the alloy and the formed oxide phases isdifficult. However, this section will attempt to elucidate general trends anddominating processes affecting the oxide scale growth in this particular alloy.
The pO2 and temperature dependence of oxide growth rates on Sanergy HTwere investigated. The parabolic rate constants measured for uncoated andcobalt coated samples were found to be essentially independent of pO2 . Themeasurements were conducted under isothermal conditions at 900 �C, andparabolic rate kinetics were observed for all samples, indicating that the oxidegrowth is limited by diffusion of reacting species through the scale. Reactionrate constants at ambient oxygen pressures are generally observed to obeylinear, Arrhenius-type behaviour. However, the temperature dependence ofmulticomponent alloys can contain large variations and irregularities dueto the high number of components, oxide phases and processes occurringsimultaneously.
Wagner’s oxidation theory relates the parabolic growth rate constant, kp,to the self diffusion coefficient of the reacting species participating in theoxide formation. If the defect concentrations enabling diffusion in the oxideare dependent of oxygen activity, it is thus expected that the parabolicgrowth rate constants will vary as a function of pO2 . Both oxides formedon uncoated Sanergy HT, Cr2O3 and (Cr, Mn)3O4, are expected to exhibitpO2 dependent defect concentrations. The majority of the oxide scale grownon Sanergy HT consists of Cr2O3. It will be assumed, as a simplification,that the growth of chromia has the largest impact on the measured parabolicgrowth rate constants. The oxide growth of chromia is observed to begoverned by predominately outward diffusion of chromium.
The amount of oxygen needed in the surrounding atmosphere to sustainoxide formation is small, and is thus not a limiting factor in the scale growth.What limits the oxide growth, is the transport of chromium ions throughthe scale. Any pO2 dependence found for parabolic growth rate constants isthus expected to reflect changes in the ability to transport chromium, thatis changes in defect concentrations enabling Cr diffusion. In addition, foroxides grown on metal surfaces, a gradient in oxygen activity will be presentacross the scale, from a maximum at the gas-oxide interface to a minimumnear the oxide-alloy interface. This is due to the migration of metal ions and
90

oxygen ions in opposite directions through the scale. It is thus expected thatpO2 dependent defect concentrations vary throughout the oxide layer.
As previously mentioned, the oxide scale on Sanergy HT consists mainlyof a Cr2O3 layer near the oxide-alloy interface and a spinel layer near thegas-oxide interface. Assuming that the growth of chromia dominates themeasured parabolic rate constants, the lack of pO2 dependence could resultdirectly from the defect situation in Cr2O3. Cation point defects, v3Cr andCr i are assumed to be the majority defects in chromia, while v O and O2
i
are present as minority defects. The total electroneutrality of Cr2O3 canbe seen in equation 2.10 on page 11. In a constructed Brouwer diagramfor pure Cr2O3, see figure 2.4, a region independent of pO2 is expectedwhen chromium interstitials (Cr i ) and chromium vacancies (v3Cr) are thedominating species. This would require chromium ions to diffuse outwardsthrough an interstitial mechanism or through lattice vacancies. Diffusionthrough interstitial positions is most energetically favourable for chemicalspecies of small ionic radii, as larger ions could require expansion of thelattice. However, structural gaps such as grain boundaries, interfaces andstress induced cracks can provide rapid diffusion paths for ions in oxides.
The effect of Fe, Mn, Si, Ti, Mo and Nb
Defect concentrations in Cr2O3 scales grown on Fe-Cr alloys can be affectedby foreign elements entering as dopants, significantly altering the defectstructure of the oxide. Elements such as Fe, Mn, Si, Ti, Mo, and Nb are allpresent in Sanergy HT.
Increased concentrations of Ti, Si, Mo and Nb have been observed inthe spinel-chromia and chromia-alloy interfaces, while Mn is also a reactingspecies in formation of the (Cr, Mn)3O4 spinel phase. The presence of thesealloying elements in oxide-oxide and oxide-alloy interfaces of Sanergy HT hasbeen reported by Canovic et al.45 Iron oxides are also likely to be formedprior to the formation of a continuous Cr2O3 film on the alloy surface. Toelucidate the effect foreign cations have on defect concentrations in chromia,and subsequently the pO2 dependence of parabolic growth rate constants,constant dopant concentrations are assumed as a first approximation.
The Cr2O3 layer has been observed to grow predominately by outwarddiffusing chromium. If cation point defects are assumed to dominatethe defect structure of chromia, the nonstoichiometry of Cr2O3 could bedescribed as either Cr2�yO3 or Cr2�yO3. At high pO2 , chromia is nowassumed to be metal deficient and the dominating defects are chromiumvacancies (v3Cr) and electron holes (h ). At low pO2 , Cr2O3 is assumed to
91

exhibit metal excess with dominating defects being interstitial chromium(Cr i ) and electrons (e1).
If Mn is introduced as a lower valent dopant in chromia near the spinel-chromia interface, this would reduce the concentration of chromium vacanciesand increase the concentration of electron holes. Near the oxide-alloyinterface, Mn1Cr would increase the concentration of interstitial chromiumand reduce the concentration of electrons. As the concentration of Mnwould be highest in the outer part of the oxide scale, the effect of Mn asa dopant would be most significant in this region. Negative Mn1Cr defectswould be compensated by positive electron holes, and the concentration ofv3Cr is reduced. Reduced concentration of chromium vacancies could reduceoutward chromium transport in the outer part of the scale, which could leadto reduced growth rates.
Si, Ti, Nb and Mo will enter as higher valent dopants in Cr2O3. PositiveTi Cr, Si Cr, Mo Cr and Nb Cr defects will be compensated by negativedefects, while the concentration of positive defects present will be reduced.In the outer part of the scale, Si, Ti and Nb substituted on chromiumlattice sites will reduce the concentration of electron holes and increasethe concentration of v3Cr. In the inner part of the scale, the concentrationof chromium interstitials will decrease and the concentration of electronsincrease. Increased concentrations of chromium vacancies could increaseoxide growth rates, and the effect would be most significant in the outerpart of the oxide scale due to the higher pO2 . Ti, Si and Nb would, ashigher valent dopants, counteract the effect of lower valent Mn. Common forthese dopant reactions, is that charge compensation by chromium vacanciesand chromium interstitials would give no contribution to pO2 dependency.Equation 6.1 show Si as an example of a higher valent dopant in Cr2O3.
3SiO2psq � 3Si Cr � v3Cr � 6OxO (6.1)
It is expected that the alloying elements are present in the system asprecipitated oxides. Precipitations are observed at the oxide-alloy interfaceboth in oxidizing and reducing conditions at temperatures between 900 �Cand 1000 �C. Precipitated second phases indicate that the total amount ofsolute has exceeded the solubility limit. When a second phase of solutehas precipitated, the concentration of solute is not constant, but will varyby exchange between the bulk and the second phase. The solubility ofdopants can be dependent of both pO2 and temperature. It is thus possiblethat the solubility will vary across the oxide scale due to the gradient inpO2 . The solubility will in this case vary with pO2 until the oxide phase iscompletely dissolved. The behaviour will then resemble that of a constantdopant concentration.
92

The lack of pO2 dependence of parabolic rate constants found for SanergyHT is assumed to be caused by rapid outward chromium diffusion enabledby aliovalent defects present in the oxide. The effect of cation impurities inchromia is also suggested by Kofstad.7 Still, the parabolic rate constantsdetermined for the Fe-Cr alloy in this work are approximately two ordersof magnitude smaller than the rate constants reported for oxidation of pureCr.29
The parabolic rate constants determined for cobalt coated samples showedapproximately linear temperature dependence, and the activation energy wascalculated to 323 kJ/mol. The activation energy corresponds well with thatreported for the same alloy,61 but is higher than values typically reported forsimilar chromia forming alloys (� 250 kJ/mol).62,63The activation energy forchromium tracer diffusion in chromia has been reported in the range of 245-280 kJ/mol.7,36 Due to the large uncertainties in measuring parabolic growthrate constants, the activation energy determined in this work is assumed tocorrespond to that of Cr diffusion in chromia. The slightly higher activationenergy could be related to the growth of (Co, Mn)3O4.
The non-linear Arrhenius behaviour observed for uncoated samplesoxidized under reducing conditions in the same temperature range couldindicate two temperature regions where different processes are dominatingthe oxide growth. The first region is from 1000 �C to 925 �C, and thesecond from approximately 900 �C to 800 �C. To extract activation energiesfrom each temperature region is possible, but could be misleading as thechangeover between dominating processes occurs gradually. As the non-linear temperature dependence is more significant for uncoated samples,one could suspect an effect from the evaporation of chromium containingspecies. However, chromium volatilization is strongly dependent of pO2 andno chromium evaporation is expected under reducing conditions.20
The rate constants in the Arrhenius plot in figure 5.16 were all calculatedfrom 45 hours of oxidation. At this time, the oxide scale thicknesses will varysignificantly for samples oxidized at different temperatures and the measuredrate constants can thus represent different stages in the oxidation sequence.To explore the effect of scale thickness on the general behaviour, the rateconstants were corrected to the same expected scale thickness for everysample, see figure 5.18. It can be seen that the kp,w values at temperaturesfrom 1000 �C to 950 �C show a more linear trend when corrected to thesame oxide scale thickness. The effect of correcting to equal oxide scalethickness is smaller for samples at the lower temperatures, between 925 �Cand 850 �C. As the oxide scales grow more rapidly at higher temperatures, itis expected that the effect of correcting to similar scale thickness increases.
93

It can be concluded that correcting the calculated rate constants to the samescale thickness do not yield a linear temperature dependence across the fulltemperature range. This finding supports the presence of two temperatureregions of different growth processes.
The two regions can be a result of one region where the growth of Cr2O3
is favoured, and one where the growth of (Cr, Mn)3O4 is governing the ratekinetics. In the high temperature region, it is probable that the oxide scalegrowth has several contributions and that the temperature dependence thusreflect a combination or coupling of mechanisms. Evidence of oxide scalegrowth by counter-diffusion of both cation and anions, such as deformationof the oxide-alloy interface, have been found at 1000 �C, but appear to bemost significant under highly oxidizing conditions. The formation of oxideridges on top of grain-boundaries is also observed, indicating contributionsfrom ion transport in grain boundaries. It is observed that the ratio betweenCr2O3 and (Cr, Mn)3O4 is significantly larger with increasing temperature,indicating that chromia is the fastest growing oxide at higher temperatures.It is thus likely that the rate constants observed in the high temperatureregion is governed by the growth of Cr2O3, which seem probable consideringthat the determined activation energy is in the range of that reported forCr diffusion in chromia. In the low temperature region, the rate constantscan be more influenced by the growth of (Cr, Mn)3O4 and not dominated bychromia growth. If the spinel layers of uncoated and cobalt coated samples atlower temperatures are compared, the (Co, Mn)3O4 layers of cobalt coatedsamples are significantly thicker. The Cr2O3 parts of the oxide scales arehowever comparable. Assuming that the rate constants measured in thelow temperature region are dominated by the growth rate of (Cr, Mn)3O4,the difference in temperature dependence of the high and low temperatureregions could result from different temperature dependencies of chromiumand manganese diffusion rates.
The temperature dependence is most likely also affected by the presenceof large concentrations of aliovalent dopants, as discussed previously. So far,only individual point defects have been discussed. However, for large defectconcentrations defects may interact to form associated defects. In chromiascales growing on multicomponent alloys, the concentration of dopantsis most likely high enough for associated defects to become energeticallyfavourable. Higher valent dopants such as Ti Cr, Si Cr, Nb Cr and Mo Cr
may associate with negative defects, for instance chromium vacancies, v3Cr.Lower valent Mn may associate with positively charged native defects such aschromium interstitials. Equations 6.22 show an example of formed associateddefect clusters between Si and chromium vacancies.
2v3Cr � Si Cr � p2vCrSiCrq51 (6.2)
94

The high concentration of positively charged dopants could lead to significantamounts of associated defects between these dopants and chromiumvacancies. This would severely reduce the mobility of the chromiumvacancies trapped in these defect complexes and possibly effect oxide growthrates, especially at lower temperatures.
The formation of complex defects may increase the activation energyfor transport along grain boundaries. If negative chromium vacancies areassociated with effectively positive reactive elements substituting a Cr site,this can reduce the outward chromium transport. In the same way maypositive oxygen vacancies associate with a lower valent dopant and reducethe inward diffusion of oxygen.
6.2.3 Protonic defects in oxides at high temperatures
The non-linear temperature dependence of uncoated samples is most signif-icant under reducing conditions. Hydrogen may dissolve as protonic defectsin chromia, significantly affecting the defect structure and subsequently oxidegrowth rates. This is also suggested by Norby.64
Protons, OH O, are positively charged and is compensated by negative
defects in the oxide. In Cr2O3, these negative defects could be chromiumvacancies, v3Cr. Higher concentrations of chromium vacancies can increasethe migration rate of outward diffusing chromium, favouring oxide growthby outward diffusing cations at or near the gas-oxide interface. This cancontribute to more uniform and stress free scale growth, as is observed underreducing conditions in this work. Holt and Kofstad33 reported the solubilityof hydrogen in chromia to increase with decreasing temperature at constantpH2 . The effect of hydrogen doping in chromia is thus assumed to be largestat lower temperatures.
As the charge of protons is smaller than the charge of oxygen ions,the ionic radius will also be smaller. The reduction in size from O2� tohydroxide ions could increase the mobility of oxygen in the oxide scale.However, this effect is assumed to be small and will not affect measuredoxide growth rates significantly, as scales under reducing conditions appearto grow predominately by outward Cr diffusion.
6.2.4 Sanergy HT as interconnect material in fuel cellsystems
To evaluate the Fe-Cr alloy Sanergy HT as a potential interconnect material,a high number of material properties must be investigated. Section 3.3.1provides the list of standard requirements a fuel cell interconnect must fulfill.
95

However, this study is limited to the oxidation behaviour of the alloy andthe evaluation can thus be made from oxidation kinetics and scale propertiesonly.
Ferritic alloys as metallic interconnects are favoured due to slow oxidationkinetics, high electrical conductivity and low price. Due to the strictrequirements in mechanical properties, only minor changes in elementalcomposition can be made to improve the oxidation behaviour of the alloyfurther. Consequently,surface coatings appear as the most convenientmethod to achieve desired oxidation kinetics and scale properties. Theevaporation of chromium containing species from uncoated Sanergy HT makecoatings a necessity if this alloy is to be used in fuel cell systems. Partsof the experimental work in this study were conducted on cobalt coatedsamples, and a brief evaluation of the effect will be given in section 6.2.5.The precipitation of Si and Ti oxide phases, and oxides of other alloyingelements, in the alloy-oxide and spinel-chromia interfaces may significantlyaffect the electrical conductivity through the scale. Further work shouldtherefore be conducted to investigate the electrical properties of oxide scalesgrown on Sanergy HT.
6.2.5 Chromium evaporation and the effect of cobalt coating
If iron-chromium alloys are to be used as interconnects in fuel cell systems,the evaporation of chromium containing species, such as CrO2(OH)2,65,66
must be prevented. Evaporated chromium will poison the electrodes,especially on the cathode side, leading to cell degradation. The additionof Mn in the alloy results in an outer oxide layer of (Cr, Mn)3O4. Althoughthis spinel oxide reduces the volatilization of chromium by about 50 %,23,67
further improvements are needed to reduce the evaporation of Cr sufficiently.
One cost effective method investigated is precoating the alloy surfacewith metallic cobalt. Submicrometer cobalt coatings are reported to reducechromium evaporation by one order of magnitude68 due to the formationof an outer oxide layer of (Co,Mn)3O4. The samples used in this work hada surface coating of 600 nm Co, applied by a physical vapour depositionprocess developed by the alloy manufacturers Sandvik Materials Technology.To ensure high efficiency of the fuel cell, the electrical resistance throughthe stack must also be kept at a minimum. The corrosion protective oxidescale growing on Fe-Cr alloys will cause the electrical resistance throughthe interconnect to increase. It is thus desired to form oxide scales of highelectrical conductivity. The evaporation of chromium is not investigated inthis work, but as the chromium content in the outer part of the oxide scaleof coated samples is significantly reduced, the cobalt coating appear to besuccessful. At the lower temperatures, the (Co, Mn)3O4 phase appears to
96

cover the surface completely. However, as the temperature is increased above925 �C, large clusters of chromium rich particles are observed under reducingconditions. Chromium evaporation from these precipitations is assumed tobe significant, indicating that the cobalt coating only reduce Cr migrationsufficiently below this temperature.
By HT-ESEM it is also observed that the oxide scales formed on cobaltcoated samples have higher electrical conductivities than the scales onuncoated samples. This is due to increased electrical conductivity of(Co, Mn)3O4 spinels phase compared to (Cr, Mn)3O4 spinels. Electricalconductivities of selected Co-Mn spinels at 800 �C are given in table 3.1 onpage 26.
6.3 Evaluation of in-situ HT-ESEM as an experi-mental method in high temperature oxidation
The formation and development of surface features on alloys during hightemperature oxidation can give insight to the competing processes presentduring oxide scale growth. Ex-situ investigation methods are by far themost common, but to get a more profound understanding of processes inmulticomponent alloys oxidized in complex environments, methodologicalerrors and weaknesses must be eliminated. Samples observed with ex-situmethods undergo cooling, which may severely alter the microstructure ofthe oxide scale and also the oxidation products. In-situ methods havethe potential of eliminating known sources of error by enabling continuousobservation as features occur and develop. High Temperature EnvironmentalScanning Electron Microscopy is a potentially flexible experimental method,enabling the use of various gas mixtures in a wide temperature range.Samples can be observed during heating, at isothermal temperature andduring cooling, which provides information about every step of the oxidationprocess. To learn the full potential of HT-ESEM and increase its credibilityas an experimental method in high temperature oxidation, more work has tobe done. The comparability of results from HT-ESEM and ex-situ methodsmust be determined. There are also experimental challenges to overcomeif HT-ESEM is to rise in the scientific community as an equally acceptedmethod to traditional ex-situ investigation methods.
Similar to ex-situ methods, samples investigated by HT-ESEM is oxidizedin a controlled atmosphere, where temperature, gas composition and pressurecan be adjusted and monitored throughout the experiment. However, theexperiment takes place inside an electron microscope variations are limited.For instance is atmospheric pressure not possible, as the electron column in
97

Figure 6.3: Image of HT-ESEM setup showing the development of thermalelectrons as a function of temperature from 500 �C to 1000 �C.
the microscope must be protected. The samples are thus exposed to lowvacuum conditions, which may affect the oxidation behaviour.
Although various gas compositions can be used, the experimental difficultylimits the options which successfully can be used. The electronic conductivityof the growing oxide scale is observed to be a limiting factor for imagequality. Higher acceleration voltages can provide improved focus at highermagnifications, but sufficient conductivity is required to prevent chargeaccumulation on the sample surface. Charge accumulation is detrimentalto the image quality. At high temperatures, signals from thermally excitedelectrons must be reduced. The most crucial factor in obtaining high imagequality is good electrical connection between sample and sample holder.Both the sample bias and the heat shield bias used in this work are necessaryto guard the detectors from excess electrons at higher temperatures, seefigure 6.3. However, the effect is varying and inconsistent.
98

Chapter 7
Conclusions
The objective of this work was to investigate the high temperature oxidationbehaviour of the multicomponent Fe-Cr alloy Sanergy HT under reducingand oxidizing conditions. More insight in elucidating the dominating growthmechanisms of Cr2O3 and (Cr, Mn)3O4 has been achieved, although thecomplexity of high temperature oxidation of multicomponent alloys impedesa detailed analysis of the system.
The oxidation of Sanergy HT generally follows parabolic growth kinetics,indicating diffusion controlled oxide scale growth. The formed scale is aduplex oxide layer of Cr2O3 near the alloy-oxide interface with a (Cr, Mn)3O4
spinel phase on top. Based on SIMS depth profiles, the oxide scale is assumedto grow predominately from the gas-spinel and spinel-chromia interfaces byoutward diffusion of Cr and Mn. The ratio between Cr2O3 and (Cr, Mn)3O4
increases as a function of temperature, indicating significantly more rapidgrowth of chromia at higher temperatures compared to that of (Cr, Mn)3O4.
The measured parabolic growth rate constants are independent of pO2 andshow non-linear dependence of temperature. This supports that the defectstructure and transport properties of chromia are significantly influenced byaliovalent dopants. Elements present in small amounts in the alloy, such asMn, Ti, Si, Nb and Mo, significantly alter the oxidation behaviour comparedto that of pure metals and binary alloys.
It can be concluded that an applied coating of cobalt significantly reducesthe concentration of chromium in the outer part of the oxide scale. This isan important step in reducing chromium evaporation from the alloy, whichmust be avoided during fuel cell operation.
As a method, in-situ HT-ESEM has great potential in investigating oxidegrowth processes at high temperatures. However, the experimental difficul-
99

ties and instability of the high temperature setup limit the possibilities. Toreach the level of stability and certainty needed, HT-ESEM as a methodmust be developed further.
7.1 Further work
The oxidation experiments conducted in this work were relatively short,and prolonged experiments should be made to improve the understandingof dominating growth mechanisms after longer oxidation times. This willreduce the uncertainty of the thermogravimetric measurements, and as theoxide layers are thicker, sample preparation and analysis of cross-sectionswill be less difficult.
To achieve more knowledge regarding the diffusivity of Mn, SIMS analysisby oxygen sputtering should be attempted. This could increase the secondaryion intensities from Mn, leading to improved results. SIMS depth profilesof ion distributions in scales under reducing conditions would also beinteresting, as growth mechanisms may vary. The limits and possibilities ofHT-ESEM as an experimental method should be investigated further. In-situobservations during high temperature oxidation can eliminate uncertaintiesoften linked to ex-situ analysis, such as cooling, and also provide valuableinformation of competing processes and development of surface features.
To better understand the effect of temperature, pO2 and aliovalent dopantson growth rates of Cr2O3 and (Cr, Mn)3O4, more investigations should beconducted in clarifying the defect concentrations in these oxides. The effectof alloying elements on oxidation behaviour of multicomponent alloys is notyet fully understood. To reduce the degree of complexity, alloys of lesscomponents could be investigated. However, it is important to continuefundamental research on commercially available multicomponent alloys asthese are the widely used alloys in high temperature technology.
100
Bibliography
[1] W. Z. Zhu and S. C. Deevi. Development of interconnect materials forsolid oxide fuel cells. Materials Science and Engineering, 2003.
[2] K. Huang, P. Y. Hou, and J. B. Goodenough. Characterization of iron-based alloy interconnects for reduced temperature solid oxide fuel cells.Solid State Ionics, 29, 2000.
[3] World Energy Council. 2013 World Energy Issues Monitor, February2013.
[4] S. P. S. Badwal and K. Foger. Solid oxide electrolyte fuel cell review.Ceramics international, 22, 1996.
[5] A. B. Stambouli and E. Traversa. Solid oxide fuel cells (SOFCs):a review of an environmentally clean and efficient source of energy.Renewable and Sustainable Energy Reviews, 6, 2002.
[6] R. M. Ormerod. Solid oxide fuel cells. Chemical Society Reviews, 32,2003.
[7] P. Kofstad. High Temperature Corrosion. Elsevier Applied Science,1988.
[8] H. J. T. Ellingham. Reducibility of oxides and sulphides in metallurgicalprocesses. Journal of the Society of Chemical Industry, 63, 1944.
[9] P. A. Tempest and R. K. Wild. Thickness Measurements ofSpinel and Chromia Layers in Stainless Steel Oxide Scales by X-RayDiffractometry. Oxidation of Metals, 17, 1982.
[10] P. Kofstad and T. Norby. Defects and Transport in CrystallineSolids. Department of Chemistry, Faculty of Mathematics and NaturalSciences, University of Oslo, 2012.
[11] F. A. Kroger and H. J. Vink. Relations between the concentrations ofimperfections in crystalline solids, volume 3, pages 273–301. AcademicPress, New York, 1956.
101

[12] R .E. Löbnig, H. P. Schmidt, K. Hennesen, and H. J. Grabke. Diffusionof cations in chromia layers grown on iron-base alloys. Oxidation ofMetals, 32, 1992.
[13] J. D. Verhoeven. Fundamentals of Physical Metallurgy. John Wiley andSons, 1975.
[14] World Steel Association. "about steel", January 2013.
[15] J. P. Davis. Heat Resistant Materials. ASM International, 1997.
[16] K.P. Lillerud and P. Kofstad. On high temperature oxidation ofchromium. Journal of the Electrochemical Society, 127, 1980.
[17] O. Yamamoto. Solid oxide fuel cells: fundamental aspects and prospects.Electrochimica Acta, 45, 2000.
[18] F. W. Jeffrey. Metallic interconnects for solid oxide fuel cells. MaterialsScience and Engineering: A, 397, 2005.
[19] N. Q. Minh. Ceramic fuel cells. Journal of the American CeramicSociety, 76, 1993.
[20] P. Kofstad and R. Bredesen. High temperature corrosion in SOFCenvironments. Solid State Ionics, 52, 1992.
[21] H. Yokokawa. Overview of Intermediate-Temperature Solid Oxide FuelCells, pages 17–43. Springer US, 2009.
[22] J. E. Hammer, S. J. Laney, R. W. Jackson, K. Coyne, F. S. Pettit,and G. H. Meier. The oxidation of ferritic stainless steels in simulatedsolid-oxide fuel-cell atmospheres. Oxidation of Metals, 67, 2007.
[23] Z. Yang, G. Xia, and J. W. Stevenson. Evaluation of NiCr-base alloysfor SOFC interconnect applications. Journal of Power Sources, 160,2006.
[24] ThyssenKrupp VDM. Crofer 22 h preliminary material data sheet no.4050, June 2008.
[25] S. Fontana, R. Amendolab, S. Chevalier, P. Piccardo, G. Caboche,M. Viviani, R. Molins, and M. Sennour. Metallic interconnectsfor SOFC: Characterisation of corrosion resistance and conductivityevaluation at operating temperature of differently coated alloys. Journalof Power Sources, 171, 2007.
[26] P. Huczkowski, V. Shemet, J. Piron-Abellan, L. Singheiser, W. J.Quadakkers, and N. Christiansen. Oxidation limited life times ofchromia forming ferritic steels. Materials and Corrosion, 55(11), 2004.
102

[27] F. H. Stott, G. C. Wood, and J. Stringer. The influence of alloyingelements on the development and maintenance of protective scales.Oxidation of Metals, 44, 1995.
[28] J. Klöwer. Factors affecting the oxidation behaviour of thin Fe-Cr-Alfoils part ii: The effect of alloying elements: Overdoping. Materials andCorrosion, 51, 2000.
[29] E. A. Polman, Fransen T., and Gellings P. J. The reactive elementeffect: ionic processes of grain-boundary segregation and diffusion inchromium oxide scales. Journal of Physics: Condensed Matter, 1, 1989.
[30] N. Shaigan, W. Qu, D. G. Ivey, and W. Chen. A review of recentprogress in coatings, surface modifications and alloy developments forsolid oxide fuel cell ferritic stainless steel interconnects. Journal ofPower Sources, 195, 2010.
[31] M. Schuisky. PreCoated Sandvik Sanergy TM HT: A New AdvancedInterconnector Material in SOFCs, 2007.
[32] E. W. A. Young, J. H. Gerretsen, and J. H. Wit. The oxygen partialpressure dependence of the defect structure of chromium(iii)oxide.Journal of Electrochemical Society, 134, 1987.
[33] A. Holt and P. Kofstad. Electrical conductivity and defect structure ofCr2O3, reduced temperatures. Solid State Ionics, 69, 1994.
[34] A. Holt and P. Kofstad. Electrical conductivity and defect structure ofCr2O3, high temperatures. Solid State Ionics, 69, 1994.
[35] P. Kofstad and K. P. Lillerud. Chromium transport through Cr2O3
scales. i. on lattice diffusion of chromium. Oxidation of Metals, 17,1982.
[36] A. C. S. Sabioni, B. Lesage, A. M. Huntz, J. C. Pivin, andC. Monty. Self-diffusion in Cr2O3 i. chromium diffusion in singlecrystals. Philosophical Magazine A-Physics of Condensed MatterStructure Defects and Mechanical Properties, 66, 1992.
[37] D. Caplan and G. I. Sproule. Effect of oxide grain structure on thehigh-temperature oxidation of Cr. Oxidation of Metals, 9, 1975.
[38] A. Atkinson and R. I. Taylor. Diffusion of 51cr tracer in Cr2O3 and thegrowth of Cr2O3 films. NATO ASI Series, 129, 1985.
[39] S. C. Tsai, A. M. Huntz, and C. Dolin. Diffusion of 180 in massiveCr2O3 and in Cr2O3 scales at 900 �C and its relation to the oxidationkinetics of chromia forming alloys. Oxidation of Metals, 43, 1995.
103

[40] B. Schmid, N. Aas, Grong Ø., and R. Ødegård. High-temperatureoxidation of nickel and chromium studied with an in-situ environmentalscanning electron microscope. Scanning, 23, 2001.
[41] B. Schmid, N. Aas, Grong Ø., and R. Ødegård. High-temperatureoxidation of iron and the decay of Wüstite studied with in situ ESEM.Oxidation of Metals, 57, 2002.
[42] T. Jonsson, B. Pujilaksono, S. Hallström, J. Ågren, J.-E. Svensson, L.-G. Johansson, and M. Halvarsson. An ESEM in situ investigation ofthe influence of H2O on iron oxidation at 500�C. Corrosion Science, 51,2009.
[43] A. Reichmann, P. Poelt, Ch. Brandl, B. Chernev, and P. Wilhelm.High-temperature corrosion of steel in an ESEM with subsequent scalecharacterization by Raman microscopy. Oxidation of Metals, 70, 2008.
[44] FEI Company. The Quanta FEG 200, 400, 600 user’s operation manual1st edition, 2003.
[45] S. Canovic, J. Froitzheim, R. Sachitanand, M. Nikumaa, M. Halvarsson,L.-G. Johansson, and J.-E. Svensson. Oxidation of Co- and Ce-nanocoated FeCr steels: A microstructural investigation. Surface &Coatings Technology, 215, 2013.
[46] H.S. Hsu and G.J. Yurek. Kinetics and mechanisms of the oxidation ofcobalt at 600-800�C. Oxidation of Metals, 17, 1982.
[47] H. Hindam and D. P. Whittle. Microstructure, adhesion and growthkinetics of protective scales on metals and alloys. Oxidation of Metals,18, 1982.
[48] G. M. Raynaud and R. A. Rapp. In situ observations of whiskers,pyramids and pits during the high temperature oxidation of metals.Oxidation of Metals, 21, 1984.
[49] E. A. Polman, T. Fransen, and P. J. Gellings. Oxidation kinetics ofchromium and morphological phenomena. Oxidation of Metals, 32, 1989.
[50] K. P. Lillerud and Kofstad P. Chromium transport through Cr2O3
scales. ii. changes in scale morphology during high vacuum treatmentof oxidized chromium specimens. Oxidation of Metals, 17, 1982.
[51] R. L. Tallman and E. A. Gulbransen. Crystal morphology andmechanisms of growth of alpha-Fe2O3 whiskers on iron. Journal of TheElectrochemical Society, 114, 1967.
[52] R. Takagi. Growth of oxide whiskers on metals at high temperatures.Journal of the Physical Society of Japan, 12, 1957.
104

[53] R.J. Asaro and W.A. Tiller. Interface morphology development duringstress corrosion cracking: Part i. via surface diffusion. Metallurgicaltransactions, 3, 1972.
[54] P. Kofstad. On the formation of porosity and microchannels in growingscales. Oxidation of Metals, 24, 1985.
[55] T. Horita, Y. Xiong, K. Yamaji, H. Kishimoto, N. Sakai, M. E.Brito, and H. Yokokawa. Imaging of mass transports around the oxidescale/Fe-Cr alloy interfaces. Solid State Ionics, 174, 2004.
[56] David Young. High Temperature Oxidation and Corrosion of Metals.Elsevier Corrosion Series, 2008.
[57] A. W. B. Skilbred and R. Haugsrud. Sandvik Sanergy HT - a potentialinterconnect material for LaNbO4-based proton ceramic fuel cells.Journal of Power Sources, 206, 2012.
[58] M. G. C. Cox, B. Mcenaney, and V. D. Scott. A chemical diffusionmodel for partitioning of transition elements in oxide scales on alloys.Philosophical Magazine, 26, 1972.
[59] R. K. Wild. High temperature oxidation of austenitic stainless steel inlow oxygen pressure. Corrosion Science, 17, 1977.
[60] T. Horita, H. Kishimoto, K. Yamaji, Y. Xiong, N. Sakai, M. Brito, andH. Yokokawa. Effect of grain boundaries on the formation of oxide scalein FeCr alloy for SOFCs. Solid State Ionics, 179, 2008.
[61] A. W. B Skilbred. Metallic Interconnects for Proton Ceramic FuelCells, Oxidation behaviour and transport properties under simulatedfuel cell conditions. PhD thesis, Department of Chemistry, Faculty ofMathematics and Natural Sciences, University of Oslo, 2012.
[62] T. Brylewski, T. Maruyama, M. Nanko, and K. Przybylski. TGmeasurements of the oxidation kinetics of Fe-Cr alloy with regard toit application as a separator in SOFC. Journal of Thermal Analysisand Calorimetry, 55, 1999.
[63] A. C. S. Sabioni, A.-M. Huntz, E. C. Luz, M. Mantel, and C. Haut.Comparative study of high temperature oxidation behaviour in AISI304 and AISI 439 stainless steels. Materials Research, 6, 2003.
[64] T. Norby. Protonic defects in oxides and their possible role in hightemperature oxidation. Journal de Physique IV, 3, 1993.
[65] H. Asteman, J.-E. Svensson, and L.-G. Johansson. Effect of water-vapor-induced Cr vaporization on the oxidation of austenitic stainless
105

steels at 700 and 900 �C. Journal of The Electrochemical Society, 151,2004.
[66] H. Asteman, J.-E. Svensson, L.-G. Johansson, and M. Norell. Indicationof chromium oxide hydroxide evaporation during oxidation of 304L at873 K in the presence of 10% water vapor. Oxidation of Metals, 52,1999.
[67] M. Stanislowski, J. Froitzheim, L. Niewolak, W.J. Quadakkers,K. Hilpert, T. Markus, and L. Singheiser. Reduction of chromiumvaporization from SOFC interconnectors by highly effective coatings.Journal of Power Sources, 164, 2007.
[68] J. Froitzheim, H. Ravash, E. Larsson, L. G. Johansson, and J. E. Svens-son. Investigation of chromium volatilization from FeCr interconnectsby a Denuder technique. Journal of The Electrochemical Society, 157,2010.
106

Appendix
A summary of parabolic rate constants measured for uncoated andcobalt coated samples oxidized under reducing and oxidizing conditions attemperatures from 800� to 1000�C is given in tables 7.1 and 7.2.
107

Table 7.1: Summary of parabolic rate constants measured for uncoatedsamples oxidized under reducing and oxidizing conditions at temperaturesfrom 800� to 1000�C.
Atmosphere Temperature, �C kp,w, g2/cm4s
UncoatedWet air 850 6.3�10�14
Wet air 850 1.6�10�14
Wet air 900 5.3�10�14
Wet air 925 2.9�10�12
Wet air 950 8.9�10�12
Wet air 1000 2.6�10�11
Wet 5% H2 in Ar 800 2.7�10�13
Wet 5% H2 in Ar 850 2.8�10�13
Wet 5% H2 in Ar 875 3.1�10�13
Wet 5% H2 in Ar 900 3.9�10�13
Wet 5% H2 in Ar 925 3.1�10�12
Wet 5% H2 in Ar 950 9.2�10�12
Wet 5% H2 in Ar 1000 1.5�10�11
O2+Ar (pO2 : 1.0�10�5 atm) 900 5.0�10�13
O2+Ar (pO2 : 9.6�10�3 atm) 900 9.9�10�13
O2+Ar (pO2 : 2.3�10�2 atm) 900 5.8�10�13
O2+Ar (pO2 : 2.4 �10�1 atm) 900 5.0�10�13
O2+Ar (pO2 : 3.2 �10�1 atm) 900 3.6�10�13
O2+Ar (pO2 : 1.0 atm) 900 4.0�10�13
108

Table 7.2: Summary of parabolic rate constants measured for 600 nmCo coated samples oxidized under reducing and oxidizing conditions attemperatures from 850� to 1000�C.
Atmosphere Temperature, �C kp,w, g2/cm4s
600 nm CoWet air 850 1.9�10�13
Wet air 900 1.3�10�12
Wet air 1000 1.0�10�11
O2 900 1.4�10�12
O2 900 1.0�10�12
O2 900 1.8�10�12
O2+Ar (pO2 : 1.6�10�1 atm) 900 1.3�10�12
O2+Ar (pO2 : 5.8�10�2 atm) 900 1.7�10�12
Ar (pO2 : 1.0�10�5 atm) 900 1.8�10�12
O2+Ar (pO2 : 6.1�10�2 atm) 900 1.5�10�12
O2+Ar (pO2 : 2.3�10�2 atm) 900 2.6�10�12
O2+Ar (pO2 : 9.6�10�3 atm) 900 1.8�10�12
Wet 5% H2 in Ar 800 2.7�10�13
Wet 5% H2 in Ar 850 2.8�10�13
Wet 5% H2 in Ar 850 5.6�10�13
Wet 5% H2 in Ar 875 3.1�10�13
Wet 5% H2 in Ar 900 3.9�10�13
Wet 5% H2 in Ar 925 3.1�10�12
Wet 5% H2 in Ar 925 4.4�10�12
Wet 5% H2 in Ar 925 5.2�10�12
Wet 5% H2 in Ar 950 7.9�10�12
Wet 5% H2 in Ar 950 9.2�10�12
Wet 5% H2 in Ar 975 2.2�10�11
Wet 5% H2 in Ar 900 1.7�10�12
Wet 5% H2 in Ar 1000 1.5�10�11
Wet 5% H2 in Ar 1000 2.6�10�11
109