high-throughput sequencing of the chicken gut...
TRANSCRIPT
High-throughput sequencing of the chicken gut
microbiome
By
Nicholas Andrew Duggett
A thesis submitted to
The University of Birmingham
For the degree of
DOCTOR OF PHILOSOPHY
School of Biosciences
The University of Birmingham
August 2015
University of Birmingham Research Archive
e-theses repository This unpublished thesis/dissertation is copyright of the author and/or third parties. The intellectual property rights of the author or third parties in respect of this work are as defined by The Copyright Designs and Patents Act 1988 or as modified by any successor legislation. Any use made of information contained in this thesis/dissertation must be in accordance with that legislation and must be properly acknowledged. Further distribution or reproduction in any format is prohibited without the permission of the copyright holder.
ii
Abstract
The chicken (Gallus gallus domesticus) is the most abundant and widely
distributed livestock animal with a global population of over 21 billion. A
commercially raised broiler chick takes five-weeks to reach market weight and
this can be attributed to the selection of genetic traits, better feed formulation (in
addition to enzyme supplementation) and an increased understanding of health
and husbandry. The symbiotic, complex and variable community of the
microbiome forms an important part of the gastrointestinal tract (gut) and is
involved in gut-development and non-specific resistance to infection.
This study investigated the chicken gut microbiota using high-throughput 16S
rRNA sequencing on an Illumina MiSeq and culture-based techniques. There
was specific interest in the proventriculus of which there is limited research
currently in the literature and the caecum because it contains the highest
density of bacterial cells in the gut at 1011 cells per gram.
The results showed no significant difference in the first stages of the GIT which
shared a low-diversity microbiota dominated by a few Lactobacillus species.
The microbiota becomes more diverse in the latter parts of the small intestine
where Clostridiales and Enterobacteriaceae were present in higher numbers.
The caecum was the most diverse organ with the majority of species belonging
to Ruminococcaceae, Lachnospiraceae and Alistipes. A number of novel
species were isolated from the chicken gut and six of these were whole-genome
sequenced.

iii
Acknowledgements
I would like to acknowledge the BBSRC and ABVista for funding the work
presented in this thesis. I would like to thank my main supervisor Mark Pallen
for his help and support throughout my Ph.D. In addition, thanks go to my other
supervisors; Charles Penn and Mike Bedford.
I would like to thank Martin Sergeant, Jacqueline Chan, Chrystala
Constantinidou, Mala Patel for their help and advice. I am particularly thankful to
Andrew Millard for proof reading and patiently teaching me bioinformatics. An
especially big thank you goes to Gemma Kay for advice, encouragement,
organisation and proof reading; this would have been much more difficult
without your help. I would also like to thank my colleagues at the University of
Birmingham and University of Warwick for providing many great times.
I am eternally grateful to my Mum and Dad for supporting me throughout my
studies, and my sister for inspiring me to go into scientific research. Finally, I
would like to thank my girlfriend Laura for putting up with me in general but
especially during the writing of this thesis; I would be lost without you.

iv
Non-author contributions
In Chapters Three and Four, the custom primers and java programs were
designed by Martin Sergeant. In Chapter Six, the custom-script to determine the
presence of spore-formation genes was written by Richard Brown.
v
Table of contents
Abstract ............................................................................................................... ii
Acknowledgements ............................................................................................. ii
Non-author contributions .................................................................................... iv
Table of contents ................................................................................................ v
List of figures ...................................................................................................... xi
List of tables ..................................................................................................... xix
Abbreviations .................................................................................................. xxiii
1. Introduction .................................................................................................. 1
1.1 The chicken ........................................................................................... 2
1.2 The gastrointestinal tract of the chicken ................................................. 3
1.3 The intestinal microbiota ........................................................................ 6
1.3.1 Microbial ecology .......................................................................... 11
1.4 Chicken gut microbiota ........................................................................ 14
1.4.1 Crop .............................................................................................. 15
1.4.2 Proventriculus ............................................................................... 18
1.4.3 Gizzard ......................................................................................... 19
1.4.4 Small intestine .............................................................................. 19
1.4.5 Caeca ........................................................................................... 21
1.4.6 Non-bacterial organisms within the chicken gut ............................ 26
1.5 The caecal metagenome ..................................................................... 27
vi
1.6 Role of the microbiota in health and disease ....................................... 28
1.7 Antibiotic growth promoters and antibiotic resistance .......................... 31
1.8 Enzymes in the chicken diet ................................................................ 34
1.8.1 Anti-nutritional effects of dietary non-starch polysaccharides in
chickens ................................................................................................. 34
1.8.2 Increase in intestinal viscosity....................................................... 35
1.8.3 Nutrient encapsulation .................................................................. 36
1.8.4 Impact of dietary NSP on intestinal microbiota ............................. 37
1.8.5 Adverse effects of intestinal bacteria on nutrient utilisation .......... 38
1.9 Dietary supplementation with NSP-degrading enzymes ...................... 38
1.9.1 Mode of action of NSP-degrading enzymes ................................. 38
1.9.2 Modification of intestinal microbiota and the prebiotic effects of
enzyme hydrolysis products .................................................................. 39
1.9.3 The addition of phytase ................................................................ 40
1.10 Aims and objectives of this study ....................................................... 43
2. Materials and methods............................................................................... 43
2.1 Sample collection ....................................................................................... 44
2.2 Suppliers .................................................................................................... 44
2.3 Media.......................................................................................................... 44
2.3.1 Bacterial media ............................................................................. 47
2.3.2 Bacterial growth conditions ........................................................... 48
2.3.3 Bacterial glycerol stocks ............................................................... 48
vii
2.4 Buffers and solutions .................................................................................. 48
2.4.1 Buffers and solutions for agarose gel electrophoresis .................. 48
2.5 Isolation of DNA ......................................................................................... 49
2.5.1 Isolation of DNA from gut samples using Qiagen Stool kit ............ 49
2.5.1.1 RNAase step.............................................................................. 50
2.5.2 Isolation of DNA from caecal sample using Powermax soil
extraction kit .......................................................................................... 51
2.5.3 Isolation of genomic DNA from solid medium cultures .................. 52
2.5.4 DNA extraction from agarose gels ................................................ 53
2.6 DNA quantification ...................................................................................... 54
2.6.1 Nanodrop 1000 ............................................................................. 54
2.6.2 Qubit 2.0 ....................................................................................... 54
2.7 Genetic manipulations ................................................................................ 55
2.7.1 Polymerase chain reaction ........................................................... 55
2.7.2 Analysis of DNA by agarose gel electrophoresis .......................... 55
2.7.3 Post-PCR DNA purification with Qiagen PCR purification kit ........ 58
2.7.4 Post-PCR DNA purification with AMPure beads ........................... 59
2.8 DNA sequencing ........................................................................................ 59
2.8.1 Sanger DNA sequencing .............................................................. 59
2.8.2 Illumina 16S rRNA gene sequencing library preparation .............. 60
2.8.3 Illumina Nextera XT library preparation ........................................ 61
2.8.4 Agilent bioanalyzer high sensitivity DNA kit .................................. 62
viii
2.9 Bioinformatic analysis ................................................................................. 63
2.9.1 Processing of 16S rRNA gene-fragment sequences .................... 63
2.9.2 Alpha rarefaction and beta diversity analysis of 16S rRNA gene-
fragment sequences .............................................................................. 64
2.9.3 Statistical analysis of 16S rRNA gene-fragment sequences ......... 65
2.9.4 Phylogenetic analysis of 16S rRNA gene sequences ................... 66
2.9.5 Analysis of Sanger sequenced isolates ........................................ 67
3. Optimisation of 16S rRNA gene-fragment sequencing on the chicken
gut microbiota ................................................................................................ 68
3.1 Introduction ................................................................................................. 69
3.2 Methods ...................................................................................................... 70
3.2.1 Normalisation of OTU coverage.................................................... 70
3.3 Results ....................................................................................................... 71
3.3.1 Exclusion of organellar sequences ............................................... 71
3.3.2 Overview ....................................................................................... 73
3.3.3 Caecum ........................................................................................ 76
3.3.4 Phylogenetic analysis of abundant OTUs from the caecum ......... 81
3.4 Discussion .................................................................................................. 82
4. Identification of the chicken gut microbiota using V4-V6 16S rRNA gene-
fragment sequencing ..................................................................................... 86
4.1 Introduction ................................................................................................. 87
4.2 Methods ...................................................................................................... 88
ix
4.3 Results ....................................................................................................... 88
4.3.1 Overview ....................................................................................... 88
4.3.2 Crop .............................................................................................. 92
4.3.3 Proventriculus ............................................................................... 96
4.3.4 Gizzard ....................................................................................... 100
4.3.5 Duodenum .................................................................................. 104
4.3.6 Ileum ........................................................................................... 108
4.3.7 Caecum ...................................................................................... 112
4.3.8 Alpha rarefaction and beta diversity of the control-diet gut ......... 120
4.3.9 Alpha rarefaction and beta diversity of the phytase-diet gut ....... 125
4.3.10 Phylogenetic analysis of abundant OTUs from both diets ........ 126
4.4 Discussion ................................................................................................ 131
5. Isolation of bacteria from the chicken gut ............................................. 140
5.1 Introduction ............................................................................................... 141
5.2 Methods .................................................................................................... 142
5.3 Results ..................................................................................................... 144
5.3.1 Bacterial identification of cultured isolates .................................. 145
5.3.2 Isolates from the Clostridiales ..................................................... 148
5.3.3 Isolates from the Bacilli ............................................................... 151
5.3.4 Isolates from the Actinobacteria.................................................. 153
5.3.5 Gram-negative isolates ............................................................... 155
x
5.3.7 Comparison against the V4-V6 16S rRNA gene-fragment
sequenced dataset .............................................................................. 157
5.4 Discussion ................................................................................................ 161
6. Genome sequence analysis of novel bacterial species isolated from the
chicken gut ................................................................................................... 167
6.1 Introduction ............................................................................................... 168
6.2 Methods .................................................................................................... 169
6.3 Results ..................................................................................................... 170
6.3.1 Clostridiales isolate one .............................................................. 170
6.3.2 Coriobacteriaceae isolate ........................................................... 176
6.3.3 Alistipes isolate ........................................................................... 177
6.3.4 Eubacteriaceae isolate one ........................................................ 179
6.3.5 Eubacteriaceae isolate two ......................................................... 180
6.3.6 Clostridiales isolate two .............................................................. 183
6.4 Discussion ................................................................................................ 184
7. Discussion ................................................................................................ 188
8. References ................................................................................................ 195
xi
List of figures
Chapter 1 Introduction
1.1 Map of chicken gastrointestinal track showing structures, pH and
transit times
1.2 16S rRNA gene with conserved regions and variable regions with
the length of the regions indicated in bp
1.3 Map of chicken gastrointestinal track showing structures with most
common and abundant taxa
1.4 Cross-section of a wheat grain showing different layers and their
constituents
1.5a Section of Lichenin (a β-glucan) and the product after the addition
of lichenase
1.5b Section of xylan and the product after the addition of xylanase
1.6 Schematic diagram of phytic acid
Chapter 2 Methods
2.1 Flow chart of steps used to generate analysable data in QIIME
from raw sequence data
xii
Chapter 3 Optimisation of 16S rRNA gene-fragment sequencing on the
chicken gut microbiota
3.1a Summary of taxonomic composition of combined diets including
organellar OTUs from V3-V4 16S rRNA gene-fragment
sequencing
3.1b Summary of taxonomic composition of combined diets excluding
organellar OTUs from V3-V4 16S rRNA gene-fragment
sequencing
3.2a Number of observed species against the number of sequences in
control-diet organs
3.2b Number of observed species against the number of sequences in
phytase-diet organs
3.3a Number of observed species against the number of sequences in
control and phytase diets in the caecum after V3-V4 16S rRNA
gene-fragment sequencing
3.3b Simpson diversity index against number of sequences in control
and phytase diets in the caecum after V3-V4 16S rRNA gene-
fragment sequencing
3.3c Jackknife beta diversity bootstrapped tree of caeca samples from
control and phytase diets after V3-V4 16S rRNA gene-fragment
sequencing
3.4 A consensus of 1,000 bootstrap trees created using the ARB
neighbour joining distance matrix method illustrating the
placement of five OTUs after V3-V4 16S rRNA gene-fragment
sequencing
xiii
Chapter 4 Identification of the chicken gut microbiota using V4-V6 16S
rRNA gene-fragment sequencing
4.1 Alpha rarefaction curve at a depth of 150,000 sequences for all
samples after V4-V6 16S rRNA gene-fragment sequencing
4.2a Taxonomic composition of control-diet organs at phylum level
before 16S rRNA gene copy number normalisation
4.2b Taxonomic composition of control-diet organs at phylum level after
16S rRNA gene copy number normalisation
4.3a Number of observed species against the number of sequences in
both diets in the crop from V4-V6 16S rRNA gene-fragment
sequencing
4.3b Simpson diversity index against number of sequences in both
diets in the crop from V4-V6 16S rRNA gene-fragment sequencing
4.3c Jackknife beta diversity bootstrap tree of crop samples
4.4a Number of observed species against the number of sequences in
both diets in the proventriculus from V4-V6 16S rRNA gene-
fragment sequencing
4.4b Simpson diversity index against number of sequences in both
diets in the proventriculus from V4-V6 16S rRNA gene-fragment
sequencing
4.4c Jackknife beta diversity bootstrap tree of proventriculus samples
4.5a Number of observed species against the number of sequences in
both diets in the gizzard from V4-V6 16S rRNA gene-fragment
sequencing
xiv
4.5b Simpson diversity index against number of sequences in both
diets in the gizzard from V4-V6 16S rRNA gene-fragment
sequencing
4.5c Jackknife beta diversity bootstrap tree of gizzard samples
4.6a Number of observed species against the number of sequences in
both diets in the duodenum from V4-V6 16S rRNA gene-fragment
sequencing
4.6b Simpson diversity index against number of sequences in both
diets in the duodenum from V4-V6 16S rRNA gene-fragment
sequencing
4.6c Jackknife beta diversity bootstrap tree of duodenum samples
4.7a Number of observed species against the number of sequences in
both diets in the ileum from V4-V6 16S rRNA gene-fragment
sequencing
4.7b Simpson diversity index against number of sequences in both
diets in the ileum from V4-V6 16S rRNA gene-fragment
sequencing
4.7c Jackknife beta diversity bootstrap tree of ileum samples
4.8a Summary of taxonomic composition at class level for control-diet
organs after V4-V6 16S rRNA gene-fragment sequencing
4.8b Summary of taxonomic composition at class level for phytase-diet
organs after V4-V6 16S rRNA gene-fragment sequencing
4.9a Number of observed species against the number of sequences in
both diets in the caecum after V4-V6 16S rRNA gene-fragment
sequencing
xv
4.9b Simpson diversity index against number of sequences in both
diets in the caecum after V4-V6 16S rRNA gene-fragment
sequencing
4.9c Jackknife beta diversity bootstrap tree of caecum samples
4.10a Number of observed species against the number of sequences
from control-diet organs from V4-V6 16S rRNA gene-fragment
sequencing
4.10b Simpson diversity index against number of sequences in the
control-diet organs from V4-V6 16S rRNA gene-fragment
sequencing
4.11 Jackknife beta diversity bootstrapped tree of control-diet samples
from V4-V6 16S rRNA gene-fragment sequencing
4.12a Number of observed species against the number of sequences
from phytase-diet organs from V4-V616S rRNA gene-fragment
sequencing
4.12b Simpson diversity index against number of sequences in the
phytase-diet organs from V4-V6 16S rRNA gene-fragment
sequencing
4.13 Jackknife beta diversity bootstrapped tree of phytase-diet samples
after V4-V6 16S rRNA gene-fragment sequencing
Chapter 5 Isolation of bacteria from the chicken gut
5.1 Work-flow of isolate identification used in this study
xvi
5.2 A consensus of 1,000 bootstrap trees created using the ARB
neighbour joining distance matrix showing the placement of
a Seven isolates within the Ruminococcaceae
b Six isolates within the Clostridiaceae and Erysipelotrichaceae
5.3 A consensus of 1,000 bootstrap trees created using the ARB
neighbour joining distance matrix showing the placement of eight
isolates in Clostridiaceae, Lachnospiraceae and
Ruminococcaceae
5.4 A consensus of 1,000 bootstrap trees created using the ARB
neighbour joining distance matrix showing three isolates within the
Bacillaceae
5.5 A consensus of 1,000 bootstrap trees created using the ARB
neighbour joining distance matrix
a Two isolates within the Staphylococcaceae
b Three isolates within the Lactobacillaceae
5.6 A consensus of 1,000 bootstrap trees created using the ARB
neighbour joining distance matrix showing two isolates with
Enterococcus species
5.7 A consensus of 1,000 bootstrap trees created using the ARB
neighbour joining distance matrix
a Two isolates within the Propionibacteriaceae
b Two isolates within the Coriobacteriaceae
c A single Corynebacterium isolate
d Two isolates within the Bifidobacterium
xvii
5.8 A consensus of 1,000 bootstrap trees created using the ARB
neighbour joining distance matrix
a Two isolates within the Bacteroides
b Two isolates with Alistipes
c A single Escherichia isolate
Chapter 6 Genome sequence analysis of novel bacterial species
isolated from the chicken GIT
6.1 Functional categories of CDS from Clostridiales isolate one after
BLASTKOALA annotation
6.2 A consensus of 1,000 bootstrap trees created using the ARB
neighbour joining distance matrix
a Clostridiales isolate one
b Coriobacteriaceae isolate
c Alistipes isolate
6.3 BLASTKOALA output overlap of each isolate showing the starch
and sugar metabolism pathways
6.4 Functional categories of CDS from Coriobacteriaceae isolate after
BLASTKOALA annotation
6.5 Functional categories of CDS from the Alistipes isolate after
BLASTKOALA annotation
xviii
6.6 Functional categories of CDS from Eubacteriaceae isolate one
after BLASTKOALA annotation
6.7 A consensus of 1,000 bootstrap trees created using the ARB
neighbour joining distance matrix
a Eubacteriaceae isolate one
b Eubacteriaceae isolate two
c Clostridiales isolate two
6.8 Functional categories of CDS from Eubacteriaceae isolate two
after BLASTKOALA annotation
6.9 Functional categories of CDS from Clostridiales isolate two after
BLASTKOALA annotation
xix
List of tables
Chapter 1 Introduction
1.1 Summary of the most abundant bacterial organisms throughout
the small intestine
1.2 Summary of the most abundant bacterial organisms from selected
studies of the caecal microbiota
Chapter 2 Materials and methods
2.1 Chicken gut samples for DNA extraction and microbial cuturing
2.2 Media used for the cultivation and isolation of bacteria from the
gut samples
2.3 PCR thermocycling conditions for all PCRs used in the project
2.4 Primer sequences that were used in this study
2.5 Sanger sequencing set up for amplicon or plasmid DNA
Chapter 3 Optimisation of 16S rRNA gene-fragment sequencing on the
chicken gut microbiota
3.1 Number of reads for organs (control and phytase), the number of
organellar reads and the remaining reads after organellar reads
were excluded
xx
3.2 Summary of control (red) and phytase (blue) diet organs from V3-
V4 16S rRNA gene-fragment sequencing after PICRUSt
normalisation
3.3a Top ten abundant OTUs after V3-V4 16S rRNA gene-fragment
sequencing of crop control and phytase diet caecum samples
3.3b Alpha rarefaction results from of the caecum from control and
phytase diet samples after V3-V4 16S rRNA gene-fragment
sequencing
3.4 List of five most abundant OTUs after V3-V4 16S rRNA gene-
fragment sequencing which were placed in an ARB tree with
>50% confidence levels and closest bacterial relative
Chapter 4 Identification of the chicken gut microbiota using V4-V6 16S
rRNA gene-fragment sequencing
4.1 Summary of control (red) and phytase (blue) diet organs showing
number, total reads, lowest sample count per organ, number of
OTUs and number of core OTUs identified from V4-V6 16S rRNA
gene-fragment sequencing
4.2a Top five abundant OTUs after V4-V6 16S rRNA gene-fragment
sequencing of crop control-diet samples
4.2b Alpha rarefaction results of the crop from control and phytase-diet
V4-V6 16S rRNA gene-fragment sequencing
4.3a Top five abundant OTUs from V4-V6 16S rRNA gene-fragment
sequencing of the proventriculus control and phytase-diet samples
xxi
4.3b Alpha rarefaction results of the proventriculus from control and
phytase-diet V4-V6 16S rRNA gene-fragment sequencing
4.4a Top five abundant OTUs from V4-V6 16S rRNA gene-fragment
sequencing of gizzard control and phytase-diet samples
4.4b Alpha rarefaction results of the gizzard from control and phytase-
diet V4-V6 16S rRNA gene-fragment sequencing
4.5a Top five abundant OTUs from V4-V6 16S rRNA gene-fragment
sequencing of duodenum control and phytase-diet samples
4.5b Alpha rarefaction results of the duodenum from control and
phytase-diet V4-V6 16S rRNA gene-fragment sequencing
4.6a Top five abundant OTUs from V4-V6 16S rRNA gene-fragment
sequencing of the ileum control and phytase-diet samples
4.6b Alpha rarefaction results of the ileum from control and phytase-
diet after V4-V6 16S rRNA gene-fragment sequencing
4.7a Top ten abundant OTUs from V4-V6 16S rRNA gene-fragment
sequencing of caecum control and phytase-diet samples
4.7b Alpha rarefaction results of the caecum from control and phytase-
diet V4-V6 16S rRNA gene-fragment sequencing
4.8 Alpha rarefaction statistics of control-diet organs at a depth of
32,000 reads
4.9 Alpha rarefaction statistics of phytase-diet organs at a depth of
31,000 reads
4.10 The nine most abundant OTUs from V4-V6 16S rRNA gene-
fragment sequencing which were placed in an ARB tree with
≥50 % confidence levels and their nearest species
xxii
Chapter 5 Isolation of bacteria from the chicken gut
5.1 Identification of bacterial species after culturing (medium,
condition and isolation source detailed)
5.2 Comparison of full-length 16S rRNA gene sequenced isolates with
representative OTUs from V4-V6 16S rRNA gene-fragment
sequencing
5.3 Comparison of forward only 16S rRNA gene sequenced isolates
with representative OTUs from V4-V6 16S rRNA gene-fragment
sequencing
5.4 Relative abundance of isolated species from V4-V6 16S rRNA
gene-fragment sequencing in each organ and in total from each
diet
Chapter 6 Genome sequence analysis of novel bacterial species
isolated from the chicken gut
6.1 Isolate statistics, including sequencing output and PROKKA
results
6.2 Results of DDH and ANI analysis of isolates tested against closest
bacterial species determined by ARB
xxiii
Abbreviations
ANI Average nucleotide identity
APEC Avian pathogenic Escherichia coli
CFU Colony Forming Unit
CMC Carboxymethylcellulose
DDH DNA-DNA hybridization
DNA Deoxyribonucleic Acid
EGTs Environmental Gene Tags
FAA Fastidious anaerobe agar
FCR Food-Conversion-Ratio
FISH Fluorescent in situ Hybridization
GUT Gastrointestinal tract
IMG Integrated Microbial Genomes
LB Lysogeny broth
LBA Lysogeny agar
MALDI-TOF Matrix-Assisted Laser Desorption Ionization Time-Of-Flight
MDR Multi Drug Resistant
MHA Mueller-Hinton agar
NSP Non-Starch Polysaccharides
xxiv
OTU Operational Taxonomic Unit
PCR Polymerase Chain reaction
QIIME Quantitative Insights Into Microbial Ecology
rRNA Ribosomal Ribonucleic Acid
RT Room Temperature
S.E.M Standard error of the mean
SINA SILVA incremental aligner
TAE Tris-acetate

1
CHAPTER ONE
1. Introduction
2
1.1 The chicken
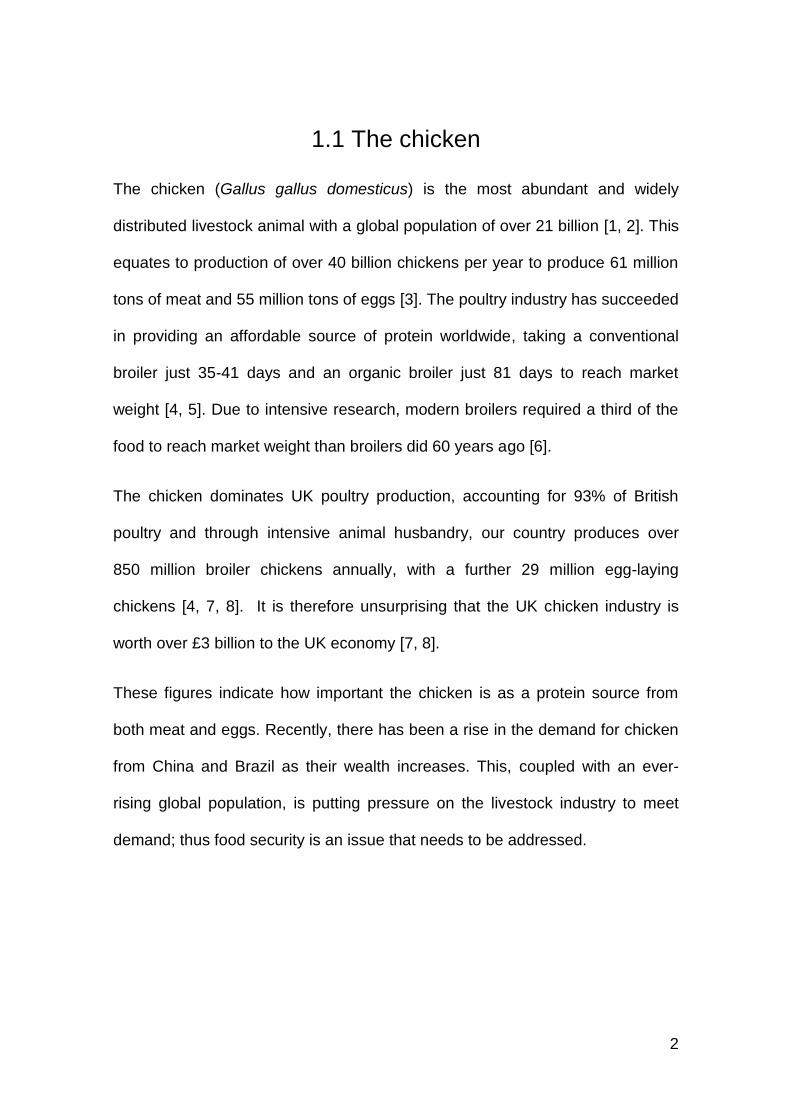
The chicken (Gallus gallus domesticus) is the most abundant and widely
distributed livestock animal with a global population of over 21 billion [1, 2]. This
equates to production of over 40 billion chickens per year to produce 61 million
tons of meat and 55 million tons of eggs [3]. The poultry industry has succeeded
in providing an affordable source of protein worldwide, taking a conventional
broiler just 35-41 days and an organic broiler just 81 days to reach market
weight [4, 5]. Due to intensive research, modern broilers required a third of the
food to reach market weight than broilers did 60 years ago [6].
The chicken dominates UK poultry production, accounting for 93% of British
poultry and through intensive animal husbandry, our country produces over
850 million broiler chickens annually, with a further 29 million egg-laying
chickens [4, 7, 8]. It is therefore unsurprising that the UK chicken industry is
worth over £3 billion to the UK economy [7, 8].
These figures indicate how important the chicken is as a protein source from
both meat and eggs. Recently, there has been a rise in the demand for chicken
from China and Brazil as their wealth increases. This, coupled with an ever-
rising global population, is putting pressure on the livestock industry to meet
demand; thus food security is an issue that needs to be addressed.
3
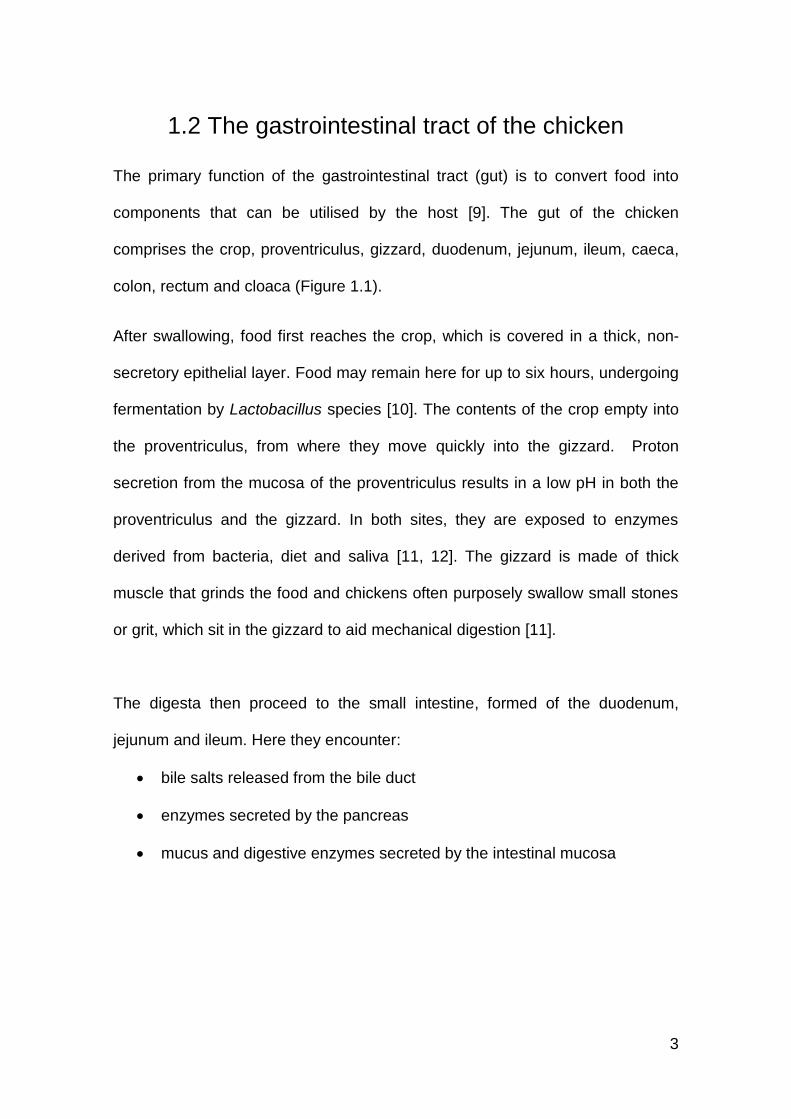
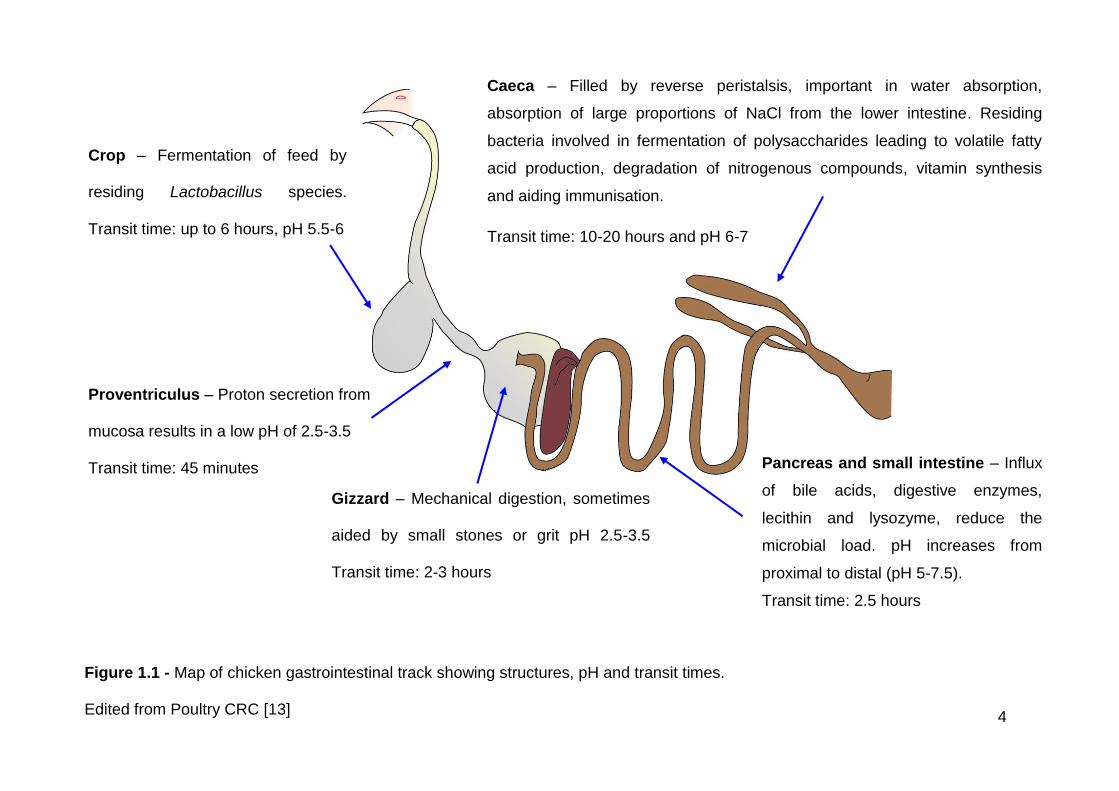
1.2 The gastrointestinal tract of the chicken
The primary function of the gastrointestinal tract (gut) is to convert food into
components that can be utilised by the host [9]. The gut of the chicken
comprises the crop, proventriculus, gizzard, duodenum, jejunum, ileum, caeca,
colon, rectum and cloaca (Figure 1.1).
After swallowing, food first reaches the crop, which is covered in a thick, non-
secretory epithelial layer. Food may remain here for up to six hours, undergoing
fermentation by Lactobacillus species [10]. The contents of the crop empty into
the proventriculus, from where they move quickly into the gizzard. Proton
secretion from the mucosa of the proventriculus results in a low pH in both the
proventriculus and the gizzard. In both sites, they are exposed to enzymes
derived from bacteria, diet and saliva [11, 12]. The gizzard is made of thick
muscle that grinds the food and chickens often purposely swallow small stones
or grit, which sit in the gizzard to aid mechanical digestion [11].
The digesta then proceed to the small intestine, formed of the duodenum,
jejunum and ileum. Here they encounter:
bile salts released from the bile duct
enzymes secreted by the pancreas
mucus and digestive enzymes secreted by the intestinal mucosa
4
Figure 1.1 - Map of chicken gastrointestinal track showing structures, pH and transit times.
Edited from Poultry CRC [13]
Crop – Fermentation of feed by
residing Lactobacillus species.
Transit time: up to 6 hours, pH 5.5-6
Pancreas and small intestine – Influx
of bile acids, digestive enzymes,
lecithin and lysozyme, reduce the
microbial load. pH increases from
proximal to distal (pH 5-7.5).
Transit time: 2.5 hours
Caeca – Filled by reverse peristalsis, important in water absorption,
absorption of large proportions of NaCl from the lower intestine. Residing
bacteria involved in fermentation of polysaccharides leading to volatile fatty
acid production, degradation of nitrogenous compounds, vitamin synthesis
and aiding immunisation.
Transit time: 10-20 hours and pH 6-7
Proventriculus – Proton secretion from
mucosa results in a low pH of 2.5-3.5
Transit time: 45 minutes
Gizzard – Mechanical digestion, sometimes
aided by small stones or grit pH 2.5-3.5
Transit time: 2-3 hours
5
Transit through the small intestine takes around 2.5 hours [2]. Once the digesta
reach the ileocaecal junction at the beginning of the large intestine, they fill two
caeca by reverse peristalsis. Here, the digesta can remain for as long as 10-20
hours, before being emptied back into the small intestine [2, 14, 15]. The role of
the caeca has not been fully established. However, there are six probable
functions:
Water absorption [16]
Absorption of large proportions of NaCl from the lower intestine [17]
Fermentation of polysaccharides leading to volatile fatty acid production
[18]
Degradation of nitrogenous compounds [19]
Vitamin synthesis [20]
Aiding immunisation [20]
The latter four are all due to bacteria present in the caeca. The materials that
enter the caeca from the small intestine are fine-particles and soluble, low
molecular weight non-viscous molecules [21]. Up to 18% of excreted dry matter
and 17% of excreted water enters the caeca, with a proportion entering birds
that have been starved [22]. The faecal pellet is formed in the short, large
intestine before passing into the cloaca, mixed with uric acid and exits through
the vent [14, 15]. Caecal contents are voided several times a day and produce
distinctive foul-smelling droppings.
6
1.3 The intestinal microbiota
Three terms are used when studying the gut as a habitat:
Microbiota – the microorganisms present in a defined habitat
Metagenome – the collection of genes and genomes of the microbiota
Microbiome – the entire habitat, including the microbiota, their genes
and genomes in addition to their interactions with each other and the
host
A census of the microbiota is established through culturing or molecular
methods such as analysis of 16S rRNA genes or other marker genes, which are
amplified and sequenced from biological samples [23-25]. The metagenome
was first described by Handelsman et al. (1998) in reference to the cloning and
functional analysis of the collective genomes of soil microbiota [26]. Shotgun
sequencing of DNA extracted from a biological sample, followed by assembly
and annotation is now the most common way of completing functional analysis
of the metagenome [23]. The term ‘microbiome’ was first used by Lederberg in
2001 to describe the “ecological community of commensal, symbiotic, and
pathogenic microorganisms that literally share our body space and have been
all but ignored as determinants of health and disease” [27]. This definition was
similar to that of the microbiota; however, microbiome has taken on a slightly
different meaning. It now encompasses the microbiota, the metagenome in
addition to their products and the host environment [23, 28].
The gut microbiota plays an important role in host animal health and production.
It can positively influence non-specific resistance to infection, immunology,
7
physiology, biochemistry and gut development. The gut of any animal forms a
habitat for a complex and varied microbial community which is determined by
the host, inter-species competition and diet [29]. The gut microbiomes of the
human, wallaby, panda, cow and termite, amongst others, have been
characterised through metagenomic and functional analyses [30-35].
There are two main approaches to characterising bacterial populations within
animal guts: culture-based and culture-independent approaches. The traditional
culture-based approach relies on growth (often on a selective medium) and
biochemical tests to identify bacteria isolated under specific culture conditions;
Henrich Kern initiated culture-based studies of the chicken gut microbiota in
1897 [36-38].
The culturing of an organism relies on many factors [39], including:
Type of culture medium
Presence of antibiotics
Presence or absence of other organisms
Temperature
Atmosphere
Incubation time
Sample collection
Cultural approaches can be onerous and fail to provide a comprehensive
picture, when the majority of microbiota have unknown growth requirements or
cannot be cultured at all in the laboratory [38]. The first understanding of the
‘unculturable’ bacteria in the chicken came from microscopy in 1897, where the
8
bacteria observed by microscopy were in orders of magnitude greater than
those that would grow on an agar plate using ordinary methods of cultivation;
this was later referred to as ‘the great plate count anomaly’. [36, 40-42].
It was proposed that the observed bacteria that would not grow could be dead.
However, it was later shown that cells can be metabolically active, even if
unable to proliferate under laboratory conditions [43]. It has been estimated that
only 20-40% of bacterial species from the gut can be cultured using currently
available techniques which was confirmed by early metagenome and 16S rRNA
gene sequencing studies [44-46]. This figure may be much lower for the caecal
microbiota, given that one study found that only 10% of bacterial sequences
obtained from this community represented known bacterial species [38].
Despite potential deficiencies, culture was the only available tool until three
crucial developments:
Sequencing technology invented by Fredrick Sanger in 1977 [47]
Adoption of the 16S rRNA gene sequence to study phylogeny by Carl
Woese in 1977 [48-50],
The development of PCR by Kary Mullis in 1983 [51]
The 16S rRNA gene is 1542 bp in length and forms part of the 30S subunit with
the 23S rRNA gene [52]. The sequences of some loops from the secondary
structure are conserved across nearly all-bacterial species due to function.
However, the structural parts are variable and only specific to one or more
classes [53]. The 16S rRNA gene is universally present in prokaryotes allowing
for comparisons of phylogenetic relationships and has highly variable regions to
allow differentiation between species, while containing conserved regions that
9
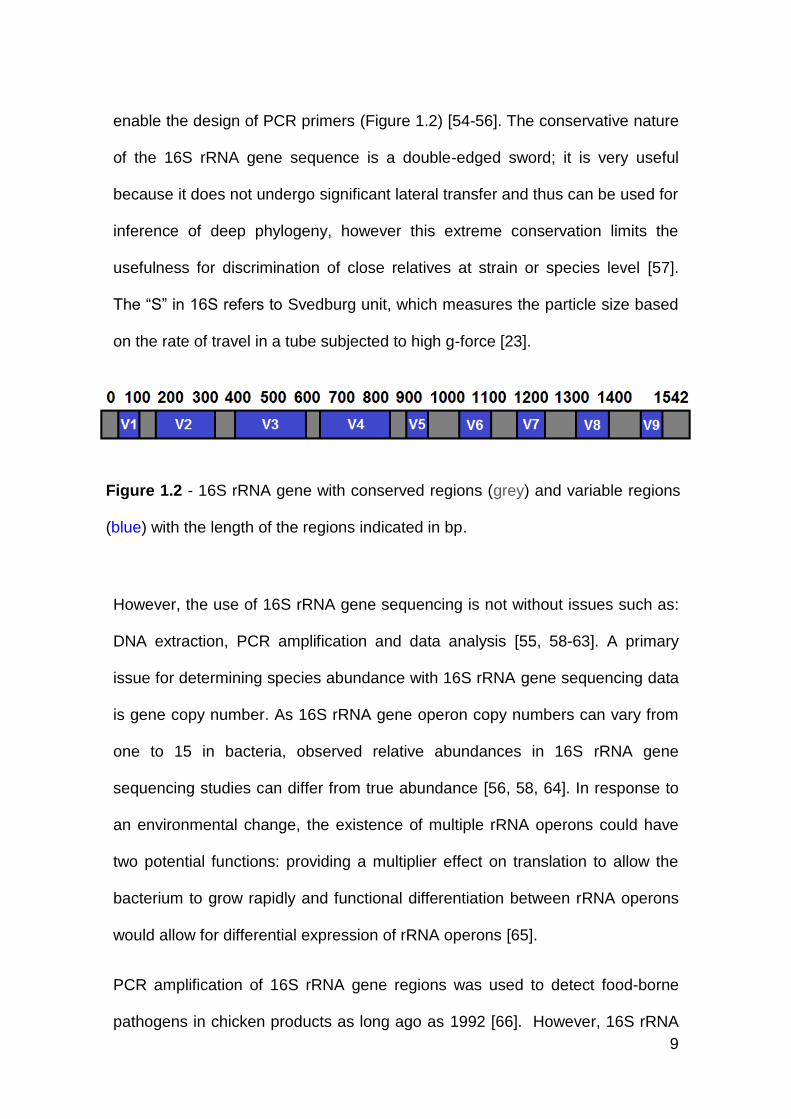
enable the design of PCR primers (Figure 1.2) [54-56]. The conservative nature
of the 16S rRNA gene sequence is a double-edged sword; it is very useful
because it does not undergo significant lateral transfer and thus can be used for
inference of deep phylogeny, however this extreme conservation limits the
usefulness for discrimination of close relatives at strain or species level [57].
The “S” in 16S refers to Svedburg unit, which measures the particle size based
on the rate of travel in a tube subjected to high g-force [23].
However, the use of 16S rRNA gene sequencing is not without issues such as:
DNA extraction, PCR amplification and data analysis [55, 58-63]. A primary
issue for determining species abundance with 16S rRNA gene sequencing data
is gene copy number. As 16S rRNA gene operon copy numbers can vary from
one to 15 in bacteria, observed relative abundances in 16S rRNA gene
sequencing studies can differ from true abundance [56, 58, 64]. In response to
an environmental change, the existence of multiple rRNA operons could have
two potential functions: providing a multiplier effect on translation to allow the
bacterium to grow rapidly and functional differentiation between rRNA operons
would allow for differential expression of rRNA operons [65].
PCR amplification of 16S rRNA gene regions was used to detect food-borne
pathogens in chicken products as long ago as 1992 [66]. However, 16S rRNA
Figure 1.2 - 16S rRNA gene with conserved regions (grey) and variable regions
(blue) with the length of the regions indicated in bp.
10
gene sequencing was not applied to the microbiota of chickens until 2002 by
Zhu et al. when they analysed the caecum of broilers [67].
The advent of high-throughput sequencing has enabled much deeper analyses
of the chicken gut microbiota, generating copious 16S rRNA gene sequences
and metagenome data [29, 60, 68].
Recent papers from Raoult’s group [25, 69] have argued for a return to culture-
based approaches, under the banner of “culturomics”. His group claims using
212 different culture conditions, in addition to matrix-assisted laser desorption
ionization time-of-flight (MALDI-TOF) mass-spectrometry, provides more
comprehensive results than DNA sequencing. The MALDI-TOF method
involves bacterial identification based on peptidic spectra and comparison to a
database [70]. They suggest that just 20 cultural conditions will result in 73%
total species isolation. From three human faecal samples, they obtained 32,500
colonies, which yielded 340 species. Of these, 174 have never been described
previously in the human-gut and 31 were completely novel species. This was
compared to sequencing on the Roche 454 FLX-Titanium platform. However, it
took three PhD students three years to isolate the colonies and the sequencing
technology used would now be considered under-powered and does not give a
true reflection on the sequencing resources that are now available.
However, it remains the case that a multi-pronged approach would almost
certainly provide the best census of the organisms present in the chicken gut
microbiota. Such an approach would combine the high speed, accuracy and
throughput generated with modern sequencing techniques with isolation of
11
organisms through culture to optimise discovery and combine genotypic and
phenotypic characterisation.
1.3.1 Microbial ecology
The advent of sequenced-based approaches allowed researchers to analyse
bacterial populations that were previously inaccessible due to their rarity or
inability to be cultivated in a laboratory [71]. However, this posed a new problem
of placing sequences (such as 16S rRNA gene sequences) within a bacterial
taxonomy. This resulted in two widely used methods of grouping sequences:
into operational taxonomic units (OTU) or phylotypes [71].
OTUs are defined as clusters of small subunits of the rRNA gene defined by
sequence similarity that can be used to provide estimates of microbial taxa,
while remaining theory-agnostic as to the definition of bacterial species [72].
Since Stackebrandt and Goebal’s influential paper in 1994, OTUs have most
often been defined with a cut-off of ≥97% nucleotide identity [73]. In that paper,
the authors compared the relatedness of 16S rRNA gene sequences to
standard DNA-DNA reannealing and stated that 16S rRNA sequences with
<97% identity are most likely a different species. However, they claimed that if
there is ≥97% identity then they can fall into the same species or different
species by previously accepted criteria [73, 74]. Therefore, whilst an OTU might
be considered a proxy for a species, there are various caveats to consider,
including:
12
Some named species have rRNA genes that share ≥97% identity
resulting in OTUs representing multiple species
Artefacts from read errors or chimeras may result in spurious OTUs
Single species can have multiple copies of the gene that are below
the 97% threshold thus causing the species to have more than one
representative OTU [75]
These factors can lead to the number of OTUs far exceeding the number of
expected species, although some errors can be corrected with the use of quality
filtering tools [76, 77].
Phylotyping involves defining reference taxonomic outlines to classify the
sequences to taxonomic bins. This often involves classifying a sequence
according to its relationship with cultured and characterised organisms.
However, this is problematic when organisms with the same phenotype belong
to different lineages and organisms that belong to the same species have
different phenotypes [71]. Another limitation of phylotyping is because it is
based upon previously cultured species, therefore there is often a lack of well-
defined taxonomy at genus and species level [71].
However, using an OTU-based method can overcome some of the limitations of
phylotyping. As a taxonomy outline is not used, the assignment of OTUs to bins
is not restricted by these outlines. Also, as methods for binning of OTUs are
based on clustering and not classification, the differentiation between two
sequences in the same OTU is dependent on other sequences in the dataset
thus remaining theory-agnostic [71].
13
There are a variety of statistical approaches to analysing sequencing data
representing species from an environment. Alpha-diversity is used to determine
the diversity within the sample and beta-diversity is used to determine the
difference in species composition between samples [74, 78, 79]. Rarefaction
curves are used to plot alpha-diversity found within a sample: for example, the
number of OTUs found in a set number of sequences. These are widely used to
establish whether a sample has been sequenced to the required depth to
observe all taxa and thus infer the total diversity of a sampled community [79].
Examples of alpha-diversity metrics commonly used are Chao1, Shannon and
Simpson [80]. These metrics have advantages and disadvantages:
Chao1 estimates species richness through the number of rare classes
present in a dataset which means it will overestimate the species
richness if there are lots of singletons [80, 81]
Simpson’s diversity index is a measure of the probability that two
individuals randomly selected from a sample will belong to the same
species (Gini-Simpson index is the probability they belong to different
species), taking into account richness and evenness. However, it is
weighted towards more abundant species [82-84]
The Shannon index (or Shannon entropy) quantifies the uncertainty in
the species identity of a randomly picked OTU from a dataset [85]
Beta-diversity is used to determine the distance or dissimilarity between
samples [86, 87]. Here, the Bray-Curtis method quantifies the compositional
dissimilarity between two samples, based on the counts at each site [86, 88].
Another method, UniFrac, measures the distance between samples based on
14
the lineages they contain. As it uses phylogeny, it is claimed to be more
powerful because it can exploit different degrees of similarity between
sequences [87].
Ecological theory has been applied to host metagenomes in an attempt to
explain and predict compositional variability between and within hosts [89]. The
late nineteenth century hypothesis of selection by the environment alone is now
considered too naïve due to the increased understanding of dispersal limitation
and diversification [89]. Metacommunity theory (an example of community
assemblage theory) looks at the world as distinct areas of suitable habitat
surrounded by unsuitable habitat. The theory is based upon predictions on the
traits of individual organisms, the rate and extent of dispersal and the difference
in conditions between the distinct areas. Using these predictions it enables the
user to calculate how much the host metagenome is influenced by local
adaptation or outside immigration [89].
1.4 Chicken gut microbiota
The microbiota of the chicken has been studied using both culture-dependent
techniques [90-93] and culture-independent techniques [2, 29, 68, 94]. Bacterial
colonisation of the gut of a chick is thought to occur soon after hatching when
the chick ingests food. However, other studies have shown that bacteria can
penetrate the eggshell prior to hatching and therefore colonisation may occur
earlier than thought [95, 96]. In 18-19-day embryos Bacillus was isolated from
the liver and large intestine and Enterococcus and Micrococcus from the gut
[93, 97, 98].
15
Ingested feed is exposed to acidic environments and pepsins in the
proventriculus and gizzard that results in a mostly sterile digesta. Furthermore,
as the digesta enters the duodenum, the rapid shift in pH produces additional
stress to any microbial survivors of gastric transit [99]. This is followed by the
introduction of bile acids, digestive enzymes, lecithin and lysozyme, which
provides an additional test to the remaining microbes. The result of these
stresses often means that the upper regions of the chicken-gut have a lower
bacterial load as the concentrations of pancreatic enzymes and highly active
enterocytes are most abundant there. However, as the digesta pass through the
gut, the concentration of enzymes and bile acids drop significantly due to
catabolisation and absorption. This results in a more hospitable environment for
any surviving bacteria to colonise and proliferate further down the gut [99].
1.4.1 Crop
The crop microbiota consists mainly of facultative anaerobic bacteria, primarily
Lactobacillus species, at 108 – 109 cfu/g (Figure 1.3) [12, 100]. Enterobacteria,
Gram-positive cocci and lactobacilli have been isolated from the digesta and
mucosa of the crop [100]. Guan et al. (2003) determined that the population of
lactobacilli changes readily during days one to seven. However, it stabilises
after 14-days post-hatch [101].
Lactobacillus species detected in the crop include: L. acidophilus, L. reuteri, L
crispatus, L. salivarius, L. fermentum, L. amylovorus, L. aviarius, L. johnsonii
and L. gallinarum [100, 101]. Other bacterial taxa isolated from the chicken crop
include Bifidobacterium, Micrococcus luteus, Staphylococcus lentus,
Enterobacter aerogenes, Pseudomonas aeruginosa, E. coli, E. fergunsonii,
16
Bacteroides, Eubacteriaceae, S. enterica and C. jejuni [11, 100, 102]. The crop
microbiota was found to be more similar to that of the duodenum rather than the
ileum and caecum after 40 days [103]. However, in another study that included
the gizzard, ileum, caecum and colon, the gizzard was found to have the most
similar microbiota to the crop (Figure 1.3) [104, 105].
Lactobacilli form an almost complete layer, 2-3 cells thick on the superficial
epithelium layers of the crop, irrespective of diet [12, 106]. Adherence occurs
through the carbohydrate components of the bacterial cell wall, with a ~7 nm
gap between bacteria and host cells, with no indication of migration through the
crop wall [12].
17
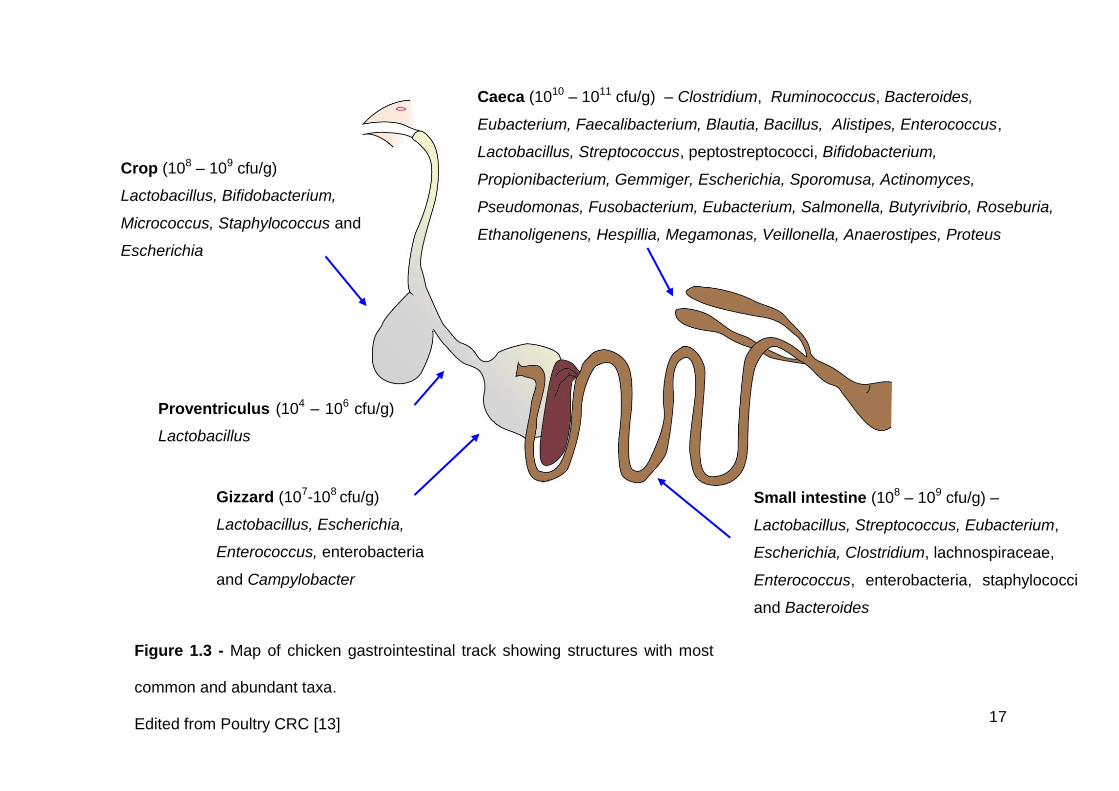
Figure 1.3 - Map of chicken gastrointestinal track showing structures with most
common and abundant taxa.
Edited from Poultry CRC [13]
Crop (108 – 109 cfu/g)
Lactobacillus, Bifidobacterium,
Micrococcus, Staphylococcus and
Escherichia
Proventriculus (104 – 106 cfu/g)
Lactobacillus
Gizzard (107-108 cfu/g)
Lactobacillus, Escherichia,
Enterococcus, enterobacteria
and Campylobacter
Small intestine (108 – 109 cfu/g) –
Lactobacillus, Streptococcus, Eubacterium,
Escherichia, Clostridium, lachnospiraceae,
Enterococcus, enterobacteria, staphylococci
and Bacteroides
Caeca (1010 – 1011 cfu/g) – Clostridium, Ruminococcus, Bacteroides,
Eubacterium, Faecalibacterium, Blautia, Bacillus, Alistipes, Enterococcus,
Lactobacillus, Streptococcus, peptostreptococci, Bifidobacterium,
Propionibacterium, Gemmiger, Escherichia, Sporomusa, Actinomyces,
Pseudomonas, Fusobacterium, Eubacterium, Salmonella, Butyrivibrio, Roseburia,
Ethanoligenens, Hespillia, Megamonas, Veillonella, Anaerostipes, Proteus
18
Colonisation of the crop by lactobacilli occurs within hours of the chick hatching
and remains throughout the life of the chicken [12]. New epithelial cells are
quickly re-colonised by bacteria from the lumen unless the chicken is starved,
which happens often prior to slaughter [12]. Fluctuations in bacterial population
size between meals are common due to the withdrawal of fermentable
carbohydrates that lactic acid-producing bacteria require to proliferate.
However, up to 106 lactobacilli can remain to inoculate and ferment the next
meal [12, 102].
The probiotic nature of lactobacilli is illustrated when they are eliminated from
the crop using high levels of penicillin; as a result coliforms increase from 105
cfu/g to 108 cfu/g[12]. Dominance by lactobacilli also confers a lower pH of 4.5,
which causes a bacteriostatic effect on E. coli and S. typhimurium and a
bactericidal effect for Enterococcus faecalis, Micrococci and vegetative cells of
Bacillus cereus [12].
1.4.2 Proventriculus
The microbiota of the chicken proventriculus is thought to be dominated by
lactobacilli, similar to that of the crop and gizzard (Figure 1.3) [44]. Whilst there
have been numerous culture-dependent and culture-independent studies on the
other organs of the chicken gut [2, 12, 19, 29, 60, 90-93, 101, 104, 107-112],
only a single study has been published on the proventriculus [106], which
reported 104 – 106 cfu/g of bacteria. The majority of these were lactobacilli, but
unlike in the crop, the lactobacilli appeared not to adhere to the epithelium of
the proventriculus.
19
1.4.3 Gizzard
The microbiota of the gizzard is closely related to that of the crop and is
dominated by lactobacilli and Clostridiaceae (Figure 1.3) [104, 105]. Multiple
studies by Engberg et al. found L. salivarius in considerable numbers, in
addition to non-lactose fermenting, coliform bacteria, enterococci and other
Lactobacillus species [109-111]. Total cfu/g counts in the gizzard have been
recorded as 103 for aerobic bacteria, 102 for coliforms, 102-104 for E. coli, 102 for
Campylobacter, 106-107 for lactobacilli, 105 for Enterococcus with a sum total of
107-108 [11, 109-111, 113]; Clostridium perfringens levels were found to be
below 103 cfu/g in the gizzard [109]. Influx of acid from the proventriculus lowers
bacterial counts and pathogen levels in the gizzard, compared to the crop, with
significantly lower levels of total aerobic bacteria, Campylobacter, E. coli and
coliform bacteria [11].
The type of feed ingested by the bird can affect the numbers of bacteria present
in the gizzard. Broilers fed whole-wheat diets had a significant reduction in
anaerobic bacteria, lactose-negative enterobacteria and enterococci, whereas
pellet fed broilers experienced a shift from L. salivarius dominance to a mixture
of lactobacilli species [109, 110].
1.4.4 Small intestine
Lactobacilli also dominate the microbiota of the small intestine, which increase
in abundance from proximal to distal (Table 1.1) [114]. Low pH, short transit
time and pancreatic and bile secretions all account for the reduced microbial
abundance in the duodenum [100]. Deconjugation of bile acids and reduced
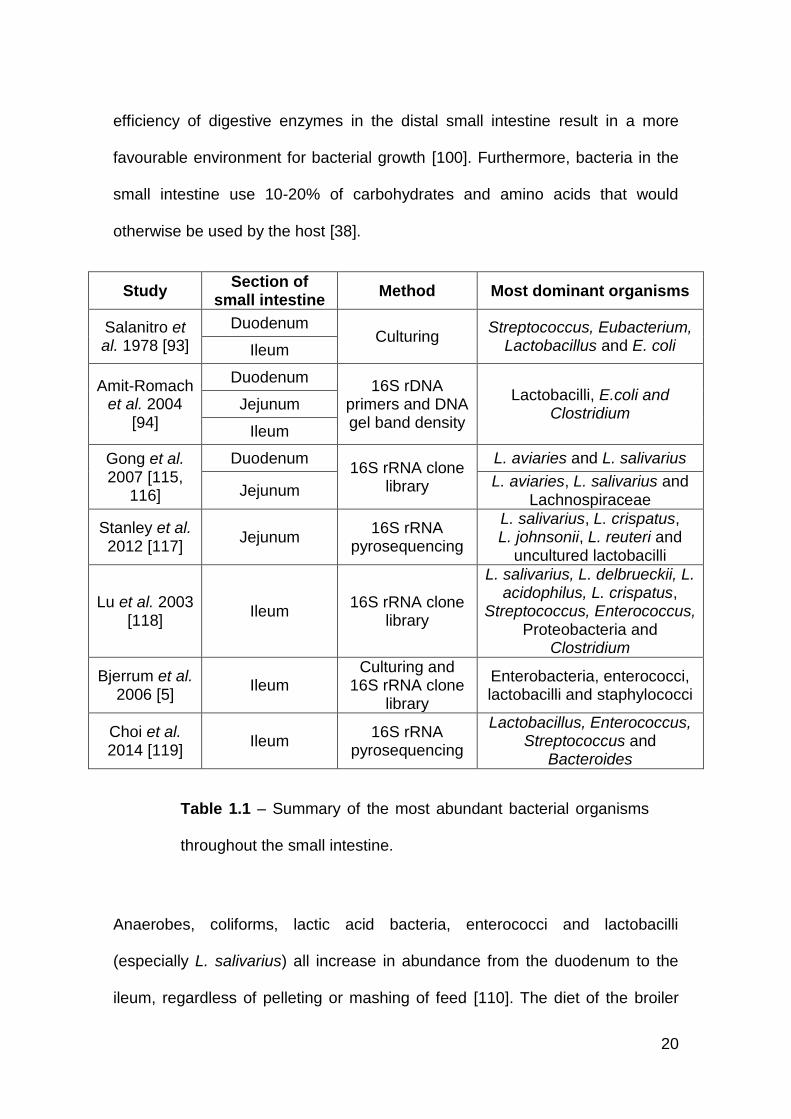
20
efficiency of digestive enzymes in the distal small intestine result in a more
favourable environment for bacterial growth [100]. Furthermore, bacteria in the
small intestine use 10-20% of carbohydrates and amino acids that would
otherwise be used by the host [38].
Study Section of
small intestine Method Most dominant organisms
Salanitro et al. 1978 [93]
Duodenum Culturing
Streptococcus, Eubacterium, Lactobacillus and E. coli Ileum
Amit-Romach et al. 2004
[94]
Duodenum 16S rDNA
primers and DNA gel band density
Lactobacilli, E.coli and Clostridium
Jejunum
Ileum
Gong et al. 2007 [115,
116]
Duodenum 16S rRNA clone
library
L. aviaries and L. salivarius
Jejunum L. aviaries, L. salivarius and
Lachnospiraceae
Stanley et al. 2012 [117]
Jejunum 16S rRNA
pyrosequencing
L. salivarius, L. crispatus, L. johnsonii, L. reuteri and
uncultured lactobacilli
Lu et al. 2003 [118]
Ileum 16S rRNA clone
library
L. salivarius, L. delbrueckii, L. acidophilus, L. crispatus,
Streptococcus, Enterococcus, Proteobacteria and
Clostridium
Bjerrum et al. 2006 [5]
Ileum Culturing and
16S rRNA clone library
Enterobacteria, enterococci, lactobacilli and staphylococci
Choi et al. 2014 [119]
Ileum 16S rRNA
pyrosequencing
Lactobacillus, Enterococcus, Streptococcus and
Bacteroides
Anaerobes, coliforms, lactic acid bacteria, enterococci and lactobacilli
(especially L. salivarius) all increase in abundance from the duodenum to the
ileum, regardless of pelleting or mashing of feed [110]. The diet of the broiler
Table 1.1 – Summary of the most abundant bacterial organisms
throughout the small intestine.
21
has been shown to affect the microbiota of the ileum, with pellet-fed broilers
containing more coliform bacteria, enterococci and C. perfringens compared to
whole wheat fed broilers [109, 110]. Supplementation with xylanase in the
broiler diet significantly increased anaerobic counts and lactic acid bacteria in
the jejunum and increased the abundance of lactic acid in the ileum [109]. No
Lactobacillus species have been found to be significantly abundant between
high and low food-conversion-ratio (FCR) chickens [117].
1.4.5 Caeca
The caecal microbiota is the best-documented microbial community within the
chicken gut. It is also the most abundant: at two weeks post-hatch the
microbiota reaches 1011 cfu/g and is maintained at this level until at least six
and a half weeks of age [90, 120]. Isolation of organisms from the caecal
microbiota is difficult because 90% of them are facultative or obligate
anaerobes, which often require exacting culture conditions [91, 94].
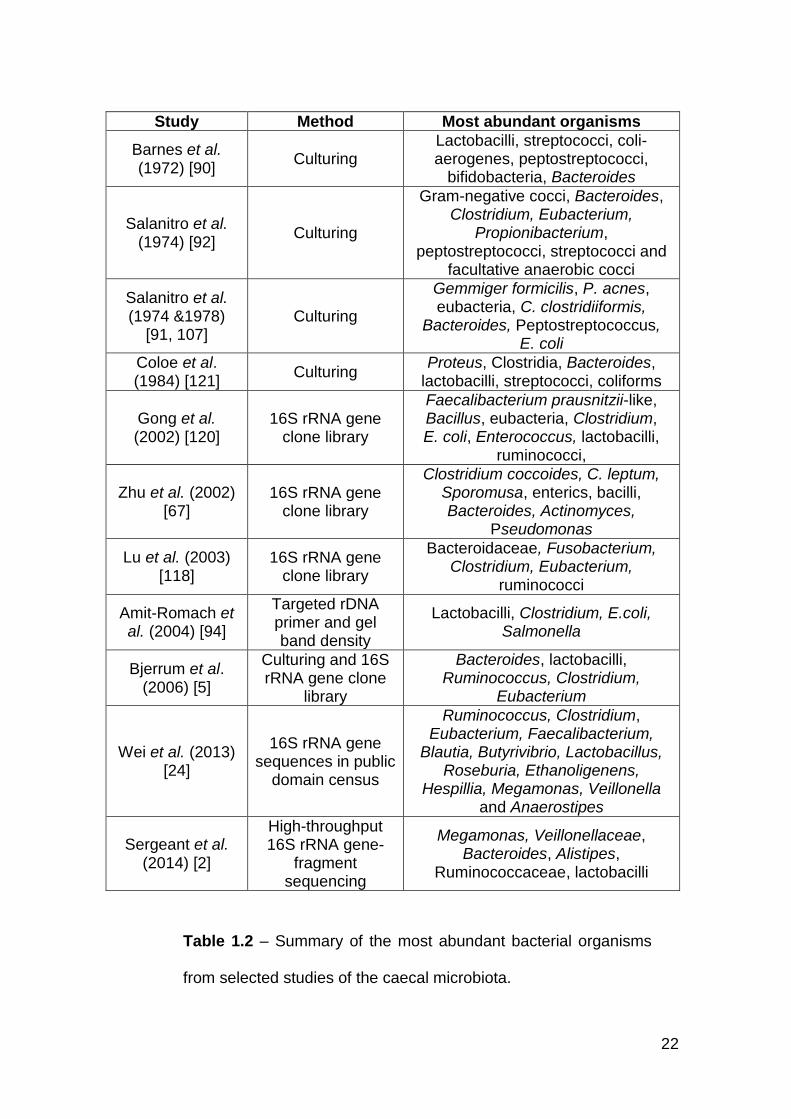
In a pioneering study by Barnes (1972), it was estimated that only a quarter of
the microbiota could be isolated. They found that the majority were strict
anaerobes, with counts of lactobacilli, streptococci, and coli-aerogenes
fluctuating between 105 and 108 cfu/g [90]. At two weeks, peptostreptococci
formed approximately 30% of the population. However, as the broilers matured
the levels dropped to 9% and at four weeks, bifidobacteria and Bacteroides
began to proliferate [90]. Since then, there have been several other reports
documenting the constituents of the chicken caecal microbiota (Table 1.2).
22
Study Method Most abundant organisms
Barnes et al. (1972) [90]
Culturing Lactobacilli, streptococci, coli-aerogenes, peptostreptococci,
bifidobacteria, Bacteroides
Salanitro et al. (1974) [92]
Culturing
Gram-negative cocci, Bacteroides, Clostridium, Eubacterium,
Propionibacterium, peptostreptococci, streptococci and
facultative anaerobic cocci
Salanitro et al. (1974 &1978)
[91, 107] Culturing
Gemmiger formicilis, P. acnes, eubacteria, C. clostridiiformis,
Bacteroides, Peptostreptococcus, E. coli
Coloe et al. (1984) [121]
Culturing Proteus, Clostridia, Bacteroides,
lactobacilli, streptococci, coliforms
Gong et al. (2002) [120]
16S rRNA gene clone library
Faecalibacterium prausnitzii-like, Bacillus, eubacteria, Clostridium, E. coli, Enterococcus, lactobacilli,
ruminococci,
Zhu et al. (2002) [67]
16S rRNA gene clone library
Clostridium coccoides, C. leptum, Sporomusa, enterics, bacilli, Bacteroides, Actinomyces,
Pseudomonas
Lu et al. (2003) [118]
16S rRNA gene clone library
Bacteroidaceae, Fusobacterium, Clostridium, Eubacterium,
ruminococci
Amit-Romach et al. (2004) [94]
Targeted rDNA primer and gel band density
Lactobacilli, Clostridium, E.coli, Salmonella
Bjerrum et al. (2006) [5]
Culturing and 16S rRNA gene clone
library
Bacteroides, lactobacilli, Ruminococcus, Clostridium,
Eubacterium
Wei et al. (2013) [24]
16S rRNA gene sequences in public
domain census
Ruminococcus, Clostridium, Eubacterium, Faecalibacterium,
Blautia, Butyrivibrio, Lactobacillus, Roseburia, Ethanoligenens,
Hespillia, Megamonas, Veillonella and Anaerostipes
Sergeant et al. (2014) [2]
High-throughput 16S rRNA gene-
fragment sequencing
Megamonas, Veillonellaceae, Bacteroides, Alistipes,
Ruminococcaceae, lactobacilli
Table 1.2 – Summary of the most abundant bacterial organisms
from selected studies of the caecal microbiota.
23
In the first culture-independent studies of the caecal microbiota, 25-72% of 16S
rRNA gene sequences showed <95% homology to 16S rRNA gene sequences
in BLASTN, compared to only 4% in the ileum [67, 116, 120]. A study into the
diversity of succession of the caecal microbiota found significant differences in
the population between three to seven days, 14 to 28 days and at 49 days. A
series of successions from a transient community occurred in the young
chickens and slowly moved to a more complex population with age. The caecal
population was a subset of the ileum population until 14 days, when they
became significantly different [118].
In a study of organic and conventional broiler chickens using both culture-
dependent and culture-independent techniques in 2006, it was found there were
significantly more lactose-negative enterobacteria and enterococci in the
conventional broiler chickens. Using the Shannon index, they determined the
organic broiler caecal samples were more diverse than the conventional broilers
[5].
In an overview study of chicken caecum microbiota sequences in the public
domain, Wei et al. (2013) estimated there could be 530-903 OTUs within the
caecal microbiota and over 4,500 16S rRNA gene sequences would be required
to achieve 99% of the diversity [24].
Recent advances in high-throughput DNA sequencing technology have allowed
for deeper sequencing of the caecal microbiota. Sergeant et al. (2014)
generated 414,070 16S rRNA gene-fragment sequences that were represented
by 699 OTUs [2]. Using saturated rarefaction curves they established there
were 200-350 OTUs in each chicken. Furthermore, 232 of the OTUs identified
24
showed <97% 16S rRNA gene sequence similarity to 16S rRNA gene
sequences in GenBank and therefore could be novel species. This study found
Megamonas was the most abundant genus, having over five times the number
of 16S rRNA gene sequences as the next most abundant genus. Unnamed
species from the Veillonellaceae, Bacteroides, Alistipes and Ruminococcaceae
were in the top five most abundant organisms and two Lactobacillus OTUs were
in the top ten. This has been the only study to report Megamonas as the most
abundant genus. This genus belongs to an unusual class, the Negativicutes,
which sit within the Firmicutes, yet possess a Gram-negative cell envelope.
However, Zhu et al. (2002) did report high levels of Sporomusa, which also sits
within the Negativicutes [2, 67].
The diet of a broiler is the strongest determinant of caecal microbiota in modern
farming [122]. It has been suggested that the treatment and conditioning of the
raw material affects the characteristics of the substrates for use by the
microbiota [122]. The type of grain fed to broilers also has an effect on the
microbiota, with corn-based diets selecting for low G+C bacteria (clostridia,
enterococci and lactobacilli) and wheat based diets selecting for high G+C
bacteria (bifidobacteria) [38]. In another study into the influence of xylanase and
whole wheat fed to broilers, Clostridium perfringens and enterococci levels
dropped in those fed whole wheat. However, levels of anaerobic bacteria,
coliform bacteria, lactose-negative enterobacteria and lactobacilli showed no
significant changes in abundance after feeding with whole-wheat or xylanase
[109].
25
The presence of lactobacilli in the chicken caeca is antagonistic against
Campylobacter jejuni and C. coli [123]. Of 150 lactic acid bacteria that were
isolated from the chicken caeca, three L. salivarius strains were shown to have
bacteriocins effective against C. jejuni and C. coli. This shows the potential of
these strains to be used as probiotics to combat the growth of pathogens [123].
In a study of three chicken trials, 30.3% of OTUs were differentially abundant
between the trials [124]. The chickens were sourced from the same hatchery,
fed the same diet and reared in very similar conditions; however there was a
high degree of variability in the microbiota between the trial flocks. They found
that Lactobacillus, Clostridium and Bacteroides generated the largest
differences between the flocks [124]. This level of variability between chickens
kept in very similar conditions could explain why both culture-dependent and
culture-independent studies find differences in the absolute and relative
abundances of organisms, even before methodological differences in analysis
are considered a source of variance [105, 124].
Although harvesting of caecal contents post-mortem is considered the gold
standard in sampling this microbiota, this requires sacrificing of the bird and so
prevents prolonged monitoring of temporal changes within the bird. To see if
this problem would be avoided by use of faecal samples, the caecal and faecal
microbiota were compared and quantitative differences were found [125]. Of the
OTUs sequenced, 88.55% were shared and these represented 99.25% of all
16S rRNA gene sequences. There were more lactobacilli in the faeces, which
was probably a result of small intestine origin. The study also found no
statistically significant differences between the microbiota of caecal pairs, as
26
previously reported by Sergeant et al. (2014) [2, 125]. It was concluded that
faecal samples could not be used as a substitute for caecal microbiota
sampling, at least not without much greater sequencing depth [125]. And even
though the same species might be detected in both samples, the communities
had different alpha and beta-diversity values, which is unlikely to change with
increased sequencing depth [125].
1.4.6 Non-bacterial organisms within the chicken gut
Bacteria are the most diverse and abundant form of life in the chicken gut.
However, the chicken gut is host to microorganisms other than bacteria, albeit
in low abundance [113]. Methanogenic archaea have been identified in the
chicken caeca at levels of 104-108/g [29, 126, 127]. The abundance of archaea
has found to increase with age, starting at three days; litter and flies were
identified as a potential source of colonisation [126]. In a metagenomic study of
two chicken caecal samples, 0.12-0.16% of the sequences were assigned to
viruses, 0.8-1.1% were archaea (mainly methanogenic) and 0.1-0.2% were
fungi; similar ratios were reported by Sergeant et al. (2014) [2, 29]. Archaea are
more abundant in chickens that have been fed growth-promoter antibiotics with
one study finding up to 2.2% of reads were assigned to archaea [68].
The levels of fungi detected in the chicken gut increase with age and are more
common in the small intestine than the caeca [29, 128]. There were 50 fungal
isolates that were assigned to Aspergillus fumigatus, A. niger, Chrysonilia
crassa, Mucor circinelloides, Rhizopus oligosporus and R. oryzae [128].
27
Protozoan parasites within the Eimeria genus are often present in the
environment where the chickens are raised and these disease causing
organisms are often found in chickens [129].
1.5 The caecal metagenome
The first study of the chicken caecal metagenome in 2008, utilised 454
pyrosequencing to generate over 530,000 sequences and almost 200,000
environmental gene tags (EGTs) [29]. The majority of these were linked to
carbohydrate metabolism with few respiratory genes present, representing the
anaerobic environment of the caecum. In addition, virulence genes were also
abundant; the majority of these (55-57%) were antibiotic resistant genes, with
tetracycline and fluoroquinolones being most common. These classes of
antibiotics are most common due to their routine use as antibiotic growth
promoters until they were phased out in the EU between 2000 and 2005 [29]. In
comparison to the human gut, mouse caecum and bovine rumen microbiomes,
chicken and bovine microbiomes had lower abundances of invasion and
intracellular resistance, prophage transposons and adhesion EGTs. However,
there was no difference in the abundance of toxins and super-antigens,
resistance to toxins and antibiotics and iron scavenging subsystems [29].
In a study of the caecal microbiome in response to anticoccidial and growth
promoter treatment, they found enrichments of type IV secretion system genes,
transport system genes and type I fimbrial genes, however no significant
differences in antibiotic resistance gene counts [68]. The most prevalent
functional groups were assigned to protein metabolism, amino acid synthesis
28
and carbohydrate utilisation. The significant enrichment of type I pili was
probably due to the proliferation of E. coli in the monensin/tylosin and
monensin/virginiamycin treatments, as the majority of the pili reads were similar
to those found in E. coli [68].
Similarly to previous studies, Sergeant et al. (2014) discovered a large
proportion of genes involved in carbohydrate metabolism [2]. As the caecum villi
exclude less soluble, large polymers the number of cellulases and
endohemicellulases accounted for 4% of the total reads, in comparison to 38%
of reads assigned to oligosaccharide degrading enzymes. Bacitracin and
tetracycline were the most common predicted antibiotic resistance genes [2].
1.6 Role of the microbiota in health and disease
There are many interactions between host, microbes and digesta within the gut
[9]. The microbiota of the intestine form a protective barrier against pathogenic
bacteria, preventing them from attaching to the host cells through competitive
exclusion [130]. Enteric pathogens are a concern to the poultry industry due to
production losses, reduced welfare of birds, increased mortality of birds and risk
of contamination to products for human consumption (zoonosis) [131]. Zoonosis
is the transmission of infectious diseases between animals and zoonotic
bacterial pathogens can have detrimental effects on food safety, animal
production and most importantly public health [132].
Using normal, germ-free and gnotobiotic mice, it was determined that the
commensal gut bacteria and enteric viruses stimulate normal development of
29
the humoral and cellular mucosal immune systems [133]. Interactions between
the mucosal immune system and gut microbiota maintain a normal level of
inflammation throughout the life of a host [133]. Germ-free animals have a
series of defects in gut-associated lymphoid tissues and antibody production
than their colonised counterparts [134]. Furthermore, germ-free animals have a
much slower turnover of intestinal epithelial cells (which line the gut and form a
protective layer to the digesta) and an altered microvilli formation. This leads to
decreased immune resistance and increased mortality when challenged with an
enteric pathogen, something that is not observed in colonised animals [134].
A mechanism of pathogen-load control is the secretion of compounds that make
the environment unfavourable for colonisation such as volatile fatty acids or
bacteriocins [12, 123, 135]. The use of probiotics such as lactobacilli can have
stimulatory effects of butyrate producing species and also re-establish balance
in the gut [136].
As broilers are harvested whilst juvenile and immature there have been studies
to develop and administer either single species or complex mixtures of bacterial
species to newly hatched chicks from mature chickens [105]. It was found by
Zhu et al. (2002) that only a complex mix of bacteria could supress Salmonella.
However, they were unable to identify which species conferred the inhibition
[67]. It has been demonstrated that colonisation of a pathogenic species can
lead to preferable conditions for other pathogens. However, the presence of a
pathogen in a healthy chicken does not always result in colonisation, significant
changes in diversity or community structure [137, 138].
30
Necrotic enteritis was first described and attributed to Clostridium welchii (now
C. perfringens) by Parish in 1961, when a large group of cockerels died after
moving to a new location. Parish noted general signs of malaise and loss of
appetite for three days, culminating in no food ingestion for 24 hours before
death [139]. Necrotic enteritis levels dramatically increased after the banning of
antibiotic growth promoters, showing they had a prophylactic effect in controlling
the disease [140]. The spores of C. perfringens are ubiquitous in the
environment and are therefore ingested via poultry feed regularly. However, it is
thought that other predisposing factors such as high non-starch polysaccharides
content and coccidiosis are required to cause disease [110, 131, 140, 141]. The
cost of necrotic enteritis was estimated at $2 billion per year to the poultry
industry in control measures and productivity losses [137, 142]. In a study of
caecal microbiota in the birds that were challenged with C. perfringens, it was
found that butyrate producers (Eubacterium species) were reduced in
abundance in addition to Weisella species. Unclassified species in Mollicutes
experienced a 3.7 fold increase in abundance and necrotic enteritis lesions
were witnessed [137].
Coccidiosis has been studied in domesticated animals for over a century and
the cost of the disease was estimated to be over £38 million in the UK alone in
1995 [143, 144]. Mortality, interruption of digestive processes and nutrient
absorption, increased susceptibility to other diseases (such as necrotic enteritis)
and reduced weight gain is caused by the multiplication of protozoan parasites
within the Eimeria genus. The severity of the lesions caused by the disease are
dependent on the number of oocysts ingested [141, 143].
31
C. jejuni is the most common cause of food-borne disease in the developed
world [145, 146]. The transmission of Campylobacter is primarily through broiler
flocks due to faecal shedding and coprophagia. However, it can also occur
through feed and water [145, 147]. Broiler breed shows no significant impact on
C. jejuni levels in the caeca [145]. In chickens, C. jejuni colonises the mucus of
the epithelial cells primarily in the small intestine and caeca and is thought to be
a commensal of the microbiota [145, 147]. However, it has been shown to
cause intestinal inflammation and diarrhoea, leading to health issues with the
feet and legs of the chicken [145].
The microbiota of high feed-conversion ratio (FCR) and low FCR birds have
been compared in an attempt to identify the species that are more abundant in
the high FCR birds [105, 117]. In a study of faeces from high and low FCR
birds, it was found that eight families, including Fusobacteriaceae and
Clostridiales family Incertae Sedis XIII (uncertain placement), were linked with
high FCR and six were linked with low FCR birds, including Rikenellaceae,
Enterobacteriaceae and Ruminococcaceae [148]. Butyrate producers and
cellulose degraders in the caecum have been associated with high FCR
chickens on multiple occasions [117, 124, 149].
1.7 Antibiotic growth promoters and antibiotic
resistance
In 1946, Moore et al. fed chickens low levels of streptomycin and witnessed
increased growth, noting decreased levels of coliform bacteria in the caeca
32
[150]. However, they failed to make the connection between increased growth
with its significance for food animal production [151]. It was not until the
inadvertent discovery in 1950 that feeding chickens fermentation waste from
cyclotetracycline production as a source of vitamin B12, led to improved weight
gain and reduction in amount of feed required to bring the broilers to market
weight [151, 152]. Antibiotics were shown to have similar effects in other
livestock such as cattle and swine [151, 153, 154].
The suggested mechanisms of antimicrobial growth promoters include
suppressing unrecognised infections, decreasing the microbial production of
metabolites such as toxins, reducing the microbial destruction of essential
nutrients, increased absorption of nutrients by the host because of a thinner
intestinal wall and reducing the microbial-load of the chicken, thus reducing the
competition for nutrients [155, 156].
The Netherthorpe report (1962) and later the Swann report (1969) into the use
of antibiotics in animal husbandry and veterinary medicine in the UK highlighted
the hazards posed by administration of antibiotics to livestock to human and
animal health through the emergence of antibiotic resistant bacteria. It
suggested the classification of certain antibiotics should be either “feed” or
“therapeutic” to reduce the hazards to human health of resistance to clinically
important antibiotics [157, 158].
The addition of growth-promoting antimicrobials to feed of livestock has been
common practice worldwide, until recently. The use of antibiotics as growth-
promoters in agriculture was banned in the EU in a two part process in 2005
and has also been restricted in North America [4, 159] due to fears of increased
33
antibiotic resistance in human pathogens. It was presumed that the removal of
antibiotic growth-promoters would reduce exposure of bacteria to the antibiotic,
thus decreasing the chance of resistance and the spread to humans via the
food chain. This was demonstrated in Denmark where 105 tonnes were used
for growth promotion in 1996 and was reduced to none in 2000 [160]. This
resulted in a marked reduction of resistance to avoparcin, macrolides and
virginiamycin in enterococci [160, 161].
However, the removal of the growth promoters, which acted as a prophylaxis,
has resulted in an increase of some therapeutic drug treatments in livestock
[161]. The use of total therapeutic antibiotics for poultry in the UK has gone up
from 15 tonnes in 2005 (before the ban) to 60 tonnes in 2010. However, this
remains much lower than the total amount used as growth promoters previously
[4, 161, 162].
Infections caused by multi-drug resistant bacteria are a global health problem
and is becoming increasingly more difficult with the emergence of multi-drug
resistant organisms [163, 164]. A route by which pathogens can acquire
antibiotic resistance genes is through the resistance reservoir present in the
microbiota of healthy hosts [163, 165]. However, a study into 30,000-year-old
permafrost sediments identified multiple antibiotic resistance genes, therefore
suggesting resistance is a naturally occurring event and not only due to overuse
[166].
Characterisation of the antibiotic resistance reservoir in the human microbiota
uncovered 95 unique functional resistance genes to 13 antibiotics, suggesting
the microbiota could contribute to the further emergence of multi-drug resistant
34
pathogens [163]. A similar study investigated the chicken gut microbiome of two
free-range chickens and two chickens raised with feed containing antibiotics. 13
antibiotic resistance genes were identified; 11 from the chickens fed antibiotics.
This was a much smaller study than the human microbiota, testing against only
six antibiotics and using a clone library orders of magnitude smaller [132].
Antibiotic resistance has been found in common human and animal microbiota
organisms. These include E. coli and enterococci [167-169] and disease
causing organisms such as Campylobacter and Salmonella [170, 171]. They
have been found within the chicken gut on multiple occasions and antibiotic
resistance is common within caecal microbiome studies [2, 29, 68].
1.8 Enzymes in the chicken diet
1.8.1 Anti-nutritional effects of dietary non-starch
polysaccharides in chickens
The diet of a chicken often consists of wheat, rye, barley, corn and sorghum
cereals and the cell wall of these grains and cereals primarily consist of
complex carbohydrates that are referred to as non-starch polysaccharides
(NSPs) [172]. These NSPs were originally thought to provide the chicken with
small nutritional contributions; however, it has been shown that the water-
soluble NSPs have an anti-nutritional effect even when in minute quantities
[173, 174]. This is because chickens lack the endogenous enzymes to
effectively cleave and digest NSPs. The glycosidic bonds in dietary NSPs such
as arabinoxylans, β-glucans, cellulose or pectic polysaccharides can only be
35
cleaved by enzymes derived from microbes [175]. β-glucans have been
isolated from barley and fed to broilers, which led to a decrease in the rate of
growth in addition to an increase in the viscosity of the digesta. Furthermore, it
was demonstrated that the β-glucan polymer passes through the chicken-gut
unchanged [173]. The anti-nutritional effects of the NSPs fall within three main
areas; increase in intestinal viscosity, nutrient encapsulation and interaction with
the intestinal microbiota.
1.8.2 Increase in intestinal viscosity
The β-glucans from barley and the arabinoxylans from the cell wall in cereals
such as wheat and rye form viscous solutions when dissolved in water. The
ability of these polysaccharides to form gels when mixed with fluid results in
increased viscosity in the gut of the chicken [176]. The level of viscosity
conferred by the NSP is determined by factors such as water solubility, how
they are bound to other cell wall constituents, the presence of a charged group,
the size of the molecule, the concentration and whether it is branched or linear.
The high viscosity in the small intestine caused by the NSPs results in reduced
digestion, absorption of protein, fat and starch [175]. The reduction in the
nutrient absorption efficiency that causes depressed growth performance has
been reported in diets containing barley, wheat or rye [177-179].
The presence of viscous polysaccharides has been shown to diminish glucose
and salt diffusion [178]. It has been speculated that this is because digestion is
dependent on the diffusion of enzymes and substrates and any hindrance to
movement of these molecules will lead to a decrease in the efficiency of the
36
process [180]. It has been shown in rats that the addition of NSPs inhibits
absorption of nutrients by increasing the relative thickness of the unstirred water
layer, making it more difficult for the nutrients to diffuse through and reach the
epithelium [181]. Viscous polysaccharides have been shown to depress lipid
digestibility more than protein or starch. This is thought to be a consequence of
bacterial overgrowth in the small intestine and the subsequent deconjugation of
bile acids, thus resulting in reduced efficacy in solubilising lipids. Furthermore, it
has been confirmed that the addition of carboxymethylcellulose (CMC), a non-
fermentable gelling fibre, resulted in a decline in the digestion of lipids by
decreasing the concentration of bile acids present in the chyme [182, 183].
Mathlouthi (2002) demonstrated that NSPs caused increased viscosity in the
small intestine, which resulted in reduction of sodium and glucose transport,
release of bile acids and pancreatic enzymes [174].
1.8.3 Nutrient encapsulation
Wheat consists of a bran layer (including aleurone), the endosperm and the
germ (Figure 1.4). The aleurone layer contains tightly packed proteins, vitamins
and minerals; but is protected by a tough pericarp and seed coat layer. The
aleurone layer consists of cells with thick walls that protect the endosperm,
which contains starch and protein. Therefore, for the chicken to release the
nutrients within the layers, it has to have an effective enzyme suite [99, 184].
The grinding of the grains in the gizzard can cause rupture of the endosperm
cell walls and hence aid digestion. However, some of the grains remain
untouched after being consumed. This means the grains will escape digestion
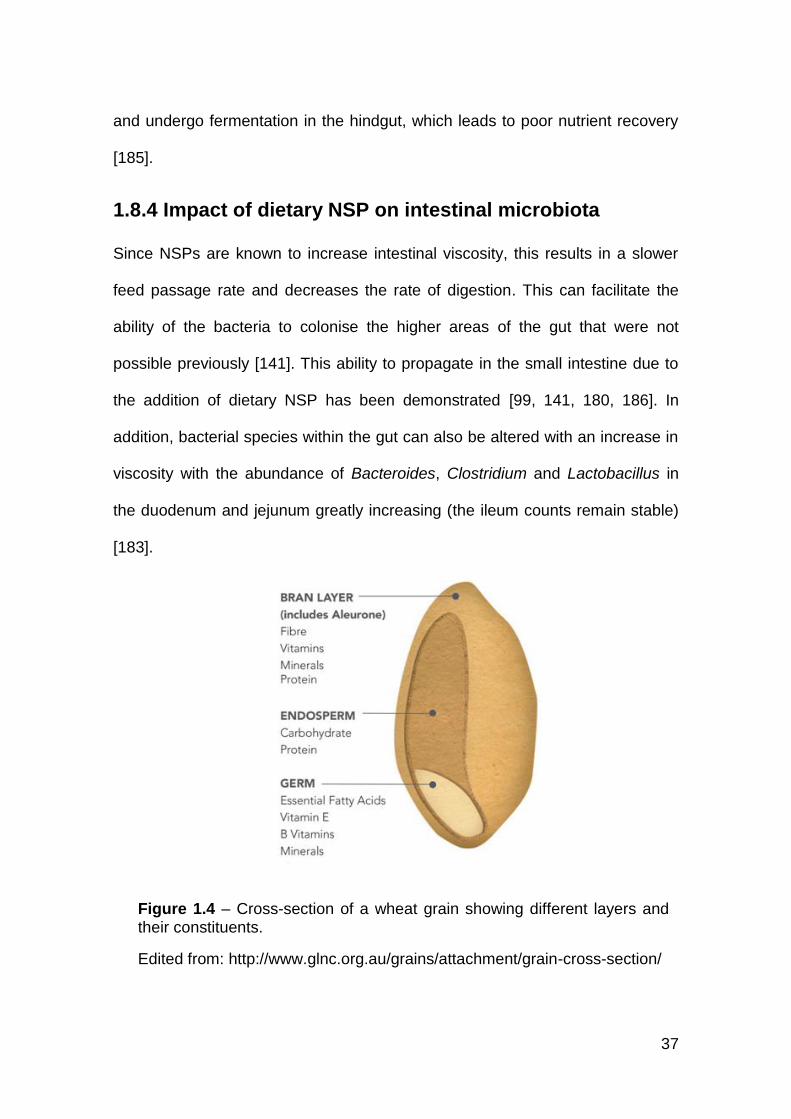
37
and undergo fermentation in the hindgut, which leads to poor nutrient recovery
[185].
1.8.4 Impact of dietary NSP on intestinal microbiota
Since NSPs are known to increase intestinal viscosity, this results in a slower
feed passage rate and decreases the rate of digestion. This can facilitate the
ability of the bacteria to colonise the higher areas of the gut that were not
possible previously [141]. This ability to propagate in the small intestine due to
the addition of dietary NSP has been demonstrated [99, 141, 180, 186]. In
addition, bacterial species within the gut can also be altered with an increase in
viscosity with the abundance of Bacteroides, Clostridium and Lactobacillus in
the duodenum and jejunum greatly increasing (the ileum counts remain stable)
[183].
Figure 1.4 – Cross-section of a wheat grain showing different layers and their constituents.
Edited from: http://www.glnc.org.au/grains/attachment/grain-cross-section/
38
1.8.5 Adverse effects of intestinal bacteria on nutrient
utilisation
Bacteria within the gut can have positive effects on the host such as the
production of volatile fatty acids, polyamines and other nutrients [18, 183]. This
has stimulatory effects on the intestinal mucosa by increasing the rate of
secretion [18, 183, 187]. However, the presence of bacteria in the gut also
leads to competition with the host for nutrients and the stimulation of rapid
epithelial cell turnover, which leads to great energy costs for the host [141].
The ability of inhabiting bacterial species such as Lactobacillus,
Bifidobacterium, Bacteroides, Enterococcus and Clostridium to cause the
deconjugation of bile salts by hydrolysing the amide bond allows other species
of bacteria to proliferate that would otherwise be unable to [141, 188]. In
addition, chickens that have been kept germ-free show a greater FCR, less
endogenous nitrogen loss and better absorption of lipids [189, 190].
1.9 Dietary supplementation with NSP-degrading
enzymes
1.9.1 Mode of action of NSP-degrading enzymes
The multiple large polymers within NSPs form a viscous, mesh-like structure
[184]. The addition of NSP-degrading enzymes aids the digestion of large
polymers into shorter, unentangled fragments, thereby drastically reducing the
intestinal viscosity. Enzymatic depolymerisation yields multiple products,
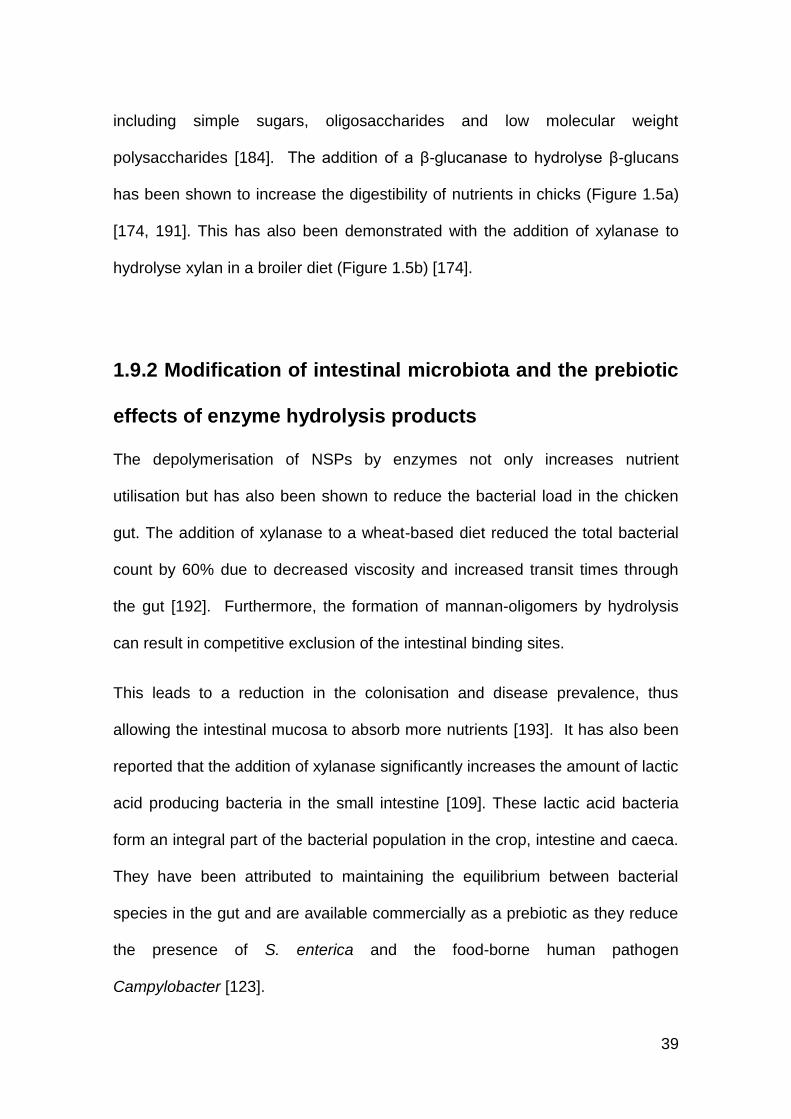
39
including simple sugars, oligosaccharides and low molecular weight
polysaccharides [184]. The addition of a β-glucanase to hydrolyse β-glucans
has been shown to increase the digestibility of nutrients in chicks (Figure 1.5a)
[174, 191]. This has also been demonstrated with the addition of xylanase to
hydrolyse xylan in a broiler diet (Figure 1.5b) [174].
1.9.2 Modification of intestinal microbiota and the prebiotic
effects of enzyme hydrolysis products
The depolymerisation of NSPs by enzymes not only increases nutrient
utilisation but has also been shown to reduce the bacterial load in the chicken
gut. The addition of xylanase to a wheat-based diet reduced the total bacterial
count by 60% due to decreased viscosity and increased transit times through
the gut [192]. Furthermore, the formation of mannan-oligomers by hydrolysis
can result in competitive exclusion of the intestinal binding sites.
This leads to a reduction in the colonisation and disease prevalence, thus
allowing the intestinal mucosa to absorb more nutrients [193]. It has also been
reported that the addition of xylanase significantly increases the amount of lactic
acid producing bacteria in the small intestine [109]. These lactic acid bacteria
form an integral part of the bacterial population in the crop, intestine and caeca.
They have been attributed to maintaining the equilibrium between bacterial
species in the gut and are available commercially as a prebiotic as they reduce
the presence of S. enterica and the food-borne human pathogen
Campylobacter [123].
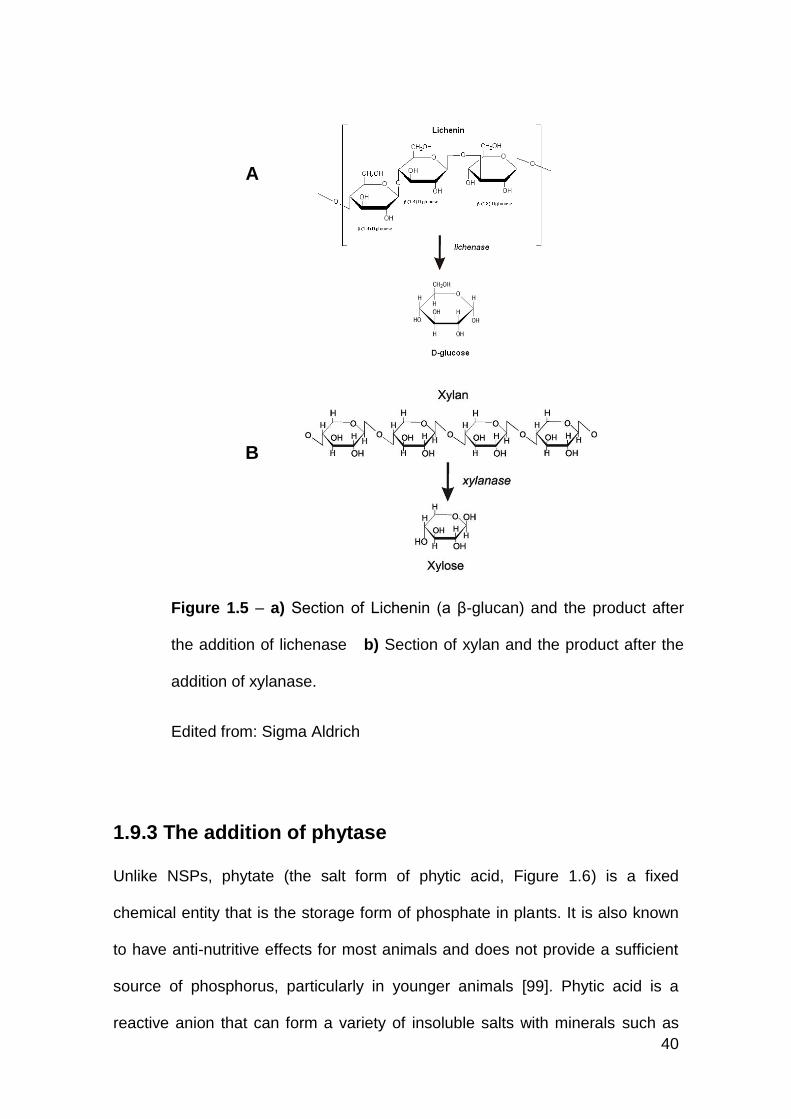
40
1.9.3 The addition of phytase
Unlike NSPs, phytate (the salt form of phytic acid, Figure 1.6) is a fixed
chemical entity that is the storage form of phosphate in plants. It is also known
to have anti-nutritive effects for most animals and does not provide a sufficient
source of phosphorus, particularly in younger animals [99]. Phytic acid is a
reactive anion that can form a variety of insoluble salts with minerals such as
Figure 1.5 – a) Section of Lichenin (a β-glucan) and the product after
the addition of lichenase b) Section of xylan and the product after the
addition of xylanase.
Edited from: Sigma Aldrich
A
B
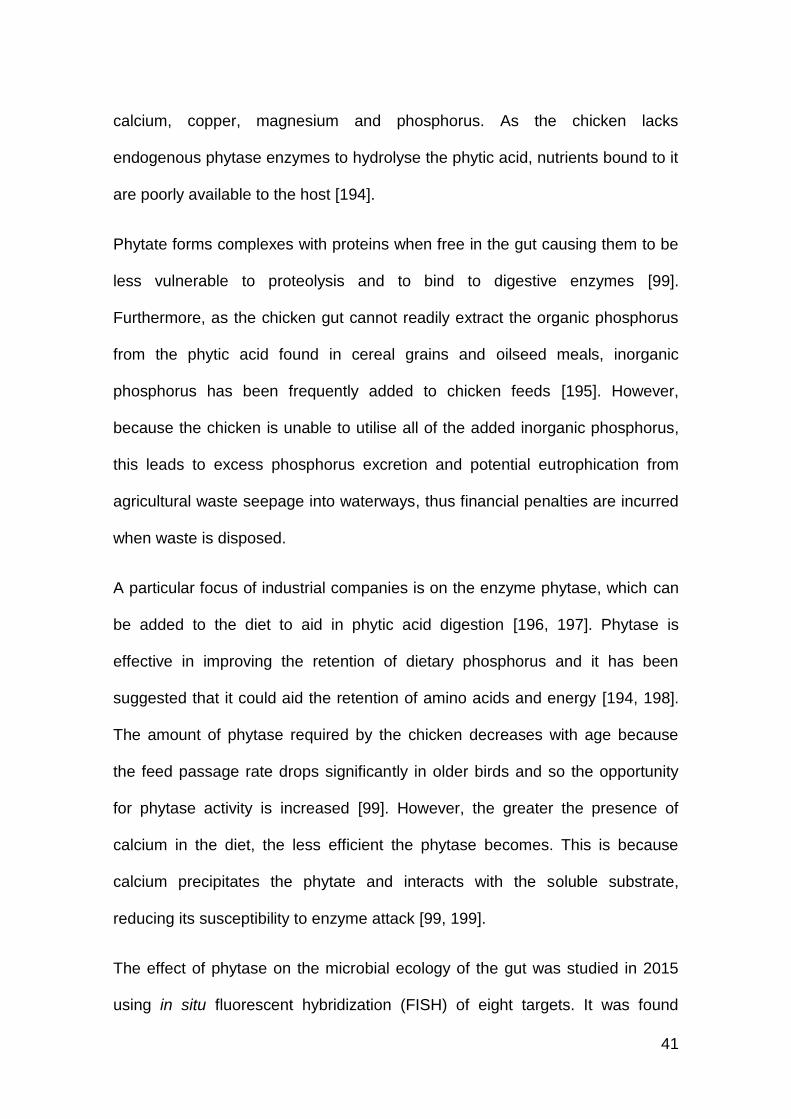
41
calcium, copper, magnesium and phosphorus. As the chicken lacks
endogenous phytase enzymes to hydrolyse the phytic acid, nutrients bound to it
are poorly available to the host [194].
Phytate forms complexes with proteins when free in the gut causing them to be
less vulnerable to proteolysis and to bind to digestive enzymes [99].
Furthermore, as the chicken gut cannot readily extract the organic phosphorus
from the phytic acid found in cereal grains and oilseed meals, inorganic
phosphorus has been frequently added to chicken feeds [195]. However,
because the chicken is unable to utilise all of the added inorganic phosphorus,
this leads to excess phosphorus excretion and potential eutrophication from
agricultural waste seepage into waterways, thus financial penalties are incurred
when waste is disposed.
A particular focus of industrial companies is on the enzyme phytase, which can
be added to the diet to aid in phytic acid digestion [196, 197]. Phytase is
effective in improving the retention of dietary phosphorus and it has been
suggested that it could aid the retention of amino acids and energy [194, 198].
The amount of phytase required by the chicken decreases with age because
the feed passage rate drops significantly in older birds and so the opportunity
for phytase activity is increased [99]. However, the greater the presence of
calcium in the diet, the less efficient the phytase becomes. This is because
calcium precipitates the phytate and interacts with the soluble substrate,
reducing its susceptibility to enzyme attack [99, 199].
The effect of phytase on the microbial ecology of the gut was studied in 2015
using in situ fluorescent hybridization (FISH) of eight targets. It was found
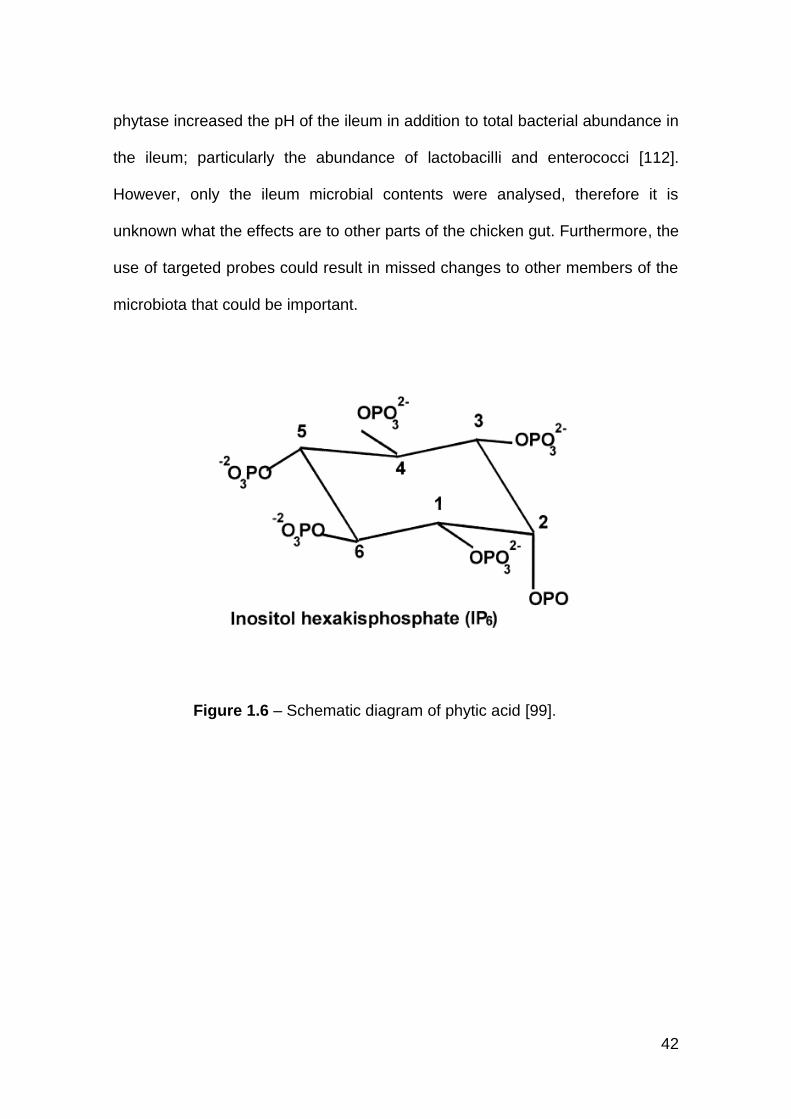
42
phytase increased the pH of the ileum in addition to total bacterial abundance in
the ileum; particularly the abundance of lactobacilli and enterococci [112].
However, only the ileum microbial contents were analysed, therefore it is
unknown what the effects are to other parts of the chicken gut. Furthermore, the
use of targeted probes could result in missed changes to other members of the
microbiota that could be important.
Figure 1.6 – Schematic diagram of phytic acid [99].
43
1.10 Aims and objectives of this study
Extensive culture-dependent analyses have been performed on the chicken gut,
with the exception of the proventriculus. However, there has been limited high-
throughput sequencing of the microbial communities colonising the organs that
form the proximal chicken gut— almost all previous studies have focussed on
the small intestine and caecum. The overall aim of the study was to complete
high-throughput sequencing of the gut microbiota to analyse the spatial
heterogeneity of the microbiota in chickens fed a standard or phytase-
supplemented diet (Chapter Three and Four). Efforts were made to culture
isolates from each gut section (Chapter Five) and novel isolates were genome-
sequenced (Chapter Six). The microbiotas from the crop, proventriculus,
gizzard, duodenum, ileum and caecum were studied in six chickens: three fed a
standard diet and three fed a standard diet supplemented with phytase.
The objectives were to: -
Provide a taxonomic census of the chicken gut
Map the spatial heterogeneity of the chicken gut
Identify the effect of phytase on the microbiota
Isolate bacterial species from the microbiota with a particular focus on
novel bacterial species
Perform whole genome sequence analysis of novel isolates

43
CHAPTER TWO
2. Materials and methods
44
2.1 Sample collection
Gut samples were collected from Ross broilers on two diets at 35 days, housed
indoors under standard commercial conditions at ADAS UK Ltd. They were fed
on a wheat-based diet with 5% maize and one of the groups had a phytase
enzyme supplement at 2,500 FTU/kg. There was no feed withdrawal before the
sacrificing of the chickens. The broilers were randomly selected from a dietary
group before being euthanized by cervical dislocation and the gut organs
removed. The samples (whole organ, including contents) were weighed and
labelled according to the diet, organ and number of the broiler in the order they
were sacrificed (Table 2.1). The samples were plunged in liquid nitrogen and
transported to the laboratory on dry ice and stored at the University of
Birmingham or University of Warwick until processing.
2.2 Suppliers
All media, chemicals and reagents used in this study were obtained from Lab M,
Life Technologies, Oxoid or Sigma-Aldrich unless otherwise stated.
2.3 Media
All media were prepared as specified in the manufacturer’s instructions and
autoclaved at 121 oC for 15 minutes at 15 psi (Table 2.2). All antibiotics or
supplements to be added to the media were sterilised by filtration through a
0.22 µm filter, except horse blood.
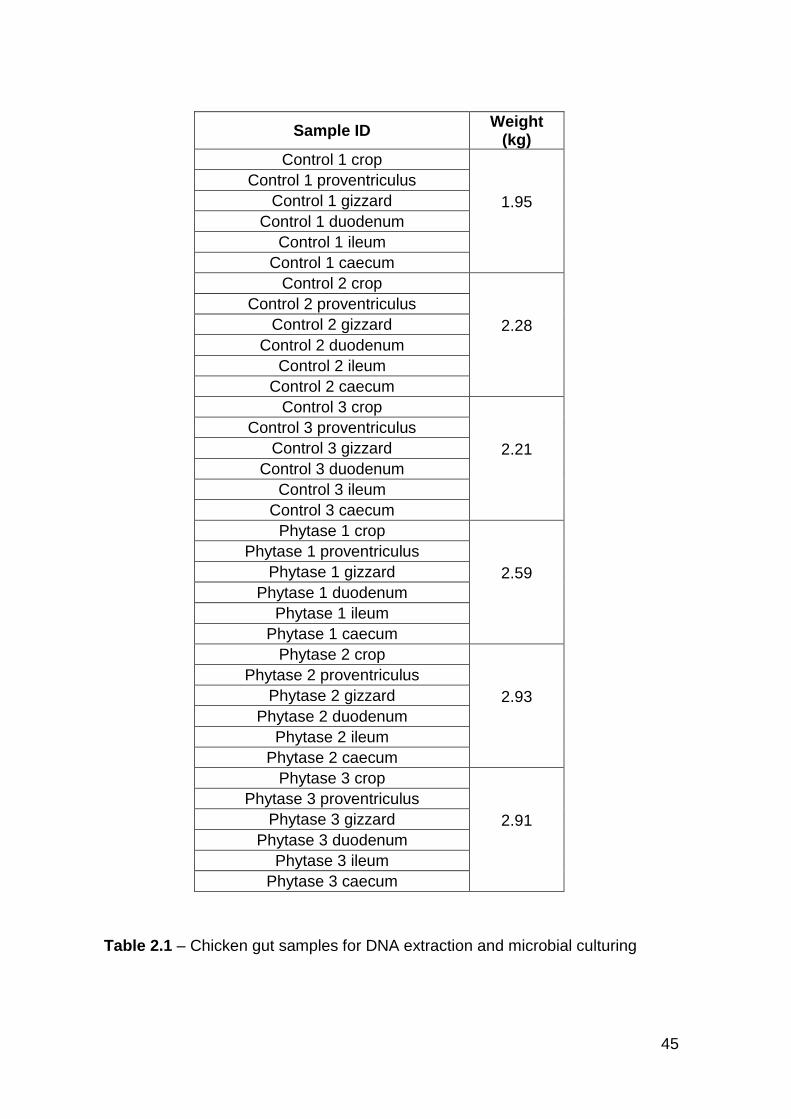
45
Sample ID Weight
(kg)
Control 1 crop
1.95
Control 1 proventriculus
Control 1 gizzard
Control 1 duodenum
Control 1 ileum
Control 1 caecum
Control 2 crop
2.28
Control 2 proventriculus
Control 2 gizzard
Control 2 duodenum
Control 2 ileum
Control 2 caecum
Control 3 crop
2.21
Control 3 proventriculus
Control 3 gizzard
Control 3 duodenum
Control 3 ileum
Control 3 caecum
Phytase 1 crop
2.59
Phytase 1 proventriculus
Phytase 1 gizzard
Phytase 1 duodenum
Phytase 1 ileum
Phytase 1 caecum
Phytase 2 crop
2.93
Phytase 2 proventriculus
Phytase 2 gizzard
Phytase 2 duodenum
Phytase 2 ileum
Phytase 2 caecum
Phytase 3 crop
2.91
Phytase 3 proventriculus
Phytase 3 gizzard
Phytase 3 duodenum
Phytase 3 ileum
Phytase 3 caecum
Table 2.1 – Chicken gut samples for DNA extraction and microbial culturing
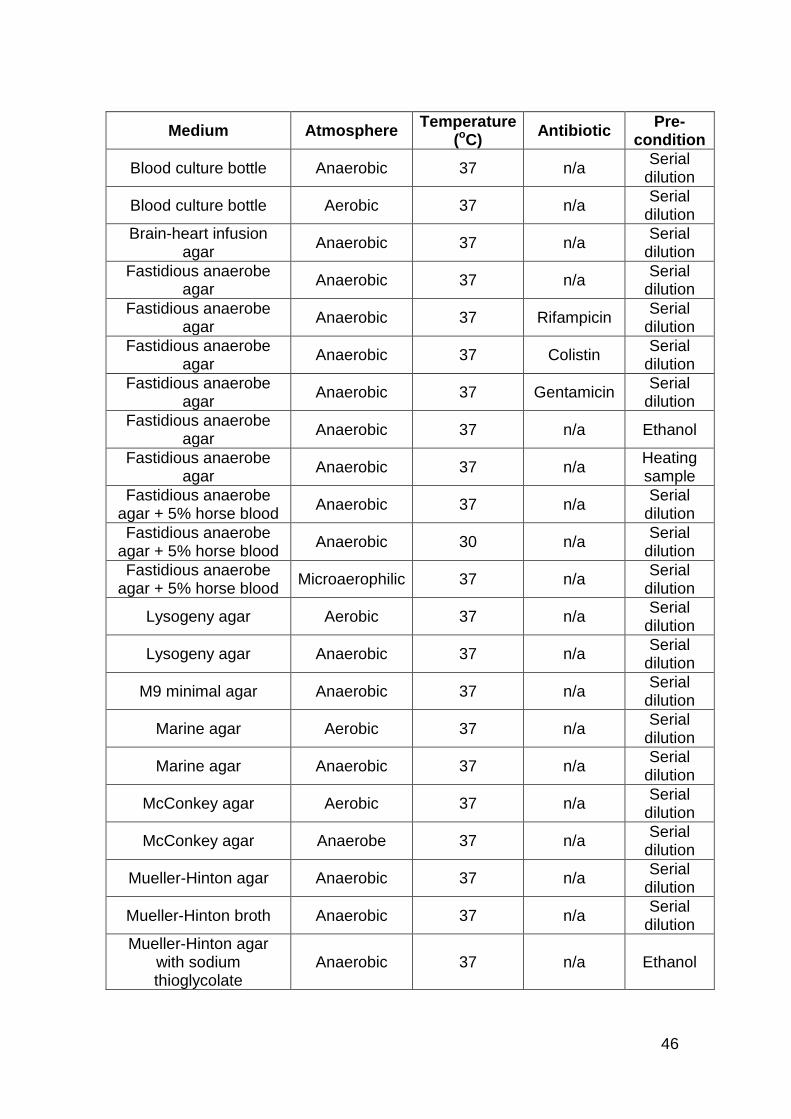
46
Medium Atmosphere Temperature
(oC) Antibiotic
Pre-condition
Blood culture bottle Anaerobic 37 n/a Serial
dilution
Blood culture bottle Aerobic 37 n/a Serial
dilution
Brain-heart infusion agar
Anaerobic 37 n/a Serial
dilution
Fastidious anaerobe agar
Anaerobic 37 n/a Serial
dilution
Fastidious anaerobe agar
Anaerobic 37 Rifampicin Serial
dilution
Fastidious anaerobe agar
Anaerobic 37 Colistin Serial
dilution
Fastidious anaerobe agar
Anaerobic 37 Gentamicin Serial
dilution
Fastidious anaerobe agar
Anaerobic 37 n/a Ethanol
Fastidious anaerobe agar
Anaerobic 37 n/a Heating sample
Fastidious anaerobe agar + 5% horse blood
Anaerobic 37 n/a Serial
dilution
Fastidious anaerobe agar + 5% horse blood
Anaerobic 30 n/a Serial
dilution
Fastidious anaerobe agar + 5% horse blood
Microaerophilic 37 n/a Serial
dilution
Lysogeny agar Aerobic 37 n/a Serial
dilution
Lysogeny agar Anaerobic 37 n/a Serial
dilution
M9 minimal agar Anaerobic 37 n/a Serial
dilution
Marine agar Aerobic 37 n/a Serial
dilution
Marine agar Anaerobic 37 n/a Serial
dilution
McConkey agar Aerobic 37 n/a Serial
dilution
McConkey agar Anaerobe 37 n/a Serial
dilution
Mueller-Hinton agar Anaerobic 37 n/a Serial
dilution
Mueller-Hinton broth Anaerobic 37 n/a Serial
dilution
Mueller-Hinton agar with sodium thioglycolate
Anaerobic 37 n/a Ethanol
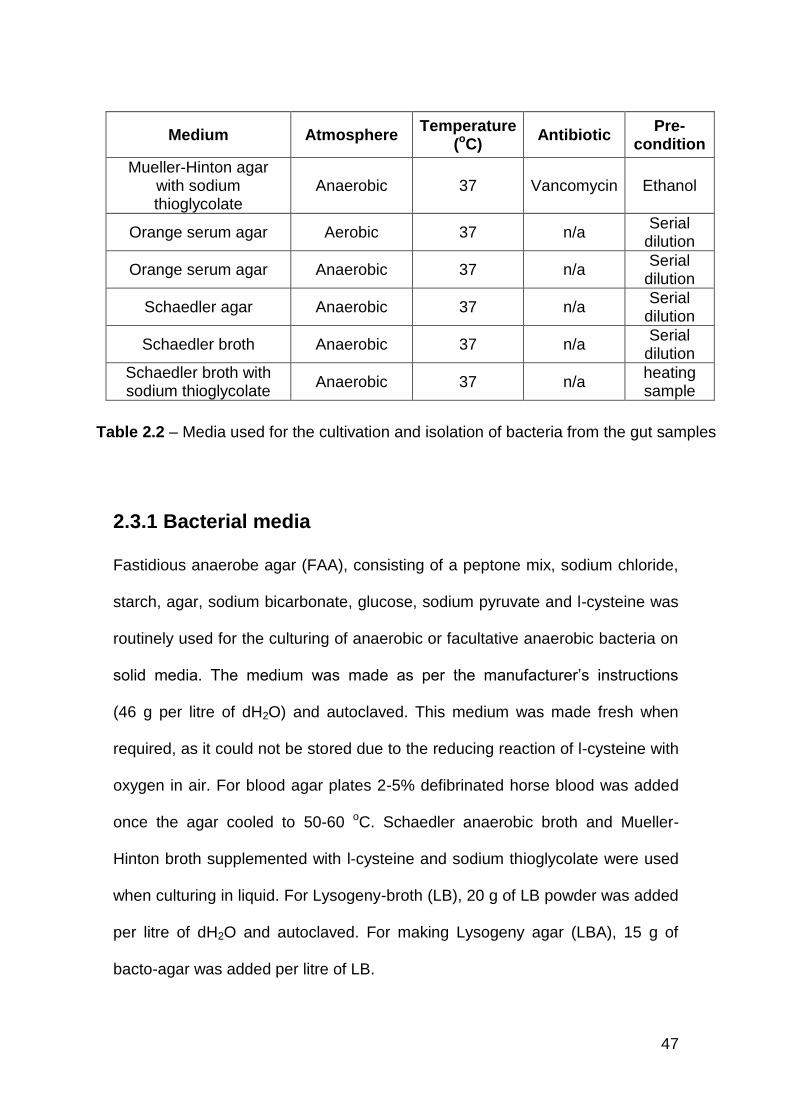
47
Medium Atmosphere Temperature
(oC) Antibiotic
Pre-condition
Mueller-Hinton agar with sodium thioglycolate
Anaerobic 37 Vancomycin Ethanol
Orange serum agar Aerobic 37 n/a Serial
dilution
Orange serum agar Anaerobic 37 n/a Serial
dilution
Schaedler agar Anaerobic 37 n/a Serial
dilution
Schaedler broth Anaerobic 37 n/a Serial
dilution
Schaedler broth with sodium thioglycolate
Anaerobic 37 n/a heating sample
2.3.1 Bacterial media
Fastidious anaerobe agar (FAA), consisting of a peptone mix, sodium chloride,
starch, agar, sodium bicarbonate, glucose, sodium pyruvate and l-cysteine was
routinely used for the culturing of anaerobic or facultative anaerobic bacteria on
solid media. The medium was made as per the manufacturer’s instructions
(46 g per litre of dH2O) and autoclaved. This medium was made fresh when
required, as it could not be stored due to the reducing reaction of l-cysteine with
oxygen in air. For blood agar plates 2-5% defibrinated horse blood was added
once the agar cooled to 50-60 oC. Schaedler anaerobic broth and Mueller-
Hinton broth supplemented with l-cysteine and sodium thioglycolate were used
when culturing in liquid. For Lysogeny-broth (LB), 20 g of LB powder was added
per litre of dH2O and autoclaved. For making Lysogeny agar (LBA), 15 g of
bacto-agar was added per litre of LB.
Table 2.2 – Media used for the cultivation and isolation of bacteria from the gut samples
48
2.3.2 Bacterial growth conditions
Anaerobic or facultative anaerobic bacteria were grown on FAA plates in an
anaerobic cabinet (Don Whitley) for two-five days at 37 oC. All LBA plates were
incubated for one to three days at 37 oC or three days at room temperature (RT)
in an aerobic or anaerobic atmosphere.
2.3.3 Bacterial glycerol stocks
For anaerobic or facultative anaerobic bacteria a 10 µl inoculation loop was
used to scrape colonies from a fresh agar plate. The colonies were
resuspended in Mueller-Hinton broth with 40% glycerol and supplemented with
l-cysteine. All other bacteria were grown overnight in LB and a 500 µl aliquot
was mixed with glycerol to a final concentration of 30%. All glycerol stocks were
stored at -80 oC.
2.4 Buffers and solutions
2.4.1 Buffers and solutions for agarose gel electrophoresis
Tris-acetate (TAE) buffer was prepared as a 50 x stock solution and diluted to
1 x with dH2O for the working solution. The stock solution consisted of 242 g
Tris base, 57.1 ml glacial acetic acid and 100 ml 0.5 M EDTA (pH 8.0) for one
litre. Fermentas 6 x loading dye (#R0611) was added to the samples as
required.
49
2.5 Isolation of DNA
2.5.1 Isolation of DNA from gut samples using Qiagen Stool
kit
Gut samples were removed from -80 oC storage and 200 mg of sample was
removed through scalpel excision of the organ and placed into a 2 ml screw cap
tube. To help the lysis of cells, 1.4 ml of buffer ASL and 0.2 g of 100–300 µM
acid washed glass beads (Sigma-Aldrich, Poole, UK) were added followed by
disruption with 2 × 30 sec pulses at 6.2 m/s in a FastPrep FP120 machine. The
tube was put into a heat-block preheated to 95 oC for 10 minutes. Each sample
was vortexed for 15 seconds and centrifuged for one minute at 13,000 rpm
before 1.2 ml of the centrifuged sample was pipetted into a new 2 ml microfuge
tube.
To each sample, one InhibitEX tablet, which had been crushed into a coarse
powder with a scalpel blade, was added and vortexed for one minute until
completely dissolved. The purpose of the InhibitEX tablet is to bind to potential
PCR inhibitors in the sample. The sample was subsequently centrifuged for
three minutes at 13,000 rpm before pipetting all the supernatant into a new 2 ml
microfuge tube and discarding the pellet. As carry over pellet would have had
detrimental effects to future steps, the sample was centrifuged again at
13,000 rpm for three minutes and the supernatant processed.
In a new 1.5 ml microfuge tube, 15 µl of Proteinase K and 200 µl of supernatant
from the second centrifugation was added followed by 200 µl buffer AL and
incubated at 70 oC for 10 minutes. Proteinase K degrades and digests proteins
50
in the sample and buffer AL is a lysis buffer. To this, 200 µl of 100% ethanol
was added and vortexed for 15 seconds to form a lysate. The purpose of the
DNA is to allow for more efficient binding of the lysate to the column. The lysate
was added to a QIAmp spin column and centrifuged at 13,000 rpm for one
minute. The collection tube was discarded and replaced with a new collection
tube before 500 µl buffer AW1 was added and centrifuged for one minute at
13,000 rpm. The collection tube was discarded again and 500 µl of buffer AW2
was added, centrifuged for three minutes at 13,000 rpm and the flow through
was discarded prior to centrifuging again for a further minute to remove residual
buffer AW2. AW1 buffer contains a higher proportion of ethanol to remove
excess salt and improve the pH conditions. AW2 is a longer spin to remove
digested proteins or other impurities. To elute the DNA 200 µl of buffer AE was
pipetted onto the membrane and incubated for two-five minutes at RT then
centrifuged for one minute at 13,000 rpm. Eluted DNA was stored at -20 oC until
required.
2.5.1.1 RNAase step
Due to the high levels of RNA extracted using this kit, an RNase step was
occasionally added after the InhibitEX tablet step. To the supernatant, 2 µl of
RNase A (100 mg/ml) was added and incubated for 30 minutes at 37 oC. The
protocol then continued from the Proteinase K step (detailed in Section 2.5.1).
51
2.5.2 Isolation of DNA from caecal sample using Powermax
soil extraction kit
To a Powermax bead solution tube 200 mg of caecal sample was added and
placed in a FastPrep FP120 machine for 2 × 30 sec pulses at 6.2 m/s. To the
homogenised solution, 1.2 ml of solution C1 was added and vortexed for
30 seconds. Solution C1 is a lysis buffer and contains SDS which breaks down
lipids and fatty acids in the cell membrane. The tubes were then fixed to the
vortexer with tape and vortexed for 10 minutes, before centrifuging for three
minutes at 13,000 rpm. The supernatant was transferred to a clean 2 ml
microfuge tube and 500 µl of solution C2 was added prior to inverting the tube
twice and incubating on ice for 10 minutes. Solution C2 removes inhibitors from
the sample. The sample was centrifuged at 13,000 rpm for four minutes and the
supernatant added to a new 2 ml microfuge tube. To the supernatant, 400 µl of
solution C3 was added, inverted twice and incubated on ice for a further
10 minutes followed by a four minute centrifugation at 13,000 rpm. Solution C3
is another inhibitor removal reagent. The supernatant was added to a 5 ml tube
containing 3 ml of solution C4 (after shaking to mix) and the tube was inverted
twice. Solution C4 contains a high concentration of salt which allows the DNA to
bind to the column. To a spin filter membrane, 1 ml of the solution was applied
and centrifuged for two minutes at 13,000 rpm. This step was repeated until the
full 3 ml and the supernatant had passed through the column. Subsequently,
1 ml of solution C5 was applied to the membrane and centrifuged for three
minutes at 13,000 rpm. Solution C5 is an ethanol wash that reduces the salt
concentration and removes other contaminants. The flow-through was
discarded before centrifuging for a further five minutes at 13,000 rpm to ensure
52
all residual solution C5 was removed. The collection tube was replaced with a
sterile 1.5 ml microfuge tube before 100 µl of solution C6 was pipetted onto the
centre of the spin filter and incubated for two-five minutes at RT followed by
centrifugation for one minute at 13,000 rpm. Solution C6 is a low salt elution
buffer and therefore the DNA is removed from the membrane. Eluted DNA was
stored at -20 oC until required.
2.5.3 Isolation of genomic DNA from solid medium cultures
Colonies were taken from a fresh agar plate using a 10 µl inoculation loop and
resuspended in 500 µl of resuspension buffer. The absorbance was taken at
OD600 and more cells were added to increase the absorbance to four as
required. Tubes were subsequently centrifuged for five minutes at 13,000 rpm
to form a compact cell pellet. The cell pellet was resuspended in 180 µl of lysis
buffer supplemented with 1 mg/ml lysozyme and RNAse A followed by
incubation at 37 oC for 30 minutes. After incubation 200 µl of buffer AL and 15 µl
of Proteinase K was added. Samples were vortexed before 200 µl of 100%
ethanol was added and incubated at 70 oC for 10 minutes. The sample was
then applied to the Qiagen stool extraction kit column and centrifuged at
13,000 rpm for one minute. The flow-through was discarded before the column
was washed with 500 µl of AW1 buffer with centrifugation at 13,000 rpm for one
minute followed by 500 µl of AW2 buffer with centrifugation at 13,000 rpm for
one minute. DNA was eluted with 50 µl of buffer AE and centrifuged at
13,000 rpm for one minute. Eluted DNA was stored at -20 oC until required.
53
2.5.4 DNA extraction from agarose gels
Following DNA gel electrophoresis (detailed in Section 2.7.2), DNA fragments of
interest were excised from an agarose gel with a clean scalpel blade whilst
using a UV-illuminator to visualise the DNA bands. Excess agarose around the
DNA band was removed prior to placing it into a 1.5 ml microfuge tube and
weighing. If the gel slice weighed 400 mg the DNA band was cut in half. After
weighing, buffer QG (from Qiagen gel extraction kit) was added in
correspondence to the weight of the gel slice (600 µl of buffer QG for a 200 mg
gel slice). After incubation at 50 oC for 10 minutes the tube was vortexed every
two minutes for 15 seconds. Buffer QG enables the solubilisation of agarose
and provides the best conditions for binding of the DNA to the column. After the
gel slice had completely dissolved, the solution was applied to a QIAquick
column and centrifuged at 13,000 rpm for one minute and the flow-through was
discarded. The reservoir could only hold 800 µl; therefore any samples over 800
µl were loaded in two parts. To remove any traces of leftover agarose from the
membrane, 500 µl of buffer QG was applied to the column and centrifuged at
13,000 rpm for one minute and the flow-through discarded. To wash and
remove salts from the sample 750 µl of buffer PE was added to the column and
incubated at RT for two-five minutes. Buffer PE removes salt and other
impurities from the column. The column was subsequently centrifuged at 13,000
rpm for one minute and the flow-through discarded before being centrifuged
again for a further one minute at 13,000 rpm to remove residual buffer PE. To
elute the DNA, 30 µl of buffer EB was added directly to the centre of the
membrane in the column, incubated at RT for two-five minutes and centrifuged
for one minute at 13,000 rpm. Buffer EB is basic and contains low salt
54
concentrations and thus is used to elute DNA from the column. Eluted DNA was
stored at -20 oC until required.
2.6 DNA quantification
2.6.1 Nanodrop 1000
The sample pedestal of a Nanodrop 1000 (Thermo Scientific, USA) was
cleaned by pipetting 2 µl of dH20 onto it and wiping with Whatman filter paper.
The Nanodrop was blanked with 1 µl of appropriate solution before pipetting
1 µl of sample and taking a reading. The concentration, 260/280 nm and
260/230 nm ratios were recorded before washing the pedestal with 2 µl dH20
after use.
2.6.2 Qubit 2.0
A working solution was made by diluting Qubit dsDNA reagent (Life
technologies, USA) 1:200 with dsDNA buffer. To 0.5 ml tubes, 190 µl of working
solution was added for standards and 198 µl was added for samples. To the
standard tubes, 10 µl of Qubit standard was added and to the sample tubes,
2 µl of sample was added. The tubes were mixed by vortexing for three seconds
ensuring bubbles were not formed. The tubes were incubated in the dark at RT
for two minutes prior to quantification on the fluorometer and the concentrations
recorded. All samples under 10 ng/µl were quantified using a high-sensitivity kit
and for all other samples a broad-range kit was used.
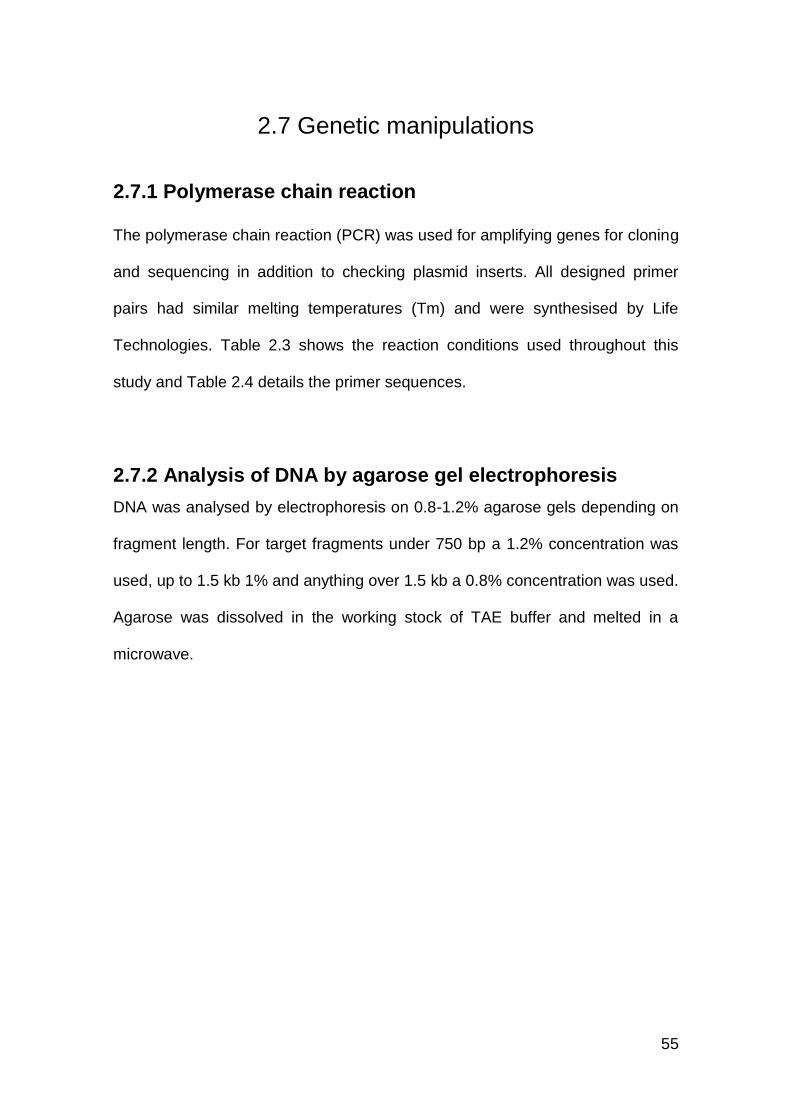
55
2.7 Genetic manipulations
2.7.1 Polymerase chain reaction
The polymerase chain reaction (PCR) was used for amplifying genes for cloning
and sequencing in addition to checking plasmid inserts. All designed primer
pairs had similar melting temperatures (Tm) and were synthesised by Life
Technologies. Table 2.3 shows the reaction conditions used throughout this
study and Table 2.4 details the primer sequences.
2.7.2 Analysis of DNA by agarose gel electrophoresis
DNA was analysed by electrophoresis on 0.8-1.2% agarose gels depending on
fragment length. For target fragments under 750 bp a 1.2% concentration was
used, up to 1.5 kb 1% and anything over 1.5 kb a 0.8% concentration was used.
Agarose was dissolved in the working stock of TAE buffer and melted in a
microwave.
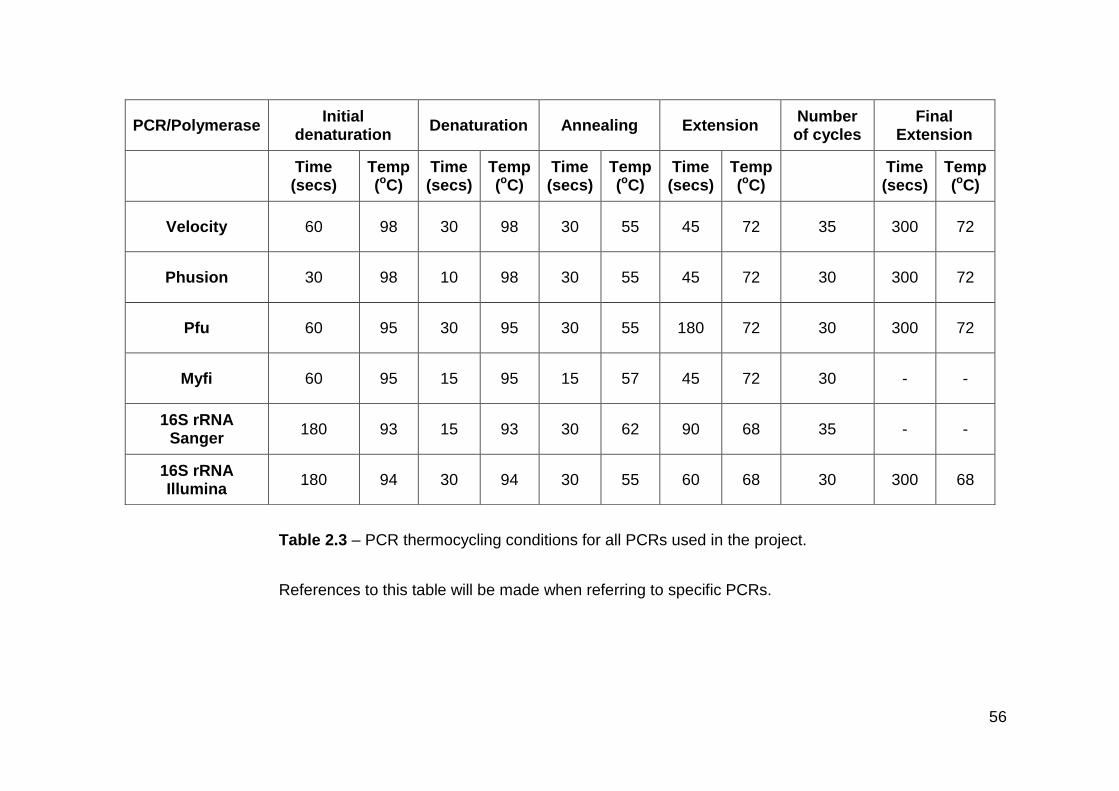
56
PCR/Polymerase Initial
denaturation Denaturation Annealing Extension
Number of cycles
Final Extension
Time (secs)
Temp (oC)
Time (secs)
Temp (oC)
Time (secs)
Temp (oC)
Time (secs)
Temp (oC)
Time (secs)
Temp (oC)
Velocity 60 98 30 98 30 55 45 72 35 300 72
Phusion 30 98 10 98 30 55 45 72 30 300 72
Pfu 60 95 30 95 30 55 180 72 30 300 72
Myfi 60 95 15 95 15 57 45 72 30 - -
16S rRNA Sanger
180 93 15 93 30 62 90 68 35 - -
16S rRNA Illumina
180 94 30 94 30 55 60 68 30 300 68
Table 2.3 – PCR thermocycling conditions for all PCRs used in the project.
References to this table will be made when referring to specific PCRs.
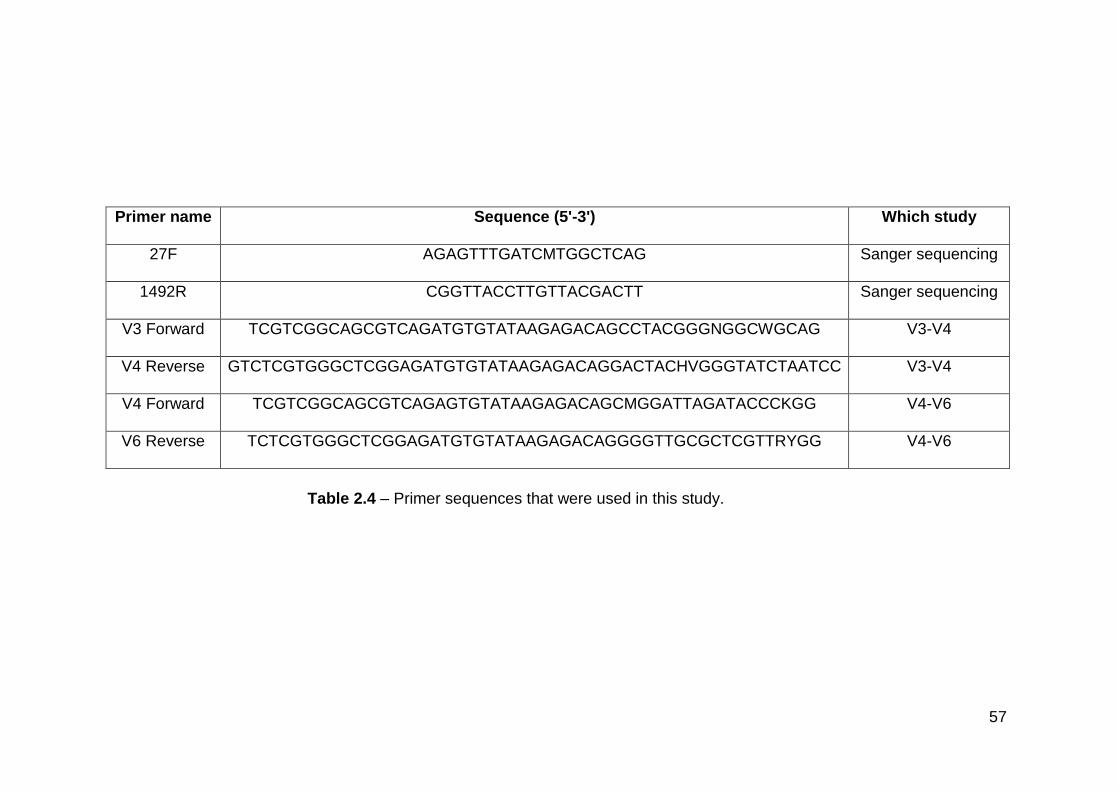
57
Primer name Sequence (5'-3') Which study
27F AGAGTTTGATCMTGGCTCAG Sanger sequencing
1492R CGGTTACCTTGTTACGACTT Sanger sequencing
V3 Forward TCGTCGGCAGCGTCAGATGTGTATAAGAGACAGCCTACGGGNGGCWGCAG V3-V4
V4 Reverse GTCTCGTGGGCTCGGAGATGTGTATAAGAGACAGGACTACHVGGGTATCTAATCC V3-V4
V4 Forward TCGTCGGCAGCGTCAGAGTGTATAAGAGACAGCMGGATTAGATACCCKGG V4-V6
V6 Reverse TCTCGTGGGCTCGGAGATGTGTATAAGAGACAGGGGTTGCGCTCGTTRYGG V4-V6
Table 2.4 – Primer sequences that were used in this study.
58
Once the melted agarose had cooled sufficiently SYBR safe (Life Technologies)
was added to a final concentration of 1:10000 for DNA visualisation. The molten
agarose was poured into a plastic cast and a plastic comb was used to produce
wells before being removed once the gel had set. The gel was then placed into
a horizontal electrophoresis tank with the TAE buffer level sufficiently high
enough to cover the gel. If required, loading dye was added to the sample at a
ratio of 6:1 and run at 80-100 volts. Hyperladder 1 kb (Bioline, UK) was used as
a ladder on all gels. To visualise the DNA, the gel was transferred to a
freestanding UV transilluminator or to a BioRad gel-doc system.
2.7.3 Post-PCR DNA purification with Qiagen PCR
purification kit
Amplicons were purified by adding a 5:1 ratio of buffer PI to the post-PCR mix
(if the PCR volume was 100 µl, 500 µl of buffer PI was added). When using
Reddy mix (ThermoScientific) or Go-Taq G2 (Promega), 5 µl of 3 M sodium
acetate was added to ensure optimum pH of ≤7.5 for binding DNA to the
membrane. Buffer PB binds to DNA >100 bp and therefore any primers should
not bind to the column. The solution was pipetted onto the membrane of a
QIAquick column and centrifuged at 13,000 rpm for one minute. The flow-
through was discarded and the column placed back into the collection tube. The
column was washed with 750 µl of PE buffer by centrifugation at 13,000 rpm for
one minute. To aid the removal of salts, buffer PE was left on the column for
two-five minutes at RT. The flow-through was discarded and the column placed
back into the tube and centrifuged for a further one minute at 13,000 rpm to
59
remove residual buffer PE, before the column was placed into a 1.5 ml
microfuge tube. To elute the DNA, 30 µl of buffer EB was added directly to the
centre of the membrane in the column, incubated at RT for two-five minutes and
centrifuged for one minute at 13,000 rpm. Purified amplicon DNA was stored at
-20 oC until required.
2.7.4 Post-PCR DNA purification with AMPure beads
After PCR, 22.5 µl of dH20 was mixed with 22.5 µl of post-PCR mix. To this,
72 µl of AMPure beads were added and incubated for 10 minutes at RT. Using
a magnetic particle concentrator the beads were pelleted against the side of the
low-binding microfuge tube and the supernatant was removed. The beads were
then washed twice with 200 µl of 80% ethanol, with vortexing between washes.
The beads were dried at 37 ºC prior to the addition of 10 µl of buffer TE to elute
DNA. Purified DNA was stored at -20 oC until required.
2.8 DNA sequencing
2.8.1 Sanger DNA sequencing
Plasmids and amplicons were Sanger sequenced using a BigDye terminator kit
and ABI Prism 3700/3730xl (Applied Biosystems) by Functional Genomics
Laboratory, School of Biosciences, University of Birmingham or GATC- Biotech.
These single primer-sequencing reactions required 3.2 pmol or 2.5 pmol final
concentrations of primers respectively. For plasmid DNA 100-300 ng was
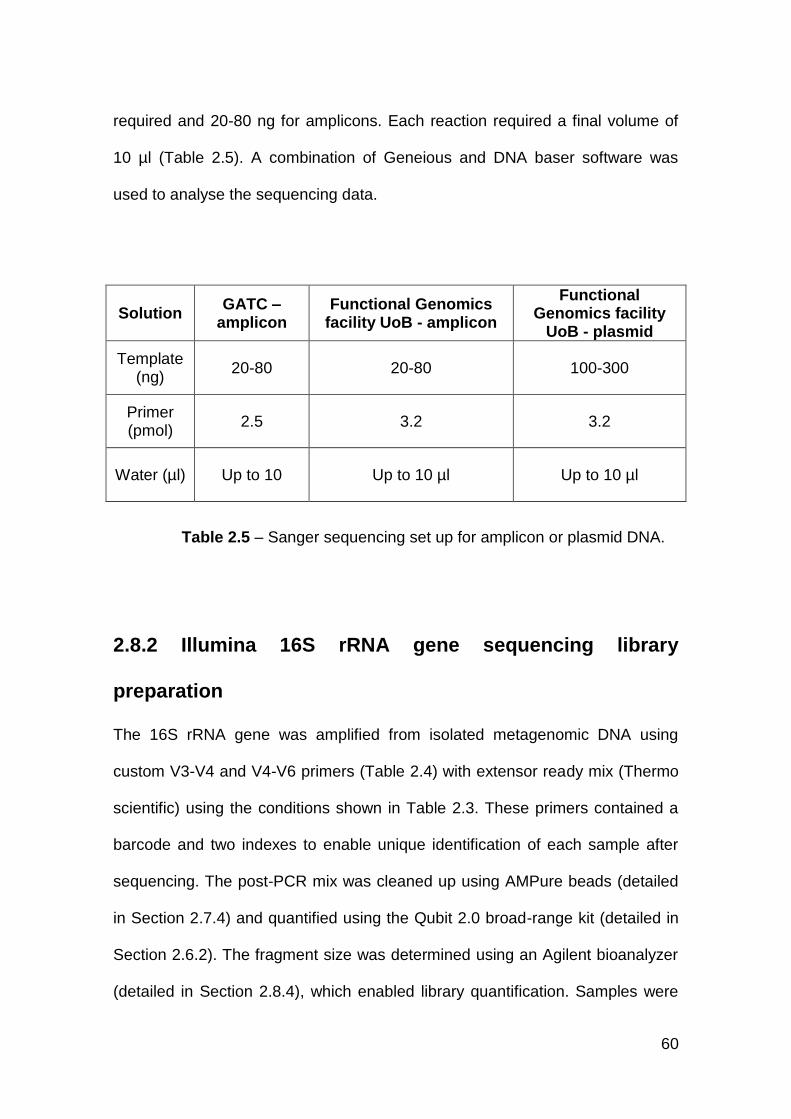
60
required and 20-80 ng for amplicons. Each reaction required a final volume of
10 µl (Table 2.5). A combination of Geneious and DNA baser software was
used to analyse the sequencing data.
Solution GATC –
amplicon Functional Genomics
facility UoB - amplicon
Functional Genomics facility
UoB - plasmid
Template (ng)
20-80 20-80 100-300
Primer (pmol)
2.5 3.2 3.2
Water (µl) Up to 10 Up to 10 µl Up to 10 µl
2.8.2 Illumina 16S rRNA gene sequencing library
preparation
The 16S rRNA gene was amplified from isolated metagenomic DNA using
custom V3-V4 and V4-V6 primers (Table 2.4) with extensor ready mix (Thermo
scientific) using the conditions shown in Table 2.3. These primers contained a
barcode and two indexes to enable unique identification of each sample after
sequencing. The post-PCR mix was cleaned up using AMPure beads (detailed
in Section 2.7.4) and quantified using the Qubit 2.0 broad-range kit (detailed in
Section 2.6.2). The fragment size was determined using an Agilent bioanalyzer
(detailed in Section 2.8.4), which enabled library quantification. Samples were
Table 2.5 – Sanger sequencing set up for amplicon or plasmid DNA.
61
diluted accordingly to 4 nM using resuspension buffer. From each library 5 µl
was taken and added to a separate low-binding microfuge tube to pool the 4 nM
libraries. To denature the DNA, 5 µl was taken from the pool and added to 5 µl
of 0.2 N NaOH, vortexed and centrifuged at 280 rpm for one minute at RT. The
denatured pool was incubated at RT for five minutes before 10 µl was removed
and added to 990 µl of chilled HT1 buffer and placed on ice until required. The
pool was diluted to a final concentration of 6-12 pM using chilled HT1 buffer.
The final denatured DNA pool was then sequenced on a MiSeq using either the
Illumina MiSeq V2 2x250 bp paired end protocol or MiSeq V3 2 x 300 bp paired
end protocol.
2.8.3 Illumina Nextera XT library preparation
The buffers required for the protocol were removed from -20 oC storage and
thawed on ice or on the bench. After the input DNA was diluted to 0.2 ng/µl, 5 µl
was added to 10 µl of TD buffer in a 0.2 ml tube. ATM buffer (5 µl) was added to
the tube and mixed by pipetting up and down five times prior to centrifugation at
280 rpm for one minute at RT. The tubes were subsequently placed in a
thermocycler for five minutes at 55 oC and then held at 10 oC. To each tube,
5 µl of NT buffer was added and mixed by pipetting up and down five times
before briefly centrifuging and incubating at RT for five minutes. After the
incubation, 15 µl of NPM was added to each tube in addition to 5 µl of each
index primer and mixed up and down by pipetting five times and briefly
centrifuged. The samples were placed in a thermocycler and the Illumina
program in Table 2.3 was used. Post-PCR samples were cleaned with AMPure
62
beads (detailed in Section 2.7.4) and the bioanalyzer (detailed in Section 2.8.4)
was used to determine fragment length and the libraries were diluted
accordingly. The same method was used to denature and pool the libraries as
outlined in 2.8.2 Illumina 16S rRNA gene sequencing subsection.
2.8.4 Agilent bioanalyzer high sensitivity DNA kit
The high sensitivity DNA dye concentrate and gel matrix were removed from
4 oC storage and equilibrated to RT in 30 minutes. Then, 15 µl of high sensitivity
DNA concentrate was added to the gel matrix in a microfuge tube before
vortexing the solution. The mix was centrifuged at 2240 rpm for 10 minutes and
stored until needed away from light at 4 oC. Once required, the gel-dye mix was
allowed to equilibrate at RT for 30 minutes prior to use. A high-sensitivity chip
was placed on the chip priming station and 9 µl of gel-dye mix pipetted into the
appropriate well. The plunger was depressed until held by the priming station
clip for exactly one minute before releasing. After the plunger had rebounded for
five seconds it was pulled back to the starting position. A further 9 µl of gel-dye
mix was added to other wells as specified. In all remaining wells, 5 µl of marker
was pipetted before 1 µl of ladder was added to the specified ladder well. As the
quantitative range of the High sensitivity DNA kit was 5-500 pg/µl, samples
<50 µg/µl were diluted 1:10 and samples <100 µg/µl were diluted 1:20 with
dH2O. In the 11 sample wells, 1 µl of sample was added, if there were less than
11 samples, 1 µl of marker was added to each empty well. The chip was
vortexed at 2400 rpm for one minute before running on an Agilent 2100
63
Bioanalyzer instrument for 45 minutes. The data was processed using an
Agilent 2100 computer program.
2.9 Bioinformatic analysis
2.9.1 Processing of 16S rRNA gene-fragment sequences
Fastq files were de-multiplexed (including trimming of barcodes and primers
and the removal of low-quality reads) using default Illumina software.
Sequences were split further according to the barcode at the beginning of read
2 and assigned to a sample. Forward and reverse reads were joined using a
custom java program to produce contigs. A quality-filtering step to discard reads
with more than three mismatches was included. If any mismatches were
identified, the base with the highest quality value was inserted into the contig.
Each contig was subsequently assigned to OTUs using the UPARSE pipeline.
Initially, 16S rRNA gene-fragment sequences were de-replicated using a
custom java program before sorting by size and singletons were excluded using
usearch –sortbysize –minsize 2. Sequences were clustered at the default 97%
identity level and chimeras were removed using usearch –cluster_otus. An extra
chimera checking step was applied to OTUs when they were compared to the
default GOLD database using the command usearch –uchime_ref. De-
replicated reads were mapped against the OTU sequences with usearch –
usearch_global –strand plus –id 0.97, which calculated the abundance of each
OTU. A custom java program assigned the original reads (prior to de-
replication) to each OTU and correlated them to each sample.
64
The OTU sequences were assigned taxonomic classification using
assign_taxonomy.py in QIIME, which used the RDP classifier. An OTU
consisting of the OTU counts for each sample and taxonomic classification was
constructed using make_otu_table.py (Figure 2.1).
2.9.2 Alpha rarefaction and beta diversity analysis of 16S
rRNA gene-fragment sequences
QIIME was used to perform alpha rarefaction analyses on the OTU tables
generated from section 2.9.1 using the alpha_rarefaction.py command. The
metrics utilised to determine diversity within the samples were: number of
observed species, Chao1, Simpson diversity and Shannon diversity. The depth
of rarefaction was determined by either the median number of sequences or the
lowest number of sequences assigned to a sample within a group that was
analysed.
To determine the diversity between the samples, jackknifed_beta_diversity.py
was used. The depth of the rarefaction was determined by lowest number of
sequences assigned to a sample within a group that was analysed. Bootstrap
trees were produced using the unweighted UniFrac output from jackknife beta
diversity with colour-coded bootstrap support.
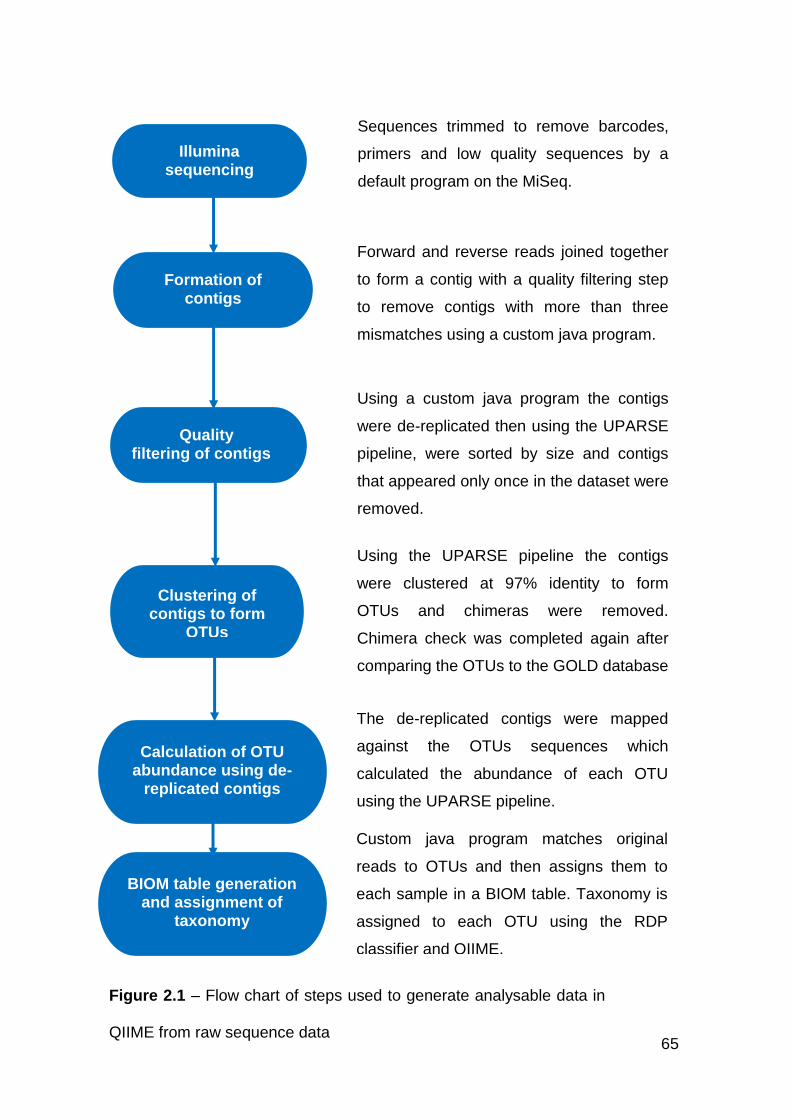
65
Formation of contigs
Sequences trimmed to remove barcodes,
primers and low quality sequences by a
default program on the MiSeq.
Forward and reverse reads joined together
to form a contig with a quality filtering step
to remove contigs with more than three
mismatches using a custom java program.
Using a custom java program the contigs
were de-replicated then using the UPARSE
pipeline, were sorted by size and contigs
that appeared only once in the dataset were
removed.
Using the UPARSE pipeline the contigs
were clustered at 97% identity to form
OTUs and chimeras were removed.
Chimera check was completed again after
comparing the OTUs to the GOLD database
The de-replicated contigs were mapped
against the OTUs sequences which
calculated the abundance of each OTU
using the UPARSE pipeline.
Custom java program matches original
reads to OTUs and then assigns them to
each sample in a BIOM table. Taxonomy is
assigned to each OTU using the RDP
classifier and QIIME.
Figure 2.1 – Flow chart of steps used to generate analysable data in
QIIME from raw sequence data
Illumina sequencing
Quality filtering of contigs
Clustering of contigs to form
OTUs
Calculation of OTU abundance using de-
replicated contigs
BIOM table generation and assignment of
taxonomy
66
2.9.3 Statistical analysis of 16S rRNA gene-fragment
sequences
To determine statistical significance between samples or organs, the OTU table
was rarefied ten times and concatenated into a single OTU table using
multiple_rarefactions.py in QIIME. The tests of significance were performed
using a two-sided Student's two-sample t-test within
make_distance_boxplots.py and the Bonferroni p-value was recorded. OTU
significance was determined using group_significance.py and either a
parametric T-test or ANOVA depending on the number of samples being
compared.
2.9.4 Phylogenetic analysis of 16S rRNA gene sequences
To refine the taxonomic resolution of the most abundant OTUs in both diets, the
sequences were imported into ARB and aligned using the SINA (SILVA
incremental aligner) tool. The aligned OTU sequences were then added to the
existing LTPs 115 SSU tree using the ARB parsimony (quick add marked)
function. Further trees were built using the ARB neighbour joining distance
matrix function to assess the confidence of each OTU position within the tree.
To confirm the taxonomy of these sequences, 1,000 bootstrap trees were built
to provide a consensus tree with the ARB estimation bootstrap values. The
percentage on each branch point provided bootstrap support of each
placement.
67
2.9.5 Analysis of Sanger sequenced isolates
The AB1 file from the sequencing of the isolate was loaded into Geneious,
which calculated the sequence length, number of ambiguities, percentage of
high quality bases and also provided a chromatogram trace. Sequences were
trimmed manually according to quality before loading into BLASTN. Isolates
were aligned against each other using BLASTN and if the comparison yielded
≤97% the sequences were retained for further analysis. For forward and reverse
16S rRNA gene sequences, DNABaser was utilised; both sequences were
imported before the ends were automatically trimmed (optimising for high-
quality samples) and assembled to form a contig. As a general rule, only
isolates that gave ≤97% identity to the nearest named species via BLASTN
were sequenced in both directions.
68
CHAPTER THREE
3. Optimisation of 16S rRNA gene-
fragment sequencing on the chicken
gut microbiota
69
3.1 Introduction
The organs of the chicken gastrointestinal tract consist of the crop, proventriculus,
gizzard, small intestine (duodenum, jejunum and ileum), caecum and large
intestine [113]. Each of the organs are differentiated functionally and
morphologically and this can affect the microbiota that inhabit these environments
[119]. The gut microbiota plays an important role in animal health; inhibiting the
proliferation of pathogenic bacteria, synthesising vitamins for the host, aiding feed
digestion and driving the development of the immune system [9, 29]. Due to these
multifunctional roles, it is important to identify and understand the complex
microbiota of the chicken gut.
The aim of this study was to map the spatial heterogeneity of bacteria from the
chicken gut at a greater depth, identify any differences in the diets of six chickens
(three fed a control-diet and three fed a phytase supplemented diet) using alpha
rarefaction and beta diversity analyses and identify the microbiota of the
proventriculus. The digesta from six organs of the chicken gut (crop,
proventriculus, gizzard, small intestine first, small intestine last and caecum) were
studied using 16S rRNA gene sequencing of the V3-V4 hypervariable region (full
details of methods are detailed in Chapter Two).
There has previously only been one published study that sequenced multiple gut
organs from a single chicken [119]. This previous study used a Roche 454 FLX
Titanium sequencer to sequence the V1-V3 region of the 16S rRNA gene and
generated 111,970 sequences assigned to 2,803 OTUs from three chickens. The
70
proventriculus was not sequenced in this previous study and there has been no
published data regarding the proventriculus using culture-independent techniques
and a single culture-dependent study that only referred to lactobacilli [106].
3.2 Methods
Methods for DNA extraction, PCR amplification set up, DNA purification, DNA
quantification, DNA sequencing using an Illumina MiSeq and subsequent
bioinformatic analysis is described in Chapter Two (Materials and Methods).
3.2.1 Normalisation of OTU coverage
As 16S rRNA gene operons can be present in multiple copies (one to 15 copies
per cell), the reads representing an OTU may not provide an accurate
representation of cellular abundance for that OTU [58]. PICRUSt was therefore
used to normalise OTU reads using a 16S rRNA gene copy number predictor. The
reads of 16S rRNA gene operons per genome were taken from Integrated Microbial
Genomes (IMG). These series of scripts were used on a galaxy interface at
http://huttenhower.sph.harvard.edu/galaxy/root?tool_id=PICRUSt_normalize.
The output from PICRUSt was applied to the OTU table using a custom python
script that divided reads by the number of 16S rRNA gene operons (e.g.
Escherichia have seven gene operons so each Escherichia read would be divided
by seven).
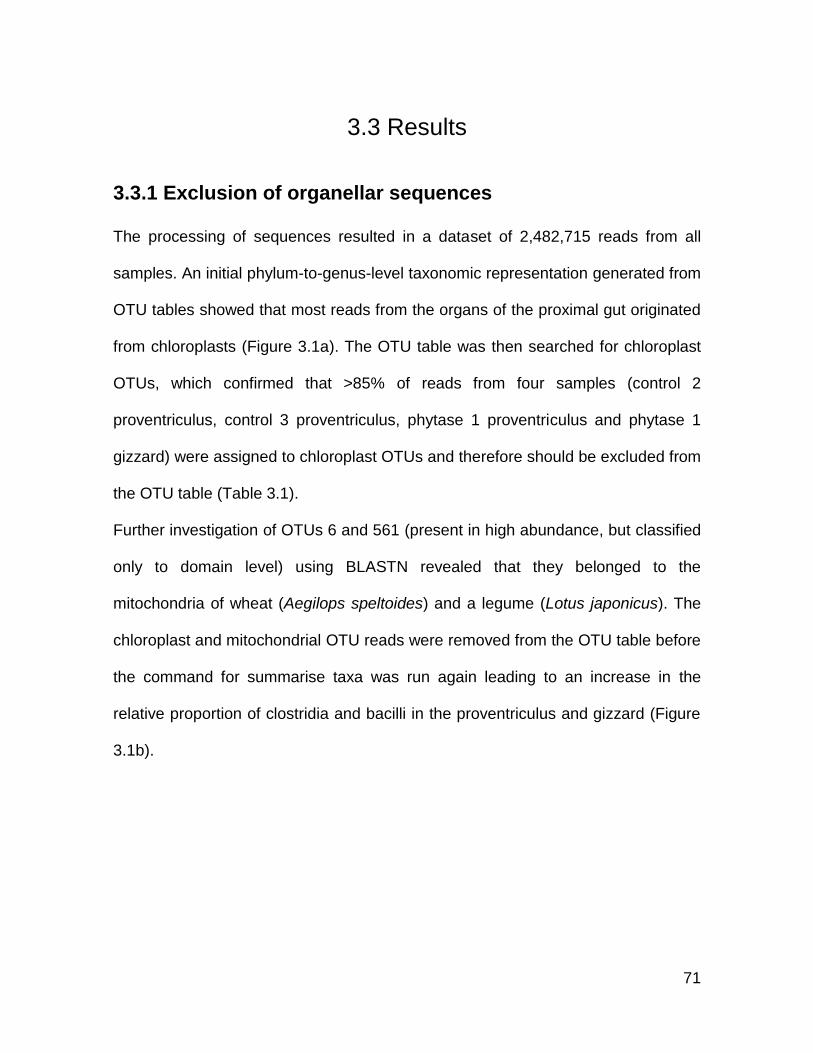
71
3.3 Results
3.3.1 Exclusion of organellar sequences
The processing of sequences resulted in a dataset of 2,482,715 reads from all
samples. An initial phylum-to-genus-level taxonomic representation generated from
OTU tables showed that most reads from the organs of the proximal gut originated
from chloroplasts (Figure 3.1a). The OTU table was then searched for chloroplast
OTUs, which confirmed that >85% of reads from four samples (control 2
proventriculus, control 3 proventriculus, phytase 1 proventriculus and phytase 1
gizzard) were assigned to chloroplast OTUs and therefore should be excluded from
the OTU table (Table 3.1).
Further investigation of OTUs 6 and 561 (present in high abundance, but classified
only to domain level) using BLASTN revealed that they belonged to the
mitochondria of wheat (Aegilops speltoides) and a legume (Lotus japonicus). The
chloroplast and mitochondrial OTU reads were removed from the OTU table before
the command for summarise taxa was run again leading to an increase in the
relative proportion of clostridia and bacilli in the proventriculus and gizzard (Figure
3.1b).
A
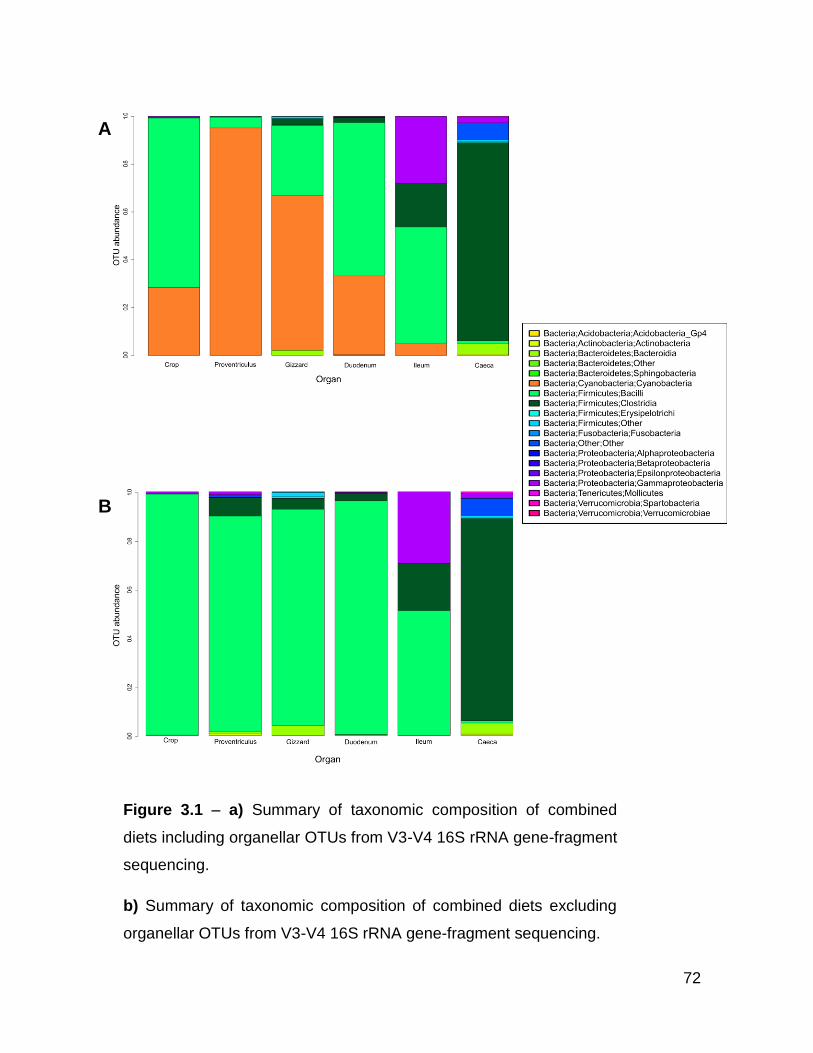
72
Figure 3.1 – a) Summary of taxonomic composition of combined
diets including organellar OTUs from V3-V4 16S rRNA gene-fragment
sequencing.
b) Summary of taxonomic composition of combined diets excluding
organellar OTUs from V3-V4 16S rRNA gene-fragment sequencing.
B
A
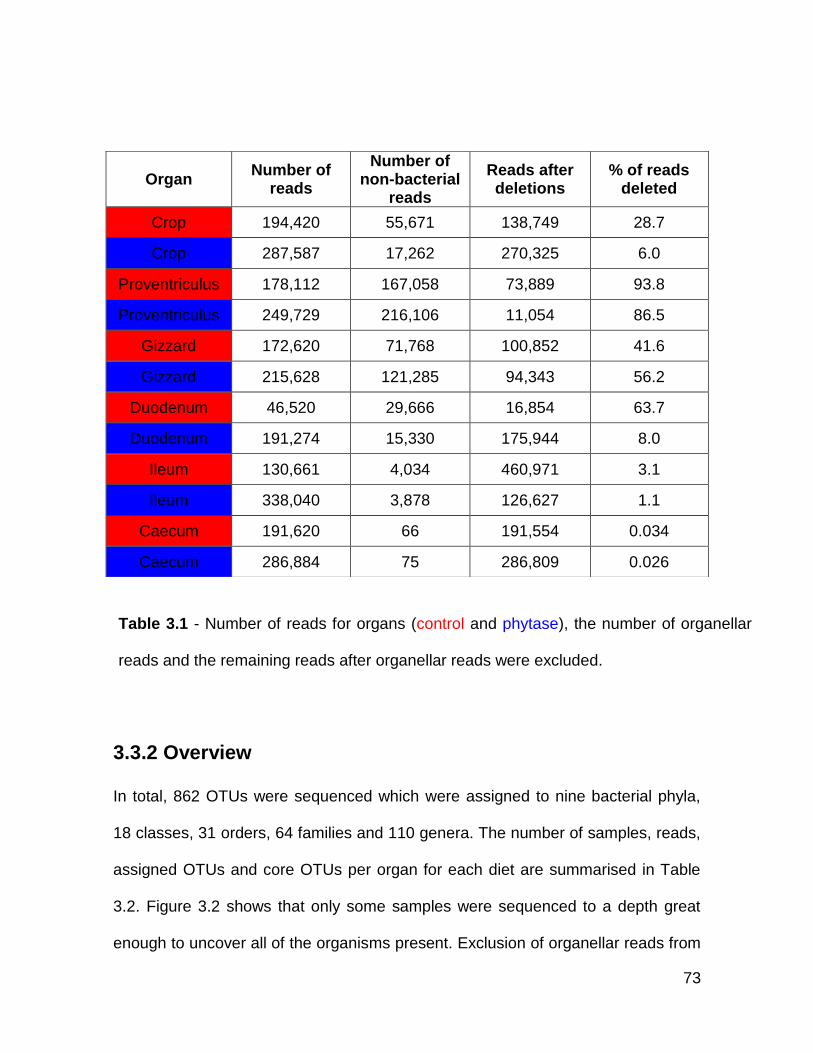
73
3.3.2 Overview
In total, 862 OTUs were sequenced which were assigned to nine bacterial phyla,
18 classes, 31 orders, 64 families and 110 genera. The number of samples, reads,
assigned OTUs and core OTUs per organ for each diet are summarised in Table
3.2. Figure 3.2 shows that only some samples were sequenced to a depth great
enough to uncover all of the organisms present. Exclusion of organellar reads from
Organ Number of
reads
Number of non-bacterial
reads
Reads after deletions
% of reads deleted
Crop 194,420 55,671 138,749 28.7
Crop 287,587 17,262 270,325 6.0
Proventriculus 178,112 167,058 73,889 93.8
Proventriculus 249,729 216,106 11,054 86.5
Gizzard 172,620 71,768 100,852 41.6
Gizzard 215,628 121,285 94,343 56.2
Duodenum 46,520 29,666 16,854 63.7
Duodenum 191,274 15,330 175,944 8.0
Ileum 130,661 4,034 460,971 3.1
Ileum 338,040 3,878 126,627 1.1
Caecum 191,620 66 191,554 0.034
Caecum 286,884 75 286,809 0.026
Table 3.1 - Number of reads for organs (control and phytase), the number of organellar
reads and the remaining reads after organellar reads were excluded.
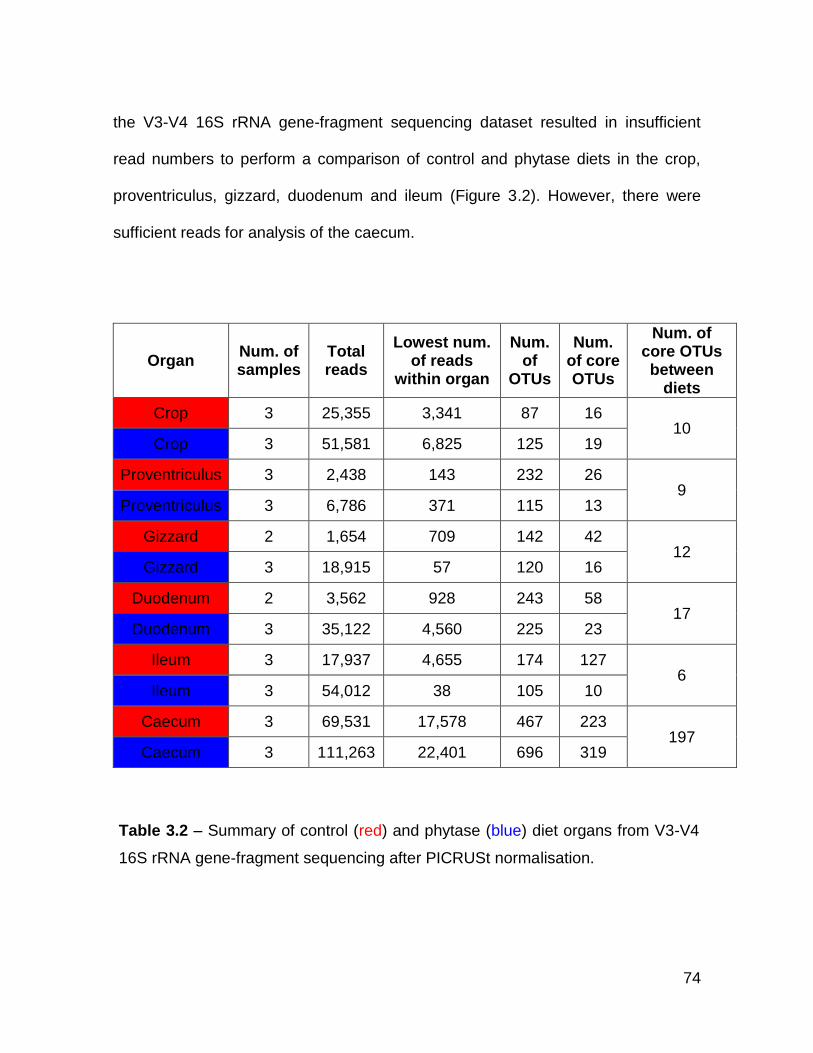
74
Table 3.2 – Summary of control (red) and phytase (blue) diet organs from V3-V4
16S rRNA gene-fragment sequencing after PICRUSt normalisation.
the V3-V4 16S rRNA gene-fragment sequencing dataset resulted in insufficient
read numbers to perform a comparison of control and phytase diets in the crop,
proventriculus, gizzard, duodenum and ileum (Figure 3.2). However, there were
sufficient reads for analysis of the caecum.
Organ Num. of samples
Total reads
Lowest num. of reads
within organ
Num. of
OTUs
Num. of core OTUs
Num. of core OTUs between
diets
Crop 3 25,355 3,341 87 16 10
Crop 3 51,581 6,825 125 19
Proventriculus 3 2,438 143 232 26 9
Proventriculus 3 6,786 371 115 13
Gizzard 2 1,654 709 142 42 12
Gizzard 3 18,915 57 120 16
Duodenum 2 3,562 928 243 58 17
Duodenum 3 35,122 4,560 225 23
Ileum 3 17,937 4,655 174 127 6
Ileum 3 54,012 38 105 10
Caecum 3 69,531 17,578 467 223 197
Caecum 3 111,263 22,401 696 319

75
A
B
Figure 3.2 – a) Number of observed species against the number of sequences in
control-diet organs.
b) Number of observed species against the number of sequences in phytase-diet
organs.
*error bars are S.E.M
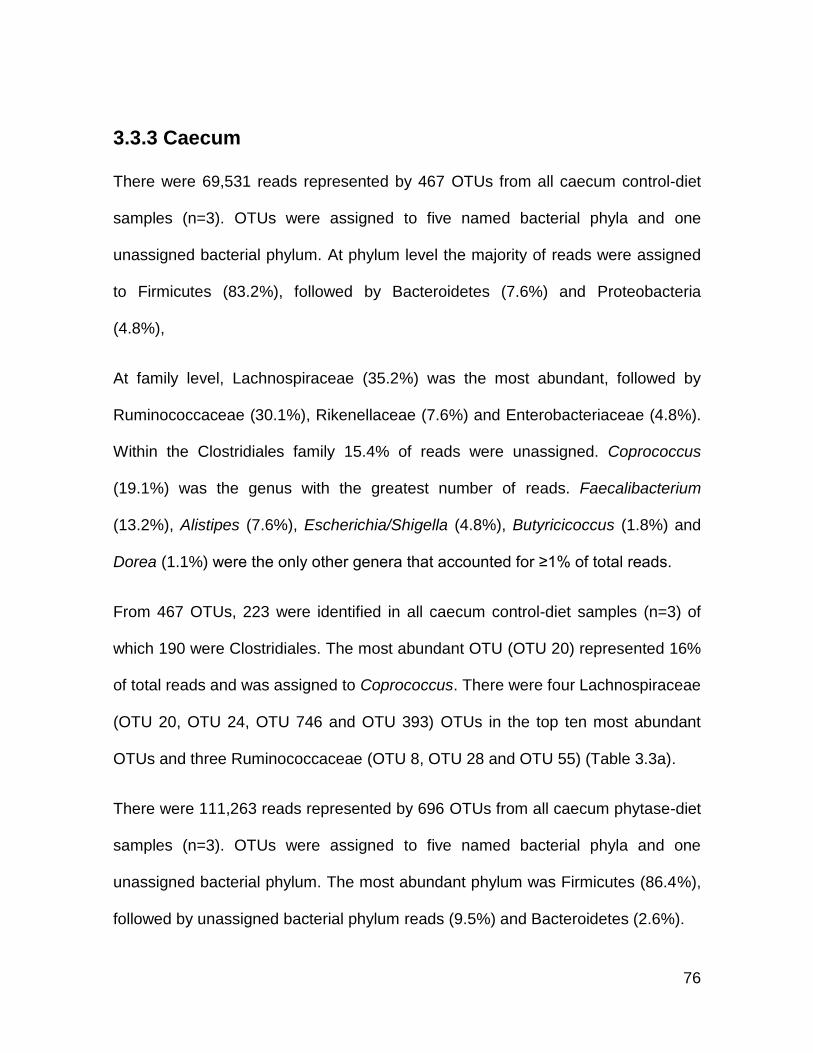
76
3.3.3 Caecum
There were 69,531 reads represented by 467 OTUs from all caecum control-diet
samples (n=3). OTUs were assigned to five named bacterial phyla and one
unassigned bacterial phylum. At phylum level the majority of reads were assigned
to Firmicutes (83.2%), followed by Bacteroidetes (7.6%) and Proteobacteria
(4.8%),
At family level, Lachnospiraceae (35.2%) was the most abundant, followed by
Ruminococcaceae (30.1%), Rikenellaceae (7.6%) and Enterobacteriaceae (4.8%).
Within the Clostridiales family 15.4% of reads were unassigned. Coprococcus
(19.1%) was the genus with the greatest number of reads. Faecalibacterium
(13.2%), Alistipes (7.6%), Escherichia/Shigella (4.8%), Butyricicoccus (1.8%) and
Dorea (1.1%) were the only other genera that accounted for ≥1% of total reads.
From 467 OTUs, 223 were identified in all caecum control-diet samples (n=3) of
which 190 were Clostridiales. The most abundant OTU (OTU 20) represented 16%
of total reads and was assigned to Coprococcus. There were four Lachnospiraceae
(OTU 20, OTU 24, OTU 746 and OTU 393) OTUs in the top ten most abundant
OTUs and three Ruminococcaceae (OTU 8, OTU 28 and OTU 55) (Table 3.3a).
There were 111,263 reads represented by 696 OTUs from all caecum phytase-diet
samples (n=3). OTUs were assigned to five named bacterial phyla and one
unassigned bacterial phylum. The most abundant phylum was Firmicutes (86.4%),
followed by unassigned bacterial phylum reads (9.5%) and Bacteroidetes (2.6%).
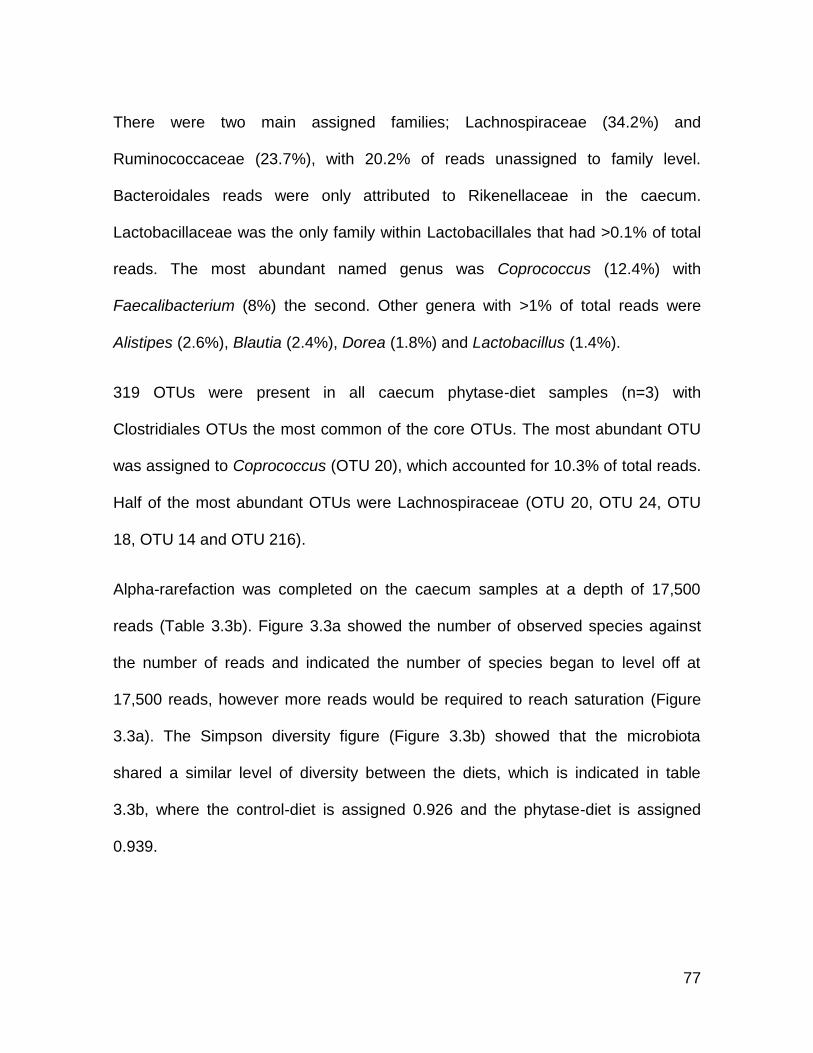
77
There were two main assigned families; Lachnospiraceae (34.2%) and
Ruminococcaceae (23.7%), with 20.2% of reads unassigned to family level.
Bacteroidales reads were only attributed to Rikenellaceae in the caecum.
Lactobacillaceae was the only family within Lactobacillales that had >0.1% of total
reads. The most abundant named genus was Coprococcus (12.4%) with
Faecalibacterium (8%) the second. Other genera with >1% of total reads were
Alistipes (2.6%), Blautia (2.4%), Dorea (1.8%) and Lactobacillus (1.4%).
319 OTUs were present in all caecum phytase-diet samples (n=3) with
Clostridiales OTUs the most common of the core OTUs. The most abundant OTU
was assigned to Coprococcus (OTU 20), which accounted for 10.3% of total reads.
Half of the most abundant OTUs were Lachnospiraceae (OTU 20, OTU 24, OTU
18, OTU 14 and OTU 216).
Alpha-rarefaction was completed on the caecum samples at a depth of 17,500
reads (Table 3.3b). Figure 3.3a showed the number of observed species against
the number of reads and indicated the number of species began to level off at
17,500 reads, however more reads would be required to reach saturation (Figure
3.3a). The Simpson diversity figure (Figure 3.3b) showed that the microbiota
shared a similar level of diversity between the diets, which is indicated in table
3.3b, where the control-diet is assigned 0.926 and the phytase-diet is assigned
0.939.
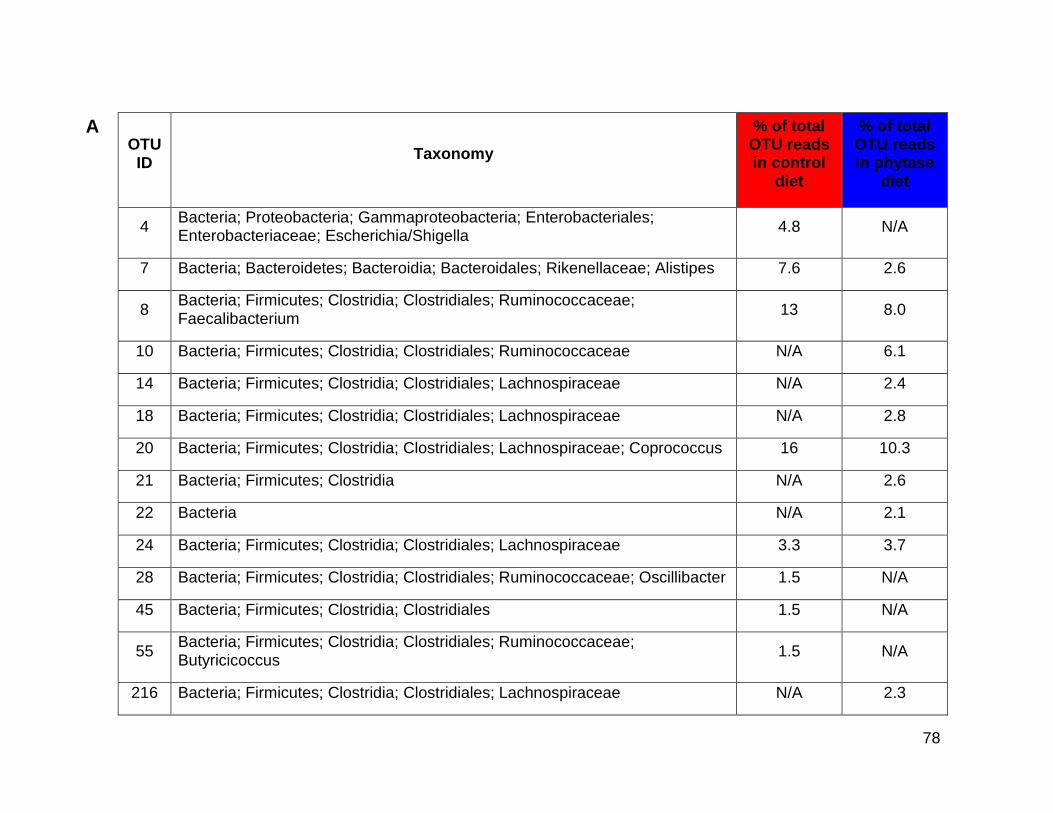
78
OTU ID
Taxonomy
% of total OTU reads in control
diet
% of total OTU reads in phytase
diet
4 Bacteria; Proteobacteria; Gammaproteobacteria; Enterobacteriales; Enterobacteriaceae; Escherichia/Shigella
4.8 N/A
7 Bacteria; Bacteroidetes; Bacteroidia; Bacteroidales; Rikenellaceae; Alistipes 7.6 2.6
8 Bacteria; Firmicutes; Clostridia; Clostridiales; Ruminococcaceae; Faecalibacterium
13 8.0
10 Bacteria; Firmicutes; Clostridia; Clostridiales; Ruminococcaceae N/A 6.1
14 Bacteria; Firmicutes; Clostridia; Clostridiales; Lachnospiraceae N/A 2.4
18 Bacteria; Firmicutes; Clostridia; Clostridiales; Lachnospiraceae N/A 2.8
20 Bacteria; Firmicutes; Clostridia; Clostridiales; Lachnospiraceae; Coprococcus 16 10.3
21 Bacteria; Firmicutes; Clostridia N/A 2.6
22 Bacteria N/A 2.1
24 Bacteria; Firmicutes; Clostridia; Clostridiales; Lachnospiraceae 3.3 3.7
28 Bacteria; Firmicutes; Clostridia; Clostridiales; Ruminococcaceae; Oscillibacter 1.5 N/A
45 Bacteria; Firmicutes; Clostridia; Clostridiales 1.5 N/A
55 Bacteria; Firmicutes; Clostridia; Clostridiales; Ruminococcaceae; Butyricicoccus
1.5 N/A
216 Bacteria; Firmicutes; Clostridia; Clostridiales; Lachnospiraceae N/A 2.3
A
79
OTU ID
Taxonomy
% of total OTU reads in control
diet
% of total OTU reads in phytase
diet
393 Bacteria; Firmicutes; Clostridia; Clostridiales; Lachnospiraceae; Coprococcus 1.4 N/A
746 Bacteria; Firmicutes; Clostridia; Clostridiales; Lachnospiraceae 2.8 N/A
Diet Seqs/Sample Chao1 Ave.
Chao1 Err.
Observed species
Ave.
Observed species
Err.
Shannon Ave.
Shannon Err.
Simpson Ave.
Simpson Err
Control 17,500 307.662 31.747 257.9 28.281 5.229 0.482 0.926 0.034
Phytase 17,500 420.146 17.507 348.933 23.606 5.701 0.479 0.939 0.033
Table 3.3 – a) Top ten abundant OTUs after V3-V4 16S rRNA gene-fragment sequencing of control and phytase
diet caecum samples.
b) Alpha rarefaction results of the caecum from control and phytase diet samples after V3-V4 16S rRNA gene-
fragment sequencing.
B
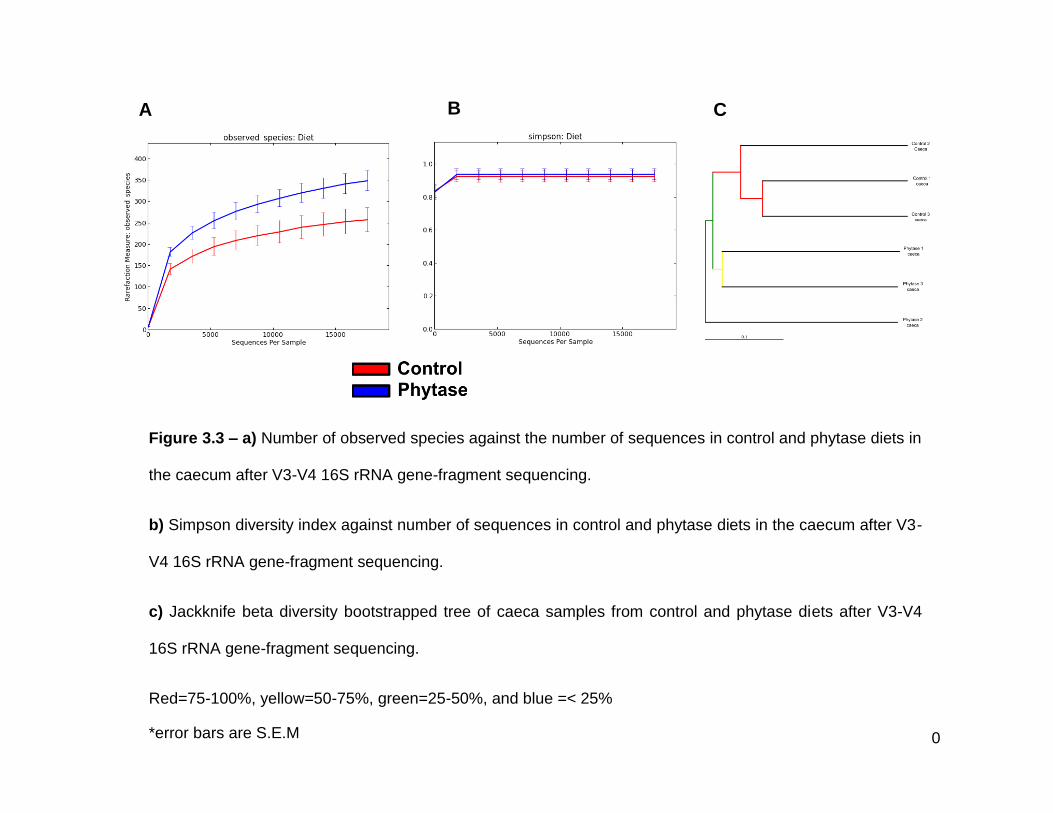
80
Figure 3.3 – a) Number of observed species against the number of sequences in control and phytase diets in
the caecum after V3-V4 16S rRNA gene-fragment sequencing.
b) Simpson diversity index against number of sequences in control and phytase diets in the caecum after V3-
V4 16S rRNA gene-fragment sequencing.
c) Jackknife beta diversity bootstrapped tree of caeca samples from control and phytase diets after V3-V4
16S rRNA gene-fragment sequencing.
Red=75-100%, yellow=50-75%, green=25-50%, and blue =< 25%
*error bars are S.E.M
B A C
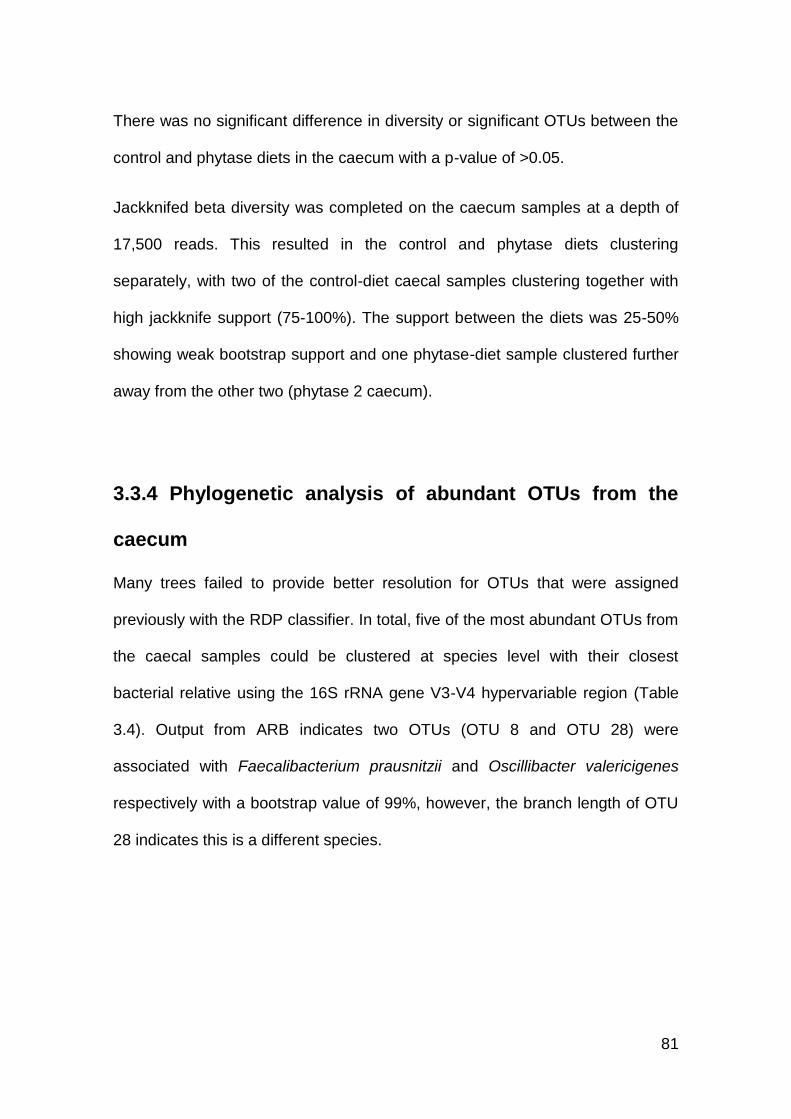
81
There was no significant difference in diversity or significant OTUs between the
control and phytase diets in the caecum with a p-value of >0.05.
Jackknifed beta diversity was completed on the caecum samples at a depth of
17,500 reads. This resulted in the control and phytase diets clustering
separately, with two of the control-diet caecal samples clustering together with
high jackknife support (75-100%). The support between the diets was 25-50%
showing weak bootstrap support and one phytase-diet sample clustered further
away from the other two (phytase 2 caecum).
3.3.4 Phylogenetic analysis of abundant OTUs from the
caecum
Many trees failed to provide better resolution for OTUs that were assigned
previously with the RDP classifier. In total, five of the most abundant OTUs from
the caecal samples could be clustered at species level with their closest
bacterial relative using the 16S rRNA gene V3-V4 hypervariable region (Table
3.4). Output from ARB indicates two OTUs (OTU 8 and OTU 28) were
associated with Faecalibacterium prausnitzii and Oscillibacter valericigenes
respectively with a bootstrap value of 99%, however, the branch length of OTU
28 indicates this is a different species.
82
3.4 Discussion
This study used V3-V4 16S rRNA gene-fragment sequencing to study bacteria
in the crop, proventriculus, gizzard, duodenum, ileum and caecum from
chickens fed either a normal diet or a diet supplemented with phytase. To the
authors’ knowledge, this is the first study to sequence the microbiota of the
proventriculus and to use V3-V4 16S rRNA gene-fragment sequencing to study
multiple regions of the chicken gut.
In this study, there were two major issues with using V3-V4 16S rRNA gene-
fragment sequencing to survey the chicken gut microbiota. The first problem
arose when trying to amplify the V3-V4 region from the DNA from the gizzard
OTU Closest bacterial relative
7 Alistipes putredinis
8 Faecalibacterium prausnitzii
20 Ruminococcus torques
28 Oscillibacter valericigenes
55 Eubacterium desmolans
Table 3.4 – Five most abundant OTUs from V3-V4 16S rRNA gene-
fragment sequencing of caecal samples, which were placed in an
ARB tree with >50% confidence levels and their closest bacterial
relative
83
and duodenum of the control-diet samples. Multiple attempts were made to
amplify a product from two samples, using a range of PCR cycling conditions,
primer concentrations, template DNA concentrations and indices. However, all
failed. The second issue was the V3-V4 primers amplified organellar DNA
present in the digesta from the feed consumed by the chicken. As this study
was only interested in non-organellar bacteria, all chloroplast reads were
removed and in some organs this resulted in the loss of over 600,000 reads.
Due to the absence and/or low number of reads within samples it was not
possible to generate reliable and accurate alpha rarefaction comparison data or
beta diversity statistics for all organs.
The identification of 862 OTUs and 110 genera were similar to those found by
Wei et al. (2013). However, the recovery of OTUs and genera were probably
limited due to the abundance of chloroplast assigned reads in this study. The
abundance of chloroplast reads was highest in the proventriculus and lowest in
the caecum. This could be because the bacterial load in the proventriculus is
among the lowest in the gut whereas the caeca has the highest bacterial load.
Furthermore, the digesta has undergone relatively little degradation in the
foregut, thus the relative abundance of organellar DNA is increased. The
removal of sequences assigned to chloroplast OTUs made the analysis and
comparison of organs difficult due to the low number of reads remaining in each
sample.
A further limitation of 16S rRNA gene-fragment sequencing is the difficultly to
determine OTU taxonomy beyond genus level. Therefore, the functions of the
OTUs could be difficult to assign and predict. If the identified OTUs are
84
genotypically and phenotypically similar to their identified closest bacterial
relatives, then it could be assumed they would have similar traits to those
discussed.
Due to the caecum being the only organ to provide sufficient number of reads
after sequencing, this is the only organ discussed in detail with regards OTU
taxonomy. Alistipes putredinis was the closest bacterial relative to one of the
most abundant OTUs in the caecum. Although the species A. putredinis has not
been described within the chicken microbiota previously, Alistipes as a genus
(reclassified from Bacteroides in 2003) is commonly found in the gut [2, 90, 92,
93, 121]. A. putredinis is bile-resistant and produces volatile-fatty acids [200].
Any benefits of A. putredinis to the chicken gut are unknown. However,
organisms in the same genus are associated with increased FCR [149].
An OTU that Ruminococcus torques was the closest bacterial relative to,
occurred in high abundance in multiple parts of the chicken gut but was the
most abundant OTU in the caecum of both diets. It has previously been isolated
from the chicken caecum and has been linked with improved performance in the
caecum, perhaps because it can degrade mucin [5, 149, 201]. Mucin production
can fluctuate in chickens in response to probiotics, enzymes, antibiotics and
feed withdrawal [149, 202]. Furthermore, drops in nutrient availability within the
gut can cause mucolytic bacteria to use mucus as a substrate, thus reducing
the protective mucus layer [149]. The abundance of the R. torques in both diets
could indicate high mucin production in the caecum and particularly in the
control-diet allowing the organism to proliferate.
85
Eubacterium desmolans was the closest bacterial relative of OTU55, which was
abundant in the control caecal samples and has previously been identified by
16S rRNA gene sequencing of the caecum. In that study it was observed to fall
dramatically in chickens challenged with C. perfringens [137]. Eubacterium
species have been isolated from the chicken on multiple occasions and is
thought to be a dominant genus in the caecum in older chickens [91, 118, 121].
Inositol is the sole carbohydrate fermented by E. desmolans, which in
environments enriched with inositol results in the production of volatile-fatty
acids beneficial for chicken health [18, 183, 203].
This study found no significant difference in microbiota between control and
phytase diets in the caecum. However, differences could have been masked by
the low read numbers. The lack of usable data generated from 16S rRNA gene-
fragment sequencing of the V3-V4 hypervariable region led to the design and
use of primers that excluded chloroplast reads to enable greater depth of
sequencing of the microbiota within organs with high chloroplast abundance
(detailed in Chapter Four).
86
CHAPTER FOUR
4. Identification of the chicken gut
microbiota using V4-V6 16S rRNA
gene-fragment sequencing
87
4.1 Introduction
This chapter followed up on the 16S rRNA gene-fragment sequencing of the
microbiota within the chicken gut. The V4-V6 hypervariable region of the 16S rRNA
gene was sequenced in this study due to the amplification and sequencing of
chloroplast DNA when using the V3-V4 16S rRNA gene-fragment which resulted in
the exclusion of over 600,000 reads (as detailed in Chapter Three). Using the V4-
V6 16S rRNA gene region almost mitigated this problem and allowed for deeper
sequencing of samples to provide greater insight into the microbiota present in
chloroplast dominant organs.
Chloroplasts are evolutionarily descended from bacteria and thus there is a
homology between the 16S rRNA genes [204, 205]. There are limited regions of
the 16S rRNA gene that allow almost universal bacterial 16S rRNA gene
amplification without chloroplast amplification and the use of the 799F primer in this
study was because chloroplast 16S rRNA genes have two base pair mismatches at
798 and 799 (E. coli numbering) [205].
The same samples that were sequenced with V3-V4 16S rRNA gene-fragment
primers were sequenced with V4-V6 rRNA gene-fragment primers (Table 2.4).
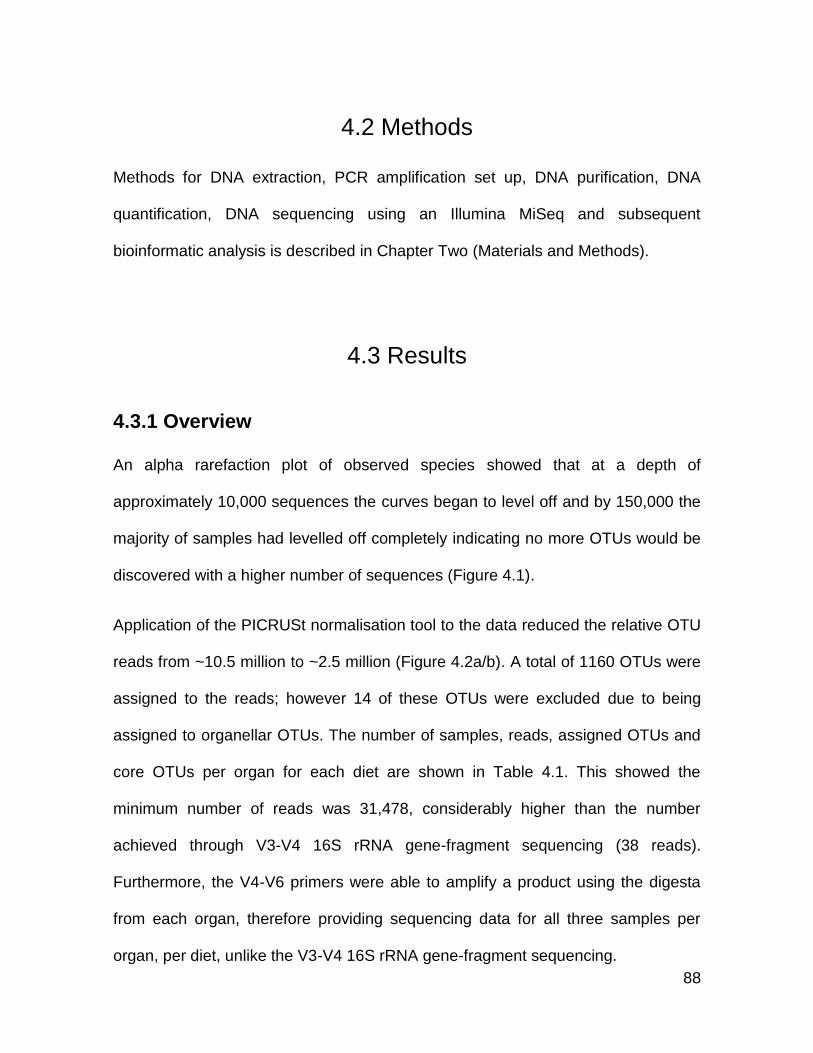
88
4.2 Methods
Methods for DNA extraction, PCR amplification set up, DNA purification, DNA
quantification, DNA sequencing using an Illumina MiSeq and subsequent
bioinformatic analysis is described in Chapter Two (Materials and Methods).
4.3 Results
4.3.1 Overview
An alpha rarefaction plot of observed species showed that at a depth of
approximately 10,000 sequences the curves began to level off and by 150,000 the
majority of samples had levelled off completely indicating no more OTUs would be
discovered with a higher number of sequences (Figure 4.1).
Application of the PICRUSt normalisation tool to the data reduced the relative OTU
reads from ~10.5 million to ~2.5 million (Figure 4.2a/b). A total of 1160 OTUs were
assigned to the reads; however 14 of these OTUs were excluded due to being
assigned to organellar OTUs. The number of samples, reads, assigned OTUs and
core OTUs per organ for each diet are shown in Table 4.1. This showed the
minimum number of reads was 31,478, considerably higher than the number
achieved through V3-V4 16S rRNA gene-fragment sequencing (38 reads).
Furthermore, the V4-V6 primers were able to amplify a product using the digesta
from each organ, therefore providing sequencing data for all three samples per
organ, per diet, unlike the V3-V4 16S rRNA gene-fragment sequencing.
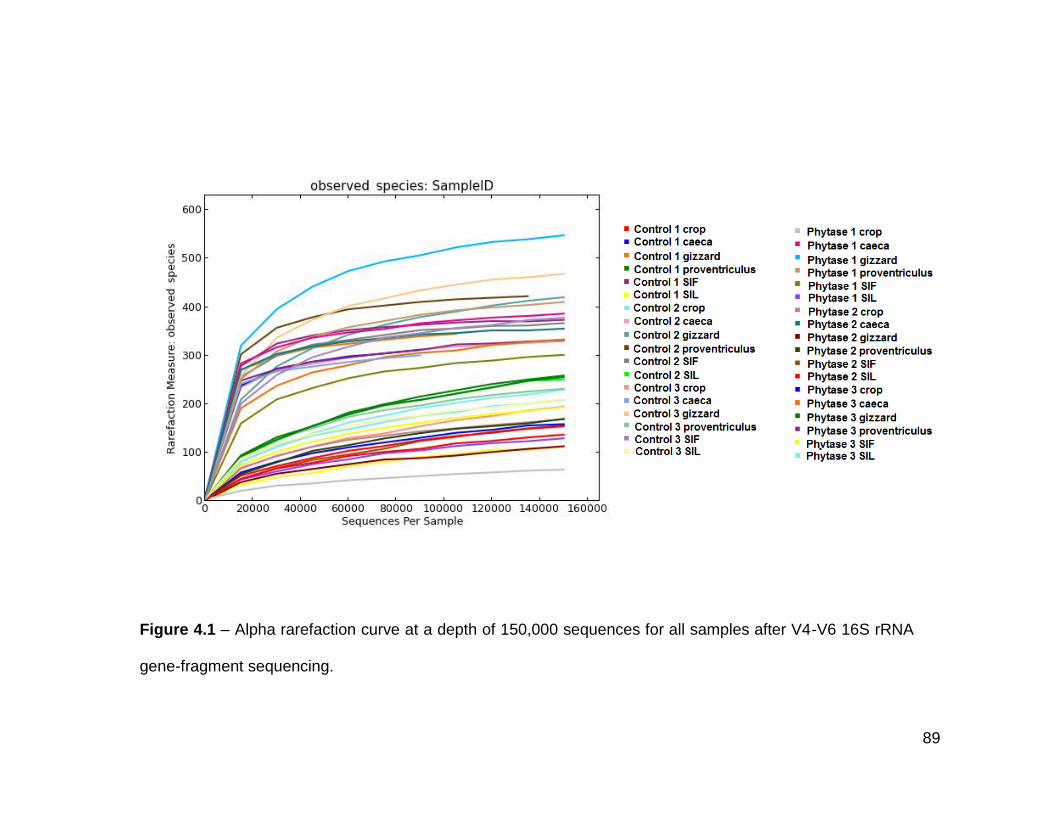
89
Figure 4.1 – Alpha rarefaction curve at a depth of 150,000 sequences for all samples after V4-V6 16S rRNA
gene-fragment sequencing.
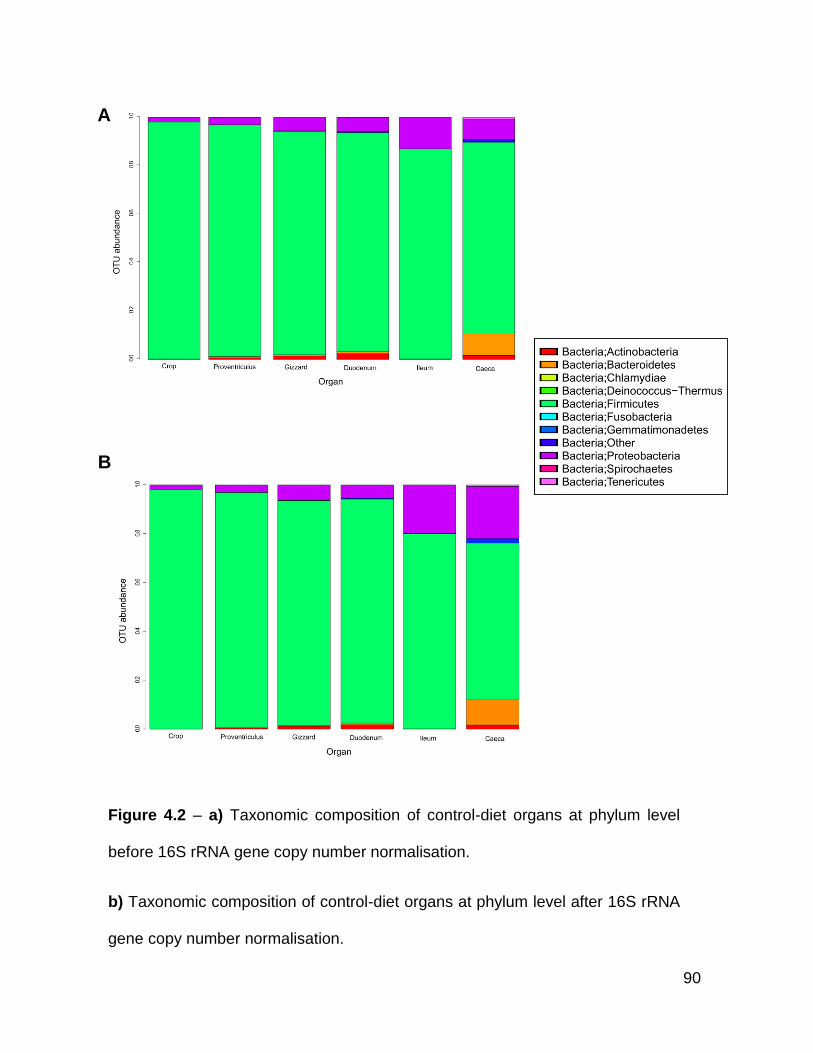
90
Figure 4.2 – a) Taxonomic composition of control-diet organs at phylum level
before 16S rRNA gene copy number normalisation.
b) Taxonomic composition of control-diet organs at phylum level after 16S rRNA
gene copy number normalisation.
A
B
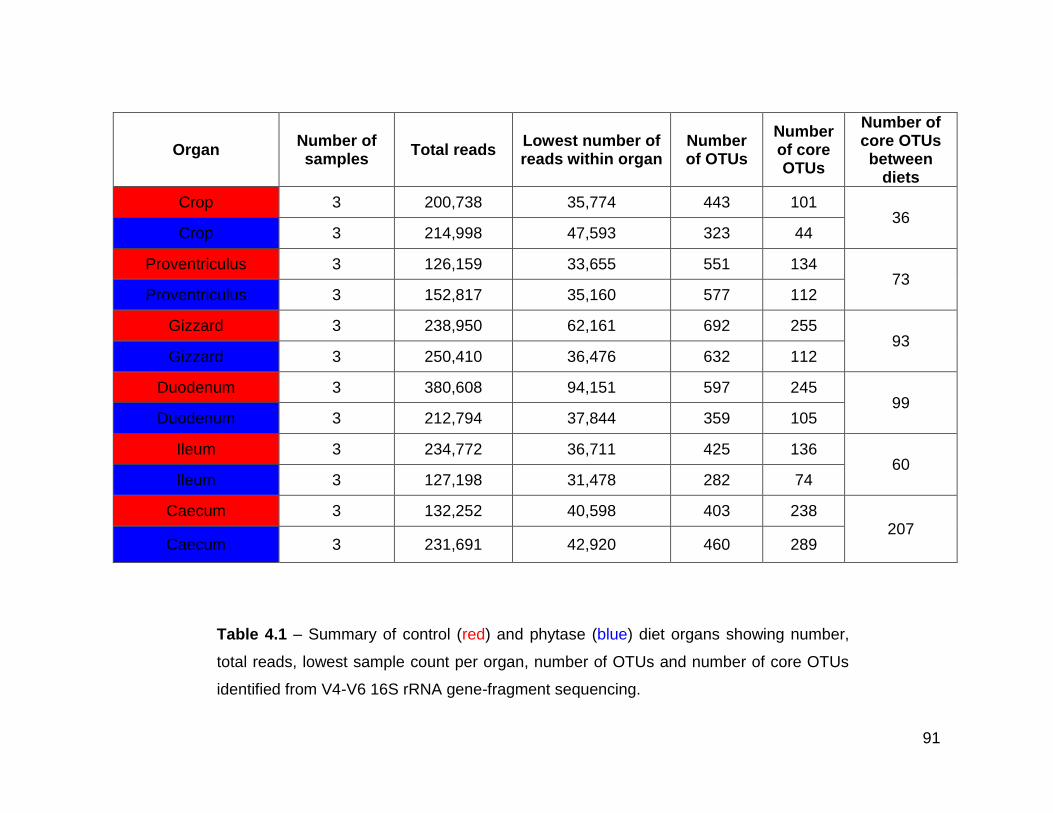
91
Organ Number of samples
Total reads Lowest number of reads within organ
Number of OTUs
Number of core OTUs
Number of core OTUs between
diets
Crop 3 200,738 35,774 443 101 36
Crop 3 214,998 47,593 323 44
Proventriculus 3 126,159 33,655 551 134 73
Proventriculus 3 152,817 35,160 577 112
Gizzard 3 238,950 62,161 692 255 93
Gizzard 3 250,410 36,476 632 112
Duodenum 3 380,608 94,151 597 245 99
Duodenum 3 212,794 37,844 359 105
Ileum 3 234,772 36,711 425 136 60
Ileum 3 127,198 31,478 282 74
Caecum 3 132,252 40,598 403 238 207
Caecum 3 231,691 42,920 460 289
Table 4.1 – Summary of control (red) and phytase (blue) diet organs showing number,
total reads, lowest sample count per organ, number of OTUs and number of core OTUs
identified from V4-V6 16S rRNA gene-fragment sequencing.
92
4.3.2 Crop
200,378 reads were obtained from three control-diet samples. These were
assigned to 443 OTUs, which belonged to eight bacterial phyla and one
unassigned bacterial phylum. The majority of reads were assigned to Lactobacillus
(83.1%) and Bacilli (14%). 101 OTUs were present in all crop control-diet samples.
Of the most abundant OTUs, four were assigned to Lactobacillus (OTU 1, OTU 0,
OTU 595 and OTU 820) with one OTU unassigned past Bacilli (OTU 579). OTU 1
was the most abundant and contributed ~56% of total reads (Table 4.2a).
214,998 reads were obtained from three crop phytase-diet samples. These were
assigned to 323 OTUs, which belonged to six bacterial phyla and one unassigned
bacterial phylum. Lactobacillus formed the most abundant genus with 96.7% of
total reads. The next most abundant named genus was Escherichia/Shigella with
0.1% of total reads. 44 OTUs were present in all crop phytase-diet samples. Four
of the five most abundant OTUs were assigned to Lactobacillus. OTU 0 was the
most abundant (~83%) and was assigned to a Lactobacillus. The second most
abundant OTU (OTU 1) was responsible for 9.9% of reads and the remaining
OTUs represented much lower percentages (Table 4.2a).
Alpha rarefaction of the crop samples from the two diets was used at a depth of
35,000 reads (Table 4.2b). Figure 4.3a showed the number of observed species
begins to level off at 35,000 reads and therefore the majority of OTUs had been
discovered in both diets. The Simpson’s diversity metric indicated that on average
93
the microbiota associated with the control-diet (0.56±0.12) was more diverse than
the phytase-diet (0.30±0.25) (Figure 4.3b).
There was no significant difference in diversity of the microbiota between the
control and phytase-diets in the crop (p >0.05). Furthermore, no significantly
abundant OTUs between the diets in crop samples were identified.
Jackknife beta diversity showed the samples did not cluster by diet (Figure 4.3c).
Control 1 crop and control 2 crop formed a branch with high bootstrap values
(75%-100%); however, these were the only samples from the same diet that
clustered together.
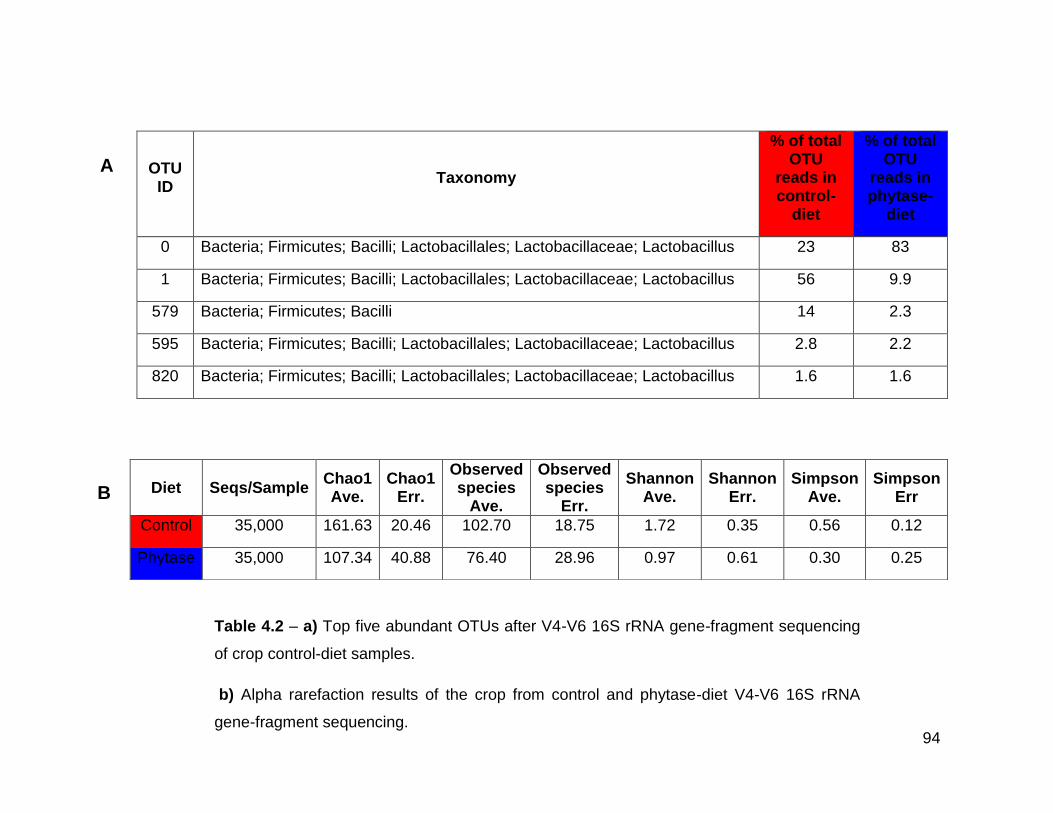
94
OTU ID
Taxonomy
% of total OTU
reads in control-
diet
% of total OTU
reads in phytase-
diet
0 Bacteria; Firmicutes; Bacilli; Lactobacillales; Lactobacillaceae; Lactobacillus 23 83
1 Bacteria; Firmicutes; Bacilli; Lactobacillales; Lactobacillaceae; Lactobacillus 56 9.9
579 Bacteria; Firmicutes; Bacilli 14 2.3
595 Bacteria; Firmicutes; Bacilli; Lactobacillales; Lactobacillaceae; Lactobacillus 2.8 2.2
820 Bacteria; Firmicutes; Bacilli; Lactobacillales; Lactobacillaceae; Lactobacillus 1.6 1.6
Diet Seqs/Sample Chao1 Ave.
Chao1 Err.
Observed species
Ave.
Observed species
Err.
Shannon Ave.
Shannon Err.
Simpson Ave.
Simpson Err
Control 35,000 161.63 20.46 102.70 18.75 1.72 0.35 0.56 0.12
Phytase 35,000 107.34 40.88 76.40 28.96 0.97 0.61 0.30 0.25
Table 4.2 – a) Top five abundant OTUs after V4-V6 16S rRNA gene-fragment sequencing
of crop control-diet samples.
b) Alpha rarefaction results of the crop from control and phytase-diet V4-V6 16S rRNA
gene-fragment sequencing.
A
B
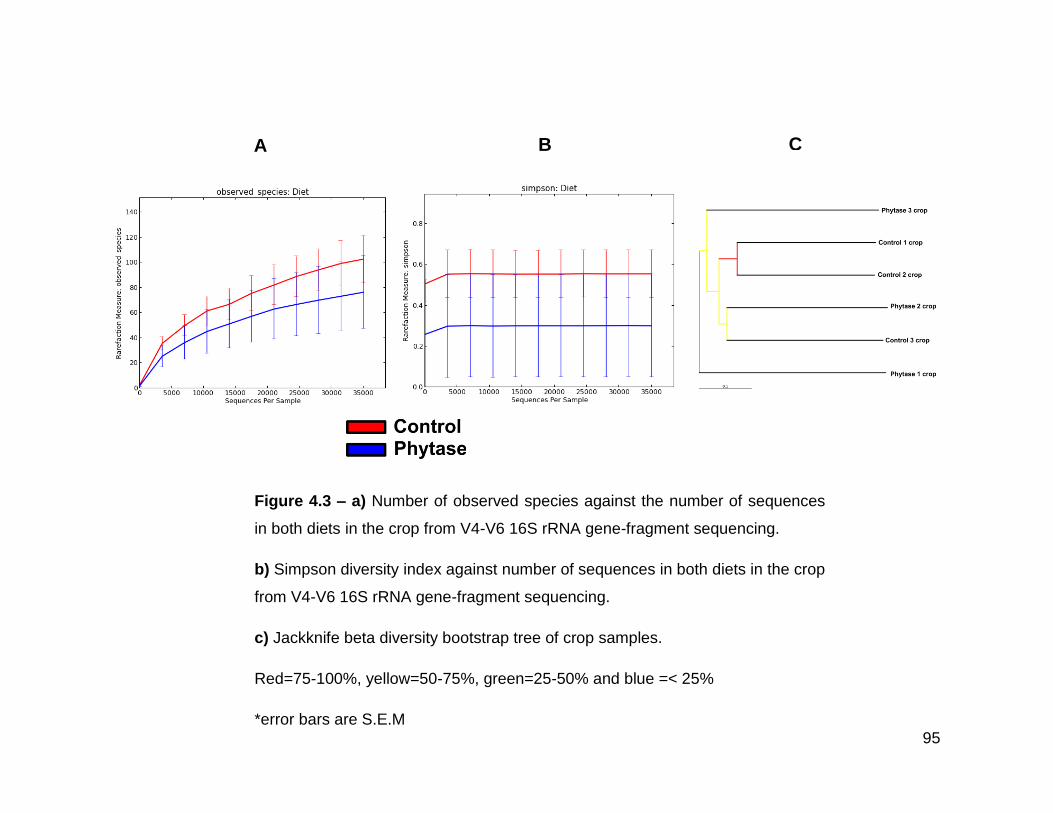
95
Figure 4.3 – a) Number of observed species against the number of sequences
in both diets in the crop from V4-V6 16S rRNA gene-fragment sequencing.
b) Simpson diversity index against number of sequences in both diets in the crop
from V4-V6 16S rRNA gene-fragment sequencing.
c) Jackknife beta diversity bootstrap tree of crop samples.
Red=75-100%, yellow=50-75%, green=25-50% and blue =< 25%
*error bars are S.E.M
A B C
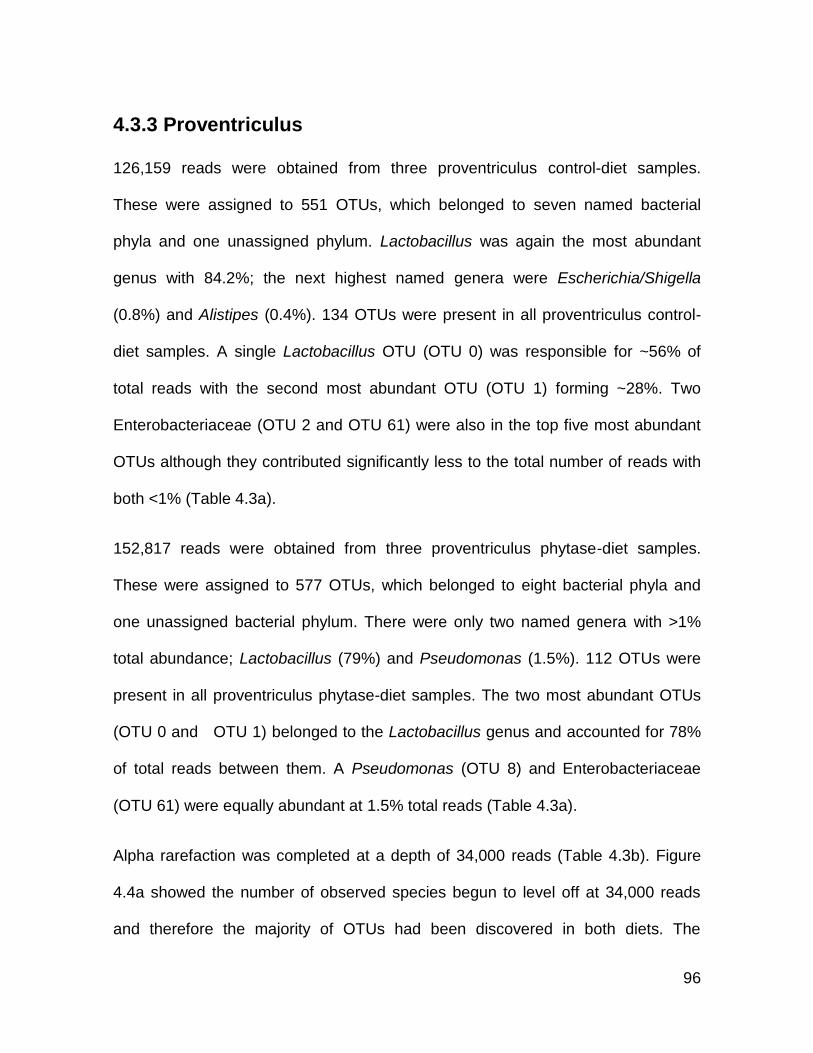
96
4.3.3 Proventriculus
126,159 reads were obtained from three proventriculus control-diet samples.
These were assigned to 551 OTUs, which belonged to seven named bacterial
phyla and one unassigned phylum. Lactobacillus was again the most abundant
genus with 84.2%; the next highest named genera were Escherichia/Shigella
(0.8%) and Alistipes (0.4%). 134 OTUs were present in all proventriculus control-
diet samples. A single Lactobacillus OTU (OTU 0) was responsible for ~56% of
total reads with the second most abundant OTU (OTU 1) forming ~28%. Two
Enterobacteriaceae (OTU 2 and OTU 61) were also in the top five most abundant
OTUs although they contributed significantly less to the total number of reads with
both <1% (Table 4.3a).
152,817 reads were obtained from three proventriculus phytase-diet samples.
These were assigned to 577 OTUs, which belonged to eight bacterial phyla and
one unassigned bacterial phylum. There were only two named genera with >1%
total abundance; Lactobacillus (79%) and Pseudomonas (1.5%). 112 OTUs were
present in all proventriculus phytase-diet samples. The two most abundant OTUs
(OTU 0 and OTU 1) belonged to the Lactobacillus genus and accounted for 78%
of total reads between them. A Pseudomonas (OTU 8) and Enterobacteriaceae
(OTU 61) were equally abundant at 1.5% total reads (Table 4.3a).
Alpha rarefaction was completed at a depth of 34,000 reads (Table 4.3b). Figure
4.4a showed the number of observed species begun to level off at 34,000 reads
and therefore the majority of OTUs had been discovered in both diets. The
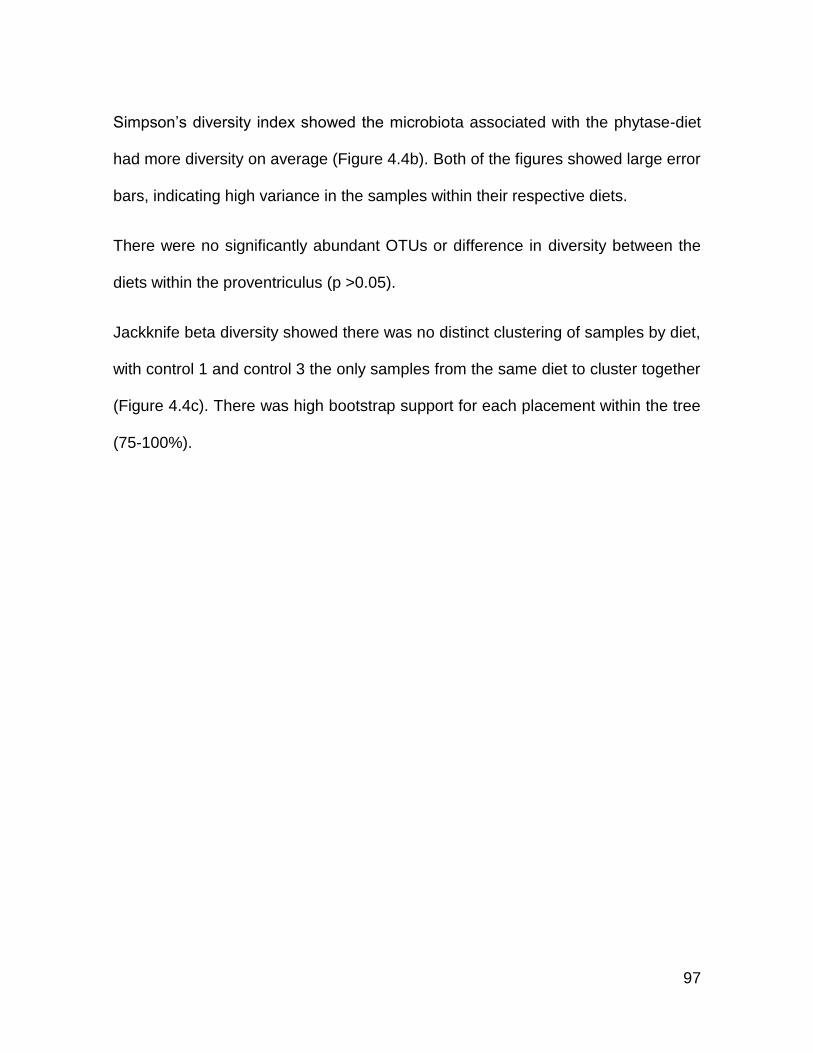
97
Simpson’s diversity index showed the microbiota associated with the phytase-diet
had more diversity on average (Figure 4.4b). Both of the figures showed large error
bars, indicating high variance in the samples within their respective diets.
There were no significantly abundant OTUs or difference in diversity between the
diets within the proventriculus (p >0.05).
Jackknife beta diversity showed there was no distinct clustering of samples by diet,
with control 1 and control 3 the only samples from the same diet to cluster together
(Figure 4.4c). There was high bootstrap support for each placement within the tree
(75-100%).
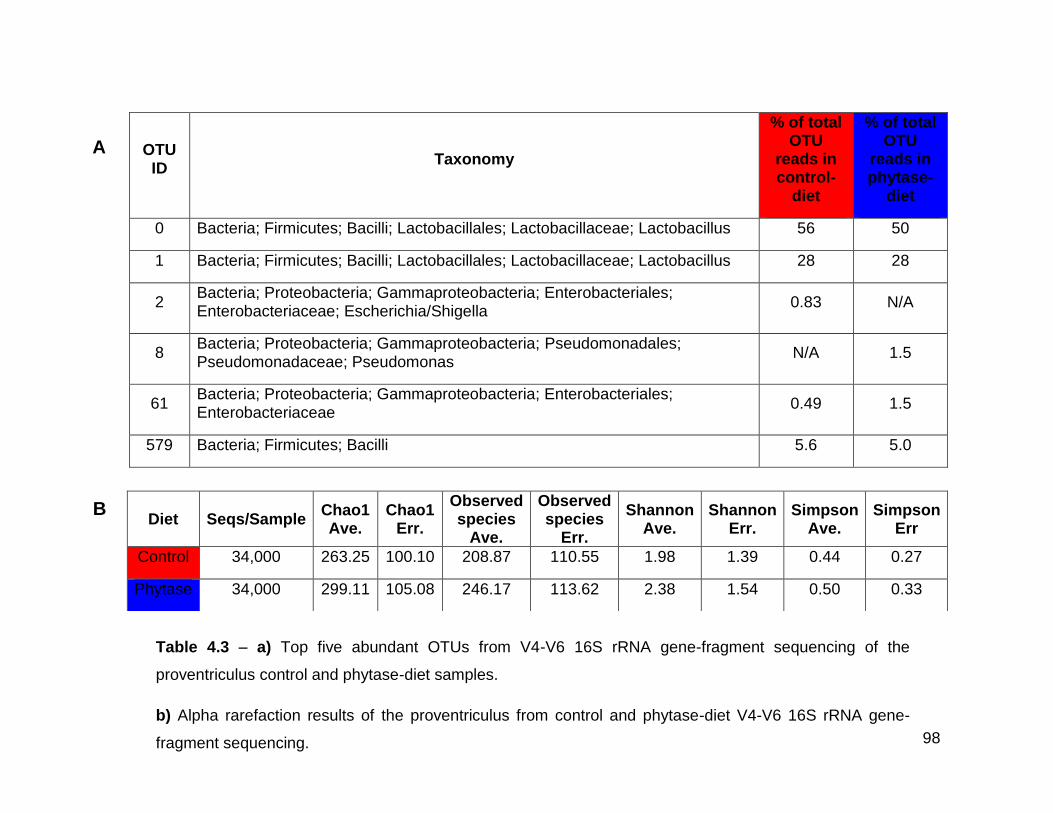
98
OTU ID
Taxonomy
% of total OTU
reads in control-
diet
% of total OTU
reads in phytase-
diet
0 Bacteria; Firmicutes; Bacilli; Lactobacillales; Lactobacillaceae; Lactobacillus 56 50
1 Bacteria; Firmicutes; Bacilli; Lactobacillales; Lactobacillaceae; Lactobacillus 28 28
2 Bacteria; Proteobacteria; Gammaproteobacteria; Enterobacteriales; Enterobacteriaceae; Escherichia/Shigella
0.83 N/A
8 Bacteria; Proteobacteria; Gammaproteobacteria; Pseudomonadales; Pseudomonadaceae; Pseudomonas
N/A 1.5
61 Bacteria; Proteobacteria; Gammaproteobacteria; Enterobacteriales; Enterobacteriaceae
0.49 1.5
579 Bacteria; Firmicutes; Bacilli 5.6 5.0
Diet Seqs/Sample Chao1 Ave.
Chao1 Err.
Observed species
Ave.
Observed species
Err.
Shannon Ave.
Shannon Err.
Simpson Ave.
Simpson Err
Control 34,000 263.25 100.10 208.87 110.55 1.98 1.39 0.44 0.27
Phytase 34,000 299.11 105.08 246.17 113.62 2.38 1.54 0.50 0.33
Table 4.3 – a) Top five abundant OTUs from V4-V6 16S rRNA gene-fragment sequencing of the
proventriculus control and phytase-diet samples.
b) Alpha rarefaction results of the proventriculus from control and phytase-diet V4-V6 16S rRNA gene-
fragment sequencing.
A
B
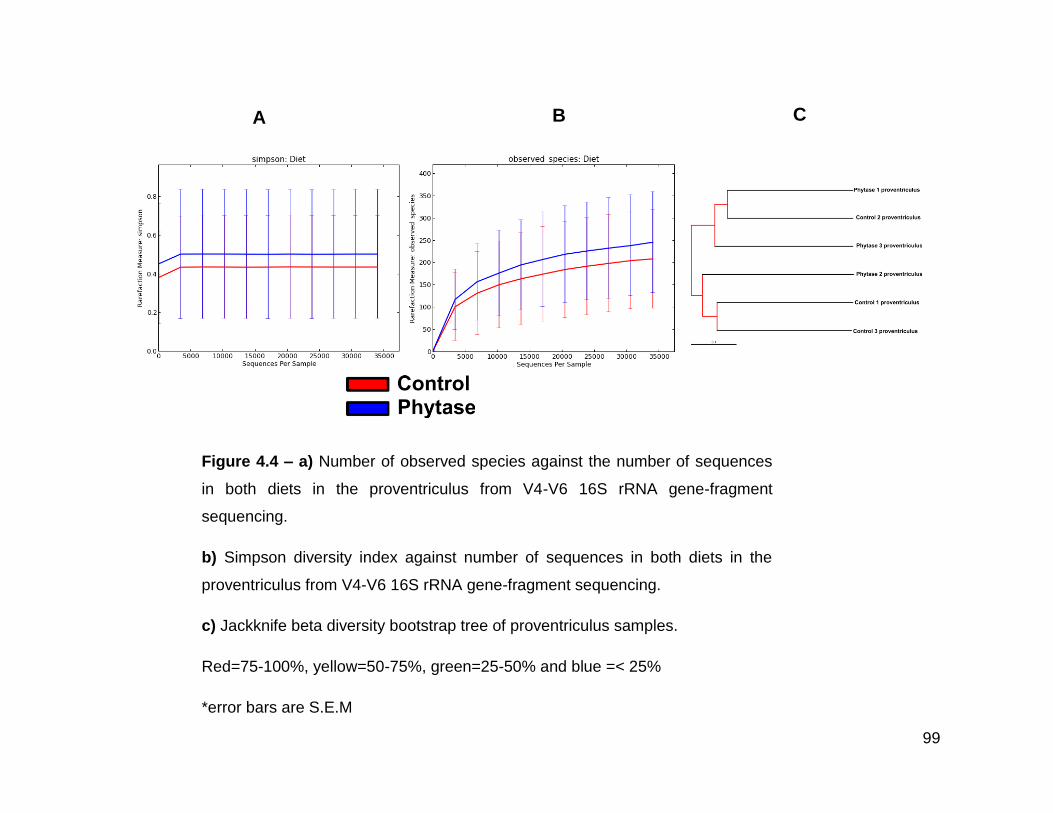
99
Figure 4.4 – a) Number of observed species against the number of sequences
in both diets in the proventriculus from V4-V6 16S rRNA gene-fragment
sequencing.
b) Simpson diversity index against number of sequences in both diets in the
proventriculus from V4-V6 16S rRNA gene-fragment sequencing.
c) Jackknife beta diversity bootstrap tree of proventriculus samples.
Red=75-100%, yellow=50-75%, green=25-50% and blue =< 25%
*error bars are S.E.M
B A C
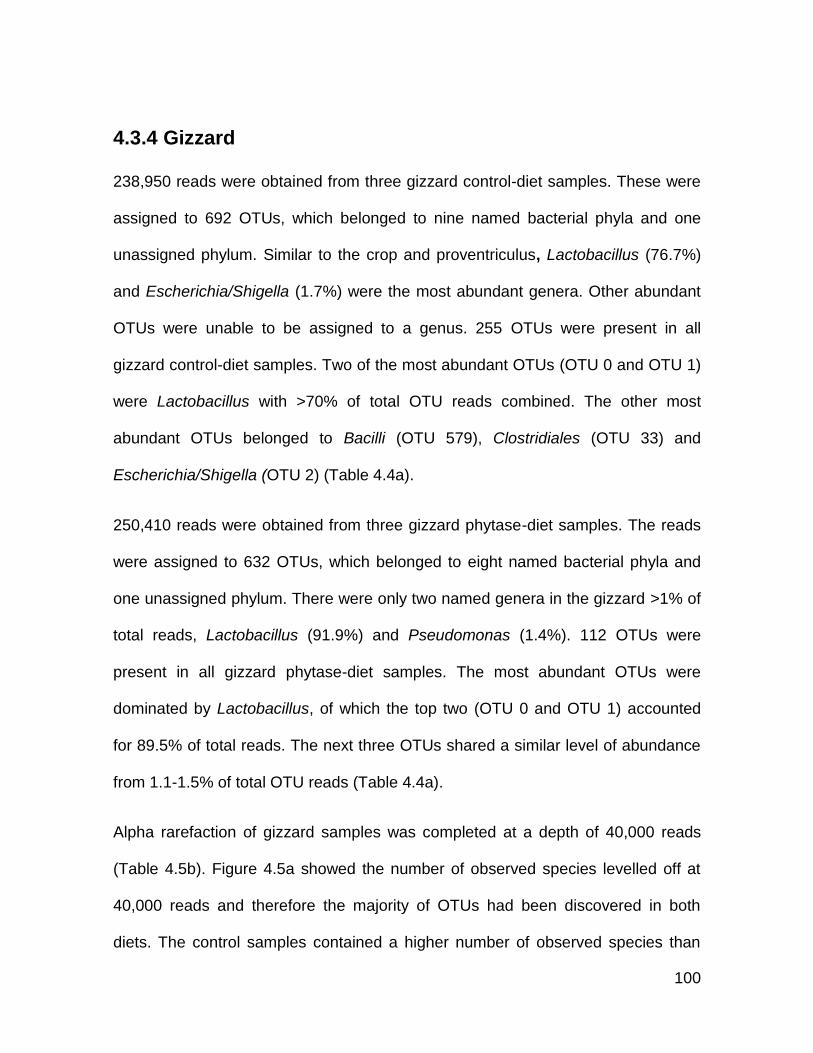
100
4.3.4 Gizzard
238,950 reads were obtained from three gizzard control-diet samples. These were
assigned to 692 OTUs, which belonged to nine named bacterial phyla and one
unassigned phylum. Similar to the crop and proventriculus, Lactobacillus (76.7%)
and Escherichia/Shigella (1.7%) were the most abundant genera. Other abundant
OTUs were unable to be assigned to a genus. 255 OTUs were present in all
gizzard control-diet samples. Two of the most abundant OTUs (OTU 0 and OTU 1)
were Lactobacillus with >70% of total OTU reads combined. The other most
abundant OTUs belonged to Bacilli (OTU 579), Clostridiales (OTU 33) and
Escherichia/Shigella (OTU 2) (Table 4.4a).
250,410 reads were obtained from three gizzard phytase-diet samples. The reads
were assigned to 632 OTUs, which belonged to eight named bacterial phyla and
one unassigned phylum. There were only two named genera in the gizzard >1% of
total reads, Lactobacillus (91.9%) and Pseudomonas (1.4%). 112 OTUs were
present in all gizzard phytase-diet samples. The most abundant OTUs were
dominated by Lactobacillus, of which the top two (OTU 0 and OTU 1) accounted
for 89.5% of total reads. The next three OTUs shared a similar level of abundance
from 1.1-1.5% of total OTU reads (Table 4.4a).
Alpha rarefaction of gizzard samples was completed at a depth of 40,000 reads
(Table 4.5b). Figure 4.5a showed the number of observed species levelled off at
40,000 reads and therefore the majority of OTUs had been discovered in both
diets. The control samples contained a higher number of observed species than
101
the phytase samples on average. The Simpson’s diversity index showed the
microbiota associated with the control-diet had a higher level of diversity than the
phytase-diet (Figure 4.5b).
There were no significantly abundant OTUs or significant difference in diversity of
the microbiota between the diets within the gizzard. Jackknife beta diversity
analysis showed the samples did not cluster by diet (Figure 4.5c).
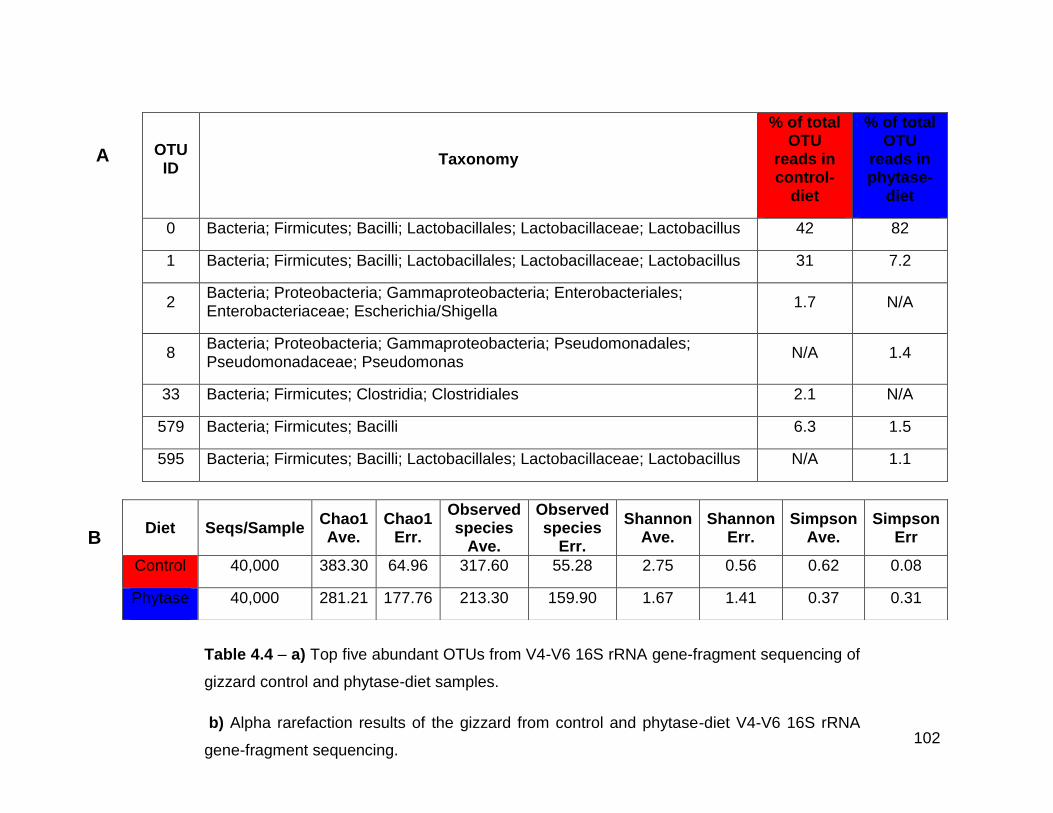
102
OTU ID
Taxonomy
% of total OTU
reads in control-
diet
% of total OTU
reads in phytase-
diet
0 Bacteria; Firmicutes; Bacilli; Lactobacillales; Lactobacillaceae; Lactobacillus 42 82
1 Bacteria; Firmicutes; Bacilli; Lactobacillales; Lactobacillaceae; Lactobacillus 31 7.2
2 Bacteria; Proteobacteria; Gammaproteobacteria; Enterobacteriales; Enterobacteriaceae; Escherichia/Shigella
1.7 N/A
8 Bacteria; Proteobacteria; Gammaproteobacteria; Pseudomonadales; Pseudomonadaceae; Pseudomonas
N/A 1.4
33 Bacteria; Firmicutes; Clostridia; Clostridiales 2.1 N/A
579 Bacteria; Firmicutes; Bacilli 6.3 1.5
595 Bacteria; Firmicutes; Bacilli; Lactobacillales; Lactobacillaceae; Lactobacillus N/A 1.1
Diet Seqs/Sample Chao1 Ave.
Chao1 Err.
Observed species
Ave.
Observed species
Err.
Shannon Ave.
Shannon Err.
Simpson Ave.
Simpson Err
Control 40,000 383.30 64.96 317.60 55.28 2.75 0.56 0.62 0.08
Phytase 40,000 281.21 177.76 213.30 159.90 1.67 1.41 0.37 0.31
Table 4.4 – a) Top five abundant OTUs from V4-V6 16S rRNA gene-fragment sequencing of
gizzard control and phytase-diet samples.
b) Alpha rarefaction results of the gizzard from control and phytase-diet V4-V6 16S rRNA
gene-fragment sequencing.
A
B
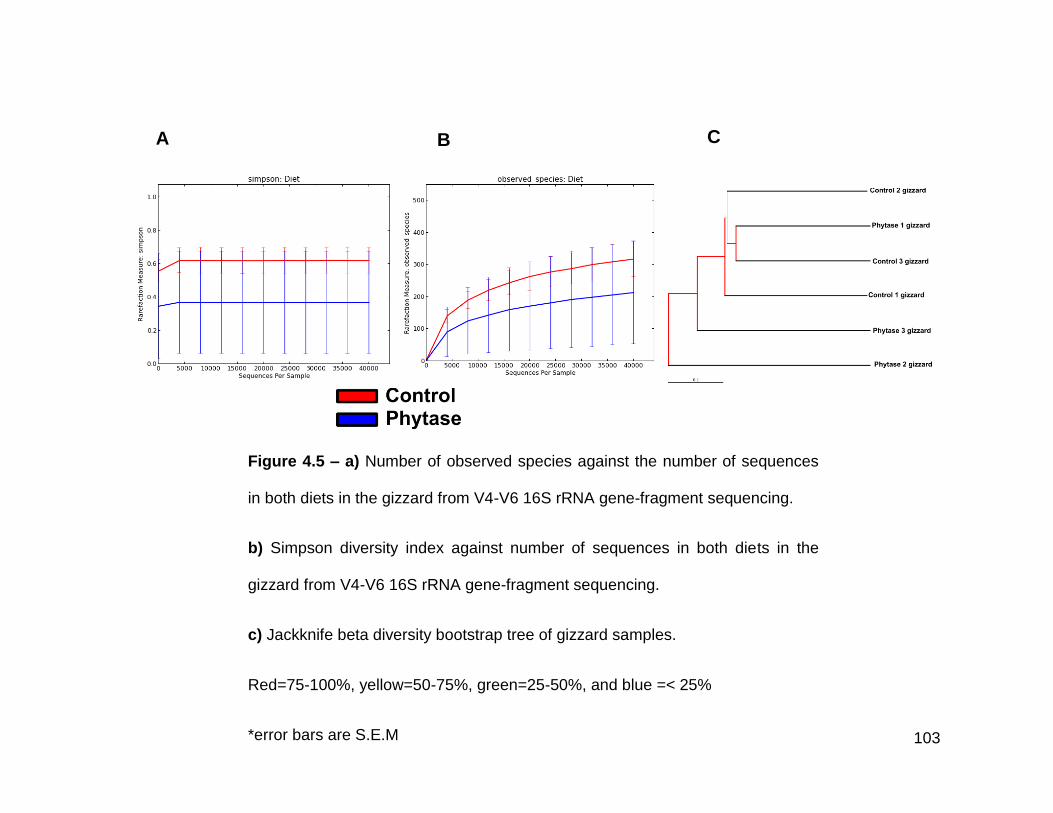
103
Figure 4.5 – a) Number of observed species against the number of sequences
in both diets in the gizzard from V4-V6 16S rRNA gene-fragment sequencing.
b) Simpson diversity index against number of sequences in both diets in the
gizzard from V4-V6 16S rRNA gene-fragment sequencing.
c) Jackknife beta diversity bootstrap tree of gizzard samples.
Red=75-100%, yellow=50-75%, green=25-50%, and blue =< 25%
*error bars are S.E.M
A B C
104
4.3.5 Duodenum
380,608 reads were obtained from three duodenum control-diet samples. These
were represented by 597 OTUs, which belonged to eight named bacterial phyla
and one unassigned phylum. The majority of reads were assigned to Firmicutes
(90.4%) with Proteobacteria (5.6%) and Actinobacteria (2.4%) the only other phyla
to account for >1% of total reads. Again, the most abundant genus was
Lactobacillus, which was responsible for all of the Bacilli reads (55.8%). The only
assigned genus in Lachnospiraceae was Dorea (1.6%) with all other reads unable
to be assigned. Herbaspirillum (2.8%), Bifidobacterium (1.6%) and
Escherichia/Shigella (1%) were the other genera responsible for ≥1% of total
reads. 245 OTUs were present in all duodenum control-diet samples. The first and
second most abundant OTUs (OTU 0 and OTU 1) in the duodenum were assigned
to Lactobacilli, which were responsible for 30% and 24% of total reads
respectively. A Clostridiales (OTU 3) and Bacilli (OTU 579) OTU were the next
most abundant, with a Herbaspirillum OTU (OTU 7) being the fifth most abundant
(Table 4.5a).
212,794 reads were obtained from three duodenum phytase-diet samples. These
were assigned to 359 OTUs, which belonged to seven named bacterial phyla and
one unassigned phylum. Firmicutes (99.6%) was the only phylum that had reads
>1%. The only assigned genus with >1% of reads was Lactobacillus (97.9%). The
next most abundant named genera were Alistipes, Escherichia/Shigella and Dorea,
which were all present at 0.1%. 105 OTUs were present in all duodenum samples;
the majority of these were Clostridia (n=59). The most abundant OTU (OTU 0) was
105
responsible for ~95% of all reads within the duodenum. The third, fourth and fifth
most abundant OTUs (OTU 820, OTU 579 and OTU 595) contributed <1% to the
total reads (Table 4.5a).
Alpha rarefaction of the duodenum samples was completed at a depth of 37,000
(Table 4.5b). Figure 4.6a showed the number of observed species levelled off at
37,000 and therefore the majority of OTUs had been discovered in both diets. The
control-diet contained more observed species than the phytase-diet; the difference
was also evident when observing the Simpson’s diversity index, with the plot
indicating the microbiota associated with the control-diet was more diverse than the
phytase-diet (Figure 4.6b).
Interestingly, there was one significantly abundant OTU (OTU 470, assigned to
Polyangiaceae) in the microbiota associated with the control-diet. There was no
significant difference in diversity of the microbiota between the control and
phytase-diets with a p-value of >0.05.
Jackknife beta diversity showed that two of the phytase samples (phytase 2
duodenum and phytase 3 duodenum) clustered with each other with high bootstrap
support in contrast to the other phytase organ samples. Control 1 duodenum and
control 2 duodenum clustered with 50-75% bootstrap values and were more similar
to control 3 duodenum and phytase 1 duodenum in diversity than the other
samples (Figure 4.6c).
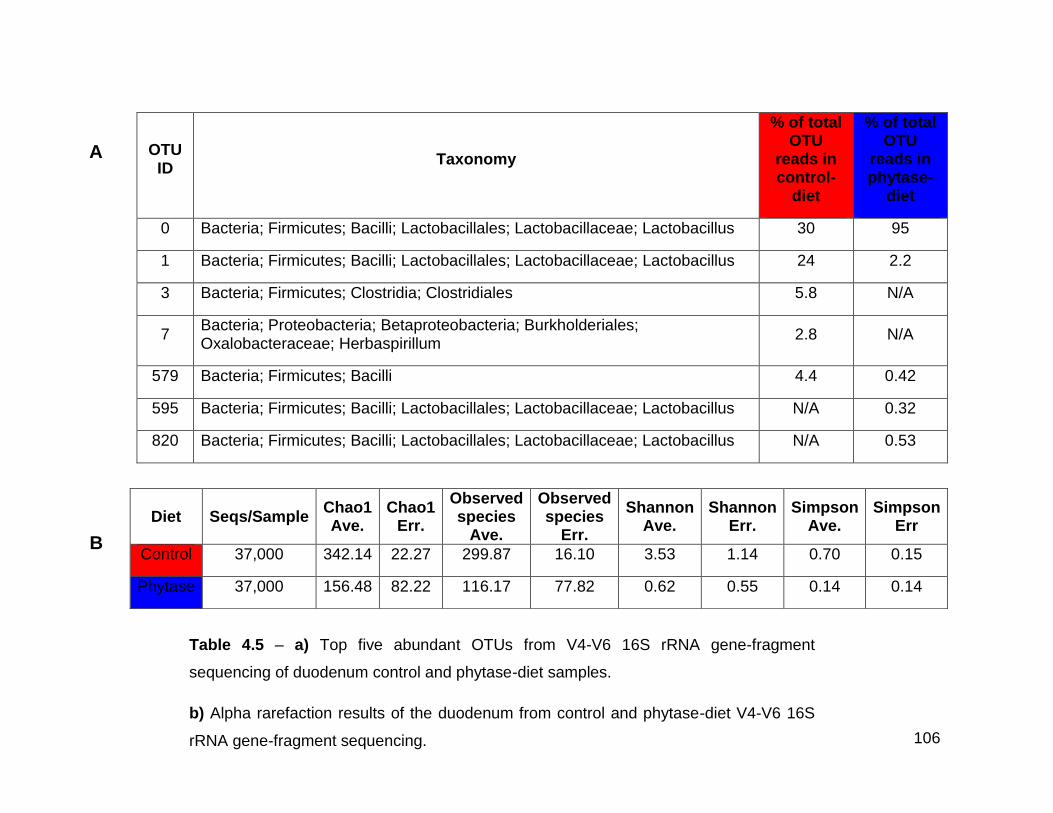
106
OTU ID
Taxonomy
% of total OTU
reads in control-
diet
% of total OTU
reads in phytase-
diet
0 Bacteria; Firmicutes; Bacilli; Lactobacillales; Lactobacillaceae; Lactobacillus 30 95
1 Bacteria; Firmicutes; Bacilli; Lactobacillales; Lactobacillaceae; Lactobacillus 24 2.2
3 Bacteria; Firmicutes; Clostridia; Clostridiales 5.8 N/A
7 Bacteria; Proteobacteria; Betaproteobacteria; Burkholderiales; Oxalobacteraceae; Herbaspirillum
2.8 N/A
579 Bacteria; Firmicutes; Bacilli 4.4 0.42
595 Bacteria; Firmicutes; Bacilli; Lactobacillales; Lactobacillaceae; Lactobacillus N/A 0.32
820 Bacteria; Firmicutes; Bacilli; Lactobacillales; Lactobacillaceae; Lactobacillus N/A 0.53
Diet Seqs/Sample Chao1 Ave.
Chao1 Err.
Observed species
Ave.
Observed species
Err.
Shannon Ave.
Shannon Err.
Simpson Ave.
Simpson Err
Control 37,000 342.14 22.27 299.87 16.10 3.53 1.14 0.70 0.15
Phytase 37,000 156.48 82.22 116.17 77.82 0.62 0.55 0.14 0.14
Table 4.5 – a) Top five abundant OTUs from V4-V6 16S rRNA gene-fragment
sequencing of duodenum control and phytase-diet samples.
b) Alpha rarefaction results of the duodenum from control and phytase-diet V4-V6 16S
rRNA gene-fragment sequencing.
A
B
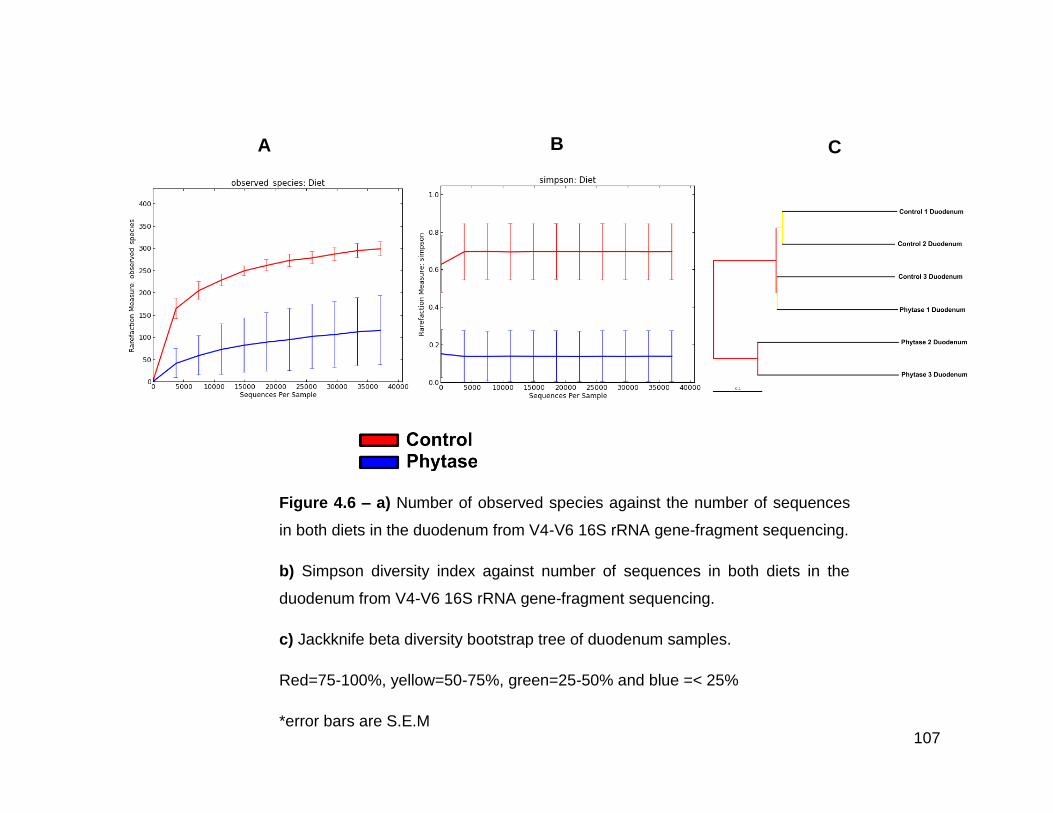
107
Figure 4.6 – a) Number of observed species against the number of sequences
in both diets in the duodenum from V4-V6 16S rRNA gene-fragment sequencing.
b) Simpson diversity index against number of sequences in both diets in the
duodenum from V4-V6 16S rRNA gene-fragment sequencing.
c) Jackknife beta diversity bootstrap tree of duodenum samples.
Red=75-100%, yellow=50-75%, green=25-50% and blue =< 25%
*error bars are S.E.M
B A C
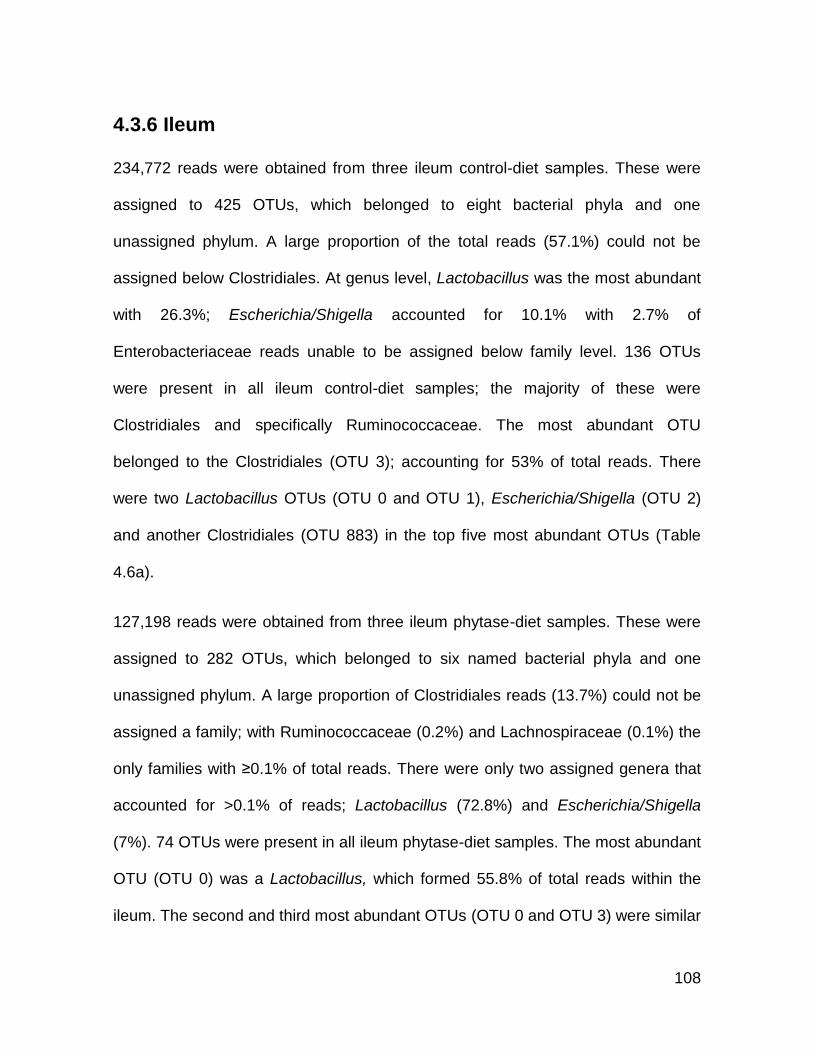
108
4.3.6 Ileum
234,772 reads were obtained from three ileum control-diet samples. These were
assigned to 425 OTUs, which belonged to eight bacterial phyla and one
unassigned phylum. A large proportion of the total reads (57.1%) could not be
assigned below Clostridiales. At genus level, Lactobacillus was the most abundant
with 26.3%; Escherichia/Shigella accounted for 10.1% with 2.7% of
Enterobacteriaceae reads unable to be assigned below family level. 136 OTUs
were present in all ileum control-diet samples; the majority of these were
Clostridiales and specifically Ruminococcaceae. The most abundant OTU
belonged to the Clostridiales (OTU 3); accounting for 53% of total reads. There
were two Lactobacillus OTUs (OTU 0 and OTU 1), Escherichia/Shigella (OTU 2)
and another Clostridiales (OTU 883) in the top five most abundant OTUs (Table
4.6a).
127,198 reads were obtained from three ileum phytase-diet samples. These were
assigned to 282 OTUs, which belonged to six named bacterial phyla and one
unassigned phylum. A large proportion of Clostridiales reads (13.7%) could not be
assigned a family; with Ruminococcaceae (0.2%) and Lachnospiraceae (0.1%) the
only families with ≥0.1% of total reads. There were only two assigned genera that
accounted for >0.1% of reads; Lactobacillus (72.8%) and Escherichia/Shigella
(7%). 74 OTUs were present in all ileum phytase-diet samples. The most abundant
OTU (OTU 0) was a Lactobacillus, which formed 55.8% of total reads within the
ileum. The second and third most abundant OTUs (OTU 0 and OTU 3) were similar
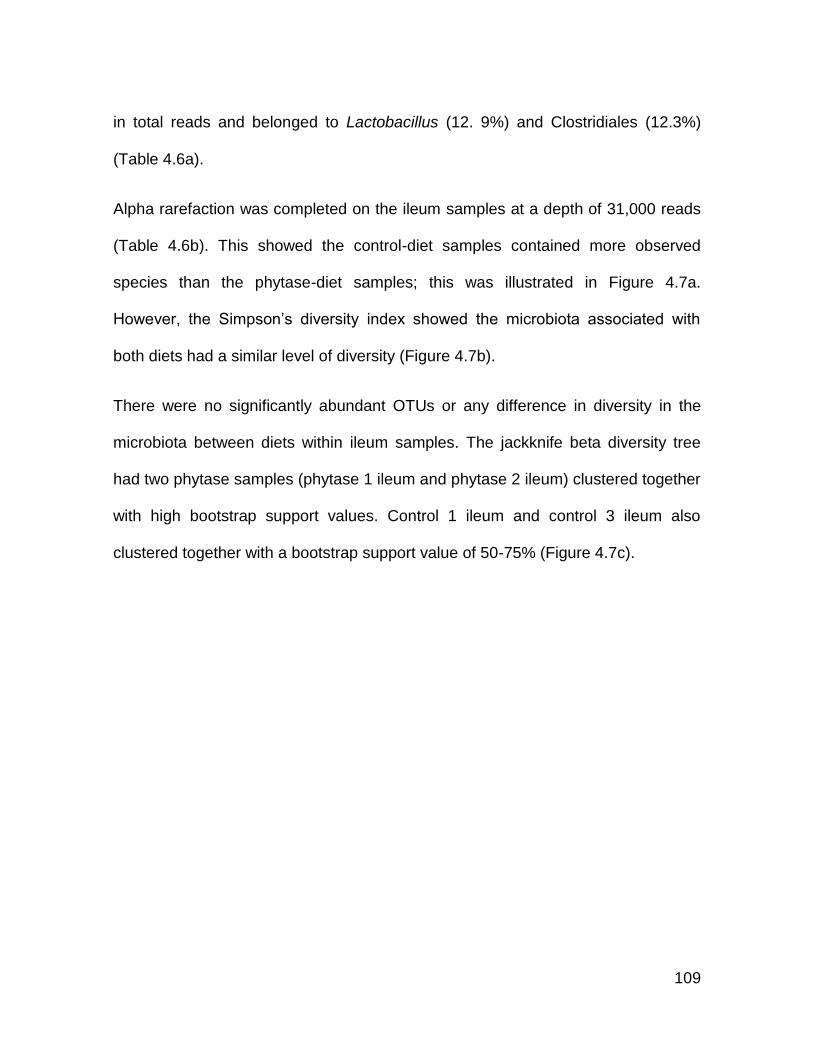
109
in total reads and belonged to Lactobacillus (12. 9%) and Clostridiales (12.3%)
(Table 4.6a).
Alpha rarefaction was completed on the ileum samples at a depth of 31,000 reads
(Table 4.6b). This showed the control-diet samples contained more observed
species than the phytase-diet samples; this was illustrated in Figure 4.7a.
However, the Simpson’s diversity index showed the microbiota associated with
both diets had a similar level of diversity (Figure 4.7b).
There were no significantly abundant OTUs or any difference in diversity in the
microbiota between diets within ileum samples. The jackknife beta diversity tree
had two phytase samples (phytase 1 ileum and phytase 2 ileum) clustered together
with high bootstrap support values. Control 1 ileum and control 3 ileum also
clustered together with a bootstrap support value of 50-75% (Figure 4.7c).
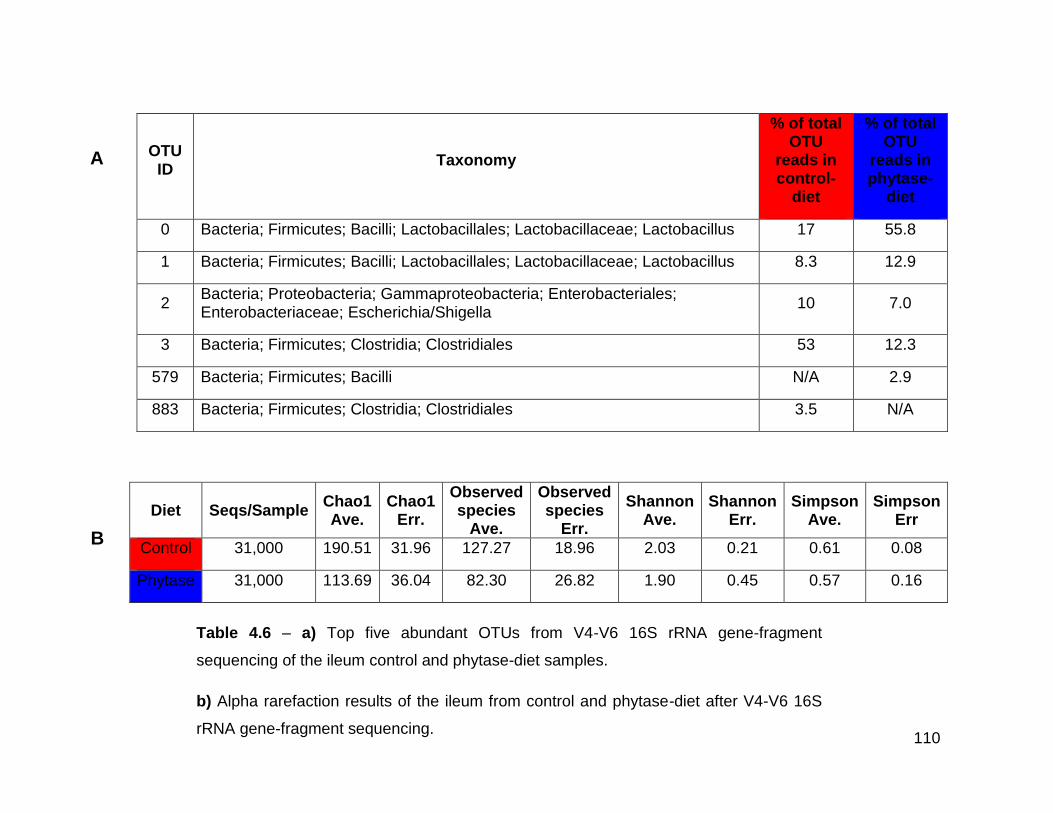
110
Diet Seqs/Sample Chao1 Ave.
Chao1 Err.
Observed species
Ave.
Observed species
Err.
Shannon Ave.
Shannon Err.
Simpson Ave.
Simpson Err
Control 31,000 190.51 31.96 127.27 18.96 2.03 0.21 0.61 0.08
Phytase 31,000 113.69 36.04 82.30 26.82 1.90 0.45 0.57 0.16
OTU ID
Taxonomy
% of total OTU
reads in control-
diet
% of total OTU
reads in phytase-
diet
0 Bacteria; Firmicutes; Bacilli; Lactobacillales; Lactobacillaceae; Lactobacillus 17 55.8
1 Bacteria; Firmicutes; Bacilli; Lactobacillales; Lactobacillaceae; Lactobacillus 8.3 12.9
2 Bacteria; Proteobacteria; Gammaproteobacteria; Enterobacteriales; Enterobacteriaceae; Escherichia/Shigella
10 7.0
3 Bacteria; Firmicutes; Clostridia; Clostridiales 53 12.3
579 Bacteria; Firmicutes; Bacilli N/A 2.9
883 Bacteria; Firmicutes; Clostridia; Clostridiales 3.5 N/A
Table 4.6 – a) Top five abundant OTUs from V4-V6 16S rRNA gene-fragment
sequencing of the ileum control and phytase-diet samples.
b) Alpha rarefaction results of the ileum from control and phytase-diet after V4-V6 16S
rRNA gene-fragment sequencing.
A
B
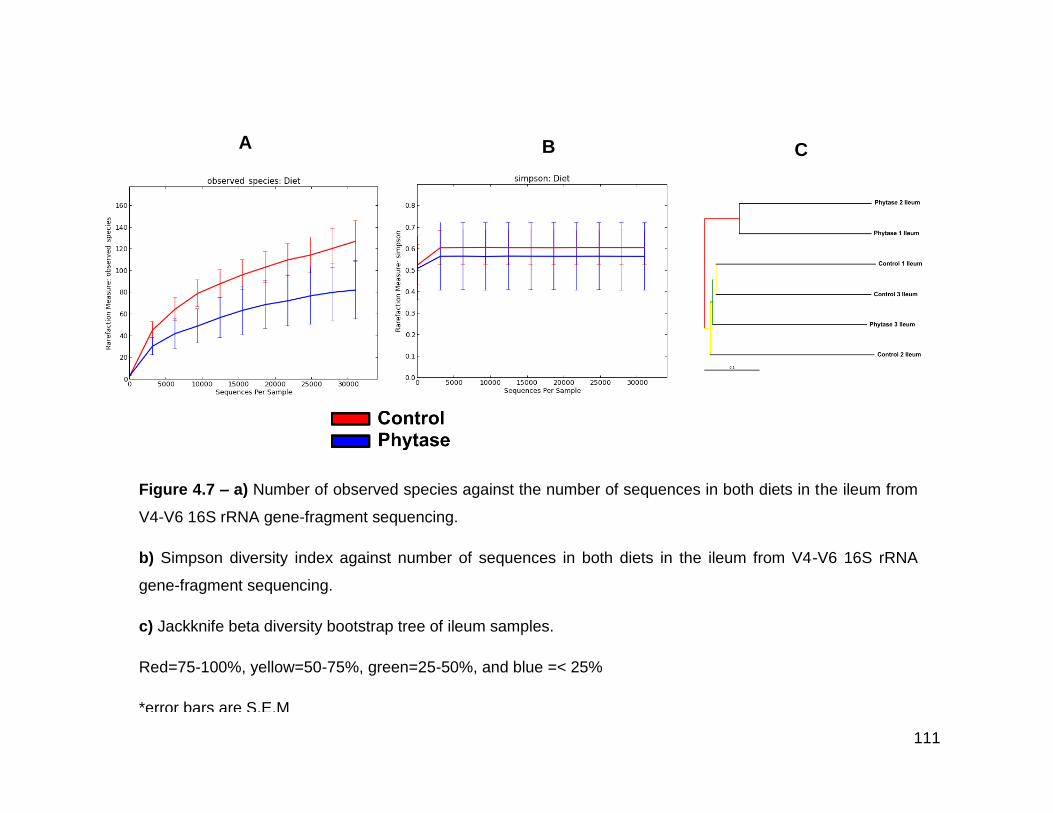
111
Figure 4.7 – a) Number of observed species against the number of sequences in both diets in the ileum from
V4-V6 16S rRNA gene-fragment sequencing.
b) Simpson diversity index against number of sequences in both diets in the ileum from V4-V6 16S rRNA
gene-fragment sequencing.
c) Jackknife beta diversity bootstrap tree of ileum samples.
Red=75-100%, yellow=50-75%, green=25-50%, and blue =< 25%
*error bars are S.E.M
B A C
112
4.3.7 Caecum
132,252 reads were obtained from three caecum control-diet samples. These were
assigned to 403 OTUs, which belonged to five bacterial phyla and one unassigned
phylum. The majority of OTU reads were assigned to Firmicutes (78.8%), followed
by Bacteroidetes (9.3%) and Proteobacteria (8.2%). Actinobacteria accounted for
1.6%; Tenericutes 0.9% and 1.3% of reads could not be assigned a phylum.
Firmicutes consisted of 73.9% Clostridia with 1.1% assigned to Bacilli (Figure
4.8a).
Clostridia reads were mainly assigned to Clostridiales; however 1.3% could not be
assigned beyond class level. Bacilli reads were due to Lactobacillales (1%) and
Bacteroidia reads were only assigned to Bacteroidales (9.3%). The next most
abundant orders were Enterobacteriales (8.2%) and Bifidobacteriales (1.5%).
Anaeroplasmatales were the sole constituent of the Mollicutes (0.9%).
Clostridiales contained three main families, Lachnospiraceae (28.5%),
Ruminococcaceae accounted for 17.4% and 6.9% were Incertae Sedis XIV
(Clostridiales family XIV of uncertain placement). Rikenellaceae was the most
abundant family outside the Clostridiales order with 9.3% of total reads, followed by
Enterobacteriaceae (8.2%), Bifidobacteriaceae (1.5%), Lactobacillaceae (1%) and
Aneroplasmataceae (0.9%). The Lachnospiraceae family primarily comprised of
unassigned reads (22.7%) and the Dorea genus (5.8%). Alistipes formed the most
abundant named genus with 9.3% of reads followed by Escherichia/Shigella (8%),
113
Blautia (6.9%), Oscillibacter (3.8), Bifidobacterium (1.5%) and Anaeroplasma
(0.9%).
238 OTUs were present in all caecum control-diet samples. Of these core OTUs,
180 were assigned to Clostridiales of which 67 were Ruminococcaceae and 33
Lachnospiraceae. The most abundant OTU was an Alistipes with 9.3% of total
reads (OTU 5). There were seven Clostridiales OTUs in the top ten most abundant
OTUs, of which four were assigned to Lachnospiraceae (OTU 22, OTU 19, OTU 13
and OTU 54) (Table 4.7a).
231,691 reads were obtained from three caecum phytase-diet samples. These
were assigned to 460 OTUs, which belonged to five named bacterial phyla and one
unassigned phylum. The most abundant phylum was Firmicutes (83.6%), followed
by Bacteroidetes (3.1%), Proteobacteria (1.5%), Tenericutes (1.4%) and
Actinobacteria (1.1%). The unassigned bacterial phylum was responsible for 2.2%
of caecum reads. At class level, Clostridia had the highest number of reads
(76.7%) with Bacilli (2.5%) and an unassigned class forming the rest of Firmicutes
reads (Figure 4.8b).
Clostridia consisted of Clostridiales (75%) and 1.7% of unassigned reads.
Lactobacillales (2.2%) was the main constituent of Bacilli reads, with Bacillales
(0.2%) and an unassigned order (0.1%) forming the remaining total reads.
Bacteroidales (3.1%) and Anaeroplasmatales (1.4%) were the only orders within
Bacteroidia and Mollicutes respectively with Enterobacteriales responsible for 1.5%
of total reads.
114
Clostridiales reads were formed from three main families and a smaller one;
Lachnospiraceae (20.1%), Ruminococcaceae (17.7%), unassigned families
(35.9%) and Incertae Sedis XIV (Clostridiales family XIV of uncertain placement,
1.2%). The next most abundant families were Rikenellaceae (3.1%),
Lactobacillaceae (2.1%), Enterobacteriaceae (1.5%), Anaeroplasmataceae (1.4%),
Coriobacteriaceae (0.6%) and Bifidobacteriaceae (0.5%). At genus level, the most
abundant named genera were Dorea (6.4%), Alistipes (3.1%), Lactobacillus
(2.1%), Anaeroplasma (1.4%), Blautia (1.2%), Oscillibacter (1.1%),
Escherichia/Shigella (1.1%) and Bifidobacterium (0.5%).
289 OTUs were present in all caecum phytase-diet samples, the majority of these
were Firmicutes with 74 Ruminococcaceae and 41 Lachnospiraceae assigned
OTUs. Of the top ten most abundant OTUs, seven were assigned to Clostridiales,
with one OTU (OTU 17) unable to be assigned to a phylum (Table 4.7a).
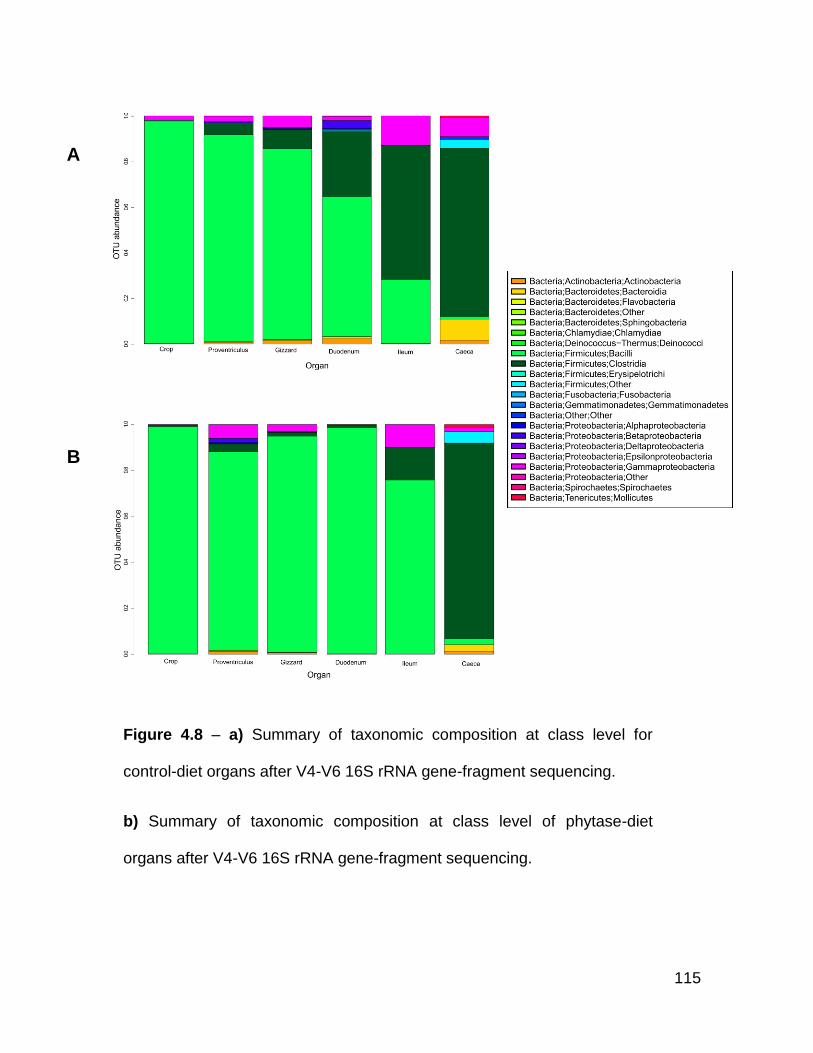
115
Figure 4.8 – a) Summary of taxonomic composition at class level for
control-diet organs after V4-V6 16S rRNA gene-fragment sequencing.
b) Summary of taxonomic composition at class level of phytase-diet
organs after V4-V6 16S rRNA gene-fragment sequencing.
A
B
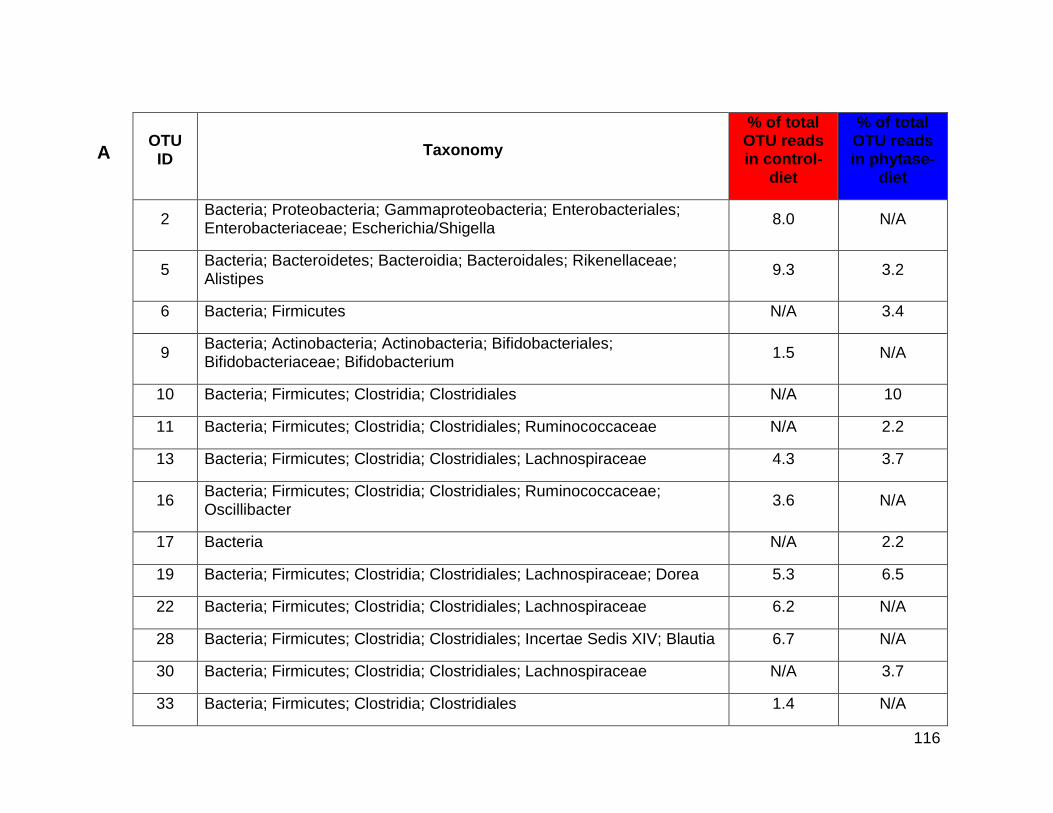
116
OTU ID
Taxonomy
% of total OTU reads in control-
diet
% of total OTU reads in phytase-
diet
2 Bacteria; Proteobacteria; Gammaproteobacteria; Enterobacteriales; Enterobacteriaceae; Escherichia/Shigella
8.0 N/A
5 Bacteria; Bacteroidetes; Bacteroidia; Bacteroidales; Rikenellaceae; Alistipes
9.3 3.2
6 Bacteria; Firmicutes N/A 3.4
9 Bacteria; Actinobacteria; Actinobacteria; Bifidobacteriales; Bifidobacteriaceae; Bifidobacterium
1.5 N/A
10 Bacteria; Firmicutes; Clostridia; Clostridiales N/A 10
11 Bacteria; Firmicutes; Clostridia; Clostridiales; Ruminococcaceae N/A 2.2
13 Bacteria; Firmicutes; Clostridia; Clostridiales; Lachnospiraceae 4.3 3.7
16 Bacteria; Firmicutes; Clostridia; Clostridiales; Ruminococcaceae; Oscillibacter
3.6 N/A
17 Bacteria N/A 2.2
19 Bacteria; Firmicutes; Clostridia; Clostridiales; Lachnospiraceae; Dorea 5.3 6.5
22 Bacteria; Firmicutes; Clostridia; Clostridiales; Lachnospiraceae 6.2 N/A
28 Bacteria; Firmicutes; Clostridia; Clostridiales; Incertae Sedis XIV; Blautia 6.7 N/A
30 Bacteria; Firmicutes; Clostridia; Clostridiales; Lachnospiraceae N/A 3.7
33 Bacteria; Firmicutes; Clostridia; Clostridiales 1.4 N/A
A
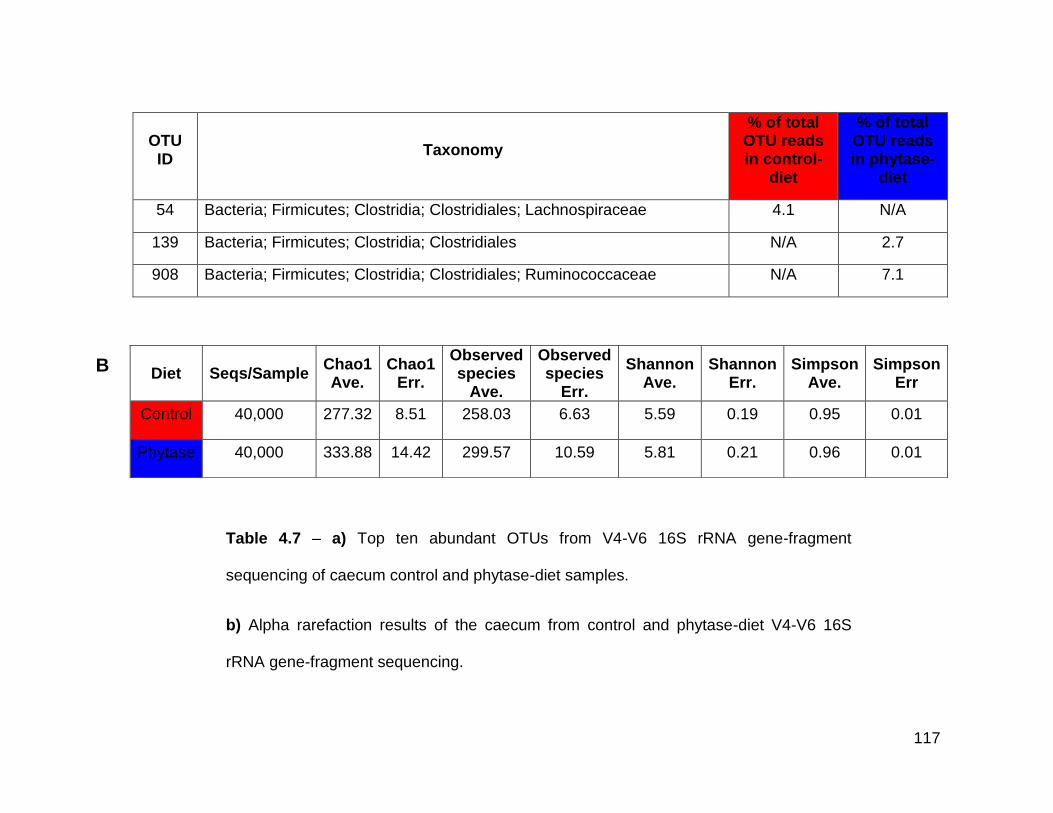
117
OTU ID
Taxonomy
% of total OTU reads in control-
diet
% of total OTU reads in phytase-
diet
54 Bacteria; Firmicutes; Clostridia; Clostridiales; Lachnospiraceae 4.1 N/A
139 Bacteria; Firmicutes; Clostridia; Clostridiales N/A 2.7
908 Bacteria; Firmicutes; Clostridia; Clostridiales; Ruminococcaceae N/A 7.1
Diet Seqs/Sample Chao1 Ave.
Chao1 Err.
Observed species
Ave.
Observed species
Err.
Shannon Ave.
Shannon Err.
Simpson Ave.
Simpson Err
Control 40,000 277.32 8.51 258.03 6.63 5.59 0.19 0.95 0.01
Phytase 40,000 333.88 14.42 299.57 10.59 5.81 0.21 0.96 0.01
Table 4.7 – a) Top ten abundant OTUs from V4-V6 16S rRNA gene-fragment
sequencing of caecum control and phytase-diet samples.
b) Alpha rarefaction results of the caecum from control and phytase-diet V4-V6 16S
rRNA gene-fragment sequencing.
B
118
Alpha rarefaction was completed at a depth of 40,000 (Table 4.7b). This showed
that on average the phytase-diet contained more observed species (Figure 4.9a),
had a higher richness and higher Shannon and Simpson’s diversity index values
(Figure 4.9b). The caecal samples from both diets had the highest Simpson’s
diversity index values in their respective guts.
There were no significantly abundant OTUs observed in the microbiota associated
from either diet, however there was a significant difference in diversity of the
microbiota with a bonferroni corrected p-value of 0.0004.
Jackknife beta diversity showed that the samples clustered by diet with high
bootstrap support values (Figure 4.9c). Within the diets, phytase 2 caecum and
phytase 3 caecum shared a closer diversity than phytase 1 caecum and control 2
caecum and control 3 caecum were closer than control 1 caecum.
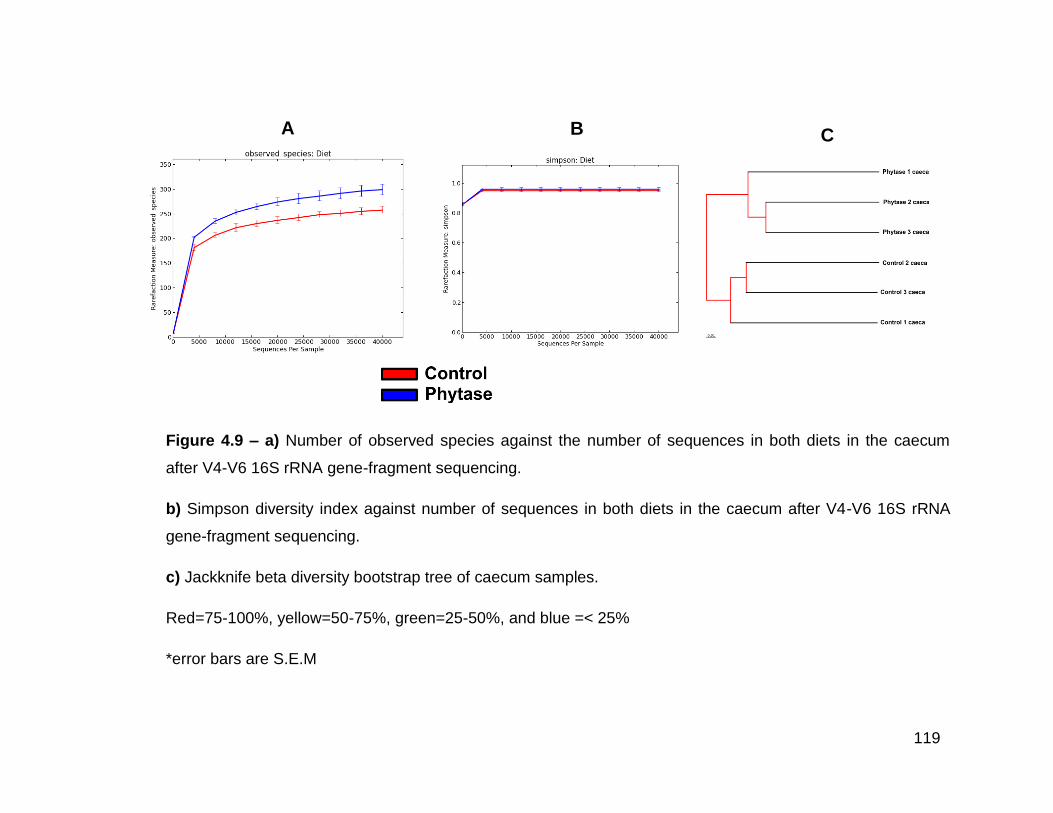
119
Figure 4.9 – a) Number of observed species against the number of sequences in both diets in the caecum
after V4-V6 16S rRNA gene-fragment sequencing.
b) Simpson diversity index against number of sequences in both diets in the caecum after V4-V6 16S rRNA
gene-fragment sequencing.
c) Jackknife beta diversity bootstrap tree of caecum samples.
Red=75-100%, yellow=50-75%, green=25-50%, and blue =< 25%
*error bars are S.E.M
B A C
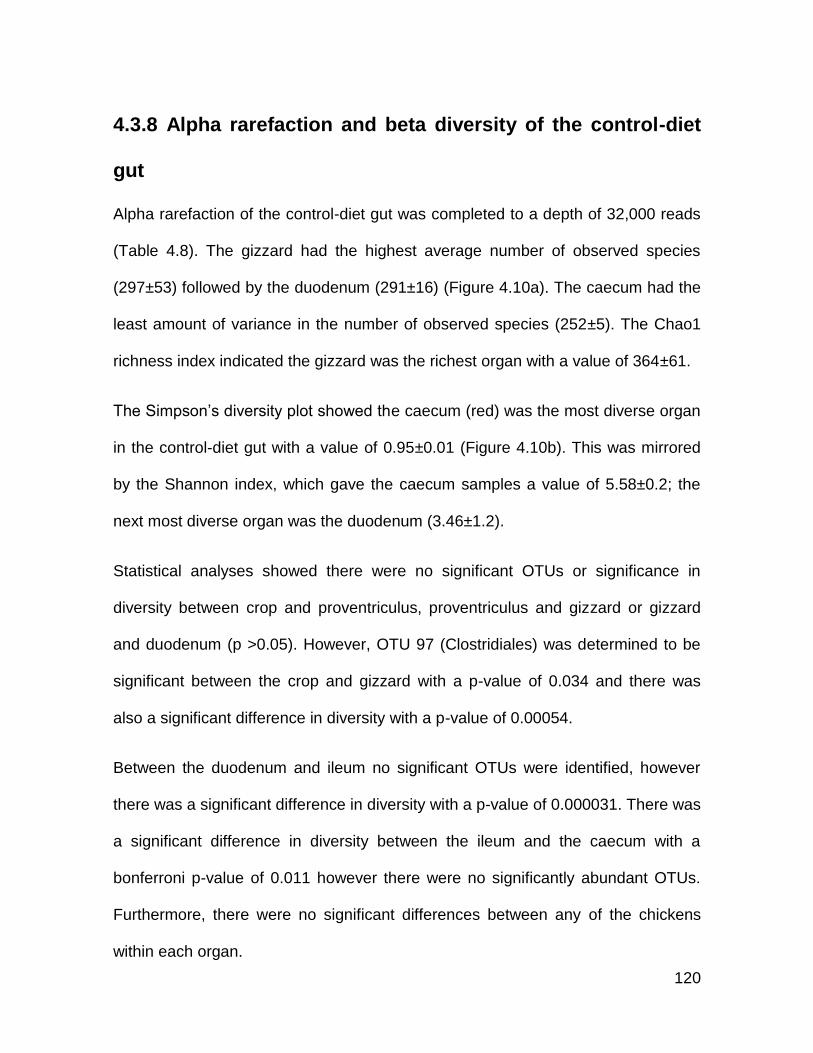
120
4.3.8 Alpha rarefaction and beta diversity of the control-diet
gut
Alpha rarefaction of the control-diet gut was completed to a depth of 32,000 reads
(Table 4.8). The gizzard had the highest average number of observed species
(297±53) followed by the duodenum (291±16) (Figure 4.10a). The caecum had the
least amount of variance in the number of observed species (252±5). The Chao1
richness index indicated the gizzard was the richest organ with a value of 364±61.
The Simpson’s diversity plot showed the caecum (red) was the most diverse organ
in the control-diet gut with a value of 0.95±0.01 (Figure 4.10b). This was mirrored
by the Shannon index, which gave the caecum samples a value of 5.58±0.2; the
next most diverse organ was the duodenum (3.46±1.2).
Statistical analyses showed there were no significant OTUs or significance in
diversity between crop and proventriculus, proventriculus and gizzard or gizzard
and duodenum (p >0.05). However, OTU 97 (Clostridiales) was determined to be
significant between the crop and gizzard with a p-value of 0.034 and there was
also a significant difference in diversity with a p-value of 0.00054.
Between the duodenum and ileum no significant OTUs were identified, however
there was a significant difference in diversity with a p-value of 0.000031. There was
a significant difference in diversity between the ileum and the caecum with a
bonferroni p-value of 0.011 however there were no significantly abundant OTUs.
Furthermore, there were no significant differences between any of the chickens
within each organ.
121
Jackknifed beta diversity was completed on the control-diet gut samples at 32,000
reads (Figure 4.11). This showed the grouping of the caecum samples together
with a bootstrap value of 75-100% however there was limited other grouping of
samples originating from the same organ or the same chicken.
The control-diet organs were compared to a depth of 127,000 reads (Figure 4.11).
The tree indicated strong bootstrap support for organ placement with all of the
branches except from the caecum coloured red (75-100% support).
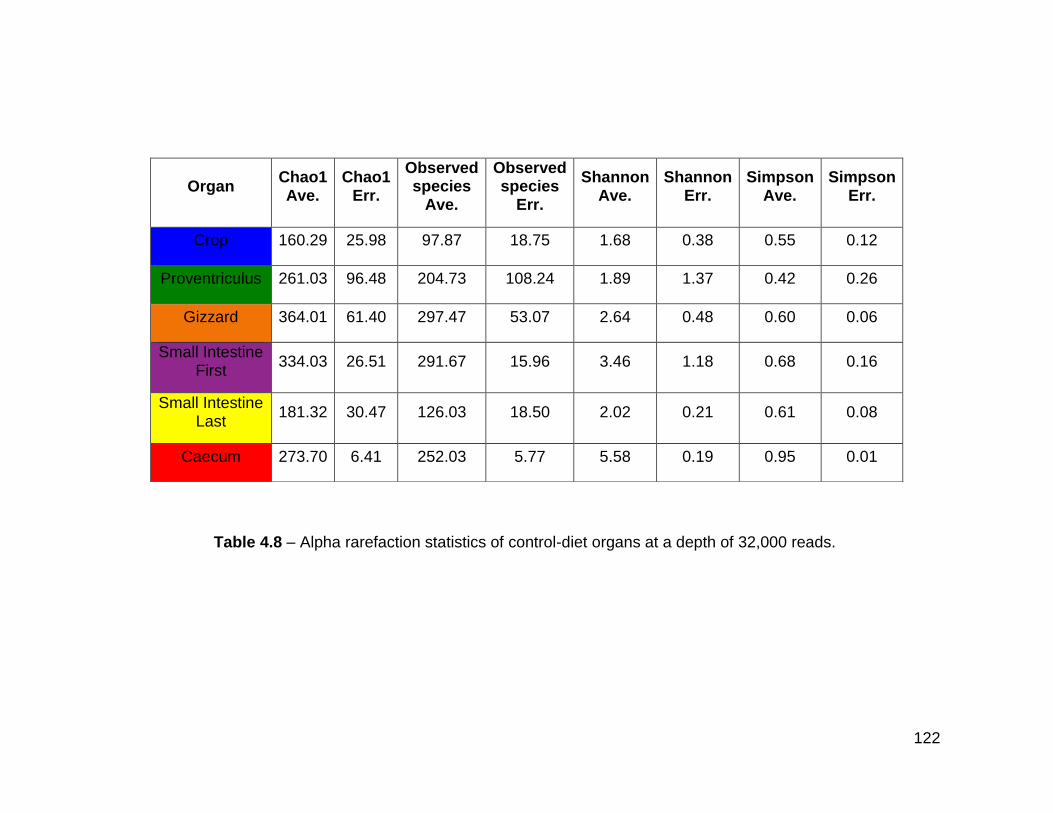
122
Organ Chao1 Ave.
Chao1 Err.
Observed species
Ave.
Observed species
Err.
Shannon Ave.
Shannon Err.
Simpson Ave.
Simpson Err.
Crop 160.29 25.98 97.87 18.75 1.68 0.38 0.55 0.12
Proventriculus 261.03 96.48 204.73 108.24 1.89 1.37 0.42 0.26
Gizzard 364.01 61.40 297.47 53.07 2.64 0.48 0.60 0.06
Small Intestine First
334.03 26.51 291.67 15.96 3.46 1.18 0.68 0.16
Small Intestine Last
181.32 30.47 126.03 18.50 2.02 0.21 0.61 0.08
Caecum 273.70 6.41 252.03 5.77 5.58 0.19 0.95 0.01
Table 4.8 – Alpha rarefaction statistics of control-diet organs at a depth of 32,000 reads.
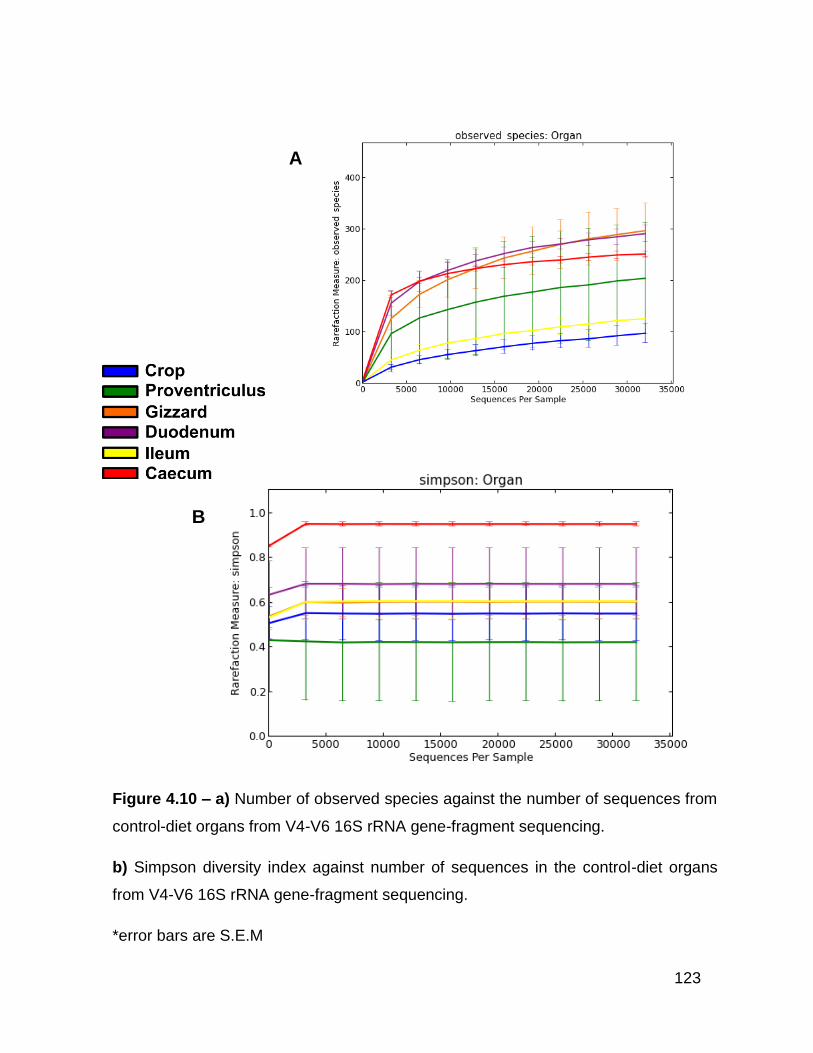
123
B
Figure 4.10 – a) Number of observed species against the number of sequences from
control-diet organs from V4-V6 16S rRNA gene-fragment sequencing.
b) Simpson diversity index against number of sequences in the control-diet organs
from V4-V6 16S rRNA gene-fragment sequencing.
*error bars are S.E.M
A
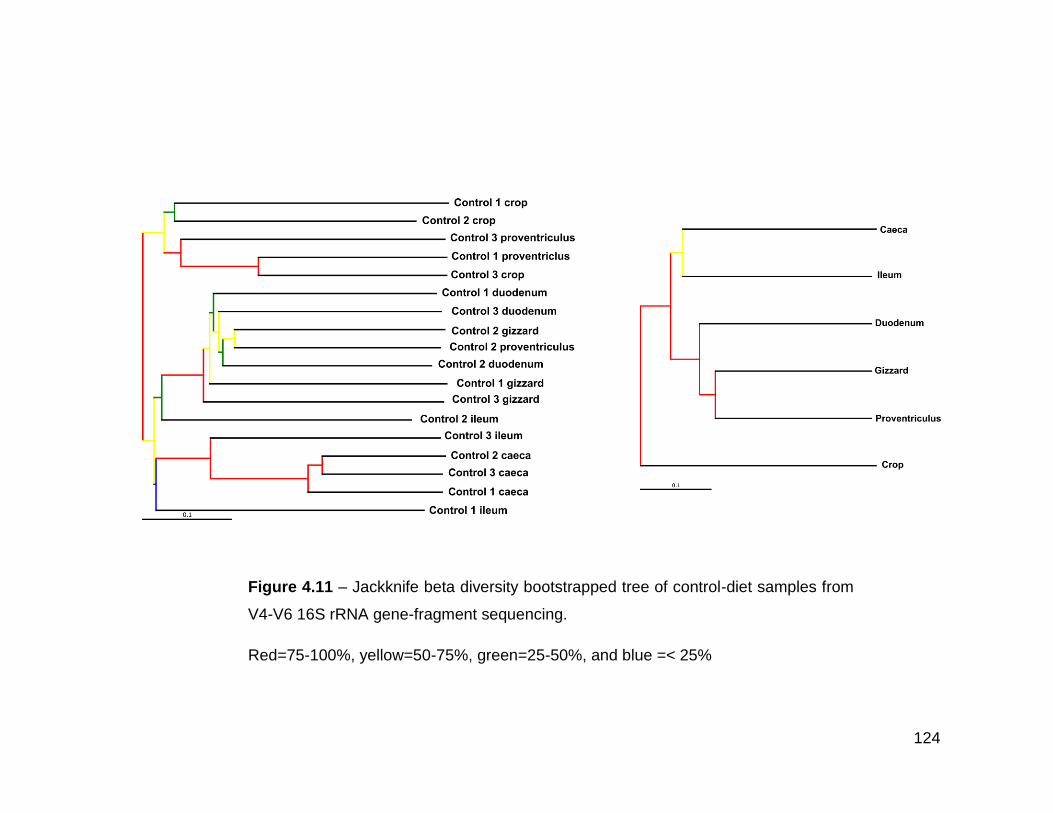
124
Figure 4.11 – Jackknife beta diversity bootstrapped tree of control-diet samples from
V4-V6 16S rRNA gene-fragment sequencing.
Red=75-100%, yellow=50-75%, green=25-50%, and blue =< 25%
125
4.3.9 Alpha rarefaction and beta diversity of the phytase-diet
gut
Alpha rarefaction of the control-diet gut was completed to a depth of 31,000 reads
(Table 4.9). Figure 4.12a showed that the number of observed species had
levelled off at 31,000 reads and therefore extra sampling would probably not result
in the observation of further species. The gizzard had the greatest error value of
197±155 followed by the proventriculus 241±113. The lowest error value was
assigned the caecum with 291±10, indicating the lowest amount of variance in the
number of species between samples.
The Chao1 richness index indicated the caecum was the richest organ with a value
of 322±15. The Simpson’s diversity plot showed the caecum (red) was the most
diverse organ in the phytase-diet gut with a value of 0.96±0.01 (Figure 4.12b). The
Shannon index also showed the caecum was the most diverse with a value of
5.81±0.22, which was more than double the next nearest organ (proventriculus
2.2±1.22).
There were no significant OTUs or difference in diversity between crop and
proventriculus, proventriculus and gizzard, crop and gizzard, gizzard and
duodenum or duodenum and ileum. However, there was a significant difference
between ileum and caecum with a bonferroni corrected p-value of 0.00068.
Furthermore, there were no significant differences between any of the chickens
within each organ.
126
Jackknife beta diversity was completed on the phytase-diet gut samples at 31,000
reads (Figure 4.13). There was high bootstrap support (75-100%) for the
placement of the majority of the samples within the tree. The tree showed the
grouping of the caecum samples together with a bootstrap value of 75-100%
however, there was limited other grouping of samples originating from the same
organ or the same chicken which mirrors what was observed in the control-diet tree
in Section 4.3.8.
The phytase-diet organs were compared to a depth of 127,000 reads and the tree
indicated high bootstrap support for every organ placement (Figure 4.13). The tree
showed that the crop is more closely related to the duodenum and ileum than the
proventriculus and gizzard.
4.3.10 Phylogenetic analysis of abundant OTUs from both
diets
ARB was used to analyse the phylogeny of the V4-V6 16S rRNA gene-fragment
OTUs. Many trees failed to provide more taxonomic resolution for OTUs that were
assigned previously with the RDP classifier. In total, nine of the 28 most abundant
OTUs formed trees with confidence levels ≥50% (Table 4.10).

127
Organ Chao1 Ave.
Chao1 Err.
Observed species
Ave.
Observed species
Err.
Shannon Ave.
Shannon Err.
Simpson Ave.
Simpson Err
Crop 103.45 41.91 70.33 27.46 0.97 0.61 0.30 0.25
Proventriculus 289.08 109.52 241.60 113.80 2.2 1.41 0.47 0.31
Gizzard 262.74 172.15 197.40 155.33 1.58 1.30 0.35 0.26
Small Intestine First
151.94 78.66 108.33 72.45 0.62 0.55 0.14 0.14
Small Intestine Last
118.28 35.59 82.77 26.87 1.91 0.45 0.57 0.16
Caecum 322.49 14.56 291.97 10.27 5.81 0.22 0.96 0.01
Table 4.9 – Alpha rarefaction statistics of phytase-diet organs at a depth of 31,000 reads.
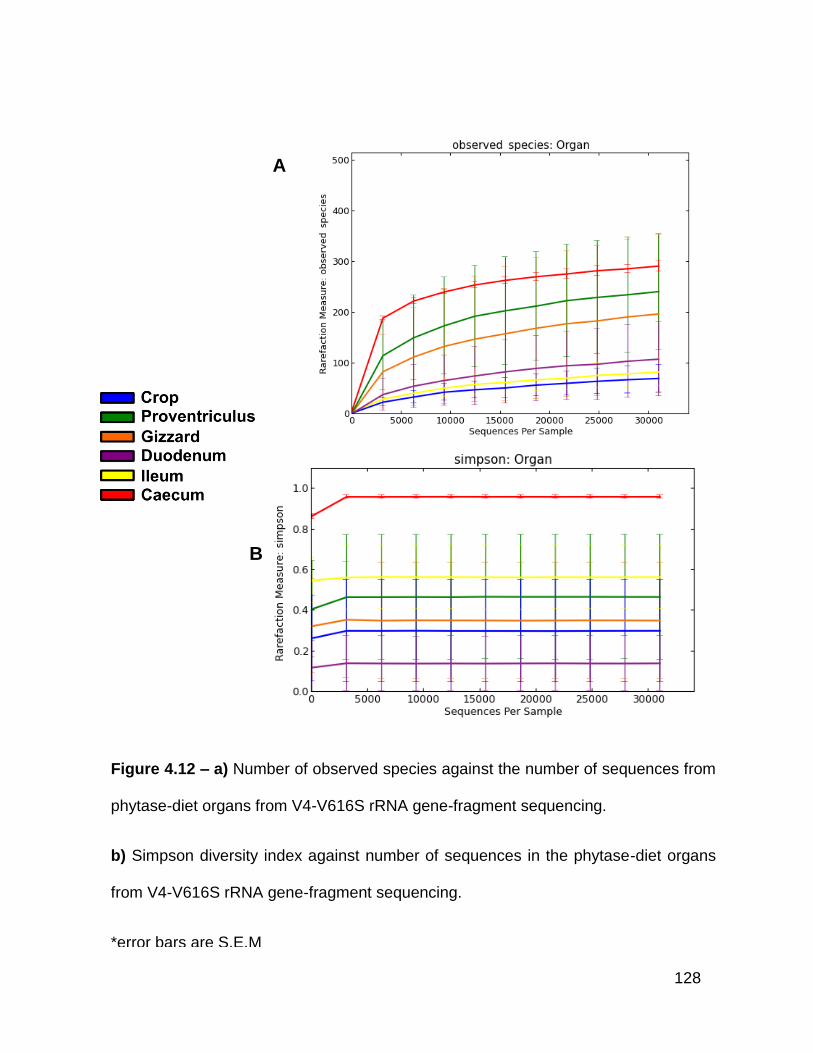
128
Figure 4.12 – a) Number of observed species against the number of sequences from
phytase-diet organs from V4-V616S rRNA gene-fragment sequencing.
b) Simpson diversity index against number of sequences in the phytase-diet organs
from V4-V616S rRNA gene-fragment sequencing.
*error bars are S.E.M
A
B
A
B
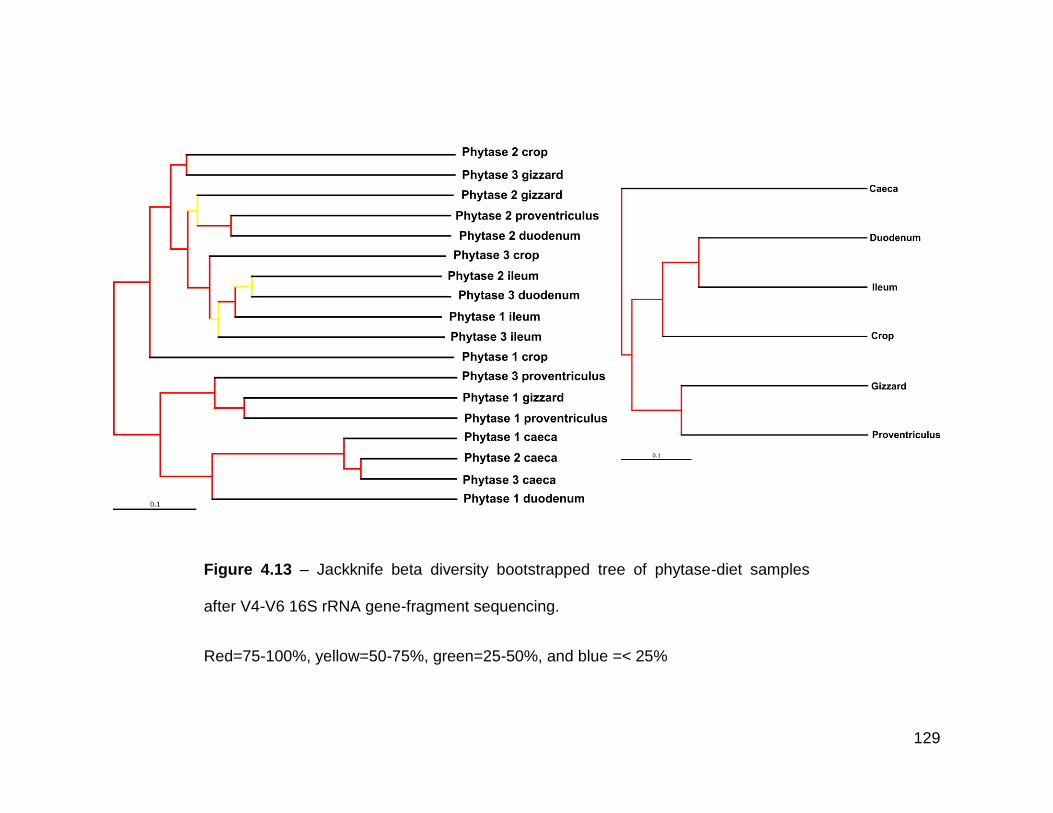
129
Figure 4.13 – Jackknife beta diversity bootstrapped tree of phytase-diet samples
after V4-V6 16S rRNA gene-fragment sequencing.
Red=75-100%, yellow=50-75%, green=25-50%, and blue =< 25%
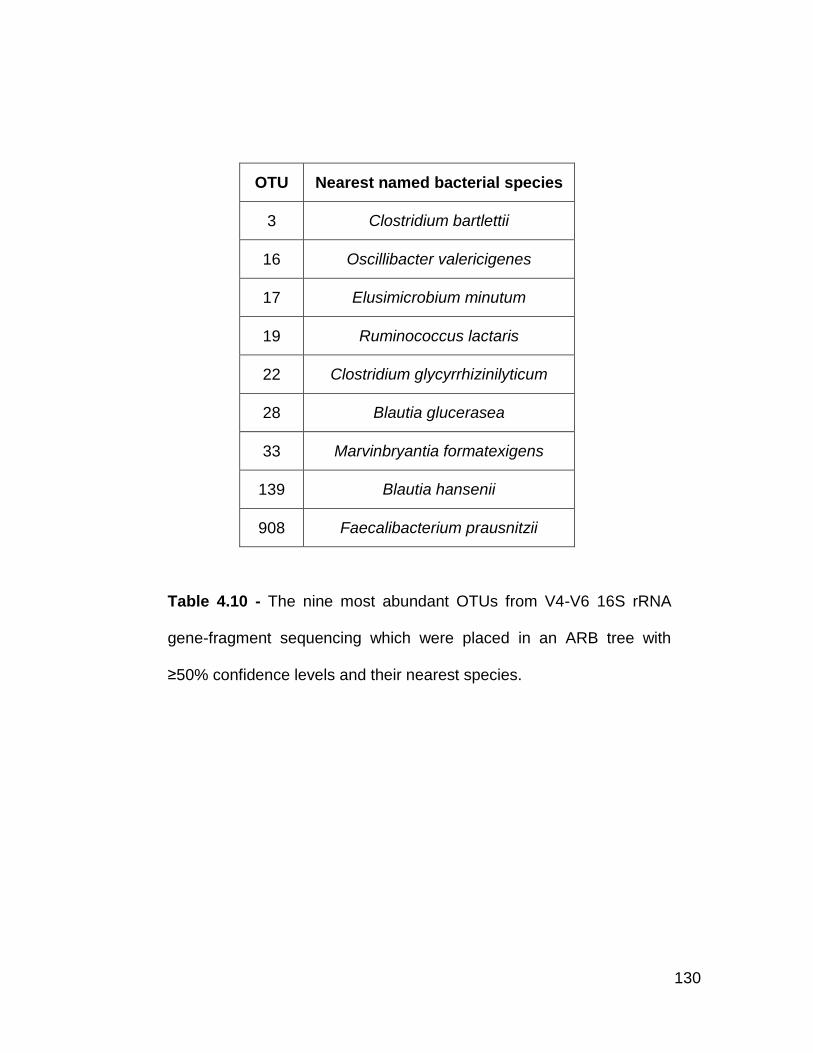
130
OTU Nearest named bacterial species
3 Clostridium bartlettii
16 Oscillibacter valericigenes
17 Elusimicrobium minutum
19 Ruminococcus lactaris
22 Clostridium glycyrrhizinilyticum
28 Blautia glucerasea
33 Marvinbryantia formatexigens
139 Blautia hansenii
908 Faecalibacterium prausnitzii
Table 4.10 - The nine most abundant OTUs from V4-V6 16S rRNA
gene-fragment sequencing which were placed in an ARB tree with
≥50% confidence levels and their nearest species.
131
4.4 Discussion
To the authors’ knowledge this was the first study of the microbiota of the crop,
proventriculus, gizzard, duodenum, ileum and caecum from a single chicken
using V4-V6 16S rRNA gene-fragment sequencing. This is not the first use of
the V4-V6 region to study the microbiota of the chicken; it was used by Zhao et
al. 2013 to study faecal samples from 15 chickens however the taxonomic data
was not published [206].
Although a published study used Roche 454 FLX Titanium pyrosequencing of
the 16S rRNA gene V1-V3 hypervariable region to study the crop, gizzard,
duodenum, jejunum, ileum, caecum and large intestine of three chickens, they
generated only 111,970 sequences. The authors’ study generated over 900
times more sequences than the published study [119]. Furthermore, their
sequences were assigned to 2,803 OTUs within 1,500 genera; this was three
times more OTUs than were reported by Wei et al. (2013) when they collected
all sequences of chicken origin from GenBank, Silva database and RDP and
over ten times more genera [24]. The vastly inflated taxonomic diversity renders
the results from that previous study implausible.
The increased depth of sequencing resulted in the discovery of 307 genera and
1,153 OTUs which is almost double the species and genera found by Apajalahti
et al. (2004) and more than identified by Wei et al. (2013) [24, 38]. Wei et al.
(2013) used rarefaction to estimate the number of OTUs in the chicken gut and
this is closer to the number observed by the authors’ study [24]. However, both
are significantly lower than the species and genera found by Choi et al. 2014
[119].
132
Firmicutes sequences dominated in both diets however the abundance was
almost 20% higher than found in previous studies [24, 115, 119]. Furthermore,
Proteobacteria and Bacteroides were the next most abundant phyla in both
diets, which is the opposite of what was found in a study by Wei et al. (2013)
[24]. An explanation for these differences in abundance could be that the
majority of publically available sequences were from studies of the small
intestine and caecum; which coincides with the lack of published sequencing
studies on the foregut. Hence, when just the caecal samples from both diets are
summarised the abundances are closer to those found by other studies.
The domination of lactobacilli in the crop, gizzard and small intestine found in
this study complements previous studies of these organs by both culture-
dependent [12, 106, 109-111, 120] and culture-independent techniques [115,
116, 119]. The identification of these lactobacilli to species level was not
possible through 16S rRNA gene-fragment sequencing of the V4-V6 region.
However, culturing efforts in Chapter Five led to the isolation and identification
of some of these species.
The proventriculus was dominated by Lactobacillus, which supports the findings
from the only previous study of this organ [106]. Both diets had a similar
abundance of the same Lactobacillus OTUs and no significant difference was
identified, indicating the addition of phytase does not affect the microbial
population in this organ. Furthermore, the microbiota associated with the
proventriculus was not significantly different from the crop or gizzard microbiota
in either diet, agreeing with the hypothesis of Oakley et al. (2014) that the
proventriculus was similar to the gizzard [44].
133
It has been demonstrated that the addition of phytase to the chicken diet causes
the proliferation of lactobacilli in the small intestine [112]. This hypothesis was
supported in this study by the dominance of Lactobacillus species in the
phytase-diet ileum samples. In contrast, within the control-diet ileum samples,
Clostridiales dominated, becoming the first class to displace Lactobacillaceae
as the most abundant. High abundance of Clostridium has been found in the
ileum in previous studies [94, 118]. The abundance of Lactobacillus species,
caused by phytase, could be why there is no significant difference in the
microbiota associated with organs of the phytase-diet between the duodenum
and ileum, however there is a significant difference in the control-diet.
The abundance of Herbaspirillum in the duodenum control samples raises an
interesting question of whether this is a true or spurious result. Herbaspirillum,
among other genera, have been identified as a contaminant in DNA extraction
kits and laboratory reagents [207]. Herbaspirillum has not been documented in
the chicken gut previously; it is a soil-dwelling, plant-associated genus and thus
could have been associated with the feed given to the chickens and was
probably transient, rather than an established species in the gut [208]. Although
it was identified in all organs it was not identified in every sample and was most
abundant in the proventriculus and duodenum samples. This could be due to
the influx of acid, bile acids and enzymes reducing the bacterial load in these
sections of the gut, resulting in OTUs from environmental sources (such as
extraction kits) becoming more abundant than OTUs originating from the
chicken gut [100].
134
In the microbiota associated with the phytase-diet, the duodenum had more
observed species than the ileum but had lower diversity as shown by the
Shannon and Simpson values. The more observed species matched the results
of Gong et al. (2007) however, they did not employ diversity statistics to their
data therefore a true comparison cannot be made [115].
In the control-diet, the duodenum had more observed species and was more
diverse than the ileum. This result is similar to Choi et al. (2014) where they
found the duodenum was much more diverse than the ileum, however, there
are large variations in the number of reads used to calculate the values reported
in Choi et al. (2014), therefore these results could be unreliable.
The caecum was the most diverse organ in both diets with no OTU dominating
and high Simpson diversity index values which agrees with previous studies of
the chicken caecum and the results detailed in Chapter Three [68, 91-93, 115,
116, 119, 120]. The number of observed species in each diet was similar to that
found by Sergeant et al. (2014) although lower than that found by Danzeisen et
al. (2011) [2, 68]. Clostridiales was the most abundant order, with
Lachnospiraceae and Ruminococcaceae the most abundant families; this
mirrors the findings of Chapter Three and published data [29, 118-120, 209].
The abundance of Bacteroides in the control-diet was similar to that in culture-
dependent and culture-independent studies [24, 91-93, 119], however, the
abundance in the phytase-diet was closer to that found by Zhu et al. (2002) [24,
67]. The abundance of lactobacilli in the caecal samples from both diets was
considerably lower than some previous studies [5, 90, 94, 115, 118, 125, 210]
although it was closer to that of others [24, 67, 93, 119]. The varying counts of
135
lactobacilli in the studies occur in both culture-dependent and culture-
independent studies; therefore it is unlikely to be a methodology limitation and is
variability between birds.
Comparison of the results in Chapter Three and Chapter Four was not always
possible for all organs due to the depth of coverage gained in the V3-V4 16S
rRNA gene-fragment sequencing. Furthermore, because the different regions of
the 16S rRNA gene can result in different levels of taxonomic refinement (due to
reference sequence quality or the number of variable parts in a region) this led
to another problem of direct comparison. Within the caecum, OTUs that were
identified in both Chapters Three and Four often had different relative
abundances. An example of this is an OTU that represented
Escherichia/Shigella that represented 4.8% of total reads in Chapter Three but
8% in Chapter Four. In addition, the OTU with the highest abundance in the
Chapter Three was not replicated in Chapter Four, with the most abundant OTU
from the same family having almost three times less relative abundance. The
differences were not isolated to just the most abundant organisms; although the
observed species graphs from both chapters are similar, the jackknife beta
diversity tree places different samples together in each chapter. This difference
between the same samples but using different 16S rRNA regions poses a
question about the reliability of comparing results when different methods and
regions of the 16S rRNA gene are used.
If the identified OTUs are genotypically and phenotypically similar to their
identified closest bacterial relatives, then it could be assumed they would have
similar traits to those discussed.
136
Clostridium bartlettii was one of the most abundant organisms in the control-diet
duodenum and ileum samples and in the phytase-diet ileum samples. It has
been found in the ileum previously, however was not found in the duodenum
and the abundance was not reported [211]. The abundance of this organism in
the small intestine could be explained by its high resistance to bile, therefore it
is able to proliferate where other organisms may not. It produces large
quantities of acetate, valerate and butyrate, which are beneficial for chicken
health [18, 183, 212]. High abundance of this organism has been associated
with higher FCR in turkeys [213]. Furthermore, C. bartlettii has been shown to
grow better at pH 6.7 [214] which could explain the higher abundance in the
control-diet as a previous study on the effects of phytase in the ileum showed a
significant increase in pH (from pH 6.7 to pH 7.2) with the addition of phytase
[112].
Oscillibacter valericigenes was abundant in the control-diet caecal samples. It is
a strict anaerobe that is able to ferment a range of sugars into the volatile fatty
acid valerate and has been found in high abundance in the chicken caecum in a
previous study [209, 215, 216]. However, previous studies on this organism
have found the optimum temperature of growth for isolated strains to be 30 oC
with no growth observed over 35 oC, which might indicate this strain is different
from those previously isolated as the internal temperature of the chicken is
~42 oC [215, 216].
Faecalibacterium prausnitzii was in the most abundant OTUs in the caecum of
both diets. It has been identified from the caecum previously [5, 120]. The
majority of strains are unable to ferment common plant polysaccharides [201].
137
In humans and murine models, it has been shown that F. prausnitzii is an anti-
inflammatory commensal and it produces volatile fatty acids such as propionate
and butyrate. However, its role in chickens is currently unknown [209, 217, 218].
Elusimicrobium minutum was in the most abundant organisms in the phytase
caecal samples and although the species has not been identified in the chicken
before the phylum has been identified in the caecum previously. Elusimicrobia
formed ~0.1% of total V3-V4 16S rRNA gene-fragment sequences during a
study of the caecum of egg laying hens over their life [219]. Originally isolated
and whole genome sequenced from a beetle larva gut, it is a strict anaerobe
that produces moderate amounts of acetate, ethanol and hydrogen through
fermentation [220, 221].
Ruminococcus lactaris was identified as one of the most abundant in both diets
in the caecal samples and has not been reported in chickens before, however it
is common in the human gut [222-224]. The ability of R. lactaris to colonise
mucin is unknown, however species in the same cluster possess this trait [225].
It proliferates in the presence of fermentable carbohydrates and produces
acetate and formate, but not butyrate [224]. The production of these volatile
fatty acids could have positive effects on the chicken health [18, 183].
Clostridium glycyrrhizinilyticum was identified in this study and was most
abundant in the control-diet caecal samples. Although it has not been reported
as being identified from previous chicken gut studies, an isolate with 96.3%
similarity was found in broilers that were fed a diet with no added vitamins [226].
In the only study of the bacterium, it was found to produce volatile-fatty acids
from a range of carbohydrates, however the specific acids produced were not
138
reported [227]. The bacterium is capable of hydrolysing glycyrrhizin (a glycoside
of glycyrrhetic acid) which is not common in the chicken diet therefore, the
benefits of this organism are unknown [227].
Blautia glucerasea was identified as one of the most abundant organisms in the
control caecal samples. This species has not been reported in chickens
previously, however the Blautia genus is commonly found in caecal samples
[24, 68]. B. glucerasea is an obligate anaerobe that can ferment a range of
polysaccharides, including xylan, in addition to producing beneficial volatile fatty
acids [228]. These traits could be why it is so abundant in the caecum and not
found in other parts of the gut.
Marvinbryantia formatexigens is able to ferment cellulose and CMC and was
most abundant in the control-diet gizzard and caecal samples [229]. It has been
identified in the chicken caecal microbiota through 16S rRNA gene sequencing
previously [206]. It requires formate to grow, therefore could be part of a co-
culture in the chicken gut [229]. It is a strict anaerobe that produces the volatile-
fatty acids: acetate, succinate and lactate through fermentation, grows at pH 7
and has multiple glycoside hydrolases [229, 230]. As it is a strict anaerobe, it
requires a neutral pH and the presence of formate (a product of fermentation), it
could be suggested that it is transient in the gizzard and not residing there.
Blautia hansenii (formally known as Streptococcus hansenii and Ruminococcus
hansenii) is an obligate anaerobe that was abundant in the phytase-diet caecal
samples [231]. Through fermentation it mainly produces lactate with lower
amounts of acetate and succinate; it is unable to ferment cellobiose [231]. It
139
was found in the caecal mucus layer of 17 out of 18 chickens in one of the first
culture-independent studies of the caecal microbiota [67].
The jackknife beta diversity trees of the control-diet showed a clustering of
caecal and ileum samples and weak clustering of crop and proventriculus
samples, however the phytase-diet had little clustering of organs and chickens
beyond the caecal samples. This spatial heterogeneity in the phytase-diet is
further illustrated by the abundance of three OTUs in each of the organs up to
the ileum however; there is less spatial heterogeneity in the control-diet. These
findings are similar to those found by Choi et al. (2014) where they noted that
low numbers of shared OTUs can still form the majority of bacterial abundance
between each organ [119].
There was a single significant OTU between the diets, found in the duodenum.
However, this was in such a low abundance that any affect this would have is
negligible. Compared to the V3-V4 16S rRNA gene-fragment sequencing
results from Chapter Three, deeper sequencing of the chicken gut uncovered a
significant difference in microbiota between the caecal samples. As there has
only been one study that looked at the change in microbiota through the
addition of phytase and this focussed on the ileum, there are no direct results to
compare those found in this study to [112]. This study was also the first to apply
copy-number correction to the generated sequences, although this could inflate
the abundance of OTUs that could not be assigned to a phylum because all
other OTU abundance will be reduced. This has provided a more accurate and
deeper analysis of the crop, proventriculus, gizzard, duodenum, ileum and
caecum of the chicken than has previously been achieved.
140
CHAPTER FIVE
5. Isolation of bacteria from the
chicken gut
141
5.1 Introduction
The first study of the chicken gut microbiota was published in 1897 by Heinrich
Kern [36]. It was determined by Kern (through microscopic preparations of the
stomach and intestinal contents) that a large number of bacterial species could
not be isolated using standard cultivation techniques. Kern cultured and
identified 21 bacterial species from the avian intestine [36, 40]. However, early
studies of the microbiota were restricted by the use of highly selective media
and aerobic storage of samples prior to culturing [232]. Therefore, the
assumption that the intestinal conditions of a healthy chicken were not
conducive for growth of obligate anaerobes by Gage in 1911 was probably due
to the lack of non-selective media and anaerobic technology.
It was proposed by King in 1905 that the mucosa of the caecum had a higher
microbial concentration than other parts of the gut [233]. This was confirmed by
Barnes in 1972 as approximately 1011/g and it has been documented that a
large proportion of these microbes have yet to be cultured in the laboratory [5,
90]. The shift towards culture-independent methods to study the gut microbiota
resulted in the discovery of more complex and diverse communities than
previously imagined [24, 74]. However, there is a limit to how useful omics-
based techniques can be when trying to establish physiology and metabolism of
particular species from a complex community, leading to a renewed interest in
culturing [25, 69, 234].
The importance of culturing bacteria is paramount; natural products and
derivatives from bacteria are thought to form 50% of commercially available
pharmaceuticals [41]. Furthermore, culturing allows for the study of
142
pathogenicity, physiology and genetics in addition to the discovery of industrially
relevant enzymes [234].
A study into the human microbiome using 212 different culture conditions and
metagenomics on the same samples identified only 51 overlapping species in
the data [25]. This indicates sequencing and culturing together identifies more
organisms within the microbiota and therefore would provide a more accurate
bacterial census.
The aim of this research was to isolate bacterial species from the chicken gut to
further knowledge, and form a census of bacterial species that reside in this
habitat and to complement sequencing efforts of the same samples. The
majority of culturing efforts focussed on the caeca due to microbial density with
particular interest in novel bacterial species that have not been cultured before.
5.2 Methods
To isolate bacteria an anaerobic and microaerophilic chamber, a range of media
and antibiotics were used (Table 2.2). The use of FAA with 5% horse blood as
the base medium for the cultivation of facultative and obligate anaerobes was
influenced by Heginbothom et al. (1990), where they deemed it superior to other
anaerobic media [235]. Heating and ethanol use on the digesta prior to serial
dilution selected for spore forming bacteria. OSA selected for acid tolerant
bacteria such as Lactobacillus and culturing aerobically selected for facultative
anaerobes and aerobes (full details of bacterial culturing is provided in Chapter
Two).
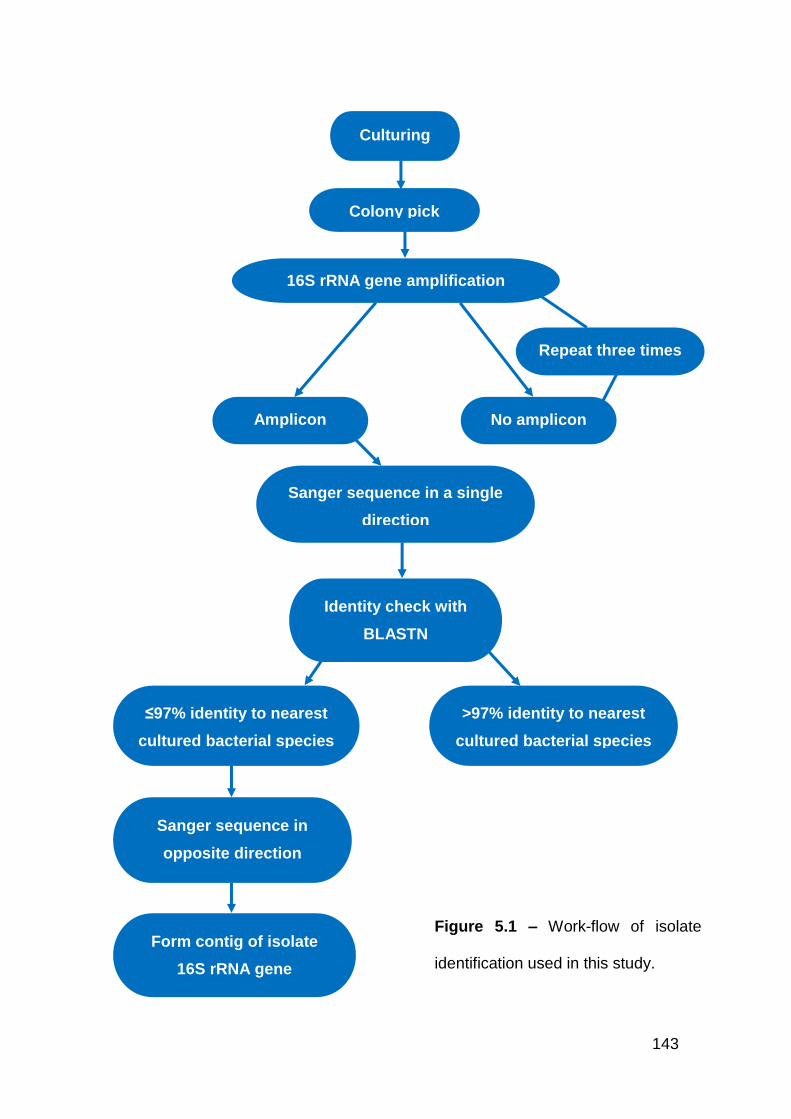
143
Culturing
Colony pick
16S rRNA gene amplification
Repeat three times
Amplicon No amplicon
Sanger sequence in a single
direction
Identity check with
BLASTN
≤97% identity to nearest
cultured bacterial species
>97% identity to nearest
cultured bacterial species
Sanger sequence in
opposite direction
Form contig of isolate
16S rRNA gene
Figure 5.1 – Work-flow of isolate
identification used in this study.
144
5.3 Results
35 isolates were cultured on FAA plates with 5% horse blood under anaerobic
conditions at 37 °C. The majority of these isolates (17/35) were grown after
serial dilution (to yield single colonies) without the addition of antibiotics or other
supplements (Table 5.1).
A further seven isolates were cultured after pre-treating caecal samples with
80% ethanol for 30 minutes prior to serial dilution; four on Mueller-Hinton agar
(MHA) with sodium thioglycolate and three on FAA plates with 5% horse blood
supplemented with sodium thioglycolate under anaerobic conditions at 37 °C. A
single isolate was cultured using the same method but with the addition of
vancomycin at 30 µg/ml to the agar (Table 5.1).
Heating caecal samples to 65 °C for 15 minutes prior to serial dilution resulted
in four isolates being cultured on FAA plates with 5% horse blood supplemented
with sodium thioglycolate under anaerobic conditions at 37 °C. A further isolate
was cultured after heating the sample to 80 °C and placed into a static blood
culture medium for three days prior to serial dilution on FAA plates with 5%
horse blood supplemented with sodium thioglycolate under anaerobic
conditions at 37 °C (Table 5.1).
FAA plates supplemented with antibiotics enabled five different bacterial
isolates to be cultured. A single isolate was cultured on an FAA plate
supplemented with colistin sulphate and two isolates each were cultured on
FAA plates supplemented with gentamicin and rifampicin (Table 5.1).
145
Under aerobic conditions at 37 °C, four isolates were cultured on LBA plates
and two on OSA. BHI was used under anaerobic conditions and 37 °C and two
isolates were cultured (Table 5.1).
5.3.1 Bacterial identification of cultured isolates
Isolates from the gut were identified using Sanger sequencing of the 16S rRNA
gene and placement into ARB. In total, 43 bacterial isolates were cultured from
the gut. For sixteen, the 16S rRNA gene was sequenced in both directions,
providing a single contig for almost the entire gene, while 27 had the 16S rRNA
gene sequenced just in a single direction.
The majority of bacterial species isolated were Gram-positive organisms with
five isolates assigned to Gram-negative organisms (E. coli, two Alistipes,
Bacteroides fragilis and B. intestinalis).
Caecal samples yielded the majority of isolates with ≤97% identity to the
nearest named bacterial species with 36 isolates cultured from a single sample
(phytase 2 caecum). Bifidobacterium pullorum was the only bacterial species
cultured from another caecal sample (control 1 caecum).
Staphylococcus warneri, a Bifidobacterium and a Bacillus species were
identified from isolates of proventriculus samples. E. coli was isolated from all
organ samples. Lactobacillus crispatus and Lactobacillus salivarius were
identified from cultured isolates from crop samples.
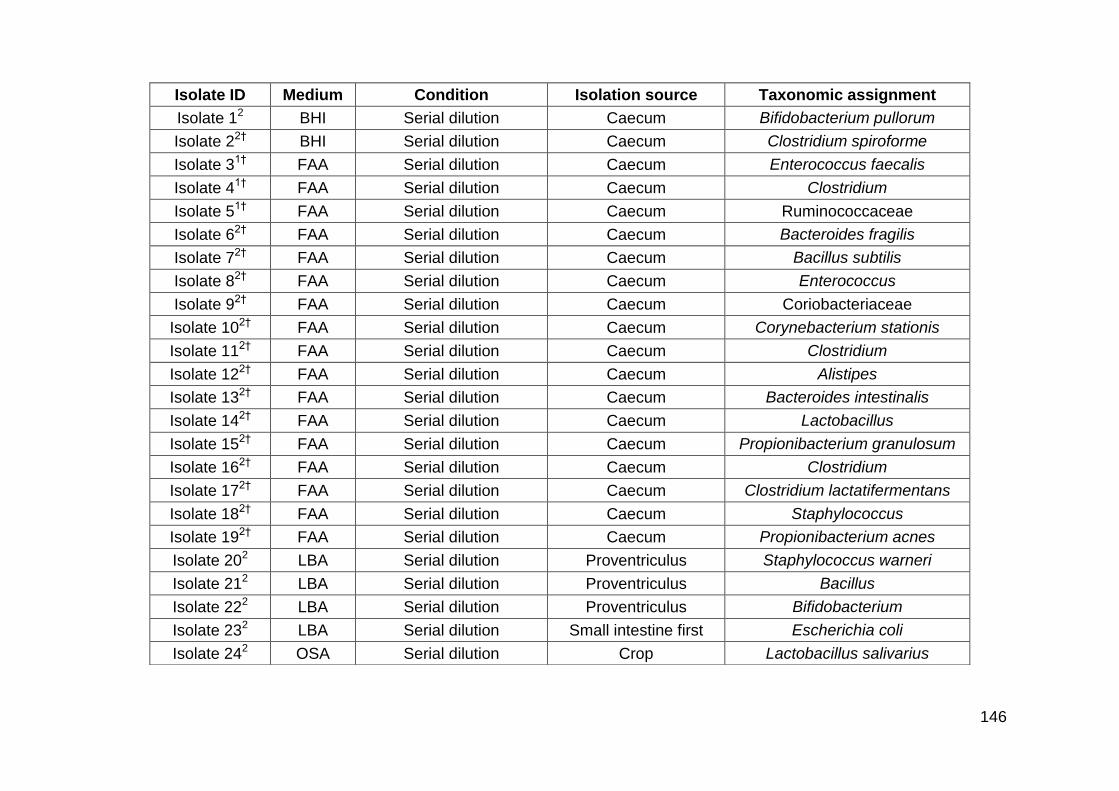
146
Isolate ID Medium Condition Isolation source Taxonomic assignment
Isolate 12 BHI Serial dilution Caecum Bifidobacterium pullorum
Isolate 22† BHI Serial dilution Caecum Clostridium spiroforme
Isolate 31† FAA Serial dilution Caecum Enterococcus faecalis
Isolate 41† FAA Serial dilution Caecum Clostridium
Isolate 51† FAA Serial dilution Caecum Ruminococcaceae
Isolate 62† FAA Serial dilution Caecum Bacteroides fragilis
Isolate 72† FAA Serial dilution Caecum Bacillus subtilis
Isolate 82† FAA Serial dilution Caecum Enterococcus
Isolate 92† FAA Serial dilution Caecum Coriobacteriaceae
Isolate 102† FAA Serial dilution Caecum Corynebacterium stationis
Isolate 112† FAA Serial dilution Caecum Clostridium
Isolate 122† FAA Serial dilution Caecum Alistipes
Isolate 132† FAA Serial dilution Caecum Bacteroides intestinalis
Isolate 142† FAA Serial dilution Caecum Lactobacillus
Isolate 152† FAA Serial dilution Caecum Propionibacterium granulosum
Isolate 162† FAA Serial dilution Caecum Clostridium
Isolate 172† FAA Serial dilution Caecum Clostridium lactatifermentans
Isolate 182† FAA Serial dilution Caecum Staphylococcus
Isolate 192† FAA Serial dilution Caecum Propionibacterium acnes
Isolate 202 LBA Serial dilution Proventriculus Staphylococcus warneri
Isolate 212 LBA Serial dilution Proventriculus Bacillus
Isolate 222 LBA Serial dilution Proventriculus Bifidobacterium
Isolate 232 LBA Serial dilution Small intestine first Escherichia coli
Isolate 242 OSA Serial dilution Crop Lactobacillus salivarius
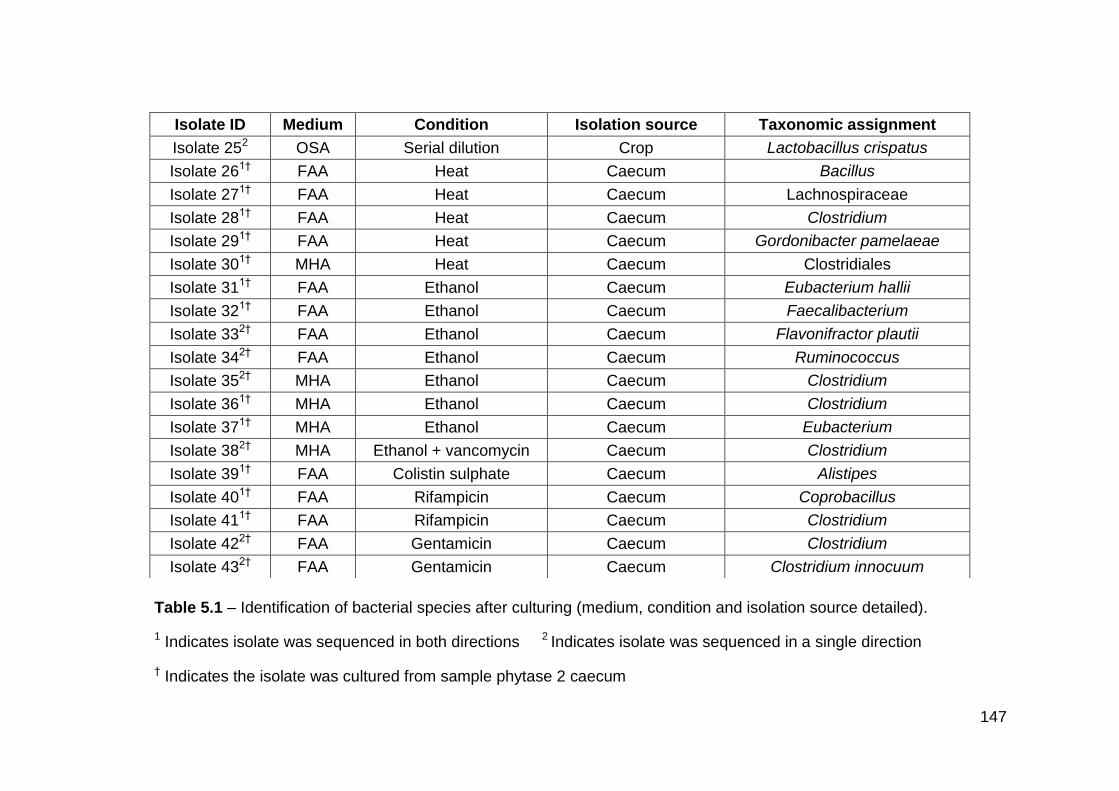
147
Isolate ID Medium Condition Isolation source Taxonomic assignment
Isolate 252 OSA Serial dilution Crop Lactobacillus crispatus
Isolate 261† FAA Heat Caecum Bacillus
Isolate 271† FAA Heat Caecum Lachnospiraceae
Isolate 281† FAA Heat Caecum Clostridium
Isolate 291† FAA Heat Caecum Gordonibacter pamelaeae
Isolate 301† MHA Heat Caecum Clostridiales
Isolate 311† FAA Ethanol Caecum Eubacterium hallii
Isolate 321† FAA Ethanol Caecum Faecalibacterium
Isolate 332† FAA Ethanol Caecum Flavonifractor plautii
Isolate 342† FAA Ethanol Caecum Ruminococcus
Isolate 352† MHA Ethanol Caecum Clostridium
Isolate 361† MHA Ethanol Caecum Clostridium
Isolate 371† MHA Ethanol Caecum Eubacterium
Isolate 382† MHA Ethanol + vancomycin Caecum Clostridium
Isolate 391† FAA Colistin sulphate Caecum Alistipes
Isolate 401† FAA Rifampicin Caecum Coprobacillus
Isolate 411† FAA Rifampicin Caecum Clostridium
Isolate 422† FAA Gentamicin Caecum Clostridium
Isolate 432† FAA Gentamicin Caecum Clostridium innocuum
Table 5.1 – Identification of bacterial species after culturing (medium, condition and isolation source detailed).
1 Indicates isolate was sequenced in both directions 2 Indicates isolate was sequenced in a single direction
† Indicates the isolate was cultured from sample phytase 2 caecum
148
5.3.2 Isolates from the Clostridiales
From the Clostridiales, isolate 5 formed a sister group of Gemmiger formicilis
and Subdoligranulum variabile. Isolate 32 was placed with Faecalibacterium
prausnitzii, however the branch length indicated this was a different species,
and isolate 38 was placed as an outgroup of two Clostridium species (Figure
5.2a). Isolate 37 grouped with Eubacterium coprostanoligenes; however, the
branch lengths indicated it is not the same species. Isolate 33 clustered with
Flavonifractor plautii and isolate 30 formed an outgroup of these species.
Isolate 36 formed a sister group of multiple Clostridium species (Figure 5.2a).
Isolate 42 formed a sister group of Clostridium species, of which isolate 2 was
within and placed next to C. spiroforme. Isolate 40 was placed with
Coprobacillus cateniformis, however the branch length indicates this is a
different species. Isolates 28 and 41 were placed together as an outgroup of
Clostridiaceae, Erysipelotichaceae and Lactobacillaceae species. Through
BLASTN it was determined isolates 28 and 41 were different species. Isolate 43
was placed with C. innocuum (Figure 5.2b).
Isolate 31 grouped with Eubacterium hallii, isolate 34 was placed outside a
clade of three Ruminococcus species and isolate 17 was placed with
Clostridium lactatifermentans (Figure 5.3). In the same tree, isolate 27 formed
an outgroup to a clade containing two Anaerostipes species and a Eubacterium.
Isolate 35 was placed as an outgroup to Clostridium schirmacherense and
Clostridium argentinense. Isolate 16 formed a sister group of Clostridium
botulinum, Eubacterium comesii and Clostridium sporogenes. Isolate 4 was
placed within a group of six Clostridium species and isolate 11 formed an
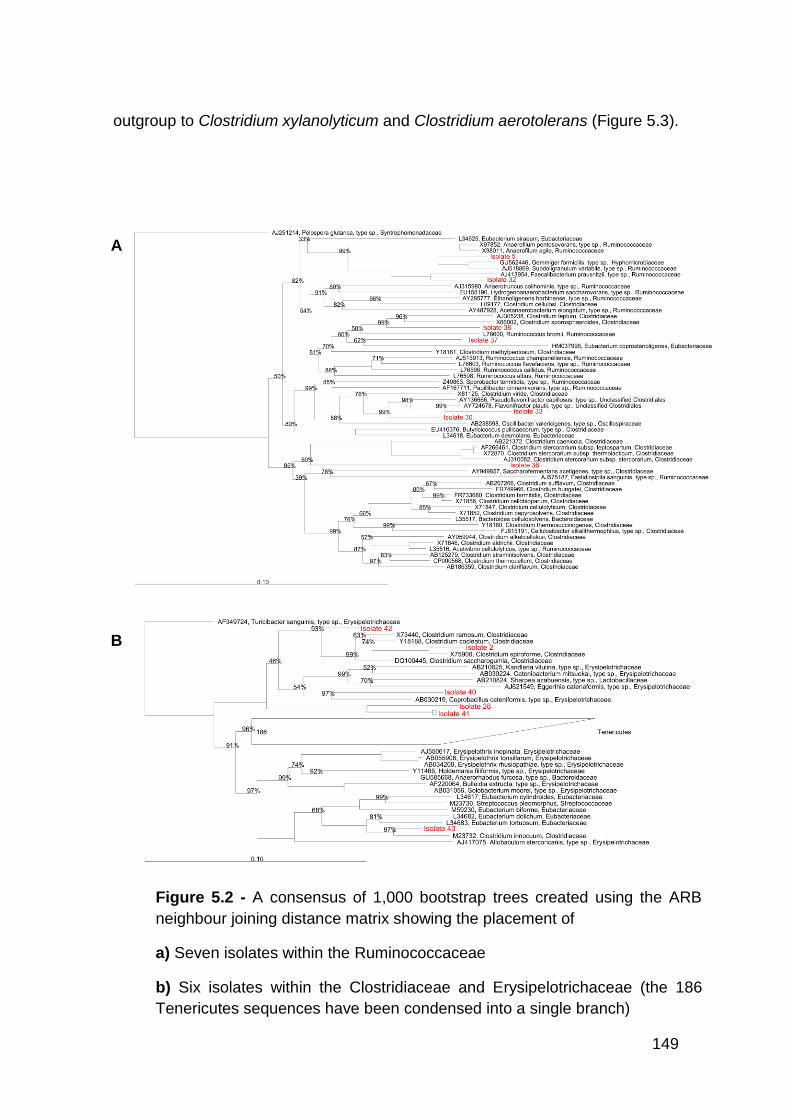
149
outgroup to Clostridium xylanolyticum and Clostridium aerotolerans (Figure 5.3).
Figure 5.2 - A consensus of 1,000 bootstrap trees created using the ARB
neighbour joining distance matrix showing the placement of
a) Seven isolates within the Ruminococcaceae
b) Six isolates within the Clostridiaceae and Erysipelotrichaceae (the 186
Tenericutes sequences have been condensed into a single branch)
A
B
B
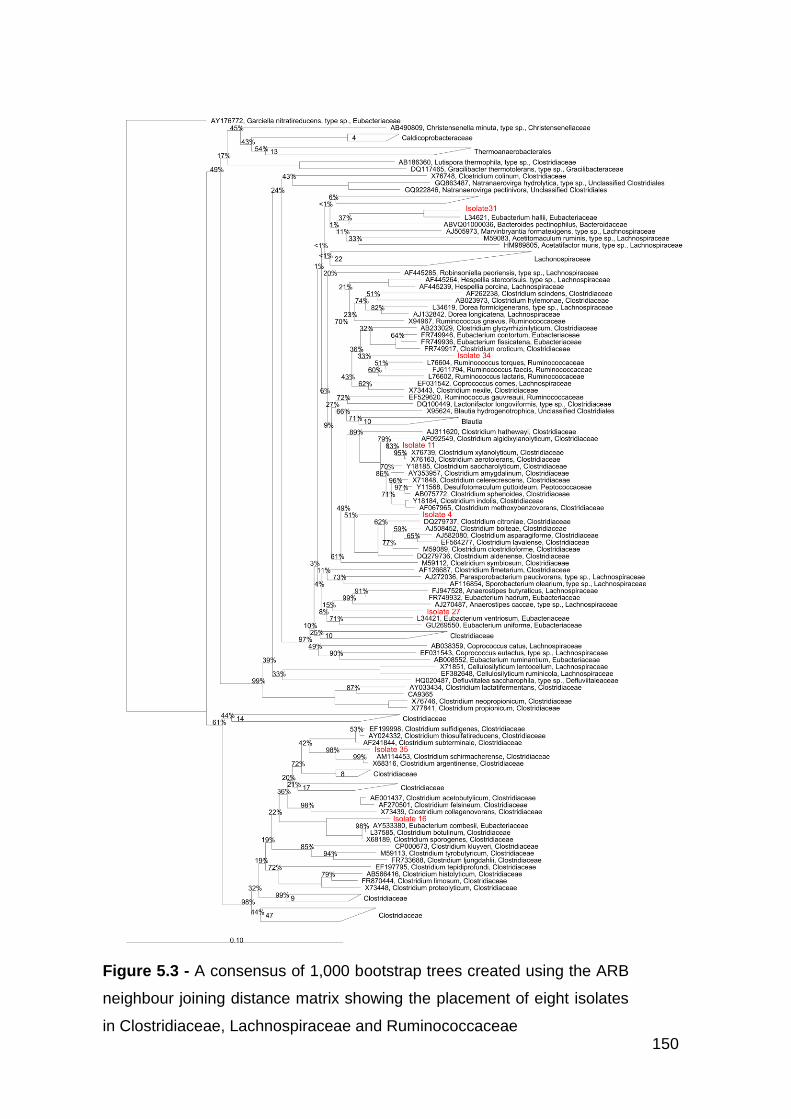
150
Figure 5.3 - A consensus of 1,000 bootstrap trees created using the ARB
neighbour joining distance matrix showing the placement of eight isolates
in Clostridiaceae, Lachnospiraceae and Ruminococcaceae
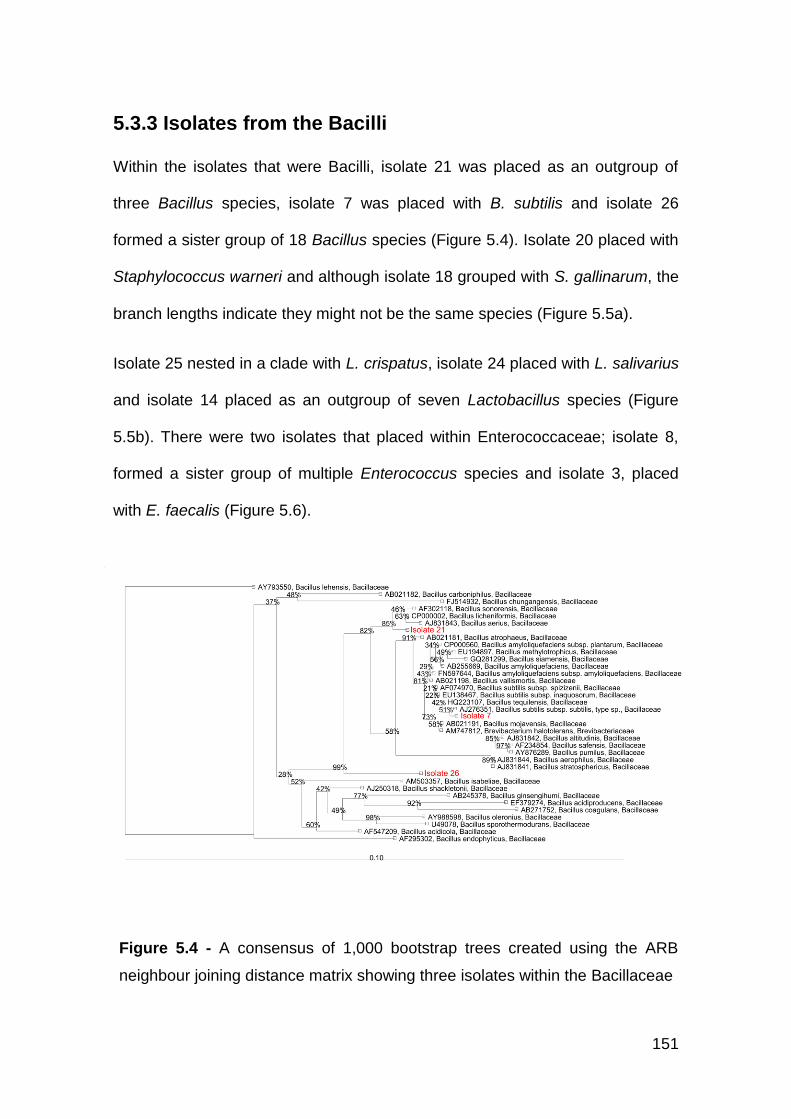
151
5.3.3 Isolates from the Bacilli
Within the isolates that were Bacilli, isolate 21 was placed as an outgroup of
three Bacillus species, isolate 7 was placed with B. subtilis and isolate 26
formed a sister group of 18 Bacillus species (Figure 5.4). Isolate 20 placed with
Staphylococcus warneri and although isolate 18 grouped with S. gallinarum, the
branch lengths indicate they might not be the same species (Figure 5.5a).
Isolate 25 nested in a clade with L. crispatus, isolate 24 placed with L. salivarius
and isolate 14 placed as an outgroup of seven Lactobacillus species (Figure
5.5b). There were two isolates that placed within Enterococcaceae; isolate 8,
formed a sister group of multiple Enterococcus species and isolate 3, placed
with E. faecalis (Figure 5.6).
Figure 5.4 - A consensus of 1,000 bootstrap trees created using the ARB
neighbour joining distance matrix showing three isolates within the Bacillaceae
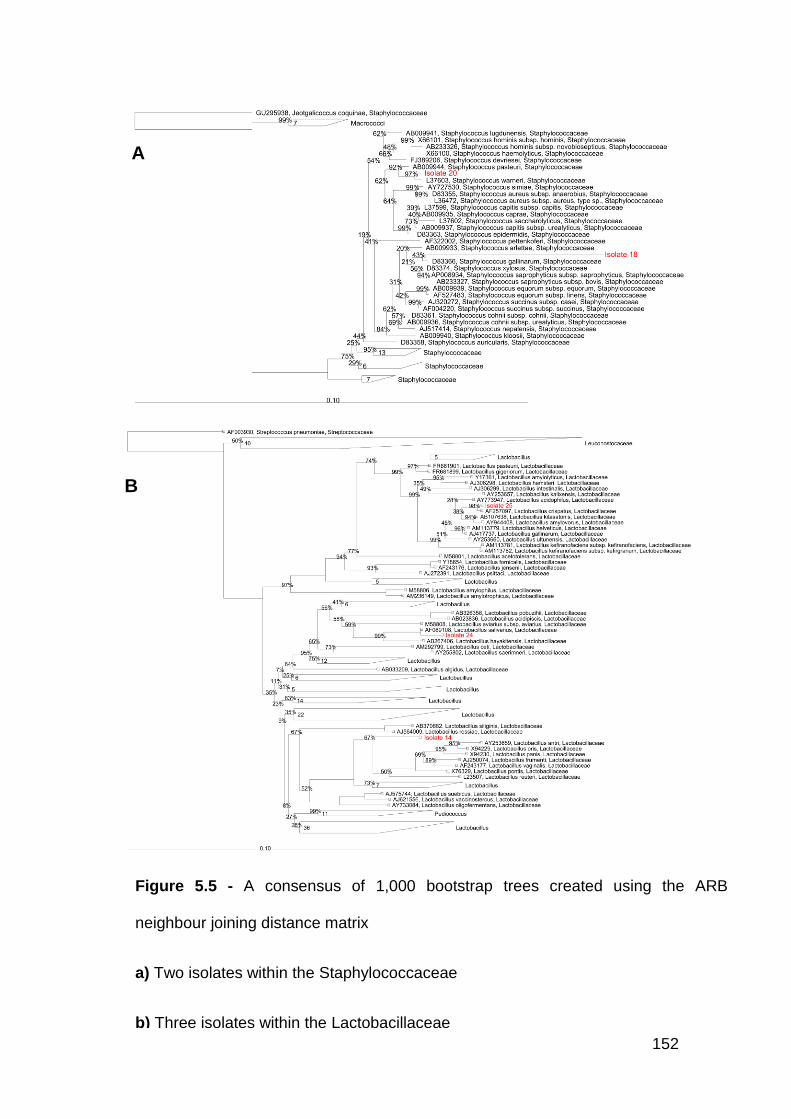
152
Figure 5.5 - A consensus of 1,000 bootstrap trees created using the ARB
neighbour joining distance matrix
a) Two isolates within the Staphylococcaceae
b) Three isolates within the Lactobacillaceae
A
B
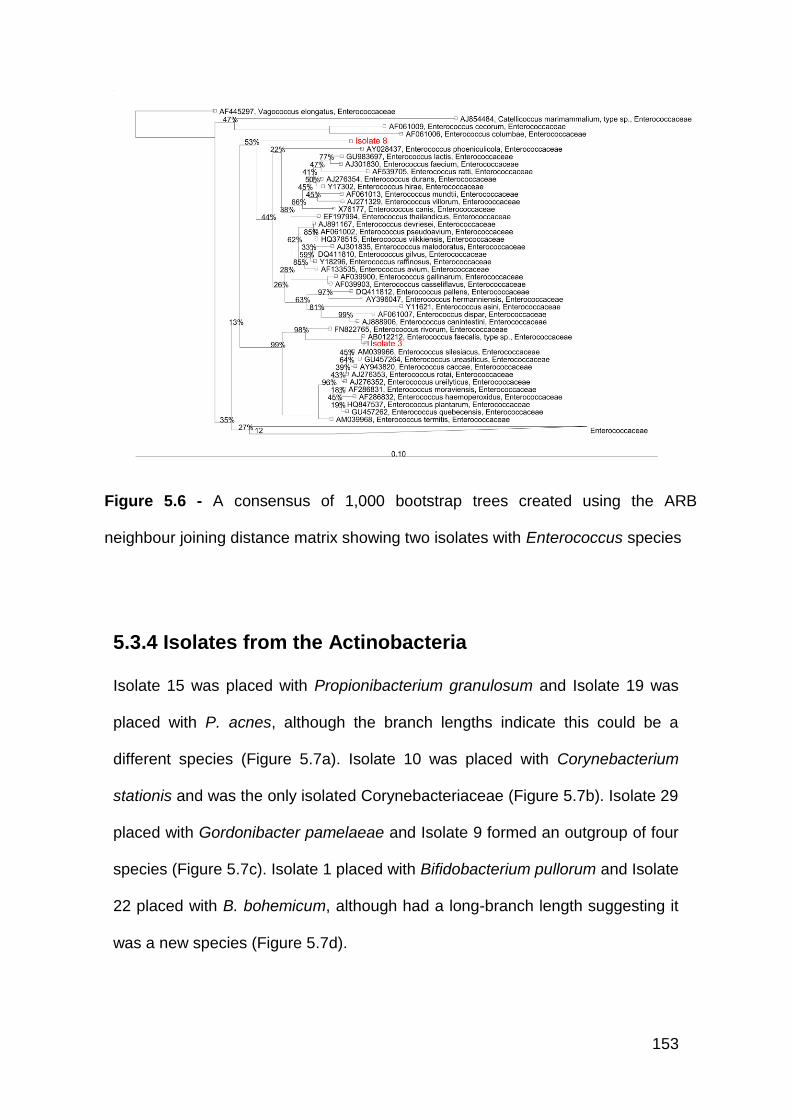
153
5.3.4 Isolates from the Actinobacteria
Isolate 15 was placed with Propionibacterium granulosum and Isolate 19 was
placed with P. acnes, although the branch lengths indicate this could be a
different species (Figure 5.7a). Isolate 10 was placed with Corynebacterium
stationis and was the only isolated Corynebacteriaceae (Figure 5.7b). Isolate 29
placed with Gordonibacter pamelaeae and Isolate 9 formed an outgroup of four
species (Figure 5.7c). Isolate 1 placed with Bifidobacterium pullorum and Isolate
22 placed with B. bohemicum, although had a long-branch length suggesting it
was a new species (Figure 5.7d).
Figure 5.6 - A consensus of 1,000 bootstrap trees created using the ARB
neighbour joining distance matrix showing two isolates with Enterococcus species
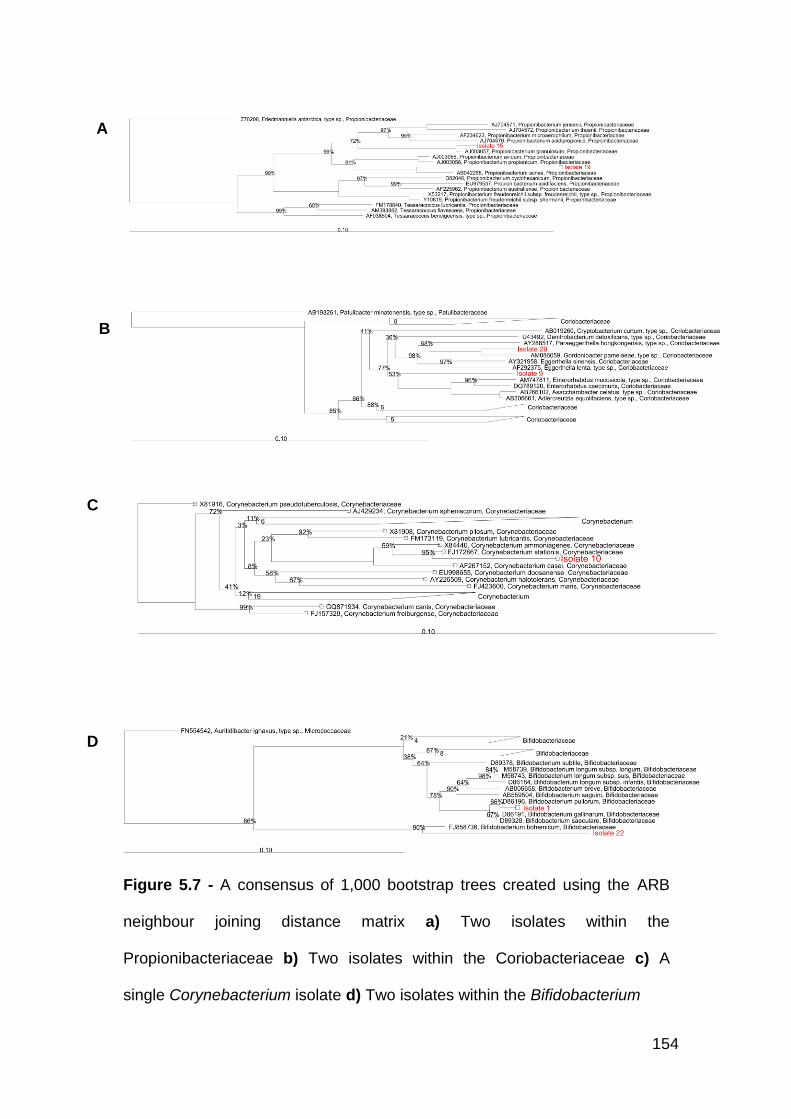
154
Figure 5.7 - A consensus of 1,000 bootstrap trees created using the ARB
neighbour joining distance matrix a) Two isolates within the
Propionibacteriaceae b) Two isolates within the Coriobacteriaceae c) A
single Corynebacterium isolate d) Two isolates within the Bifidobacterium
A
B
C
D
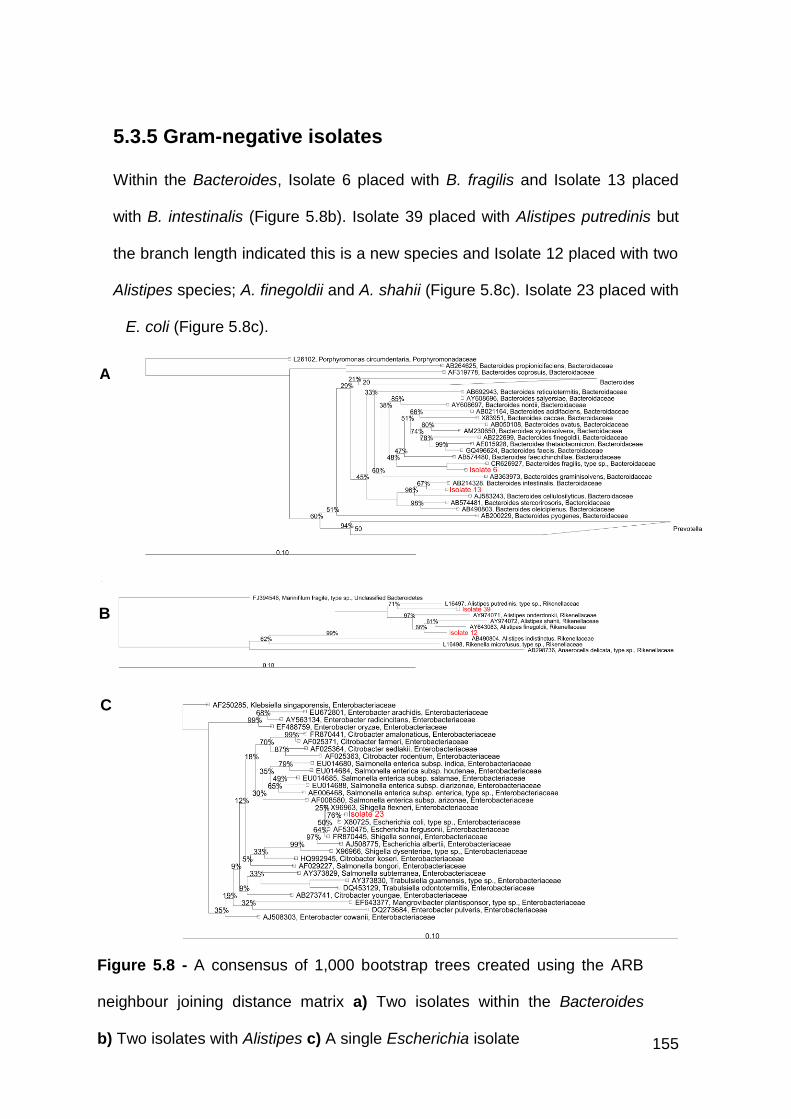
155
5.3.5 Gram-negative isolates
Within the Bacteroides, Isolate 6 placed with B. fragilis and Isolate 13 placed
with B. intestinalis (Figure 5.8b). Isolate 39 placed with Alistipes putredinis but
the branch length indicated this is a new species and Isolate 12 placed with two
Alistipes species; A. finegoldii and A. shahii (Figure 5.8c). Isolate 23 placed with
E. coli (Figure 5.8c).
Figure 5.8 - A consensus of 1,000 bootstrap trees created using the ARB
neighbour joining distance matrix a) Two isolates within the Bacteroides
b) Two isolates with Alistipes c) A single Escherichia isolate
A
B
C
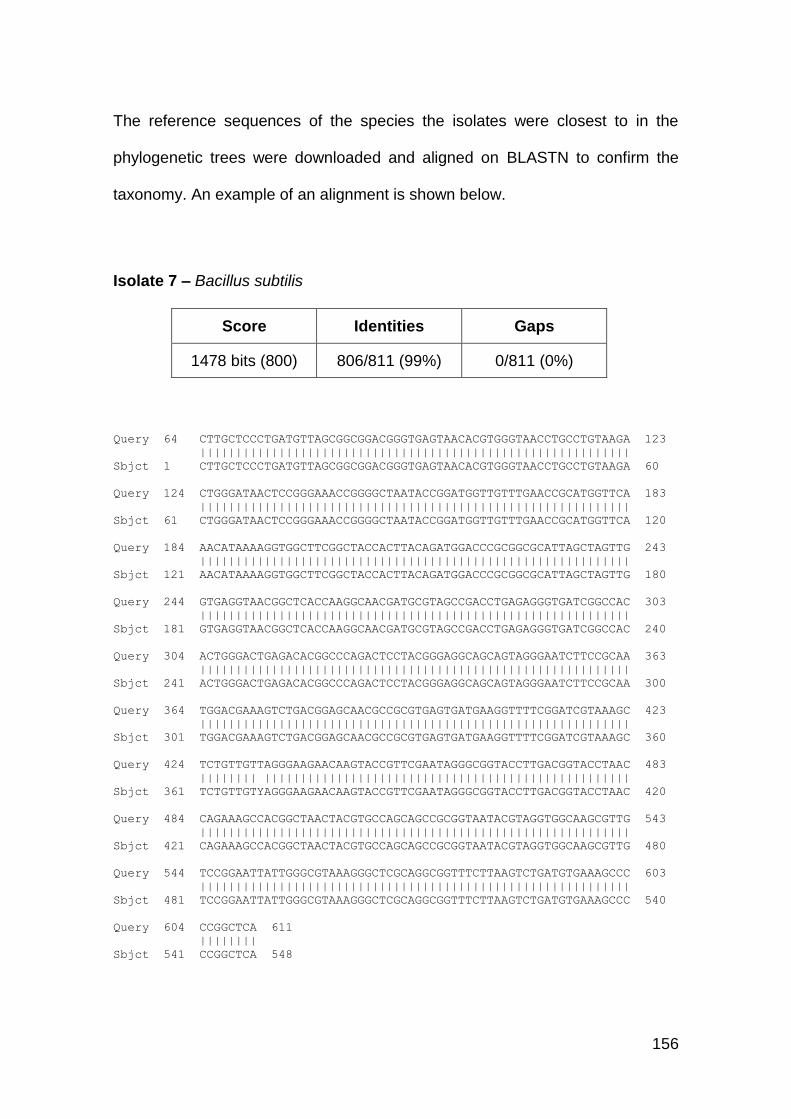
156
The reference sequences of the species the isolates were closest to in the
phylogenetic trees were downloaded and aligned on BLASTN to confirm the
taxonomy. An example of an alignment is shown below.
Isolate 7 – Bacillus subtilis
Score Identities Gaps
1478 bits (800) 806/811 (99%) 0/811 (0%)
Query 64 CTTGCTCCCTGATGTTAGCGGCGGACGGGTGAGTAACACGTGGGTAACCTGCCTGTAAGA 123
||||||||||||||||||||||||||||||||||||||||||||||||||||||||||||
Sbjct 1 CTTGCTCCCTGATGTTAGCGGCGGACGGGTGAGTAACACGTGGGTAACCTGCCTGTAAGA 60
Query 124 CTGGGATAACTCCGGGAAACCGGGGCTAATACCGGATGGTTGTTTGAACCGCATGGTTCA 183
||||||||||||||||||||||||||||||||||||||||||||||||||||||||||||
Sbjct 61 CTGGGATAACTCCGGGAAACCGGGGCTAATACCGGATGGTTGTTTGAACCGCATGGTTCA 120
Query 184 AACATAAAAGGTGGCTTCGGCTACCACTTACAGATGGACCCGCGGCGCATTAGCTAGTTG 243
||||||||||||||||||||||||||||||||||||||||||||||||||||||||||||
Sbjct 121 AACATAAAAGGTGGCTTCGGCTACCACTTACAGATGGACCCGCGGCGCATTAGCTAGTTG 180
Query 244 GTGAGGTAACGGCTCACCAAGGCAACGATGCGTAGCCGACCTGAGAGGGTGATCGGCCAC 303
||||||||||||||||||||||||||||||||||||||||||||||||||||||||||||
Sbjct 181 GTGAGGTAACGGCTCACCAAGGCAACGATGCGTAGCCGACCTGAGAGGGTGATCGGCCAC 240
Query 304 ACTGGGACTGAGACACGGCCCAGACTCCTACGGGAGGCAGCAGTAGGGAATCTTCCGCAA 363
||||||||||||||||||||||||||||||||||||||||||||||||||||||||||||
Sbjct 241 ACTGGGACTGAGACACGGCCCAGACTCCTACGGGAGGCAGCAGTAGGGAATCTTCCGCAA 300
Query 364 TGGACGAAAGTCTGACGGAGCAACGCCGCGTGAGTGATGAAGGTTTTCGGATCGTAAAGC 423
||||||||||||||||||||||||||||||||||||||||||||||||||||||||||||
Sbjct 301 TGGACGAAAGTCTGACGGAGCAACGCCGCGTGAGTGATGAAGGTTTTCGGATCGTAAAGC 360
Query 424 TCTGTTGTTAGGGAAGAACAAGTACCGTTCGAATAGGGCGGTACCTTGACGGTACCTAAC 483
|||||||| |||||||||||||||||||||||||||||||||||||||||||||||||||
Sbjct 361 TCTGTTGTYAGGGAAGAACAAGTACCGTTCGAATAGGGCGGTACCTTGACGGTACCTAAC 420
Query 484 CAGAAAGCCACGGCTAACTACGTGCCAGCAGCCGCGGTAATACGTAGGTGGCAAGCGTTG 543
||||||||||||||||||||||||||||||||||||||||||||||||||||||||||||
Sbjct 421 CAGAAAGCCACGGCTAACTACGTGCCAGCAGCCGCGGTAATACGTAGGTGGCAAGCGTTG 480
Query 544 TCCGGAATTATTGGGCGTAAAGGGCTCGCAGGCGGTTTCTTAAGTCTGATGTGAAAGCCC 603
||||||||||||||||||||||||||||||||||||||||||||||||||||||||||||
Sbjct 481 TCCGGAATTATTGGGCGTAAAGGGCTCGCAGGCGGTTTCTTAAGTCTGATGTGAAAGCCC 540
Query 604 CCGGCTCA 611
||||||||
Sbjct 541 CCGGCTCA 548
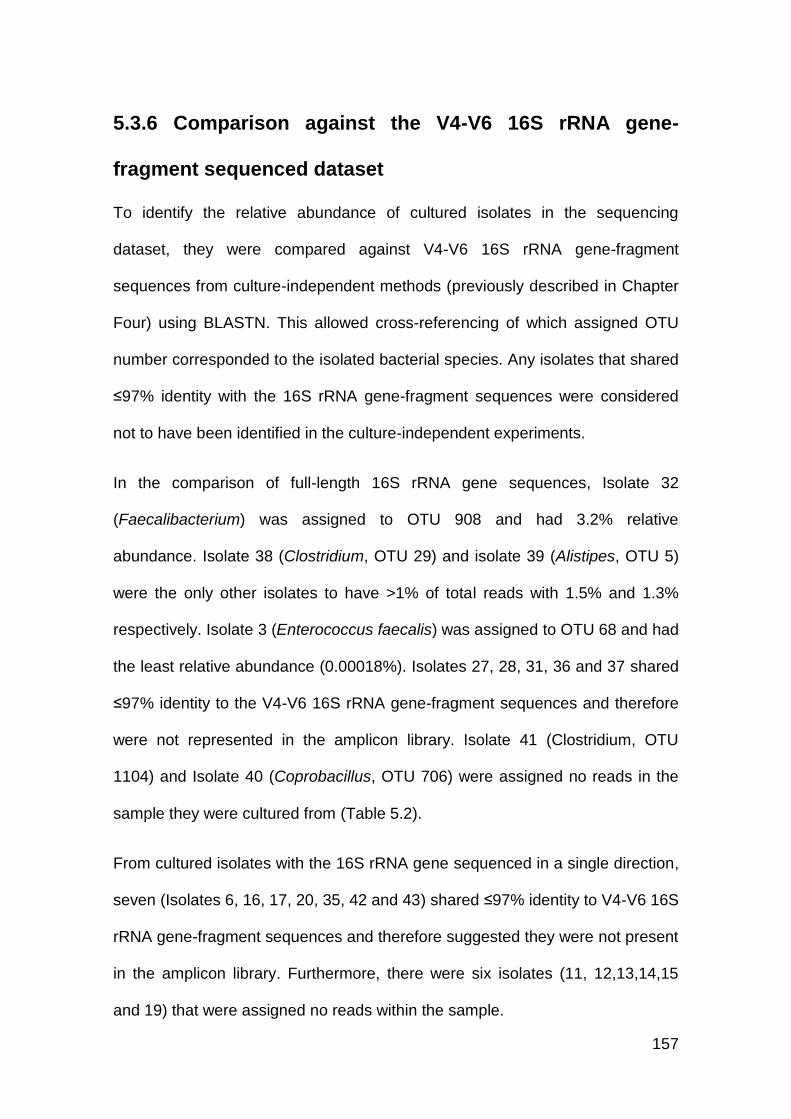
157
5.3.6 Comparison against the V4-V6 16S rRNA gene-
fragment sequenced dataset
To identify the relative abundance of cultured isolates in the sequencing
dataset, they were compared against V4-V6 16S rRNA gene-fragment
sequences from culture-independent methods (previously described in Chapter
Four) using BLASTN. This allowed cross-referencing of which assigned OTU
number corresponded to the isolated bacterial species. Any isolates that shared
≤97% identity with the 16S rRNA gene-fragment sequences were considered
not to have been identified in the culture-independent experiments.
In the comparison of full-length 16S rRNA gene sequences, Isolate 32
(Faecalibacterium) was assigned to OTU 908 and had 3.2% relative
abundance. Isolate 38 (Clostridium, OTU 29) and isolate 39 (Alistipes, OTU 5)
were the only other isolates to have >1% of total reads with 1.5% and 1.3%
respectively. Isolate 3 (Enterococcus faecalis) was assigned to OTU 68 and had
the least relative abundance (0.00018%). Isolates 27, 28, 31, 36 and 37 shared
≤97% identity to the V4-V6 16S rRNA gene-fragment sequences and therefore
were not represented in the amplicon library. Isolate 41 (Clostridium, OTU
1104) and Isolate 40 (Coprobacillus, OTU 706) were assigned no reads in the
sample they were cultured from (Table 5.2).
From cultured isolates with the 16S rRNA gene sequenced in a single direction,
seven (Isolates 6, 16, 17, 20, 35, 42 and 43) shared ≤97% identity to V4-V6 16S
rRNA gene-fragment sequences and therefore suggested they were not present
in the amplicon library. Furthermore, there were six isolates (11, 12,13,14,15
and 19) that were assigned no reads within the sample.
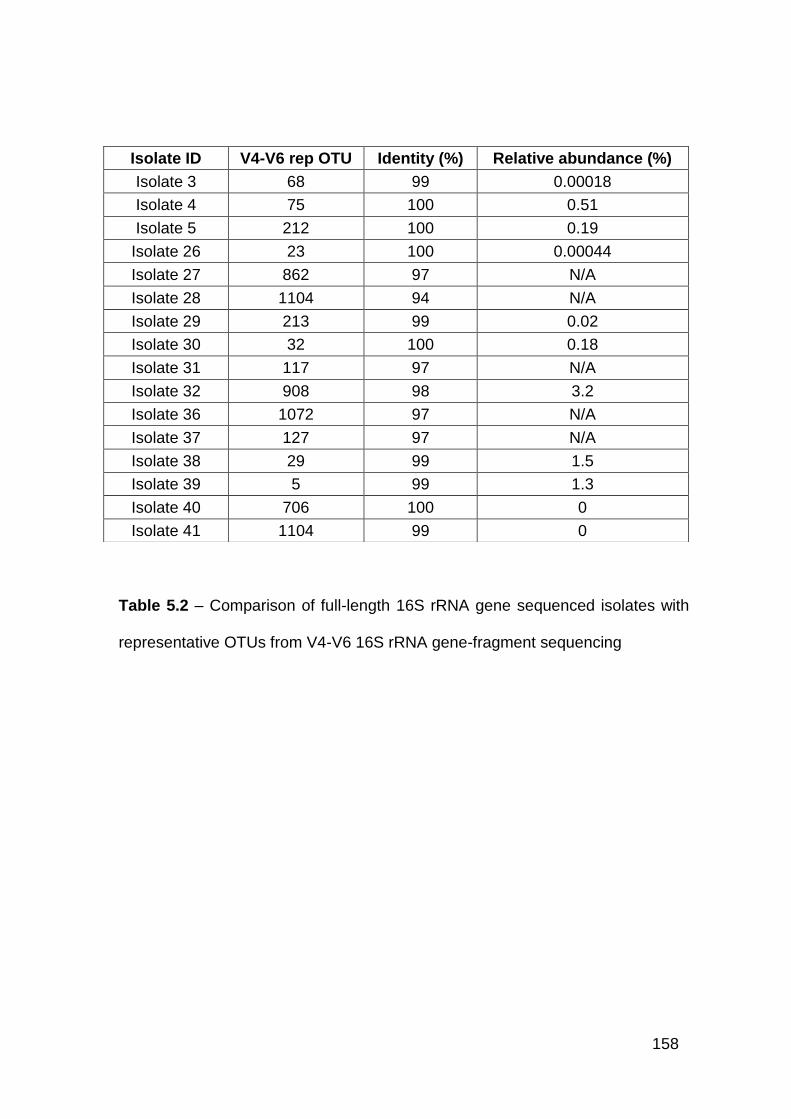
158
Isolate ID V4-V6 rep OTU Identity (%) Relative abundance (%)
Isolate 3 68 99 0.00018
Isolate 4 75 100 0.51
Isolate 5 212 100 0.19
Isolate 26 23 100 0.00044
Isolate 27 862 97 N/A
Isolate 28 1104 94 N/A
Isolate 29 213 99 0.02
Isolate 30 32 100 0.18
Isolate 31 117 97 N/A
Isolate 32 908 98 3.2
Isolate 36 1072 97 N/A
Isolate 37 127 97 N/A
Isolate 38 29 99 1.5
Isolate 39 5 99 1.3
Isolate 40 706 100 0
Isolate 41 1104 99 0
Table 5.2 – Comparison of full-length 16S rRNA gene sequenced isolates with
representative OTUs from V4-V6 16S rRNA gene-fragment sequencing
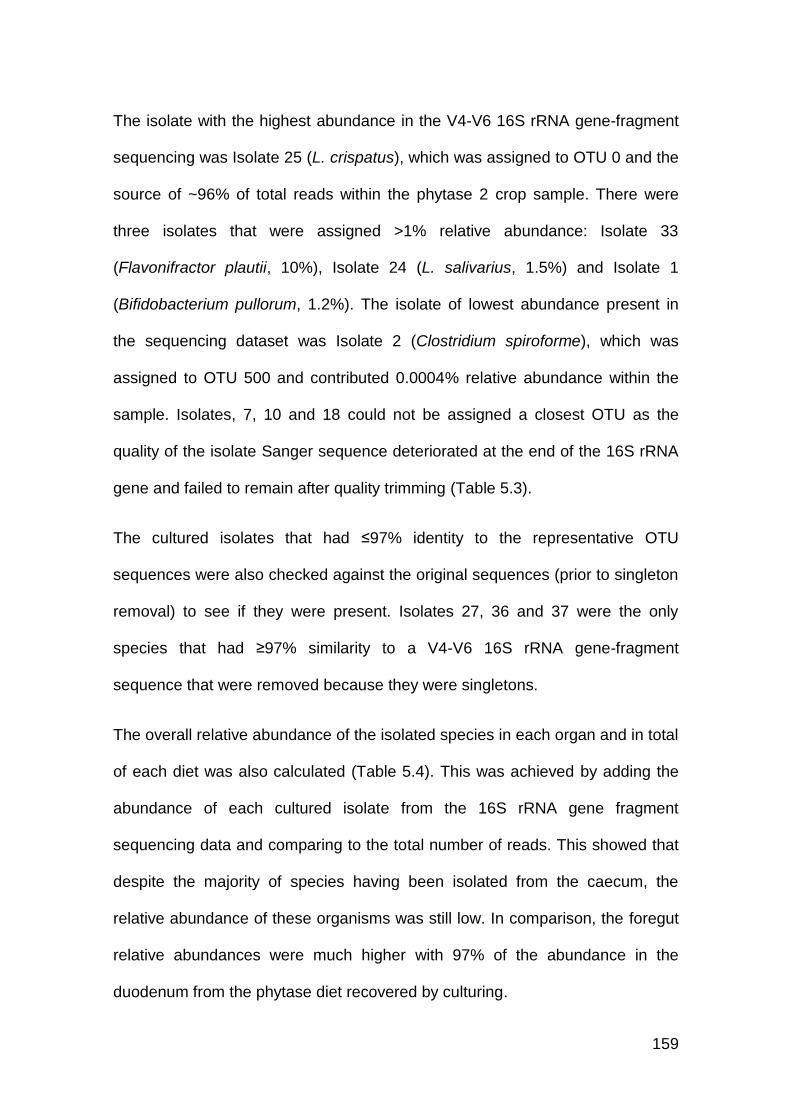
159
The isolate with the highest abundance in the V4-V6 16S rRNA gene-fragment
sequencing was Isolate 25 (L. crispatus), which was assigned to OTU 0 and the
source of ~96% of total reads within the phytase 2 crop sample. There were
three isolates that were assigned >1% relative abundance: Isolate 33
(Flavonifractor plautii, 10%), Isolate 24 (L. salivarius, 1.5%) and Isolate 1
(Bifidobacterium pullorum, 1.2%). The isolate of lowest abundance present in
the sequencing dataset was Isolate 2 (Clostridium spiroforme), which was
assigned to OTU 500 and contributed 0.0004% relative abundance within the
sample. Isolates, 7, 10 and 18 could not be assigned a closest OTU as the
quality of the isolate Sanger sequence deteriorated at the end of the 16S rRNA
gene and failed to remain after quality trimming (Table 5.3).
The cultured isolates that had ≤97% identity to the representative OTU
sequences were also checked against the original sequences (prior to singleton
removal) to see if they were present. Isolates 27, 36 and 37 were the only
species that had ≥97% similarity to a V4-V6 16S rRNA gene-fragment
sequence that were removed because they were singletons.
The overall relative abundance of the isolated species in each organ and in total
of each diet was also calculated (Table 5.4). This was achieved by adding the
abundance of each cultured isolate from the 16S rRNA gene fragment
sequencing data and comparing to the total number of reads. This showed that
despite the majority of species having been isolated from the caecum, the
relative abundance of these organisms was still low. In comparison, the foregut
relative abundances were much higher with 97% of the abundance in the
duodenum from the phytase diet recovered by culturing.
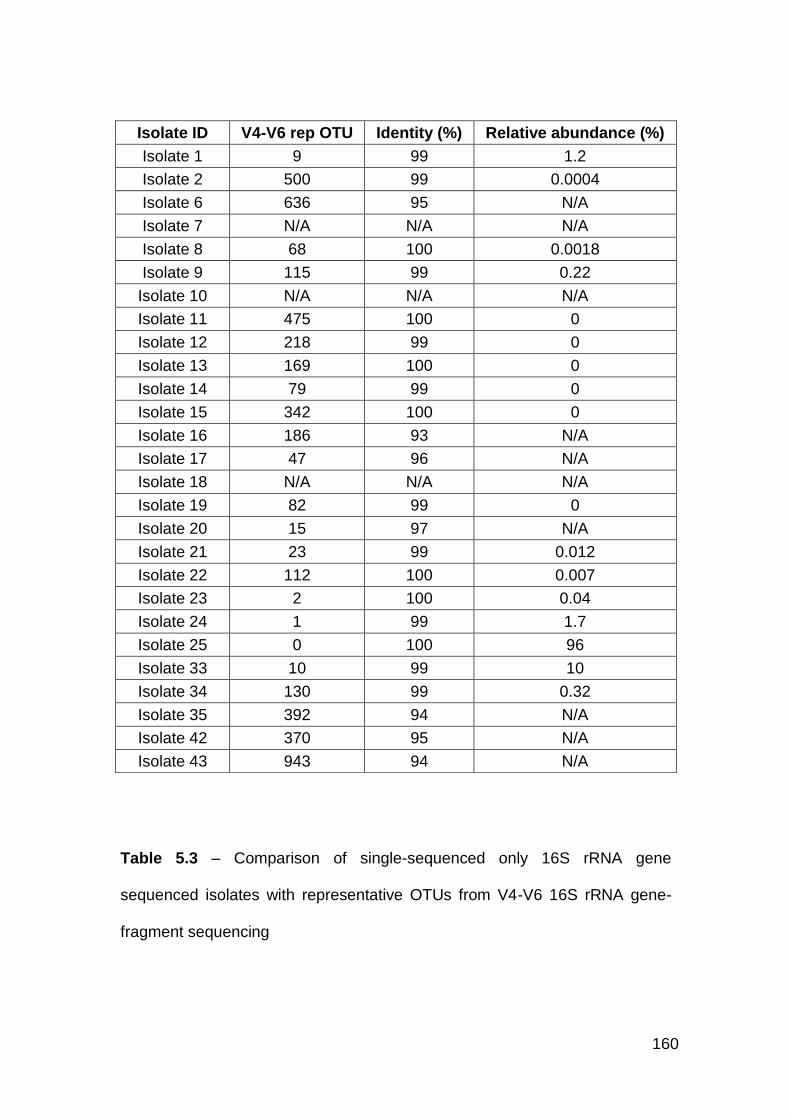
160
Table 5.3 – Comparison of single-sequenced only 16S rRNA gene
sequenced isolates with representative OTUs from V4-V6 16S rRNA gene-
fragment sequencing
Isolate ID V4-V6 rep OTU Identity (%) Relative abundance (%)
Isolate 1 9 99 1.2
Isolate 2 500 99 0.0004
Isolate 6 636 95 N/A
Isolate 7 N/A N/A N/A
Isolate 8 68 100 0.0018
Isolate 9 115 99 0.22
Isolate 10 N/A N/A N/A
Isolate 11 475 100 0
Isolate 12 218 99 0
Isolate 13 169 100 0
Isolate 14 79 99 0
Isolate 15 342 100 0
Isolate 16 186 93 N/A
Isolate 17 47 96 N/A
Isolate 18 N/A N/A N/A
Isolate 19 82 99 0
Isolate 20 15 97 N/A
Isolate 21 23 99 0.012
Isolate 22 112 100 0.007
Isolate 23 2 100 0.04
Isolate 24 1 99 1.7
Isolate 25 0 100 96
Isolate 33 10 99 10
Isolate 34 130 99 0.32
Isolate 35 392 94 N/A
Isolate 42 370 95 N/A
Isolate 43 943 94 N/A
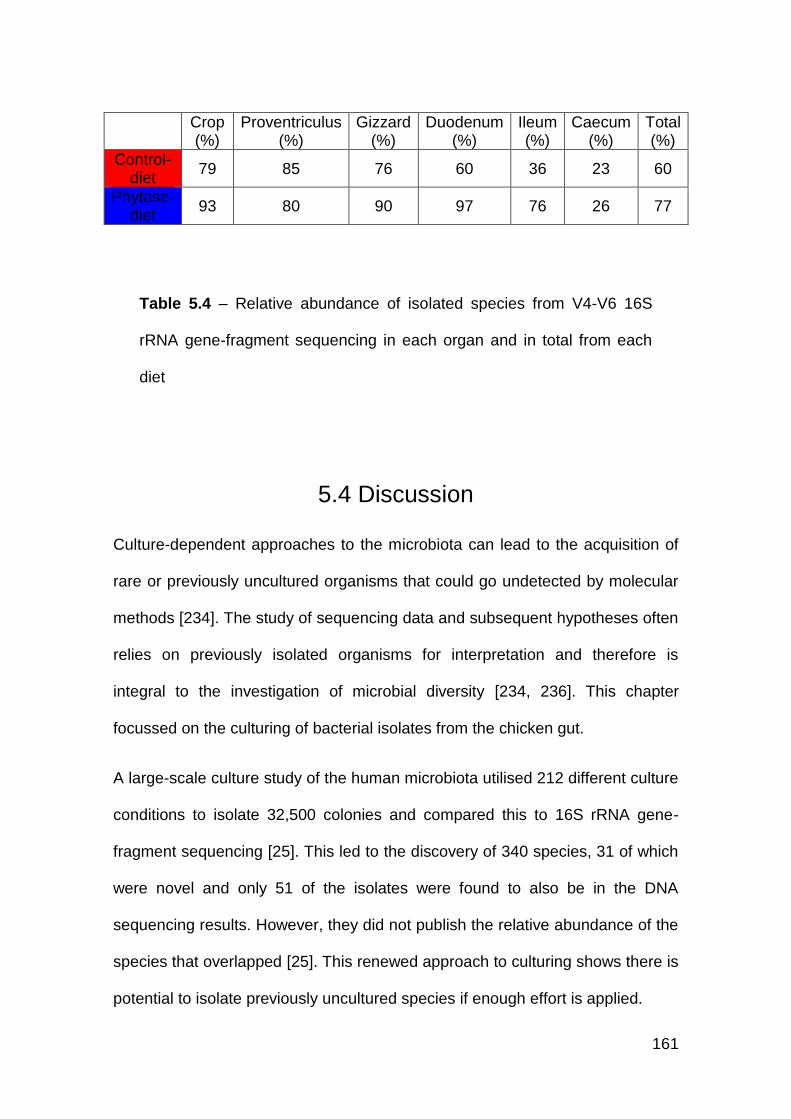
161
5.4 Discussion
Culture-dependent approaches to the microbiota can lead to the acquisition of
rare or previously uncultured organisms that could go undetected by molecular
methods [234]. The study of sequencing data and subsequent hypotheses often
relies on previously isolated organisms for interpretation and therefore is
integral to the investigation of microbial diversity [234, 236]. This chapter
focussed on the culturing of bacterial isolates from the chicken gut.
A large-scale culture study of the human microbiota utilised 212 different culture
conditions to isolate 32,500 colonies and compared this to 16S rRNA gene-
fragment sequencing [25]. This led to the discovery of 340 species, 31 of which
were novel and only 51 of the isolates were found to also be in the DNA
sequencing results. However, they did not publish the relative abundance of the
species that overlapped [25]. This renewed approach to culturing shows there is
potential to isolate previously uncultured species if enough effort is applied.
Crop (%)
Proventriculus (%)
Gizzard (%)
Duodenum (%)
Ileum (%)
Caecum (%)
Total (%)
Control-diet
79 85 76 60 36 23 60
Phytase-diet
93 80 90 97 76 26 77
Table 5.4 – Relative abundance of isolated species from V4-V6 16S
rRNA gene-fragment sequencing in each organ and in total from each
diet
162
There has been a single study that used culture-dependent and culture-
independent techniques to study the ileum and caecum of conventional and
organic raised broilers [5] However, to the authors’ knowledge this is the first
study to directly compare isolates with those found with high-throughput 16S
rRNA gene-fragment sequencing.
The culturing of 43 different bacterial species from the chicken gut led to the
identification of many species that could not be identified from high-throughput
16S rRNA gene-fragment sequencing alone. One of these, L. crispatus, was
one of the most dominant species throughout the gut and has been identified in
the chicken previously [101, 117, 118]. The ability of L. crispatus strains to
adhere to the stratified squamous epithelium helps it to proliferate in the crop
and has been shown to competitively exclude Salmonella enterica serovar
Enteritidis, when present with Clostridium lactatifermentans (which was also
isolated in the authors’ study) [237, 238].
Of the other Lactobacillus species isolated; L. salivarius has been identified in
chickens previously and was also found to be one of the most abundant species
in the crop [239]. Some strains of L. salivarius can produce a bacteriocin with an
inhibitory effect on C. jejuni and other strains can out-compete E.coli and
Salmonella, similarly to L. crispatus. [240]. The other Lactobacillus isolate could
not be identified beyond genus-level. The cultured isolate was found in V4-V6
16S rRNA gene-fragment sequencing and the inability to determine the species
could have been because the isolate did not have the entire 16S rRNA gene
sequenced, therefore there was not enough sequence to differentiate it from
other Lactobacillus species.
163
The majority of caecal isolates were Firmicutes and were within the
Ruminococcaceae and Lachnospiraceae families, corroborating the sequencing
results and the findings of previous culturing studies [90-93]. Facultative
anaerobes such as E. coli and lactobacilli were commonly isolated in this study
despite their low relative abundance in the sample and this could be why levels
of these groups were over-estimated in early culturing attempts [90-93].
To the authors’ knowledge this is the first time Corynebacterium stationis has
been identified in the chicken gut. However, the genus has been found before
both within the gut and on the surface of chicken meat during processing [241,
242]. Furthermore, it was not detected in the 16S rRNA gene sequencing
analysis in Chapter Three and could not be compared to the deeper V4-V6
(detailed in Chapter Four) data due to the low quality of Sanger sequence in the
V4-V6 16S rRNA region.
Of the cultured Bacteroides species, B. fragilis has been identified from
previous studies using both culture-dependent and culture-independent
methods on the chicken gut. However, the effect on the chicken is unknown [91,
118]. B. fragilis has previously been identified as the most virulent Bacteroides
species with fimbriae and agglutinins acting as adhesins. The polysaccharide
capsule and enzymes suite protects it from host immune response and mediate
tissue destruction [243]. It is the most commonly isolated Bacteroides species
despite its low relative abundance in the host, this is in part due to the ability to
tolerate and use oxygen [243]. B. intestinalis was originally isolated and
identified from human faeces but has not been reported in chickens before
[244]. It can ferment a range of polysaccharides to produce acids, but the
164
identity of these acids and the amounts are not described [244]. It was found in
very low abundance in the caecal sample it was isolated from, therefore any
effect this species would have on the chicken could be reduced.
Clostridium spiroforme was originally isolated from a chicken in 1979 and has
been implicated in the cause of the enteritis-complex in rabbits [245, 246].
Similarly to C. perfringens, it contains an iota-toxin however, this is on the
chromosome of C. spiroforme rather than a plasmid like C. perfringens [247].
The effect of C. spiroforme on chickens has not been fully investigated although
it has been isolated from healthy chickens and those with coccidiosis (the same
as C. perfringens) [248]. In the authors’ study, this species was isolated from
the heaviest chicken; therefore any negative effects imposed on the bird must
have been limited because it did not influence weight gain.
Flavonifractor plautii (formerly Clostridium orbiscindens/Eubacterium plautii) has
been found in multiple previous studies of the chicken gut [115, 118, 137, 210].
A reason behind the discovery of this species in many other studies could be
due to the anaerobic degradation of flavonoids [249]. Flavonoids are widely
distributed secondary metabolites in most plant seeds and grains and therefore
ingested naturally [249]. As an obligate anaerobe, it is unable to ferment the
majority of common saccharides. However, in a broth produces large amounts
of butyric and acetic acid, with a smaller amount of propionic acid [250]. This
suggests this species could be very beneficial to the host; the inability to
ferment saccharides means it is not competing for nutrients whilst still producing
beneficial volatile fatty acids.
165
E. coli has been identified in chickens since the first study in 1896 (known as
Bacillus coli) [36]. It has been found in multiple culture-dependent and culture-
independent studies of the chicken gut since then and is the main source of
Proteobacteria assigned reads [5, 24, 90-93, 109-111]. Avian pathogenic
Escherichia coli (APEC) causes a range of extra-intestinal diseases in chickens
including colibacillosis, which can result in significant economic losses to the
poultry industry [251, 252]. However, with sequencing of the 16S rRNA gene it
is difficult to provide identification below species level, therefore the strains of E.
coli that were isolated still need to be determined [253].
A number of bacterial species were isolated from the proventriculus that have
not been observed before. E. coli was commonly isolated from this organ, in
addition to L. crispatus, L. salivarius and a Bacillus species. This is the first time
an organism has been specifically identified, with the only published study
observing lactobacilli however failed to identify a species [106].
From the 43 isolates, 25 could not be assigned to a bacterial species. This
could have been due to the lack of full-length 16S rRNA gene sequences for
some of the isolates, resulting in the lack of differentiation. However, 12 of the
isolates that had a full-length sequence failed to cluster with a known bacterial
species, indicating they could be new species. The isolates sequenced from a
single direction should have the full length of the 16S rRNA gene sequenced to
allow for better assignment.
Unlike the culturomics study of human faeces, this was not a comprehensive
study of the chicken gut using culturing. The authors’ study relied upon
phenotypic traits for differentiation and therefore many different isolates could
166
have been missed. Furthermore, the selection of spores by using heat and
ethanol could result in the germination and subsequent identification of species
that were in a vegetative state in the gut, hence reducing the probability of being
lysed during the isolation of DNA for sequencing and thus not detected. From
the limited culturing applied to the chicken gut, a number of potential novel
species were isolated; therefore there is scope for a more comprehensive study
to identify multitudes of novel species. Six of the isolates were chosen for
whole-genome sequence analysis and this is presented in Chapter Six.
167
CHAPTER SIX
6. Genome sequence analysis of novel
bacterial species isolated from the
chicken gut
168
6.1 Introduction
Large polymers from NSPs often become entangled and increase the viscosity
of the intestine [172]. This causes a slow-down in digesta transit time, leading to
bacterial overgrowth. Furthermore, this viscosity prevents enzymes from
breaking down the polymer efficiently [99, 180, 184, 195]. The addition of NSP-
degrading enzymes reduces large polymers before they can become entangled
and thus increases the digestibility of the feed which has been shown to
increase the FCR [174, 191]. Exogenous enzymes such as xylanase and
cellulase have also shown to reduce the abundance of pathogens such as C.
perfringens and Campylobacter species in the caeca of chicks, this is attributed
to oligosaccharides that are released after NSP degradation by the enzymes
being fermented by these species [174, 254].
The treatment of bacterial infections is becoming increasingly more difficult with
the emergence of multi-antibiotic resistant organisms [163, 255, 256]. From
whole genome sequencing of some organisms (such as MRSA) it was found
that the majority of the resistance genes were acquired through horizontal gene
transfer as opposed to intra-genomic evolution of resistance [132, 163].
Antibiotic growth promoters were routinely fed to chickens before they were
banned in 2005 and therapeutic antibiotics are still given in large quantities
promoting the emergence of resistant zoonotic pathogens [132, 160, 161].
In metagenomic studies, antibiotic resistance genes are regularly identified and
multi-drug resistant bacteria have been isolated from the chicken on multiple
occasions [2, 29, 68, 167, 168]. This indicates that microbial communities (such
as the chicken-gut microbiome) are potential reservoirs for antibiotic resistance,
169
which could be particularly important if human pathogens were exposed to
these communities. Therefore the identification of antibiotic resistance in novel
species found in chickens could have potential importance to human health.
The aim of this chapter was to perform whole genome sequence analysis on six
isolates; the objectives were to determine if they were novel through
comparison of closest bacterial species, identify antibiotic resistance genes and
potential industrially relevant enzymes.
6.2 Methods
From the cultured isolates discussed in chapter five, six were whole genome
sequenced using an Illumina MiSeq 2x250 bp run. To check the quality of the
sequences, they were initially loaded into fastqc before they were trimmed using
SICKLE. De novo assembly was performed using SPAdes3.1. The contigs file
output from SPAdes3.1 was used to map the reads against using BWA mem.
Sequences were then converted with samtools and loaded into qualimap to
check the quality of the assembly and the coverage of each contig. Contigs with
<5x coverage were removed from the contig files and the process was repeated
from the BWA step. To annotate the contig sequences, PROKKA1.9 was
utilised.
Genome sequences were uploaded to SPECI which compares the genome
sequences against 40 clusters of orthologous groups and found the nearest
bacterial species cluster [257] and the 16S rRNA genes were inserted into ARB
to determine taxonomy. An in silico DNA-DNA hybridization (DDH) analysis of
170
the genomes was completed using the Genome-to-Genome Distance
Calculator (GGDC 2.0) [258] and average nucleotide identity (ANI) was
performed with JSpecies [259] on the bacterial species that were closest to the
isolate after ARB taxonomy placing. A threshold value of 70% (DDH) and 95%
(ANI) were set for a genome belonging to the same species as per convention
[258, 259]. Genomes were checked for antibiotic resistance genes using
ResFinder2.1 [260]. As previously described, polysaccharide degrading
enzymes are industrially relevant, therefore to identify any within these novel
isolates BLASTKOALA [261] was used and PROKKA annotations further
searched in Artemis. A custom python script was used to determine the number
of sporulation genes present using the genes referred to in Abecasis et al.
[108].
6.3 Results
6.3.1 Clostridiales isolate one
Clostridiales isolate one was cultured from a chicken caecum by heating the
digesta to 65 oC for 15 minutes prior to serial dilution on FAA supplemented
with sodium thioglycolate for three-five days in an anaerobic chamber at 37 oC.
A total of 498,389 reads were produced, which resulted in 31x mean genome
coverage. De novo assembly resulted in 48 contigs (max length, 346,860 bp)
which totalled 3,426,140 bp with a G+C content of 36.8% (Table 6.1). Within the
genome there were 52 tRNAs, five rRNA operons, 80 ncRNA operons, 3081
CDS and five CRISPR structures.
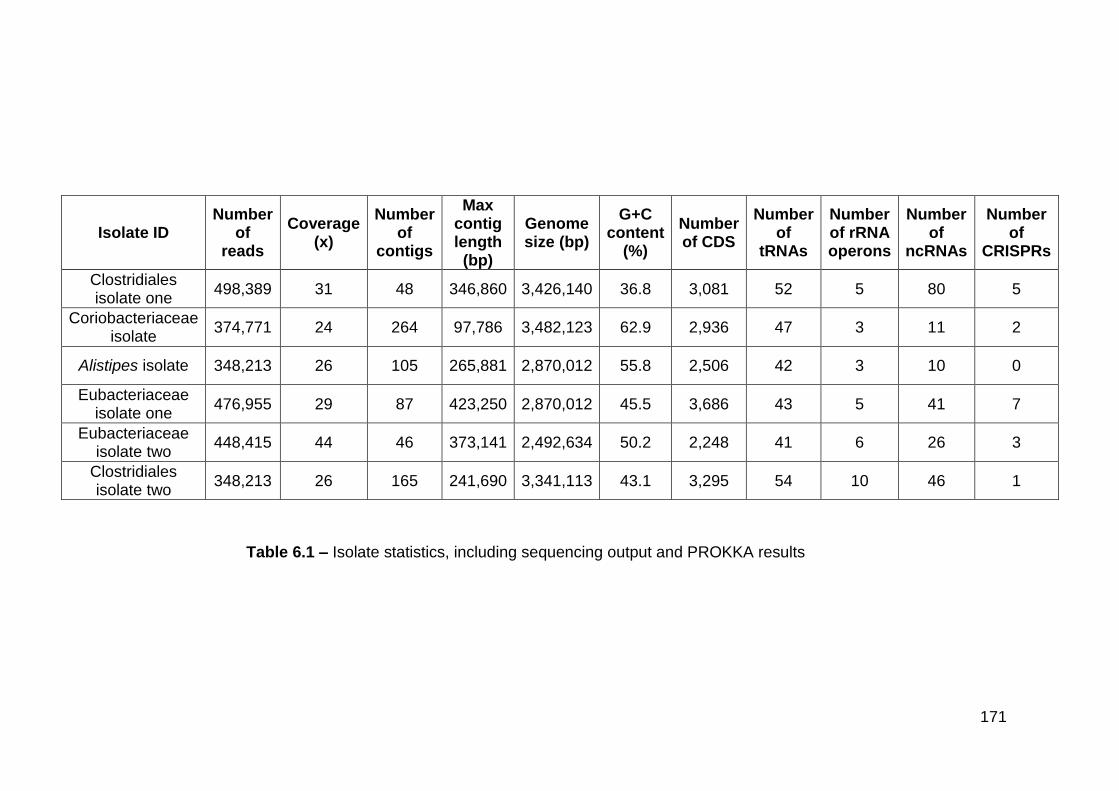
171
Isolate ID Number
of reads
Coverage (x)
Number of
contigs
Max contig length (bp)
Genome size (bp)
G+C content
(%)
Number of CDS
Number of
tRNAs
Number of rRNA operons
Number of
ncRNAs
Number of
CRISPRs
Clostridiales isolate one
498,389 31 48 346,860 3,426,140 36.8 3,081 52 5 80 5
Coriobacteriaceae isolate
374,771 24 264 97,786 3,482,123 62.9 2,936 47 3 11 2
Alistipes isolate 348,213 26 105 265,881 2,870,012 55.8 2,506 42 3 10 0
Eubacteriaceae isolate one
476,955 29 87 423,250 2,870,012 45.5 3,686 43 5 41 7
Eubacteriaceae isolate two
448,415 44 46 373,141 2,492,634 50.2 2,248 41 6 26 3
Clostridiales isolate two
348,213 26 165 241,690 3,341,113 43.1 3,295 54 10 46 1
Table 6.1 – Isolate statistics, including sequencing output and PROKKA results
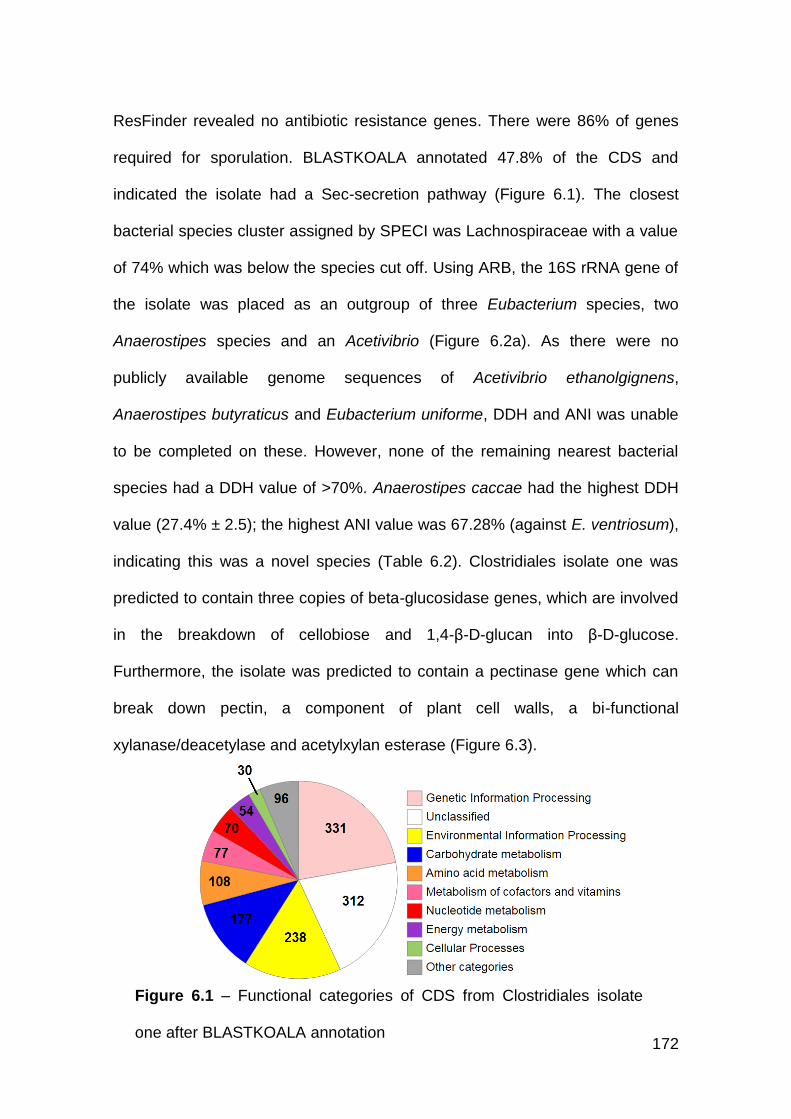
172
ResFinder revealed no antibiotic resistance genes. There were 86% of genes
required for sporulation. BLASTKOALA annotated 47.8% of the CDS and
indicated the isolate had a Sec-secretion pathway (Figure 6.1). The closest
bacterial species cluster assigned by SPECI was Lachnospiraceae with a value
of 74% which was below the species cut off. Using ARB, the 16S rRNA gene of
the isolate was placed as an outgroup of three Eubacterium species, two
Anaerostipes species and an Acetivibrio (Figure 6.2a). As there were no
publicly available genome sequences of Acetivibrio ethanolgignens,
Anaerostipes butyraticus and Eubacterium uniforme, DDH and ANI was unable
to be completed on these. However, none of the remaining nearest bacterial
species had a DDH value of >70%. Anaerostipes caccae had the highest DDH
value (27.4% ± 2.5); the highest ANI value was 67.28% (against E. ventriosum),
indicating this was a novel species (Table 6.2). Clostridiales isolate one was
predicted to contain three copies of beta-glucosidase genes, which are involved
in the breakdown of cellobiose and 1,4-β-D-glucan into β-D-glucose.
Furthermore, the isolate was predicted to contain a pectinase gene which can
break down pectin, a component of plant cell walls, a bi-functional
xylanase/deacetylase and acetylxylan esterase (Figure 6.3).
Figure 6.1 – Functional categories of CDS from Clostridiales isolate
one after BLASTKOALA annotation
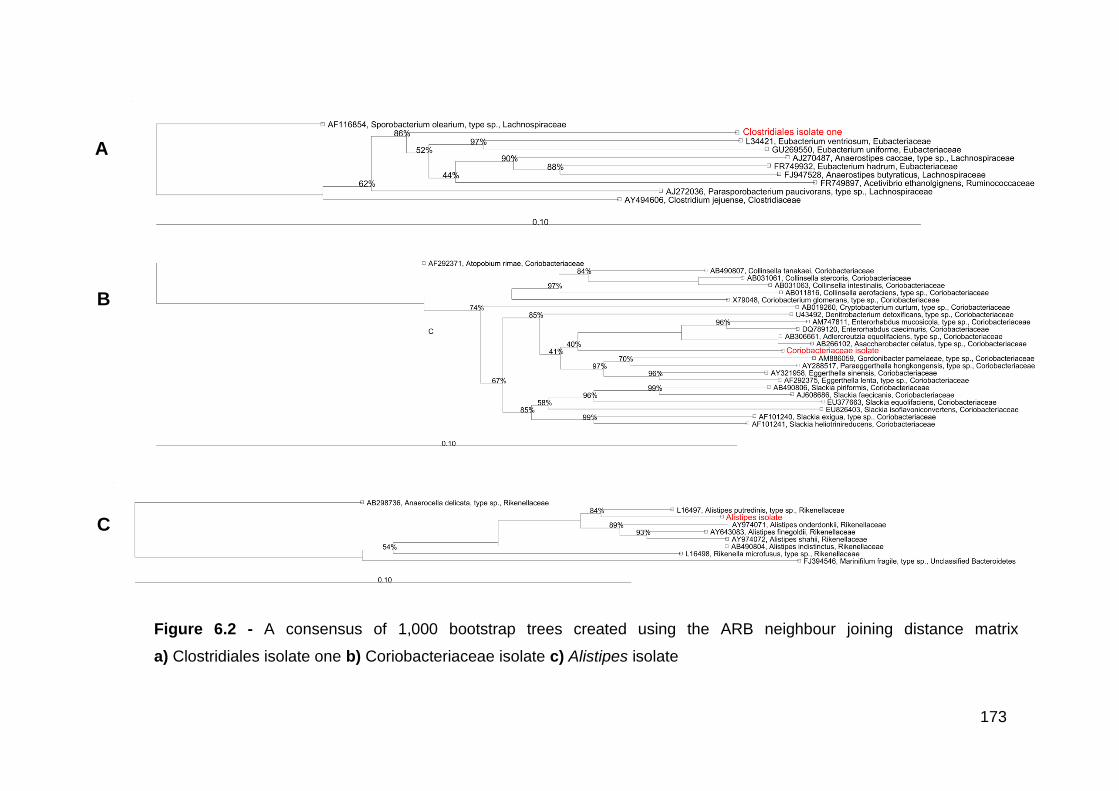
173
A
B
C
Figure 6.2 - A consensus of 1,000 bootstrap trees created using the ARB neighbour joining distance matrix
a) Clostridiales isolate one b) Coriobacteriaceae isolate c) Alistipes isolate
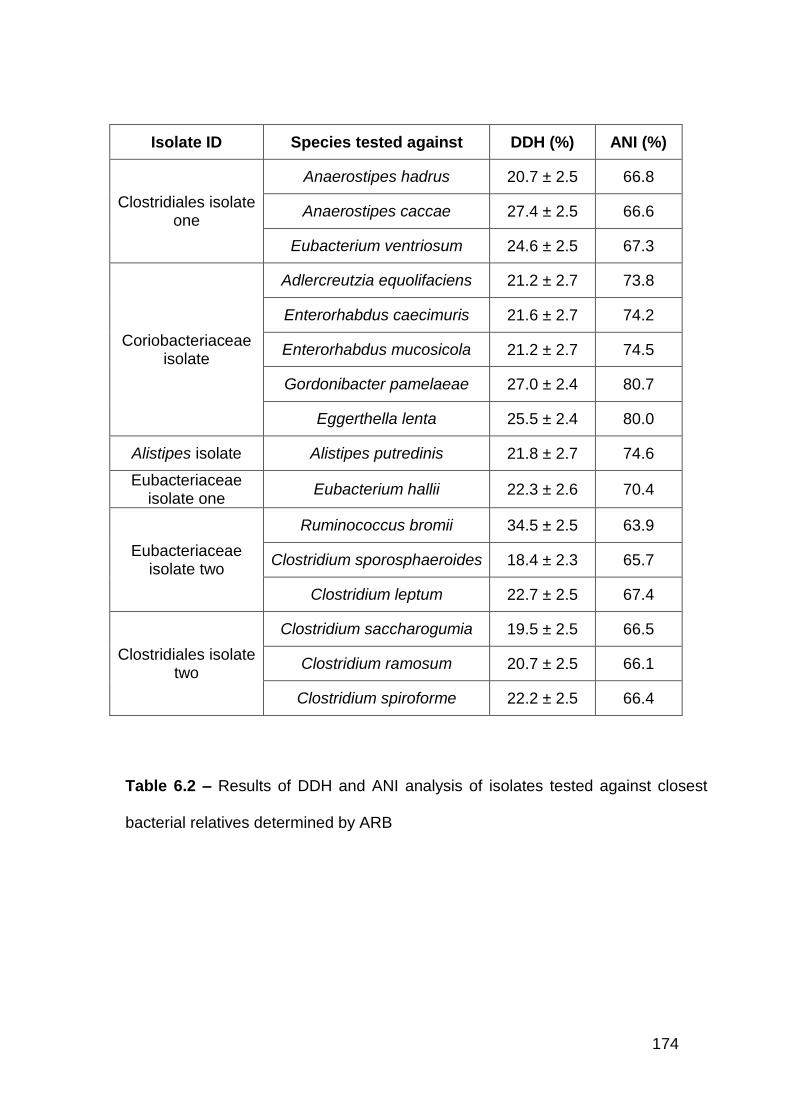
174
Isolate ID Species tested against DDH (%) ANI (%)
Clostridiales isolate one
Anaerostipes hadrus 20.7 ± 2.5 66.8
Anaerostipes caccae 27.4 ± 2.5 66.6
Eubacterium ventriosum 24.6 ± 2.5 67.3
Coriobacteriaceae isolate
Adlercreutzia equolifaciens 21.2 ± 2.7 73.8
Enterorhabdus caecimuris 21.6 ± 2.7 74.2
Enterorhabdus mucosicola 21.2 ± 2.7 74.5
Gordonibacter pamelaeae 27.0 ± 2.4 80.7
Eggerthella lenta 25.5 ± 2.4 80.0
Alistipes isolate Alistipes putredinis 21.8 ± 2.7 74.6
Eubacteriaceae isolate one
Eubacterium hallii 22.3 ± 2.6 70.4
Eubacteriaceae isolate two
Ruminococcus bromii 34.5 ± 2.5 63.9
Clostridium sporosphaeroides 18.4 ± 2.3 65.7
Clostridium leptum 22.7 ± 2.5 67.4
Clostridiales isolate two
Clostridium saccharogumia 19.5 ± 2.5 66.5
Clostridium ramosum 20.7 ± 2.5 66.1
Clostridium spiroforme 22.2 ± 2.5 66.4
Table 6.2 – Results of DDH and ANI analysis of isolates tested against closest
bacterial relatives determined by ARB
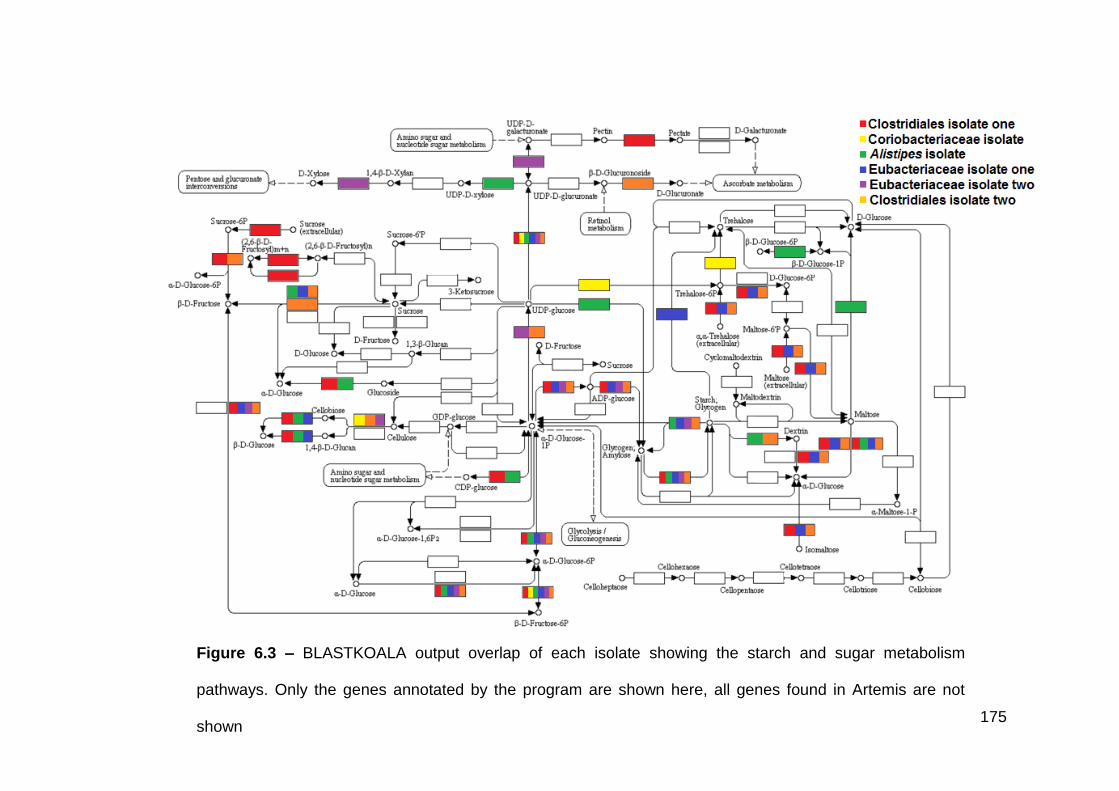
175
Figure 6.3 – BLASTKOALA output overlap of each isolate showing the starch and sugar metabolism
pathways. Only the genes annotated by the program are shown here, all genes found in Artemis are not
shown
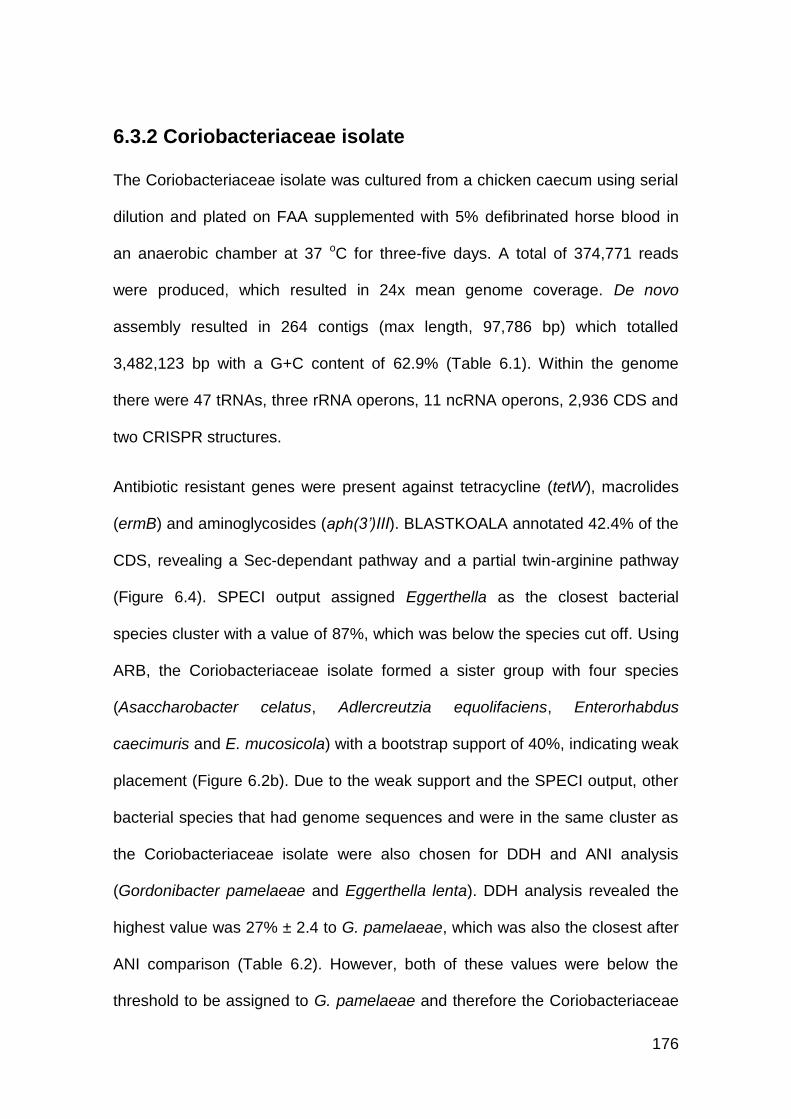
176
6.3.2 Coriobacteriaceae isolate
The Coriobacteriaceae isolate was cultured from a chicken caecum using serial
dilution and plated on FAA supplemented with 5% defibrinated horse blood in
an anaerobic chamber at 37 oC for three-five days. A total of 374,771 reads
were produced, which resulted in 24x mean genome coverage. De novo
assembly resulted in 264 contigs (max length, 97,786 bp) which totalled
3,482,123 bp with a G+C content of 62.9% (Table 6.1). Within the genome
there were 47 tRNAs, three rRNA operons, 11 ncRNA operons, 2,936 CDS and
two CRISPR structures.
Antibiotic resistant genes were present against tetracycline (tetW), macrolides
(ermB) and aminoglycosides (aph(3’)III). BLASTKOALA annotated 42.4% of the
CDS, revealing a Sec-dependant pathway and a partial twin-arginine pathway
(Figure 6.4). SPECI output assigned Eggerthella as the closest bacterial
species cluster with a value of 87%, which was below the species cut off. Using
ARB, the Coriobacteriaceae isolate formed a sister group with four species
(Asaccharobacter celatus, Adlercreutzia equolifaciens, Enterorhabdus
caecimuris and E. mucosicola) with a bootstrap support of 40%, indicating weak
placement (Figure 6.2b). Due to the weak support and the SPECI output, other
bacterial species that had genome sequences and were in the same cluster as
the Coriobacteriaceae isolate were also chosen for DDH and ANI analysis
(Gordonibacter pamelaeae and Eggerthella lenta). DDH analysis revealed the
highest value was 27% ± 2.4 to G. pamelaeae, which was also the closest after
ANI comparison (Table 6.2). However, both of these values were below the
threshold to be assigned to G. pamelaeae and therefore the Coriobacteriaceae
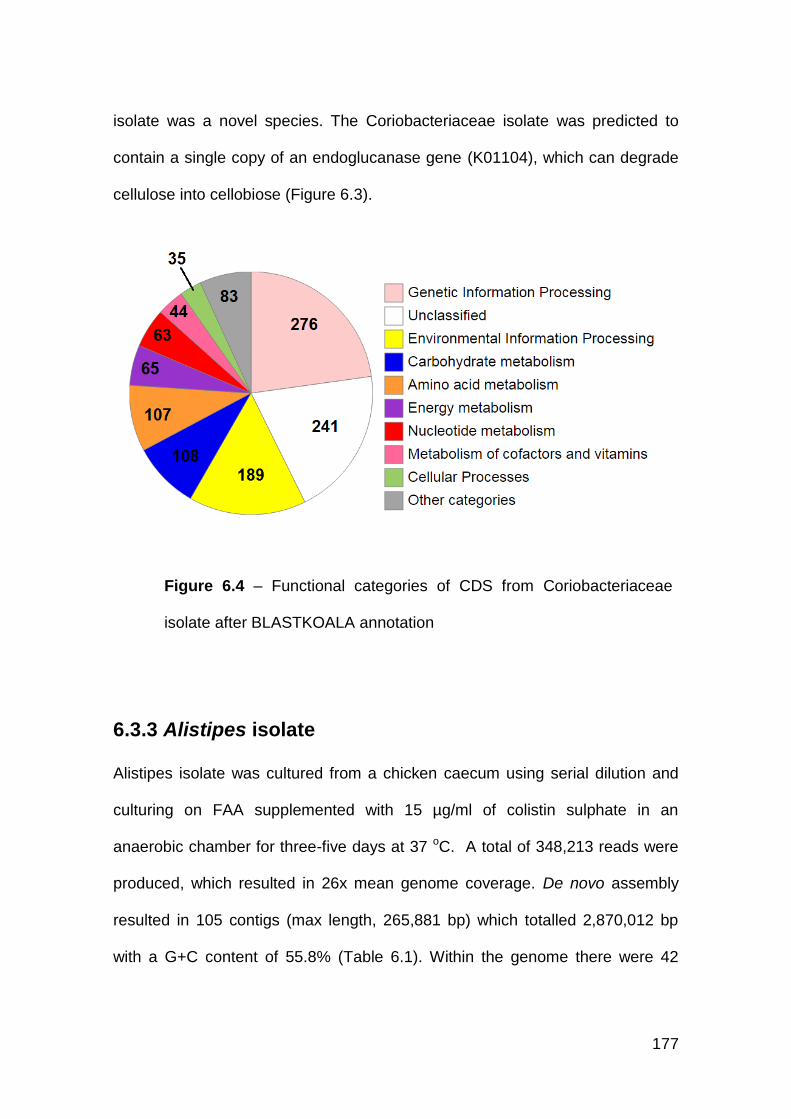
177
isolate was a novel species. The Coriobacteriaceae isolate was predicted to
contain a single copy of an endoglucanase gene (K01104), which can degrade
cellulose into cellobiose (Figure 6.3).
6.3.3 Alistipes isolate
Alistipes isolate was cultured from a chicken caecum using serial dilution and
culturing on FAA supplemented with 15 µg/ml of colistin sulphate in an
anaerobic chamber for three-five days at 37 oC. A total of 348,213 reads were
produced, which resulted in 26x mean genome coverage. De novo assembly
resulted in 105 contigs (max length, 265,881 bp) which totalled 2,870,012 bp
with a G+C content of 55.8% (Table 6.1). Within the genome there were 42
Figure 6.4 – Functional categories of CDS from Coriobacteriaceae
isolate after BLASTKOALA annotation
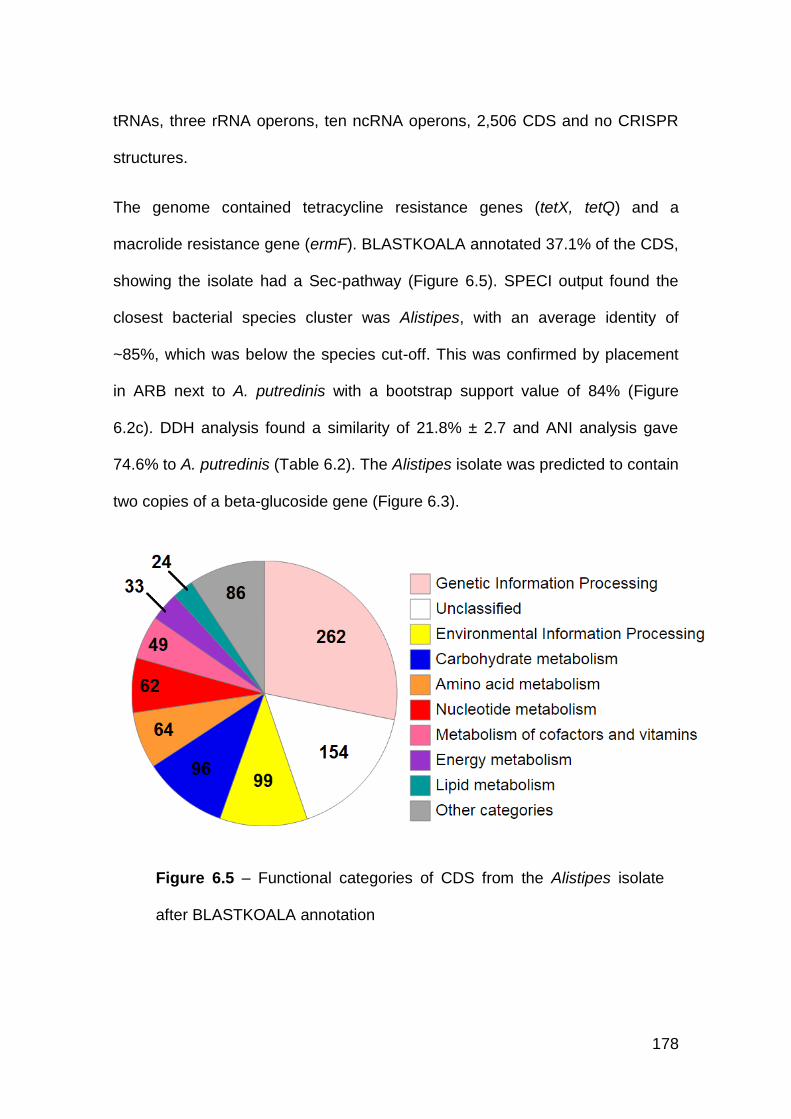
178
tRNAs, three rRNA operons, ten ncRNA operons, 2,506 CDS and no CRISPR
structures.
The genome contained tetracycline resistance genes (tetX, tetQ) and a
macrolide resistance gene (ermF). BLASTKOALA annotated 37.1% of the CDS,
showing the isolate had a Sec-pathway (Figure 6.5). SPECI output found the
closest bacterial species cluster was Alistipes, with an average identity of
~85%, which was below the species cut-off. This was confirmed by placement
in ARB next to A. putredinis with a bootstrap support value of 84% (Figure
6.2c). DDH analysis found a similarity of 21.8% ± 2.7 and ANI analysis gave
74.6% to A. putredinis (Table 6.2). The Alistipes isolate was predicted to contain
two copies of a beta-glucoside gene (Figure 6.3).
Figure 6.5 – Functional categories of CDS from the Alistipes isolate
after BLASTKOALA annotation
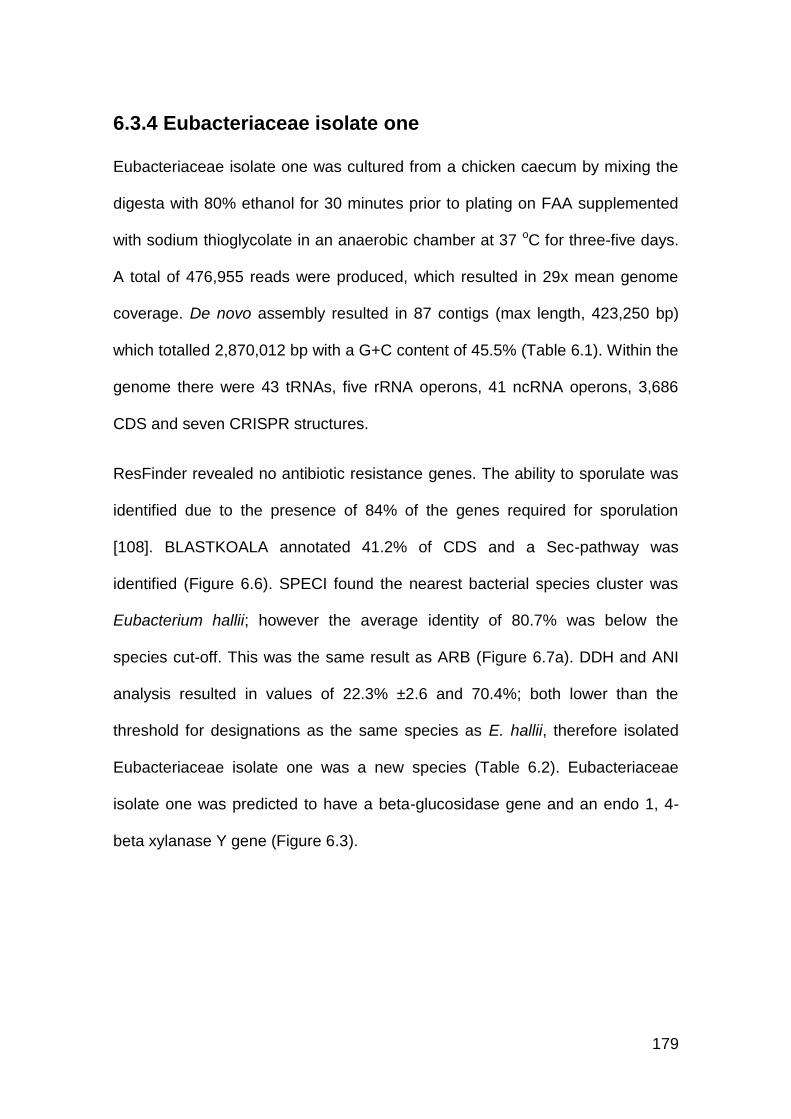
179
6.3.4 Eubacteriaceae isolate one
Eubacteriaceae isolate one was cultured from a chicken caecum by mixing the
digesta with 80% ethanol for 30 minutes prior to plating on FAA supplemented
with sodium thioglycolate in an anaerobic chamber at 37 oC for three-five days.
A total of 476,955 reads were produced, which resulted in 29x mean genome
coverage. De novo assembly resulted in 87 contigs (max length, 423,250 bp)
which totalled 2,870,012 bp with a G+C content of 45.5% (Table 6.1). Within the
genome there were 43 tRNAs, five rRNA operons, 41 ncRNA operons, 3,686
CDS and seven CRISPR structures.
ResFinder revealed no antibiotic resistance genes. The ability to sporulate was
identified due to the presence of 84% of the genes required for sporulation
[108]. BLASTKOALA annotated 41.2% of CDS and a Sec-pathway was
identified (Figure 6.6). SPECI found the nearest bacterial species cluster was
Eubacterium hallii; however the average identity of 80.7% was below the
species cut-off. This was the same result as ARB (Figure 6.7a). DDH and ANI
analysis resulted in values of 22.3% ±2.6 and 70.4%; both lower than the
threshold for designations as the same species as E. hallii, therefore isolated
Eubacteriaceae isolate one was a new species (Table 6.2). Eubacteriaceae
isolate one was predicted to have a beta-glucosidase gene and an endo 1, 4-
beta xylanase Y gene (Figure 6.3).
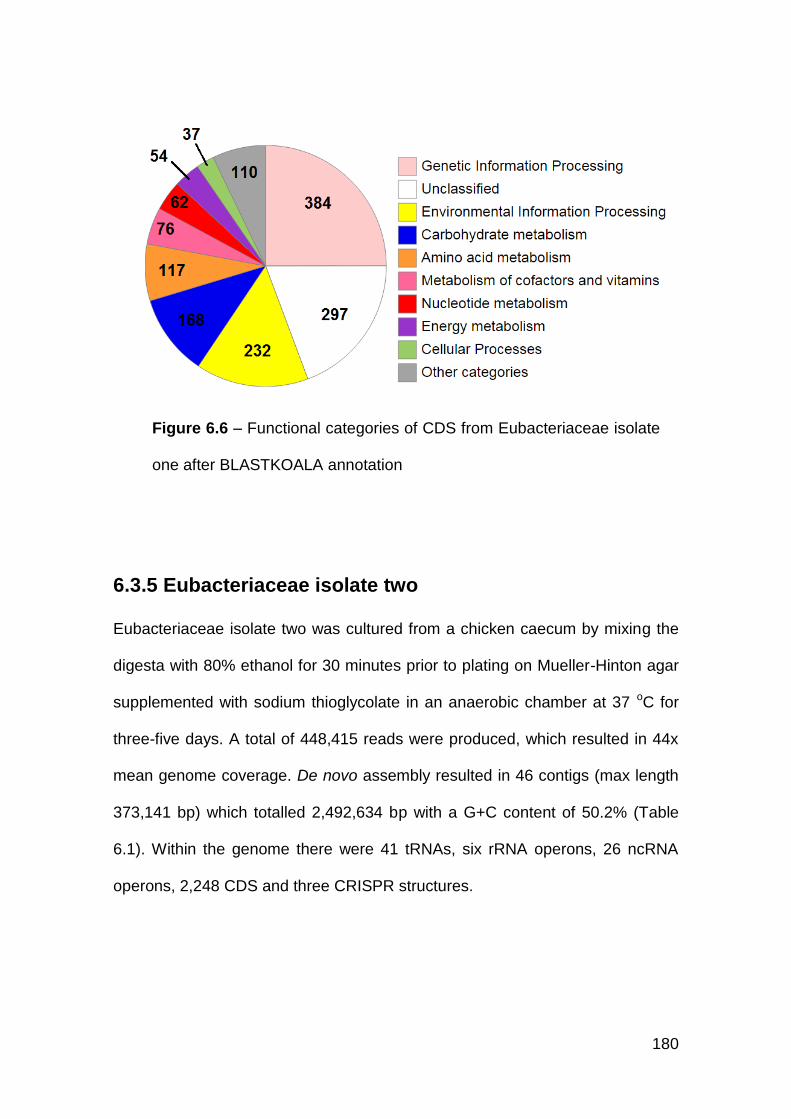
180
6.3.5 Eubacteriaceae isolate two
Eubacteriaceae isolate two was cultured from a chicken caecum by mixing the
digesta with 80% ethanol for 30 minutes prior to plating on Mueller-Hinton agar
supplemented with sodium thioglycolate in an anaerobic chamber at 37 oC for
three-five days. A total of 448,415 reads were produced, which resulted in 44x
mean genome coverage. De novo assembly resulted in 46 contigs (max length
373,141 bp) which totalled 2,492,634 bp with a G+C content of 50.2% (Table
6.1). Within the genome there were 41 tRNAs, six rRNA operons, 26 ncRNA
operons, 2,248 CDS and three CRISPR structures.
Figure 6.6 – Functional categories of CDS from Eubacteriaceae isolate
one after BLASTKOALA annotation
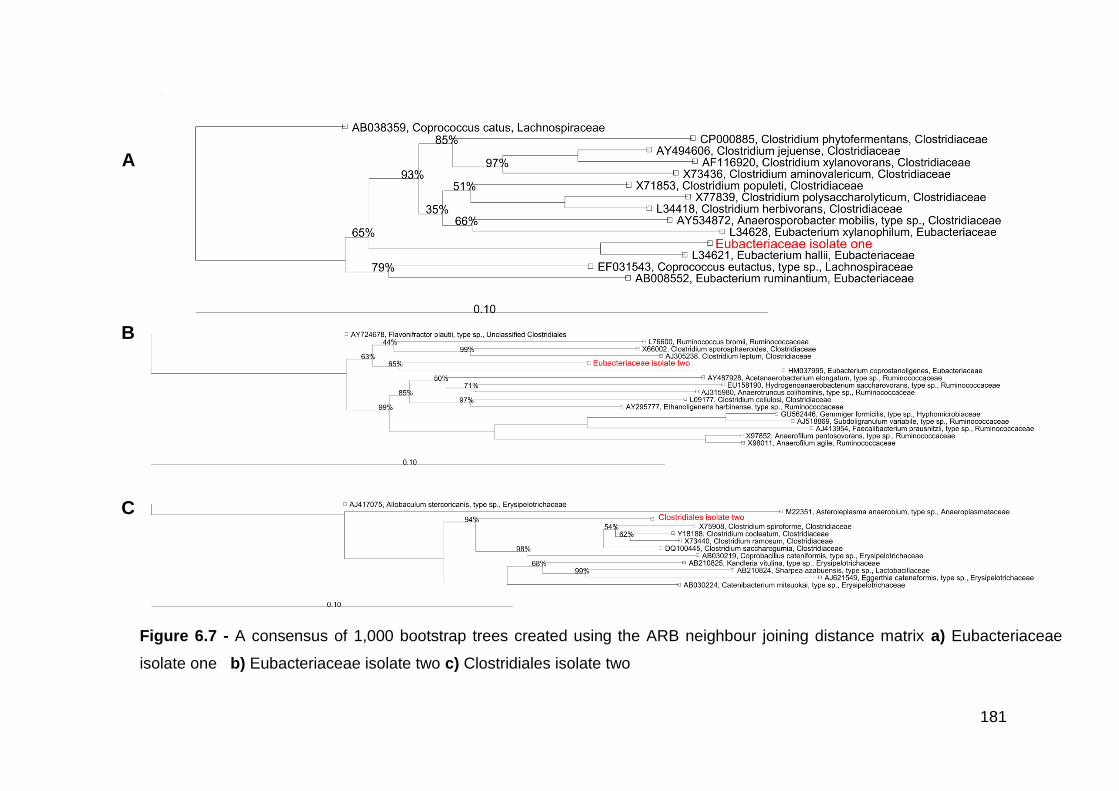
181
A
B
C
Figure 6.7 - A consensus of 1,000 bootstrap trees created using the ARB neighbour joining distance matrix a) Eubacteriaceae
isolate one b) Eubacteriaceae isolate two c) Clostridiales isolate two
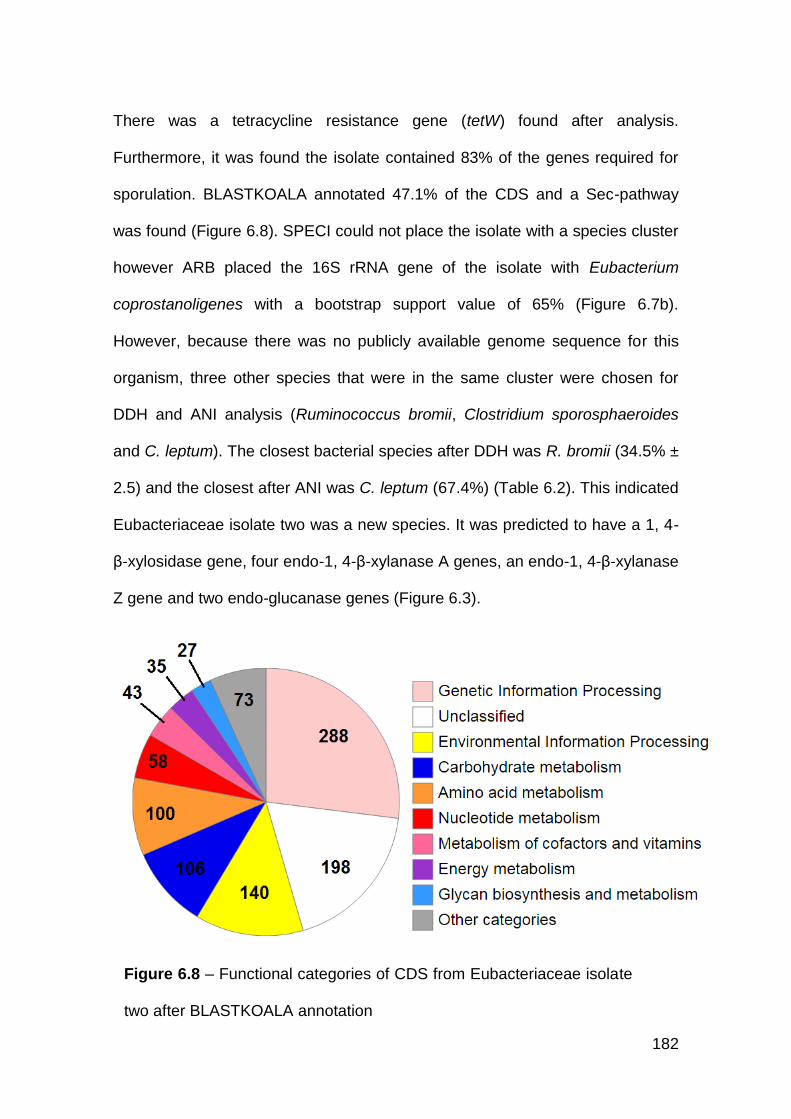
182
There was a tetracycline resistance gene (tetW) found after analysis.
Furthermore, it was found the isolate contained 83% of the genes required for
sporulation. BLASTKOALA annotated 47.1% of the CDS and a Sec-pathway
was found (Figure 6.8). SPECI could not place the isolate with a species cluster
however ARB placed the 16S rRNA gene of the isolate with Eubacterium
coprostanoligenes with a bootstrap support value of 65% (Figure 6.7b).
However, because there was no publicly available genome sequence for this
organism, three other species that were in the same cluster were chosen for
DDH and ANI analysis (Ruminococcus bromii, Clostridium sporosphaeroides
and C. leptum). The closest bacterial species after DDH was R. bromii (34.5% ±
2.5) and the closest after ANI was C. leptum (67.4%) (Table 6.2). This indicated
Eubacteriaceae isolate two was a new species. It was predicted to have a 1, 4-
β-xylosidase gene, four endo-1, 4-β-xylanase A genes, an endo-1, 4-β-xylanase
Z gene and two endo-glucanase genes (Figure 6.3).
Figure 6.8 – Functional categories of CDS from Eubacteriaceae isolate
two after BLASTKOALA annotation
183
6.3.6 Clostridiales isolate two
Clostridiales isolate two was cultured from a chicken caecum using serial
dilution and FAA supplemented with 15 µg/ml rifampicin in an anaerobic
chamber for three-five days at 37 oC. A total of 348,213 reads were produced,
which resulted in 26x mean genome coverage. De novo assembly resulted in
165 contigs (max length, 241,690 bp) which totalled 3,341,113 bp with a G+C
content of 43.1% (Table 6.1). Within the genome there were 54 tRNAs, ten
rRNA operons, 46 ncRNA operons, 3,295 CDS and one CRISPR structure.
There was a lincosamide resistance gene (lnuC) and tetracycline resistance
gene (tetW) present in the genome. Analysis of the sporulation genes identified
77% of the required genes which was below the threshold of 80%.
BLASTKOALA annotated 39.9% of CDS and a Sec-pathway was identified
(Figure 6.9). SPECI output found Coprobacillus was the nearest bacterial
species cluster with an average identity of ~71% which was below the species
cut-off. ARB placed the 16S rRNA gene as an outgroup of five species
(Clostridium spiroforme, C. cocleatum, C. ramosum, C. saccharogumia and
Coprobacillus cateniformis) with a bootstrap support value of 94% (Figure 6.7c).
However, there are no published genome sequences of C. cocleatum or
C. cateniformis so DDH and ANI could not be completed with them. Of the
remaining species, C. spiroforme (22.2% ±2.5) was the closest after DDH
analysis and C. saccharogumia (66.5%) was the closest after ANI analysis
(Table 6.2). The genome of Clostridiales isolate two was predicted to contain
four endo-1, 4-β-xylanase Z genes, an endo-1, 4-β-xylanase Y gene, an
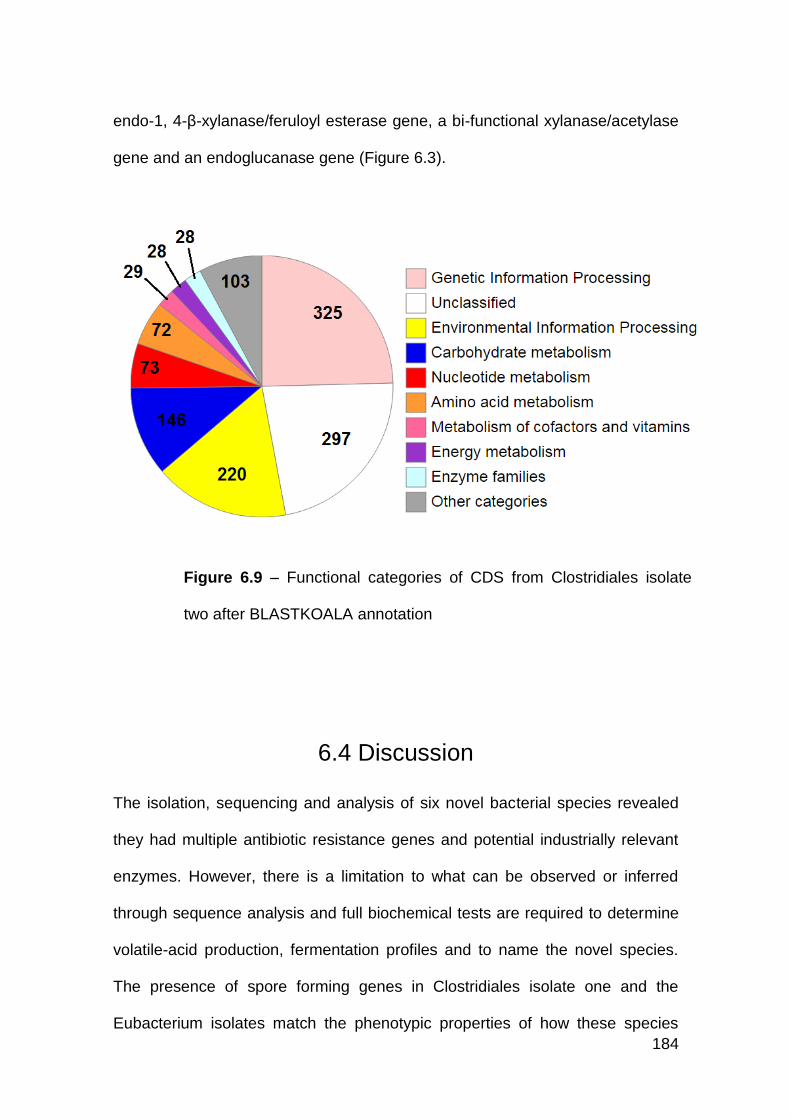
184
endo-1, 4-β-xylanase/feruloyl esterase gene, a bi-functional xylanase/acetylase
gene and an endoglucanase gene (Figure 6.3).
6.4 Discussion
The isolation, sequencing and analysis of six novel bacterial species revealed
they had multiple antibiotic resistance genes and potential industrially relevant
enzymes. However, there is a limitation to what can be observed or inferred
through sequence analysis and full biochemical tests are required to determine
volatile-acid production, fermentation profiles and to name the novel species.
The presence of spore forming genes in Clostridiales isolate one and the
Eubacterium isolates match the phenotypic properties of how these species
Figure 6.9 – Functional categories of CDS from Clostridiales isolate
two after BLASTKOALA annotation
185
were isolated through selection and germination of spores. The isolation of
novel species from the chicken gut can help future taxonomic assignments, not
only because they can provide a reference, but also other species that are more
taxonomically similar to them than currently available sequences.
Genes that confer tetracycline resistance were the most common antibiotic
resistance from sequence analysis of the isolates which is the same result as in
previous caecal microbiome studies [2, 29]. Qu et al. (2008) noted the
abundance of horizontal gene transfer elements and virulence factors in the
chicken caecum microbiome, therefore transfer events involving genes that
confer resistance is likely [29]. However, the antibiotic resistance genes in some
isolates were naturally occurring, for example resistance in the Alistipes isolate
could be because it is closely related to the Bacteroides genus and the majority
of species within the genus contain these resistance genes [262-264].
Eubacteriaceae isolate one could show potential as a probiotic to the chicken. It
was found to be related to E. hallii, a lactate utilising and significant butyrate
producing species [265]. Similarly A. caccae (related to Clostridiales isolate
one) shared the same property [266]. Lactate is the major product of lactic acid
bacteria such as lactobacilli, which are the most abundant organisms in the
chicken gut [105, 266]. In humans, it has been shown that ulcerative colitis
sufferers have increased concentrations of lactate [266]. Lactobacillus species
have been studied as probiotics due to their ability to reduce pathogen load.
However, the effect of excess lactate to chicken health has not been
investigated [237, 238, 267-269]. It has been noted that increased lactate levels
result in the stimulation of butyrate producing bacteria, therefore if isolates
186
Eubacteriaceae isolate one and Clostridiales isolate one were given as a
probiotic at the same time as lactobacilli it could result in increased digestive
health and weight gain [136, 270].
Industrially relevant enzymes such as xylanases were identified in the novel
isolates. These are important to chicken gut health though reduced intestinal
viscosity resulting in improved weight gain [99, 109, 174, 271]. Microbial
xylanases also have potential for the biodegradation of biomass into fuels and
the bleaching of pulp and paper [272]. Due to this multi-purpose potential,
xylanases from microorganisms are often studied for activity and potential [272-
276]. The discovery of two bi-functional xylanase could provide the greatest
hope of a future feed additive. As the enzyme is bi-functional it does not require
the presence of an additional enzyme to degrade xylan from grains [277]. These
enzymes should be of particular interest and their activity should be tested in
the future.
In addition to finding xylan-degrading enzymes, pectinase and cellulase genes
were also discovered. The addition of cellulase to a broiler diet results in
reduced feed consumption and an increase in FCR. It has also be found that
calcium, phosphorus, iron, zinc and copper that were associated with cell walls
are solubilised by cellulase [278]. Pectinase has also demonstrated a greater
growth rate in chicks and egg production, both on its own and when mixed with
cellulase and hemicellulose in a rye-based diet due to rye containing 8% pectin
[279-281].
As the species in this study were isolated and sequenced, the enzymes
identified can be observed in their natural host or primers can be designed to
187
amplify the genes into an expression host. If high enzyme activity was detected
in the host, then other benefits the organism might confer to the host, such as
the production of volatile-fatty acids or bacteriocins, could result in potential
probiotic uses rather than cloning gene into other organisms for over-
expression.

188
CHAPTER SEVEN
7. Discussion
189
This study used culture-dependent and culture-independent methods to
establish the chicken gut microbiota. Chapter Three illustrates the problems of
using the V3-V4 16S rRNA gene-fragment region to study the majority of organs
in the chicken, due to chloroplast amplification. This issue has not been
discussed in the literature before, despite previous studies using 16S rRNA
gene sequencing to study organs other than the caecum [115, 119]. Chapter
Four presents 16S rRNA gene-fragment data of the crop, proventriculus,
gizzard, duodenum, ileum and caecum of six chickens fed different diets,
something that has not been completed previously. This is the largest survey of
the chicken gut using 16S rRNA gene sequencing to date.
The increase in the depth of sequencing in Chapter Four allowed for a more
accurate bacterial census of the chicken gut. The minimum number of reads per
sample was enough to saturate the number of OTUs present in each sample,
something that was not achieved in Chapter Three. Furthermore, the increase
in depth also revealed a significant difference in diversity in the caecum
between the diets which was not found in the V3-V4 16S rRNA gene-fragment
sequencing and might not have been found without the extra depth. This
illustrates that significant differences could be missed in studies that do not
sample to a great enough depth.
Chapter Five presents culturing data from the chicken gut and the discovery of
multiple new species. This included the isolation of bacteria from the
proventriculus, something that has not been previously published. The majority
of novel species were isolated from the caecum, which matches the hypothesis-
drawn from culture-dependent and culture-independent studies that the caecum
190
is populated with a multitude of uncultured species [38, 90-93, 120, 124]. Whilst
the abundance of the isolated species in the chicken gut was high for the
majority of organs, this was primarily due to the culturing of two Lactobacillus
species. Even though 37 of the 43 species were isolated from the caecum, they
conferred only a small proportion of the relative abundance in this organ. Many
of the most abundant organisms found in Chapter Four were not isolated from
the caecum, therefore the appropriate isolation techniques were not utilised, the
respective colonies were not picked or the 16S rRNA gene was not successfully
amplified using the PCR primers.
Chapter Six presents whole genome analysis of six novel bacterial species. The
isolation of novel species with industrially relevant enzymes, illustrates the
potential of the chicken gut as an untapped resource for the discovery of a
multitude of enzymes with varied use. The microbiota of the caecum are
involved in fermentation of NSPs, therefore are already equipped to digest
multiple targets. Setting up a gut model could help isolate more species and test
hypotheses of co-culture, competition between species and probiotics in the
chicken gut.
The 16S rRNA gene-fragment sequencing in Chapter Four has saturated the
discovery of OTUs in the samples. As a large amount of data was produced, the
use of a copy number normalisation was utilised without compromising the
depth. This is something that has not been applied to chicken 16S rRNA gene-
fragment data previously and should provide a more accurate account of the
microbial community in the chicken. The development of next-generation long-
read technologies such as Oxford Nanopore MinION will benefit future 16S
191
rRNA gene sequence studies. The capability of obtaining almost full length 16S
rRNA gene sequences increases the taxonomic resolution and this has been
demonstrated on a small scale [282]. If this can be developed for more complex
samples it could be a useful tool in a bacterial census.
This is the deepest 16S rRNA gene-fragment study of the chicken gut to date.
Whilst the aim of this study was to identify the microbiota of the chicken gut and
discover difference between diets, similar approaches could be used to identify
high and low FCR associated OTUs as completed by some previous low-
powered studies. This would require a different experimental set-up where the
amount of feed available to the chickens would be monitored.
The sequencing results generated in this study largely agree with those found in
literature. The chicken gut was dominated by Firmicutes and the lactobacilli
were the most abundant in the majority of organs. A difference to the results
from other studies was the low abundance of Bacteroidetes, with Proteobacteria
the second most abundant phylum instead [24, 119]. The caecum was the most
diverse organ with Lachnospiraceae and Ruminococcaceae families the most
abundant which is in agreement of other studies [24, 29, 115, 119, 120].
However, from previous studies on the chicken gut microbiota, the results have
been varied, especially in the caeca. This could be due to genotypic and
geographical differences between flocks of chickens, in addition to feed and
antibiotic use. Therefore the results generated from the authors’ study may not
be universal and may only apply to this specific set of chickens. To test this
hypothesis, the caecal samples of multiple chickens, fed different diets and in
192
different locations could be analysed through high-throughput sequencing and
culture-based methods to try and establish a core microbiome of the chicken.
Phytase has been shown to increase the abundance of lactobacilli in the ileum
and this was also discovered in this study, however there was not a significant
difference in diversity between the diets [112]. The effect of phytase
supplements on the microbiota of other organs has not previously been studied,
but it was found there was no significant difference in diversity in any organ but
the caecum. One hypothesis for this difference could be the lactate produced by
the more abundant lactobacillus in the ileum selecting for organisms that can
utilise the lactate and produce other volatile fatty acids such as butyrate
downstream in the caecum [136].
The study of the gut microbiota is a continuing challenge for microbiologists and
has been since the 1800’s [36]. Early culturing efforts were limited by specific
media and limited anaerobic methods, restricting early pioneers to the discovery
of a minute quantity of organisms and failing to capture the true diversity of
these complex communities. Whilst more recent culturing approaches to the gut
microbiota have led to the discovery of a wide array of new species, it is still a
developing technique.
The application of 16S rRNA gene sequencing, initially through clone
sequencing and later high-throughput methods, revealed a more complex and
diverse environment than previously thought. The advent of high-throughput
DNA methods has resulted in the generation of gigabases of data and an
almost complete bacterial census of the gut. However, there are still downsides
to using high-throughput sequencing. Bias is introduced at many stages of the
193
sequencing process; DNA extraction, PCR amplification and data analysis.
Furthermore, the use of OTUs in 16S rRNA gene-fragment sequencing at ≥97%
limits means that some species will be not be discovered through clustering.
Different species that have 16S rRNA gene identities above this threshold risk
being clustered together; therefore the true diversity of an environment may be
higher than estimated.
This study has further shown that a culture-dependent and culture-independent
approach to gut microbiota is prudent. The identification of many organisms
through culturing helped to support the 16S rRNA gene-fragment sequencing
data and their potential roles in the microbiota that would not be possible
through 16S gene-fragment sequencing alone. Also the discovery of organisms
that were present but not detected through sequencing raises the question of
unknown unknowns. Without the culturing data to back up the sequencing data,
these organisms would have been missed. The abundance of these organisms
in the gut has not been calculated and further analysis would be required to
determine if it was the DNA extraction technique, PCR amplification or low
abundance behind they were not detected. The cultured isolate sequences that
were too short for comparison with the data generated in Chapter Four should
have their entire 16S rRNA gene sequenced.
Whilst a metagenomic study of the chicken gut would have reduced PCR bias
and could have led to the greater taxonomic identification and perhaps
generated whole or partial genome sequences of some of the more abundant
organisms, this would have been a more expensive approach. The use of 16S
rRNA gene-fragment sequencing allows the multiplexing of multiple samples
194
whilst still generating enough depth to provide answers. The abundance of
chloroplast reads in the majority of chicken gut organs generated in this study
shows that non-targeted sequencing will lead to generation of data that might
not be of use. This is why microbiome studies have only focussed on the
caecum where bacterial density is highest and presence of DNA from the
digesta is lowest [2, 29, 68]. Thus, 16S rRNA gene sequencing is still a very
useful tool and especially when targeting just the bacteria in biological samples.
A different approach to culturing novel species in the chicken gut could be
achieved through the study of metagenomic data. If metagenomic sequencing
provided enough data to generate whole or partial genome sequences of novel
species, the identification of antibiotic resistances and metabolic pathways
could help to design a selective medium to aid the isolation of that organism.
Whilst this would apply to only the most abundant species in a sample, this
would still be beneficial for samples with a large proportion of novel species
such as the chicken caeca.
For a full census of the chicken gut microbiome, a three-pronged approach of
16S rRNA gene sequencing, metagenomic sequencing and intense culturing
would need to be completed on multiple chickens. The identification of novel
species should lead to full biochemical test and whole-genome sequencing to
try and identify their roles within the microbiome.

195
8. References
196
1. UNFAO. Stocks of live animals. 2013 07/15]; Available from: http://faostat.fao.org/site/573/DesktopDefault.aspx?PageID=573#ancor.
2. Sergeant, M.J., et al., Extensive microbial and functional diversity within the chicken cecal microbiome. PLoS ONE, 2014. 9(3).
3. Muir, W.M., et al., Genome-wide assessment of worldwide chicken SNP genetic diversity indicates significant absence of rare alleles in commercial breeds. Proceedings of the National Academy of Sciences, 2008. 105(45): p. 17312-17317.
4. Hughes, L., P. Hermans, and K. Morgan, Risk factors for the use of prescription antibiotics on UK broiler farms. Journal of Antimicrobial Chemotherapy, 2008. 61(4): p. 947-952.
5. Bjerrum, L., et al., Microbial community composition of the ileum and cecum of broiler chickens as revealed by molecular and culture-based techniques. Poultry Science, 2006. 85(7): p. 1151-1164.
6. Havenstein, G., P. Ferket, and M. Qureshi, Growth, livability, and feed conversion of 1957 versus 2001 broilers when fed representative 1957 and 2001 broiler diets. Poultry Science, 2003. 82(10): p. 1500-1508.
7. OxfordEconomics-ComissionedbytheBritishPoultryCouncil. Economic Impact Assessment: the British Poultry Industry. 2013 07/15; 1-27]. Available from: http://www.britishpoultry.org.uk/wp-content/uploads/2014/03/Economic-Impact-Assessment-2013.pdf.
8. DEFRA. United Kingdom Poultry and Poultry Meat Statistics - June 2015. 2015 07/15]; Available from: https://www.gov.uk/government/uploads/system/uploads/attachment_data/file/447668/poultry-statsnotice-23jul15.pdf.
9. Zoetendal, E.G., et al., Molecular microbial ecology of the gastrointestinal tract: from phylogeny to function. Current issues in intestinal microbiology, 2004. 5(2): p. 31-47.
10. Mead, G.C., Bacteria in the Gastrointestinal Tract of Birds. Gastrointestinal Microbiology. 1997, New York: Champman & Hall.
11. Smith, D. and M. Berrang, Prevalence and numbers of bacteria in broiler crop and gizzard contents. Poultry Science, 2006. 85(1): p. 144-147.
12. Fuller, R. and B.E. Brooker, Lactobacilli which attach to the crop epithelium of the fowl. The American Journal of Clinical Nutrition, 1974. 27(11): p. 1305-1312.
197
13. PolutryCRC. The Digestive System. 2015 [cited 2015 08]; Available from: http://www.poultryhub.org/physiology/body-systems/digestive-system/.
14. McLelland, J., Anatomy of the avian cecum. Journal of Experimental Zoology, 1989. 252(S3): p. 2-9.
15. McNab, J.M., The Avian Caeca: A Review. World's Poultry Science Journal, 1973. 29(03): p. 251-263.
16. Chaplin, S.B., Effect of cecectomy on water and nutrient absorption of birds. Journal of Experimental Zoology, 1989. 252(S3): p. 81-86.
17. Thomas, D.H. and E. Skadhauge, Water and electrolyte transport by the avian ceca. Journal of Experimental Zoology, 1989. 252(S3): p. 95-102.
18. Annison, E.F., K.J. Hill, and R. Kenworthy, Volatile fatty acids in the digestive tract of the fowl. British Journal of Nutrition, 1968. 22(02): p. 207-216.
19. Barnes, E.M. and C.S. Impey, The Occurence and Properties of Uric Acid Decomposing Anaerobic Bacteria in the Avian Caecum. Journal of Applied Microbiology, 1974. 37(3): p. 393-409.
20. Karasawa, Y., Significant role of the nitrogen recycling system through the ceca occurs in protein-depleted chickens. Journal of Experimental Zoology, 1999. 283(4-5): p. 418-425.
21. Svihus, B., M. Choct, and H.L. Classen, Function and nutritional roles of the avian caeca: a review. World's Poultry Science Journal, 2013. 69(02): p. 249-264.
22. Son, J.H., D. Ragland, and O. Adeola, Quantification of digesta flow into the caeca. British Poultry Science, 2002. 43(2): p. 322-324.
23. Marchesi, J.R. and J. Ravel, The vocabulary of microbiome research: a proposal. Microbiome, 2015. 3: p. 31.
24. Wei, S., M. Morrison, and Z. Yu, Bacterial census of poultry intestinal microbiome. Poultry Science, 2013. 92(3): p. 671-683.
25. Lagier, J.C., et al., Microbial culturomics: paradigm shift in the human gut microbiome study. Clinical Microbiology and Infection, 2012. 18(12): p. 1185-1193.
198
26. Handelsman, J., et al., Molecular biological access to the chemistry of unknown soil microbes: a new frontier for natural products. Chemistry & Biology. 5(10): p. R245-R249.
27. Lederberg, J. and A. Mccray, The Scientist:\'Ome Sweet\'Omics--A Genealogical Treasury of Words. The Scientist, 2001. 17(7).
28. Whiteside, S.A., et al., The microbiome of the urinary tract[mdash]a role beyond infection. Nat Rev Urol, 2015. 12(2): p. 81-90.
29. Qu, A., et al., Comparative Metagenomics Reveals Host Specific Metavirulomes and Horizontal Gene Transfer Elements in the Chicken Cecum Microbiome. PLoS ONE, 2008. 3(8): p. e2945.
30. Warnecke, F., et al., Metagenomic and functional analysis of hindgut microbiota of a wood-feeding higher termite. Nature, 2007. 450(7169): p. 560-565.
31. Brulc, J.M., et al., Gene-centric metagenomics of the fiber-adherent bovine rumen microbiome reveals forage specific glycoside hydrolases. Proceedings of the National Academy of Sciences, 2009. 106(6): p. 1948-1953.
32. Pope, P.B., et al., Adaptation to herbivory by the Tammar wallaby includes bacterial and glycoside hydrolase profiles different from other herbivores. Proceedings of the National Academy of Sciences, 2010. 107(33): p. 14793-14798.
33. Qin, J., et al., A human gut microbial gene catalogue established by metagenomic sequencing. Nature, 2010. 464(7285): p. 59-65.
34. Zhu, L., et al., Evidence of cellulose metabolism by the giant panda gut microbiome. Proceedings of the National Academy of Sciences, 2011.
35. Isaacson, R. and H.B. Kim, The intestinal microbiome of the pig. Animal Health Research Reviews, 2012. 13(01): p. 100-109.
36. Kern, H., Beitrag zur Kenntnis der im Darme und Magen der Vögel vorkommenden Bacterien. 1897, Karlsruhe: Badische Verlagsdruckerei. 1 p. ℓ., 154 p. (Cited from Gage, G.E., no. 153. 1911, College Park: Maryland Agricultural Experiment Station. p. [201]-226.
37. Johansson, K.R., W.B. Sarles, and S.K. Shapiro, The Intestinal Microflora of Hens as Influenced by Various Carbohydrates in a Biotin-deficient Ration. Journal of Bacteriology, 1948. 56(5): p. 619-634.
199
38. Apajalahti, J., A. Kettunen, and H. Graham, Characteristics of the gastrointestinal microbial communities, with special reference to the chicken. World's Poultry Science Journal, 2004. 60(02): p. 223-232.
39. Lagier, J.-C., et al., Current and Past Strategies for Bacterial Culture in Clinical Microbiology. Clinical Microbiology Reviews, 2015. 28(1): p. 208-236.
40. Gage, G.E., A study showing bacteria and animal organisms determined in the feces and intestinal mucosa of healthy chickens. Bulletin / Maryland Agricultural Experiment Station ;no. 153. 1911, College Park: Maryland Agricultural Experiment Station. p. [201]-226.
41. Stewart, E.J., Growing Unculturable Bacteria. Journal of Bacteriology, 2012. 194(16): p. 4151-4160.
42. Staley, J.T. and A. Konopka, Measurement of in situ activities of nonphotosynthetic microorganisms in aquatic and terrestrial habitats. Annual Reviews in Microbiology, 1985. 39(1): p. 321-346.
43. Roszak, D.B. and R.R. Colwell, Survival strategies of bacteria in the natural environment. Microbiological Reviews, 1987. 51(3): p. 365-379.
44. Oakley, B.B., et al., The chicken gastrointestinal microbiome. FEMS microbiology letters, 2014. 360(2): p. 100-112.
45. Gaskins, H.R., C.T. Collier, and D.B. Anderson, Antibiotics as a growth promotant:Modes of action. Animal Biotechnology, 2002. 13(1): p. 29-42.
46. Eckburg, P.B., et al., Diversity of the Human Intestinal Microbial Flora. Science, 2005. 308(5728): p. 1635-1638.
47. Sanger, F., S. Nicklen, and A.R. Coulson, DNA sequencing with chain-terminating inhibitors. Proceedings of the National Academy of Sciences, 1977. 74(12): p. 5463-5467.
48. Fox, G.E., et al., Classification of methanogenic bacteria by 16S ribosomal RNA characterization. Proceedings of the National Academy of Sciences of the United States of America, 1977. 74(10): p. 4537-4541.
49. Balch, W., et al., An ancient divergence among the bacteria. Journal of Molecular Evolution, 1977. 9(4): p. 305-311.
50. Woese, C.R. and G.E. Fox, Phylogenetic structure of the prokaryotic domain: the primary kingdoms. Proceedings of the National Academy of Sciences of the United States of America, 1977. 74(11): p. 5088-5090.
200
51. Mullis, K.B., et al., One of the first Polymerase Chain Reaction (PCR) patents. 1987, Google Patents.
52. Kango, N., Textbook of Microbiology. 2010: IK International Pvt Ltd.
53. Wang, Y. and P.-Y. Qian, Conservative Fragments in Bacterial 16S rRNA Genes and Primer Design for 16S Ribosomal DNA Amplicons in Metagenomic Studies. PLoS ONE, 2009. 4(10): p. e7401.
54. Větrovský, T. and P. Baldrian, The Variability of the 16S rRNA Gene in Bacterial Genomes and Its Consequences for Bacterial Community Analyses. PLoS ONE, 2013. 8(2): p. e57923.
55. Vos, M., et al., A Comparison of rpoB and 16S rRNA as Markers in Pyrosequencing Studies of Bacterial Diversity. PLoS ONE, 2012. 7(2): p. e30600.
56. Acinas, S.G., et al., Divergence and Redundancy of 16S rRNA Sequences in Genomes with Multiple rrn Operons. Journal of Bacteriology, 2004. 186(9): p. 2629-2635.
57. Pace, N.R., Mapping the Tree of Life: Progress and Prospects. Microbiology and Molecular Biology Reviews : MMBR, 2009. 73(4): p. 565-576.
58. Langille, M.G.I., et al., Predictive functional profiling of microbial communities using 16S rRNA marker gene sequences. Nat Biotech, 2013. 31(9): p. 814-821.
59. Yuan, S., et al., Evaluation of Methods for the Extraction and Purification of DNA from the Human Microbiome. PLoS ONE, 2012. 7(3): p. e33865.
60. Sergeant, M.J., et al., High-Throughput Sequencing of 16S rRNA Gene Amplicons: Effects of Extraction Procedure, Primer Length and Annealing Temperature. PLoS ONE, 2012. 7(5): p. e38094.
61. Salonen, A., et al., Comparative analysis of fecal DNA extraction methods with phylogenetic microarray: Effective recovery of bacterial and archaeal DNA using mechanical cell lysis. Journal of Microbiological Methods, 2010. 81(2): p. 127-134.
62. Kunin, V., et al., Wrinkles in the rare biosphere: pyrosequencing errors can lead to artificial inflation of diversity estimates. Environmental Microbiology, 2010. 12(1): p. 118-123.
201
63. Wu, J.-Y., et al., Effects of polymerase, template dilution and cycle number on PCR based 16 S rRNA diversity analysis using the deep sequencing method. Bmc Microbiology, 2010. 10(1): p. 255.
64. Kembel, S.W., et al., Incorporating 16S Gene Copy Number Information Improves Estimates of Microbial Diversity and Abundance. PLoS Comput Biol, 2012. 8(10): p. e1002743.
65. Case, R.J., et al., Use of 16S rRNA and rpoB Genes as Molecular Markers for Microbial Ecology Studies. Applied and Environmental Microbiology, 2007. 73(1): p. 278-288.
66. Giesendorf, B.A., et al., Rapid and sensitive detection of Campylobacter spp. in chicken products by using the polymerase chain reaction. Applied and Environmental Microbiology, 1992. 58(12): p. 3804-3808.
67. Zhu, X.Y., et al., 16S rRNA-Based Analysis of Microbiota from the Cecum of Broiler Chickens. Applied and Environmental Microbiology, 2002. 68(1): p. 124-137.
68. Danzeisen, J.L., et al., Modulations of the Chicken Cecal Microbiome and Metagenome in Response to Anticoccidial and Growth Promoter Treatment. PLoS ONE, 2011. 6(11): p. e27949.
69. Dubourg, G., et al., The gut microbiota of a patient with resistant tuberculosis is more comprehensively studied by culturomics than by metagenomics. European journal of clinical microbiology & infectious diseases, 2013. 32(5): p. 637-645.
70. Seng, P., et al., Ongoing Revolution in Bacteriology: Routine Identification of Bacteria by Matrix-Assisted Laser Desorption Ionization Time-of-Flight Mass Spectrometry. Clinical Infectious Diseases, 2009. 49(4): p. 543-551.
71. Schloss, P.D. and S.L. Westcott, Assessing and Improving Methods Used in Operational Taxonomic Unit-Based Approaches for 16S rRNA Gene Sequence Analysis. Applied and Environmental Microbiology, 2011. 77(10): p. 3219-3226.
72. Schmidt, T.S.B., J.F. Matias Rodrigues, and C. von Mering, Ecological Consistency of SSU rRNA-Based Operational Taxonomic Units at a Global Scale. PLoS Comput Biol, 2014. 10(4): p. e1003594.
73. Stackebrandt, E. and B. Goebel, Taxonomic note: a place for DNA-DNA reassociation and 16S rRNA sequence analysis in the present species definition in bacteriology. International Journal of Systematic Bacteriology, 1994. 44(4): p. 846-849.
202
74. Forney, L.J., X. Zhou, and C.J. Brown, Molecular microbial ecology: land of the one-eyed king. Current Opinion in Microbiology, 2004. 7(3): p. 210-220.
75. Edgar, R.C. Operational Taxonomic Units (OTUs). 2015.
76. Edgar, R.C., UPARSE: highly accurate OTU sequences from microbial amplicon reads. Nature Methods, 2013. 10(10): p. 996-998.
77. Edgar, R.C., et al., UCHIME improves sensitivity and speed of chimera detection. Bioinformatics, 2011. 27(16): p. 2194-2200.
78. Hughes, J.B., et al., Counting the Uncountable: Statistical Approaches to Estimating Microbial Diversity. Applied and Environmental Microbiology, 2001. 67(10): p. 4399-4406.
79. He, Y., et al., Stability of operational taxonomic units: an important but neglected property for analyzing microbial diversity. Microbiome, 2015. 3(1): p. 20.
80. Edgar, R.C. Single-sample diversity metrics (alpha diversity). 2015.
81. Chao, A. and S.-M. Lee, Estimating the Number of Classes via Sample Coverage. Journal of the American Statistical Association, 1992. 87(417): p. 210-217.
82. Simpson, E., Measurement of Diversity. Nature, 1949. 163: p. 688.
83. Tuomisto, H., An updated consumer’s guide to evenness and related indices. Oikos, 2012. 121(8): p. 1203-1218.
84. Hill, M.O., Diversity and Evenness: A Unifying Notation and Its Consequences. Ecology, 1973. 54(2): p. 427-432.
85. Shannon, C., A Mathematical Theory of Communication. 1948.
86. Bray, J.R. and J.T. Curtis, An ordination of the upland forest communities of southern Wisconsin. Ecological monographs, 1957. 27(4): p. 325-349.
87. Lozupone, C. and R. Knight, UniFrac: a New Phylogenetic Method for Comparing Microbial Communities. Applied and Environmental Microbiology, 2005. 71(12): p. 8228-8235.
88. Clarke, K.R., P.J. Somerfield, and M.G. Chapman, On resemblance measures for ecological studies, including taxonomic dissimilarities and a
203
zero-adjusted Bray–Curtis coefficient for denuded assemblages. Journal of Experimental Marine Biology and Ecology, 2006. 330(1): p. 55-80.
89. Costello, E.K., et al., The application of ecological theory towards an understanding of the human microbiome. Science (New York, N.Y.), 2012. 336(6086): p. 1255-1262.
90. Barnes, E.M., The avian intestinal flora with particular reference to the possible ecological significance of the cecal anaerobic bacteria. The American Journal of Clinical Nutrition, 1972. 25(12): p. 1475-1479.
91. Salanitro, J.P., I.G. Blake, and P.A. Muirhead, Studies on the Cecal Microflora of Commercial Broiler Chickens. Applied Microbiology, 1974. 28(3): p. 439-447.
92. Salanitro, J.P., I.G. Fairchilds, and Y.D. Zgornicki, Isolation, Culture Characteristics, and Identification of Anaerobic Bacteria from the Chicken Cecum. Applied Microbiology, 1974. 27(4): p. 678-687.
93. Salanitro, J.P., et al., Bacteria isolated from the duodenum, ileum, and cecum of young chicks. Applied and Environmental Microbiology, 1978. 35(4): p. 782-790.
94. Amit-Romach, E., D. Sklan, and Z. Uni, Microflora ecology of the chicken intestine using 16S ribosomal DNA primers. Poultry Science, 2004. 83(7): p. 1093-1098.
95. Pernot, E.F., An investigation of the mortality of incubator chicks. 1908, Corvallis, Or.: Oregon Agricultural College Press.
96. Pennington, M.E., A chemical and bacteriological study of fresh eggs. Journal of Biological Chemistry, 1910. 7(2): p. 109-132.
97. Berrang, M.E., et al., Bacterial Penetration of the Eggshell and Shell Membranes of the Chicken Hatching Egg: A Review. The Journal of Applied Poultry Research, 1999. 8(4): p. 499-504.
98. Binek, M.B., W; Pisarski, R; Blaszczak, B; Kosowska, G; Malec, H; Karpinska, E, Evaluation of the efficacy of feed providing on development of gastrointestinal microflora of newly hatched broiler chickens Archiv fuer Gefluegelkunde, 2000. 64(4): p. 147-151.
99. Bedford, M.R., Exogenous enzymes in monogastric nutrition — their current value and future benefits. Animal Feed Science and Technology, 2000. 86(1–2): p. 1-13.
204
100. Rehman, H.U., et al., Indigenous bacteria and bacterial metabolic products in the gastrointestinal tract of broiler chickens. Archives of Animal Nutrition, 2007. 61(5): p. 319-335.
101. Guan, L.L., et al., Detection and Identification of Lactobacillus Species in Crops of Broilers of Different Ages by Using PCR-Denaturing Gradient Gel Electrophoresis and Amplified Ribosomal DNA Restriction Analysis. Applied and Environmental Microbiology, 2003. 69(11): p. 6750-6757.
102. Hinton, A., R.J. Buhr, and K.D. Ingram, Physical, chemical, and microbiological changes in the crop of broiler chickens subjected to incremental feed withdrawal. Poultry Science, 2000. 79(2): p. 212-218.
103. Wielen, P.W.J.J., et al., Spatial and Temporal Variation of the Intestinal Bacterial Community in Commercially Raised Broiler Chickens During Growth. Microbial Ecology, 2002. 44(3): p. 286-293.
104. Sekelja, M., et al., Abrupt Temporal Fluctuations in the Chicken Fecal Microbiota Are Explained by Its Gastrointestinal Origin. Applied and Environmental Microbiology, 2012. 78(8): p. 2941-2948.
105. Stanley, D., R. Hughes, and R. Moore, Microbiota of the chicken gastrointestinal tract: influence on health, productivity and disease. Applied Microbiology and Biotechnology, 2014. 98(10): p. 4301-4310.
106. Fuller, R. and A. Turvey, Bacteria Associated with the Intestinal Wall of the Fowl (Gallus domesticus). Journal of Applied Bacteriology, 1971. 34(3): p. 617-622.
107. Salanitro, J.P., P.A. Muirhead, and J.R. Goodman, Morphological and physiological characteristics of Gemmiger formicilis isolated from chicken ceca. Applied and Environmental Microbiology, 1976. 32(4): p. 623-632.
108. Abecasis, A.B., et al., A Genomic Signature and the Identification of New Sporulation Genes. Journal of Bacteriology, 2013. 195(9): p. 2101-2115.
109. Engberg, R., et al., Influence of whole wheat and xylanase on broiler performance and microbial composition and activity in the digestive tract. Poultry Science, 2004. 83(6): p. 925-938.
110. Engberg, R.M., M.S. Hedemann, and B.B. Jensen, The influence of grinding and pelleting of feed on the microbial composition and activity in the digestive tract of broiler chickens. British Poultry Science, 2002. 43(4): p. 569-579.
205
111. Engberg, R.M., et al., Effect of zinc bacitracin and salinomycin on intestinal microflora and performance of broilers. Poultry Science, 2000. 79(9): p. 1311-1319.
112. Ptak, A., et al., Phytase Modulates Ileal Microbiota and Enhances Growth Performance of the Broiler Chickens. PLoS ONE, 2015. 10(3): p. e0119770.
113. Yeoman, C.J., et al., The microbiome of the chicken gastrointestinal tract. Animal Health Research Reviews, 2012. 13(01): p. 89-99.
114. Pedroso, A. and M. Lee, The composition and role of the microbiota in chickens.
115. Gong, J., et al., 16S rRNA gene-based analysis of mucosa-associated bacterial community and phylogeny in the chicken gastrointestinal tracts: from crops to ceca. FEMS Microbiology Ecology, 2007. 59(1): p. 147-157.
116. Gong, J., et al., Molecular analysis of bacterial populations in the ileum of broiler chickens and comparison with bacteria in the cecum. FEMS Microbiology Ecology, 2002. 41(3): p. 171-179.
117. Stanley, D., et al., Intestinal microbiota associated with differential feed conversion efficiency in chickens. Applied Microbiology and Biotechnology, 2012. 96(5): p. 1361-1369.
118. Lu, J., et al., Diversity and Succession of the Intestinal Bacterial Community of the Maturing Broiler Chicken. Applied and Environmental Microbiology, 2003. 69(11): p. 6816-6824.
119. Choi, J.H., G.B. Kim, and C.J. Cha, Spatial heterogeneity and stability of bacterial community in the gastrointestinal tracts of broiler chickens. Poultry Science, 2014. 93(8): p. 1942-1950.
120. Gong, J., et al., Diversity and phylogenetic analysis of bacteria in the mucosa of chicken ceca and comparison with bacteria in the cecal lumen. Vol. 208. 2002. 1-7.
121. Coloe, P., T. Bagust, and L. Ireland, Development of the normal gastrointestinal microflora of specific pathogen-free chickens. Journal of hygiene, 1984. 92(01): p. 79-87.
122. Apajalahti, J.H.A., et al., Percent G+C Profiling Accurately Reveals Diet-Related Differences in the Gastrointestinal Microbial Community of
206
Broiler Chickens. Applied and Environmental Microbiology, 2001. 67(12): p. 5656-5667.
123. Messaoudi, S., et al., Identification of lactobacilli residing in chicken ceca with antagonism against Campylobacter. Int Microbiol, 2011. 14(2): p. 103-10.
124. Stanley, D., et al., Highly Variable Microbiota Development in the Chicken Gastrointestinal Tract. PLoS ONE, 2013. 8(12): p. e84290.
125. Stanley, D., et al., Comparison of fecal and cecal microbiotas reveals qualitative similarities but quantitative differences. BMC Microbiology, 2015. 15(1): p. 1-11.
126. Saengkerdsub, S., et al., Detection of methane and quantification of methanogenic archaea in faeces from young broiler chickens using real-time PCR. Letters in Applied Microbiology, 2007. 45(6): p. 629-634.
127. Saengkerdsub, S., et al., Identification and Quantification of Methanogenic Archaea in Adult Chicken Ceca. Applied and Environmental Microbiology, 2007. 73(1): p. 353-356.
128. Yudiarti, T., et al., Isolation of fungi from the gastrointestinal tract of indigenous chicken. 2012. Vol. 37. 2012.
129. Chapman, H.D., T.K. Jeffers, and R.B. Williams, Forty years of monensin for the control of coccidiosis in poultry. Poultry Science, 2010. 89(9): p. 1788-1801.
130. Lloyd, A.B., R.B. Cumming, and R.D. Kent, Prevention of Salmonella typhimurium infection in poultry by the pretreatment of chickens and poults with intestinal extracts. Australian Veterinary Journal, 1977. 53(2): p. 82-87.
131. Timbermont, L., et al., Necrotic enteritis in broilers: an updated review on the pathogenesis. Avian Pathology, 2011. 40(4): p. 341-347.
132. Zhou, W., Y. Wang, and J. Lin, Functional Cloning and Characterization of Antibiotic Resistance Genes from the Chicken Gut Microbiome. Applied and Environmental Microbiology, 2012. 78(8): p. 3028-3032.
133. Cebra, J.J., Influences of microbiota on intestinal immune system development. The American Journal of Clinical Nutrition, 1999. 69(5): p. 1046s-1051s.
207
134. Round, J.L. and S.K. Mazmanian, The gut microbiota shapes intestinal immune responses during health and disease. Nat Rev Immunol, 2009. 9(5): p. 313-323.
135. Neal-McKinney, J.M., et al., Production of Organic Acids by Probiotic Lactobacilli Can Be Used to Reduce Pathogen Load in Poultry. PLoS ONE, 2012. 7(9): p. e43928.
136. Meimandipour, A., et al., In vitro fermentation of broiler cecal content: the role of lactobacilli and pH value on the composition of microbiota and end products fermentation. Letters in Applied Microbiology, 2009. 49(4): p. 415-420.
137. Stanley, D., et al., Changes in the caecal microflora of chickens following Clostridium perfringens challenge to induce necrotic enteritis. Veterinary Microbiology, 2012. 159(1–2): p. 155-162.
138. Skraban, J., et al., Changes of poultry faecal microbiota associated with Clostridium difficile colonisation. Veterinary microbiology, 2013. 165(3): p. 416-424.
139. Parish, W., Necrotic Enteritis in The Fowl (Gallus Gallus Domesticus): I. Histopathology of The Disease And Isolation of A Strain of Clostridium Welchii. Journal of Comparative Pathology and Therapeutics, 1961. 71: p. 377-393.
140. Van Immerseel, F., et al., Rethinking our understanding of the pathogenesis of necrotic enteritis in chickens. Trends in microbiology, 2009. 17(1): p. 32-36.
141. Yegani, M. and D.R. Korver, Factors Affecting Intestinal Health in Poultry. Poultry Science, 2008. 87(10): p. 2052-2063.
142. Van der Sluis, W., Clostridial enteritis is an often underestimated problem. Cited from "Stanley, D. Changes in the caecal microflora of chickens following Clostridium perfringens challenge to induce necrotic enteritis". World Poultry, 2000. 16(7): p. 42-43.
143. Williams, R.B., Intercurrent coccidiosis and necrotic enteritis of chickens: rational, integrated disease management by maintenance of gut integrity. Avian Pathology, 2005. 34(3): p. 159-180.
144. Williams, R., A compartmentalised model for the estimation of the cost of coccidiosis to the world's chicken production industry. International journal for parasitology, 1999. 29(8): p. 1209-1229.
208
145. Humphrey, S., et al., Campylobacter jejuni Is Not Merely a Commensal in Commercial Broiler Chickens and Affects Bird Welfare. mBio, 2014. 5(4).
146. Altekruse, S.F., et al., Campylobacter jejuni--an emerging foodborne pathogen. Emerging Infectious Diseases, 1999. 5(1): p. 28-35.
147. Newell, D.G. and C. Fearnley, Sources of Campylobacter Colonization in Broiler Chickens. Applied and Environmental Microbiology, 2003. 69(8): p. 4343-4351.
148. Singh, K., et al., High through put 16S rRNA gene-based pyrosequencing analysis of the fecal microbiota of high FCR and low FCR broiler growers. Molecular biology reports, 2012. 39(12): p. 10595-10602.
149. Torok, V.A., et al., Identification and Characterization of Potential Performance-Related Gut Microbiotas in Broiler Chickens across Various Feeding Trials. Applied and Environmental Microbiology, 2011. 77(17): p. 5868-5878.
150. Moore, P., et al., Use of sulfasuxidine, streptothricin, and streptomycin in nutritional studies with the chick. J. biol. Chem, 1946. 165(2): p. 437-441.
151. Gustafson, R. and R. Bowen, Antibiotic use in animal agriculture. Journal of Applied Microbiology, 1997. 83(5): p. 531-541.
152. Stokstad, E.L.R. and T.H. Jukes, Further Observations on the “Animal Protein Factor” Cited from: Gustafson, RH & Bowen, RE "Use of antibiotics in agriculture". Experimental Biology and Medicine, 1950. 73(3): p. 523-528.
153. Carpenter, L.E., Effect of APF concentrate containing aureomycin on gestating, lactating, and growing swine. Journal of Animal Science, 1951. 10(3): p. 657-664.
154. Murley, W., N. Jacobson, and R. Allen, The Effect of Aureomycin Supplementation on Growth and Feed Utilization of Young Dairy Calves 1, 2. Journal of Dairy Science, 1952. 35(10): p. 846-856.
155. Dibner, J. and J. Richards, Antibiotic growth promoters in agriculture: history and mode of action. Poultry Science, 2005. 84(4): p. 634-643.
156. Visek, W.J., The Mode of Growth Promotion by Antibiotics. Journal of Animal Science, 1978. 46(5): p. 1447-1469.
157. Swann, M.M., Report Joint Committee on the Use of Antibiotics in Animal Husbandry and Veterinary Medicine. 1969: HM Stationery Office.
209
158. Committee, N., Report of the Joint Committee on Antibiotics in Animal Feeding. Cited from "Gustafson and Bowen, 1997". London, UK: Agricultural Research Council and Medical Research Council, 1962.
159. FDA, The Judicious Use of Medically Important Antimicrobial Drugs in Food-Producing Animals, FDA, Editor. 2012: www.FDA.gov.
160. Casewell, M., et al., The European ban on growth-promoting antibiotics and emerging consequences for human and animal health. Journal of Antimicrobial Chemotherapy, 2003. 52(2): p. 159-161.
161. Phillips, I., et al., Does the use of antibiotics in food animals pose a risk to human health? A critical review of published data. Journal of Antimicrobial Chemotherapy, 2004. 53(1): p. 28-52.
162. VMD, Sales of antimicrobial products authorised for use as veterinary medicines in the UK in 2010, V.M. Directorate, Editor. 2011.
163. Sommer, M.O.A., G. Dantas, and G.M. Church, Functional Characterization of the Antibiotic Resistance Reservoir in the Human Microflora. Science, 2009. 325(5944): p. 1128-1131.
164. Worthington, R.J. and C. Melander, Combination approaches to combat multidrug-resistant bacteria. Trends in Biotechnology, 2013. 31(3): p. 177-184.
165. Sommer, M.O.A. and G. Dantas, Antibiotics and the resistant microbiome. Current Opinion in Microbiology, 2011. 14(5): p. 556-563.
166. D/'Costa, V.M., et al., Antibiotic resistance is ancient. Nature, 2011. 477(7365): p. 457-461.
167. Obeng, A.S., et al., Antibiotic resistance, phylogenetic grouping and virulence potential of Escherichia coli isolated from the faeces of intensively farmed and free range poultry. Veterinary Microbiology, 2012. 154(3–4): p. 305-315.
168. Tremblay, C.-L., et al., Multiple-antibiotic resistance of Enterococcus faecalis and Enterococcus faecium from cecal contents in broiler chicken and turkey flocks slaughtered in Canada and plasmid colocalization of tetO and ermB genes. Journal of Food Protection®, 2011. 74(10): p. 1639-1648.
169. Kilonzo-Nthenge, A., et al., Occurrence and Antimicrobial Resistance of Enterococci Isolated from Organic and Conventional Retail Chicken. Journal of Food Protection®, 2015. 78(4): p. 760-766.
210
170. Diarra, M.S., et al., Antibiotic resistance and diversity of Salmonella enterica serovars associated with broiler chickens. Journal of Food Protection®, 2014. 77(1): p. 40-49.
171. Cui, S., et al., Prevalence and antimicrobial resistance of Campylobacter spp. and Salmonella serovars in organic chickens from Maryland retail stores. Applied and environmental microbiology, 2005. 71(7): p. 4108-4111.
172. Francesch, M. and P.A. Geraert, Enzyme complex containing carbohydrases and phytase improves growth performance and bone mineralization of broilers fed reduced nutrient corn-soybean-based diets. Poultry Science, 2009. 88(9): p. 1915-1924.
173. Annison, G. and M. Choct, Anti-nutritive activities of cereal non-starch polysaccharides in broiler diets and strategies minimizing their effects. World's Poultry Science Journal, 1991. 47(03): p. 232-242.
174. Mathlouthi, M., Saulnier, Quemener, Larbier, Effects of xylanase and beta-glucanase addition on performance, nutrient digestibility, and physico-chemical conditions in the small intestine contents and caecal microflora of broiler chickens fed a wheat and barley-based diet. Animal Research, 2002. 51(1): p. 395-406.
175. Smits, C.H.M. and G. Annison, Non-starch plant polysaccharides in broiler nutrition – towards a physiologically valid approach to their determination. World's Poultry Science Journal, 1996. 52(02): p. 203-221.
176. Dikeman, C.L. and G.C. Fahey, Viscosity as Related to Dietary Fiber: A Review. Critical Reviews in Food Science and Nutrition, 2006. 46(8): p. 649-663.
177. Campbell, G.L., et al., Genotypic and environmental differences in extract viscosity of barley and their relationship to its nutritive value for broiler chickens. Animal Feed Science and Technology, 1989. 26(3–4): p. 221-230.
178. Fengler, A.M., R, Water-Soluble Pentosans from Rye: II. Effects on Rate of Dialysis and on the Retention of Nutrients by the Chick. Cereal Chem, 1988. 65(4): p. 298-302.
179. Choct, M. and G. Annison, Anti‐nutritive effect of wheat pentosans in broiler chickens: Roles of viscosity and gut microflora. British Poultry Science, 1992. 33(4): p. 821-834.
211
180. Bedford, M.R., The role of carbohydrases in feedstuff digestion. Poultry Feedstuffs: Supply, Composition and Nutritive Value, ed. M.a. Boorman. 2002, Wallingford, UK: CABI Publishing.
181. Johnson, I.T. and J.M. Gee, Effect of gel-forming gums on the intestinal unstirred layer and sugar transport in vitro. Gut, 1981. 22(5): p. 398-403.
182. Smits, C.H.M., et al., Dietary Carboxymethylcellulose with High Instead of Low Viscosity Reduces Macronutrient Digestion in Broiler Chickens. The Journal of nutrition, 1997. 127(3): p. 483-487.
183. Smits, C., et al., The inhibitory effect of carboxymethylcellulose with high viscosity on lipid absorption in broiler chickens coincides with reduced bile salt concentration and raised microbial numbers in the small intestine. Poultry Science, 1998. 77(10): p. 1534-1539.
184. Bedford, M.R., Mechanism of action and potential environmental benefits from the use of feed enzymes. Animal Feed Science and Technology, 1995. 53(2): p. 145-155.
185. Józefiak, D., A. Rutkowski, and S.A. Martin, Carbohydrate fermentation in the avian ceca: a review. Animal Feed Science and Technology, 2004. 113(1–4): p. 1-15.
186. Waldenstedt, L., et al., Intestinal digesta viscosity decreases during coccidial infection in broilers. British Poultry Science, 2000. 41(4): p. 459-464.
187. Sakata, T., Stimulatory effect of short-chain fatty acids on epithelial cell proliferation in the rat intestine: a possible explanation for trophic effects of fermentable fibre, gut microbes and luminal trophic factors. British Journal of Nutrition, 1987. 58(01): p. 95-103.
188. Knarreborg, A., et al., Quantitative Determination of Bile Salt Hydrolase Activity in Bacteria Isolated from the Small Intestine of Chickens. Applied and Environmental Microbiology, 2002. 68(12): p. 6425-6428.
189. Kussaibati, R., J. GUILLAUME, and B. LECLERCQ, The effects of the gut microflora on the digestibility of starch and proteins in young chicks. Ann. Zootech., 1982. 31(4): p. 483-488.
190. Krogdahl, A., Digestion and absorption of lipids in poultry. The Journal of nutrition, 1985. 115(5): p. 675-685.
191. Almirall, M., et al., The differences in intestinal viscosity produced by barley and beta-glucanase alter digesta enzyme activities and ileal
212
nutrient digestibilities more in broiler chicks than in cocks. The Journal of nutrition, 1995. 125(4): p. 947-955.
192. Choct, M., Enzymes for the feed industry: past, present and future. World's Poultry Science Journal, 2006. 62(01): p. 5-16.
193. Iji, P.A. and D.R. Tivey, Natural and synthetic oligosaccharides in broiler chicken diets. World's Poultry Science Journal, 1998. 54(02): p. 129-143.
194. Singh, P.K., Significance of phytic acid and supplemental phytase in chicken nutrition: a review. World's Poultry Science Journal, 2008. 64(04): p. 553-580.
195. Bedford, M.R. and A.J. Morgan, The use of enzymes in poultry diets. World's Poultry Science Journal, 1996. 52(01): p. 61-68.
196. Leeson, S., et al., Efficacy of new bacterial phytase in poultry diets. Canadian Journal of Animal Science, 2000. 80(3): p. 527-528.
197. Donoghun, A.F., M.; Cole, K.; Donoghun, D., Avian Gut Function in Health and Disease, in Avian Gut Function in Health and Disease, G. Perry, Editor. 2007, CABI: Oxon, Uk.
198. Cowieson, A.J., M. Hruby, and E.E.M. Pierson, Evolving enzyme technology: impact on commercial poultry nutrition. Nutrition research reviews., 2006. 19(1): p. 90-103.
199. Sebastian, S., et al., Efficacy of Supplemental Microbial Phytase at Different Dietary Calcium Levels on Growth Performance and Mineral Utilization of Broiler Chickens. Poultry Science, 1996. 75(12): p. 1516-1523.
200. Rautio, M., et al., Reclassification of Bacteroides putredinis (Weinberg et al., 1937) in a new genus Alistipes gen. nov., as Alistipes putredinis comb. nov., and description of Alistipes finegoldii sp. nov., from human sources. Systematic and applied microbiology, 2003. 26(2): p. 182-188.
201. Salyers, A.A., et al., Fermentation of mucins and plant polysaccharides by anaerobic bacteria from the human colon. Applied and Environmental Microbiology, 1977. 34(5): p. 529-533.
202. Forder, R.E.A., et al., Bacterial Modulation of Small Intestinal Goblet Cells and Mucin Composition During Early Posthatch Development of Poultry1. Poultry Science, 2007. 86(11): p. 2396-2403.
213
203. Morris, G.N., et al., Eubacterium desmolans sp. nov., a Steroid Desmolase-Producing Species from Cat Fecal Flora. International Journal of Systematic and Evolutionary Microbiology, 1986. 36(2): p. 183-186.
204. Woese, C.R., Bacterial evolution. Microbiological Reviews, 1987. 51(2): p. 221-271.
205. Hanshew, A.S., et al., Minimization of chloroplast contamination in 16S rRNA gene pyrosequencing of insect herbivore bacterial communities. Journal of microbiological methods, 2013. 95(2): p. 149-155.
206. Zhao, L., et al., Quantitative Genetic Background of the Host Influences Gut Microbiomes in Chickens. Scientific Reports, 2013. 3: p. 1163.
207. Salter, S.J., et al., Reagent and laboratory contamination can critically impact sequence-based microbiome analyses. BMC biology, 2014. 12(1): p. 87.
208. Schmid, M., J. Baldani, and A. Hartmann, The Genus Herbaspirillum, in The Prokaryotes, M. Dworkin, et al., Editors. 2006, Springer New York. p. 141-150.
209. Oakley, B.B., et al., Successional changes in the chicken cecal microbiome during 42 days of growth are independent of organic acid feed additives. BMC veterinary research, 2014. 10(1): p. 282.
210. Lan, P.T.N., et al., Phylogenetic Analysis of Cecal Microbiota in Chicken by the Use of 16S rDNA Clone Libraries. Microbiology and Immunology, 2002. 46(6): p. 371-382.
211. Luo, J., et al., Proteome changes in the intestinal mucosa of broiler (Gallus gallus) activated by probiotic Enterococcus faecium. Journal of Proteomics, 2013. 91: p. 226-241.
212. Song, Y.L., et al., Clostridium bartlettii sp. nov., isolated from human faeces. Anaerobe, 2004. 10(3): p. 179-184.
213. Danzeisen, J.L., et al., Succession of the turkey gastrointestinal bacterial microbiome related to weight gain. PeerJ, 2013. 1: p. e237.
214. Duncan, S.H., et al., The role of pH in determining the species composition of the human colonic microbiota. Environmental Microbiology, 2009. 11(8): p. 2112-2122.
214
215. Katano, Y., et al., Complete genome sequence of Oscillibacter valericigenes Sjm18-20(T) (=NBRC 101213(T)). Standards in Genomic Sciences, 2012. 6(3): p. 406-414.
216. Iino, T., et al., Oscillibacter valericigenes gen. nov., sp. nov., a valerate-producing anaerobic bacterium isolated from the alimentary canal of a Japanese corbicula clam. International Journal of Systematic and Evolutionary Microbiology, 2007. 57(8): p. 1840-1845.
217. Miquel, S., et al., Ecology and metabolism of the beneficial intestinal commensal bacterium Faecalibacterium prausnitzii. Gut Microbes, 2014. 5(2): p. 146-151.
218. Sokol, H., et al., Faecalibacterium prausnitzii is an anti-inflammatory commensal bacterium identified by gut microbiota analysis of Crohn disease patients. Proceedings of the National Academy of Sciences, 2008. 105(43): p. 16731-16736.
219. Videnska, P., et al., Succession and Replacement of Bacterial Populations in the Caecum of Egg Laying Hens over Their Whole Life. PLoS ONE, 2014. 9(12): p. e115142.
220. Herlemann, D.P.R., et al., Genomic Analysis of “Elusimicrobium minutum,” the First Cultivated Representative of the Phylum “Elusimicrobia” (Formerly Termite Group 1). Applied and Environmental Microbiology, 2009. 75(9): p. 2841-2849.
221. Geissinger, O., et al., The Ultramicrobacterium “Elusimicrobium minutum” gen. nov., sp. nov., the First Cultivated Representative of the Termite Group 1 Phylum. Applied and Environmental Microbiology, 2009. 75(9): p. 2831-2840.
222. Nagashima, K., et al., Application of New Primer-Enzyme Combinations to Terminal Restriction Fragment Length Polymorphism Profiling of Bacterial Populations in Human Feces. Applied and Environmental Microbiology, 2003. 69(2): p. 1251-1262.
223. Nam, Y.-D., et al., Bacterial, archaeal, and eukaryal diversity in the intestines of Korean people. The Journal of Microbiology, 2008. 46(5): p. 491-501.
224. MOORE, W.C., J. Johnson, and L. Holdeman, Emendation of Bacteroidaceae and Butyrivibrio and descriptions of Desulfomonas gen. nov. and ten new species in the genera Desulfomonas, Butyrivibrio, Eubacterium, Clostridium, and Ruminococcus. International Journal of Systematic Bacteriology, 1976. 26(2): p. 238-252.
215
225. Leitch, E.C.M., et al., Selective colonization of insoluble substrates by human faecal bacteria. Environmental Microbiology, 2007. 9(3): p. 667-679.
226. Luo, Y.-h., et al., Broilers fed dietary vitamins harbor higher diversity of cecal bacteria and higher ratio of Clostridium, Faecalibacterium, and Lactobacillus than broilers with no dietary vitamins revealed by 16S rRNA gene clone libraries. Poultry Science, 2013. 92(9): p. 2358-2366.
227. Sakuma, K., et al., Clostridium glycyrrhizinilyticum Sp. Nov., a Glycyrrhizin-Hydrolysing Bacterium Isolated from Human Faeces. Microbiology and Immunology, 2006. 50(7): p. 481-485.
228. Furuya, H., et al., Isolation of a novel bacterium, Blautia glucerasei sp. nov., hydrolyzing plant glucosylceramide to ceramide. Archives of Microbiology, 2010. 192(5): p. 365-372.
229. Wolin, M.J., et al., Formate-Dependent Growth and Homoacetogenic Fermentation by a Bacterium from Human Feces: Description of Bryantella formatexigens gen. nov., sp. nov. Applied and Environmental Microbiology, 2003. 69(10): p. 6321-6326.
230. Rey, F.E., et al., Dissecting the in Vivo Metabolic Potential of Two Human Gut Acetogens. Journal of Biological Chemistry, 2010. 285(29): p. 22082-22090.
231. Holdeman, L.V.a.M., W. E. C., New Genus, Coprococcus, Twelve New Species, and Emended Descriptions of Four Previously Described Species of Bacteria from Human Feces. International Journal of Systematic and Evolutionary Microbiology, 1974. 24(2): p. 260-277.
232. Barrow, P., Probiotics for chickens, in Probiotics. 1992, Springer Netherlands. p. 225-257.
233. King, W.E., The bacterial flora of the intestinal mucosa and conjunctiva of the normal chicken. Am. Med., 1905. 10: p. 400-404 (Cited from Gage, G.E., no. 153. 1911, College Park: Maryland Agricultural Experiment Station. p. [201]-226.).
234. Prakash, O., et al., Microbial cultivation and the role of microbial resource centers in the omics era. Applied Microbiology and Biotechnology, 2013. 97(1): p. 51-62.
235. Heginbothom, M., T.C. Fitzgerald, and W.G. Wade, Comparison of solid media for cultivation of anaerobes. Journal of Clinical Pathology, 1990. 43(3): p. 253-256.
216
236. Allen-Vercoe, E., Bringing the gut microbiota into focus through microbial culture: recent progress and future perspective. Current Opinion in Microbiology, 2013. 16(5): p. 625-629.
237. van der Wielen, P.W.J.J., et al., Competitive Exclusion of Salmonella enterica serovar Enteritidis by Lactobacillus crispatus and Clostridium lactatifermentans in a Sequencing Fed-Batch Culture. Applied and Environmental Microbiology, 2002. 68(2): p. 555-559.
238. Edelman, S.M., et al., Identification of a high-molecular-mass Lactobacillus epithelium adhesin (LEA) of Lactobacillus crispatus ST1 that binds to stratified squamous epithelium. Microbiology, 2012. 158(7): p. 1713-1722.
239. Abbas Hilmi, H.T., et al., Identification of the Most Abundant Lactobacillus Species in the Crop of 1- and 5-Week-Old Broiler Chickens. Applied and Environmental Microbiology, 2007. 73(24): p. 7867-7873.
240. Stern, N.J., et al., Isolation of a Lactobacillus salivarius Strain and Purification of Its Bacteriocin, Which Is Inhibitory to Campylobacter jejuni in the Chicken Gastrointestinal System. Antimicrobial Agents and Chemotherapy, 2006. 50(9): p. 3111-3116.
241. Awan, M. and M. Matsumoto, Heterogeneity of staphylococci and other bacteria isolated from six-week-old broiler chickens. Poultry Science, 1998. 77(7): p. 944-949.
242. Bailey, J., J. Thomson, and N. Cox, Contamination of poultry during processing. Vol. 193. 1987: Academic Press, Orlando, FL.
243. Wexler, H.M., Bacteroides: the Good, the Bad, and the Nitty-Gritty. Clinical Microbiology Reviews, 2007. 20(4): p. 593-621.
244. Bakir, M.A., et al., Bacteroides intestinalis sp. nov., isolated from human faeces. International Journal of Systematic and Evolutionary Microbiology, 2006. 56(1): p. 151-154.
245. KANEUCHI, C., et al., Taxonomic study of helically coiled, sporeforming anaerobes isolated from the intestines of humans and other animals: Clostridium cocleatum sp. nov. and Clostridium spiroforme sp. nov. International Journal of Systematic Bacteriology, 1979. 29(1): p. 1-12.
246. Peeters, J.E., et al., Significance of Clostridium spiroforme in the enteritis-complex of commercial rabbits. Veterinary Microbiology, 1986. 12(1): p. 25-31.
217
247. Gibert, M., et al., Clostridium spiroforme Toxin Genes are Related to C. perfringens Iota Toxin Genes but have a Different Genomic Localization. Systematic and Applied Microbiology, 1997. 20(3): p. 337-347.
248. El-Gwad, A.A. and A. El-R-Thabet, ISOLATION OF INTESTINAL CLOSTRIDIUM SPIROFORME FROM BROILER CHICKEN AND THEIR SUSCEPTIBILITY TO EIGHT ANTIBACTERIAL AGENTS IN VITRO. Ass. Univ. Bull. Environ. Res, 2002. 5(1).
249. Schoefer, L., et al., Anaerobic Degradation of Flavonoids by Clostridium orbiscindens. Applied and Environmental Microbiology, 2003. 69(10): p. 5849-5854.
250. Winter, J., et al., Clostridium orbiscindens sp. nov., a Human Intestinal Bacterium Capable of Cleaving the Flavonoid C-Ring. International Journal of Systematic and Evolutionary Microbiology, 1991. 41(3): p. 355-357.
251. Dho-Moulin, M. and J.M. Fairbrother, Avian pathogenic Escherichia coli (APEC). Veterinary research, 1999. 30(2-3): p. 299-316.
252. Ewers, C., T. Janssen, and L.H. Wieler, Avian pathogenic Escherichia coli (APEC). Berliner und Munchener tierarztliche Wochenschrift, 2003. 116(9-10): p. 381-395.
253. Magray, M.S.U.D., et al., Identification of Escherichia coli through analysis of 16S rRNA and 16S-23S rRNA internal transcribed spacer region sequences. Bioinformation, 2011. 6(10): p. 370-371.
254. Hidaka, H., et al., Effects of Fructooligosaccharides on Intestinal Flora and Human Health. Bifidobacteria and Microflora, 1986. 5(1): p. 37-50.
255. Blair, J.M.A., et al., Molecular mechanisms of antibiotic resistance. Nat Rev Micro, 2015. 13(1): p. 42-51.
256. Wright, G.D., Molecular mechanisms of antibiotic resistance. Chemical Communications, 2011. 47(14): p. 4055-4061.
257. Mende, D.R., et al., Accurate and universal delineation of prokaryotic species. Nat Meth, 2013. 10(9): p. 881-884.
258. Auch, A.F., et al., Digital DNA-DNA hybridization for microbial species delineation by means of genome-to-genome sequence comparison. 2010. Vol. 2. 2010.
218
259. Richter, M. and R. Rosselló-Móra, Shifting the genomic gold standard for the prokaryotic species definition. Proceedings of the National Academy of Sciences of the United States of America, 2009. 106(45): p. 19126-19131.
260. Zankari, E., et al., Genotyping using whole-genome sequencing is a realistic alternative to surveillance based on phenotypic antimicrobial susceptibility testing. Journal of Antimicrobial Chemotherapy, 2013. 68(4): p. 771-777.
261. Kanehisa, M. and S. Goto, KEGG: Kyoto Encyclopedia of Genes and Genomes. Nucleic Acids Research, 2000. 28(1): p. 27-30.
262. Arzese, A.R., L. Tomasetig, and G.A. Botta, Detection of tetQ and ermF antibiotic resistance genes in Prevotella and Porphyromonas isolates from clinical specimens and resident microbiota of humans. Journal of Antimicrobial Chemotherapy, 2000. 45(5): p. 577-582.
263. Yang, W., et al., TetX Is a Flavin-dependent Monooxygenase Conferring Resistance to Tetracycline Antibiotics. Journal of Biological Chemistry, 2004. 279(50): p. 52346-52352.
264. Roberts, M.C., Tetracycline resistance determinants: mechanisms of action, regulation of expression, genetic mobility, and distribution. FEMS microbiology reviews, 1996. 19(1): p. 1-24.
265. Holdeman, L.V. and W.E.C. Moore, New Genus, Coprococcus, Twelve New Species, and Emended Descriptions of Four Previously Described Species of Bacteria from Human Feces. International Journal of Systematic and Evolutionary Microbiology, 1974. 24(2): p. 260-277.
266. Duncan, S.H., P. Louis, and H.J. Flint, Lactate-Utilizing Bacteria, Isolated from Human Feces, That Produce Butyrate as a Major Fermentation Product. Applied and Environmental Microbiology, 2004. 70(10): p. 5810-5817.
267. Garriga, et al., Selection of lactobacilli for chicken probiotic adjuncts. Journal of Applied Microbiology, 1998. 84(1): p. 125-132.
268. Pascual, M., et al., Lactobacillus salivarius CTC2197 Prevents Salmonella enteritidis Colonization in Chickens. Applied and Environmental Microbiology, 1999. 65(11): p. 4981-4986.
269. Servin, A.L., Antagonistic activities of lactobacilli and bifidobacteria against microbial pathogens. FEMS Microbiology Reviews, 2004. 28(4): p. 405-440.
219
270. Meijer, K., P. de Vos, and M.G. Priebe, Butyrate and other short-chain fatty acids as modulators of immunity: what relevance for health? Current Opinion in Clinical Nutrition & Metabolic Care, 2010. 13(6): p. 715-721.
271. Mathlouthi, N., et al., Xylanase and β-glucanase supplementation improve conjugated bile acid fraction in intestinal contents and increase villus size of small intestine wall in broiler chickens fed a rye-based diet. Journal of Animal Science, 2002. 80(11): p. 2773-2779.
272. Kluepfel, D., et al., Purification and characterization of a new xylanase (xylanase B) produced by Streptomyces lividans 66. Biochem. J, 1990. 267: p. 45-50.
273. Michelin, M., et al., A novel xylan degrading β-D-xylosidase: purification and biochemical characterization. World Journal of Microbiology and Biotechnology, 2012. 28(11): p. 3179-3186.
274. Hurlbert, J.C. and J.F. Preston, Functional characterization of a novel xylanase from a corn strain of Erwinia chrysanthemi. Journal of bacteriology, 2001. 183(6): p. 2093-2100.
275. Zhou, J., et al., Molecular and biochemical characterization of a novel xylanase from the symbiotic Sphingobacterium sp. TN19. Applied microbiology and biotechnology, 2009. 85(2): p. 323-333.
276. Wang, Y., et al., Characterization, gene cloning, and expression of a novel xylanase XYNB from Streptomyces olivaceoviridis A1. Aquaculture, 2007. 267(1): p. 328-334.
277. Khandeparker, R. and M. Numan, Bifunctional xylanases and their potential use in biotechnology. Journal of Industrial Microbiology & Biotechnology, 2008. 35(7): p. 635-644.
278. Nahm, K.H. and C.W. Carlson, Effects of Cellulase from Trichoderma viride on Nutrient Utilization by Broilers. Poultry Science, 1985. 64(8): p. 1536-1540.
279. Saleh, F., et al., A mixture of pure cellulase, hemicellulase and pectinase improves broiler performance. British Poultry Science, 2005. 46(5): p. 602-606.
280. Patel, B., M.S. Jami, and J. McGinnis, Effect of Gamma Irradiation, Penicillin, and/or Pectic Enzyme on Chick Growth Depression and Fecal Stickiness Caused by Rye, Citrus Pectin, and Guar Gum. Poultry Science, 1980. 59(9): p. 2105-2110.
220
281. Grammer, J.C., M. James, and M.H. Publos, The Effects of a Pectic Enzyme on the Growth-Depressing and Rachitogenic Properties of Rye for Chicks. Poultry Science, 1982. 61(9): p. 1891-1896.
282. Benitez-Paez, A., K. Portune, and Y. Sanz, Species level resolution of 16S rRNA gene amplicons sequenced through MinIONTM portable nanopore sequencer. 2015.