high velocity blue-shifted feii absorption in the dwarf ... · high velocity blue-shifted feii...
TRANSCRIPT
Mon. Not. R. Astron. Soc. 000, 1–15 (2014) Printed 11 October 2018 (MN LATEX style file v2.2)
High velocity blue-shifted FeII absorption in the dwarfstar-forming galaxy PHL293B: Evidence for a wind drivensupershell?
Roberto Terlevich1,2?, Elena Terlevich1, Guillermo Bosch 3,4, Angeles Dıaz5,Guillermo Hagele3,4, Monica Cardaci3,4, Veronica Firpo3,61INAOE, Luis Enrique Erro 1, Tonantzintla, Puebla, C.P. 72840, Mexico2Institute of Astronomy, Madingley Rd., Cambridge, CB3 0HA, UK3Instituto de Astrofısica de La Plata (CONICET-UNLP), Argentina.4Facultad de Cs. Astronomicas y Geofısicas, UNLP, Argentina.5Departamento de Fısica Teorica, Universidad Autonoma de Madrid, Cantoblanco, E-28049 Madrid, Spain.6Universidad de La Serena, Chile.
v 04-04 —- Compiled on 11 October 2018
ABSTRACT
X-shooter and ISIS WHT spectra of the starforming galaxy PHL 293B also knownas A2228-00 and SDSS J223036.79-000636.9 are presented in this paper.
We find broad (FWHM = 1000km/s) and very broad (FWZI = 4000km/s) com-ponents in the Balmer lines, narrow absorption components in the Balmer seriesblueshifted by 800km/s, previously undetected FeII multiplet (42) absorptions alsoblueshifted by 800km/s, IR CaII triplet stellar absorptions consistent with [Fe/H]< −2.0 and no broad components or blushifted absorptions in the HeI lines. Based onhistorical records, we found no optical variability at the 5 σ level of 0.02 mag between2005 and 2013 and no optical variability at the level of 0.1mag for the past 24 years.
The lack of variability rules out transient phenomena like luminous blue variablesor SN IIn as the origin of the blue shifted absorptions of HI and FeII. The evidencepoints to either a young and dense expanding supershell or a stationary cooling wind,in both cases driven by the young cluster wind.
Key words: galaxies: abundances – galaxies: dwarfs
1 INTRODUCTION
Early studies of emission line galaxies have shown that ob-jects that spectroscopically resembled HII regions both inline emission intensities and widths, constituted about 80per cent of total samples, the rest being galaxies of Seyferttype (see e.g. French 1980, and references therein). Some ofthese objects are also characterised by their compacticityand blue excess as shown on photographic plates and repre-sent the overlap between blue compact galaxies (BCG) andHII galaxies. PHL 293 B is one of these objects. It was foundby Haro & Luyten (1962) in the “Palomar-Haro-Luyten”survey of faint blue objects. Kinman (1965) obtained its op-tical spectrum and described it as having a faint continuumwith unresolved emission in the Balmer series and [OIII]λλ5007,4959 and 4363A that makes of it, to our knowledge,one of the first detections of the [OIII]λ4363A auroral line in
? E-mail: [email protected]
a star forming galaxy. We nowadays recognize this fact as theone allowing a trustworthy derivation of the gas elementalabundances in regions of star formation showing an emissionline spectrum. In the case of PHL 293 B, these abundancesare amongst the lowest known, less than one tenth of thesolar value (French 1980; Izotov, Thuan & Stasinska 2007;Asplund et al. 2009) and in the border line of what is consid-ered to be an extremely metal deficient galaxy (e.g. Kunth& Ostlin 2000). The galaxy was included in the sample stud-ied by French (1980) who lists its absolute magnitude andsize as -13.6 and 0.2 kpc respectively. PHL 293B also lookscompact in the images obtained by Cairos et al. (2001), andGeha et al. (2006) give an effective radius for this galaxy ofonly 0.4 kpc. Its absolute magnitude according to the SloanDigital Sky Survey (SDSS) is, Mg = -14.77. These facts makeof it a very low luminosity and compact HII galaxy.
One of the characteristics of HII galaxies is their highstar formation rate that takes place in a very small volumeand probably in short duration episodes, thus making these
c© 2014 RAS
arX
iv:1
409.
1189
v1 [
astr
o-ph
.GA
] 3
Sep
201
4
2 R.Terlevich et al.
galaxies easily observable. Given the large value of the equiv-alent width of their emission lines, it is the current burstof star formation that dominates their luminosity at blueand visible wavelengths. The low metallicity of these objectsguarantees that they are in a chemically unevolved stageprobably similar to what is expected in galaxies at early cos-mological times. The evolution of their massive young stars,responsible for the gas ionisation, is conditioned by their lowmetallicity as is probably the case for Pop III stars. The evo-lution of high mass stars is short and encompasses phaseswith intense episodes of mass loss, therefore the presence oflow intensity broad components or wings in the otherwisenarrow emission lines typical of star-forming regions (SFR),are relatively common in high S/N medium resolution spec-tra. Well known examples are: NGC 604, a giant HII regionin the spiral galaxy M 33 (Dıaz et al. 1987; Terlevich et al.1996); NGC 5471, a giant HII region in the spiral galaxyM 101 (Castaneda, Vilchez, & Copetti 1990), NGC 2363, agiant HII region in the irregular galaxy NGC 2366 (Roy etal. 1992; Gonzalez-Delgado et al. 1994) and 30 Dor in theLMC, one of the largest extragalactic HII regions in the localuniverse (Melnick, Tenorio-Tagle, & Terlevich 1999). This isalso the case, as expected, for HII galaxies and strong lineBCG (see e.g. Izotov et al. 1996), since it is the dominantstar forming region that dominates their integrated spectra.
The most likely origin of the extended line wings ob-served in SFR is related to the evolution of very massivestars and the feedback processes between them and the sur-rounding interstellar medium. Given the large number ofthese stars present in a relatively small volume, it may beexpected that the combination of their powerful winds gaverise to complex kinematical components in both permittedand forbidden lines. Also multiple supernova events havebeen invoked as the possible cause (see Roy et al. 1992, forthe case of NGC 2363). However, some of these massive starslike Luminous Blue Variables (LBV), can be so luminous asto be capable of producing visible effects by themselves par-ticularly in nearby resolved system and some of them mayeven end their lives as supernovae hence dominating for sometime the galaxy luminosity output. This evolutionary pathmay be the one followed by the most massive stars of lowmetallicity for which the inefficiency of line-driven stellarwinds would translate in a low mass-loss rate and failurein becoming a WR star. Some of these stars might be theprogenitors of type IIn supernovae in which the narrow linespectrum arises from the interaction of the supernova blastwave with the circumstellar shell. These supernovae can bevery luminous and also very long lived (Aretxaga et al. 1999;Smith et al. 2007).
Another mechanism accounting for the presence of lowintensity broad line components in HII galaxies or BCGspectra may be mass accretion onto an intermediate-massblack hole (103 - 105 M�). Up to now there are no bona fidelow metallicity objects (about one tenth of solar) harbour-ing massive black holes. In fact, it is intrinsically difficultto identify these objects in commonly used diagnostic dia-grams (e.g. Stasinska et al. 2006). The overlapping of theirbroad component Hα luminosities and those of supernovaeand even stellar winds, makes this identification even harder.Yet, from the point of view of galactic evolution to firmly es-tablish the existence of these objects would be of the greatest
importance. In this sense the detection of X rays emissionwould be a major discriminant.
In this work we analyse recently obtained moderate tohigh resolution spectra of PHL 293B which is a low lumi-nosity, low metallicity HII galaxy that shows low intensitybroad wings and blue shifted narrow absorptions in the hy-drogen recombination lines, in order to try to shed somelight on their origin. §2 gives a description of the data, §3presents the results obtained from them and §4 is devotedto their analysis. A discussion is presented in §5 and theconclusions of our work are given in §6.
2 DESCRIPTION OF THE DATA
PHL 293B , also known as HL 293B, Kinman’s dwarf,A2228-00 and SDSS J223036.79-000636.9 is a very low lu-minosity galaxy (MB = -14.37; Cairos et al. 2001) at a dis-tance of 23.1 Mpc obtained from the radial velocity (Mouldet al. 2000) taken from NASA/IPAC Extragalactic Database(NED) corrected for Virgo Infall, Great Attractor and Shap-ley, with a Hubble constant of 73 km s−1 Mpc−1. Its metal-licity was first measured by French (1980) who gave a valueof 12+log(O/H) = 7.78 and, more recently, by Izotov, Thuan& Stasinska (2007) who derive a value of 12+log(O/H) =7.66 from SDSS data.
2.1 Spectroscopic data
We have compiled spectroscopic data of PHL 293B for 4 dif-ferent epochs spanning more than 10 years. Archival spectro-scopic data have been extracted from DR7 of the Sloan Dig-ital Sky Survey (Abazajian et al. 2009), SDSS(J223036.79-000636.9); ESO VLT-UVES [Programme ID 70.B-0717(A)];Science Verification (SV) VLT-X-shooter [ESO program60.A-9442(A)]. To these data we have added new observa-tions obtained with the ISIS spectrograph attached to the4.2m WHT at the Observatorio del Roque de los Muchachosin the island of La Palma (Spain).
The data from SDSS were taken on the 22nd of Au-gust 2001 and cover the spectral range from 3800 to 9200Aat a resolution R = 1800-2200. The UVES data were ob-tained on the 18th of November 2002 in both the blue andred arms covering a total wavelength range from 3100 to6800 A with 0.2 A spectral resolution. X-shooter (Vernet2011) observations were performed during Science Verifica-tion on the nights of the 16th August and 28th September2009. The data simultaneously cover the spectral range fromUV(∼ 3000 A) to K′ (∼2.5µm) and were reduced using theESO Recipe Execution Tool (EsoRex) following standardprocedures with minor adaptations for these SV data.
ISIS data were obtained on the 30th of November 2011using an EEV12 detector attached to the blue arm of thespectrograph. The R300B grating was used covering the un-vignetted wavelength range 4800-7200 A (centred at λc =6000 A), giving a spectral dispersion of 0.86 A/pixel whichcombined with a slit width of 1 arcsec yields a resolutionof about 3.4 A. The observations were made at paralacticangle, at an airmass of 1.3 and with a seeing of 0.5 arcsec.Several bias and sky flat-field frames were taken at the begin-ning and at the end of the night. In addition, two lamp flat-fields, before and after the observation, and one calibration
c© 2014 RAS, MNRAS 000, 1–15
FeII absorptions 3
lamp exposure were performed. The calibration lamp usedwas CuNe+CuAr. The spectra were processed and analysedwith IRAF routines1 following standard procedures that in-clude removal of cosmic rays, bias subtraction, division by anormalized flat-field and wavelength calibration. In the laststep, the spectra were corrected for atmospheric extinctionand flux calibrated. Four standard star observations wereused: BD+17 4708, Wolf1346, G191B2B and Feige34 allow-ing a good spectrophotometric calibration with an estimatedaccuracy of about 5 per cent.
2.2 Photometric data
The photometric optical data was compiled from 3 differ-ent sources: the Catalina Sky Survey (CSS) second release(Drake et al. 2009) provides for PHL 293B , accurate magni-tudes for 80 nights from April 2005 to October 2012. Mostnights have 4 different observations inside one hour totalobserving time. In addition, the SDSS provides photomet-ric parameters for the night of 22/08/2001, and Cairos etal. (2001) published their photometry for PHL 293B ob-tained in October 1988 with the 3.5m telescope of the CalarAlto Observatory (Spain). Kinman (1965) provides the ear-liest brightness estimates based on the Palomar Sky Survey(PSS) plates and photographic images taken with the LickObservatory 20-inch Astrograph in 1949 and 1965 and atthe prime focus of the Lick 120-inch telescope.
PHL 293B was observed also using the ACIS-S cameraon board the Chandra X-rays observatory in 2009 septem-ber 25th. Data cover the energy range 0.4 - 10 keV and theexposure time was about 7.7 ks (ObsID 11294).
3 RESULTS
3.1 Spectroscopy
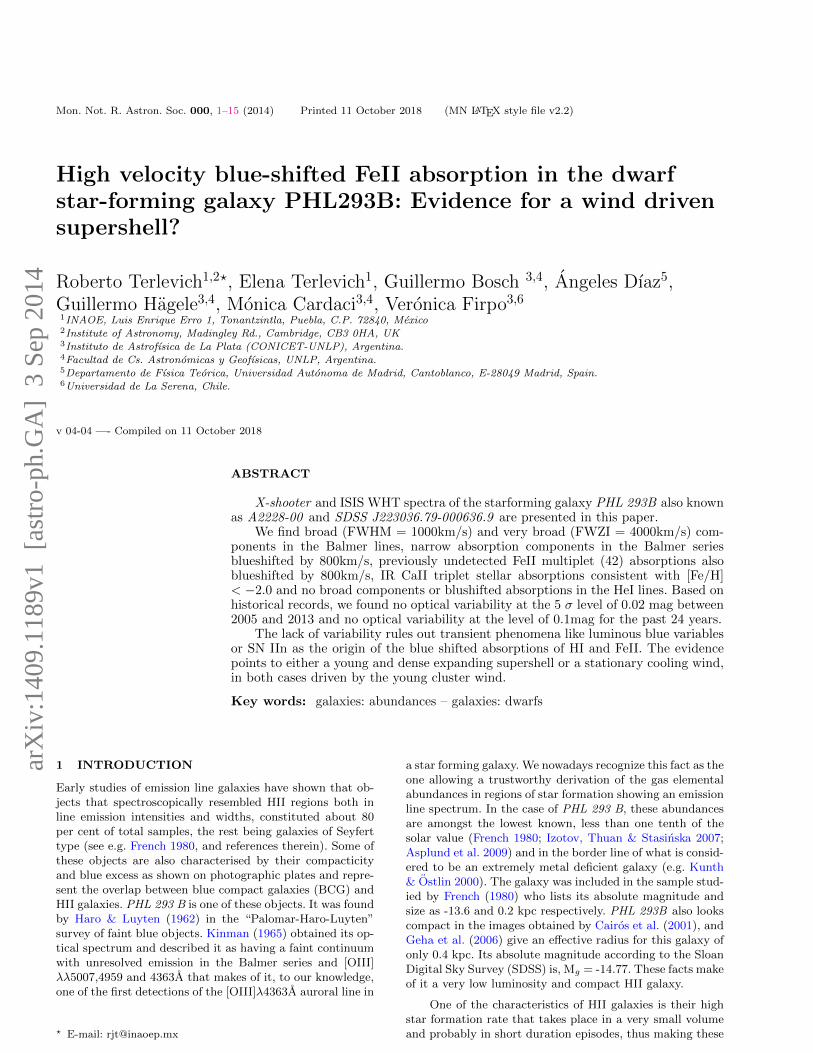
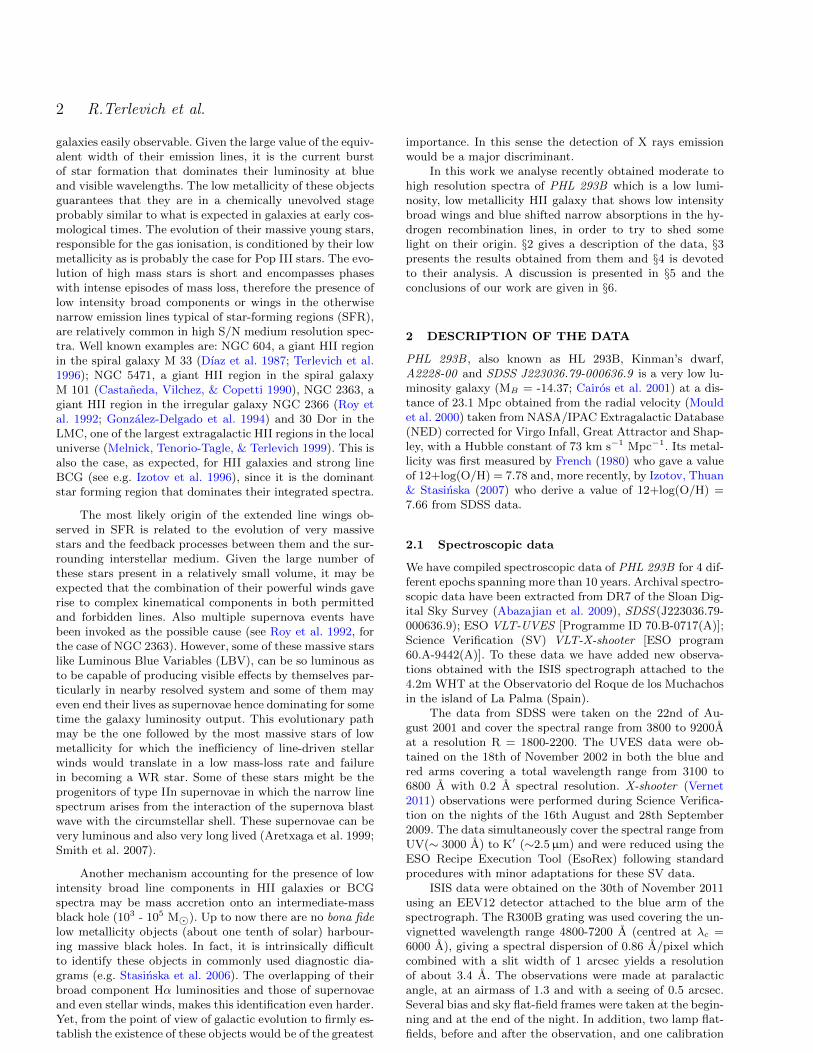
The blue to visual spectrum of PHL 293B shows the usualstrong emission lines found in star-forming galaxies: recom-bination lines from hydrogen and helium and collisionallyexcited lines of different ions: [OII], [OIII], [NII], [SII], [SIII],etc. The most striking feature of the spectral lines is thepresence of broad components in the hydrogen recombina-tion lines, already reported by Izotov et al. (2007), which areundetected in the corresponding helium lines. These broadcomponents that can be seen in Figures 1 through 5 forthe Balmer lines: Hα, Hβ, Hγ and Hδ, have FWHM be-tween 1000 and 400 km/s (Izotov & Thuan 2009; Izotov etal. 2011) and relatively low intensities. They are redshiftedby about 50 km/s with respect to the narrow emission linesreference frame as determined by the centroid of the [OIII]λ 4959 A line. Figure 2 shows a detail of the multigaussianfit performed on the X-shooter spectrum Hα profile. Detailsof measurements performed in SDSS and X-shooter spectraare listed in Tables 1 and 2, using the normal notation for
1 IRAF: the Image Reduction and Analysis Facility is distributed
by the National Optical Astronomy Observatories, which is oper-ated by the Association of Universities for Research in Astronomy,Inc. (AURA) under cooperative agreement with the National Sci-
ence Foundation (NSF).
equivalent widths as positive for lines in absorption, nega-tive for emission. In what follows, we will call the referenceframe defined by the [OIII] λ 4959 A line, the galaxy refer-ence frame. The fluxes in the narrow component of Hα andHβ (measured from the SDSS spectrum) are 4.86 and 1.54× 10⁻¹⁴ erg s−1 cm−2 respectively and the ratio of broad tonarrow components in both lines is about 0.25.
Errors in measurements depend strongly on flux uncer-tainties. Individual errors are determined from profile fittingroutines. These errors rely on a good determination of er-rors present in the spectra, which is directly obtained for theSDSS spectra and had to be modeled for the X-shooter data.They are below 1% for radial velocity and 10% for dispersiondeterminations in strong narrow line profiles but can raise totens of km s−1for broader components. Uncertainties in fluxrange from 3% in strong lines and/or components but cangrow up to 20% in weak absorption lines. Equivalent widthsshare a few percent to 20% uncertainty based on relativelylow counts level for the continuum flux.
From the X-shooter data the measured narrow line Hαand Hβ fluxes are 2 and 0.66× 10⁻¹⁴ erg s−1 cm−2, respec-tively. The ratio Hα/Hβ between the narrow line compo-nents is the same in both spectra within the observationalerrors. The ratio between the narrow and broad componentsfor these lines are also the same within the observationalerrors. Hence the differences in the flux measurements be-tween the SDSS and the X-shooter spectra can be attributedto aperture effects. Since the aperture used for the SDSS ob-servations is larger than the one used for the X-shooter one,we hereafter use the SDSS measurements for the line fluxesand EWs. Additional features of the Balmer lines are anultra-broad component with FWZI ∼ 4000Km/s redshiftedby about 500 km/s and a P Cygni like absorption blueshiftedby 800 km/s with respect to the reference frame (see table2).
To summarise, the complex Hα line profile shows a nar-row component at the galaxy reference frame, a broad com-ponent FWHM ∼ 1000 km/s redshifted by about 50 km/swith respect to the galaxy reference frame, an ultra-broadcomponent with FWZI ∼ 4000 km/s redshifted by about500 km/s and a P Cygni like narrow absorption blueshiftedby 800 km/s.
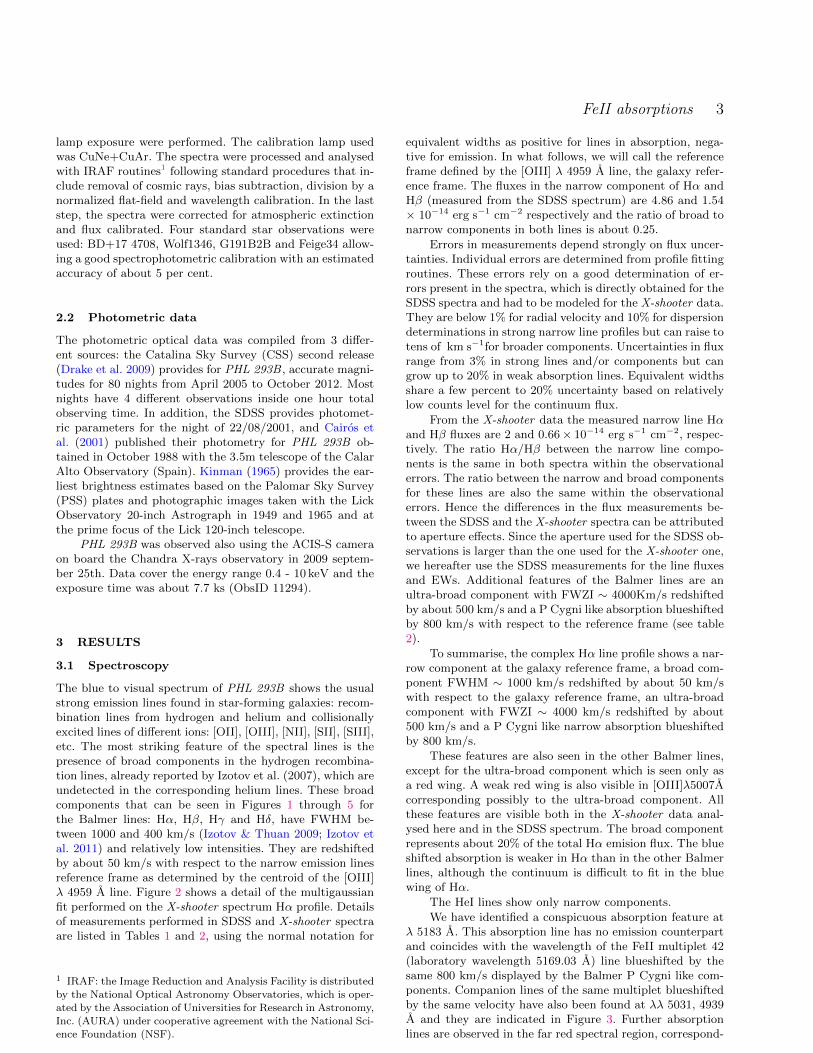
These features are also seen in the other Balmer lines,except for the ultra-broad component which is seen only asa red wing. A weak red wing is also visible in [OIII]λ5007Acorresponding possibly to the ultra-broad component. Allthese features are visible both in the X-shooter data anal-ysed here and in the SDSS spectrum. The broad componentrepresents about 20% of the total Hα emision flux. The blueshifted absorption is weaker in Hα than in the other Balmerlines, although the continuum is difficult to fit in the bluewing of Hα.
The HeI lines show only narrow components.
We have identified a conspicuous absorption feature atλ 5183 A. This absorption line has no emission counterpartand coincides with the wavelength of the FeII multiplet 42(laboratory wavelength 5169.03 A) line blueshifted by thesame 800 km/s displayed by the Balmer P Cygni like com-ponents. Companion lines of the same multiplet blueshiftedby the same velocity have also been found at λλ 5031, 4939A and they are indicated in Figure 3. Further absorptionlines are observed in the far red spectral region, correspond-
c© 2014 RAS, MNRAS 000, 1–15
4 R.Terlevich et al.
Figure 1. X-shooter spectrum showing the line profile aroundHα. Here and in the following spectra, flux is measured in
erg s−1 cm−2.
Figure 2. X-shooter spectrum showing the multi Gaussian fit
performed to the Hα line profile. Four components are clearly
identified: a blue wing absorption blueshifted by 800 km s−1,a strong narrow component, a strong broad component and a
relatively fainter ultra broad component, redshifted by 900 kms−1. The narrow spike at λ6620 A is an artifact from the reductionprocess and discarded during profile fitting.
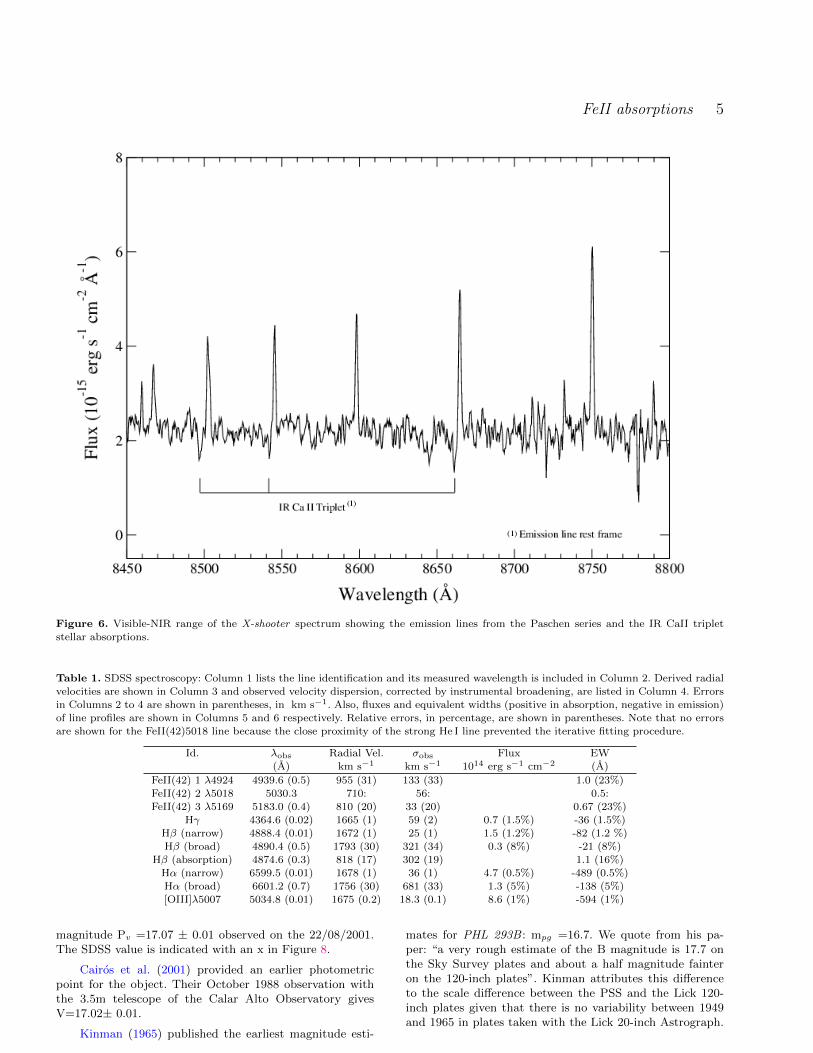
ing to the CaII triplet (CaT) lines at λλ 8498, 8542, 8662A in the galaxy rest frame (see Figure 6). Although theselines, being close to the left of the adjacent Paschen lines atλλ 8505, 8548, 8667 A, can mimic P Cygni profiles, the CaIIlines are clearly separated from the Paschen ones. Further-more, there is no hint of a P Cygni like component in the λ8601 A Paschen line.
Although the X-shooter infrared spectrum is not a verygood one, we can identify hydrogen recombination lines ofthe Paschen and Brackett series, HeI lines and a hint of theH2 line at 2.122 µm rest frame. There is no evidence forbroad components or P Cygni like profiles in any of theselines.
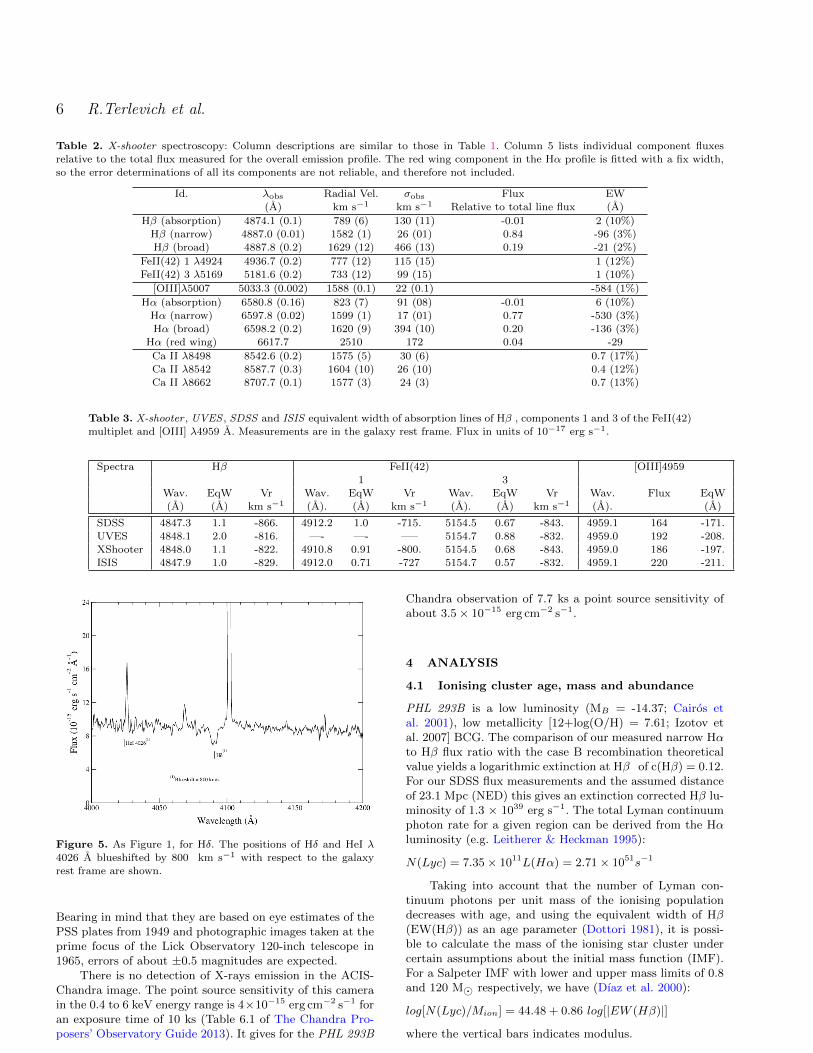
The WHT-ISIS spectrum covering from λ4300 A to
Figure 3. Same as Fig. 1, for the Hβ, [OIII] λ5007A region. Notethe possibly very broad blue wing in [OIII]. The position of the
FeII multiplet 42 blueshifted by 800 km s−1with respect to the
galaxy rest frame is shown.
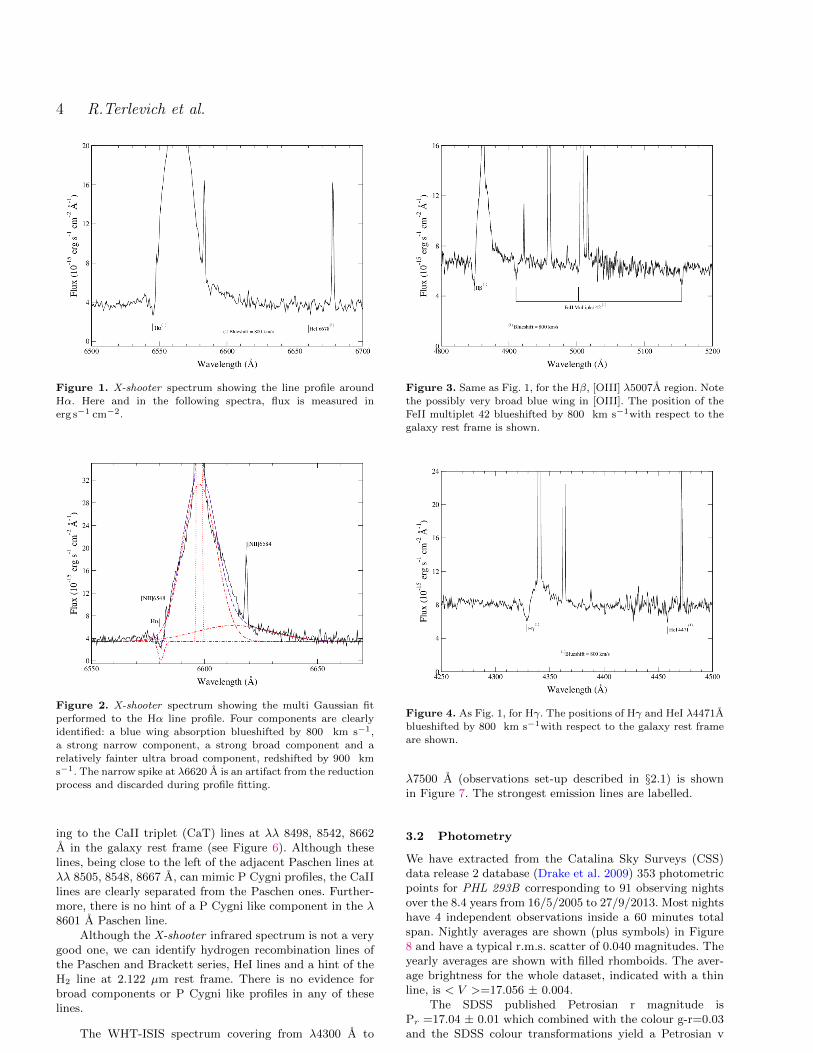
Figure 4. As Fig. 1, for Hγ. The positions of Hγ and HeI λ4471A
blueshifted by 800 km s−1with respect to the galaxy rest frame
are shown.
λ7500 A (observations set-up described in §2.1) is shownin Figure 7. The strongest emission lines are labelled.
3.2 Photometry
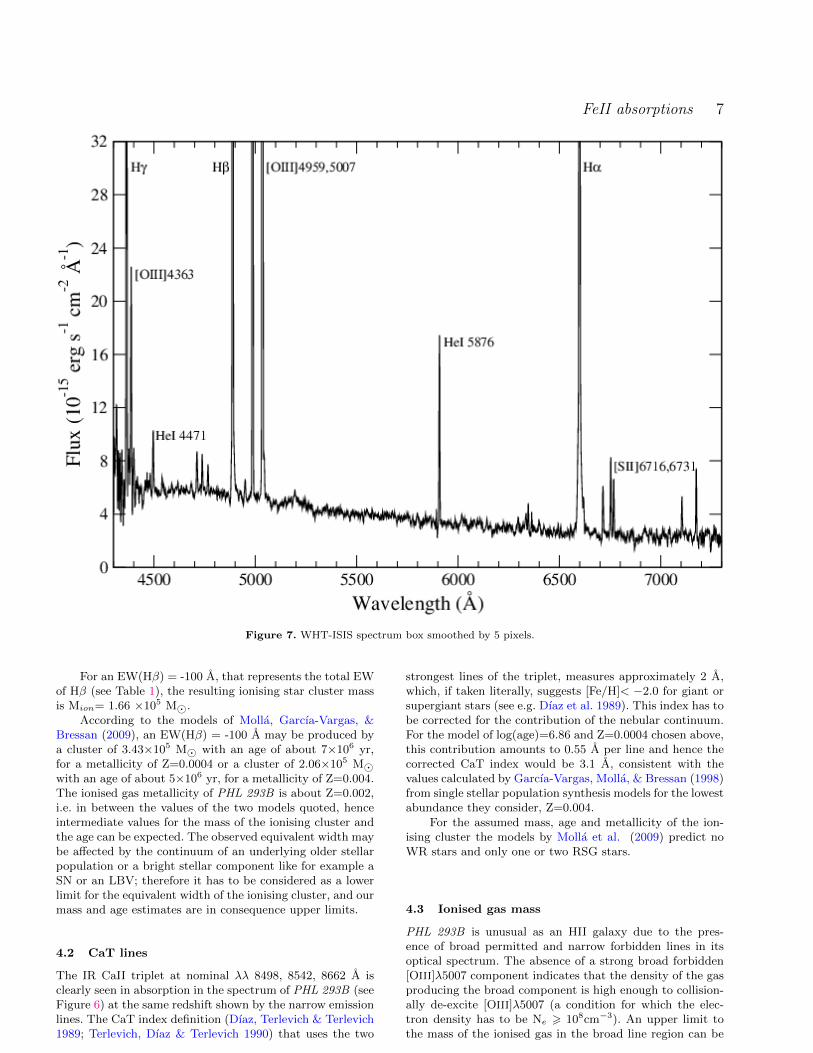
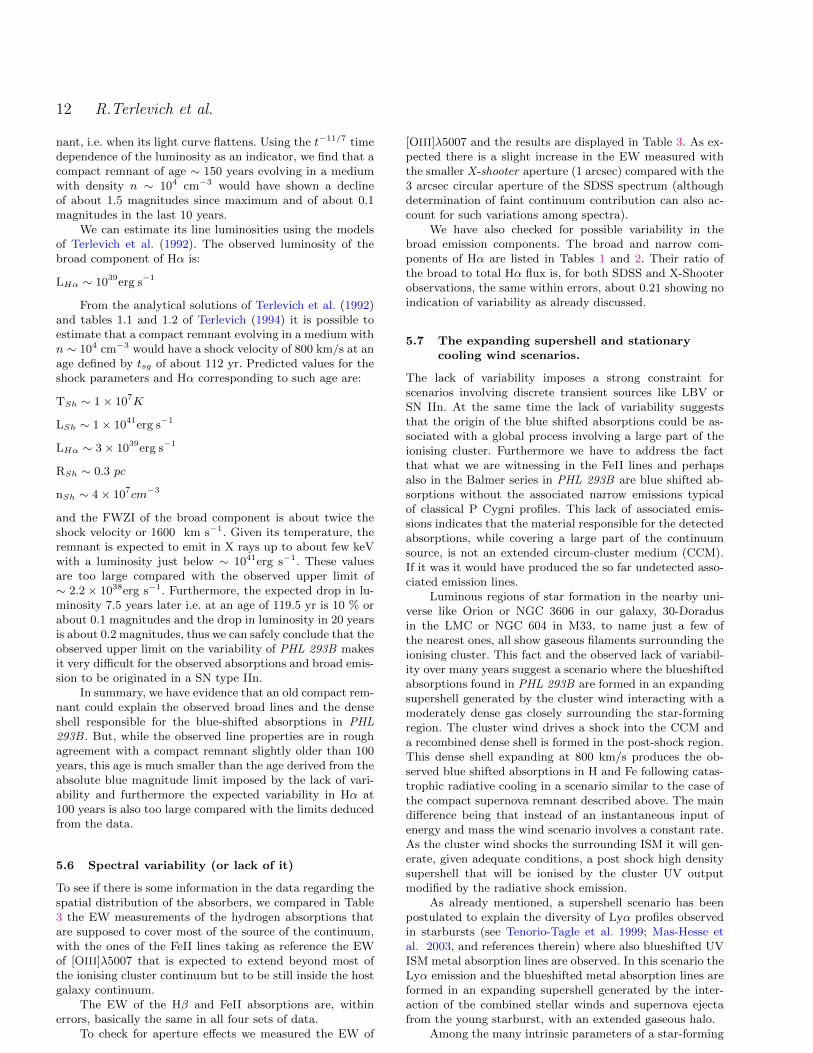
We have extracted from the Catalina Sky Surveys (CSS)data release 2 database (Drake et al. 2009) 353 photometricpoints for PHL 293B corresponding to 91 observing nightsover the 8.4 years from 16/5/2005 to 27/9/2013. Most nightshave 4 independent observations inside a 60 minutes totalspan. Nightly averages are shown (plus symbols) in Figure8 and have a typical r.m.s. scatter of 0.040 magnitudes. Theyearly averages are shown with filled rhomboids. The aver-age brightness for the whole dataset, indicated with a thinline, is < V >=17.056 ± 0.004.
The SDSS published Petrosian r magnitude isPr =17.04 ± 0.01 which combined with the colour g-r=0.03and the SDSS colour transformations yield a Petrosian v
c© 2014 RAS, MNRAS 000, 1–15
FeII absorptions 5
Figure 6. Visible-NIR range of the X-shooter spectrum showing the emission lines from the Paschen series and the IR CaII tripletstellar absorptions.
Table 1. SDSS spectroscopy: Column 1 lists the line identification and its measured wavelength is included in Column 2. Derived radial
velocities are shown in Column 3 and observed velocity dispersion, corrected by instrumental broadening, are listed in Column 4. Errors
in Columns 2 to 4 are shown in parentheses, in km s−1. Also, fluxes and equivalent widths (positive in absorption, negative in emission)of line profiles are shown in Columns 5 and 6 respectively. Relative errors, in percentage, are shown in parentheses. Note that no errors
are shown for the FeII(42)5018 line because the close proximity of the strong He I line prevented the iterative fitting procedure.
Id. λobs Radial Vel. σobs Flux EW
(A) km s−1 km s−1 1014 erg s−1 cm−2 (A)
FeII(42) 1 λ4924 4939.6 (0.5) 955 (31) 133 (33) 1.0 (23%)FeII(42) 2 λ5018 5030.3 710: 56: 0.5:
FeII(42) 3 λ5169 5183.0 (0.4) 810 (20) 33 (20) 0.67 (23%)
Hγ 4364.6 (0.02) 1665 (1) 59 (2) 0.7 (1.5%) -36 (1.5%)Hβ (narrow) 4888.4 (0.01) 1672 (1) 25 (1) 1.5 (1.2%) -82 (1.2 %)
Hβ (broad) 4890.4 (0.5) 1793 (30) 321 (34) 0.3 (8%) -21 (8%)Hβ (absorption) 4874.6 (0.3) 818 (17) 302 (19) 1.1 (16%)
Hα (narrow) 6599.5 (0.01) 1678 (1) 36 (1) 4.7 (0.5%) -489 (0.5%)
Hα (broad) 6601.2 (0.7) 1756 (30) 681 (33) 1.3 (5%) -138 (5%)[OIII]λ5007 5034.8 (0.01) 1675 (0.2) 18.3 (0.1) 8.6 (1%) -594 (1%)
magnitude Pv =17.07 ± 0.01 observed on the 22/08/2001.The SDSS value is indicated with an x in Figure 8.
Cairos et al. (2001) provided an earlier photometricpoint for the object. Their October 1988 observation withthe 3.5m telescope of the Calar Alto Observatory givesV=17.02± 0.01.
Kinman (1965) published the earliest magnitude esti-
mates for PHL 293B : mpg =16.7. We quote from his pa-per: “a very rough estimate of the B magnitude is 17.7 onthe Sky Survey plates and about a half magnitude fainteron the 120-inch plates”. Kinman attributes this differenceto the scale difference between the PSS and the Lick 120-inch plates given that there is no variability between 1949and 1965 in plates taken with the Lick 20-inch Astrograph.
c© 2014 RAS, MNRAS 000, 1–15
6 R.Terlevich et al.
Table 2. X-shooter spectroscopy: Column descriptions are similar to those in Table 1. Column 5 lists individual component fluxes
relative to the total flux measured for the overall emission profile. The red wing component in the Hα profile is fitted with a fix width,so the error determinations of all its components are not reliable, and therefore not included.
Id. λobs Radial Vel. σobs Flux EW
(A) km s−1 km s−1 Relative to total line flux (A)
Hβ (absorption) 4874.1 (0.1) 789 (6) 130 (11) -0.01 2 (10%)
Hβ (narrow) 4887.0 (0.01) 1582 (1) 26 (01) 0.84 -96 (3%)
Hβ (broad) 4887.8 (0.2) 1629 (12) 466 (13) 0.19 -21 (2%)
FeII(42) 1 λ4924 4936.7 (0.2) 777 (12) 115 (15) 1 (12%)
FeII(42) 3 λ5169 5181.6 (0.2) 733 (12) 99 (15) 1 (10%)
[OIII]λ5007 5033.3 (0.002) 1588 (0.1) 22 (0.1) -584 (1%)
Hα (absorption) 6580.8 (0.16) 823 (7) 91 (08) -0.01 6 (10%)Hα (narrow) 6597.8 (0.02) 1599 (1) 17 (01) 0.77 -530 (3%)
Hα (broad) 6598.2 (0.2) 1620 (9) 394 (10) 0.20 -136 (3%)Hα (red wing) 6617.7 2510 172 0.04 -29
Ca II λ8498 8542.6 (0.2) 1575 (5) 30 (6) 0.7 (17%)
Ca II λ8542 8587.7 (0.3) 1604 (10) 26 (10) 0.4 (12%)Ca II λ8662 8707.7 (0.1) 1577 (3) 24 (3) 0.7 (13%)
Table 3. X-shooter , UVES , SDSS and ISIS equivalent width of absorption lines of Hβ , components 1 and 3 of the FeII(42)multiplet and [OIII] λ4959 A. Measurements are in the galaxy rest frame. Flux in units of 10−17 erg s−1.
Spectra Hβ FeII(42) [OIII]4959
1 3Wav. EqW Vr Wav. EqW Vr Wav. EqW Vr Wav. Flux EqW(A) (A) km s−1 (A). (A) km s−1 (A). (A) km s−1 (A). (A)
SDSS 4847.3 1.1 -866. 4912.2 1.0 -715. 5154.5 0.67 -843. 4959.1 164 -171.
UVES 4848.1 2.0 -816. —- —- —– 5154.7 0.88 -832. 4959.0 192 -208.XShooter 4848.0 1.1 -822. 4910.8 0.91 -800. 5154.5 0.68 -843. 4959.0 186 -197.ISIS 4847.9 1.0 -829. 4912.0 0.71 -727 5154.7 0.57 -832. 4959.1 220 -211.
Figure 5. As Figure 1, for Hδ. The positions of Hδ and HeI λ
4026 A blueshifted by 800 km s−1 with respect to the galaxyrest frame are shown.
Bearing in mind that they are based on eye estimates of thePSS plates from 1949 and photographic images taken at theprime focus of the Lick Observatory 120-inch telescope in1965, errors of about ±0.5 magnitudes are expected.
There is no detection of X-rays emission in the ACIS-Chandra image. The point source sensitivity of this camerain the 0.4 to 6 keV energy range is 4×10⁻¹⁵ erg cm−2 s−1 foran exposure time of 10 ks (Table 6.1 of The Chandra Pro-posers’ Observatory Guide 2013). It gives for the PHL 293B
Chandra observation of 7.7 ks a point source sensitivity ofabout 3.5× 10⁻¹⁵ erg cm−2 s−1.
4 ANALYSIS
4.1 Ionising cluster age, mass and abundance
PHL 293B is a low luminosity (MB = -14.37; Cairos etal. 2001), low metallicity [12+log(O/H) = 7.61; Izotov etal. 2007] BCG. The comparison of our measured narrow Hαto Hβ flux ratio with the case B recombination theoreticalvalue yields a logarithmic extinction at Hβ of c(Hβ) = 0.12.For our SDSS flux measurements and the assumed distanceof 23.1 Mpc (NED) this gives an extinction corrected Hβ lu-minosity of 1.3 × 1039 erg s−1. The total Lyman continuumphoton rate for a given region can be derived from the Hαluminosity (e.g. Leitherer & Heckman 1995):
N(Lyc) = 7.35× 10¹¹L(Hα) = 2.71× 1051s−1
Taking into account that the number of Lyman con-tinuum photons per unit mass of the ionising populationdecreases with age, and using the equivalent width of Hβ(EW(Hβ)) as an age parameter (Dottori 1981), it is possi-ble to calculate the mass of the ionising star cluster undercertain assumptions about the initial mass function (IMF).For a Salpeter IMF with lower and upper mass limits of 0.8and 120 M� respectively, we have (Dıaz et al. 2000):
log[N(Lyc)/Mion] = 44.48 + 0.86 log[|EW (Hβ)|]
where the vertical bars indicates modulus.
c© 2014 RAS, MNRAS 000, 1–15
FeII absorptions 7
Figure 7. WHT-ISIS spectrum box smoothed by 5 pixels.
For an EW(Hβ) = -100 A, that represents the total EWof Hβ (see Table 1), the resulting ionising star cluster massis Mion= 1.66 ×10⁵ M�.
According to the models of Molla, Garcıa-Vargas, &Bressan (2009), an EW(Hβ) = -100 A may be produced bya cluster of 3.43×10⁵ M� with an age of about 7×10⁶ yr,for a metallicity of Z=0.0004 or a cluster of 2.06×10⁵ M�with an age of about 5×10⁶ yr, for a metallicity of Z=0.004.The ionised gas metallicity of PHL 293B is about Z=0.002,i.e. in between the values of the two models quoted, henceintermediate values for the mass of the ionising cluster andthe age can be expected. The observed equivalent width maybe affected by the continuum of an underlying older stellarpopulation or a bright stellar component like for example aSN or an LBV; therefore it has to be considered as a lowerlimit for the equivalent width of the ionising cluster, and ourmass and age estimates are in consequence upper limits.
4.2 CaT lines
The IR CaII triplet at nominal λλ 8498, 8542, 8662 A isclearly seen in absorption in the spectrum of PHL 293B (seeFigure 6) at the same redshift shown by the narrow emissionlines. The CaT index definition (Dıaz, Terlevich & Terlevich1989; Terlevich, Dıaz & Terlevich 1990) that uses the two
strongest lines of the triplet, measures approximately 2 A,which, if taken literally, suggests [Fe/H]< −2.0 for giant orsupergiant stars (see e.g. Dıaz et al. 1989). This index has tobe corrected for the contribution of the nebular continuum.For the model of log(age)=6.86 and Z=0.0004 chosen above,this contribution amounts to 0.55 A per line and hence thecorrected CaT index would be 3.1 A, consistent with thevalues calculated by Garcıa-Vargas, Molla, & Bressan (1998)from single stellar population synthesis models for the lowestabundance they consider, Z=0.004.
For the assumed mass, age and metallicity of the ion-ising cluster the models by Molla et al. (2009) predict noWR stars and only one or two RSG stars.
4.3 Ionised gas mass
PHL 293B is unusual as an HII galaxy due to the pres-ence of broad permitted and narrow forbidden lines in itsoptical spectrum. The absence of a strong broad forbidden[OIII]λ5007 component indicates that the density of the gasproducing the broad component is high enough to collision-ally de-excite [OIII]λ5007 (a condition for which the elec-tron density has to be Ne > 108cm−3). An upper limit tothe mass of the ionised gas in the broad line region can be
c© 2014 RAS, MNRAS 000, 1–15
8 R.Terlevich et al.
2001 2003 2005 2007 2009 2011 2013 2015Date (yr)
17.3
17.2
17.1
17.0
16.9
16.8
16.7
v (m
ag)
<-- X
Shoo
ter
<-- I
SIS
x
<-- S
DSS
<-- U
VES
Figure 8. PHL 293B CSS photometry from April 2005 to October 2013. There are 353 observations in 91 observing nights. Most
night results are made out of four independent observations. The average night magnitude is plotted with a plus sign. The 9 filled
rhomboids are the yearly averages. The horizontal line represents the average magnitude 17.056 ± 0.004. The x indicates the SDSSPetrosian g magnitude converted to v magnitudes. For older photometry see text. The labelled arrows show the dates corresponding to
the spectroscopy.
estimated using the observed L(Hα) (Macchetto et al. 1990)and the electron density lower limit,
M(HII) = 3.32× 10⁻³³L(Hα)/Ne
therefore,
M(HII)broad comp . 3× 10⁻²M�
The ionized gas mass of the narrow line region is, as-suming an electron density of 100 cm−3 (derived from the[SII] doublet ratio in our ISIS data),
M(HII)narrow comp ∼ 1.22× 10⁵M�
similar to the ionising star cluster mass determined in §4.1.
4.4 Photometric Variability (or lack of it)
From the nightly averaged data (pluses) in Figure 8 no vari-ability is detected. Dividing the data into 9 groups of oneyear duration each (filled diamonds in the same figure) re-duces the r.m.s. scatter to 0.009 per group as expected fora non variable sample and again no systematic trend in theluminosity is apparent; furthermore a cursory analysis indi-cates that there is no periodic variation.
Based on the CSS data we can infer that at 3 σ level anylong term variability, i.e. over a few years, cannot be largerthan 0.02 magnitudes and that any medium term variability,i.e. over a few months, should be less than 0.04 magnitudes.Further still, including the data from Cairos et al. (2001),
Kinman (1965) and SDSS we can safely conclude that thereis no variability at the level of few tenths of magnitude overa period of 25 years.
5 DISCUSSION
5.1 P Cygni profiles
To generate relatively narrow P Cygni like absorption pro-files such as the ones observed in PHL 293B , the absorbingmaterial must cover a substantial fraction of the continuumsource, in this case a young stellar cluster several parsecsin size. These absorptions may be produced in an expand-ing dense supershell created by the interaction of combinedstellar winds with the circumcluster medium. An expandingsupershell has been postulated to explain the blueshiftedmetal absorption detected in the UV spectrum of severalnearby and high redshift HII galaxies (Tenorio-Tagle et al.1999; Mas-Hesse et al. 2003).
Alternatively the observed blueshifted narrow absorp-tions could be associated with a single star in a very lumi-nous transient phase like an LBV or a SN IIn.
5.2 P Cygni profiles and the HeI lines
The possibility that the P Cygni like profiles in PHL 293Bare originated in the powerful wind of an LBV has beenextensively discussed by Izotov et al. (2011). These authors
c© 2014 RAS, MNRAS 000, 1–15
FeII absorptions 9
suggested that the absorptions seen at λ 4939 A and λ5031Aare in fact the blue shifted absorptions associated with theHeI lines at rest wavelengths λ4921 A and λ5016 A in ac-cordance with the P Cygni profile of the Balmer lines.
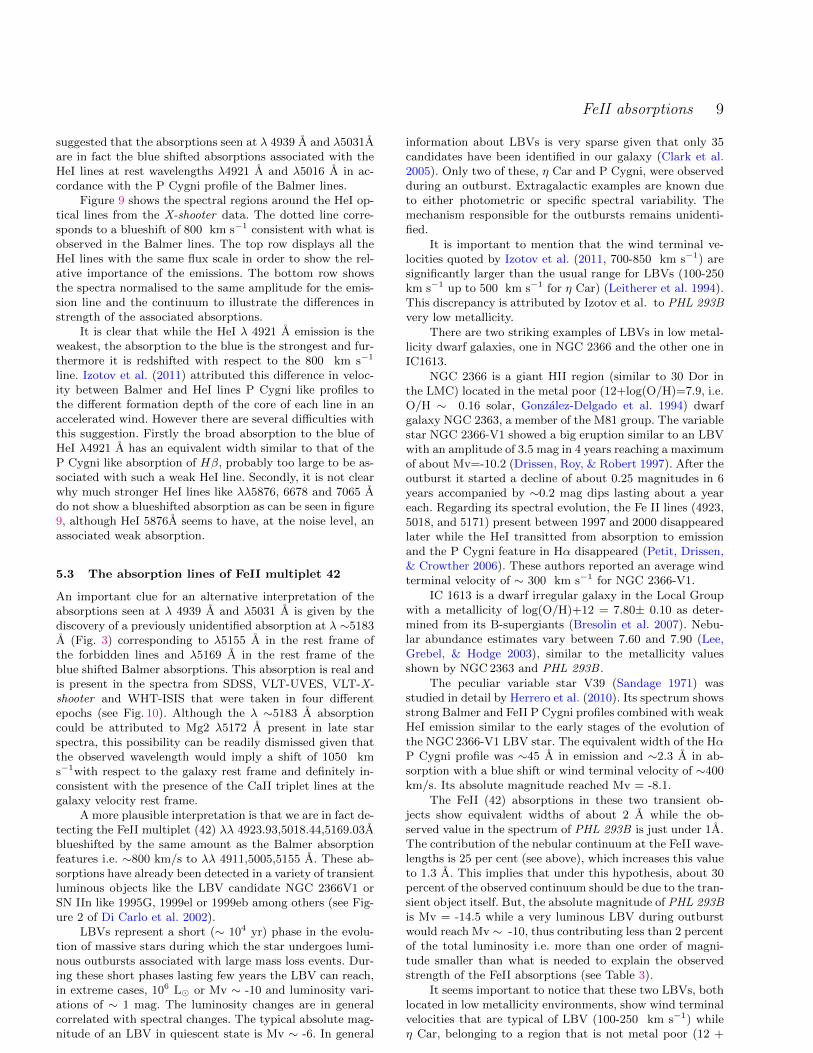
Figure 9 shows the spectral regions around the HeI op-tical lines from the X-shooter data. The dotted line corre-sponds to a blueshift of 800 km s−1 consistent with what isobserved in the Balmer lines. The top row displays all theHeI lines with the same flux scale in order to show the rel-ative importance of the emissions. The bottom row showsthe spectra normalised to the same amplitude for the emis-sion line and the continuum to illustrate the differences instrength of the associated absorptions.
It is clear that while the HeI λ 4921 A emission is theweakest, the absorption to the blue is the strongest and fur-thermore it is redshifted with respect to the 800 km s−1
line. Izotov et al. (2011) attributed this difference in veloc-ity between Balmer and HeI lines P Cygni like profiles tothe different formation depth of the core of each line in anaccelerated wind. However there are several difficulties withthis suggestion. Firstly the broad absorption to the blue ofHeI λ4921 A has an equivalent width similar to that of theP Cygni like absorption of Hβ, probably too large to be as-sociated with such a weak HeI line. Secondly, it is not clearwhy much stronger HeI lines like λλ5876, 6678 and 7065 Ado not show a blueshifted absorption as can be seen in figure9, although HeI 5876A seems to have, at the noise level, anassociated weak absorption.
5.3 The absorption lines of FeII multiplet 42
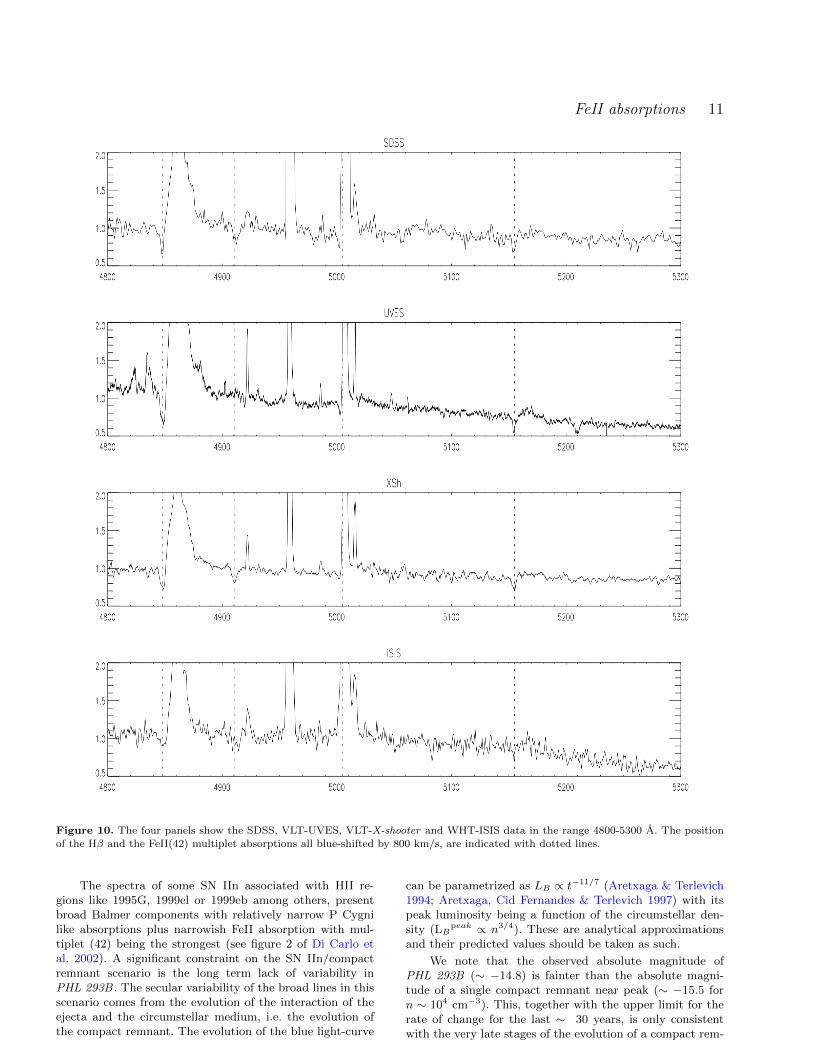
An important clue for an alternative interpretation of theabsorptions seen at λ 4939 A and λ5031 A is given by thediscovery of a previously unidentified absorption at λ ∼5183A (Fig. 3) corresponding to λ5155 A in the rest frame ofthe forbidden lines and λ5169 A in the rest frame of theblue shifted Balmer absorptions. This absorption is real andis present in the spectra from SDSS, VLT-UVES, VLT-X-shooter and WHT-ISIS that were taken in four differentepochs (see Fig. 10). Although the λ ∼5183 A absorptioncould be attributed to Mg2 λ5172 A present in late starspectra, this possibility can be readily dismissed given thatthe observed wavelength would imply a shift of 1050 kms−1with respect to the galaxy rest frame and definitely in-consistent with the presence of the CaII triplet lines at thegalaxy velocity rest frame.
A more plausible interpretation is that we are in fact de-tecting the FeII multiplet (42) λλ 4923.93,5018.44,5169.03Ablueshifted by the same amount as the Balmer absorptionfeatures i.e. ∼800 km/s to λλ 4911,5005,5155 A. These ab-sorptions have already been detected in a variety of transientluminous objects like the LBV candidate NGC 2366V1 orSN IIn like 1995G, 1999el or 1999eb among others (see Fig-ure 2 of Di Carlo et al. 2002).
LBVs represent a short (∼ 104 yr) phase in the evolu-tion of massive stars during which the star undergoes lumi-nous outbursts associated with large mass loss events. Dur-ing these short phases lasting few years the LBV can reach,in extreme cases, 106 L� or Mv ∼ -10 and luminosity vari-ations of ∼ 1 mag. The luminosity changes are in generalcorrelated with spectral changes. The typical absolute mag-nitude of an LBV in quiescent state is Mv ∼ -6. In general
information about LBVs is very sparse given that only 35candidates have been identified in our galaxy (Clark et al.2005). Only two of these, η Car and P Cygni, were observedduring an outburst. Extragalactic examples are known dueto either photometric or specific spectral variability. Themechanism responsible for the outbursts remains unidenti-fied.
It is important to mention that the wind terminal ve-locities quoted by Izotov et al. (2011, 700-850 km s−1) aresignificantly larger than the usual range for LBVs (100-250km s−1 up to 500 km s−1 for η Car) (Leitherer et al. 1994).This discrepancy is attributed by Izotov et al. to PHL 293Bvery low metallicity.
There are two striking examples of LBVs in low metal-licity dwarf galaxies, one in NGC 2366 and the other one inIC1613.
NGC 2366 is a giant HII region (similar to 30 Dor inthe LMC) located in the metal poor (12+log(O/H)=7.9, i.e.O/H ∼ 0.16 solar, Gonzalez-Delgado et al. 1994) dwarfgalaxy NGC 2363, a member of the M81 group. The variablestar NGC 2366-V1 showed a big eruption similar to an LBVwith an amplitude of 3.5 mag in 4 years reaching a maximumof about Mv=-10.2 (Drissen, Roy, & Robert 1997). After theoutburst it started a decline of about 0.25 magnitudes in 6years accompanied by ∼0.2 mag dips lasting about a yeareach. Regarding its spectral evolution, the Fe II lines (4923,5018, and 5171) present between 1997 and 2000 disappearedlater while the HeI transitted from absorption to emissionand the P Cygni feature in Hα disappeared (Petit, Drissen,& Crowther 2006). These authors reported an average windterminal velocity of ∼ 300 km s−1 for NGC 2366-V1.
IC 1613 is a dwarf irregular galaxy in the Local Groupwith a metallicity of log(O/H)+12 = 7.80± 0.10 as deter-mined from its B-supergiants (Bresolin et al. 2007). Nebu-lar abundance estimates vary between 7.60 and 7.90 (Lee,Grebel, & Hodge 2003), similar to the metallicity valuesshown by NGC 2363 and PHL 293B .
The peculiar variable star V39 (Sandage 1971) wasstudied in detail by Herrero et al. (2010). Its spectrum showsstrong Balmer and FeII P Cygni profiles combined with weakHeI emission similar to the early stages of the evolution ofthe NGC 2366-V1 LBV star. The equivalent width of the HαP Cygni profile was ∼45 A in emission and ∼2.3 A in ab-sorption with a blue shift or wind terminal velocity of ∼400km/s. Its absolute magnitude reached Mv = -8.1.
The FeII (42) absorptions in these two transient ob-jects show equivalent widths of about 2 A while the ob-served value in the spectrum of PHL 293B is just under 1A.The contribution of the nebular continuum at the FeII wave-lengths is 25 per cent (see above), which increases this valueto 1.3 A. This implies that under this hypothesis, about 30percent of the observed continuum should be due to the tran-sient object itself. But, the absolute magnitude of PHL 293Bis Mv = -14.5 while a very luminous LBV during outburstwould reach Mv ∼ -10, thus contributing less than 2 percentof the total luminosity i.e. more than one order of magni-tude smaller than what is needed to explain the observedstrength of the FeII absorptions (see Table 3).
It seems important to notice that these two LBVs, bothlocated in low metallicity environments, show wind terminalvelocities that are typical of LBV (100-250 km s−1) whileη Car, belonging to a region that is not metal poor (12 +
c© 2014 RAS, MNRAS 000, 1–15
10 R.Terlevich et al.
HeI 4471
4435 4460 44850.00
0.75
1.50
2.25
3.00HeI 4921
4885 4910 49350.00
0.75
1.50
2.25
3.00HeI 5016
4978 5003 50280.00
0.75
1.50
2.25
3.00HeI 5876
5835 5860 58850.00
0.75
1.50
2.25
3.00HeI 6678
6635 6660 66850.00
0.75
1.50
2.25
3.00HeI 7065
7020 7045 70700.00
0.75
1.50
2.25
3.00
HeI 4471
4435 4460 44850.60
1.15
1.70
2.25
2.80HeI 4921
4885 4910 49350.80
0.98
1.15
1.33
1.50HeI 5016
4978 5003 50280.60
0.95
1.30
1.65
2.00HeI 5876
5835 5860 5885-1.00
0.75
2.50
4.25
6.00HeI 6678
6635 6660 66850.0
0.5
1.0
1.5
2.0HeI 7065
7020 7045 70700.00
0.45
0.90
1.35
1.80
Figure 9. Spectral regions around the HeI optical lines from the X-shooter data. The dotted line corresponds to a blueshift of 800Km/s.Top row spectra are plotted with the same scale in flux to show the relative importance of the emissions. Bottom row shows the spectra
normalised to the same amplitude for the emission line and the continuum to illustrate the differences in the associated absorptions. See
text regarding the strong absorption to the blue of HeIλ 4921 A, shifted with respect to the 800 km s−1 line.
log O/H=8.36 ±0.03; Pilyugin, Ferrini, & Shkvarun 2003),has a larger wind terminal velocity (up to 500 km s−1) .
Wind velocities between 100 km/s and 1000 km/s arereported for transient events or “supernova impostors” thatcould be related to powerful eruptions of LBVs (Smith2011), and in a very interesting recent work Koss et al.(2014) report an unusual variable source in the nearby dwarfgalaxy MRK 177 (UGC 239) that they suggest can be ex-plained as an LBV eruption followed by a SN IIn like eventin 2001.
Naze, Rauw, & Hutsemekers (2012) discussed the X-rays properties of the Galactic LBVs. They found that theirX-ray luminosities in the 0.5-8 keV range are between ∼8 × 1029 and ∼ 4 × 1034 erg s−1. The estimated minimumluminosity for a point source to be detected in the ACIS-Chandra image of PHL 293B is about 2.2×1038 erg s−1 (seesection §3.2) about three orders of magnitud higher than thelargest reported values for Galactic objects.
5.4 Lack of optical variability
One fact supporting the hypothesis of the presence of a tran-sient object would be the detection of long term variabilityin the flux from PHL 293B . However, as stated in §4.4, wecan conclude that there is no variability at the level of a fewhundredths of magnitude over 25 years. This implies thatany long term variable component has to be fainter thanV =21.5. For a distance modulus (m-M)=31.8 this upper
limit means that any long term variable component has tobe fainter than MV =-10.5. However, this does not excludethe possibility that we are observing such a transient objectduring a non variable phase. The caveat in that case is that,if the variable component is that faint in relation with theionising cluster, it will be difficult to explain the observedstrength of the Balmer and FeII absorptions.
5.5 An old SN type IIn?
An alternative scenario for the broad lines and pseudoP Cygni profiles in PHL 293B is that they are originatedin an evolved SN type IIn. It is usually assumed that SN IInexplode inside the circumstellar material previously ejectedin the form of a slow dense wind by the red supergiant SNprogenitor. What is observed is the result of the interactionbetween the ejecta and this slowly expanding dense circum-stellar medium (CSM) which transforms the mechanical en-ergy of the ejecta into radiation. These events are knownas SN IIn or compact supernova remnants (see e.g. Chugai1991; Terlevich et al. 1992; Turatto 2003). In this interac-tion, radiative cooling can become catastrophic and theseremnants rapidly radiate most of the mechanical energy ina relatively short time scale and so they are highly luminous.The energy output is mostly in the extreme UV and X-rayregions of the spectrum. The optical continuum is a mixtureof young stars and the emission from the SN IIn with fastmoving high density gas producing the broad line emission.
c© 2014 RAS, MNRAS 000, 1–15
FeII absorptions 11
Figure 10. The four panels show the SDSS, VLT-UVES, VLT-X-shooter and WHT-ISIS data in the range 4800-5300 A. The positionof the Hβ and the FeII(42) multiplet absorptions all blue-shifted by 800 km/s, are indicated with dotted lines.
The spectra of some SN IIn associated with HII re-gions like 1995G, 1999el or 1999eb among others, presentbroad Balmer components with relatively narrow P Cygnilike absorptions plus narrowish FeII absorption with mul-tiplet (42) being the strongest (see figure 2 of Di Carlo etal. 2002). A significant constraint on the SN IIn/compactremnant scenario is the long term lack of variability inPHL 293B . The secular variability of the broad lines in thisscenario comes from the evolution of the interaction of theejecta and the circumstellar medium, i.e. the evolution ofthe compact remnant. The evolution of the blue light-curve
can be parametrized as LB ∝ t−11/7 (Aretxaga & Terlevich1994; Aretxaga, Cid Fernandes & Terlevich 1997) with itspeak luminosity being a function of the circumstellar den-sity (LB
peak ∝ n3/4). These are analytical approximationsand their predicted values should be taken as such.
We note that the observed absolute magnitude ofPHL 293B (∼ −14.8) is fainter than the absolute magni-tude of a single compact remnant near peak (∼ −15.5 forn ∼ 104 cm−3). This, together with the upper limit for therate of change for the last ∼ 30 years, is only consistentwith the very late stages of the evolution of a compact rem-
c© 2014 RAS, MNRAS 000, 1–15
12 R.Terlevich et al.
nant, i.e. when its light curve flattens. Using the t−11/7 timedependence of the luminosity as an indicator, we find that acompact remnant of age ∼ 150 years evolving in a mediumwith density n ∼ 104 cm−3 would have shown a declineof about 1.5 magnitudes since maximum and of about 0.1magnitudes in the last 10 years.
We can estimate its line luminosities using the modelsof Terlevich et al. (1992). The observed luminosity of thebroad component of Hα is:
LHα ∼ 1039erg s−1
From the analytical solutions of Terlevich et al. (1992)and tables 1.1 and 1.2 of Terlevich (1994) it is possible toestimate that a compact remnant evolving in a medium withn ∼ 104 cm−3 would have a shock velocity of 800 km/s at anage defined by tsg of about 112 yr. Predicted values for theshock parameters and Hα corresponding to such age are:
TSh ∼ 1× 10⁷K
LSh ∼ 1× 1041erg s−1
LHα ∼ 3× 1039erg s−1
RSh ∼ 0.3 pc
nSh ∼ 4× 107cm−3
and the FWZI of the broad component is about twice theshock velocity or 1600 km s−1. Given its temperature, theremnant is expected to emit in X rays up to about few keVwith a luminosity just below ∼ 1041erg s−1. These valuesare too large compared with the observed upper limit of∼ 2.2× 1038erg s−1. Furthermore, the expected drop in lu-minosity 7.5 years later i.e. at an age of 119.5 yr is 10 % orabout 0.1 magnitudes and the drop in luminosity in 20 yearsis about 0.2 magnitudes, thus we can safely conclude that theobserved upper limit on the variability of PHL 293B makesit very difficult for the observed absorptions and broad emis-sion to be originated in a SN type IIn.
In summary, we have evidence that an old compact rem-nant could explain the observed broad lines and the denseshell responsible for the blue-shifted absorptions in PHL293B . But, while the observed line properties are in roughagreement with a compact remnant slightly older than 100years, this age is much smaller than the age derived from theabsolute blue magnitude limit imposed by the lack of vari-ability and furthermore the expected variability in Hα at100 years is also too large compared with the limits deducedfrom the data.
5.6 Spectral variability (or lack of it)
To see if there is some information in the data regarding thespatial distribution of the absorbers, we compared in Table3 the EW measurements of the hydrogen absorptions thatare supposed to cover most of the source of the continuum,with the ones of the FeII lines taking as reference the EWof [OIII]λ5007 that is expected to extend beyond most ofthe ionising cluster continuum but to be still inside the hostgalaxy continuum.
The EW of the Hβ and FeII absorptions are, withinerrors, basically the same in all four sets of data.
To check for aperture effects we measured the EW of
[OIII]λ5007 and the results are displayed in Table 3. As ex-pected there is a slight increase in the EW measured withthe smaller X-shooter aperture (1 arcsec) compared with the3 arcsec circular aperture of the SDSS spectrum (althoughdetermination of faint continuum contribution can also ac-count for such variations among spectra).
We have also checked for possible variability in thebroad emission components. The broad and narrow com-ponents of Hα are listed in Tables 1 and 2. Their ratio ofthe broad to total Hα flux is, for both SDSS and X-Shooterobservations, the same within errors, about 0.21 showing noindication of variability as already discussed.
5.7 The expanding supershell and stationarycooling wind scenarios.
The lack of variability imposes a strong constraint forscenarios involving discrete transient sources like LBV orSN IIn. At the same time the lack of variability suggeststhat the origin of the blue shifted absorptions could be as-sociated with a global process involving a large part of theionising cluster. Furthermore we have to address the factthat what we are witnessing in the FeII lines and perhapsalso in the Balmer series in PHL 293B are blue shifted ab-sorptions without the associated narrow emissions typicalof classical P Cygni profiles. This lack of associated emis-sions indicates that the material responsible for the detectedabsorptions, while covering a large part of the continuumsource, is not an extended circum-cluster medium (CCM).If it was it would have produced the so far undetected asso-ciated emission lines.
Luminous regions of star formation in the nearby uni-verse like Orion or NGC 3606 in our galaxy, 30-Doradusin the LMC or NGC 604 in M33, to name just a few ofthe nearest ones, all show gaseous filaments surrounding theionising cluster. This fact and the observed lack of variabil-ity over many years suggest a scenario where the blueshiftedabsorptions found in PHL 293B are formed in an expandingsupershell generated by the cluster wind interacting with amoderately dense gas closely surrounding the star-formingregion. The cluster wind drives a shock into the CCM anda recombined dense shell is formed in the post-shock region.This dense shell expanding at 800 km/s produces the ob-served blue shifted absorptions in H and Fe following catas-trophic radiative cooling in a scenario similar to the case ofthe compact supernova remnant described above. The maindifference being that instead of an instantaneous input ofenergy and mass the wind scenario involves a constant rate.As the cluster wind shocks the surrounding ISM it will gen-erate, given adequate conditions, a post shock high densitysupershell that will be ionised by the cluster UV outputmodified by the radiative shock emission.
As already mentioned, a supershell scenario has beenpostulated to explain the diversity of Lyα profiles observedin starbursts (see Tenorio-Tagle et al. 1999; Mas-Hesse etal. 2003, and references therein) where also blueshifted UVISM metal absorption lines are observed. In this scenario theLyα emission and the blueshifted metal absorption lines areformed in an expanding supershell generated by the inter-action of the combined stellar winds and supernova ejectafrom the young starburst, with an extended gaseous halo.
Among the many intrinsic parameters of a star-forming
c© 2014 RAS, MNRAS 000, 1–15
FeII absorptions 13
region that can affect the properties of the observed emissionline profiles, velocity, density and ionisation distributions ofthe gas along the line of sight are by far the dominant ones.The expulsion of dust and gas from young clusters due to theaction of stellar winds and supernovae has been discussedby many authors (see for example Tutukov 1978; Goodwin& Bastian 2006; Bastian & Goodwin 2006) as well as theresultant cluster “infant mortality” effect (see for exampleGrosbøl & Dottori 2013).
The strength of a weak absorption line depends on itsoscillator strength f , its wavelength λ and column densityN. If the element is mostly in one ion state and there is noline saturation the relation between the column density Nand the EWλ is given by Morton (1991):
log(N) = log(EWλ/λ)− log(λf) + 20.053
From the X-shooter spectra of PHL 293B we have mea-sured EW = 0.91 A and 0.68 A for the FeII lines 4923A and5169A respectively. The corresponding oscillator strengthsare 0.0104 and 0.0226 (Kramida et al. 2012; Giridhar &Arellano Ferro 1995). With these values for the oscillatorstrength we can compute the Fe+ column density,
NFe+ ∼ 4.1× 1014cm−2
and
NFe+ ∼ 1.4× 1014cm−2
for the FeII lines 4923A and 5169A respectively. The Fe+
column density values are in good agreement with each otherwithin observational errors.
If the supershell is formed from shocked CCM, it musthave abundances similar to those observed in the ionised gas.If Fe/O is solar, this implies for the supershell Fe/H ∼ 3 ×10⁻⁶ and therefore the hydrogen column density associatedwith Fe+ is,
NH+ ∼ 1020cm−2
or
NH+ ∼ 2× 1020cm−2
if Fe/O is half solar. Given that we do not know the hy-drogen ionization fraction, these values should be taken asan estimate of the total, i.e. neutral plus ionized, hydrogencolumn density.
Following the same procedure we can estimate from theBalmer absorptions the column density of neutral hydro-gen. For a measured EW = 6 A and 2 A for Hα and Hβ thecolumn densities estimates of neutral hydrogen are respec-tively:
NH ∼ 3× 1013cm−2
and
NH ∼ 8× 1013cm−2
The comparison of the column density of “total” andneutral hydrogen suggests a high degree of ionisation in thegas that is producing the blueshifted absorptions.
An interesting variant of this scenario is provided bythe Super Star Cluster (SSC) cooling wind model of Silichet al. (2004), Tenorio-Tagle et al. (2007) and collaborators.This group has shown that in the case of a very massive and
extremely compact young cluster its wind may radiativelycool in a stationary condition close to the outer radius of thecluster. This cool ejecta should be the responsible agent forthe broad emission and blue shifted absorptions observed(see figure 4a of Tenorio-Tagle et al. 2007)). We expectto see soon detailed model calculations for the supershelland stationary cooling wind scenarios and the comparisonof the theoretical predictions with the observed parametersof PHL 293B .
If the FeII absorptions are formed in a stationary cool-ing wind the metal abundances will be those of the combinedejecta of stellar winds and SNe. In this scenario Fe/H will bemuch higher than that of the ISM in PHL 293B and conse-quently the estimated NH+ column density will be propor-tionally lower than those estimated above. Assuming solarabundances for the cluster wind, the estimated ionized hy-drogen column density will be:
NH+ ∼ 1019cm−2
A question that is raised in these relatively long livedcluster wind scenarios is: why is it that among several thou-sand HII galaxies known, only PHL 293B is known to havesimultanously narrow blue shifted Balmer and FeII absorp-tions? or equivalently, why is this type of event so rare?
The answer may be related to the fact that we are wit-nessing an event that produces weak narrow absorptionsthat are detectable only with high dispersion and high S/Nspectra.
6 CONCLUSIONS
We have analysed spectra of the low metallicity starforminggalaxy PHL 293B corresponding to four epochs obtained infour different combinations of telescopes and spectrographs,the SDSS, VLT-UVES, VLT-X-shooter and WHT-ISIS.
We find moderate narrow absorption components in theBalmer series blueshifted by 800km/s. We detected also theIR CaII triplet lines at the galaxy velocity rest frame, i.e.the rest frame defined by the ionised gas narrow emissionlines. We also find narrow absorptions at λ ∼ 4911A atλ ∼ 5004A (partially filled up by [OIII] λ 5007A) and apreviously unidentified absorption at λ ∼5183A. We inter-pret these narrow absorptions as the FeII multiplet (42)λλ 4923.93,5018.44,5169.03A, similar to those detected ina variety of transient luminous objects like the LBV candi-date NGC 2366 V1 or SN type IIn 1995G, 1999el or 1999eb,blueshifted by the same amount as the Balmer absorptionfeatures i.e. ∼800 km/s to λλ 4911,5005,5155 A.
The analysis of the photometric data provided by theCSS puts a strong upper limit to the possible variabilityof PHL 293B . Basically any optical yearly variability al-lowed by the data should be smaller than 0.02 magnitudesat the 3 sigma level in the 8.5 years between April 2005 andSeptember 2013. The possibility of any secular trend in theluminosity of PHL 293B in the last 15 years (consideringonly CCD data) is also limited to at most 0.02 magnitudesat the 3 sigma level.
This lack of variability and the observed strength of theBalmer and FeII absorptions rule out any transient of thetype of an LBV or SN type IIn as the origin of the blueshifted absorptions of H and FeII.
c© 2014 RAS, MNRAS 000, 1–15
14 R.Terlevich et al.
The evidence points to either a young and dense ex-panding supershell or a stationary cooling wind, both drivenby the young cluster wind. We suggest that the observedabsorptions and broad Balmer emissions are originated inone of these scenarios which seem capable of explaining theobserved spectral features, the constant (within errors) pho-tometric history and the rarity of the phenomenon.
Many starbursts, both nearby and at high z, showblueshifted far UV ISM narrow absorption lines. On thatbasis, coupled with the observational evidence, we expectthat the far UV spectrum of PHL 293B will show blueshifted ISM lines and moderate Lyα emission with perhapsa P Cygni-like profile.
We have to bear in mind that there are not many HIIgalaxies known to show prominent broad wings in their emis-sion lines and none with the quality of the data presentedhere for PHL 293B . This leaves open the possibility that weare witnessing an event not detected in other systems dueto low S/N data. Even if it is true that we haven’t beenactively looking for them, and that data of the quality andvariety discussed here is not widely available, it is still puz-zling that Fe absorptions have not been detected in otherstar forming HII galaxies. A search should be performed inhigh dispersion, high signal-to-noise spectra of HII galaxiesto investigate the presence of supershells in starbursts withor without strong broad components in the Balmer lines.Until such data is gathered and analysed, the fact that wedo not see many HII galaxies showing spectra similar toPHL 293B means that this may be a relatively short dura-tion stage in the evolution of compact and massive stellarclusters, lasting perhaps only a few thousand years.
ACKNOWLEDGMENTS
ET and RT are grateful to the Mexican Research Coun-cil (CONACYT) for support under grants 2008-103365 and2010-01-155046. Financial support for this work has alsobeen provided by the Spanish Ministerios de Educacion yCiencia and Ciencia e Innovacion under grants AYA2007-67965-C03-03 and AYA2010-21887-C04-03. Our team en-joyed the hospitality of the Institute of Astronomy, Cam-bridge, of the Departamento de Fısica Teorica of the Uni-versidad Autonoma de Madrid and of the Observatorio As-tronomico of the Universidad Nacional de La Plata (Ar-gentina) during fruitful visits when this paper was startedand developed. We thank Vahram Chavushyan for sug-gesting the identification of the FeII absorption features inλλ4911, 5155 A and discussions with Daniel Kunth helped toclarify the estimates of the analysis of these FeII features.Greatly enjoyed were discussions with Guillermo Tenorio-Tagle, Sergiy Silich and Sergio Martınez-Gonzalez, fromwhich a picture of the stationary wind scenario started toemerge. We are grateful to Vital Fernandez for helping withthe reduction of the WHT data. We thank the X-shooterdata reduction team for valuable help and suggestions andan anonymous referee whose questionings greatly improvedthe clarity of the paper.
The CSS survey is funded by the National Aeronauticsand Space Administration under Grant No. NNG05GF22Gissued through the Science Mission Directorate Near-EarthObjects Observations Program. The CRTS survey is sup-
ported by the U.S. National Science Foundation undergrants AST-0909182. This research has made use of theNASA/IPAC Extragalactic Database (NED) which is oper-ated by the Jet Propulsion Laboratory, California Instituteof Technology, under contract with the National Aeronauticsand Space Administration.
REFERENCES
Abazajian K. N., et al., 2009, ApJS, 182, 543Aretxaga I., Terlevich R.,1994, MNRAS, 269, 462Aretxaga I., Cid Fernandes R., Terlevich R., 1997, MN-RAS, 286, 271
Aretxaga I., Benetti S., Terlevich R.J., Fabian A.C., Cap-pellaro E., Turatto M., della Valle M., 1999, MNRAS, 309,343
Asplund M., Grevesse N., Sauval A. J., Scott P., 2009,ARA&A, 47, 481
Bastian N., Goodwin S. P., 2006, MNRAS, 369, L9Bresolin F., Urbaneja M. A., Gieren W., Pietrzynski G.,Kudritzki R.-P., 2007, ApJ, 671, 2028
Cairos L. M., Vılchez J.M., Gonzalez Perez J.N., Iglesias-Paramo J., Caon N., 2001, ApJS, 133, 321
Castaneda H. O., Vilchez J. M., Copetti M. V. F., 1990,ApJ, 365, 164
The Chandra Proposers’ Observatory Guide,Issue 16.0, 2013, Chandra X-ray Center(http://cxc.harvard.edu/proposer/POG/)
Chugai N.N., 1991, MNRAS, 250, 513Chugai N.N., Blinnikov S. I., Cumming R. J., Lundqvist P.,Bragaglia A.,Filippenko A. V., Leonard D. C., MathesonT., 2004, MNRAS, 352, 1213
Clark J.S., Larionov V.M., Arkharov A., 2005, A&A, 435,239
Dıaz A. I., Terlevich E., Pagel B. E. J., Vilchez J. M.,Edmunds M. G., 1987, MNRAS, 226, 19
Dıaz A.I., Terlevich E., Terlevich R., 1989,MNRAS, 239,325
Dıaz A.I., Terlevich E., Terlevich R., 1989,MNRAS, 239,325
Dıaz A. I., Castellanos M., Terlevich E., Luisa Garcıa-Vargas M., 2000, MNRAS, 318, 462
Di Carlo E., Massi F., Valentini G., et al., 2002, ApJ, 573,144
D’Odorico S. et al., 2006, SPIE, 6269, 626933Dottori H. A., 1981, Ap&SS, 80, 267Drake,A.J. et al. 2009, ApJ, 696, 870Drissen L., Roy J.-R., Robert C., 1997, ApJ, 474, L35Fassia, A., et al. 2001, MNRAS, 325, 907Filippenko A.V.,1989, AJ, 97, 726Filippenko A.V.,1997, ARA& A, 35, 309French H. B., 1980, ApJ, 240, 41Garcıa-Vargas M. L., Molla M., Bressan A., 1998, A&AS,130, 513
Geha M., Blanton M. R., Masjedi M., West A. A., 2006,ApJ, 653, 240
Giridhar S., Arellano Ferro A., 1995, Rev.Mex.A.A.,31,23GTT07
Gonzalez-Delgado R. M., et al., 1994, ApJ, 437, 239Goodwin S. P., Bastian N., 2006, MNRAS, 373, 752Grosbøl P., Dottori H., 2013, A&A, 551, L13
c© 2014 RAS, MNRAS 000, 1–15
FeII absorptions 15
Hagele G.F., Dıaz A.I., Cardaci M.V., Terlevich E., Ter-levich R., 2009, MNRAS, 396, 2295
Haro G., Luyten W. J., 1962, BITon, 3, 37Herrero A., Garcia1 M., Uytterhoeven K., Najarro F.,Lennon D. J., Vink J. S., Castro N., 2010, A&A, 513,A70
Izotov Y. I., Dyak A. B., Chaffee F. H., Foltz C. B., KniazevA. Y., Lipovetsky V. A., 1996, ApJ, 458, 524
Izotov Y. I., Thuan T.X., 2009, ApJ, 690, 1797Izotov Y. I., Thuan T.X., Stasinska G., 2007, ApJ, 662, 15Izotov Y. I., Guseva N. G., Fricke K. J., Henkel C., 2011,A&A, 533, A25
Kinman,T.D., 1965, ApJ, 142, 1241Koss M., Blecha L., Mushotzky R., Hung Ch.L., VeilleuxS., Trakhtenbrot B., Schawinski K., Stern D., Smith N.,Li Y., and 5 coauthors, 2014, arXiv:1401:6798v1
Kramida, A., Ralchenko, Yu., Reader, J. and NIST ASDTeam (2012). NIST Atomic Spectra Database (version5.0), [Online]. Available: http://physics.nist.gov/asd
Kunth D., & Ostlin G., 2000, A&AR, 10, 1Lee H., Grebel E. K., Hodge P. W., 2003, A&A, 401, 141Leitherer, C., Allen, R., Altmer, B., et al. 1994, ApJ, 428,292
Leitherer C., Heckman T. M., 1995, ApJS, 96, 9Macchetto F., Colina L., Golombek D., Perryman M. A. C.,di Serego Alighieri S., 1990, ApJ, 356, 389
Mas-Hesse,M.J. ,Kunth,D., Tenorio-Tagle,G., Leitherer,C.,Terlevich R.J., Terlevich,E., 2003, ApJ, 598, 858
Melnick J., Tenorio-Tagle G., Terlevich R., 1999, MNRAS,302, 677
Molla M., Garcıa-Vargas M. L., Bressan A., 2009, MNRAS,398, 451
Molla M., Garcıa-Vargas M. L., Bressan A., 2009, MNRAS,398, 451
Morton,D.,1991, ApJS, 77, 119Mould J. R., et al., 2000, ApJ, 529, 786Naze Y., Rauw G., Hutsemekers D., 2012, A&A, 538, A47Petit V., Drissen L., Crowther P. A., 2006, AJ, 132, 1756Pilyugin L. S., Ferrini F., Shkvarun R. V., 2003, A&A, 401,557
Roy J.-R., Aube M., McCall M. L., Dufour R. J., 1992,ApJ, 386, 498
Silich S.,Tenorio-Tagle G.,Rodrıguez-Gonzalez A. 2007,ApJ, 610, 226
Sandage A., 1971, ApJ, 166, A70Smith, N., Li, W., Silverman, J. M., Ganeshalingam, M.,& Filippenko, A. V. 2011, MNRAS, 415, 773
Stasinska G., Cid Fernandes R., Mateus A., Sodre L., AsariN. V., 2006, MNRAS, 371, 972
Tenorio-Tagle, G., Silich, S. A., Kunth, D., Terlevich, E.,Terlevich, R. 1999, MNRAS, 309, 332
Tenorio-Tagle G., Wunsch R., Silich S., Palous J. 2007,ApJ658, 1196
Terlevich E., Dıaz A.I., Terlevich R., 1990,MNRAS, 242,271
Terlevich E., Dıaz A.I., Terlevich R., 1990,MNRAS, 242,271
Terlevich E., Dıaz A. I., Terlevich R., Gonzalez-DelgadoR. M., Perez E., Garcıa Vargas M. L., 1996, MNRAS,279,1219
Terlevich R., Tenorio-Tagle G., Franco J., Melnick J.,1992,MNRAS, 255, 713
Terlevich R., 1994, in: Circumstellar Media in Late Stagesof Stellar Evolution, Proceedings of the 34th Herstmon-ceux Conference held in Cambridge, July 12-16, 1993.Edited by R.E.S. Clegg, I.R. Stevens and W.P.S. Meikle.Cambridge, UK: Cambridge University Press, p.153
Turatto M., 2003, in: Supernovae and Gamma-RayBursters. Ed. K. Weiler., Lecture Notes in Physics, vol.598, p.21-36
Turatto M., 2005, in: Cosmic Explosions, On the 10th An-niversary of SN1993J. Proceedings of IAU Colloquium192. Edited by J.M. Marcaide and Kurt W. Weiler.Springer Proceedings in Physics, vol. 99. Berlin: Springer,2005., p.151
Tutukov A. V., 1978, A&A, 70, 57Vernet J., Dekker H., D’Odorico S., Kaper L., KjaergaardP., Hammer F., Randich S., Zerbi F., Groot P. J., HjorthJ., and 80 coauthors, 2011, A&A, 536A, 105
Vestergaard M., Peterson B.M., 2006, ApJ, 641, 689
This paper has been typeset from a TEX/ LATEX file preparedby the author.
c© 2014 RAS, MNRAS 000, 1–15