high voltage solar array study - nasa · to voltage breakdown, ... this document reports the...
TRANSCRIPT

HIGH VOLTAGE SOLAR ARRAY STUDY
THE BflE/Nfi COMPANY
prepred for
NATIONAL AERONWTICS AND SPACE ADMINISTRATION
NASA Lewis bsearek Genbr Cmtmci; N A B - 1 1534 Stanley h i tz, Project JMmqer
https://ntrs.nasa.gov/search.jsp?R=19700017869 2018-08-11T03:19:40+00:00Z

NOTICE
Assumes any liabilities with respect to the use of, or for damages resul ti ng from the use of, any i nfor- mation, apparatus, method or process disclosed in

NASA CR-72674 Boeing ~2-121734-1
FINAL RENRT
HIGH VOLTAGE SOLAR JRRAY 8TUPY
Wepared By:
W, 3'. Springgate - Technical Leader
Henry Oman -. Program Leader
THE BOEING COMPANY AWOSPACE GROUP
KENT FACILITY P.0, BOX 3999
SEATTI.8, WASHINGTON 98124
Prepared For:
NATIONAL AERONAUTICS AND SPACE ADMINISTRATION
Contract NM~-11534
Stanley D o d t z , Pro3sct Manager
Spacecraft Technology Division


The r e sea rch descr ibed he re in , which was conducted by The Boeing Company, Aerospace Systems Divis ion, was performed under NASA Contract NAS~-11534. The work was done under t h e management of the NASA P r o j e c t Manager, M r . S t an l ey Domitz, Spacecraf t Technology Divls ion, NASA Lewis Research Center.

~2-121734-~
TABLE O F CONTENTS
SPACE ET\SVIRONMENT MODEL
LSAKAGE CURRENTS
ENVIRONMENTAL E F F E C T S
INSULATION BREAKDOWN
FABRICATION AND CONCEPTUAL DESIGN
R E L I A B I L I T Y ANALYSES
CONCLUSIONS
GLOSSARY
APPENDIX 1: COMPUTER PiiOGRAM FOR CURRENT COLLECTION
APPENDIX 2 : DETERMINATION O F NET ACCELERATING VOLTAGE PRODUCED BY A S O L m ARRAY OPERATING AN I O N THRUS TOR
APPENDIX 3 : PLASMA-RESISTANT ORGANIC MATERIALS
APPENDIX 4 : HIGH VOLTAGE SOLAR ARRAY SPACE ENVIRONMENT MODEL
REFERENCES
Page
2
3
8
23
33
47
58
6 7
69
70
78

The problems i n opera t ing a 15 kW, 2 t o 16 kV s o l a r a r r a y i n Ea r th o r b i t a r e analyzed. The a r r a y would f i r s t power ion t h r u s t o r s on a apacec ra f t climbing from 185 k m t o synchronous a l t i t u d e , and then power t r a n s m i t t i n g tubes f o r 5 years . Such an a r r a y i s f e a s i b l e , S o l a r - c e l l in te rconnectora and o t h e r conducting s w f a c e s would probably be i n s u l a t e d t o prevent power l o s s through plasma. S e v e r a l i n su l a t ed -a r r ay designs appear p r a c t i c a l . figl-i-voltage i n a ~ ~ l a t i o n s must be t e s t e d I n t h e l a b o r a t o r y f o r performance i n t h e ionospheric plasma, followed by 5 years i n synchronous o r b i t . The leakage cu r ren t from exposed conductors and through p inholes needs t o be c a l c u l a t e d f o r a l l plasma condi t ions , and confirmed experimental ly .


The purpose of t he s tudy descr ibed i n t h i s r e p o r t was t o def ine t h e problems a s soc i a t ed wi th opera t ing a h igh vol tage s o l a r a r r a y i n Ea r th o r b i t and t o recomnend methods f o r so lv ing these problems, Voltages considered were 2000 v o l t s t o 16,000 v o l t s , bo th p o s i t i v e and negat ive w i t h r e s p e c t t o t h e space- c r a f t . The s o l a r a r r a y would power ion thrusters t o r a i s e a spacec ra f t from low Ear th o r b i t (185 k i lome te r s ) t o synchronous o r b i t (35,800 k i lometers ) du r ing t h r e e months, and then power high-frequency e l e c t r o n tubes f o r f i v e years of broadcast ing. Most of t h e problems r e l a t e d t o t h e power l o s s r e s u l t - i n g from cu r ren t flow between t h e a r r a y and t h e surrounding space plasma.
We pos tu l a t ed an a r r a y 'with uninsulated s o l a r c e l l in te rconnectors , bu t which otherwise i s p e r f e c t l y i n s u l a t e d . Analysis of t h e e l e c t r i c f i e l d about an uninsula ted in t e rconnec to r and t h e i n t e r a c t i o n of t h i s f i e l d wi th t h e sur- rounding plasma r equ i r ed a s o p h i s t i c a t e d d i g i t a l computer program. The c a l c u l a t i o n s showed t h a t t h e t o t a l e l e c t r o n cu r ren t c o l l e c t e d by the i n t e r - connectors i s about t h e same a s t h e t o t a l i o n cu r r en t swept out by t h e a r r ay . A t low a l t i t u d e t h i s r e p r e s e n t s a s i g n i f i c a n t power l o s s ( f o r example 210 wa t t s per square meter of in te rconnector area a t 300 Ism). Fur ther a n a l y t i c a l and experimental work i s needed t o provide t h e l o s s e s f o r s p e c i f i c vo l tages and a l t i t u d e s .
Af te r concluding t h a t t h e high-voltage s o l a r a r r a y must be campletely i n s u l a t e d t o avoid leakage-current power l o s s e s , we developed conceptual designs of i n s u l a t e d a r r ays . P r o p e r t i e s of i n s u l a t i n g ma te r i a l s were examined wi th r e spec t t o vol tage breakdown, chemical i n t e r a c t i o n wi th t h e space plasma, u l t r a v i o l e t r a d i a t i o n , and ease of a r r a y f a b r i c a t i o n . A new 5600 vol t -per-mil d i e l e c t r i c , Parylene C , has many c h a r a c t e r i s t i c s t h a t could make it u s e f u l f o r i n s u l a t i n g . I n s u l a t i o n performance under t h e proper environmental condi t ions i s not ava i l ab l e . Proposed f u r t h e r work inc ludes : (1) Use of a duoplasmatron t o measure charge bui ldup phenomena; ( 2 ) use of a cu r r en t - l imi t ing apparatus f o r vo l t age breakdown measurements: and (3) use of l abo ra to ry plasmas t o produce acce l e ra t ed r a t e s of chemical r eac t ion .
Other work i n t h i s s tudy inc luded t h e eva lua t ion of s p u t t e r i n g , mercury contamination, s o l a r c e l l r a d i a t i o n damage, micrometeroid damage, and a r r a y r e l i a b i l i t y . A model of t h e space environment, as it app l i e s t o t h i s s tudy , was e s t ab l i shed .

l , O IIVTRODUCTI OIV
This document r e p o r t s t h e r e s u l t s of a High Voltage So la r Array Study, conducted by The Boeing Company f o r NASA Lewis Research Center on con t r ac t NAS3-11534. The o b j e c t i v e s of t h i s program were %o study, d e f i n e , and evalrl- a t e t h e des ign , f a b r i c a t i o n , t e s t , and a p p l i c a t i o n problems r e s u l t i n g from t h e use of a high vol tage s o l a r a r r a y .
A s i n g l e app l i ca t ion was def ined f o r t h e program--a 15 kW a r ray , producing from 2,000 t o 16,000 v o l t s dc, i n s i x vol tage s t e p s , a t one vol tage, o r up t o s i x vol tage and power l e v e l s . The program a n t i c i p a t e s a s p a c e c r a f t t h a t s p i r a l s from 100 n a u t i c a l miles a l t i t u d e t o synchronous o r b i t i n t h r e e months, using i o n thrusters, and then se rves f o r f i v e years a s a d i r e c t b roadcas t s a t e l l i t e using high vol tage e l e c t r o n tubes i n t h e t r a n s m i t t e r . The a r r ay must be capable of ope ra t ing a t e i t h e r nega t ive o r p o s i t i v e p o t e n t i a l r e l a t i v e t o t he space plasma, The a r r a y must a l s o opera te i n e c l i p s e o r b i t s and have safeguards f o r personnel p r o t e c t i o n during ground handling.
To produce such an a r r ay , r e sea rch and development i s needed i n : (1) design- i n g and ope ra t ing high vol tage s o l a r a r r ays ; ( 2 ) r e g u l a t i n g and switching a r r a y elements; and (3) deploying large-area a r r a y s . This s tudy was confined t o t he problems a s soc i a t ed wi th t h e f i r s t i tem, designing and ope ra t ing a high vol tage s o l a r a r r ay . Froblems common t o both h igh vol tage and low vol tage s o l a r a r r a y s , such a s s o l a r c e l l r a d i a t i o n damage, were t r e a t e d on ly b r i e f l y .
A problem r e q u i r i n g ex tens ive s tudy was t h a t of cu r r en t leakage between t h e s o l a r a r r a y and t h e apace plasma. The plasmas i n space con ta in charge c a r r i e r s of both p o l a r i t i e s , and one o r t h e o the r w i l l d r i f t t o t h e high vol tage po r t ions of t h e s o l a r a r r a y if leakage pa ths can be e s t ab l i shed . Since the mob i l i t y of e l e c t r o n s i s much higher than t h a t of ions , an a r r a y ope ra t ing a t p o s i t i v e p o t e n t i a l s s u s t a i n s t h e higher leakage cu r ren t . A previous s tudy ( ~ e f . 1) based on d a t a from the f i r s t OGO spacec ra f t e s t a b l i s h e d t h a t even a s o l a r a r r a y ope ra t ing a t a low p o s i t i v e vol tage (+36 v o l t s ) i n Ea r th o r b i t can draw enough e l e c t r o n c u r r e n t t o i t s exposed s o l a r c e l l i n t e r connec to r s t o s h i f t t h e s p a c e c r a f t p o t e n t i a l r e l a t i v e t o t h e plasma.
Deta obta ined from simulated plasma experiments i n a l a t e r s tudy ( ~ e f . 2 ) i nd ica t ed t h a t a s o l a r a r r a y wi th exposed in te rconnectors maintained a t a p o s i t i v e p o t e n t i a l ( k i l o v o l t s ) while immersed i n a plasma t y p i c a l of low E ~ r t h o r b i t c o l l e c t e d e l e c t r o n leakage c u r r e n t s r ep re sen t ing s i g n i f i c a n t power l o s s . Thus an o b j e c t i v e of o m study .was t o determine what a n a l y t i c a l and experimental e f f o r t i s needed t o enable one t o p r e d i c t , wi th reasonable accuracy, t h i s leakage cu r ren t and power l o s s .
Other problem areas s tud ied ex tens ive ly were vol tage breakdown of i n s u l a t i o n , chemical i n t e r a c t i o n between t h e plasma and t h e a r r ay , techniques of f a b r i c a t - i ng an i n s u l a t e d a r r a y , and su r f ace f lashover between exposed po r t ions of t h e a r r c y .
A space environment model was e s t a b l i s h e d and i s descr iued i n d e t a i l i n Appendix 4. P summary- of t h e space environment model i s provided i n Sec t ion 2.0 of t h i s r e p o r t . This mod.el provided the environmental da t a used i n our a n a l y s i s ,

2,O SPACE ENCrSROrJMENT MODEL
The environment f o r t h e high vol tage s o l a r a r r a y i s summarized i n F i g w e 1 where a l t i t u d e is p l o t t e d i n Ear th r a d i i , n a u t i c a l mi les and k i lometers h o r i z o n t a l l y on a logar i thmic s c a l e , bu t w i th t h e c e n t e r of t h e Ear th brought from minus i n f i n i t y t o t h e edge of t h e i l l u s t r a t i o n .
Dominating t h i s r eg ion i s t h e Earth 's magnetic f i e l d , which can be r ep re sen ted mathematically as a t i l t e d d ipo le (30 percent accuracy) , off-center t i l t e d d ipo le (10 percent accuracy) , o r mul t ipo le model ( 2 percent accuracy). A t some 14 Ea r th r a d i i on t h e sunward s i d e , t h e Ear th ' s magnetic f i e l d meets t h e s o l a r wind, forming a bow shock wave t h a t cons t r a ins t h e f i e l d t o a tear-drop shape having i t s p o i n t i n t h e Earth 's shadow. The s o l a r wind i s a n e u t r a l plasma composed most ly of protons, bu t w i t h one percent hot hydrogen atoms and l e s s e r q u a n t i t i e s of o t h e r atoms. I t s temperature i s 105 degrees Kelvin, it t r a v e l s a t 270 t o 800 Der second, and i t conta ins t rapped magnetic f i e l d s of around 5 gamma ( 5 X 10% webers/m2) i n t e n s i t y . Between t h e bow shock and t h e magnetosphere i s a magnet ica l ly t u r b u l e n t reg ion c a l l e d t h e plasmasheath which drops down t o synchronous a l t i t u d e (6.6 Ea r th r a d i i ) on ly during s o l a r events .
The Ea r th ' s magnetic f i e l d does not d i r e c t l y a f f e c t t h e high vol tage s o l a r a r ray , b u t it c o n t r o l s o t h e r phenomena t h a t do a f f e c t t h e a r ray . These phenomena vary by o rde r s of magnitude i n i n t e n s i t y a s a r e s u l t of so l a r - a c t i v i t y induced changes i n t h e Ear th ' s magnetic f i e l d and p a r t i c l e a r r i v a l r a t e s . For example, t h e ionospher ic l aye r s , of which t h e F1 and F2 a r e i n t h e 100 n a u t i c a l mi le (EM) t o synchronous-al t i tude ope ra t ing regime, a r e a f f e c t e d not only by t h e magnetic f i e l d s , b u t a l s o by t h e time of day and season of t h e year . During t h e day t h e u l t r a v i o l e t i n t h e sun l igh ion izes t h e oxygen and n i t r o en n e u t r a l atoms of t h e a i r , producing over 10k e l ec t rons per cm 3 ( ~ i g u r e 27. A t n i g h t t h e recombination of e l e c t r o n s w i t h ion ized oxygen produces t h e air-glow. A t synchronous a l t i t u d e t h e normal e l e c t r o n count f a l l s t o 100 p e r cm3, and 60 cubic k i lometers must be swept t o f i n d a coulomb of charge. The thermal f l u x of e l ec t rons and t h e f l u x of i ons swept out by t h e spacec ra f t a r e p l o t t e d as a f u n c t i o n of a l t i t u d e i n Figure 3.
Ionospheric e l e c t r o n d e n s i t i e s below t h e F2 l a y e r have been measured f o r many years w i th Earth-surface ionosondes, which p l o t a s a func t ion of frequency t h e time r equ i r ed f o r r a d i o s i g n a l s t o echo back from t h e ionosphere. The echo time i s converted t o a l t i t u d e , and t h e c r i t i c a l frequency above which no s i g n a l s a r e r e f l e c t e d can be converted t o i o n dens i ty . The ionosphere above t h e F2-peak e l e c t r o n d e n s i t y zone has been explored wi th rockets , sa te l l i t e -mounted ionosondes which probe downward, and plasma probes. The moculation and d e l a y time r e s u l t s found f o r ultra-low frequency (1 ~ e r t z ) w h i s t l e r s echoing i n t h e magnetospheric "waveguide" dur ing q u i e t time provides t h e e l e c t r o n d e n s i t y d a t a i n t h e 2-8 Ear th r a d i i range.
S o l a r c e l l degrada t ion i s most severe i n t he Van Allen t rapped e l e c t r o n and 6 pro ton b e l t s , where up t o 1 0 protons of g r e a t e r than 4 MeV energy bombard
every square cent imeter of c e l l a rea each second. The e n e r g e t i c protons a r e p a r t i c u l a r l y damaging because each proton of energy over 4 MeV can p e n e t r a t e a 6-mil quar tz cover and produce thousands of c r y s t a l d e f e c t s befor
sq . cm. per y e a r ) produce t r i v i a l damage i n s o l a r c e l l s .
E coming t o r e s t . Compared wi th t rapped protons t h e g a l a c t i c cosmic r ays (10 per


1,000 10,000
Altitude (kilometers)
Figure 2 : ELECTRON DENSITY VS ALTITUDE

Thermal Electron Flux (< 2 ev)
Ion Flux Swep by Spacecraft
1 , 0 0 0 10,000
Altitude (kilometers)
F i g u r e 3: ELECTRON AND I O N FLUX VS ALT ITUDE

The polar regions, p a r t i c u l a r l y the aurora l peak a t 65 t o 670 geomagnetic l a t i t u d e contain highly var iable charged-particle phenomena. For example, 6000° K e lec t rons can be found a t a l t i t u d e s as low as 540 NM. This tempera- t u r e does not normally occur below 13,000 km i n equa to r ia l regions.
Another contr ibutor t o the s o l a r a r ray environment i s the meteoroids, which t r a v e l a t around 33 km per second with respect t o the Earth, or some 17 km per second wi th respect t o in te rp lane ta ry space. Empirical equations have been developed t o r e l a t e meteoroid f l u x t o s i ze .
The magnitudes and varia.tions of phenomena occuring i n the high voltage s o l a r a r ray environment are described i n d e t a i l i n Appendix 4.

3.0 'LEAKAGE CURRENTS
Exposed conducting surfacers on a high vol tage a r r a y which opera tes an ion t h r u s t o r i n Ear th o r b i t can c o l l e c t leakage c w r e n t from (1) the n a t u r a l space plasma, ( 2 ) t h e i o n t h r u s t o r exhaust, (3) nearby i n s u l a t i n g susfaces which e j e c t e l e c t r o n s dur ing bombardment by photons, atoms, or ions , and ( 4 ) nearby exposed conductors v i a vol tage breakdown on i n s u l a t i n g su r f aces. We first desc r ibe why leakage c u r r e n t s p ~ e s e n t a p o t e n t f a l problem, and how power l o s s i s a f f e c t e d by a l t i t u d e , vo l tage and p o l a r i t y ( s~xbsec t ion 3 . 1 ) , Then we digcuss each type of leakage cu r ren t i n d i v i d u a l l y ( subsec t ioqs 3 .2 - 3.5).
3.1 Power L o s ~
3 .1 , l Ef fec t of Voltage, A l t i tuda and P o l a r i t y
A s o l a r a r r a y t h a t i s not completely i n s u l a t e d when operated i n t he ionosphere w i l l l o s e some of i t s power ou-tput t o e l e c t r o n o r i o n leakage cu r ren t s ( i , e . e l e c t r o n s o r ions " leaking" from t h e plasma t o t h e a r r a y ) . The g r e a t e r leakage c w r e n t and power losaoccurswhen a l l po in t s on the a r r a y a re p o s i t i v e r e l a t i v e t o t h e surrounding plasma. This is because a pos i t i ve -po la r i t y a r r a y a t t r a c t s e l e c t r o n s r a t h e r than the heavier , harder - to-co l lec t i ons .
The e l e c t r o n s a t t r a c t e d by an uninsula ted 1,000-volt a r r a y having a p o s i t i v e p o l a r i t y w i l l f a l l through an average p o t e n t i a l d rop of 500 v o l t s . The magnitude of t h e r e s u l t i n g leakage cu r ren t depends on t h e dens i ty of plasma themnal e l e c t r o n s . The maximum cur ren t dens i ty from thermal e l e c t r o n s (4.9 ,uamperes/cm2) occurs i n t h e daytime a t an a l t i t u d e of 300 kilometerg ( ~ i ~ u r e 3 ) .
The a r r a y power consumed i n c o l l e c t i n g t h e s e e l e c t r o n s ~ ~ o u l d be:
Power l o s s = Eave IT
= -00245 watts/cm2 = 2 -45 milliwatts/cm2
where ave =I average p o t e n t i a l through which thermal e l e c t r o n s f a l l s
IT = c u r r e n t of c o l l e c t e d thermal e l e c t r o n s
Since s o l a r c e l l s i n E a r t h o r b i t generate about 14 milliwatts/cm2, t h i s r e p r e s e n t s a 17 percent power l o s s . Under s i m i l a r circumstances a 16,000 v o l t a r r a y would l o s e a s much power as it could genera te .
Repeat ing the above c a l c u l a t i o n f o r a p o s i t i v e p o l a r i t y a r r a y a t d i f f e r e n t a l t i t u d e s produced t h e curves i n Figure 4. It i s ev ident from these curves t h a t t he uninsula ted a r r a y lo ses l e s s power a t a l t i t u d e s above 300 k i lometers , S imi l a r curves were generated f o r a nega t ive-polar i ty a r r a y which c o l l e c t s plasma ions as t h e spacec ra f t sweeps through them ( ~ i g u r e 4 ) . Although the curvea i n F i g w e 4 a r e not intended t o be design d a t a , t hey do i n d i c a t e t h a t t h e ionosphere plasma i s a p o t e n t i a l problem i n high-voltage a r r ays ope ra t ing a t a l t i t u d e s below 1000 k i lometers .

Array Collects Electrons at Thermal Flux Rate
-.Is- Array Collects Ions at
Spacecraft Sweep Rate
1,000-Volt Array
16,000-Volt Array
1,000 10,000
Altitude (kilometers)
F i g u r e 4: EFFECT OF PLASMA LEAKAGE CURRENTS ON ARRAY POWER OUTPUT
3 , l , 2 E f f e c t of Operating an Ion Thrus tor
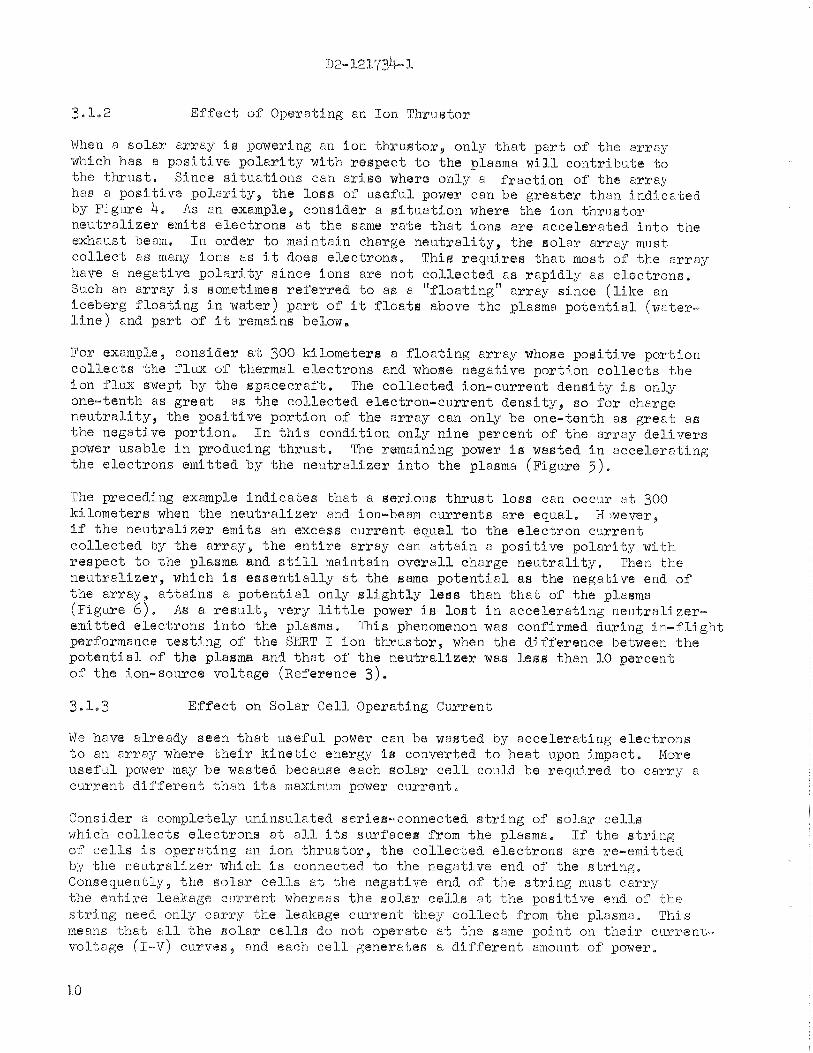
When a s o l a r a r r c y i s powering an i o n t m u s t o r , on ly t h a t p a r t of t h e a r r ay which has a p o s i t i v e p o l a r i t y w i th r e s p e c t t o t h e plasma w i l l con t r ibu te to the thxus t . Since situations can a r i s e where on ly a f r a c t i o n of t h e a r r ay has a p o s i t i v e polarity, t h e l o s s of u s e f u l power can be g r e a t e r than i n d i c a t e d by F i g m e 4. A s an example, consider a s i t u a t i o n where the ion t h r u a t o r n e u t r a l i z e r emits e l e c t r o n s a t t he same r a t e t h a t ions a r e acce l e ra t ed i n t o t h e exhaust beam, I n ostler t o maintain charge n e u t r a l i t y , t he s o l a r a r r a y must e o l l e c t a s many ions a s it does e l ec t rons , This r e q u i r e s t h a t most of t h e a r r a y have a negat ive p o l a r i t y s i n c e ions a r e not c o l l e c t e d a s r a p i d l y a s e l e c t r o n s . Such an a r r a y i s sometimes r e f e r r e d t o a s a " f l o a t i n g " a r r a y s ince ( l i k e an i cebe rg f l o a t i n g i n wa-ter) p a r t of it f l o a t s above t h e plasma p o t e n t i a l (water- l i n e ) and p a r t of i t remains below,
For example, cons ider a t 300 k i lometers a f l o a t i n g a r r a y whose p o s i t i v e p o r t i o n c o l l e c t s t h e f l u x of thermal e l e c t r o n s and whose negat ive po r t ion c o l l e c t s t h e i o n f l u x swept by t h e spacec ra f t , The c o l l e c t e d ion-current d e m i t y i s on ly one-tenth as g r e a t a s t h e co l l ec t ed e lec t ron-cur ren t dens i ty , so f o r charge n e u t r a l i t y , t he p o s i t i v e p o r t i o n of t h e a r r a y can only be one-tenth as g r e a t a s t h e negat ive po r t ion , I n t h i s condi t ion only nine percent of t h e a r r a y d e l i v e r s power usable i n producing t h r u s t . The remaining power is wasted i n a c c e l e r a t i n g t h e e l e c t r o n s emi t ted by t h e n e u t r a l i z e r i n t o t h e plasma ( ~ i g u r e 5 ) .
The preceding example i n d i c a t e s t h a t a s e r i o u s t h r u s t l o s s can occur a t 300 kilome-ters when t h e n e u t r a l i z e r and ion-beam c u r r e n t s a r e equal. Hlwever, if t h e n e u t r a l i z e r emits an excess cu r r en t equ-a1 t o t h e e l e c t r o n cu r ren t c o l l e c t e d by t h e a r r a y , t h e e n t i r e a r r a y can a t t a i n a p o s i t i v e p o l a r i t y w i t h r e s p e c t t o t he plasma and s t i l l r f l a i n t a i n o v e r a l l charge n e u t r a l i t y . Then t h e n e u t r a l i z e r , which i s e s s e n t i a l l y a t t he same p o t e n t i a l a s t h e negat ive end of t h e a r r ay , a t t a i n s a p o t e n t i a l only s l i g h t l y l e s s than t h a t of t he plasma ( ~ i g u r e 6 ) . A s a r e s u l t , very l i t t l e power i s l o s t i n a c c e l e r a t i n g n e u t r a l i z e r - emi t ted e l e c t r o n s i n t o t h e plasma. This phenomenon was confirmed during i n - f l i g h t performance t e s t i n g of t h e SERT I i o n t h r u s t o r , when the d i f f e r ence between t h e p o t e n t i a l of t h e plasma and t h a t of t h e n e u t r a l i z e r was l e s s than 10 percent of t he ion-source vo l t age (Reference 3) .
3.1.3 E f f e c t on S o l a r C e l l Operating Ciurrent
We have a l ready seen t h a t u s e f u l power can be wasted by acce l e ra t ing e l e c t r o n s t o an a r r a y where t h e i r k i n e t i c energy is converted t o h e a t upon impact, More u s e f u l power may be wasted because each s o l a r c e l l could be r equ i r ed t o c a r r y a cu r r en t d i f f e r e n t t han i t s maximum power c u r e n % *
Consider a completely uninaula ted ser ies-connected s t r i n g of s o l a r c e l l s which co l l . ec t s e l e c t r o n s a t a l l i t s a w f a c e s from t h e plasma, I f t h e s t r i n g of c e l l s i s ope ra t ing an i o n t h r u s t o r , t h e c o l l e c t e d el-ectrons a r e re-emit ted by t h e n e u t r a l i z e r which i s connected t o t h e negat ive end of the s t r i n g . Consequently, t h e s o l a r c e l l s a t t he negat ive end of t h e s t r i n g m u - s t c a r r y t h e e n t i r e Leakage c m r e n t whereas t h e s o l a r c e l l s a t t h e p o s i t i v e end of t h e s t r i n g need only c a r r y t h e leakage cu r ren t they c o l l e c t from the plasma, This means t h a t a l l t h e gobar c e l l s do not opera te a t t h e same po in t on t h e i r cu r r en t - vo l tage (I-V) curves , and each c e l l generat,es a d i f f e r e n t amount of power,


Actua l ly , on ly one c e l l i n t h e s t r i n g w i l l ope ra t e e x a c t l y a t maximum power. As a r e s u l t , t h e u s e f u l power delivered t o t h e i o n t k u s t o r may be seve re ly degraded.
To i l l u s t r a t e t h i s we analyzed a s i t u a t i o n where an a m a y c o l l e c t s e l e c t r o n s uniformly from t h e plasma while ope ra t ing a cons tan t -cur ren t i on t h r u s t o r which maintains i t s n e u t r a l i z e r a t plasma p o t e n t i a l . The r e s u l t i s shown i n F igure 7 where ion - th rus to r power i s p l o t t e d versus c o l l e c t e d e l e c t r o n cu r ren t dens i ty . The s o l a r a r r a y was assumed t o be designed such t h a t , without t he plasma leakage c u r r e n t , t h e a r r a y ope ra t e s a t maximm power. A complete d iscues ion of t h e assumptions and c a l c u l a t i o n s used i n de r iv ing t h e curve i n Figure 7 i s provided i n Appendix 2.
An e l e c t r i c a l des igner should des ign h i s a r r a y so t h a t most of t h e s o l a r c e l l s would ope ra t e a t t he maximum power p o i n t when car ry ing load cu r ren t p lus leakage c ~ m r e n t , p rovid ing t h i s were the c r i t i c a l p a r t of h i s mission, and providing he knew p r e c i s e l y how much leakage cu r ren t he would have t o handle. One approach i s swi tch ing c e l l s t o change t h e number i n p a r a l l e l a t d i f f e r e n t s t r i n g l o c a t i o n s s o t h a t more c e l l s w i l l opera te near t h e i r maximum power po in t . Furthermore an i o n t h r u s t o r i s not e x a c t l y a constant-current load , and i t s cu r r en t v a r i a t i o n s should be considered i n e s t a b l i s h i n g the maximum-power vol tage of t h e a r r ay .
3.2 Leakage Current from Natura l Plasma
This s e c t i o n desc r ibes (1) a d i g i t a l computer program which was developed t o c a l c u l a t e t h e magnitude of t h e n a t u r a l plasma leakage cu r ren t , and ( 2 ) recommended f u t u r e a n a l y s i s and experimentation.
3.2.1 Completed Work
P resen t ly a v a i l a b l e a n a l y t i c a l techniques a r e no t adequate t o c a l c u l a t e t h e plasma leakage c u r r e n t t o a high vol tage s o l a r a r ray . M de rn e l e c t r i c probe theo ry (References 4, 5 ) , which i s adequate f o r c a l c u l a t i n g leakage c u r r e n t t o low vol tage conductors wi th a simple geometry, i s not app l i cab le t o complex a r r a y geometries involv ing high vol tage . Although high vol tage s o l a r a r r a y s have been exper imenta l ly t e s t e d f o r leakage cu r ren t i n a simulated space plasma (Reference 6), it i s d e s i r a b l e t o have good a n a l y t i c a l da t a f o r comparison purposes. Therefore we programmed a d i g i t a l computer t o c a l c u l a t e t h e leakage cu r ren t .
Descr ip t ion of Computer Frogram and Assumptions
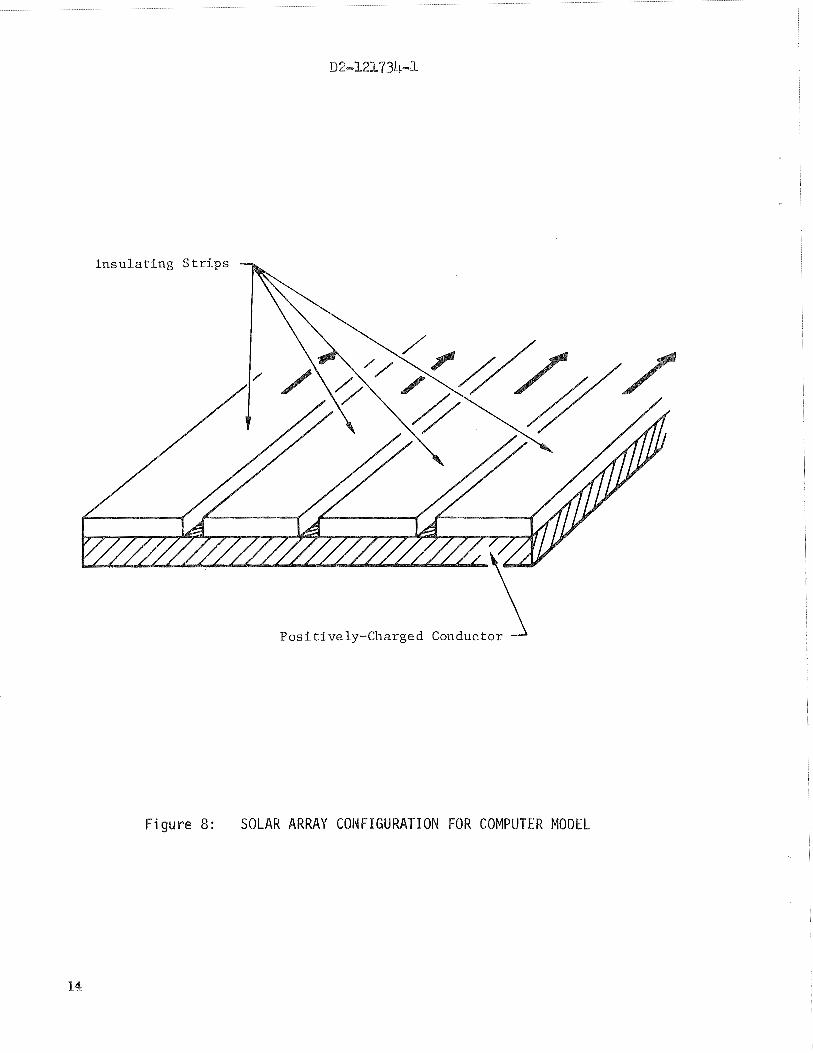
The program numerically- s imula tes t h e c o l l e c t i o n of e l e c t r o n s by a p o s i t i v e a r r a y having quartz-covered s o l a r c e l l s and exposed in t e rconnee to r s . The a r r a y i s assumed t o be a posi t ively-charged conducting plane p a r k i a l l y covered by long, 2 cm-wide i n s u l a t i n g s t r i p s ( ~ i ~ u r e 8) . The gap between s t r i p s i s 0 . 1 cm wide and 0.05 cm deep. The model analyzed cons i s t ed of t he reg ion between t h e center of one i n s u l a t i n g s t r i p and t h e cen te r of an adjacent gap. The conductor i s assumed t o always have 500 u n i t s of p o s i t i v e charge d i a t r i b u t e d f a i r l y evenly over i t s top su r f ace .

F i g u r e 7 : EFFECT OF LEAKAGE CURRENT OH POWER AVAILABLE FOR THRUST
P o s i t i v e l y - C h a r g e d Conductor
Figure 8: SOLAR ARRAY COI \ IF IGURATION FOR COMPUTER MODEL

The computation s t a r t s a t t = 0 wi th 450 u n i t s of bound negat ive charge d i s t r i - bu ted evenly over t h e i m u l a t i n g s m f a c e , and wi th the space above t h o s t r i p and gap conta in ing 2150 f r e e i n d i v i d u a l u n i t s of nega t ive charge having a random v e l o c i t y d i s t r i b u t i o n , The f r e e negat ive charges a r e a t t r a c t e d t o t h e unin- s u l a t e d gap which conta ins 50 ( i , e . , 500 - 450) unneu t r a l i zed u n i t s o f p o s i t i v e charge, Motion of t h e s e f r e e charges is s o l e l y d i c t a t e d by the e l e c t r o s t a t i c f o r c e s produced by t h e p o s i t i v e charges on t h e conductor and t h e negat ive charges bound t o t he i n s u l a t o r su r f ace . E l e c t r o s t a t i c f o r c e s between f r e e charges i s neglec ted . Free negat ive charges which r each t h e conductor during a t ime i n t e r v a l h t a r e assumed t o be immediately e rased s o t h a t t h e n e t p o s i t i v e charge on the conductor i s no t a f f ec t ed . Free negat ive charges which reach t h e i n s u l a t i n g s t r i p become bound. The su r f ace and bulk conduct iv i ty of t h e i n s u l a t i o n s t r i p a r e assumed t o be zero.
A t t h e beginning of t h e next t ime i n t e r v a l , new f r e e negat ive charges cor res - ponding t o those p rev ious ly c o l l e c t e d by t h e conductor and i n s u l a t o r , a r e in t roduced i n t h e reg ion above, wi th prescr ibed p o s i t i o n s and v e l o c i t i e s . I n add i t i on , 11.25 u n i t s of n e g a t i v e charge on t h e i n s u l a t o r a r e e rased a t t he beginning of t h i s second t ime i n t e r v a l . This e r a su re corresponds t o an un- d e f l e c t e d ion cu r r en t a r r i v i n g a t t h e i n s u l a t i n g sur face . I t e r a t i o n o f 100 t o 200 time i n t e r v a l s u s u a l l y produces a f a i r l y s t a b l e , s t eady s t a t e condit ion.
The computer program s t e p s a r e l i s t e d i n Appendix 1.
R e s u l t s and Discussion
Computer leakage-cument c a l c u l a t i o n s made t o da t e were f o r checkout purposes. only, and corresponded t o an u n r e a l i s t i c plasma environmant. However, t h e important r e s u l t , app l i cab le t o t he ionospheric plasma, was t h a t t h e e l e c t r o n c u r r e n t c o l l e c t e d by t h e a r r a y a t +3 k i l o v o l t s was roughly equa l t o t h e i o n cu r r en t dene i ty swept ou t by t h e a r ray . Other s i g n i f i c a n t r e s u l t s a re : ( 1 ) t h e c o l l e c t e d cu r r en t was found t o be p ropor t iona l t o v ~ / ~ where V is t h e vol tage of t h e conductor r e l a t i v e t o t h e undisturbed space plasma, and ( 2 ) more charge accumulated on t h e edge of t h e i n s u l a t o r su r f ace t h a n i n t h e center . We d i d not analyze t h e case where ions cannot r each t h e covers due t o t h e i r being r e f l e c t e d a t t h e sheath. I n such a case , the r e s u l t t h a t e l e c t r o n cu r ren t equals i o n c u r r e n t i s not va l id . Future computer runs can be made t o correspond t o a r e a l i s t i c plasma environment by changing s e l e c t e d input parameters. The use of a d i g i t a l computer f o r numerical ly s imula t ing t h e motion of charged p a r t i c l e s has been used successfully by o the r s (e .g . , Reference 7) and inc reases our confidence i n t h e v a l i d i t y of t h e s e r e s u l t s .
The program i s no t l i m i t e d t o e l e c t r o n c o l l e c t i o n a t exposed in t e rconnec to r s . The program wi th s l i g h t modi f ica t ions , could be used t o c a l c u l a t e e i t h e r i o n o r e l e c t r o n leakage cu r ren t s . C w r e n t s co l l ec t ed through p inholes i n i n s u l a t i o n could a l s o be ca l cu la t ed , a l though a d i f f e r e n t technique may be r e q u i r e d f o r a ve ry smal l pinhole where t h e s u r f a c e r e e i s t i v l t y of t h e pinhole w a l l s i s important .
3.2.2 Future Analysis
The fol lowing proposed a n a l y s i s w i l l e s t a b l f s h t h e magnitude of plasma leakage c u r r e n t s f o r t h e e n t i r e mission def ined f o r t h i s s tudy:

1. Use the computer program j u s t descr ibed t o c a l c u l a t e ion and e l e c t r o n c u r r e n t s t o exposed in t e rconnec to r s on an a r r a y operated a t d i f f e r e n t a l t i t u d e s and d i f f e r e n t vo l tages . P l o t the ca l cu la t ed leakage c m r e n t s a s a func t ion of a l t i t u d e f o r d i f f e r e n t vo l tage l e v e l s .
2, Repeat t h e above c a l c u l a t i o n s f o r d i f f e r e n t s i z e pinholes i n t he i n s u l a t i o n , wi th t h e in t e rconnec to r s i n s u l a t e d and uninsulated.
3. Repeat a few of t h e above c a l c u l a t i o n s wi th t h e fol lowing ref inements incorpora ted , one a t a t ime, i n t o t h e program: ( 1 ) Each f r e e charge f e e l s t h e e l e c t r o s t a t i c fo rces of a l l t h e o t h e r f r e e charges; ( 2 ) a magnetic f i e l d i n f luences t h e motion of f r e e charges; (3) t h e su r f ace and bulk c o n d u c t i v i t i e s of t h e i n s u l a t i o n a r e assigned non-zero values. The r e s u l t s should i n d i c a t e whether o r no t t h e ref inements a re necessary.
3.2.3 Future Ekperimentat ion
V e r i f i c a t i o n o f t h e computed leakage cuxrents i s des i r ab l e . A meaningful experiment could use t h e plasma source descr ibed by Burroughbridge ( ~ e f e r e n c e 8) , w i th a t h i n one square-foot meta l t e s t specimen completely i n s u l a t e d on one s i d e and p a r t i a l l y i n s u l a t e d on t h e o the r s i d e . A s h e e t of aluminum with Kapton bonded t o one s u r f a c e could form the i n s u l a t e d s i d e , and an a r r a y of 2 by 2-cm qua r t z covers bonded t o the o t h e r su r f ace could be t h e p a r t i a l l y in- s u l a t e d su r f ace . The t e s t specimen and plasma source would have t o be i n a vacuum chamber. Various vol tages between 2,000 and 16,000 v o l t s , r e l a t i v e t o t h e s imula ted plasma, would be appl ied t o t h i s t e s t specimen and t h e r e s u l t i n g e l e c t r o n leakage cu r ren t would be measured. The o r i e n t a t i o n of t he t e s t specimen r e l a t i v e t o t h e plasma beam d i r e c t i o n would be va r i ed t o determine t h e e f f e c t of s t reaming ions on the e l e c t r o n leakage cur ren t .
The t e s t should be repea ted wi th t e s t specimens comprised of f l a t meta l s h e e t s covered w i t h o the r i n s u l a t i n g m a t e r i a l s (e ,g . , Parylene, ~eflon-FEP) , and having purposely-induced d e f e c t s ( e .g. , d r i l l e d h o l e s ) .
Important cons idera t ions i n t h e design of t h e complete experiment a r e :
1, W i l l t h e e l e c t r o n shea th around t h e t e s t specimen be s o t h i c k t h a t it extends t o t h e i o n i z a t i o n chamber of t h e plasma source t o a f f e c t t h e e l e c t r o n c u r r e n t ?
2. How l a r g e should t h e vacuum chamber be?
3. How should t h e plasma p o t e n t i a l be e s t a b l i s h e d ?
4. How low must t h e p re s su re i n t h e vacuum chamber be t o reduce i o n i z a t i o n of n e u t r a l a t o m ou t s ide the plasma source t o i n s ign i f i cance?
I s d i f f e r e n t i a l vacuum pumping be-tween t h e i o n i z a t i o n chamber and t h e t e s t volume necessary t o reduce the d e n s i t y of n e u t r a l atoms i n t h e t e s t volume?

The p r i n c i p l e e q u i p e n t r equ i r ed i s :
1, Plasma source ( ~ e f e r e n c e 8)
2. Vacuum chamber, s i z e and vacuum c a p a b i l i t y t o be determined, b u t probably at l e a s t 6 f e e t long, 3 f e e t i n diameter , and capable of t o r r .
El-ectron Emissions from S o l a r C e l l Covers
When photons, ions , o r n e u t r a l s impinge upon quar tz covers , e l ec t rons can be emi t ted by. t h e covers and then a t t r a c t e d by s t r o n g e l e c t r i c f i e l d s t o a nearby uninsula ted interconnectox. For an i n s u l a t e d a r r a y secondary emission has l f t t l e importance.
3.3,l Completed Analysis
Pho toe l ec t r i c Einission
The upper l i m i t of p h o t o e l e c t r i c emission f o r meta ls i n s u n l i g h t i s about 10' 8 amps/cm2 ( ~ e f e r e n c e 9 ) . It thus appears t h a t p h o t o e l e c t r i c emission is no t a problem unless qua r t z f o r some unant ic ipa ted reason has a much l a r g e r quantum y i e l d than metals .
Second,ary Emission from Ions
The cu r ren t d e n s i t y ( j eP i ) of e l ec t rons emi t ted by s o l a r c e l l covers a s a con- sequence of i on bombardment depends upon t h e ion cu r r en t d e n s i t y ( j i ) and the secondary e l e c t r o n y i e l d (g i ) :
The maximum value of ji i s about 5 x lon7 amps/cm2 and occurs a t 300 k i lometers a.s a r e s u l t o f t h e s p a c e c r a f t o r b i t a l v e l o c i t y (v,). The e l e c t r i c f i e l d s from t h e in tesconnectora w i l l undoubtedly s h i e l d t h e s o l a r c e l l covers from a t l e a s t some of t h e incoming ions , s o t h a t t h e expected i o n cu r r en t d e n s i t y w i l l be l e s s than t h i s m a x i m u m value.
The vd-ue o f d i depends upon t h e type of t a r g e t ma te r i a l , t h e i o n i z a t i o n p o t e n t i a l and mass of t h e incoming ion , and the v e l o c i t y of impact. For atomic oxygen ions r red om in ant i on a t 300 km) i n c i d e n t on qua r t z w i th a k i n e t i c energy of 5 e v (corresponds t o spacec ra f t v e l o c i t y ) no publ ished experimental d a t a has y e t been found. However, some experimental d a t a ( ~ e f e r e n c e 1 0 ) i n d i c a t e 8 t h a t low energy (40 ev) helium i o n s i n c i d e n t upon No. 46 g l a s a produce secondary e l e c t r o n s wi th a 25 percent e f f i e n c y ( i .e . , di = 0.25).
Whether o r no t atomic oxygen ions t r i l l produce secondary e l e c t r o n s from qua r t z w i th a 25 percent e f f i c i e n c y i s y e t t o be determined, however t h e f i r s t i o n i z a t i o n p o t e n t i a l of oxygen (13-6 v o l t s ) does exceed twice the work f u n c t i o n o f qua r t z (4.75 c v ) , which i s t h e c r i t e r i o n f o r producing secondary e l e c t r o n emission by low energy i n c i d e n t i o n s .

It t h e r e f o r e appems t h a t secondary e l e c t r o n emission fxom ion impact must be considered a p o t e n t i a l problem f o r an un insu la t ea a r r a y u n t i l it can be shown t h a t t h e covers a r e efPectSv%E;y ~hieleLed ~ f o m incoming ions o r t h a t t h e secon- da ry e l e c t r o n y i e l d is much lower than 27 percent .
Secondary Emission from Neut ra l s
The c u r r e n t d e n s i t y of e l e c t r o n s ( j ) emi t ted by s o l a r c e l l covers a s a consequence of n e u t r a l bombardment 56p"ends upon t h e e f f e c t i v e n e u t r a l cu r r en t d e n s i t y ( j n = Nnqvs) and the secondary e l e c t r o n y i e l d 2,:
The maximum value of j, a t 200 km i s about 10-3 amps/cm2 and is p r imar i ly due t o oxygen atoms ~ t r l k i n g t h e a r r a y a s a r e s u l t of spacec ra f t motion, Since these atoms a r e n e u t r a l , t h e e l e c t r i c f i e l d s from t h e in te rconnector w i l l not s h i e l d t h e covers a s i n t h e case of 'ncoming ions , Note t h a t t h e e f f e c t i v e n e u t r a l b c u r r e n t d e n s i t y (10-3 amps/cm ) i s ab u t 2000 times g r e a t e r than the maximum 9 i o n c u r r e n t d e n s i t y (5 x 10⁻⁷ amps/cm ). Unles sd , i s much l e s s t h a n $ i , secondary e l e c t r o n e d s s i o n by n e u t r a l s would be much g r e a t e r than t h a t due t o ions .
It i s concluded t h a t secondary emission would be an important a rea of i n v e s t i - ga t ion pre l iminary t o t h e design of an uninsulated a r ray .
3.3*2 Future Xork
The e x t e n t t o which e l e c t r o n emission w i l l enhance cu r r en t flow t o t h e a r r a y depends upon t h e e l e c t r o n y i e l d of n e u t r a l s i n c i d e n t on given t a r g e t m a t e r i a l s . The o b j e c t i v e of a u s e f u l t e s t is t o determine the e l e c t r o n y i e l d of atoms and mobcu le s a t r i k i n g m a t e r i a l s a t spacec ra f t v e l o c i t i e s . The fol lowing m a t e r i a l s , u s e f u l f o r high vol tage a r r ays , a r e recommended f o r t e s t i n g :
M a t e r i a l
Q xart z Kagton FEP Tef lon S i lvsr
6 mi ls 2 mi ls 2 mi l s 2 mi ls
The apparatus usea by Greene ( ~ e f e r e n c e 11 ) i n measuring secondary e l e c t r o n emisaion from molybdenum bombarded by helium, neon, argon, and hydrogen n e u t r a l s appears t o be appropr ia te f o r t h e high vol tage s o l a r a r r a y work.
I o n Thruator E f f e c t s
The Mgh vo l t age s o l a r a r r a y may degrade i n power output because o f : ( 1 ) t h e depos i t i on of mercury atoms, emi t ted from t h e thxus to r , onto t h e s u r f a c e of t h e array! ( 2 ) an inc rease i n l o c a l e l e c t r o n and ion d e n s i t y from i o n i z a t i o n of mercmy a t o m by s u n l i g h t ; and ( 3 ) a t t r a c t i o n of e l e c t r o n s and ions , emi t ted from t h e t h r u s t o r , t o exposea po r t ions of t h e a r r ay , A l l t h r e e phenomena could c ~ n t r f b u t e t o le&age c u r r e n t c o l l e c t e d by t h e a r r a y from t h e plasma, causing

added l o s s i n e l e c t r i c a l power output . Fu r themore , d e p o s i t i e d l aye r s of mercury, if t h i c k enough, could o b s t r u c t t h e sun l igh t , f u r t h e r reducing t h e power output from t h e s o l a r c e l l s ,
Mercury Deposition
If mercury i s depos i ted on t h e sur face of t he amay , i t s h igh conduct iv i ty could enhance t h e c u r r e n t c o l l e c t i o n through pinholes i n t h e c e l l covers and i n t h e i n s u l a t i o n , Thick l a y e r s (many Angstroms) of mercury would a l t e r t h e o p t i c a l p roper t iaa of c e l l covers ,
Reference 12 d i scusses t h e mercury condensation r a t e s on s o l a r panels. The r a t e a t which a vapor condenses on a s m f a c e i s determined by t h e d i f f e r e n c e between the a r r f v a l r a t e pL(, and t h e desorp t ion r a t e d .
/'
= t he a r r i v a l r a t e partic16s/cm2-sec = t h e desorp t ion r a t e , p/cm2-sec
d = t h e su r f ace concent ra t ion of adsorbed spec i e s , par t ic les/cm2 S = t h e s t i c k i n g c o e f f i c i e n t
The a r r i v a l r a t e depends on t h e geometry of t h e apacec ra f t and t h e i o n t h r u s t o r mercury emission r a t e . The desorp t ion r a t e depends on t h e temperature of t h e sur face and t h e deaorp t ion energy.
According t o t h e Reference 12, no mercury w i l l condense on an i l luminated s o l a r a r r a y i n vacuum a t one A.U. became t h e temperature of an i l luminated a r r a y i s s o h igh t h a t mercury evapora tes f a s t e r than it condenses. However, it w i l l be necessary t o check t h e f i n a l spacec ra f t d e ~ i g n t o s ee if t h e r e a r e co lder p laces where mercury can condense and cause t rouble .
It would a l s o be ~ppx-opr ia te i n t h e f u t u r e t o analyze t h e mercury condensation on cold s o l a r p a n e b a s t h e i o n t h r u s t o r a a r e t u rned on a f t e r t h e s p a c e c r a f t emerges from t h e Earth" shadow,
I o n i z a t i o n of Mercury
The d e n s i t y of i on ized mercury atoms i n t h e v i c i n i t y of t he a r r a y depends upon t h e emission r a t e of n e u t r a l mercury a t o m by the t h r u s t o r a s w e l l as t h e v e l o c i t y of t h e emi t ted atoms. An ion t h r u s t o r having a one-ampere ion beam and a 90 percent u t i l i z a t i o n e f f i c i ency , would emit 7 X 10¹⁷ neu t r a l s / s ec , according t o t h e fo l lowing equat ion f o r n e u t r a l atom emission r a t e :
1 = i on beam c u r r e n t , amps J = i o n beam c u r r e n t dens i ty , amp/cm2 r = t h x u ~ t o r r ad ius q = e l e c t r o n charge, 1-6 x l0 l9 coulomb n =: p r o p e l l a n t u t i l i z a t i o n e f f i c i e n c y na = n e u t r a l particles/cm-sec
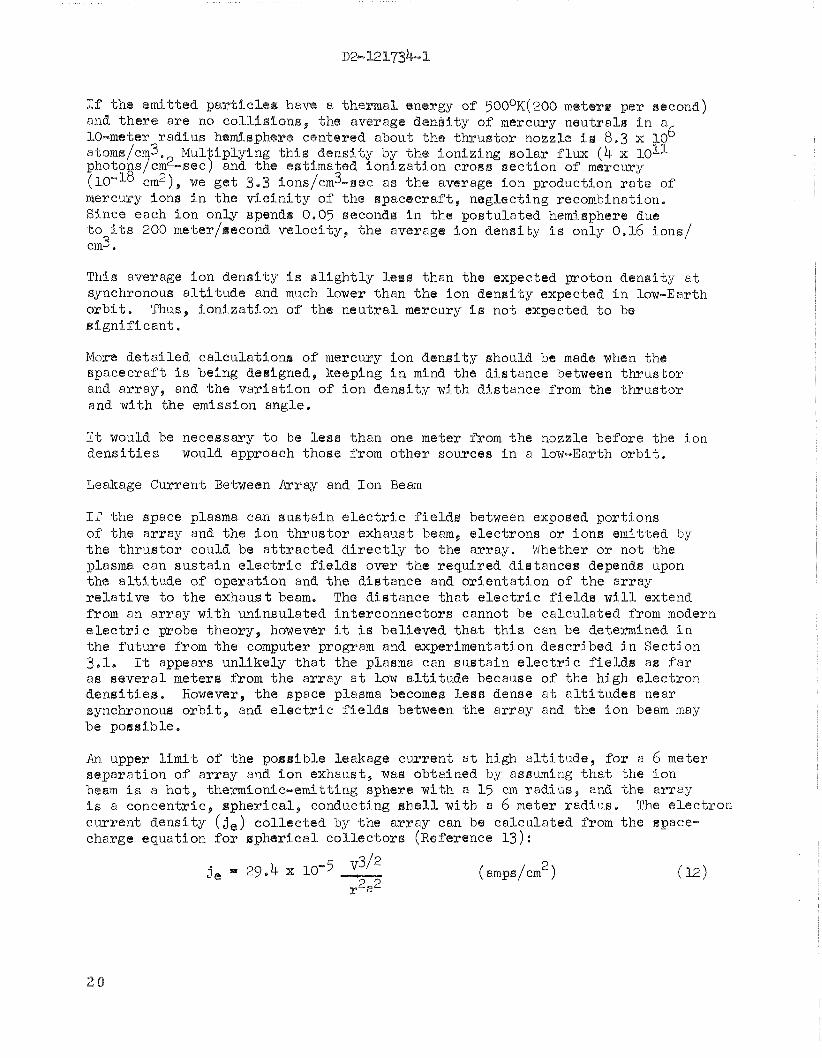
I f t he emi t ted p a r t i c l e s have a t h e m a l energy of 5 0 0 ~ ~ ( 2 0 0 meters per second) and t h e r e a r e no c o l l i s i o n s , t he a m r a g e d e n s i t y of mercury n e u t r a l s i n a lO=meter r a d i u s hemisphere centered about t h e t h u s t o r nozzle i s 8.3 x l o 6 a%oms/cm3. Mul t ip ly ing t h i s d e n s i t y by t h e ion iz ing s o l a r f l u x ( 4 x lox1 photons/cm2-sec) and t h e es t imated i o n i z a t i o n c ros s s e c t i o n of mercury ( l 0 = l 8 cm2), we g e t 3.3 ions/cm3-ssc a s t h e average ion product ion r a t e of mercwy ions i n t h e v i c i n i t y of t h e spacec ra f t , neglec t ing recombination. Since each i o n only spends 0.05 seconds i n t he pos tu l a t ed hemisphere due t o i t s 200 meter/second v e l o c i t y , t h e average ion d e n s i t y i s only 0.16 ions / cm3
T h i ~ average i o n d e n s i t y i s s l i g h t l y l e a s than the expected proton dena i ty a t synchronous a l t i t u d e and much lower than t h e ion d e n s i t y expected i n low-Earth o r b i t . Thus, i o n i z a t i o n of t he n e u t r a l mercury i s no t expected t o be s i g n i f i c a n t .
More d e t a i l e d calculations of mercury ion d e n s i t y should be made when t h e s p a c e c r a f t i s being degigned, keeptng i n mind t h e d i s t a n c e between th rus tox and a r r a y , and t h e v a r i a t i o n of i o n d e n s i t y wi th d i s t ance from t h e th rus tox and wi th t h e emission angle.
It would be necessaz-y t o be l e s s t han one meter from t h e nozzle before t he ion d e n s i t i e s would approach those from o t h e r sources i n a low-Earth o r b i t .
Leakage Current Between Array and I o n Beam
I f t h e space plasma can s u s t a i n e l e c t r i c f i e l d s between exposed po r t ions of t h e a r r a y and t h e i o n t h r u s t o r exhaust beam, e l e c t r o n s o r i ons emi t ted by t h e t h r u s t o r could be a t t r a c t e d d i r e c t l y t o t h e a r ray . Whether o r not the plasma can s u s t a i n e l e c t r i c f i e l d s over t h e r equ i r ed d i s t ances depends upon the a l t i t u d e of o p e r a t i o n and t h e d i s t a n c e and o r i e n t a t i o n of t h e a r r a y r e l a t i v e t o t h e exhaus t beam. The d i s t a n c e t h a t e l e c t r i c f i e l d s w i l l extend from an a r r a y w i t h uninsula ted in t e rconnec to r s cannot be ca l cu la t ed from modern e l e c t r i c probe theory , however it i a be l i eved t h a t t h i s can be determined i n t h e f u t u r e from t h e computer program and experimentat ion descr ibed i n Sec t ion l It appears u n l i k e l y t h a t t he plasma can s u s t a i n e l e c t r i c f i e l d s a s f a r a s s e v e r a l meters from t h e a r r a y a t low a l t i t u d e because of t he h igh e l e c t r o n d e n s i t i e s . However, t h e space plasma becomes l e s s dense a t a l t i t u d e s near synchronous o r b i t , and e l e c t r i c f i e l d s between t h e a r r a y and t h e i o n beam may be poss ib l e .
An upper l i m i t of t h e polssible Leakage cu r ren t a t high a l t i t u d e , f o r a 6 meter s e p a r a t i o n of a r r a y and i o n exhaust , was obta ined by assuming t h a t t h e ion beam i s a h o t , t hemion ic -emi t t i ng sphere wi th a l 5 cm r a d i u s , and t h e a r r a y i s a concent r ic , s p h e r i c a l , conducting s h e l l w i th a 6 meter r ad ius . The e l e c t r o n c u r r e n t d e n s i t y ( j e ) c o l l e c t e d by t h e a r r a y can be ca l cu la t ed from t h e space- charge equat ion f o r s p h e r i c a l c o l l e c t o r s ( ~ e f e r e n c e 13) :

where V = vol tage ( v o l t s of a r r a y retlai;ive t o n e u t r a l i z e r
a" '$ - o h $ 3 + 0.24 - 0.074 2 + . . .
r = r ad fus (cm) of o u t e r sphere ( a r r a y ) ro = r a d i u s (cm) of i nne r sphere ( n e u t r a l i z e r )
Using t h e values V = +3000 v o l t s , ro = 15 cm, and r = 600 cm we f i n d t h a t 2 r = 0 a2 = 2-94 and je 3.63 x amps/cm
Since t h i s c a l c u l a t e d value of je i s f o r a worst-case geometry, t he a c t u a l leakage c u r r e n t d e n s i t y can be expected t o be f a r l e s s , e s p e c i a l l y i f t h e a r r ay Is p a r t i a l l y i n s u l a t e d ,
It would be appropr i a t e i n t h e f u t u r e t o adapt e x i s t i n g d i g i t a l computer programs, which numerical ly s imula te c u r r e n t c o l l e c t i o n , t o t h i s cu r r en t c o l l e c t i o n problem once s p e c i f i c a r r a y geometries a r e known,
3-5 E l e c t r i c a l Breakdown and Leakage Currents on I n s u l a t i n g Surfaces
E l e c t r i c a l breakdown on t h e i n s u l a t i o n su r f ace can occur unless outgassing ope ra t iona l procedures axe used during t e s t and deployment.
3 .5.1 Completed Analysis
Breakdobin s t r e n g t h on t h e aur face of t h e i n s u l a t i n g su r f ace i s a f u n c t i o n of t h e vol tage g rad ien t s , e l e c t r o d e geometry and aur face r e s i s t i v i t y a t t h e gas- s o l i d i n t e r f a c e , The s o l a r a r r a y ambient gas d e n s i t y a t ope ra t iona l a l t i t u d e s w i l l be much below t h a t which w i l l allow impact i o n i z a t i o n and e l e c t r o n avalanche. Howemr,polymericinsulations w i l l have occluded gas and moisture. Polyimides , f o r example Kapton, have approximately 1.3% absorbed mois t u r e a f t e r s to rage a t 507 r e l a t i v e humidity. This moisture is boxnd t o t h e polymer cha in and is r e l e a s e d s lowly i n a space-vacuum environment. I n add i t i on t o mois ture , a l l components of a i r a r e a v a i l a b l e during t h e outgass ing period. I f t h e p re s su re a t a su r f ace reaches t h e c r i t i c a l value a f l a shove r can occur.
Fused s i l i c a c e l l cover were s tud ied i n d e t a i l . The bulk r e s i s t ' v i t y o f fu sed s i l i c a i s 5 x 10¹⁸ ohm-cm and t h e su r f ace r e s i s t a n c e is lo1& ohms per square i n a i r . When an in te rconnector i a exposed t o t h e plasma a c u r r e n t w i l l flow along the edge of t h e c e l l cover t o t h e in t e rconnec to r . . This c u r r e n t flow w i l l be approximately 10"'~ amps wl th 16 kV appl ied ac ros s 0.006 i n c h (0.015 cm) t h i c k , 2 cm wide cover s l i p s . However, much l a r g e r leakage c u r r e n t s a r e expected Prom t h e cover s l i p t o t h e in t e rconnec to r through t h e plasma and shea th r e g i o n due t o secondaries , Therefore, t h i s r e l a t i m l y small cu r r en t w i l l r e l i e v e vol tage g rad ien t s , bu t t h e e f f e c t of t h i s leakage c u r r e n t on t h e plasma leakage cu r ren t appears t o be small .
The cover s u r f a c e w i l l be oxid ized and ionized by t h e plasma, contaminated by t h e n e u t r a l mercury dur ing o p r a t i o n , and a l s o w i t h hydrocarbons dur ing f a b r i c a t e o n and t e s t , These f a c t o r s would make t h e su r f ace r e s i s t i v i t y l e s s t han loxk ohms/squa.re. Conversely, space vacuum w i l l remove contaminants and inc rease t h e r e s i s t a n c e .

Although understanding of su r f ace conduc t iv i ty has increased s i g n i f i c a n t l y i n t h e p a s t 10 yeara a v a i l a b l e information does not enable r e l i a b l e p r e d i c t i o n of su r f ace conduc t iv i ty v m l a t i o n versus t ime i n t o t h e mission ( ~ e f e r e n c e 14),
3*5.2 Pxoposed Experiments
Object ive: To e s t a b l i s h design f a c t o r s r e l a t i n g e l ec t rode s e p a r a t i o n out- gass ing , i n s u l a t i o n su r f ace breakdown and leakage cu r ren t s .
Desc r ip t ion of Tes t Samples:
Tes t samples must have t h e geometry, e l ec t rode and d i e l e c t r i c m a t e r i a l s a n t i c i p a t e d f o r t h e a r ray . Elec t rode m a t e r i a l s a r e s i l v e r , copper, molybdenlm, aliminum, and t in - lead so lde r . Typica l d i e l e c t r i c m a t e r i a l s t e s t e d should be fused s i l i c a , polyimides, poly-p-xylyline, s i l i c o n e s , epoxy, and f luoro- ethylene-propylene . Tes t Apparatus:
A space e f f e c t s t e a t f a c i l i t y would be r equ i r ed which inc ludes t h e fol lowing:
I o n source W - o p t i c a l monochrometer Electron-paramagnetic-regonance measurement apparatus Vacuum chamber 10-7 t o r r Array deployment s imula tor ( t o provide c o n t r o l l e d r a t e of
exposuxe of samples of environment) Mercury contamination chamber D i rec t vo l tage source, 0-32 kV Current , vo l tage and i o n i z a t i o n d e t e c t i o n apparatus
4.0 ENVXRONIVEENTAL EFFECTS
Chemical E f f e c t s of Plasma
The chemical e f f e c t s of plasma a r e t h e most severe a t 185 Ism (100 n a u t i c a l m i l e s ) a l t i t u d e where e l e c t r o n s and ions of oxygen, n i t rogen , helium and o the r spec i e s p r e v a i l . A s synchronous a l t i t u d e i s approached, t h e chemical e f f e c t s of plasma cease t o be s i g n i f i c a n t . Oxygen atoms having a k i n e t i c energy of about 4.3 e l e c t r o n v o l t s a r e t h e s i g n i f i c a n t component a t 185 km. They ox id i ze sur faces of polymers, adhesives, and metals . They cannot reach the s i l i c o n of s o l a r c e l l s , and they do not a f f e c t quar tz . Q u a n t i t a t i v e d a t a on degxada- t i o n of polymers and adhesives a t 185 km i s lacking; however, da t a froin higher-pressure t e s t s suggest plasma-resis tant m a t e r i a l s t h a t need t o be t e s t e d under more app l i cab le condi t ions ,
Completed Analysis
The sea rch fo r b e t t e r suxface p r o p e r t i e s f o r m a t e r i a l s has motivated ex tens ive s t u d i e s o f t h e r e a c t i o n of plasmas w i t h both organic and inorganic su r f aces . Many r e s u l t s of t h e s e l a b o r a t o r y s t u d i e s a r e app l i cab le t o t h e a n t i c i p a t e d ope ra t ing environment of t h e high vol tage s o l a r a r ray . However, t h e h igh vol tage i s unique i n t h a t it can ( 1 ) enhance o r r e t a r d t h e r a t e of i on a r r i v a l tiepanding on t h e p o l a r i t y of elements r e l a t i v e t o t h e e x t e r n a l plasma, and ( 2 ) a c c e l e r a t e i ons s o t h a t t h e y p e n e t r a t e deeper. With r e spec t t o polymer ma te r i a l s (epoxies , polyimides, po lyes t e r s , e tc . ) , t h i s l a t t e r e f f e c t has no t been s tud ied ex tens ive ly i n r e c e n t years .
The spacec ra f t encounters t h e most severe environment a t i t s lower a l t i t u d e s . For exam l e , a t 200 km (108 n a u t i c a l mi l e s ) , t h e d e n s i t y of p a r t c l e s i n about 3 10x0 cm- . With a s a t e l l i t e v e l o c i t y of 7.4 km sec-1, about 10" atoms ~ r n - ~ sec' 1 w i l l be swept out by t h e spacec ra f t , and N o r 0 atoms i n the plasma a t 200 km w i l l be t h e most troublesome r e a c t i v e agent. Nitrogen, helium, argon, and l i g h t e r spec i e s a r e no t nea r ly s o r e a c t i v e a s oxygen. Oxidation r e s i s t a n c e i s t k ~ s an important c r i t e r i o n i n s e l e c t i o n of m a t e r i a l s . A t higher a l t i t u d e s , oxygen ion and atomic r e a c t i o n s w i t h ma te r i a l s w i l l p rog res s ive ly diminish and become l e s s of a problem. Proton and helium i o n spec i e s predominate a t h ighe r a l t i t u d e s b u t t h e i r concent ra t ions a r e w r y low a t synchronous a l t i t x d e .
Metals
Oxygen conta in ing plasma w i l l t h i cken the oxide on meta l surfacea auch a s exposed s o l a r c e l l i n t e r connec to r s . We could f i n d no q u a n t i t a t i v e da t a showing how a p o s i t i v e o r negat ive b i a s enhances ox ida t ion of metals i n plasma. Information about t h e e f f e c t s i n metals f'rom bombardment by ions o the r t han oxygen and by n e u t r a l p a r t i c l e s i s a v a i l a b l e from s p u t t e r i n g and ion implanta- t i o n experiments u s ing non-reactive plasmas such a s argon ( ~ e f e r e n c e 15 ) .
High energy p e n e t r a t i n g ions can produce these d e f e c t s o r d i s turbances i n meta ls , a l l o y s , and o t h e r conductors:

l, Ions can impinge and b a c k s c a t t e r depending on t h e angle of t he i n c i d e n t i o n t r a j e c t o r y ,
2 Ions can pene t r a t e and produce d e f e c t s which enhance hole-e lec t ron com- b ina t ion .
3 , Ions can form i n t e r s t i t i a l s o l u t i o n s which sometimes cause embr i t t l eaen t , f o r example, w i th H+ i ons .
4. Ions can pene t r a t e and r e p l a c e some s i t e s i n t h e s u b s t r a t e l a t t i c e , forming a s u b s t i t u t i o n a l so lu t ion .
5. I o n s can form i n s o l i d l l c l u s t e r s , l ' where t h e surrounding atoms foxm a d i f f e r e n t ordered a r ray .
Coll igan s tud ied the e f f e c t of i on energy on depth of pene t ra t ion . Table 1 taken from h i s work, shows pene t r a t ions up t o thousands of Angstroms. Such depths i n metals a r e t oo shallow t o compromise bulk mechanical o r e l e c t r i c a l p r o p e r t i e s , Local hea t ing could a f f e c t i n s u l a t o r - meta l bonds i f i o n bom- bardment r a t e s were high enough; howeveq t h e i o n a r r i v a l r a t e s i n t h e high vol tage s o l a r a r r a y w i l l be o rde r s of magnitude too low t o produce s i g n i f i c a n t hea t ing .
It appears a t t h i s t ime t h a t t h e plasma w i l l produce only su r f ace e f f e c t s on meta ls on the high-voltage s o l a r a r ray , Experimental work wi th metals w i l l become necessary only if t h e f i n a l a r r a y design i s such t h a t changes i n me ta l su r f ace c h a r a c t e r i s t i c s such a s r e f l e c t i o n s o r emit tance a f f e c t t h e performsnce of t h e high-voltage s o l a r a r ray .
I n s u l a t i o n
Polymer i n s u l a t i o n may be r equ i r ed t o p r o t e c t s o l a r c e l l in te rconnectors from t h e plasma a t low a l t i t u d e s . There a l s o i s t h e p o s s i b i l i t y t h a t polymer in- s u l a t i o n w i l l be used t o cover t h e e n t i r e f r o n t and back su r f ace of t h e s o l a r a r ray . To avoid chen ica l a t t a c k by a c t i v e plasma spec i e s , i n s u l a t i n g m a t e r i a l s should be chemically r e s i s t a n t t o oxidat ion. The l i s t i n Appendix 3 i n d i c a t e s m a t e r i a l s which can be considered. Candidate polymers f o r i n s u l a t i n g t h e backside of t h e a r ray , a s w e l l as a c t i n g a s t he s o l a r c e l l s u b s t r a t e , a r c polyimide ( ~ a ~ t o n ) and polyethylene t e r e p h t h a l a t e ( ~ ~ l a r ) . Hanson ( ~ e f e r e n c e 16) shows t h a t polyimide i s more s t a b l e t o atomic oxygen than polythylene te re- p h t h a l a t e by a f a c t o r of 1 -5 .
The e f f e c t of atomic oxygen a t low a l t i t u d e s on polymer m a t e r i a l s i n g e n e r a l can be r ep re sen ted by t h e fo l lowing sequence of r eac t ions . R r ep re sen t s t h e remaining polymer chain,
Rapid: R. + RO. or R- + OH- Rapid: S low : Rapid :
Short :

Penetration deptb no l i sed to 1 keV for varisug me-mg%el eombimtions
Target mt erial
ZnS:Ag powder
Ilford C-2 Efmuleion Mlm
Single crystal Silicon

w The surface region (100-10,000 A ) of most polymers thus oxidizes rapid ly , f o m i n g peroxy, hydroperoxy, o r alkoxy groups. It i s d i f f i c u l t t o predic t quer.rmtitatively with ava i l ab le da ta t h e extent of surface oxidat ion t o be expected i n the space p l a s m environment, The surface r e s i s t i v i t y w i l l pro- bably drop because of increased e l e c t r o n dens i ty a t the surface. !Phis introduces t h e p o s s i b i l i t y f o r conduction paths generated by high voltages, promoting surf ace breakdown.
The surface oxidat ion predominates with hydrocarbon backbone polymers. With s i l i c o n e polymers another type of atomic oxidat ion sequence can t ake place, a s shown below.
R O * ( a d s ) R ' ( ads ) + O H * (ads)
OH OH
OH OH I I heating
This sequence i s suggested by in f ra red measurements a f t e r atornic oxidat ion of dimethylopolysiloxane. The f i n a l r e s u l t i s Si02 on t h e surface of t h e s i l i- cone i n s u l a t o r o r adhesive, a l a y e r that should d i sp lay high surface r e s i s t i v i t y .
Surface r e s i s t i v i t y da ta on mate r i a l s oxygenated i n vacuum a re scarce. The degree of lo:.:ering of surface r e s i s t i v i t y and i t s inf luence on surface con- d u c t i v i t y and breakdown have not been inves t iga ted ,
The e f f e c t of exci ted oxygen on various polymers i s indica ted i n Table 2 , 4 Mere r a t e s of oxidation a r e expressed i n grms/cm2 -min x 10 and t h e 0 atom
concentrat ion is e s t i m t e d t o be between 1 0 ~ 6 and l0l7 cm-3, a value con- s ide rab ly higher than w i l l be found at a l t i t u d e s above 100 n a u t i c a l miles. m y polymers exh ib i t su r face crackin& when exposed t o atomic oxygen a t 1 .0 tsrr f o r seve ra l ininutes m d e r mechanical s t r e s s , The cracks develop i n t h e surface, and these w i l l mult iply. I n a polyethylene surface, f o r

Table 2: EFFECT OF ATOMIC OXYGEN ON POLYMERS
Rate of,.weight l a s s
I r r a d i a t e d low-density p3lyethylene ( 1 m a d ) I r r a d i a t e d low-density polyethylene (10 m a d ) I r r a d i a t e d low-density polyethylene ( 105 m a d ) Chemically cross l inked low-density polyethylene L9w molecular weight highly branched p ~ l y e t h y l e n e High-density ethylene-butene copolymer Pa lypropy lene Polybutene- Chlorinated high-density polyethylene Chlorinated polyethylene-plus 10% polysul f ide polymer Natura l rubber Natura l rubber-sulfur raw s tock Natura l rubber-sulfur vulcanizate Natura l rubber-peroxide raw s tock Natura l rubber-peroxide cured Commercial hard rubber Vu-lcani zed ethylene-propylene rubber Palystyrene Pdy-3-phenyl- 1-propene pow-4-phenyl- 1-butene Polyvinylcyc lohexane ABS polymers, s e v e r a l types Unplas t i c i z e d poly(vinyl chlor ide) copolymer ~ o l y ( v i n y 1 f l u o r i d e ) Paly te t raf luoroethylene Perf luor ina ted ethylene-propylene copolymer ~ a l y ( m e t h y 1 methacrylate) Polyimide Polycarbonate ~ o l y ( e t h y 1 e n e ~ e r e p h t h a l a t e ) Nylon 6 Nylon 610 Formaliiehyde polymers Polysulf ide ( ch lo roe thy l formal d i s u l f i d e ) Cellulose a c e t a t e
*Low Power, Tracerlab LTA-500A

exmple , t h e cracks range from 0.1 t o 0.01 inches i n s i z e , However, i n t h e hi&-voltage s o l a r a r m y t h e i n s u l a t o r m t e r i a l s m y not be s t r e s sed ad"tcr deployment a t 106 m u t i c a l miles, nor i s t h e oxygen pressure a n y h e r e near one t o r r , msl;her kamlysis and testiaa@; i s reqp;ctrad a f t e r a r r a y m t e r i a l s have been se lec ted and t h e mission p r o f i l e has been es tabl i shed. The previous lab- o ra to ry experiments have not been conducted at t h e appl icable oxygen presswe and exposure time.
Other atomic and i o n i c species, such a s N, H, and poss ib ly NO, i n t h e upper ionosphere, should produce no s i m i f i c a n t e f f e c t s compared t o those expected from atomic oxygen.
Adhesives
For a ro l l -ou t a r m y , t h e adhesive between t h e s o l a r c e l l s and s t ruc tu re has t o be f l e x i b l e as w e l l as i n e r t Lo p l a s m s , and has t o withstand cycling of t e m p e m t u e , These requirements elianinate m n y oxidat ion-res is tant high p e r f o m n c e polymers. The most promising elastomeric adhesives f o r t h i s app l i - ca t ion are the i n e r t f l u o r s s i l i c o n e s having t h e genemb formula
No polymer w i l l be f l e x i b l e a t t h e lowest tempemture expected; however, the f luoros i l i cones kasve about t h e bes t lo~r-temperatwe? c h a r a @ t e r i d i c s p resen t ly ava i l ab le . Adhesives used i n t h e high voltage s o l a r a r r a y a r e norrmally shielded from t h e p l a s m by t h e m t e r i a l s they a r e bonding together . However, i f t h e f i n a l array design includes e l e c t r i c a l l y s t r e s sed adhesives exposed t o p l a s m , then t h e adhesives should be subjec t t o t h e same s e l e c t i o n and t e s t i n g procedure as o the r polymer i n s u h t i o n .
C e l l Covers
m e r e appears t o be no problem associa ted with chemical i n t e m c t i o n o f the p h s m with Si02 s o l a r c e l l covers. Q m r t z tubes are used f o r p h s m reac to r s in the laboratory, and q u a r t z appears t o be q u i t e s t a b l e i n a v a r i e t y of a c t i n t e d p s p l a s m s .

The e f f ec t sf' t h e ionospheric p l a sm on p o l p a r m t e r i a l s i n vacuum can be measured rueasombly we%% i n the laboratory. A l t h o r n the s i rnuat ion experi-- ments w i l l probably involve plPasms of greater density than encomtered i n s p c e even at 100 naut ical miles, the r e su l t can be extrapolated t o the long exposure times.
It w i l l be important t o take selected polymers which have been formed i n t o model insu la tors and observe them f o r s t r e s s cracking and high voltage surface conductivity* This information w i l l support quanti tat ive predictions f o r mechanical and e l e c t r i c a l r e l i a b i l i t y of insulators .
Taze e f f ec t of oxygen and oxygen/nitrogen pusmas on polymer materials used a s insu%L3.tors, a&esives, and 6 ~ b ~ t 1 ' 8 ~ t 6 8 i n a high voltage s i tua t ion needs inves- t i p t i o n , Precise s imuutfon of the space plasma environment may not be possible i n the Xabomtory, however the resu l t should be an accelerated worst- case mater ia l degradation measuremen% f o r lower a l t i tudes . Data required for emlusating maLerials r e l i a b i l i t y and s t ruc tu ra l performance i s outl ined i n Table 3. Specimens with and Without mechanical defects should be tes ted i n plasma a t zero and h i a e r voltages.
Surface Res i s t iv i ty
S t ress Cracking
Insulat ion In t eg r i t y
Ipl%ercomectors
mndidate subs tmte m t e r i a l s m y need t o be tes ted i n t h e i r bonded config- urat ions i n an oxygen-plasma environment.
The p l a s m parmeters can be varied t o some extent t o evaluate t he e f f ec t of a l t i t ude . The resuEting materials performance data w i l l provide t he design a l l o m b l e s necessary f o r f i n a l design.
F a c i l i t i e s Required
For m t e r i a l s evaluations the f o l l o w i ~ f a c i l i t i e s a re needed:
Radio frequency $enemtor, 0-500 w~atts Impedance mlch ing network Plasm mactor , imcluding smple chmber v&cuun! pmps Gas f l o m e t e r , control devices, re@;lalatsrs, and pressure gawe,
4.2 m t m v i s l e t Effects
The e f f e c t s of u l t r av io l e t (IN) rrzdia"con on metals, semiconductors, and insu la to rs has been s r ized by Jaffee and Ritte&ouse ( ~ e f e r e n c e 17). Ud_traviolet r e f l e c t i ng c m t i w s have been developed f o r s o u r c e l l covers t o prevent cell-to-cover adhesives from b e c o d w swque i n space, Solar c e l l s with i n t eg ra l g lass and quartz covers avoid t h e problem of W degradation of t h e cover adhesive. Kowever, i n t eg ra l covers th ick enough t o protect c e l l s f o r 5 years from s;ynchmnous o rb i t protons and e lect rons a= not p r ac t i c a l a t t h i s time (1970). Vstmviole t r e s i s t i n g ~ i n t s a r e used where thermal e d t t a n c e musk be controlled on conventioml s o u r c e l l a rmys .
T2ze high voltage so l a r a r r ay i s more w l n e m b l e t o surl"cace leakage on insul- a t i n g surfaces than a bow voltage array; hence, it i s appropriate t o exmine t h e e f f e c t s of W list on insu la t ing m t e r i a l s .
Completed h l y s i s
No extensive a l t e r a t i o n of surface wet%abil i ty, swface cracking, o r of e lec- t r i c a l charac te r i s t i cs r e s u l t s from W in te rac t ions with polymers, '$he most ser ious W e f f ec t may be t he compromise of mechamical propert ies i n bonded o r o ther s$ructuares, These mechanical e f f e c t s m y ubtimaGely be manifested only u d e r high voltage s t r e s s , I n s d a t o r s and other polymer components may lose modulus o r become s l i g h t l y more b r i t t l e a f i e r prolonged UV exposure. It m y be possible t o design " c h c high voltage so l a r a r ray i n a m m e r t ha t w i l l avoid mechanical and e l e c t r i c a l s t r e s se s i n the surfaces of polymers exposed t o We Any UV degradation invest igat ion should obviously be based on t he s t r e s se s t h a t w i l l probably be encomtered.
Organic materials can receive ioniain@; doses of 108 t o l 0 l l joules/kilogram- year when exposed t o 100 t o 1000 3 wavelength UV i n sunlight i n surface layers
t o 10-7 meters deep. Such doses w i l l i n time severely damage the surface region of a l l known polymers par t i cu la r ly s i l i cones , A s a consequence of cross-linking-type react ions the e l a s t i c i t y of t h e polymer i s i n time reduced, and embrittlcment can occur t o t he point where t he swface w i l l f l ake o r f rac ture when under mechanical s t r e s s ,
f i b s of comercia% phenyl s i l icone, v inyl chloride, and methyl methacrylate mdergo i n a few days appreciable clcolssliabking when exposed t o t he W of s imuhted space sun l i&t a t 7OoC. Such m t e r i a l s as polfietrafluorethylene and polyethylene terephthala te ( m l a r ) a n severely discolored and lose si-if i can t mechanical s t rength and ealonmtion o r f l e x i b i l i t y a f t e r exposure t o t he equivalent of a few weeks t o space sunl i&t .
The subst ra te presents t h e e aspects with respect t o bW degradation:
The dark s ide of t h e substsate, whish must presen- hi&-emi'eteinee s la r f~ce t o space t o keep %he so l a r c e l l s coo%, would nomal ly see l i t t l e W.
The subslsate areas m d e r the so l a r c e l l s see no W.

The sblfastrate areas not covered w i " e c e l l s a r e exposed t o UV wnless pro- tected. These areas can be weuaned mechanically and perhaps e l e c t r i c a l l y p r t i c u h r l . ~ i f the a r ray i s re-rol led and re-deployed.
The exposed substra te m t e r i a l w i l l be subject t o W degradation. Again, unless long term degradation adversely compromises substra te f l e x i b i l i t y and modulus, there i s no problem not already recognized f o r substra te polymers of conventional low-voltage arrays. If, however, t he long W exposure a l t e r s the polymer modulus, cracking may be encountered when the substrate i s ro l led up, a l t e r i ng high voltage s t resses .
f i t u r e Analysis
h y a m l y s i s of the UJ s t a b i l i t y of materials should include a l l wavelengths be-tween 100 and 1000 A. Most of t he avai lable data on W e f f ec t s on polymers relate t o wave1engt;hs between 1000 and 3000 A. Further t e s t i ng i s required t o deternine t he e f f ec t of the lower wavelengths.
a n d i d a t e insulatirt@; materials should include polymers with W s tab i l i z ing addi t ives . Polymer degradation may be prevented or impeded by addi t ives which serve a s UV s t ab i l i z e r s . A su i tab le addit ive must (1 ) compete e f fec t ive ly f o r a l l t h e UV wavelewths--not jus t those observed on Earth and (2) the addi t ives must themselves not in te r fe re with t he ewineer ing properties of t he materials .
"BPoomiw" or segregation of addi t ives t o the surface has been observed i n a high vacuum. UV s t ab i l i z e r s have aot yet been used i n polymers for space; however, fac tors of 3 t o 10 improvement i n W s t a b i l i t y have been observed with current addi t ives , A new c l a s s of W s tab i l i z ing addi t ives uses a nickel complex which ra ther than absorbing UV t rans fe rs the W energy i n a manner t h a t avoids the effects of W.
m q u e coatin@; can a l so be considered i f W turns out t o be a problem. Evaporated alumiulum, a successfull. coating on a polyethylene terephthla te film, W o r % w t e l y present s a conductive surface.
Proposed Experiments
a t r r i iv iole t t e s t i ng i s not c r i t i c a l with respect t o es tabl ishing f e a s i b i l i t y of t he high voltage sobar array. However, the u l t rav io le t 5-year meis tance of any new e l e c t r i c a l l y s t ressed polymers exposed t o W w i l l hsve t o be established pr io r t o f i n a l design of the spacecraft.
Combined mcuum and u l t rav io le t a r t e s sen t i a l i n any simulated space environ- ment t e s t s f o r W* dusabil i ty. 44x1 important W degmdation mechanism i s t he Boss of gas freed from bonds by the UV photons. Pn mbien t Earth-swrface a i r p r e s s u e , t he released gas, p a r t i c d a r l y if it i s axypn, m e d i a t e l y recom- bines with t he surface, and the t r u e d e g r a a t i o n i s not obsened,
me reqased c M b e r , with ion p u p s capabbe of czchieviw t o r r of mcuum, i s madily a v a i h b l e . However, a sshr sfmuhtor w w b l e of producing d t r a - v i o l e t r sd ia t ion down t o 100 fi i s mot a v a i b b l e and m y require development.

E-Zl'i"36c-1
Ion mrnbarbent H f c c t s on Cel l Covers
Opemtion of the s o h r c e l l array at hi& vo3dtage i n a low b s t h orb i t (190 km) can r e su l t i n Ion interact ions on t he cover ghoses , degradim the panel. It i s aLat;icimted tbt t h e c e l l covers w i l l be bombarded with low enerm ions (1 t o 15 k e ~ ) a t f l w e s a s high as 8 x 1 0 ~ ~ isns/cm2-scc. bygen ions wiPL be the pmdominanat sptc ies , and t h e i r energy depends on e l ec t ro s t a t i c charge buildup on the surface of the covers. Calcuht ions show tha t these ions could remove by sput ter ing t h e an t i - re f lec t ion coating from the c e l l covers i n as l i t t l e a s 4 t o 5 months. Removing the an t i - re f lec t ion coatiwg reduces the l i gh t tmnsmit ted through the cover g h s s (o r i n c ~ a s e s t he reflectance l o s s ) by cabout; 3 percent.
The objective of fu r the r s tudies w i l l be t o ver i fy t he significance of the sputtering problem, and t o develop techniques f o r minimizing it. This requires both analysis and experimental work. The ambysis w i l l include: (1) bvelop- men% of a model f o r ionic bombardment species, energies, fluxes, and angles of incidence a s a function of time and a l t i tude ; (2) calculation of t he e lec t ro- s t a t i c charge buildup on the c e l l cover surfaces and i t s e f fec t on ion energy; and (3) c a l c a t i o n of t he r a t e of removal of the an t i - re f lec t ion coating and t h e loss i n cover transmission a s a function of time i n space. Experi- mental work w i l l include: (1) measurement of sput ter ing yie lds (atoms removed/incident ion) f o r oxygen ions impinging on &F2; and (2) embmt ion of t e c h i q u e s f o r ~ n i m i z i n g sputtering.

High voltage gradients a t voids i n polygleric insulat ion and so la r c e l l covers can degrade the perfomlace of the a r m y by promoting voltage breakdown with subsequent increased l e e a g e clusrent and power loss .
A voltage of 16 kV between the p l a sm and the array conductors w i l l produce a gradient of 2700 mil (lo6 ~/crn) i n 6-mil a r ray insulation. Voids and defects i n the i n s u h t i o n genemte loca l e l e c t r i c f i e l d gradient8 that a re higher than ex i s t i n homogeneous insulation.
A f i e l d of lo6 V/cm i s within an order of magnitude of the i n t r i n s i c d i e l ec t r i c s t rength of the insulating materials considered. W i l l the i n t r i n s i c strength be achieved? The answer depends upon the d i e l ec t r i c strength, d i e l ec t r i c constant and conductivity of the insulation a s well as i t s geometry. According t o t he Kilpatrick criterion,bre&down i s possible across a 6 m i l vacuum gap when f i e ld s exceed 3 X 10⁵ ~/cm. (~e fe rencc 18)
Where E = Field Strength, V/CM K d = Cap Width, cm
W4 = Maximum Energy of a a r t i c l e a t Electrode Surface, ev
I n order t o estimate the probabili ty of approaching i n t r i n s i c breakdown of the insulat ion i n the ionosphere, we must know the f i e l d s i n the insulat ion i n and near the surface regions. There i s some confidence i n our under- standing of the surface region of silicon/vacuum and ~ i ~ ~ / v a c u u m , and hence, the i n i t i a t i o n of breakdown i n voids when the a r m y i s operated negative with respect t o the plasma. However, with the a r ray operating posi t ive the p l a s m / i n s d a t i o n interface becomes most important, Mercury layers deposited by the th rus tor would simplify calculations i n the interface problem, but it; is s t i l l f a r from ek c l a s s i ca l cathode. F'ield emission theory cannot be applied t o the p lasm. For example, the cold emission from the plasma i s important i n predicting b ~ a k d o m but emission data are not available. It i s not known whether the i n a b i l i t y of the plasma t o support strong f i e l d s s ign i f ican t ly a f f ec t s i t s e ~ s s i v c properties.

A s a t i s f a c t o r y q_ua%%ta%ive mdesstanding sf the s w f a c e reg ion @f the plasma eEectrode i s not p resen t ly avai lable , ASTM t e s t procedures do not app.S,y, These i s very l i t t l e da ta on insu la t ion breaMawn s t ~ e n g t h i n a vacuwx and none i n which -the cathode i s a dL1ute plasma,
We postula te t h a t t h e plasma " e l e c " 6 o d e ' h i ~ ~ limit cwren.t; andd permi %only non-destructive breakdown as observed by Xiehl (~efesaence 19). Repeating Rieh l ' s experiment f o r the insu la t ion mater ia ls and thicknesses we are considering would be valuable,
The p robab i l i ty of gas - f i l l ed voids increases with increasing insula t ion thickness. Evacuated voids can be present a l s o , The Ki lpat r fck c r i t e r i o n , wi th "d" being the dfame%er of void, can be used t o est imate c r i t i c a l void s i zes . This c r i t e r i o n depends upon void geometry, and can be applied t o spher ica l voids. Using the diameter, the longeat acceler t i o n path i g the void, f o r the gap width, gives d = 0.0003 inch ( 7 @ 5 X lo-' cm) f o r 10 valts/cm applied f i e l d s , The other vacuum gap c r i t e r i a ( ~ r a n s b e r g , Slivkov, an4 Mait land) give l a r g e r c r i t a i @ a l void a i zee (.Figure 9),
Very t h i n insu la to r s , PO"? inch (2.5 X l0"5 cm) can have breakdown s t rengths g rea te r than i n t r i n s i c because of the f i n i t e p robab i l i ty of escape of m c o l l f d e d e lec t rons ( ~ e f e r e n c e 20) , However, the re i s no prackical way t o use t h i s phenomenon because contact with a second layer reduces the escepe p robab i l i ty , H~wever, layered insu la t ion wauld solve the void-size psoblern,
Emission Current
The emission current influences breakfiawn. $d'aben low, i t p r o v i des a current l i m i t a t i o n and when high, space charge increases the f i e l d s a t the emi t t e r , bat a l s o increases t h e re ta rd ing f i e l d i n t h e d i e l e c t r i c . Fowler and Nordheirn ( ~ e f e s e n c e 21) analyzed the f i e l d emission curser&, j, from a metal cathode surface through the tunneling mechanism and obtained:
where eq5 = The Thermal Work Function of Ehectsodbe Ma-berials
Therma l Work F m c t i o n
Tin 4,38 ev Ie ad 3.97 ev Copper 4,89 ev A l d n u m 4-08 ev S i l v e r 4,93 e-v Mo9,ybdenm 4,20 ev
W i = The Per& Level E - F i e l d I n t e n s i t y a% the Emftter h - Planck's Constant w
e =: Elect ron Charge m - Electron Mass

GAP WIDTH (INCHES)---
VACUUM GAP (CM) - Figure 9: VACUUM GAP BREAKDOWN C R I T E R I A

Norclheim (Reference 22) corrected t h i s expression taking i n t o account the Schottky e f f e c t (Reference 23), which was confirmed by Dobrezow ( ~ e f e r e n c e 24), obtaining the Fowler-Nordheim current jm
-6.83 ~ F N = exp (------- E
where @ i s i n eV, E i s ' n ~ / c m , and the functions t ( x ) and f ( x ) with the argument x = 3.79 x lo-$ are tabulated by Good and Muller (Reference 25). Kaminsky (Reference 26) gives an excel lent swnmary of emission,from r e a l surfaces. It i s c l e a r t h a t f o r applied f i e l d s g rea te r than loo v ~ l t s / c m po la r i za t ion f i e l d s become important and they must be considered, I n analyzing Nordheim's correc t ion one must b,? c a r e f u l t o d i s t ingu i sh the ex te rna l applied f i e l d from the f i e l d a t the emit ter .
Non-uniformity of t h e emit ter surface i n t e n s i f i e s the f i e l d so t h a t E i s replaced by a.73 i n t h e emission current expresslon. Values of m as high a s 30 'have been measured f o r Schottky emission (Reference 27). We are concerned only with e lec t ron discharges s o the non-uniformity of the cathode i s most important. Non-uniformity of the anode influences the character , s t a b i l i t y , and dura t ion of t h e discharge but not i t s i n i t i a t i o n . Cell , g r id , and interconnector surfaces w i l l be important when they a r s negative with respect t o t h e plasma. The e f f e c t of non-uniformity of t h e plasm8 as a cathoiie has not been establishefi.
Ef fec t of Mercury
The p robab i l i ty of n e u t r a l mercury from the th rus to r coating the a r ray i s analyzed elsewhere i n t 5 i s r epor t . Were such a l ayer t o form, it would provide a meta l l i c sheet bstween the plasma and a r ray insula t ion. This l sye r w i l l be non-uniform because of the vapor pressure and surface tension (Reference 26) of mercury. The mercury patches would provide the l a r g e s t conductive surface t o t h e plasma and would be wi th in a few vo l t s of plasma p s t e n t i a l below lo4 kilometers a l t i t u d e and wi th in a few tens of v o l t s of plasma p o t e n t i a l a t higher a l t i t u d e i n an equil ibrium s i t u a t i o n . It seems l i k e l y t h a t only t r a n s i e n t surges i n the current , due t o the i n s t a b i l i t y of the sheath region i n a streaming plasma, could p ~ s s i b l y be large enough t~ s t a r t a i s c arge. We est imate t h a t such currents w i l l be under 1 amp/cG i n a 1OVa c$ l o c a l spot . This cur r sn t wou3.1 be to9 low t o i n i t i a t e a d i s c h ~ r g e s lnce a t y p l c a l requirement 1 s LO amp/cm . Voids
Speci f ica t ions f o r s o l a r z e l l covers supplied by Opt ica l Coating Laboratory, Inc. allow bubbles as large as 0.003 inch diameter i n Corning 0211Microsheet. Speci f ica t ions f o r covers of Corning No, 7940 fused s i l i c a allow the following s i z e bubbles.

Cover Thickness Inches - ------L-..-- -- Greater than 0.025 0.015 t o 0.025 Less than 0.036
Maximum Bubble Diameter, Inches
0.015 0.010 0,003 open
Included bubbles of l e s s than 0.005 inch are permitted i n a l l cover thick- nesses. Three bubbles of t he maximwn s ize specified a re permitted fo r a 1 x 2 cm area.
Small quant i t ies of a i r are entrapped i n so la r c e l l covers and other insula t ions during production. This a i r creates small pinholes or voids. Also small v ~ i d s may appear when insu la t ion surfaces are bonded together or when r e s in s a re used t o impregnate open evacuated cavi t ies . The gas i n voids w i l l be a t near one atmosphere i n pressure ( ~ e f e r e n c e s 19, 20, 27). Assuming t ha t these vaids are embedded or sealed within the insula t ion i s thebas i s of a f i r s t analysis . A second analysis i s based on the probabi l i ty of an open void o r p i t being created by a micrometeoroid.
Closed Voids
An analysis was based on the following conditions:
1, Void diameter i s 0.001 inch (0,0025 cm) 2 , void i n t e rna l pressure i s 760 t o r r 3. Thickness of insula t ion i s 0.020 inch (0.0'51 cm) 4, Insula t ion d i e l e c t r i c constant i s 4.0
Then
Pd = 2.5 x 10-3 x 760 = 1.9 torr-cm
where P i s pressure and d i s spacing. As shown i n the Paschen's law curve, ( ~ i g u r e l o ) , the ionizat ion po t en t i a l of res idua l gas within the void i s 310 volts ac, or 440 vol ts 'dc.
The gas void within the d i e l e c t r i c can be modeled as three capacitors i n s e r i ea as shown i n Figure 11.
where V i s the applied voltage, V i s the ionizat ion po ten t ia l , t and E are the thickness and d i e l e c t r i c consiant of insula t ion as defined i n Figure 11.
This analysis shows t h a t t he gas within the void w i l l ionize when a voltage of 2530 vdc i s impressed acraas t h i s 20-milsethick insula t ion. This i s only 125 volts/mil o-ratbng voltage. The ionized gas w i l l tend t o enlarge the vaid. If the void breaks open, it w i l l become evacuated and be an open %.aid e


SCHEMATIC OF VOlD IN INSULATION
El = Eg = DIELECTRIC CONSTANT OF SOLID INSULATION = 4.0
E2 = DIELECTRIC CONSTANT OF GAS IN VOID = 1.0
tl+t2+t3 = THICKNESS OF SOLID INSULATION = 0.020 lNCH (0.051 cm)
+2 = THICKNESS OF VOlD = 0.001 INCH (0.0025 cm)
V = TOTAL IMPRESSED VOLTAGE
V, = IONIZATION VOLTAGE WITHIN VOlD = 440 VDC
V2 = VOLTAGE ACROSS VOlD
EQUIVALENT CAPACITORS
F i g u r e 11: MODEL OF VOID I N SOLID INSULATION

A gas - f i l l ed void next t o an e lec t rode can be anawzed i n t h e same way as an eabedde3 void, The a i m ~ l i f i e d equation f o r ioniz ing p o t e n t i a l i s
t 1 0 ,019 V = V1 (1 + ) - 440 (l t- -- ) = 2530 vol ts t2C1
I n i t i a l pressure and spacing are assumed t o be the same f o r the embedded VB id .
Open void.
If t h e spac%ng=pressure dimensions ( P x d ) f o r the void or crack i s l e s s than 10-3 %err-centimeters, the p robab i l i ty of discharges within the void a re neg l ig ib le , This i s because the mean f r e e path is s o g rea t t h a t gas ion iza t ion cannot occur unless severa l thousan1 vo l t s are applied d i r e c t l y t o the void, A closed void with a i r a t 760 t o r r pressure would have t o be smaller than 0,0035 n i l ( 0 ~ 0 0 ~ 3 cm) i n diameter t o have a PJ product of l e s s than 10-3 An open void wouXd normally outgas i n vacuum within 3 hours t o a P ~ I of 16-3.
The r e m i n i n g insu la t ion outside of the void w i l l have an increased voltage gradient a s a consequence 3.f the void,
Futaxre h a l z i s and E x ~ r i m e n t a t i o n ----- --- The deter;n%na"l;on of the c a p s b i u t y of fased s i l i c a s o l a r c e l l covers and other d i e l e c t r i c mater ia ls , requires measurement of the breakdown character- i s t i c s with c u r r e n t - l i d t e d pager sources. The re la t ionsh ips between break down streazgth with meta l l i c e lec t ro4es and those with t h e ionospheric plasma ac t ing a t an e lec t rode a r e not y e t known with assurance.
Two types of t e s t i n s are rsquired , Th9 f i r s t w i l l e s t a b l i s h fundaraentals w i q t h e duoplasmatron. The second w i l l e s t a b l i s h pe r t inen t c h a r a c t e r i s t i c s of a v a r i e t y of insu la t ions i n a current- l imited breakdown enviroment. Chmge builrl-up on Insu la t ing surfaces of the a r ray can be inves t igated with a duoplasmatmn, which can deposit ions on polymer insula t ions and on s o l a r c e l l covers, g a r n e r s and c e l l covers wlth se lec ted types of de fec t s , such as vs ids an3 plnboles, can be placed wi th in the ion beam and the leakage currents can be measurad. Surface r e s i s t i v i t y can a l s o b? measared with a u x i l i a r y electrodes.
Pr inciple of Operation of the Duoplasmatron
Ths duoplasmatron has a chember in which a canstrained plasma i s generated by e lec t rons emitted i n t o a gas within a magnetic f i e l d , and ions ext rac ted from the plasma a re focused by e l e c t r i c f i e l d s on t h e t e s t specimen (Figure l2).
The e lec t rons e n t t t e d f r o n an oxide-coated cathode i n t a the gas f i l l the a r c region, maintaining an s rc a s c h a r g e between cathode and anode. This discharge i s focuse3 on the center clf the anode by the intermediate e lec t r sde t k o ~ g b t h e fo rna t ion o f a bba?sble-shaped e q d p o t e n t i a l (anode b r igh t l a y e r ) , The plasma formed by t he discharge i s a3ditionaU.y constrained by makiw the intermediate e lec t r sde and &!ode the poles of an electrcmagnet,


E ~ i s coinbfslcd focus-ing a c t i o n pro%r%da,s an extremely dense p l a s m wi th a hlpr- curr;?rti; dens i ty a t t he c e n t e r of t h e anode, To prevent e ros ion , t h e anode b a s ;. slaa%'i. tungsten i n s e r t with a very sme.I.1 ape r tu re , The piasma exules thx:;ugh t h k sapea.t#~;%e and i s thus a v a i l a b l e f o r extrarstiol? t o form B n i o n
The e x t r a c t o r i s he ld a h high nega t ive p o t e n t i a l t o a t t r a c t p x i t i v e ions iu-om t h i s plasnaa. The e x t r a c t o r i s shaped t o produce a beam of lolls which k e n passes through the e i n z e l l e n s f o r ~ ~ ~ e d by t h e gaps between t h e l ens e l ~ c t r o d e end i t s neighbors , The f o c a l length of t h i s l ens i s va r i ed by adju-sting the p 2 t e n t l a l of t he l e n s e l ec t rode r e l a t i v e t o t h a t of t he e x t r a c t o r ,
The botto,n p l a t e i s he ld a t t h e e x t r a c t o r p o t e n t i a l t o r e - acce l e ra t e t h e beum i n t o t h e t a r g e t cham73er.
The 3uopiasmatron r e q u i r e s a vacuum pump and a gas Peed sys t en , The major gas load on t h e vaculrn pump i s t 3 e neu t r a l i zed beam, Since l , O ma of beam produces adbout 0.2 micron- l i te rs per second of gas flow, a p~ ping speed of 203 L i t e r s p-r second i s r e q u i r e 3 t c ~ maintain a vacuum of lom8 t o r r i n t h e absence of' any o the r gas load ,
Cwrent-Limited Breakdown Apparatus
Many saryl-es of' c e l l covers and o the r i n s u l a t i n g m a t e r i a l s w i l l have t o be t e s t e d f o r d i e l e c t r i c s t r eng th . I t i s no t l i k e l y t h a t i n s t r u n ~ ~ n t a t i o n l i k e the duoplasmatron w i l l b; p r a c t i c a l f o r any except bas i c s t u d i e s , Simulat ion which provides a means of measuring d i e l e c t r i c breakdown under cu r r en t l i m i t e d condit ions i s necessary, For t h i s , t h3 work descr ibed i n Reference 2 1 is app l i cab le , and i s summarized below.
Nm-des t ruc t ive breakdown (NDB) in Mylar f i lms was observed i n t h e Laboratory us ing apparatus which Limited the c u - s e n t ava i l ab l e t o t h e sample, NDB was 6 observed a t 6 9 3 0 vol ts / rni l (2,7 x LO vol"c/cnn), which i s h igher than t h e vo l t age grad ien t s axliicipated f o r t he s o l a r c e l l i n s u l a t i o n , It i s i n t e r e s t i n g that j'or ~1arren-t limited condi t ions NDB occu r re l only with m e t a l l i c cathodes. Breakdown w i t A n3n-metal i c cathodes d i d not occur a t vo l tages exceeding k 15,000 vol t s /mi l (6 x 10 volts/cm). The conclusion was t h a t e l e c t r o n i n j e c - t i o n from a m e t a l l i c c a t h ~ d e was necessary.
These t e s t s were made i n a vacuum chamber a t lou5 t o r r . The c i r c i i i t r y i s shown i n Figures l 3 a and l3b. Dsta were obtained both wi th and without i j_l i lntnat ioa~ of the sample by t h e 3660 Angstroin l i n e of a mercury lamp. Ill.nini.nation rzduced the NDB of a 0,16 m i l t h i c k sample fram 7500 val"c/mil t o 7200 trilhs/rnil, This information a i d s i n t h e theore t ica l . explana t ion of' NDB, ~ n d i n d i c a t e s t h a t the decrease i n d i e l e c t r i c s t r e n g t h wwith iLLumin~tkon i s not s i g n i f i c a n t Tn t h e app l i ca t ion of Mylar a s an i n s u l a t i o n ,
A Li;bougb Limited, t h e curren dens i ty s t i l l was 103 amps/cm2 f o r a channel of app rox iu l t e ly 4 x LO-4 ~ m ' i n t hese t e s t s . c u r e n t dens i ty ava i l ab l e

a . TEST APPARATUS
DC VOL
STRAY CAPACITANCE = 100 pF
TEKTRONIX 519 6
POLAROID CAMERA
b . ELECTRICAL Cl RCUIT
PULSE GEN
SAMPLE
Figure 13: CURRENT LIMITED BREAKDOWN STUDY

6 f r ox %he plaslua is lesw by a f a c to r of 10 . It thus appears t h a t the bse&down voltage for Laater ia l% such as Mybar and Kapton can be very high .erhen %he ionosy?%aeric plasma i s the cathode.
8hown i n Figure 14 i s another conceptual design of a f i x tu r e f o r t e s t i n g i~laubat ing m a t e r i ~ l s . The basic: r s ~ i r e m e n t of l imi t ing the current t o simirlate a plasma source i a achieved by u i n g a high r e s i s t i v i t y li uid as one e lsc t rode. Liquids wlth r e s i s t i v i t i e s i n the range l o l l t o 10'' ohm-cm are d i e l e c t r i c grade cas to r o i l , g lyceryl t r i-acetoxy-stearate and s i l i c a t e - e a t r f l u ld . Using electrodes of these materials w i l l Umit current t o about lom8 amp/cm2. l l e c t r s d e l iqu ids f o r higher o r lower current i iensi t ies are avai lable ,
Test Progran f o r I n s d a t i n g Materials
A t e s t prsgram "t envisioned which w i l l provide the data necessary for design of the insu'Lathon system used t o operate i n the h o s t i l ~ space plasma environment, Bowever, t o p u t t he insu la t ion requirements i n t o pzrapzctive, examine the construction of the s i l i c o n so l a r c e l l . Shown i n Figure 15 a re the e lec t rode system f o r a so lder less so l a r c e l l and a metal l ized d i e l ec t r i c capaci tor , The e lect rode systems a re s imi lar . Theae capacitors expose semral square f e e t of insu la t ion i n each un i t t o possible breakd~wn. Since it i s not pract icable t o use fau l t - f ree d i e l ec t r i c a an electrode system was developed which enables the capacitor t o be s e l f healing, When a f a u l t occurs t he high current aensi ty %n $he electrode a t the f a u l t vaporizes the metal and c lea rs t he f a u l t . There are over a b i l l i o n of these s e l f healing capaci tors i n use i n t he telephone system, A s shown i n Figure 15, a n a i l can be driven i n t o the capacitor w i t h no 111 e f f ec t , It i s postulated t h a t the s i l t c o n so l a r c e l l with s i l v e r - t f t a n i m contacts may now be se l f -c lear ing o r can be made so with &nor charages i n the s i lverpt i taniwn electrode. A micrometeosoid puncture would then cause only a momentary shor t c i r cu i t . A t e s t program f o r d e t e r d n i n g d i e l e c t r i c s t rength and r e s i s t i v i t y of d f e l ec t s f c mater ia ls under siml1ated operating conditions i s sumrnarize.3 below.
caP Materials t o be Tested -------.------ S oecimen Descr - - h - - - - -
Polyimides ( apto on) 0.25, 1.0, 5.0 mlls th ick sheet Poly-p-xylylene ( Parylene ) 0.1, 1.0, 5.0 mfls th ick deposited on
e lect rodes Si l icone 0.5, 1.0, 5.0 a i l s th ick deposited on
electrodes Fused S i l i c a Cover s l i p s , 3.0, 6.0, 10.0 mils th ick ,
with selecte.3 voids Microsheet, 021% C ~ r n i n g c 2 1 ~ s s Cover S l ips , 3,0, 6.0, 10.0 mils th ick E P ~ X Y 0.25, 2.0, 5.0 m i l s t h ick sheet Flu-oro-etmlene-propylene 0.5, 1.0, 5.0 n i l s th ick deposited on ( ~ e f lon-FEP) e lect roaes
The major items of apparatus required fo r t h i s testirag are :
Duoplssmatr~n and a m i U a r y equfpment (Figure E) Current l i d t i n g d ie lec%r ic brealsdown t e s t a p p ~ r a t u (I?igure 13) 8 Vacuum chanT?er, b cubic foot volume, capable of LOw t o r r vacuum.

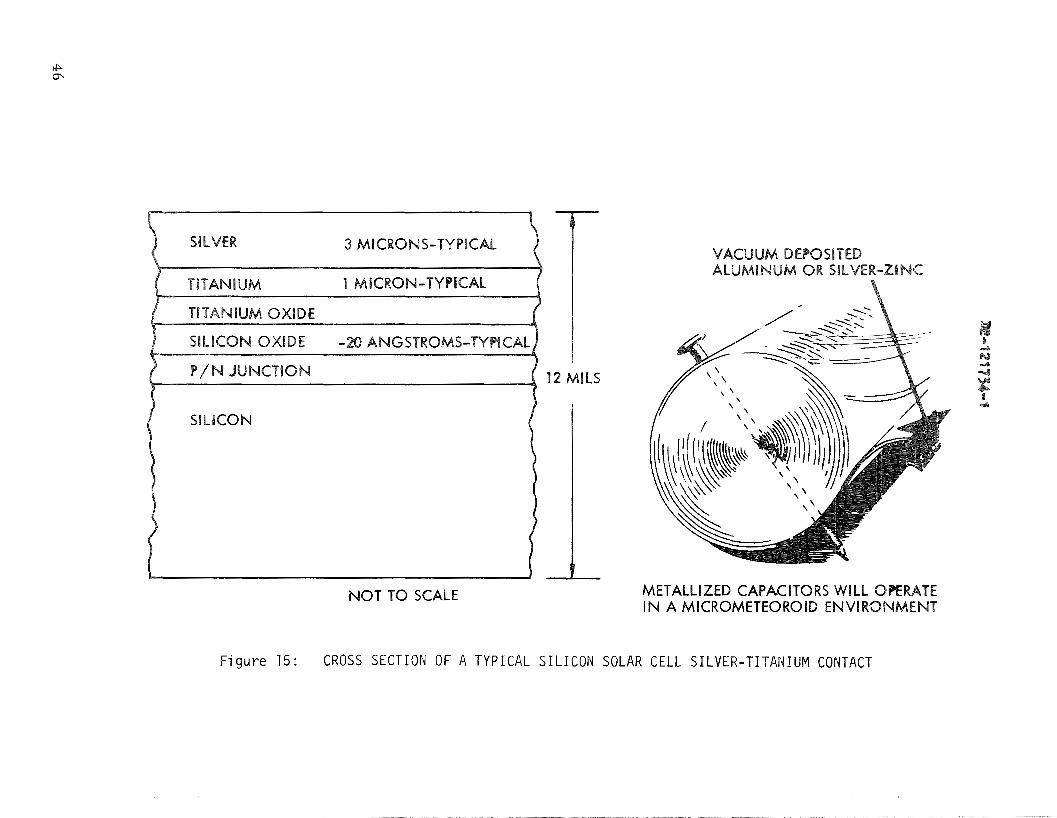
3 MICRONS-TYPICAL -f
NOT TO SCALE _L
VACUUM DEWSITED ALUMINUM OR SILVER-ZINC
METALLIZED CAPACITORS WILL OPERATE IN A MICROMETEOROID ENVIRONMENT
F igu re 15: CROSS SECTION OF A TYPICAL SILICON SOLAR CELL SILVER-TITANIUM CONTACT
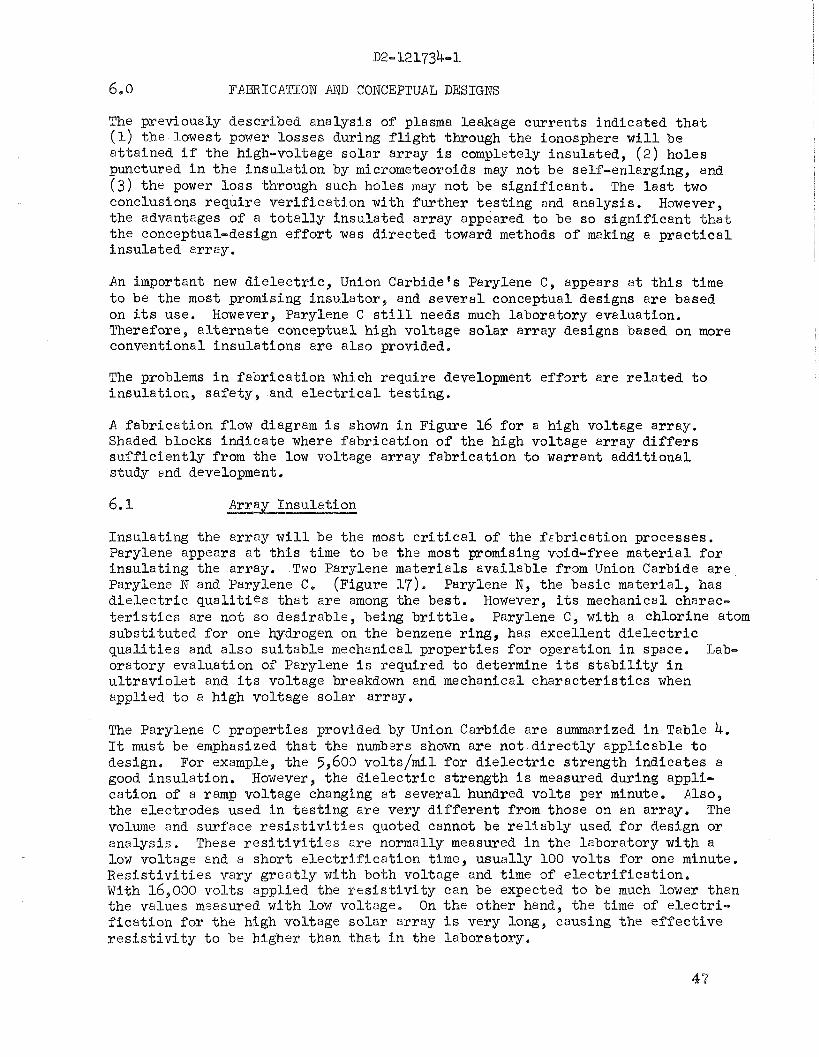
6. o FAFBICATIOW AND CONCEPTUAL DESIGNS
The previously described a n a w s i s of plasma leakage currents indicated t h a t (1) the lowest power losses during f l i g h t through the ionosphere w i l l be a t t a ined if the high-voltage s o l a r a r ray i s completely insula ted , ( 2 ) holes punctured i n t h e insu la t ion by micrometeoroids may not be self-enlarging, and ( 3 ) the power l o s s through such holes may not be s ign i f i can t . The l a s t two conclusions requ i re v e r i f i c a t i o n with f u r t h e r t e s t i n g and analysis . H~wever, the advantages of a t o t a l l y insula ted a r ray appeared t o be so s i g n i f i c a n t t h a t t h e conceptual-design e f f o r t was d i rec ted toward methods of making a p r a c t i c a l insu la ted array.
An important new d i e l e c t r i c , Union Carbide's Parylene C , appears a t t h i s time t o be the most promising insu la to r , and severa l conceptual designs a r e based on i t s use. However, Parylene C s t i l l needs much laboratory evaluation. Therefore, a l t e r n a t e conceptual high voltage s o l a r a r ray designs based on more conventional insu la t ions a re a l s o provided.
The problems i n f a b r i c a t i o n which require development e f f o r t a re r e l a t e d t o insu la t ion , sa fe ty , and e l e c t r i c a l t e s t i n g .
A f a b r i c a t i o n flow diagram i s shown i n Figure 16 f o r a high voltage ar ray . Shaded blocks ind ica te where fabr ica t ion of t h e high voltage ar ray d i f f e r s s u f f i c i e n t l y from the low voltage a r ray f a b r i c a t i o n t o warrant add i t iona l study and development,
Insu la t ing the a r r a y w i l l be the most c r i t i c a l of the f ~ b r i c a t i o n processes. Parylene appears a t t h i s time t o be t h e most promising void-free mate r i a l f o r insu la t ing the array. Two Parylene mater ia ls avai lable from rJnion Carbide a re Parylene N and Parylene C. ( ~ i g u r e 17). Parylene N, the bas ic mater ia l , has d i e l e c t r i c q u a l i t i e s t h a t are among the bes t . However, i t s mechanical charac- t e r i s t i c s are not so des i rab le , being b r i t t l e . Parylene C , with a chlor ine atom subs t i tu ted f o r one hydrogen on t h e benzene r ing, has excel lent d i e l e c t r i c q u a l i t i e s and a l s o s u i t a b l e mechanical proper t ies f o r operation i n space. Lab- ora tory evaluation of Parylene i s required t o determine i t s s t a b i l i t y i n u l t r a v i o l e t and i t s voltage breakdown and mechanical c h a r a c t e r i s t i c s when applied t o a high voltage so la r array.
The Parylene C p roper t i e s provided by Union Carbide are summarized i n Table 4. It must be emphasized t h a t the numbers shown a r e not d i r e c t l y applicable t o design. For example, the 5,603 volts/mil f o r d i e l e c t r i c s t r eng th inciicates a good insula t ion. However, t h e d i e l e c t r i c s t r eng th i s measured during appli- ca t ion of a ramp voltage changing a t severa l hundred v o l t s per minute. Also, the electrodes used i n t e s t i n g a r e very d i f f e r e n t from those on an array. The volume and surface r e s i s t i v i t i e s quoted cannot be r e l i a b l y used f o r design or analys is . These r e s i t i v i t i e s are normally measwed i n the laboratory wi th a low voltage and a shor t e l e c t r i f i c a t i o n time, usual ly 100 vo l t s f o r one minute. R e s i s t i v i t i e s vary g r e a t l y with both voltage and time of e l e c t r i f i c a t i o n . With 16,000 v o l t s applied the r e s i s t i v i t y can be expected t o be much lower than the values m3asured with low voltage. On t h e o ther hand, the time of e l e c t r i - f i c a t i o n f o r t h e high voltage so la r ar ray i s very long, causing t h e e f f e c t i v e r e s i s t i v i t y t o be higher than t h a t i n the laboratory.

CONNKTBR CONWCTOW SUBSTRATE WLAR CEQLS COVEBStlDES MATERIAL MATERIAL MATERIAL
o INTER-MOWLE o MOWLE-TO-BUS
BOND OR PRINT CONDU TO SUBSTRATE
CONNECT TO
BOND ELECTRONICS PACKAGES TO PANEL
ASSeM%LE nlKVUWE-MUNTED ELKTRONICS PACKAGES
F i g u r e 16: F A B R I C A T I O N FLOW DIAGRAM

PARYLENE N
PARYLENE C
Figure 17: ' PARYLENE CHEMICAL STRUCTURE
Charac te r i s t i c --------- Value .- Remarks ------ Die lec t r i c Strength ( shor t time) 5,600 ~ / M i l 0.001 inch t h i c k specimen
Volune R e s i s t i v i t y 23OC, 50% RH 8.8 x l ~ ~ ~ o h m / c r n Surface R e s i s t i v i t y 1014 ohms/sq. Die lec t r i c Constant 3.10 1,030 Hertz Diss ipat ion Factor 0.019 1,000 Hertz Elongation t o Break 23% Yield St rength 8,030 PSI Linear Coefficient of Expansion 3.5 x ~ o - ~ / O C
Table 4: SUMMARY OF Pd3PERTIES OF PARYIXNE-C
The d i e l e c t r i c constant of Parylene i s 3.1, a reasonably high value, A high d i e l e c t r i c constant is des i rab le because the insu la t ion w i l l b? i n s e r i e s with the vacuum of space and the voltage gradients a re inverse ly prapor t ional t o the S i e l e c t r i c constant and conductance. The d i s s ipa t ion fac to r af Parylene C i s high compared t o Parylcne N and other low l o s s d i e l e c t r i c s . However, f o r the d i r e c t voltages of the s o l a r a r ray the d i s s i p a t i o n f a c t o r i s not c r i t i c a l The mechanical c h a r a c t e r i s t i c s appear adequate. ha long at ion t o break" i s important because of the requfrenents of a ra l l -up ar ray and the large tempera- t u r e va r ia t ions i n an ec l ips ing o r b i t . The coef f i c ien t of expansion of Parylene i s low i n comparison with o ther organic coating mater ia ls , but i s s t i l l high i n comparison with fused s i l i c a with which it w i l l be i n contact ,

The e f f e c t of thickness on voltage breakdown of' Pagrlene is shown i n Figure 18. Direct m l t a g e was used by Union Carbide i n sbtainiilg the data , however "ee voltage was applied rap id ly and breakdown occurred i n seconds or minutes, Electrodes were meta l l i c and current was not l l d t e d . Thus the t e s t , although useful , cannot be corre la ted with the high voltage s o l a r a r ray oporat- i n g configma"eon or enviranment, The Union Carbiibdata do suggest t h a t 3 t o 5 mils may be adequate i n s u l a t i o n f o r the high voltage array.
100 1 .o 18 so loo
THICKNESS, MICRONS
Figure 18: B R E A K W N VOLTAGE OF PARYLENE C VS POLYMER FILM THICKNESS
The Parylene deposi t ion process developed by Union Carbide i s shown i n Figure 19. This pracess may provide a t r u e pinhole-R'ee conformal insu la t ion , The Parylene polymer i s deposited Prom vapor a t about 0 , l t o r r pressure, a t which the mean f r e e path of th? gas molecules i n the deposi t ion chamber i s about 0.1 cm. Therefore, unlike vacuum metalizing, the deposi t ion i s not l ine-of-sight , and a l l s i d e s of an object a re encapsulated unifor~nly by the gaseom mononer. This produces a t r u l y conformal coating t h a t can flow arounfi t h e c e l l connectors and coat t h e underside of the connectors, as wel l as the t o p s i d e , It w i l l a l s o coat a l l exposed p a r t s of the s o l a r c e l l s and s o l a r ar ray .

1) VAPORIZE E
CH2
PARA-XYLYLEN E POLY(PARA-XYLYLEN E)
Dl-PAM-XYLYLEN E ""DX N8' (6) IMER)
(MONOMER) PARYLENE N (POLYMER)
VAPORIZER PYROLY Sl S DEPOSITION CHAMBER
MECHANICAL . . . - - - - - .
F igure 19: PARYLENE DEPOSITION PROCESS VACUUM PUMP

Three approaches a re pos tula ted f o r the use of Parylene C. The f i r s t approach, and the most conventional, i s t o vacuum deposi t the Parylene on completed modules of t h e s o l a r a r ray , Masks would be used t o prevent deposit ion of p ~ ~ e r on the quartz c e l l covers, The Parylene covers a l l exposed areas with insu la t ion , After deposit ion, the masks are removed leaving a panel t h a t i s 100 percent insula ted ,
The second. approach i s t o bu i ld the a r ray but leave off the c e l l covers. The e n t i r e panel i s then coated with Parylene, and the covers are bonded on t h e Parylene. This approach el iminates masking and gives a continuous insu la t fon over the e n t i r e panel.
The t h i r d approach i s t o use Parylene as an insu la t ion and as a thermal c o n t r o l coating i n place of c e l l covers, Extensive t e s t i n g w i l l be required t o e s t a b l i s h the d u r a b i l i t y of Parylene i n space, but s u b s t a n t i a l savings are poss ib le , For example, the cos t of c e l l covers, cover-glass adhesives, and conventional i n s t a l l a t i o n of the so la r c e l l s can be over $1,000,003 f o r a 320,000-cell a r ray .
A conceptual design of a Parylene-insulated so la r c e l l assembly i s shown i n Figure 20. The design i s a space proven one, bu t having the addit ion of t h e confarmal coating of d i e l e c t r i c . The submodule interconnector i s expanded s i l v e r , coated with Parylene on a l l surfaces including the inner edges of t h e mesh openings,
Conventional Insu la t ion
Another conceptual design uses s i l i c o n e insu la t ion i n the c r i t i c a l area between c e l l s (Figure 21). B ~ t h conventional c e l l s and c e l l s ,with wrap-around contacts a re shown. Wrap-around contacts have possible advantages because interconnections can be p r in ted or bonded t o the subs t ra te . Also the void problem may be s impl i f ied . Wrap-around contacts have not been produced i n large quan t i t i e s , a re not f l ight-proven, and a re not necessary fo r success. However, they a r e avai lable and should be considered i n a development program. As emphasized i n the discussion of val tage s t r e s s , voids l a rge r than a c r i t i c a l s i z e are not acceptable. Void s i z e , a function of both mater ia ls and configuration, needs t o be control led .
A conceptual design i n which the a r ray i s assembled from insula ted modules i s shown i n Figurs 22. I n t h i s design the p a r a l l e l groups of s o l a r c e l l s with p ro tec t ive fused s i l i c a covers a r e impregnated i n thin-walled preforms. After inspect ion and t e s t these modules are connected i n t h e des i red s e r i e s and p a r a l l e l configurat ion. This concept has been used successful ly i n other e lec t ron ic assemblies.
C e l l cover and s u b s t r a t e mater ia ls w i l l have t o be t e s t e d f o r d i e l e c t r i c s t rength . It w i l l be necessary t o use t e s t methods which can be applied economically t o l a rge areas of subs t ra te and large numbers of coversl ides. Such t n s t s can be American Society fo r Testing Materials (PSTM) t e s t s , modi- f i e d by the r e s u l t s of research and development t e s t s made under simulated mfssi on environment condit ions.


WITH CONVENTIONAL CONTACTS WITH WRAP-AROUND CONTACTS
!3 FLUORO-SILICONE 1 FLUORO-SILICONE 4
DIELECTRIC FILLER POTENTIAL VOIDS DIELECTRIC ADHESIVE h)
A
-4 0.008 SOLAR CELL W
a I A
\ SO-RCELL
CELL INTERCONNECT
PRINTED 1 INTERCONNECT
Figure 21: HIGH VOLTAGE SOLAR CELL INTERCONNECTIONS


Elements of the a r ray can be t e s t e d funct ional ly i n a simulated ionospheric plasma, However, t e s t i w large-area panels i n a simulated ionospheric plasma would be cos t ly , Thus, an a l t e r n a t e means of a i m l a t i n g the plasma during t e s t s f o r checking t h e fabr ica t ion process would be des i rable . The plasma c h a r a c t e r i s t i c of i n t e r e s t here i s i t s conductivi ty. A eanceptual desEgn of a plasma simulator ( ~ i g u r e 2 3 ) uses an e l e c t r o l y t i c tank f o r t e s t i n g large sa la r - c e l l panels. The conducting l i q u i d can provide near ly the same voltage gradients i n t h e d i e l e c t r i c s of t h e panel as the ' ionospheric plasma. Parameters t o be measured are insu la t ion res i s t ance , voltage breakdown s t rength , e l e c t r i c a l noise, and t h e e f f e c t s of varying the conductivi ty of the operating medium,
The p o s s i b l i t y of accidents from t h e high voltage can be minimized with s a f e t y in te r locks and shor t ing devices. However, shor t ing of over 500 se r i es - connected c e l l s can be misleading, because va r ia t ions within c e l l s make the voltage drop i n a long s t r i n g of shorted s o l a r c e l l s non-uniform. Two approaches t o t h i s problem are : (1) Expose mult iple terminals f o r short ing, and ( 2 ) shor t -c i rcu i t long s t r i n g s of c e l l s using conductive pressure sens i t ive tape such as Scotch X-1170.
Working s a f e l y with high voltages requires s t r i c t enforcement of documented procedures. Examples a r e The Boeing Coqany's I n d u s t r i a l Hazards Control Bul le t ins S-15, " ~ i g h E l e c t r i c a l P ~ t e n t i a l Testing," and S--16, "Personnel E l e c t r i c a l Hazards. "


RELIABILITY ANALYSES
The high voltage s o l a r a r ray i s assumed t o consis t of a s t r i n g of 32,000 submodules each having LO p a r a l l e l c e l l s and 2 shunting diodes. This d e ~ i g n meets t h e requirements of 16,000 vo l t s a t 15,030 wat ts , assuming t h a t each c e l l de l ive r s 0.5 v o l t s a t 0,093 amp, To provide d i f f e r e n t voltage l e v e l s , the a t r i n g of submodules i s divided i n t o voltage blocks,
R e l i a b i l i t y analyses were conducted t o est imate t h e f a i l u r e r i s k associated with the design elements unique t o the high voltage ar ray applicat ion. P o t e n t i a l problems were i d e n t i f i e d and methods f o r achieving reasonable r e l i a b i li t y l e v e l s were developed.
The major design elements of the high voltage s o l a r a r ray are :
Solar c e l l submodule with shunting diode Submodule i n t erconne c t o r Busses Block- to-bus connectors Insu la t ion
Other elements of the s o l a r ar ray such as s t r u c t u r e , s o l a r ce l l -subst ra te , cell-cover adhesive, and s o l a r c e l l adhesives employ conventional mater ia ls and processes and have not been considered i n t h i s r e l i a b i l i t y analys is . The Paflure r i s k s associa ted with these elements are negl ig ib le due t o appl ica t ion of proven manufacturing and qua l i ty con t ro l techniques and procedures.
Table 5 presents t h e f a i l u r e r i s k s which were derived f o r the major design elements of the high voltage ar ray .
The unique c h a r a c t e r i s t i c s a f fec t ing r e l i a b i l i t y of the high voltage s o l a r ar ray design are :
(1) The many s o l a r c e l l submodules which must be connected i n s e r i e s t o de l ive r the required voltages.
(2) The insu la t ion between posi t ive and negative busses w i l l be e l e c t r i c a l l y s t r essed .
( 3 ) Insu la t ion on t h e interconnector w i l l reduce i t s f l e x i b i l i t y .
(4) New processes a r e required f o r appl ica t ion of insu la t ion on exposed high voltage p a r t s of the s o l a r ar ray , such as interconnectors, edges of the s o l a r c e l l s , and e l e c t r i c a l terminals ,
7.2 - An Elements
Fa i lu re r i s k s f o r the individual elements were ca lcula ted using f a i l u r e r a t e data and mission time or cycles. The mission time used i n the analyses was 5 years a t synchronous a l t i t u d e plus 3 months a t law a l t i t u d e . The t o t a l mission time was 46,000 hours. Thermal cycling e f f e c t s were based on an average

Design Element Funct ion
F a i l u r e Mode
Fa i l u r e R i sk Remarks
S o l a r c e l l sub- conver t s u n l i g h t t o Submodule 1. 0 x lom32 A l l c e l l s i n submodule and module w i t h t o e l e c t r i c a l energy Open c i r c u i t shunt ing diode f a i l open shun t ing diode
Open o r s h o r t 4.5 x 10⁻⁵ Open and s h ~ t e d c e l l s , c i r c u i t f a i l u r e s ( 2 . 4 ~ lo-7] shor ted a i d e s ; 1.6% margin causing power l ~ s s (1.8% margin). See note 2
S ubmodule- t o Provide e l e c t r i c a l Open f a i l u r e 2.6 x 10'~ 3 p a r a l l e l connectors between submodule i n t e r - c o n t i n u i t y b ~ t w e e n submdules connector s ubm~dules
E l e c t r i c a l E l e c t r i c a l con- S t r u c t u r a l 1 .0 x lo-G Provide adequate spacing busses duc tor f a i l u r e : s h o r t and i n s u l a t i o n between
k3 between busses busses - es t ima te k rn
I n s u l a t i o n P r o t e c t e l e c t r i c a l Breakdown; voids 1.0 x lom5 Est imate conductors from en- vironment ; prevent s h o r t s
Block- to- bus Connect vo l t age Open f a i l u r e 3.7 lo-? Redundant connectors connectors blocks t o busses
N3te 1: Faillxre r i s k i s de f ined a s p r o b a b i l i t y of no t meeting 16 kV, 15 kW requirements 2: Percent design margin i s percent a d d i t i o n a l submodules
Table 5: RELIABILITY ANALYSIS SUMMARY-HIGH VOLTAGE SOLAR ARRAY

sf $5 $hema% cycles per day i n low a l t i t u d e o r b i t s and 90 cycles per year a t s~ckusonous al t i tud-e, f o r a t o t a l of 1890 thermal cycles,
Ef fec t s of C e l l Fai lure8
Three bas ic modes of c e l l f a i l u r e were i d e n t i f i e d :
I) open c i r c u i t f a i l u r e 2 ) shor t c i r c u i t f a i l t w e 3) degraded c e l l output ,
We assumed t h a t open and shor t c i r c u i t f a i l u r e woulCa occur a% random and t h a t the exponential thms-to-f a i l u r e model R = e - at wa, reasonably va l id fo-r pew dieting c e l l r e l i a b i l i t y , I n t h i s Model, R = r e l i a b i l i t y ; A = f a i l u r e rate/hour; k = operat ing time i n horns.
It was a l s o assumed t h a t %he degsaded c e l l output was a r e s u l t of r a d i a t i o n o r mierotlle%eoroid damage. Radiation degradation was accourated f o r by using dew graded s o l a r c e l l operat ing c h a r a c t e r i s t i c s i n ca lcula t ing the number of c e l l s required t o provide the requbred power. Degradation from micrometeoroid impact was accounted for by a c e l l f a i l u r e r a t e a t t r i b u t a b l e t o t h i s phenomenon. It was f u r t h e r assumed t h a t dcronaeteosoid c e l l damage would be e i t h e r an open or shor t c i r c u i t f a i l u r e of the c e l l ,
Open C i r c u i t Fa i lu res
The e f f e c t of an open c i r c u i t f a i l u r e of a s o l a r c e l l i s loss of c e l l p m e r , reducing the power generat ing capab i l i ty of the ~ubmodule, This changes t h e submodule V-1 curve. The proposed deeign has two shunting diodes conm?cted across each submcdule t o provide an a l t e r n a t e current path i n t h e event t h a t one or more c e l l s f a i l open i n t h a t submodule. Loss of block power w i l l occur only i f a l l c e l l s i n a submodulz f a i l open and the s h u n l i w diodes a l so f a i l open,
Short C i r c u i t Fai l u r e s
A shor t c i r c u i t f a i l u e of a s o l a r c e l l r e s u l t s i n shor t ing of the e n t i r e sub- module with subsequent l o s s of submodule poxer, This mode may be c~mpensated i n design by providing ex t ra ao la r c e l l submoduleru ( A n) so t h a t the proha- b i l i t y of more thmhn shor t c i r c u i t f a i l u r e s i s l e s s than o r equal t o the des i red f a i l u r e r i s k .
Solar C e l l F ~ i P u r e Rate
The s o l a r c e l l f a i l u r e r a t e used i n t h e r e l i a b i u t y a n a u s e s account& f o r f a i l u r e of c e l l s f r o a t h e m 1 c y c l i w , f r a c t w i n g , manufacturing de fec t s , and Impact by meteoraids, Several sources were uaed i n dewloping t h i s f a i l u r e r a t e , Figure 24 shows these c e l l f a i l w e r a t e pedict l .ons from these aowces as a funct ion of calendar time. S i ~ i f i c a n t va r ia t ions can be noted i n the predicted s o l a r c e l l f a i l u r e rakes,
It appears t h a t a f a i l u r e r a t e of 1.2 x f a i l u r e a per hour i s a reasonably coneervative a s s u p t i o n , anowing f o r the e f f e c t s of thermal cycling, This r a t e was then increase3 by 58 percent t o acceunt f o r c e l l f a i l u r e s frora

-
TRIJ P r e d i c t i o n
Boeing LO P r e d i c t i o n (D Hughes P r e d i c t i o n ( ~ a r s enus us P robe )
rn @@ EOS E s t i m a t e
Hughes P r e d i c t i o n ( I n c l u d i n g R a d i a t i o n Envi ronment)
@ estimate (For Lab Environment)
@a @B TRW Voyager P r e d i c t i o n
LO P r e d i c t i o n
@ Douglas P r o j e c t i o n
GE Voyager P r e d i c t i o n
@&
a c t u a l ( l a b ) @
NASA P r e d i c t i o n TRW P r e d i c t i o n
Douglas P r o j e c t i o n
@
2 6 4 6 6 6 8 70 7 2 7 4 7 6
Ca lenda r Time
FI gurc- 24 : SII..ICON SOLAR CELL F A I L U R E RATES

m?$earaid impacts, The m t e o r o i d s w i l l erode the cover surface and o c c a s i o n a l b p w c t ~ ~ e the c e l l , A p w c t u e may o r may not a f f e c t s i g n i f i c a n t l y the c e l l output , It i s d i f f i c u l t t o est imate a more precise meteoroid f a i l u r e r a t e becabbse of the many m c e r t a f n t i e s i n the masses of p a r t i c l e s , the f lux-s ize a s t r i b u t i o n , and the u l t imate e f f e c t of a pene t ra t i sa on a so la r c e l l ( ~ e f esence 28),
I n c l u d i ~ allowances f o r theamal cycling and the mzteoroid environment, a t o t a l s o l a r c e l l f a i l u r e r a t e f o r a l l causes was es tabl ished a t 1.8 x 10" 8 f a i l u r e s p%r hour, Data inclicale t h a t c e l l shor t s a re much l e s s l i k e l y t o occur than opens ( ~ e f e r e n c e 2 9 ) , Asswing 79 percent of the f a i l u r e s a r e open c i r c d t , and 30 percent ar?. shor t c i r c l ~ i t f a i l w e s , the fa i l i l se r a t e by mode of f a i l m e was es tabl ished:
Open - 1.3 x lou8 f a i l u r e s per hour
Short - 0.5 x 10'~ f a i h r e s per hour
Ef fec t s of Shunting Diode P a i l m e
Redews sf in~3ustny sources ind ica te t h a t genes81 p w p x e diodes have a pre- d ic ted f a i l w e r a t e i n t h e range 0.20 - 2.0 x 1r8 f a lures per hour, ( ~ e f e r - encea 30, 31, 3 8 ) . A comervat ive value of 2.0 x 10mQ was aelectnd f m the r e l i a b i u t y analys is t o account f o r t h e m a l - c y c l i w , r ad ia t ion , an? micro- meteoroid e f f e c t s . We a l s o searched f o r data on $he most probable mades of f a i l u r e , We found t h a t 30 t o 73 percent of general-puspose diode f a i l u s e s a re open c i r c u i t . The average value of 50 percent was a d ~ p t e d , making an 3pzn or shor t cilrcui$ f a i l u r e r a t e of 1 , O x lW8 failweer per hour. The prababiai'cy of e i t h e r an open or shor t c i r c u i t f a i l u r e of a hunting diode was then calculate.3, using t h e exponential:
Open Ci rcu i t F a i l u e s
An open c i r c u i t diode f a i l u r e w i l l have no e f f e c t on ar ray power 3utput unless one or more c e l l s i n t h e same submodule a h o f a i l open, Cumulative expected a r ray power l o s s from these f a i l u r e s was ca lcuh%ed as 0,000b4 psrcent as ~ h o m i n the fablowing t ab le :
Nuder of Open Bsobabi U t y of P robab i l i ty sf Combined E x p c t e d Array Ci rcu i t Cel l Occurrence Open Circuftk Probabi l i ty Paxier Loss PaSlwea - ------- Diode F a i l a r e ( ~ a t % % ) -------------- ---
l 5.944 x lo=3 4.6 x loek; 2.73 x Q , 0180 2 1.777 x 18-5 8. a6 x 10-9 0,0032 3 3.0 x lo- 1 . 3 8 x ~ o - ~ l 2 * l w 1 0 - 9
4 - 10 Neg . Neg . Neg . ------ ---a- ---- ---
TOTAL 0,0212 Watts o .aooa..4%

The p m e r l o s s ca lcula t ions were based on:
0.4 vo l t s per c e l l 40,003 submodules per a r r a y 0.30 vol ts per submdule wi th 1 c e l l open -10 volts per submdules wEth 2 c e l l s open, no diode -40 vo l t s per submoiiule wi th 3 c e l l s open, no diode,
Diode Short C i rcu i t Fa i lu res
A diode shor t c i r c u i t f a i l u r e r e s u l t s i n loss of submdule power. This f a i l u r e r a t e is, therefore , added t o the submodule f a i l u r e rake .3ue t o so la r c e l l f a i l u r e s t o provide the expected number of submodules with degraded output o r l o s s of power,
Submodule Fai lure Risk Calculat ion
The f a i l u r e e f f e c t considered i n t h i s analysis is l o s s of power caused by e i t h e r an open o r shor t c i r c u i t c e l l f a i l m e or by a atode s h ~ t c i r c u i t f a i l u r e . The f a i l u r e r i s k associa ted wi th submodulo f a i l u r e s depends 011 the margin pro- vided i n design f o r thzse f a i l u r e s . The f a i l u r e r i s k decreases as add i t iona l design margin i n the form of ex t ra submodules i s provided, Figure 25 shows how the s o l a r a r r a y f a i l u r e r i s k i s af fec ted by t h i s design margin. The f a i l u r e r i s k was determined from tab les of the cumulative terms of t h e Poisson d i s t r i b u t i o n (Reference 33) where the f a i l u r e r i s k (Pf) i s expressed as :
where x a the number of s w p l u s subm12dules provided per w l t a g e block r = number of submodule f a i l u r e s n = number of raubrnodul_p.s per voltage block including surplus
= subraodule f a i l u r e r a t e t = operat ing time v = block voltage i n thousands of v a l t s
For i l l u s t r a t i o n , va l tage b l ~ c k s of 1 kV, 2 kV and 4 kV were used i n t h e analys is . Figure 25 shows t h a t the design margin required f o r a given f a i l u r e r i s k i s inverse ly propor t ional t o the s i z e of the voltage block.
F d l u r e Risk from Interconnector Fa i lu re
The primary f a i l u r e mode of interconnectors i s open c i r c u i t due t o thermal cycling, Consideration was a l s o given t o the p o s s i b i l i t y of plasma current co l l ec ted a t the interconnector beating the interconnector, a f fec t ing i t s f l e x i b i l i t y , Such h e a t i m t w n e d out t o be triv-ial.

Design Margin (percent)
Fdgum 25: SOLAR A R W FAILURE R I S K DUE TO SUBMODULE FAILURE
The r e s u l t s of thermal cycling t e s t s conducted by the Ap2lied Physics Labora- t o r y s f Johns Napkins Universi ty on the OSCAR 0-13 so la r panels used on the !IFMYSIT program were used i n Aeveloping a f a i l u r e f o r interconnectors, These 250 thermal cycles indicated an increasing f a i l u r e r a t e as thermal cycles accumulated, Extrapolat ing these data t o t h e number of thermal cycles a n t i c i - pated during the 5 year high voltage a r ray mission resu l t ed i n the following f a i l u r e raLe t
MAe of Fa i lu re -- Faillare Rate .- -- Solder connection f a i l u r e 9.0 x 10⁻⁵ f a i ~ u r e s / t h e r m a l cycle
Torn t a b or titaniiwn s i l v e r 3.5 x lom5 fa i lures / thermal cycle pu l l - away
The extrapolat ion i s a h o s t one order of m a a i t u d e i n number af t h e m a 1 cycles (250 t o 1 8 9 0 ) ~ Jobs Rogk%ns had recornended a design f i x t o correc t the fa1Pwes which were experienced during the t e s t s , This should reduce the fai11.x-e r a t e s shown, On the other hand, the i n ~ u l a t e d interconnectors i n t h e high voltage ar ray a re l e s s f l e x i b l e , and thus may have a higher f a i l w e r a t e

i n thermal cycling, For these reasons, the ext raps la ted f a i l w e r a t e was not adjusted t o accaunt f o r %mprowmnts i n design,
Applying the above f a i l u r e r a t e s , a s s u i n g redundant solder connections on each interconnector t a b , and redundant interconnectors between submodules, the f a i l u r e p robab i l i ty due t o interconnector f a i l u r e was ca lcula ted as 1.226 x bO'"g/thermal cyclp. Assuming 1890 t erinal cycles per mission r e s u l t e d 2 i n a f a i l w e p robab i l i ty of 2.32 x 10" . With 32,640 submodules i n t h e ar ray , the f a i l u r e r i s k due t o interconnector f a i l u r e i s 0.073 f a r the mission, a value too high f o r a mlssio=1 r e l i a b i l i t y g o a l ? 0.99. Adding a t h i r d i n t e r - connector between subm~dules brings he f a i l u r e r i s k f o r the mission due t o interconnector f a i l u r e t o 2.62 x low' which i s sa t i s fac to ry .
The interconnector design being cansidered f o r t h e high voltage s o l a r a r ray i s a continuous mesh interconnector soldered or bonded t o each s o l a r c e l l i n the submdule. If one assumes t h a t any one zonnection point on both edges of t h e interconnector i s s u f f i c i e n t t o provide e l e c t r i c a l cont inui ty between subnodules, then the p r o b a b i u t y of f a i l u r e w i l l b? s i g n i f i c a n t l y l e s s than what was ca lcu l s t ed above. However, the e f f e c t of insu la t ing the interconnector on i t s f l e x i b i l i t y i s a t t h i s time unknown, and u n t i l f u r t h e r t e s t da ta a re developed the r i s k of f a i l u r e i s assumed t o be the ca lcula ted value corres- ponding t o th ree p a r a l l e l interconnectors.
Fa i lu re Risk Due t o Bus Fa i lu re and Bloek-to-Bus Connector Fai lure
It i s assumed t h a t f a i l u r e of the a r ray busses is unl ikely . Aside from genera l s t r u c t u r a l f a i l w e of t h e busses and bus-to-busshort no ~ t h e r f a i l u r e m ~ d e s e x i s t . The r i s k of such f a i l l i r e i s estimated as lowg: assuming t h a t t h e design i s good, t h a t an adequate qua l i ty contra1 program i s maintained, and no gross de fec t s a re generated i n manufacturing. The c r i t i c a l f a i l u r e mode i s open f a i l u r e of the block-to-bus connectors, producing l o s s of block voltage.
The conceptual a r ray design has e ight 2030 vol t blocks. Assuming redundant block connectors and redundant solder jo in t s per connection point , the p r o b a b i l i t y of f a i l u r e per connection point , the cannector f a i l u r e r a t e derived f a r the preceding analys is , i s 1.23 x /thermal cycle. The t o t a l f a i l u r e p robab i l i ty , assuming 1890 thermal cycles and 16 interconnections i s 3.72 x 10⁻⁵, If a t h i r d interconnector i s added a t each connection point , t h e t o t a l fai lure? p robab i l i ty i s reduced t o 1.3 x 10⁻⁹.
Fa i lu re Risk Due t o Insu la t ion Fai lure
The problems i n insu la t ing s o l a r c e l l s an3 t h e i r interconnectors w i l l be i n obtaining uniform thickness without voids or d i s c o n t i n u i t i e s , The cover g lass w i l l i n s u l a t e most of t h e c e l l surface, but there w i l l be e x p ~ s e d edges, corners and interconnector attachment areas , Busses can be conventional Kapton insu la ted f l a t conductors. The required f i l l i n g of i n t e r c e l l spaces with void-free d i e l e c t r i c could generate high mechanical s t r e s s with conventional designs, The problem t h a t i s ant ic ipated i s placing t h e f i l l e r ma te r i a l under the expansion j o i n t on the s 3 l a r c e l l , The f i l l e r ma te r i a l would reduce the ef fec t iveness of the expansion j o i n t and subsequently t h e f l e x i b i l i t y of the panel.

1% is extreme* d%%ficul% a t this $$me to predBct a f a i l u ~ e r%sk a ~ s ~ x i a t e d wS%h %l~u%ation, No applicable q u a n t l t a t i t ~ e data cauM be Pound, It appe%:es %hat the reliability of Insdating materials is affected by the design apes%- ficatlons for a given application, It appears to us that achievement of s n insulation failure risk goal 4epends on develop8ng a thorough insulating specification, acc~mpanying documen%ed processes, and. quality contrsl proce82ures.

CONCLUSIONS
The stu-dy of a high vol tage s o l a r a r r a y produced t h e fol lowing s i g n i f i c a n t conclusions. Some of t h e conclusions a r e p r o v i s i o n a l i n t h a t f u r t h e r analy- t i c a l and/or experimental v e r i f i c a t i o n i s requi red .
Firm Conclusions
o Generat ing s p a c e c r a f t power a t vo l tages between 2 and 16 kV d i r e c t l y wi th s e r i e s connecked s i l i c o n s o l a r c e l l s i s f e a s i b l e .
o O u r understanding of t h e space environment between 100 n a u t i c a l miles a l t i t u d e and synchronous-orbit a l t i t u d e i s adequate f o r h igh vol tage s o l a r a r r a y development.
o Micrometeoroids i n Ea r th -o rb i t space w i l l p ene t r a t e 6 m i l quartz covers on a 144 square meter a r r a y an average of s i x t imes per day.
o The r e l i a b i l i t y g o a l of a 0*99 p r o b a b i l i t y of design power being a v a i l a b l e a f t e r 5 years may be achieved by t h e h igh vol tage s o l a r a r r a y having sub- modules shunted w i t h diodes, redundant connect ions, and about 1.8 percent e x t r a s e r i e s submodules t o compensate f o r f a i l u r e s .
P rov i s iona l Conclusions - s u b j e c t t o i nd ica t ed confirmation.
o The high vol tage s o l a r a r r a y should be completely in su la t ed unless a power l o s s can be t o l e r a t e d . Confirmation r equ i r e s computation of leakage c w r e n t t o t h e plasma from exposed conduction su r f aces , confirmed by t e s t s i n sirnu-lated ionospher ic plasma.
o Quartz i s a good i n s u l a t i o n i n a plasma environment. Other u se fu l i n s u l a t i o n s , such a s Union Carbide 's Parylene C which can be vacuum de- pos i t ed , need t o be t e s t e d i n simulated space environment t o e s t a b l i s h f o r des ign purposes Long-term mechanical and phys i ca l c h a r a c t e r i s t i c s ( e . g . , d i e l e c t r i c s t r e n g t h , su r f ace conduct iv i ty , t o l e r a b l e imperfec t ions) . Oxidat ion e f f e c t s on polymer su r f aces i n an oxygen-containing plasma need t o be e s t ab l i shed by t e s t .
o The a b i l i t y of i n s u l a t i o n t o s u s t a i n non-destruct ive breakdown i n a plasma environment i s important . Instruments such a s t he Duoplasmatron, ionos- phe r i c plasma s imula tor , and cu r ren t - l imi t ed d i e l e c t r i c t e s t e r , a r e u s e f u l i n e s t a b l i s h i n g i n s u l a t i o n breakdown c h a r a c t e r i s t i c s i n plasma, a s w e l l a s f o r explor ing f i e l d s and cu r ren t c o l l e c t i o n phenomena i n plasma.
o I n s u l a t i o n voids i n t h e high vol tage a r r a y may have t o be r e s t r i c t e d t o 0.0003 inches i n s i z e ( 7 - 5 x low4 cm). Conventional fu sed - s i l i ca s o l a r c e l l covers would con ta in too many and t o o b i g voids. However, t h e e l e c t r i c a c t i v i t y i n a void i n i n s u l a t i o n which i s s t r e s s e d by a cu r r en t - l imi t ed plasma dc source r e q u i r e s f u r t h e r r e sea rch f o r f u l l un3erstandin.g.
o Secondary e l e c t r o n s emi t ted from a r r a y su r f aces as a r e s u l t of u l t r a - v i o l e t or pos i t i ve - ion bombardment can be important only i f t he s o l a r a r r a y i s not completely i n s u l a t e d .

o Neu t r a l mercury w i l l no t depos i t on warm i l luminated s o l a r a r r ays i n Ear th o r b i t , Neut ra l mercury r e l ea sed by t h e i o n t h r u s t o r can be ion ized by s o l a r r a d i a t i o n ; however, t h e mercury ions w i l l b e a s numerous a s t h e plasma ions only i n synchronous o r b i t and only wi th in one meter of t h e t h r u s t o r .
o Unique problems i n h igh vol tage s o l a r c e l l a r r a y f a b r i c a t i o n a r e i n s u l a t i o n , c l e a n l i n e s s t o prevent subsequent outgassing, personnel s a f e t y , and e lec- t r i c a l t e s t i n g . Func t iona l t e s t i n g i n plasma of a r r a y elements during f a b r i c a t i o n does not seem p r a c t i c a l ; however, e l e c t r o l y t i c - t a n k t e s t i n g can provide r equ i r ed confirmation of i n s u l a t i o n q u a l i t y . Evalua t ion of conceptua l des igns i n d i c a t e s t h e manufacturing problems can be solved.

9 * 0 GLOSS AaY OF TERN5
S o l a r a r r a y - The equipment r equ i r ed t o supply t h e load a t any of t he r e - qu i red vol tage l e v e l s . The a r r a y c o n s i s t s of s o l a r c e l l s connected i n a s e r i e s of volkage bu i ld ing blocks, r econf igusa t ion swi tches , l o g i c , f a u l t p r o t e c t i o n and r egu la t ion c i r c u i t s , and signal-power i s o l a t i o n devices .
Submodules - a group of c e l l s connected i n p a r a l l e l .
Module - a group of ser ies-connected submodules, wi th a switch f o r shunt ing.
Shunting diode - a d iode connected across each submodule, t o conduct c u r r e n t i n t h e same d i r e c t i o n a s flows through an i l luminated sub- module. The diode c a r r i e s t h e cu r r en t if s o l a r c e l l s f a i l open.
Shunting swi tch - a power t r a n s i s t o r connected across a module and ope ra t ing i n a swi tch ing mode.
Block - a ser ies-connected group of modules whose vol tage i s r egu la t ed t o a s p e c i f i e d l e v e l .
Blocking diode - a diode i n s e r i e s wi th each block o r module.

O G O l O C C ?
0 0 1 6 CO 17 0 0 1 1 : 0 0 1 9 O O Z P 0 0 2 1 0 0 2 2 C O 2 3 0 0 2 s 0 0 7 5
W C C E L 4 4 P S V E H S I D Y 3 r L E V E L 3 D A T E 7 0 0 2 2
c C \ U P F 9 1 C A L S I V U L A T I O I I O F T H E C U R R F N T S C U L L E C T E O F R O M A P L A S M A HY A C I h C C I P E N S I O N A L A R d A Y O F I N S b L A T L H S T R I P S O N A C O N D U C T I N G S U d t A L t C C B E C A L S E O F S Y t ' U E T R Y O t 4 L Y T H E P L A S M A P A R T I C L E S I N O N E H A L F A R R A Y C C Y C L F ( F H C P T t ' t C t l v l t R O F A N U h l l Y S U L A T E i ) S T R I P T O T H E C E N T t d Ot C A h I h S L L A T E D S T R I P 1 A R E C O M P U T E D
L
C C = h C ' l t ' A L I Z E O N E S A T I V E C H A R G E O N P L A S P A P 4 R T I C L E S C L P = h r C R P A L I L € C P O L I T I V E C t ' A A G t C N C O ~ J D U C T O R C C P l = t d C R Y A L I L t O I :v1 T I A L N E G A T I V t C H A R G E 014 I> . !SULATOR S U R F A C E C C Z P = h C P l r A L I Z t l: P 1 : S I T I V E IC:< CIJRRI-YT C T t ! ~ P = & C R M f . L I L E D T H E ? P A L V E L U C I TY C H = h C A U C L I Z t O T H I C < h F j S C!: I N S ' J L A l O & C A K C = ' \ C . ( ~ A L I L ~ ~ t i l C I H O F L \ I t i S U I _ I I t : O K E G I O N C C C \ D = t < C ' I H A L I I 'FC CCNDI .CT I f I T I OF C 0 : r O b C T O R C C T = ~ \ C R ~ ' A L I Z E C C C ~ P ~ : U T A T I C ' ~ A L T I Y E S T E P C C l S K = O . FOR I N I T I A L d U N , = l . F O R A L L O T H E R R U V S C c
R L A C I , C , G P , C H I , L ~ ~ M , ~ E ) I . P , H , A K C , ~ U U U . D T , D I S K P R 1 I . T t P R I I J T 1 r l i 1 C P r G H l t D i ~ ~ r T E M P r H ~ A K C r C 0 N O ~ D T t+=.31+ l - K E = O K C = A K C K C P = Y C + 1 1 F ( D I S # ) 1 5 ~ 1 5 r 2 0
L C S E T S I N I T I A L C O N U I T I O N S C
15 A=C. ,l1=0. C C 1 9 1 = 1 * 5 0 A l = l I F 1 1 - K C l 1 6 r 1 6 . 1 7
1 6 C M ( I ) - C . GC TC 1 8
I I C F ( I ) = C M I 1 8 L U H ( I ) = O .
C L ; ( I ) = C .
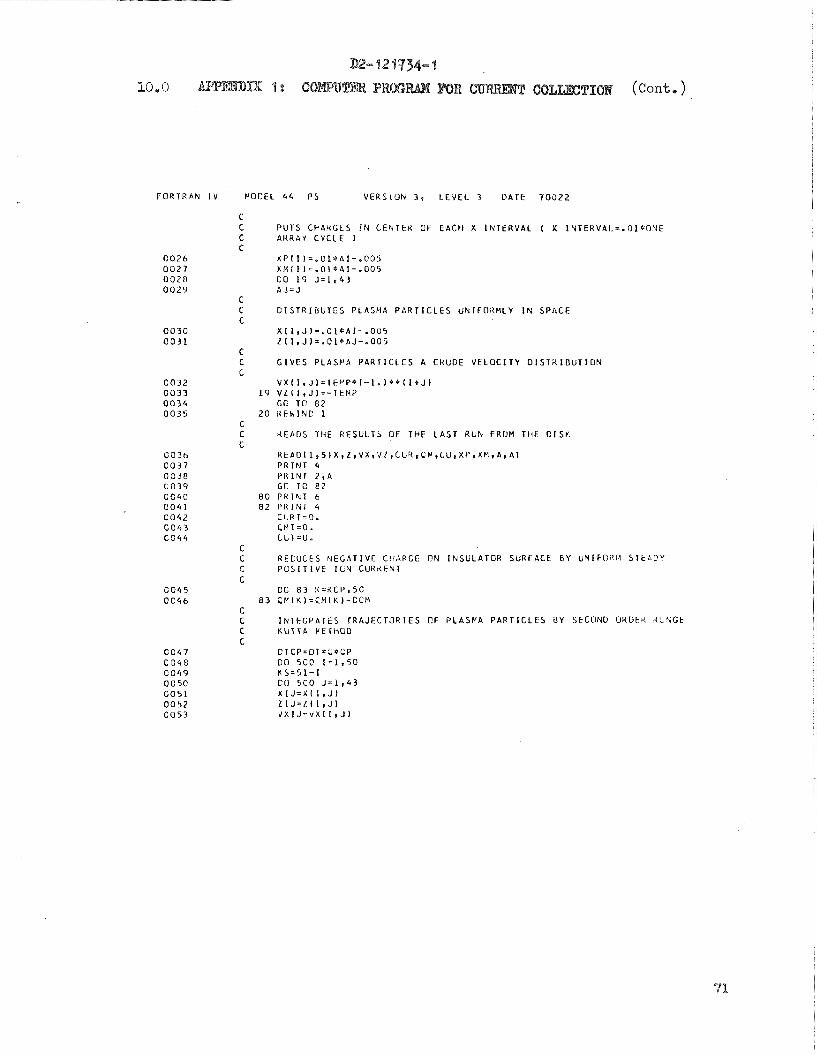
F O R T R A N I V H O C E L 4 4 P S V E R S I O N 3~ L E V E L 3 D A T E 7 0 0 2 2
P U T S C F A Y G E S I 1 4 C E N T E * O F E A C H X I N T E R V A L ( X l N T E R V A l . = . l ) l * O N E A N R A Y C Y C L k )
C I S T R I B U T E S P L A S M A P A R T I C L E S U N I F O X H L Y I N S P A C E
G I V E S P L A S V A P A R T I C L E S A C k U C E V E L O C I T Y D I S T 2 I B U T I O N L
VX(I.J)=lFPP*I-1.)**II+JI 19 V L ( I I J l = - I t M P
G C T O 82 2 0 R E k l W 1
C C H E A D S THE R E S U L T S O F THF L A S T R U N F R O M T H E D I S K c
R E A 0 ~ 1 ~ 5 I X ~ Z ~ V X ~ V I ~ C I ; 9 ~ C P ~ C U ~ X f ~ X F I ~ A , A l P R I N T 4 P R I N T Z I A Gi3 T C @ 2
8 0 P R I r v T 6 8 2 P R i N l 4
C L R T = 9 . 1;MT=O. C L T = U -
C C R E C U C E S N E G A T I V F C H A P G E OFI I N S U L A T O R S U R F A C E 6 Y U Y I F O R ! l S T E A C V C P C S l T l V E I C N C U R * F N T c
OC 8 3 K = K C P 1 5 0 83 C f ' ( K ) = C M ( K l - C G M
c C I N T F G P A T t S T R k J t C T O R l E S OF PLASt 'A P A Q T I C L E S 3 Y S E C O N D O R O F K 4LhGt C K U 1 T A WElHCD C
O T C P = D T * C * G P D O 5 G O 1 = 1 , 5 0 K S - 5 1 - 1 CO 5 C 0 J z l . 4 3 X I J = X ( I , J ) Z I J = Z ( I r J ) d X I J = v X ( I , J l

F O R T R A N I V P C C C L 4 4 P S V E R S I O M 3 r L E V E L 3 D A T E 7 0 0 2 2
0 0 5 9 C C 6 0 C 0 6 1 0 0 6 2 G O 6 3 0 0 6 4 5 0 6 5 C O C h C 0 6 7 6 0 6 8 0 0 6 9 0 0 7 0 G O 7 1 C 0 7 2 0 0 7 3 O C 7 4 C 0 7 5 CC 7 6 C C 7 1 C C 7 8 O C 7 9 O C 8 0 O O e l C C E 2 C 0 8 3 C O B 4 G O 8 5 0 0 8 6 G O 8 7 C 0 6 P 5 0 6 9 C C 9 0 C O Y 1 0 0 9 2
F I R S T I N T t G K A T l O N S T E P
P L A S f ' A P h R T I C L E S F E F L F I E L D S F R O f J P O S I T I V E C H A R G E S Ot4 C O ' i O U C T O K Ah 'C h E G A T l V E C H A d G t S O N I k 5 U L A T C d S U R F A C E I F i 0.1E A R R A Y C Y C L E ( E . G . 2 CP. 1 C E N T E R E D ON P L A S M A P A R T I C L E I N I T I A L X P O S I T I O N S
00 1 O C K z 1 . 5 0 X P K = X P l K ) X M K = X f ' ( Y ) C I C M = C T * C * C M l Y ) G E h = l X I J - X P K I * * Z + l Z I J + H ) * * Z C V X l = D V X l - C I C P * ( A I J - A P K j / C t Y C V Z l = C V Z L - C T C P * ( L I J t P ) / C E N O E h = ( X I J - X C P ) + * 2 + Z I J + s Z D V X ~ = C V % ~ + C T C P * ~ A ~ J - X ( ~ K ~ / D E % C V L 1 = O V L l + C I C r * L I J / D E N C O 1 1 0 K = K S , 5 0 X P K = X P l # ) X C K = X M ( K j c T c r = n r c , . * g u ~ ~ ) OEh=(XIJ-l.+XPK)**Z+(LlJtH)**2 C V X l = C V X 1-C I L P * I X I J- I + X P K ) / C E N DVLl=OVLL-CIGP*lZIJCPI/[:CN CEh=(XIJ-l.+Xh'K)**2+ZIJ**Z C V X l = C V X l t C T P P * l X I J - L . + X x u K ) / D E N U V L l = C V Z L + C T L r * Z I J / D E % C O 1 2 6 K = l , K S X P K = X P ( K ) X P K = X t J l K ) O I C C = D T * C * C ~ l K ) C E h = I X l J + X P K ) * + Z + I L I J + t i ) * * Z ~ V X ~ = ~ V X I - C I C P ~ I X I J + X P ~ ~ ~ C : ~ ~ ~ C V Z l = ~ V Z I - L T 6 P * I L l J + H ) / C L h D E h = ( X I J + X P K ) * * Z + L I J * * 2 C V X L = C V X 1 4 C T i M * ( X I J t X W K ~ / C F M O V Z l = C V Z l t C T C N * Z I J / C E N D X . ? = C T * l V X I J + C V X I ) C Z Z = C T * ( V Z I J + O V Z l ) C V X ? = O . C V Z 2 = 0 .

F O R T R A N I V MCjCEL 4 4 P S V E & S I O N 31 L E V E L 3 D A T E 7 0 0 2 2
C C P L A S P A P A R T I C L E S F E E L F I E L D S F H O P P O S I T I V E C t l A R G E S OW Cf l : lC lJCTOR C hhC N F G A l I V E C t l A R G E S O N I N S U L A T O 4 S U k F A C E I t 4 U N E A R R A Y C Y C L F C ( E . G . 2 C P . 1 C L N T E k E D ON P L A L M A P A R T I C L E I N I T I A L X P O S I T I O h l S C
CO 2 C O K = 1 , 5 0 X P K = X P ( K 1 X P K = X M l L o C T C P = D l * C * L M ( K ) C E h = ( X I J + O X l - X P K ) * * 2 + ( Z I J + D Z 1 + H ) * * 2 O V X 2 = O V X Z - C T C P * ( X I J t D X 1 - X P K I / D t N D V ? Z = D V I Z - C T C P * 1 Z I J t D Z l + H ) / D E Y D E h = ( X I J + O X 1 - X N U ) * * 2 + ( Z I J + D Z I ) * * 2 C V X 2 = C V X Z + C T L ~ * I X I J + C X 1 - X ~ ~ 1 / O E N
2 C 0 C V Z 2 = D V Z Z + C T i M * ( L I J + C L l ) / D t N CO 2 1 0 K = K S r S C X P K = X P ( K I X b ' C = X W ( K ) C T t F = ~ T * C * C M ( K 1 O E h = ~ X 1 J t U X 1 - 1 . + X P K ) f * 2 + ( Z I J + D Z 1 + 1 - 0 * 8 2 C V X Z = C V X Z - G T C P * ( X I J + U X 1 - 1 . + X C ' K l / D E N OVL2=PVLZ-CTCP*(ZIJ+CZI+k)/LI~N D E N = ( X I J + D X 1 - L . + i ~ K ) * * Z + ( Z I J + D L 1 ~ * * 2 C V X Z = C V X Z + C T < M * ( A 1 J + C X l - L . t X P r K . ) / C E ' . (
2 1 0 D V Z 2 = D V Z Z + O T i r : * ( L I J + C Z l ) / O E \ j LC 2 2 0 K = l r K S X P K = X P ( K I X P K = X P l Y ) D T C P = D T * C * C V ( K G F h = I X I J 4 0 A 1 t X D K ) * * 2 + ~ Z I J + C L l + h ) * * 2 C V X 2 = O V X 2 - C l i P + l X l J + O X l + X P h ) / D ~ h ' C V Z Z = D V Z 2 - C T C P * l L I J + C Z l + ~ i 1 / D E Z I C € h = l X I J t C X l t X P Y ) * * 2 + ( Z I J + U Z 1 ) * * 2 C V X 2 = C V X 2 + C T C Y * ( X I J t O X l + A P r ; 1 / D E P l
2 2 C C V Z 2 = D V Z Z i C T C W * ( Z I J + C Z L ) / C E N X ~ I . J ~ = X I J + . 5 * ( O 4 1 + O X 2 1 Z I I , J 1 = L l J + . 5 * ( U L l + O Z 2 ) V X I I I J ~ = V X I J + . ~ * ~ D V X ~ + D V X ~ ~
5 C O VZfI,JI=VLIJ+.S*lDVL1+OVL21 C C I K T E G R A T E S T R A J E C T O R I E S O F C H A R G E S ON C O X D U C T O R BY S E C O N D O R C E K C RUkGE K U T T A M E T H O D

F O R l H A Y I V M D C E L 4 4 P S V E a S I U N 3 r L E V E L 3 D A T E 7 0 0 2 2
C F I R S T I N T E G R A T I O N S T E P C C C H A R G E S ON C O & I l I J C T O R F E E L F I F L D S F R O M O T H E R P O S I T I V E C H A N G E S GFI C C O h C U C T O H A N D N E G A T I V E C l - A A G E S O N I N S U L A T O R S U Y F A C E I N O Y t A H K A Y c C Y C L E ( E . G . 2 c14. I C E N T E R E D EN C H A R G E INITIAL x PCISITIONS L
00 5:O K = 1 . 5 0 X P K - X P I K I X Y K = X P ( K I O I P P C = O T * C P * C N ( K ) * C O N 0 I F ( I - K l 5 1 0 e 5 2 0 ~ 5 1 0
5 1 0 C X P l = C X P l + C T P P C / I X P I - X P K ) 5 2 0 D X P L = D X P l - C T P ' : C I l X P I - X H K ) / ( I X P I - X M K I * * Z t H * * 2 1
GU 5 3 0 K = K S 9 5 C X P K = X P ( K ) X U K = X t ' ( K 1 O T P t ' C = C T * C P * C Y ( K l * C { l \ G C X P 1 = U X P l t C T P P C / ( X P I - l . + X P K I
5 3 0 C X P 1 = C X P l - C T P M C * ~ X P I - l . + X P K ~ / ( ( X P I - I . t X M K ~ * * ? + H * * 2 ~ C O 5 4 0 K = l . K S X P K = X P ( K I X C K = X P ( K I C T P V C = O T * Q P * b H I K l * C O N D O X ? 1 = O X P l + L T P P C / I X P I + X P K )
5 4 0 C X P l = C X P l - C T P ~ C * ( X P I + X H K ) / ~ l X P l + X Y K I * * 2 + t i * * 2 ) O X P 2 = 0 .
C C S E C O N D I N T E C R A T I O U S T E P C C C C H A R G E S Gh C C h D U C T O l l F E E L F I E L D S F R O M O T t I E R P O S I T I V E C H A R G E S O"1 C C O h O U C T C 9 A N b N E G A T I V E C H A < G t S C N I N S U L A I U H S U H F & C E I N O U E A R R A Y C C Y C L E ( E.G. 2 CH. C E N T E d E U C 4 C H A R G E I N I T I A L X P D S I T I C V J C
C O 5 6 0 K = l t 5 O X P K = X P ( K I X P K = X H I K ) C T P M C = C T * C P * C P l K I * C O N 3 I F ( I - K 1 5 5 0 ~ 5 6 0 1 5 5 0
5 5 0 D X P ? = C X P 2 + C T P P C / ( X P I + O X P l - X P K I 5 6 0 C X P ~ = ~ X P ~ - C T P ~ C * ( X P I + D X P ~ - X U ~ ~ / ( ~ X P I + D X P I - X ~ ~ V ) * * ~ + H * * ~ )
CO 5 7 0 K = K S v S O X P K = X P ( K ) K V K = X E I ( K l C T F M C = O T o C P * : M l K l * C f l N C C X P 2 = C X P 2 + L l P P C / ( X P I + C X P 1 - 1 . + X P K )
5 7 0 O X P ~ = C X P ~ - C T P M C * ( X P ~ + U X P ~ - ~ . ~ X Y K ~ / ( ( X P I + D X P ~ - ~ . + X ~ ~ K I * * ~ + ~ I ~ ~ ~ ~ C C 5 8 C K = l e K S X P K = X P ( K I

F C R T R A N I V Y O C E L 4 4 P S V E d S I O N 3 , L E V E L 3 D A T E 7 0 5 2 2
C R E F L E C T S T R A J F C T O R l t S O F P L A S M A P A R T I C L E S E A C K I N T O C O M P U T E D C R E G I C N I X = C T O .5 I I F A h Y L E A V t C
CU 7 4 0 1 = 1 , 5 0 GO 7 4 0 J = 1 1 4 3 I F l X l I ~ J l l 7 1 C ~ 7 2 0 ~ 7 2 O
7 1 0 X ( I t J l = - X I 1 1 J l V X ( l r J ) = - V X ( 1 . J ) GC TC 7 4 0
7 2 0 IF(X(IrJ)-.51740t740~730 7 3 0 X l l , J l = L . - X I 1 , J I
V X ( l r J ) = - V X ( I I J ) 7 4 0 C t h T l N L E
C C C C L L t C T S C b A R G E S I F T H E Y P A S S THE P L A N E O F T H E I N S U L A T O K S U R F A C E C
C f l 0 5 0 I = l r 5 0 C C 8 5 0 J - 1 ~ 4 3 l F l L ( 1 ~ J l l 7 5 C . 8 0 5 ~ 8 0 0
7 5 C L = l C C . * X I I ~ J ) + 1 . I F I L - K C ) 7 6 C 1 7 6 0 . 7 7 0
C C C H A R G k S C I O N T R I B U T E T O C U d H t N T T O C C U D U C T O R I F T H E Y A R E I N Tt!E C b h l N S U L A l E C H F G I C N C
7 6 0 C L R ( L ) = C L R ( L l + d C L R T = C L R T + C GO T C 7 8 0
L
C C H b R G E S A R E P U T I ' d T t i E C E N T E K O F T H E X I F t T E R V A L ON W H I C H T I i E Y L A N D C I F T t E Y A R t 1 Q T h E I N S U L A T E D R t G l O N L
7 7 0 C V l L ) = C P ( L l + C c,lJT=CYT+Q
7 8 0 A = b t I . A T = A T t l . l A = A
c C T H E L A B E L S O F T H E C O L L E C T E D C H A R G E S A R E A S S I G N E D T O NEW C H A R G F S C k l T H P R F S C & I B E D P O S 1 T I D h S ANO V E L C C I T I E S

M C C E L 4 4 P S V E R S I O N 3 . L E V E L 3 D A T E 7 0 0 2 2
C C L N T S Tt3E C H A R G t S T H A T L E A V E T h E V I C I N I T Y OF T H t A R R A Y
T h E L A B E L S CF T H E E S C A P E D C H A R G E S ARE A S S I G N E D T O NEW C H A R G E S h l T H P R E S C R l 8 E D P O S I T I O N S A N D V E L O C I T I E 5
A T = : d T ? " b L I Z E C T C T A L C H A R G F C O L L E C T E D C U R I % I = I ? C R M I L I Z E D T C T A L Ci -4RGE C C L L E C T E O B Y E A C H U I i I N S U L A T E D X I b T T - R V A L C U R T = h i ; R t ' A L I I E D T G l A L C1lAPi;E C I ; L L E C T E 3 3 Y U N I N S U L A T C D R E G I O N C ~ t K ) = X C X P ~ l L I i F O C H A k S E Ck E A C H I N S U L A T E D X I N l E R V A L C P l = h C s W A L I L C D T J T A L C H A d S t C O L L t C l E L ) BY I h S U L A T E D R E G l O Y C b I K - 4 C d t ' A L I Z E D l D l A L F L C A P E D Ct1,12GL T t i R O U G H E A C H X I N l E R V d L C L I = h C R P h L I Z t D T C T A L E S C A P E D C H A R G E X P I K ) = P C S I T I O ! . I S L F T l i E P C S I T I V E C H A R G E S UIJ T H E COtJDUCTOR
P R I N T 4 P R I N T 2 1 A T t C L R T 1 C N T , C U T P Q I k l 4 P R I N T ~ I ~ C L R ~ K ) ~ K = ~ , K C I ~ ~ G H ( K ) , K = K C P ~ ~ O ) P R I N T 4 P R I N T 2 * i C L t K ) , K = 1 1 5 0 ) P R I N T 4 P R I N T I , i X P i K 1 1 K = 1 , 5 0 1 K E = K E + l
C H A N G E T H E N E X T F C i l T P A N C A R E D E P E P I D I K G O X H O U M A N Y 3 f l l N U T E T I M E S T E P S T H t R E A R E I N I t?€ A L L O h E D C O M P U T A T I O t d T I M E

F O R T R A N I V PUCEL 4 4 DS V E R S I O N 3 , L E V E L 3 O A T € 7 0 C 2 2
C C S T C R F S Tl'E R L S U L T S Oh 1 I i E OISK T C R E U S E D I N THE 1 , : t X T RUN C
0227 ~ R I T € ~ L ~ ~ I X ~ Z , V X I V L , C U R ~ ~ P ~ C L ~ X P ~ X M ~ ~ I A T 0 2 2 8 S T C P 0229 kNC

11.0 APPENDIX 2: DETERMINATION OF NET ACCELEXATING VOLTAGE PRODUCED BY A SOLAR ARRAY 0E)ERATING AN I O N THRUSTOR
Statement of Problem --- Assume t h a t a s o b ~ a,rray operates an ion " c u t o r at a constant ion beam current i n the ionosphere. Deterraine how the ne t accelerating potent ia l produced by the axray i s af fected by given dens i t i es of e lec t ron and ion currents col lected from the plasma..
Basic Approach
We a.ssume t h a t a t l e a s t pa r t of the so la r array has a posi t ive po ten t ia l r e l a t i v s t o the plasma. and co l lec t s e lect rons from the pla.sma. with a uniform current densi ty of Pe. The valtage output of ea.ch c e l l i s then tletermined as a function of i t s pos i t ion along the length of the array. Froa t h i s information, t he voltage gradient i s determined as a function of position. The length of the posi t ive p ~ r t i o n of the a r ray i s then determined as a function of (1) excess neutra l izer
) ( 2 ) e lec t ron current density (Pe) collected by t h e posi t ive current (Iexcess p ~ r t i o n of the array, a.nd (3) ion current density (Pi) collected by the negative port ion of the array. The to ta .1 voltage produced by the posi t ive port ion of the aXra.y is then calcula ted by in tegra t ing t he voltage gra.dient over the pos i t ive port ion of the array.
The resu l t ing voltage is t h e net accelerating potentia.1 which operates t he ion th rus to r a.nd depends upon Iexcess, pe a n d p i e
Assumed A r r r C h a r a C t e r i s t i c s --- ----- The s o l a r array (Figure 26) is composed of Ns rows connected i n s e r i e s t o form a s t r i n g Ecm long. Each row contains Np c e l l s connected i n p a r a l l e l so t h a t %he s t r i n g i s W-cm .wide.
Ths c e l l s are s i l i c o n s o l a r c e l l s with the I -V charac te r i s t i c shown i n Figurs 27.
The negative end of t he asray is connected t o t h e neu t ra l i ze r and the vehicle skin.
The currents which flow between the array, thrustor , vehicle skin, and plasma are shmn i n Figure 28,
Mathema --- senta t ion of Solar Ce l l I -V Curve --- If the array did not co l l ec t electrons from the plasma, each so la r c e l l would operate near t he maximlm power point shown i n Figure 27, When the arrw col lec t s e lect rons from the plasma, the c e l l s must carry more than the current a t maximum p'wer. Therefore the c e l l s may operate at currents between rnaxfmun power current (0.125 m p ) and shor t c i r c u i t current (0.149 amp). The voltage of the c e l l s consequently var ies between .maximum pcower voltage and zero. I n order t o calcula te t h e t o t a l a r ray voltage it i s necessmy t o represent mathemticallgr the re la t ionsh ip between c e l l current and c e l l voltage i n the region between maximum power and shor t c i r c u i t current .

F i g u r e 26: SOLAR ARRAY CONFIGURATION

C e l l C h a r a c t e r i s t i c s : H e l i o t e k N /P 10 ohm-cm rl = 10.3% @ 30°C Bare C e l l 2x2 cm x 0.012-inch
C e l l Temperature: 55°C
Ligh t I n t e n s i t y : 140 mw/cm2, AM0
Maximum Power
-
Exper imental Curve
0 C a l c u l a t e d Data (V = 0.0727 Rn (0.1491-1) + 0.670
C e l l Vol tage ( v o l t s )
Figure 27: I - V CURVE FOR A S I L I C O N SOLAR C E L L

Emits I o n s
I h l y this Portion of th beam
W Array Coatributee to the n r u s t
Arrows i n d i c a t e d i r e c t i o n of p o s i t i v e c u r r e n t f l o w
Fjwm a: CURRENT FLOW BETWEEN ARRAY, TI-IRUSTOR, AND PLASMA

A very good f i t t o -the I - V curve i n Figure 27 f o r the region between m&mm power and short c i r c u i t c n t i s a t ta ined with the following equation:
/ 8
V = C 1
where
The da ta points shown i n Figure 27 were calculated f'rom Equation 19.
I n order t o ca lcu la te t h e re la t ionsh ip between t h e voltage and current of a row of Np parallel-connected c e l l s we make the subst i tu t ions
= %OW and
i n Equation 19 t o ge t -
Distr ibut ion ~f Current i n t he A r 3 --------- If the array did not co l l ec t electrons from the plasma, each row of N parallel-connected c e l l s would carry a current equal t o the ion beam Purrent:
However, if the c e l l s d id co l lec t electrons from the plasma a t a uniform current densi ty of Pe, the current carr ied by a given row of c e l l s would depend upon how f a r the row was located from the most poai t ive end of the array:
where W i s the width of the row an4 x i s the distance of the row from the most posi t ive end of the array (see Figure 28).
If the e n t i r e array i s pos i t ive , then Equation 22 i s va l id fo r the e n t i r e length of the array. If o i l y pa r t of the array i s posi t ive , then a d i f f e r en t expression fo r Ir,, is required f o r the reminder of the array. Providing Irow never becoraes 80 large t h a t the raw voltage drops t o zero, t he remainrier of the array w i l l a t t a i n a negative po t en t i a l and the expression f o r row current becomes :

where pi = Lon current d e n s i t y c o l l e c t e d by the array from t h e plaama
kt - length of p o s i t i v e por t ion of t h e m a y
This gene ra l s i t u a t i o n , where the re existr j both p o s i t i v e and negat ive por t ions of t h e array-, i s shown i n F i g m e 28, Note t h a t i n t h i s s i t u a t i o n , t h e vehlc le s k i n a l s o becomes negat ive and c o l l e c t s ions from the plasma, When p a r t of the a r r a y and veh ic l e become negative, t he i o n engine loses t h r u s t because only t h e p o s i t i v e por t ion of t h e a m a x con t r ibu tes t o t h e n e t acce le ra t ing p o t e n t i a l of t h e ion engine,
The value of I+ 9s de-hermined by t h e equil ibr ium condit ion t h a t the n e t cu r ren t flow from t h e p l a s m . t o the away-thxustor syatem l a zero:
where 1, =pe WL+ (25)
I i -pi W ( L - ~ y ) (26)
Iveh = fveh %eh (27) Pveh = ion cu r ren t d e n s i t y co l l ec ted by the vehic le s k i n from t h e plasma
1
heh = e f f e c t i v e i o n c o l l e c t i o n area of vehicle s k i n
The qua:ati t y (I,,,L - Ibeam) represents the excess e l ec t ron current emit ted by the neu-tral izer :
S u b s t i t u t i n g Equations 25, 26, 27, and 28 i n t o Equation 24 and r e a . r r a n g i q we g e t :
Theve a re %wo d i f f e r e n t condit ions under which Equation 29 i s not va l id :
(1) When the e n t i r e asray i s p o s i t i v e , L+ = L and the n e u t r a l i z e r cu r ren t i s given by IeXCes8 -pe WL
(2) When the cu r ren t i n one of t h e rows becomes s o l a rge t h a t the row voltage drops t o zero, This occurs when the ind iv idua l c e l l s c a r r y 0,149 amperes ( s h o r t c i r c u i t c u r r e n t ) o r I r O = (~,)(0.149 amp). Under t h i s condit ion:
or - Np (0.149 amp) - lbeam L+ - ---
Few (30) The p o t e n t i a l of t h e remainder of the a r r a y and the vehic le sk in ad jus t s appraximately t o t h a t of the plasma and does not c o l l e c t a n e t cu r ren t from the >lss rce ,

I n t h i s case the excesg neutralizer c m e n t is given by
The current d is t r ibut ion i n the array as a function of distance along the ' array i s shown i n Figure 29for the three casea:
(1) L+ = L ; (Entire array posit ive) (32
(par t of array pz~sitivs and remainder negative)
Pe W (34 1 (par t of array positive, and remainder a t plasma p ~ t e n t i a l )
Distribution of Voltage i n the Arrax --__I_----- -- - The voltage output of any row of ce l l s i n the en t i r e array i a given by Equation 20 and is repeated hem:
where C l = 0.0727
c2 = 0.1491 C3 = 9.670 Np = number of parallel-connected ce l l s i n the row.
The current through a row i n the posit ive portion of the array i s a function of where the row is located as indicated by Equation 22 which i s repeated here:
Substituting Equation 22 in to Equation 20 we ge t row voltage as a function of posit ion i n the wray:
vrow = Cl [cp ' (Ibearn (35)
The voltage gradient [.%)+at any place along the positive portion of the
arm~ i s the row voltage divided by the c e l l length:
where L i s the array length and Ng i s the t o t a l number of rows connected i n ser ies .

n
2 $4 L4
I n e u t
d k-4 w
h, d a, k k 3 u J
beam a k
4 L = L-
Dis tance From P o s i t i v e End of Array (X)
( a ) E n t i r e a r r a y i s p o s i t i v e
I n e u t i-
I beam
D i s t a n c e From P o s i t i v e End of Array (X)
(b) P a r t of a r r a y i s p o s i t i v e , remainder i s n e g a t i v e
A
2 k bc (d
H w
I n e u t
4-J
9 I
k kj 'beam U
3 k k 4
Dis tance From P o s i t i v e End of Array (X)
( c ) Park of a r r a y ts p o s i t i v e , remainder i s a t plasma p o t e n t i a l
Figure 28: CURRENT V A R I A T I O N ALONG LENGTH OF SOLAR ARRAY
Subs t i tu t ing Equation 35 i n t o Equation 36 wa m t
The net acce le ra t ing voltage which operates the ion th rus to r i s simply the voltage output of t h e p o s i t i v e port ion of the m a y . To calcula te t h i s t o t a l voltage we need t o i n t e g r a t e the voltage gradient given i n Equation 37 along t h e length of t h e p o s i t i v e por t ion of the array:
Subs t i tu t ing (37) . i n t o (38) we g e t :
where U2 - (Ibeam + Pe WL+) P
The net acce le ra t ing voltage (vnet can be calculated fkora Equation 32. To do t h i s it i s necessary t o know:
(1) N,, t h e number of rows i n s e r i e s (2) Np, the number of c a l l a i n a row
(3 ) pe, the e l e c t r o n current dens i ty col lec ted bv the a r ray (amps/cm2) Ibeam, the i o n beam C ~ r e n t (amp) W, t h e width of t h e array (cm)
(6) L, t h e length of t h e a r r a y (cm) (7) L+, t h e length of t h e p o s i t i v e por t ion of t h e a r ray (cm)
~ h c value of L+ can be determined from Equation 32 i f it i s assumed t h a t the n ~ u t r a l i z e r rent emits an excess e lec t ron c n t equal i n magnitude t o t h e e l e c t r o n current co l l ec ted by the array:

The value of L can be determined from Eqmkion 34 i f it i s assumed t h a t the neu t ra l i ze r c d r e n t emits an excess e lect ron current jus t large enough t o make some of the c e l l s i n the array operate a t %heir shor t c i r c u i t current point :
'excess = (~,)(0.149 amp) - Ibesm L+ = Iexcess
f e W
The value of L+ caw be determined from Equation 33 i f it i s assumed t h a t t h e neu t ra l i ze r emits an excess e lect ron current which i s l e s s t h a t the two l im i t s described i n t h e two preceding paragraphs:
Of 'excess ( N ~ ) ( 0 . ~ 4 9 ) Ibem I L+ = 'excess + P i WL +~veh*veh
( p e + p i ) w
(J.4.l whichever i s smaller
Note t ha t i n order t o calcula te L+ i n the l a s t case, it i s necessary t o know the ion current densi ty ( Pi) collected by the negative portion of the a r ray and t he ion current density ( pveh) collected by t he vehicle skin. The vehicle skin col lect ion area ( A ~ , ~ ) i s a lso required.
Smmary of Procedure
(1) Determine how much excess neutra l izer current w i l l be emitted. I f you assume t h a t the neu t ra l i ze r emits t h e maximum possible, the neu t ra l i ze r current i s given by Eque;tion 40 or Equation 42, whichever i s smaller.
( 2 ) Calculate the length (L+) of the posi t ive p ~ r t i o n of the array from Equation 41, Equation 43, or Equation 46, whichever i s the appropriate one fo r the value of excess neutra l izer current being used.
(3) Calculate the net accelera t ing voltage from Equation 39 using the values
Of 'excess and L+ determined i n the two preceding s teps .
Sample Calculation -- #l
Let Ns = 79500 Np = 40 pe = 4.86 x 10⁻⁶ amps/cm2
Pveh = pi = 4.95 x 10.7 emps/cm2 Ibeam = 5
W = 90 cm L = ~ 6 , 0 0 0 cm
- 1 Aveh - - l o WE = 1.44 x 105 cm2

"rice 'excess = 0, we use Equation 46 -kc d e t e r d n e L+:
= 1.63 x lo3 cm
We calcula te t he net accelerating voLtage from Equation 39:
.J where U2 = .1491 - + (4.86 x 1 0 ~ ~ ) ( ~ 0 ) ( 1 . 6 ~ x 10
U1 = .I491 - (5 ) = 0,0241
'net accel = 271 vo l t s
alcubation #2 ----- Same e s Sample Calculation #1 except l e t Ioxcess be a t i t s maximum value. The maximum value tha.t IexCess can a t t a i n i s WL or (Np)(.149) - Ibem, whichevsr i s smaller. f'e
Q ~ ~ I L = (4.85 x lom6) x (90) x (1.6 x I-64) = 7*00 arnps
(Np)( 8149) - Ibeam = (40) x (.149) - 5 = 0.96 amps
Therefore Iexcess = oe96 amps i s the maximum neut ra l i ze r current. This is the value of excess neu t ra l i ze r current which i s jus t large enough t o make soms of the c e l l s in the array operate a t t h e i r shor t c i r c u i t current. L+ i s therefore given by Equation 43:
The ne t accelera t ing voltage i s obtained from Equation 39:
'net accel [ ( 6 ~ 0 ) ( 2 . 2 x mil - - T ( 9 0 >
?
where
U2= .1491- z'?i ' [ i + ~ 4 . 8 6 x 1 d 6 ) ( 9 0 ) ( 2 . 2 x -
1 = 01491 - (5) = 0.0241
'net accel = 334 vol ts
This calculation was repeated a t d i f fe ren t values of the collected e lectron current density, Pe, t o obtain the curve plot ted i n Figure 7,

APPENDIX 3
Plasma R e s i s t a n c e Materials---Organic
1. Polyqu inoxa l ines
2. Epoxies
0 3 , Polyimide I - C %
N - -- 0 /
I C
H
4. Polybenzimidazole
Polybenzoxaxole
P o l y b e n z o t h i a z o l e
5. Mixed polyamide-imide
0 6 . Polyamide B - C - N H
8. Ladder polymers
9 . Aromatic and pseudo-aromatic polymers
10. S i l i c o n e s and f l u o r o s i l i c o n e s
Plasma R e s i s t a n t Mate r ia l s - - - Inorgan ic
S i02
Noble m e t a l s
Cerami c s
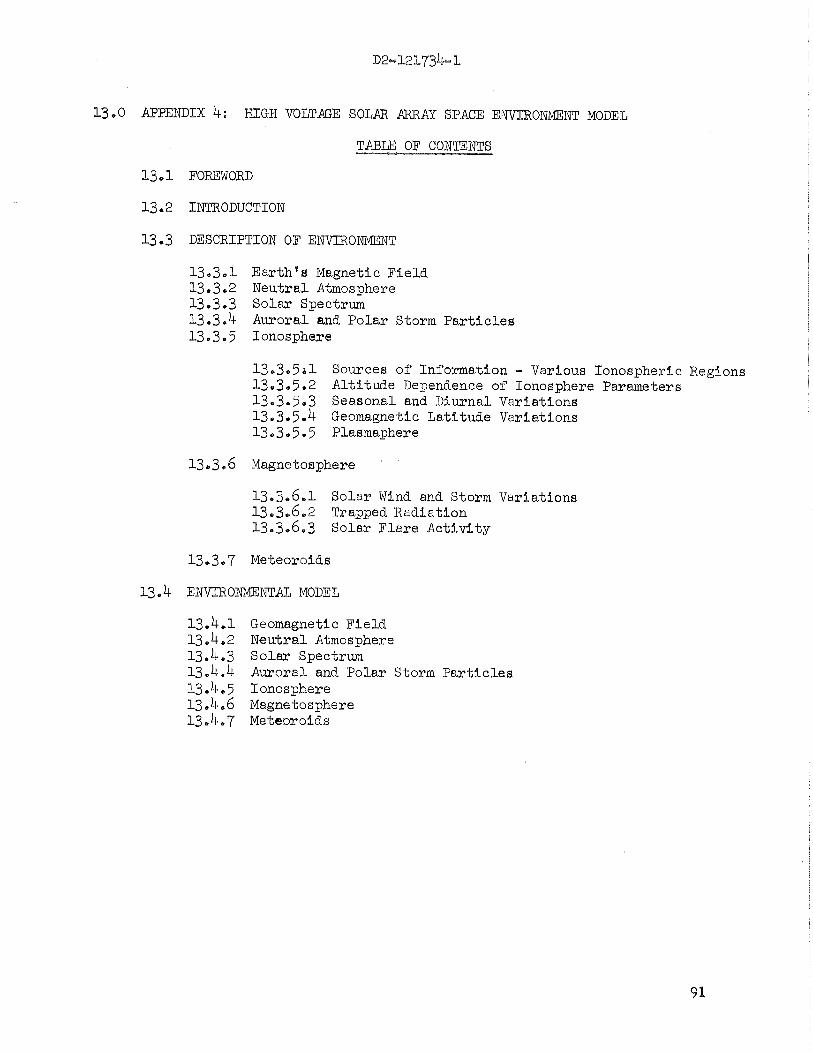
13.0 APPENDIX 4: H I G H VOLTAGE SOLAR ARRAY SPXE ENVTEONMENT MODEL
13.1 FOREWORD
13.2 INTRODUCTION
1 . DESCRIPTION OF ENVIRONMENT
13,3,1 Earth 's Magnetic F ie ld 13,3,2 Neutra.1 Atmosphere 13.3.3 Solar Spectrum 13.3.4 Aurora.1 and Polar Storm P a r t i c l e s 13.3.5 Ionosphere
13.3.511 Sources of In fomat ion - Various Ionospheric Regions 13,3.5.2 Alt i tude Dependence of Ionosphere Parameters 13,3.5,3 Seasonal and Diurnal Variations 13.3.5.4 Geomagnetic Lati tude Variations 13.3,5,5 Plasmaphere
~ 3 . 3 ~ 6 Magnetosphere '
13.3*6,1 Solar Wind and Storm Variations I-3.3,6,2 Trapped Radiation ~ 3 . 3 ~ 6 . 3 Solar F la re Act iv i ty
13-3.7 Meteoroids
13.4 ENVIRONMENTAL MODEL
13.4,l Geomagnetic F ie ld 13.4,2 Neutral Atmosphere 13.4.3 Solar Spectrum 13.4.4 Amoral and Polar S to rm P a r t i c l e s 1 3 .A. 5 Ionosphere 13.4.6 Magnetosphere 13.4,7 M e t e ~ r o i d s

13, l FOREWORD
This appendix summarizes t h e model of t he space environment developed a t Boeing for t he High Voltage So la r Array S.tudy,
The complete model was publ i shed e a r l i e r i n Boeing document D2-12133-1,

13-2 INTRODUCTION
A high voltage s o l a r array, t r avers ing t h e region from 100 nau t i ca l miles t o synchronous a l t i t u d e , w i l l encounter the n a t u r a l environment present i n t h e Earth 's magnetosphere, Occasionally, s o l a r activ36ty WIPE compress t h e E a r t h 9 s magnetosphere t o expose a synchronous-altitude s a t e l l i t e t o the bow shock region. A complete desc r ip t ion of t h e environment throughout the region of i n t e r e s t would be lengthy; hence we w i l l r e s t r i c t our descr ip t ion t o those parameters t h a t s i g n i f i c a n t l y influence the operat ion of a high-voltage so la r array.
The ionosphere, a c r i t i c a l environment I n t h e design and operat ion of t h e s o l a r array, r equ i res a comprehensive descr ip t ion i n t h i s model environment. The n e u t r a l atmosphere, i n conjunction with the rad ia t ion , i s t h e source of t h e ionosphere, and a t low a l t i t u d e t h e n e u t r a l atmospheric densi ty i s g r e a t enough t o a f f e c t t h e e l e c t r i c a l proper t ies of the ionosphere. The s p a t i a l d i s t r i b u t i o n of t h e ionosphere i s s t rong ly influenced by the Earth 's magnetic f i e l d , These i n t e r r e l a t i o n s h i p s require t h a t t h e environmental desc r ip t ion include severa l parameters of secondary importance,
Micrometeoroids may penet ra te the insu la t ion of the so la r array, leading t o damaging damaging discharge phenomena. Thus a descr ip t ion of the micrometeoroid impact r a t e i s provided,
High energy ioniz ing rad ia t ion , mainly protons and e lec t rons , degrade t h e s o l a r c e l l s i n the array. These p m t i c l e s a re trapped i n the Earth" magnetic f i e l d and a l s o come from the sun and from the galaxy i n the form of cosmic rays. The high voltage s o l a r array, while t ravers ing fkom 100 nau t i ca l miles t o synchronous a l t i t u d e , w i l l go through the dense proton and e lec t ron regions of the Van Allen be l t s . Exis t ing models of t h i s n a t u r a l r ad ia t ion env-ironment, developed by NASA and the Alr Force and updated by Dr, Vette, are proposed f o r s o l a r - c e l l degradation s tudies ,
This environmental model does not include t h e solar-axray and spacecraf t environmental components coming from outgassing, ion propulsion t h r u s t o r op- e ra t ion , and open-tube t r ansmi t t e r s ,
13 -3 DESCRIPTION OF EmONMENTG
The Earth's magnetic f i e l d , produced by c m e n t ~ l i n t h e Earth 's core i s modulated by mineral deposi ts i n t h e Earth's c rus t , currents i n t h e ionosphere, and t h e motion of t h e trapped charged p a r t i c l e s i n the rad ia t ion be l t s . A t Ugh a l t i t u d e s t h e solax wind compresses t h e Ea&hPs magnetic f i e l d i n t o a c a v i t y termed the magnetosphere. The magnetic f i e l d , measured near the surface of t h e Earth, shows long-time-cons t a n t var ia t ion0 of the order of 10'7 Tes la (103 gamma) p e r year, and shor t time var ia t ions associated with s o l a r a c t i v i t y ,
Because a l a rge contribu-t;Lon t o the Earth" magnetic f i e l d i s made by f i e l d s which o r ig ina te i n the Ewth , a dipole o r multipole representa t ion of t h e Earth 's magnetic f i e l d i a useful , A t i l t e d dipole representa t ion of the f i e l d g ives the
su r face f i e l d t o wi th in 3CY$p and t o within lw0 i f an off-center d ipole is used ( ~ e f , 34), Jenssn and CaFn have used 1960 da ta t o f i t the Ear th ' s magnetic f i e l d wi th a mult ipole expansion t h a t i s about 1 , O percent accurate ( ~ e f , 35). A t d i s t ances beyond a fe'w Ear th r a d i i from t h e Ear th ' s sur face t h e higher-order terms i n t h e rnultipole expansion f a l l o f f and the d ipole becomes the dominant term.
Beyond 6 Ear th r a d i i t he i n f 1uence of the s o l a r wind pressure , a s w e l l as the t rapped p a r t i c l e r i n g cu r ren t s , d i s t o r t t he d ipole- l ike f i e l d , confining i t i n t o the teardrop- l ike magnetosphere, Here s t rong v a r i a t i o n s r e l a t e d t o l o c a l time and s o l a r a c t i v i t y dominate t h e magnetic f i e l d descr ip t ion . Mead has developed a model which represents t h e Ear th ' s f i e l d a t high a l t i t u d e s ( ~ e f . 36) .
l3 ,3,2 Neutral Atrnosphere
The n e u t r a l atmosphere above 100 n a u t i c a l miles has a dens i ty so low t h a t t h e atmospheric components sepa ra te d i f fus ive ly . Hence the upper atmosphere i s bel ieved t o be i n d i f f u s i v e equil ibr ium, A t t h i s he igh t t h e p r i n c i p l e components a r e molecular and atomic oxygen and molecular ni t rogen. The d e n s i t y of each component decreases wi th increas ing he ight according t o the barometric law,
The use of the barometric law requ i re s a knowledge of t h e s c a l e he ight f o r each component, and thus t h e temperature, Some d f f f i c u l t y has been encountered i n obtaining a cons i s t en t p i c t u r e of the upper atmosphere's dens i ty and tempera- t u r e c h a r a c t e r i s t i c s i n t h e diffusosphere and above. However, t h e n e u t r a l atmosphere i s of secondary kmportance Sn the operat ion of t h e high-voltage s o l a r a r r ay , s o the s tandard atmosphere of 1962 and the 1966 supplement i s adequaee f o r t h i s study. ( ~ e f . 37, 381,
l3,3.3 So la r Spectrum
The s o l a r electro-magnetic spectrum seen by the Ear th ' s atmosphere ranges from x-rays t o radio-frequencies, The in f ra red , v i s i b l e , and near ultraviolet radia- t i o n s have been s tudied f o r many years and a re we l l defined. The x-ray and r a d i o emissions, which depend s t rong ly on s o l a r activity, have been s tudied only r ecen t ly . A r ecen t compilation of t h e s o l a r spectrum by Malitson gives a complete desc r ip t ion of the s o l a r spectrum wi th v a r i a t i o n s during d i f f e r e n t types of s o l a r a c t i v i t y ( ~ e f . 39) ,
13.3.4 Auroral and Polar Storm P a r t i c l e s
The a u r o r a l zone p a r t i c l e s e x c i t e t h e lower ionosphere, enhancing e l ec t ron d e n s i t i e s and temperatures i n the tops ide ionosphere geomagnetically poleward of t h e F2 trough, The regponse of t h e ionosphere i s discussed i n t h e next sec t ion . The h ighly va r i ab le f luxes of the auroral-zone e l ec t rons and protons preclude a simple desc r ip t ion of t h e i r behavior. However, f o r cons idera t ions of t h e i r d i r e c t inf luence upon t h e spacec ra f t , peak f luxes and t y p i c a l spec t ra w i l l s u f f i c e , The spectrum becomes genera l ly harder as we move from the pole toward sub-auroral l a t i t u d e s (around 6 0 0 ) ~ The peak a u r o r a l f luxes occur i n a narrow l a t i t u d e band centered i n t h e v i s i b l e a u r o r a l zone (above 60 t o 6g0 geomagnetic), The spec t ra measured i n t h e 65' t o 6g0 zone was adopted f o r the hfgh-voltage s o l a r a r r a y study. E l e c t r i c f i e l d s a s in t ense as 180 m ~ / m have been observed perpendicular t o the magnetic f i e l d i n t h e vilcinity of b r i g h t a m o r a l a r c s

13.3,5 Ionosphere
The n a t u r a l ionosphere i s t h e most slgnificalztcomponent of t he space environment model; hence, it r e q u i r e s a more comprehensive ana lys i s . The d e t a i l e d v a r i a t i o n s of t h e ionosphere, a r e t h e s u b j e c t of cu r r en t research, beyond t h e scope of t h i s e f f o r t .
The most important ionosphere parameters f o r t h i s high-voltage a r r a y s tudy a r e t h e v a r i a t i o n s w i t h a l t i t u d e of t h e peak e l e c t r o n d e n s i t y and daytime e l e c t r o n and i o n temperatures .
I n order t o desc r ibe t h e s t r u c t u r e of t h e ionosphere it i s convenient t o l i s t t h e ionospher ic reg ions where r e l a t i v e maxima of e l e c t r o n dens i ty occur, Table 6 p re sen t s t h e nomenclature used i n ionospher ic l i t e r a t u r e and t y p i c a l va lues of t h e parameters. Table 7 provides t y p i c a l values f o r ionosphere components f o r sunspot numbers of 0 and LOO, The D and E ionosphere reg ions , descr ibed adequate ly i n r e f e rences 40, 41, and 42, a r e below the lowest a l t i t u d e a t which t h e high-voltage a r r a y w i l l be a t t r i b u t e d (100 n a u t i c a l miles o r 185 h),
13.3.5.1 Sources of Information f o r Ionospheric Regions
There i s no s i n g l e experiment which measures d i r e c t l y t he dens i ty , temperatures and t h e composition of t he ionosphere from 185 h t o synchronous a l t i t u d e . Further- more t h e r e i s not y e t ava i l ab l e a complete theory of t h e ionosphere f o r extrapo- l a t i n g r e l i a b l y t h e r e s u l t s of experiments t o s p a t i a l and temporal r eg ions not probed. Thus our b e s t sources of information on t h e ionosphere a r e L h o ~ e experiments which a r e g iv ing t h e broades t coverage. The a l t i t u d e reg ioxs explored by t h e major experiments a r e :
A l t i t u d e
185 km - F2 peak Lonosnndes, rocke t s
F2 peak - LOO0 km Topside ionosondes, s a t e l l i t e s , r o c k e t s
185 km - 6000 km Incoherent s c a t t e r
2 R, - 6 R, VLF and ULF w h i s t l e r s
2 R e - 7 Re Plasma Probes
A l l o f t h e s e experiments can y i e l d the e l e c t r o n d e n s i t y d i r e c t l y .
An e x c e l l e n t d e t a i l e d desc r ip t ion of t he use of r a d i o waves t o measure t h e r e f r a c t i v e , r e f l e c t i v e and t ransmiss ive p r o p e r t i e s of t he ionosphere is given by Rawer and Suchy ( ~ e f , 43). They a l s o present an e x c e l l e n t summary o f t h e informat ion obta ined from the ionosonde d a t a p r i o r t o t h e s a t e l l i t e e ra . Examples of t h e i r d a t a appear i n Figures 30 thL-ough 31,
J u s t a s ground-based ionosondes provide d e n s i t y i n t h e bottomside ionosphere, t h e s a t e l l i t e - b a s e d tops ide ionosondes a r e t h e workhorse of e l e c t r o n d e n s i t y de te rmina t ions i n t h e topaide ionosphere, While t h e tops ide ionosondes provide

f o ordinlary cr i t ical frequency
f:x = extra-ordimry c r i t i c a l frequency
fg = mo-frequency f o r a m n e t i c flux density B (commonly B = H)
Ve i = col l i s ion frequency of electron8 with ions
= col l ie ion frequency of electrons with ne&rals
Vpn = col l i s ion freqwncy of ions v i t h m u t r a l s
B = ion csfieentmtion
h u m elecLrsn concem%rr?l%isn in ionospheric layer
fH " ( " / h a @ I3 = 2.7994 B mz
er 2
= seccsmbimtion esefficfent ( r a t e = a N, Ng -. a N, )
P a t t a c b e n t - l i k e emfficieat (m%e = 0 R ~ )
k! simple theory dNe = q - aN, - pNe
h' -- vistwl height
D, .: -bipolar d i f f w i o n coefficient
T, = 'tempek&%~~"e of electrons
Ti = t e m p c r a % m e s b i o n e
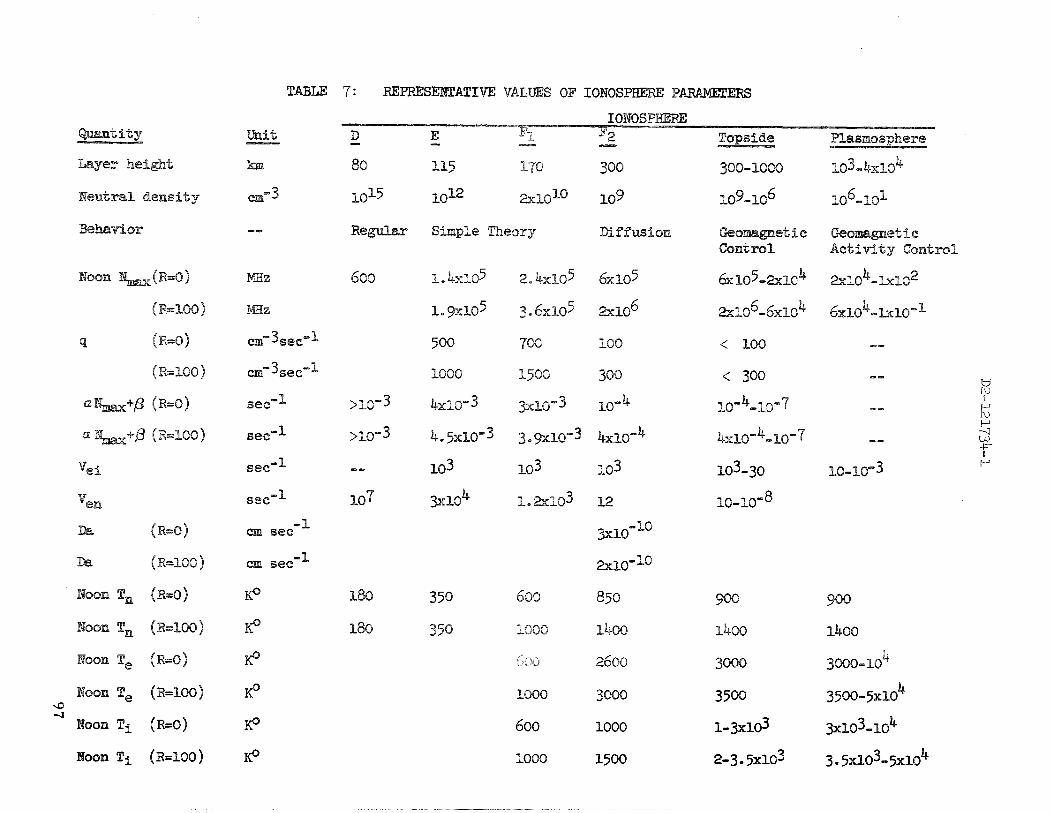
8
t-i I 0
d
iii
88
8;
~
Ha
,
8 8
d
t-i

(Reference 4 3 )
Gnke~ loke (87 70 sl
W&irfg/on / P / *; 50 7 S/ough
f 6 7 O ; 55 =I Son Prunc~Zco / tZor 46 76.j
Wh7e Sands fsaOl 41")
~ u k k u n u i f6U i 35'7
Aki/o /5t ";YO 7 Tokyo f495250j
Bonu/rta /40 :.Zl 'j
0k;nuivo /X02 157
Bag///b m577 gunnr /1076;I
kuu~cuyu f25-1*)
Singupo~e /219 5 -1U76.j
henos Aircs /-20'; -2JV
Figure 30: MEAN DIURNAL VARIATION OF fOF2 FOR EQUINOX MONTHS
(Magnetic I n c l i n a t i o n I: and Geomagnetic L a t i t i d e X i n Brackets)

(Reference 4 3 )
a) Washington, I = 71 '
b) Panama, I = 37'
Figure 31: DIURNAL VARIAT ION OF THE MEAN ELECTRON DENSITY (June 1958)

c) Talara, I = 13'
Figure 39 : DIURNAL VARIATION OF THE MEAN ELECTRON DENSITY (June 1958)

r ap id geographic coverage, the ground-based ionosondes produce l o c a l time dependence a t many se lec ted s i t e s , Typical tops ide ionosonde da ta appear i n Figures 32 through 34. A world map of for2 i s shown i n Figure 35.
The over lap provided by t h e inc reas ing number of incoherent Thomson s c a t t e r r e s u l t s f o r the bottomside and tops ide ionosphere have f a c i l i t a t e d g r e a t l y the sepa ra t ion of geomagnetic and l o c a l time dependences. Improved world maps and p r o f i l e s a re being compiled by Environmental Science Services Administration (ESSA) and are ava i l ab le through the World Data Center (WDC). The usefulness of Thomson s c a t t e r i n obta in ing d i r e c t l y dens i ty , e l ec t ron temperature, and e lec t ron/ ion temperature-rat io p r o f i l e s was r e c e n t l y reviewed by Evans (Ref. 44). He a l s o shows how t o determine composition and magnetic f i e l d d i r e c t i o n s , and desc r ibes techniques f o r improving the s p a t i a l and temporal r e s o l u t i o n of t h e measurements.
The understanding of the F region and tops ide ionosphere increased s u b s t a n t i a l l y s ince 1960. Chapman's review, the ses s ion summaries, and t h e concluding remarks by Evans, Bauer and Chapman given a t t h e NATO Advanced Study I n s t i t u t e i n Apr i l 1965 a r e p a r t i c u l a r l y u s e f u l (Ref, 45). Geomagnetic c o n t r o l was then w e l l e s t ab l i shed and t h e importance of d r i f t (Ref . 46,47 ) , photoelectrons (Ref .48,49
), and geomagnetic t a i l cu r ren t s (Ref, 50 ) was s t rong ly suggested.
The plasmasphere has been examined wi th VLF whist ler-propagation techniques and t h e t h e r e s u l t s have been compared with da ta from plasma probes on e c c e n t r i c Earth- o r b i t i n g s a t e l l i t e s ( Ref. 51,52,53). Recently the analys is of ULF (a.bout 1.0 HZ) w h i s t l e r s (Ref, 54,55) has provided plasma d e n s i t i e s out t o 8 E a r t h r a d i i .
The b e s t t h e o r e t i c a l desc r ip t ion of t h e plasmasphere i s perhaps given i n Angerami's t h e s i s (Ref. 56). As i s pointed out by Kenney e t a 1 (Ref. 55) the quiet-time plasmasphere extends beyond synchronous a l t i t u d e and t h e d e n s i t i e s are h ighes t during t h e sun ' s qu ie t t imes. The ULF whis t l e r s a re important i n t h a t they a re observed more f requent ly a t qu ie t t imes, while t h e VLF whis t l e r s o c c w most f r equen t ly during d is turbed condit ions.
Probes on ATS s a t e l l i t e s a t synchronous a l t i t u d e have shown t h a t ( 5 ) ex t ra- plasmaspheric plasma a t synchronous a l t i t u d e i s charac ter ized by d i r ec ted flow (normally toward t h e magnetosphere boundary) and (ii) during moderate storms, the magnetosheath plasmas appear a t synchronous a l t i t u d e (Ref. 57). Thus the pene t ra t ion of t h e bow shock and admission of t h e s o l a r wind t o synchronous a l t i t u d e during a l a rge storm i s poss ib le .
1-3.3.5.2 Al t i tude Dependence of Ionosphere Parameters
The e l e c t r o n dens i ty increases up t o t h e F2 peak and then decreases monotonically t o t h e edge of t h e plasmasphere i n the non-polar ionosphere and i n t o t h e geo- magnetic t a i l i n t h e polar ionosphere. The decoupling of t h e polar ionosphere i n t h e v i c i n i t y of t h e a u r o r a l zone i s a l ready apparent a t LOO0 km a l t i t u d e , Above t h e F2 peak the sub-auroral a l t i t u d e dependence i s charac ter ized by d i f f u s i v e equil ibr ium i n the geomagnetic f i e l d , while the polar ionosphere has flow t o and from the t a i l . The envelope of a l l a l t i t u d e p r o f i l e s is t h e model f o r o w study. Thus as we r i s e upward,this envelope represents t h e peak d e n s i t i e s under a v a r i e t y of condi t ions , t r a n s f e r r i n g from s o l a r c o n t r o l a t t h e subsolar po in t t o geomagnetic con t ro l a t about 15O l a t i t u d e near t h e F2 peak, and then

(Reference 45 )
1% November 1962 Pars No. 696
Longitude 1lre1 t 2 1 3 UT to 8282 $IT k$ -9
Dip latlbude (deg)
Figure 32 : LATITUDINAL VARIATIONS OF ELECTRON DENSITY I N THE TOPSIDE IONOSPHERE (1 1 November 1962 j
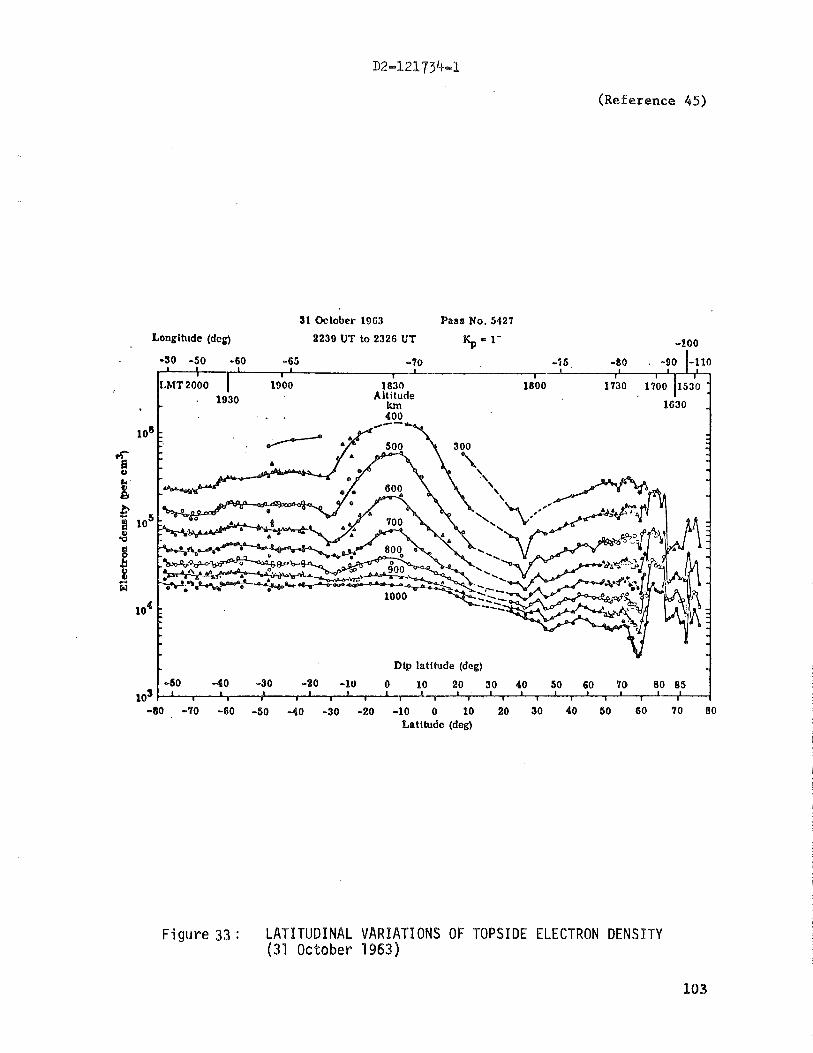
31 October 19G3 Pass No. 5427
Longih~de (dcg) 2239 UT to 2326 UT Kp = 1-
(Reference 45)
-80 -70 -60 -50 4 0 -30 -20 -10 0 10 20 30 40 SO 60 70 80 Latitude (deg)
Figure 33 : LATITUDINAL VARIATIONS OF TOPSIDE ELECTRON DENSITY (31 October 1963)
103


Figure 35: WORLD HAP OF foF2 FOR 15 UT
t o t h e geomagnetic equator above 600 km a l t i t u d e ( ~ % g . 36).
The e l e c t r o n and i o n t empera twes g e n e ~ a l l y r i s e s lowly wi th a l t i t u d e , and t h e l a t i t u d e and l o c a l t ime dependencies a r e s t rong , Mid-lati tude temperature pro- f i l e s on December 18, 1964 i l l u s t r a t e t h e time and a l t i t u d e dependency ( ~ i g . 37).
The composition of t h e ionosphere i s p r i n c i p a l l y Ot below t h e F2 peak, The Ot. concent ra t ion decreases monotonically wi th a l t i t u d e , The H+ and He+ concen- t r a t i o n inc reases a t a l l l a t i t u d e s , peaking above t h e F2 l a y e r and then de- c r eas ing monotonically, A t y p i c a l composition p r o f i l e ( ~ e f . 58) i s p resented i n Figure 38, Local time dependence of t h e composition i s shown i n F igure 39. The a l t i t u d e where H+ becomes t h e major i o n i s s t r o n g l y dependent upon l a t i t u d e and l o c a l time. A p r o f i l e f o r t h e po la r ionosphere ( ~ e f . 59) i s presented i n Figure 40.
13.3.5.3 Seasonal and Diurnal Var ia t ions
The s t r o n g e s t e l e c t r o n and i o n d e n s i t y changes a r e t h e d i u r n a l va r i a t i ons . An example of E q u a t o r i a l ionosphere changes i s provided i n Figure 41, rln example of' mid- la t i tude d e n s i t y appears i n F igure 42, A map of f0F2 seasonal and long term v a r i a t i o n dur ing a pe r iod of decreas ing s o l a r a c t i v i t y l n So la r cycle 18 (1944- 1954), o r i g i n a l l y presented by Rawer and Suchy, i s shown i n F i m e monthly mean d e n s i t y N, a t t h e F peak i s given by 1.240g @ ';~-3TheThus,
2 l q f ~ .
t h e monthly mean a t 23. O d i p l ag i tude exceeded 3.6 x 10 cm? from 1100 t o 1600 h o w s i n t h e f a l l of 19 9. The s o l a r cyc le v a r i a t i o n i s s t r o n g e s t a t t h e h igher l a t i t u d e s , a s can be seen by comparing Figures 43b and 43d. Figure 43c shows the seasona l v a r i a t i o n of t h e d i u r n a l maximum,
The e l e c t r o n temperature exceeds t h e ion temperature immediately a f t e r s u n r i s e and remains h ighe r t h o u g h o u t t h e day i n a l t i t u d e s over 800 km. Typical p r o f i l e s of mean daytime temperatures a r e preaented i n F igures 44a through 44f.
The temporal changes of t he composition a r e g e n e r a l l y small. I n t h e e x c i t e d warm ionosphere a t O+ i o n concent ra t ion i s enhanced whi le t h e H+ concent ra t ion i s enhanced a t n i g h t and dur ing per iods of low s o l a r a c t i d t y .
13.3.5.4 Geomagnetic La t i t ude Dependence
The geomagnetic l a t i t u d e competes wi th t h e l o c a l t ime f o r F2 l a y e r con t ro l , Figure 35 shows a t y p i c a l con tom p l o t of l og %ax f o r March 1958, a per iod near t h e peak of Cycle 19, when H = 210, Above t h e F2 peak t h e d e n s i t y gen- e r a l l y decreases w i t h l a t i t u d e , reaching a minimum a t about 60° l a t i t u d e and in- c r eas ing s l i g h t l y i n t h e po la r r eg ions , Figure 45 shows t y p i c a l l a t i t u d e p r o f i l e s a t around 800 km demonstrat ing t h a t averaging over time w i l l wash ou t C t he minimum so-ca l led F2 trough".
The ionosphere temperature depends s t r o n g l y upon l a t i t u d e , F igure 46 p r e s e n t s f o r 800 km a simple model which i s c o n s i s t e n t wi th tops ide sounder da t a , The h ighes t temperatures a r e observed i n t he a u r o r a l zone. Recent ly e l e c t r o n temperatures a s h igh as 6000°K have been deduced from probe measurements a t 1000 k m i n an a u r o r a l s t o m ( ~ e f . G O ) ,


(Reference 45)
Figure, 37 : ELECTRON TEMPEMTURES OBSERVED ON DECEMBER 18,1964
188
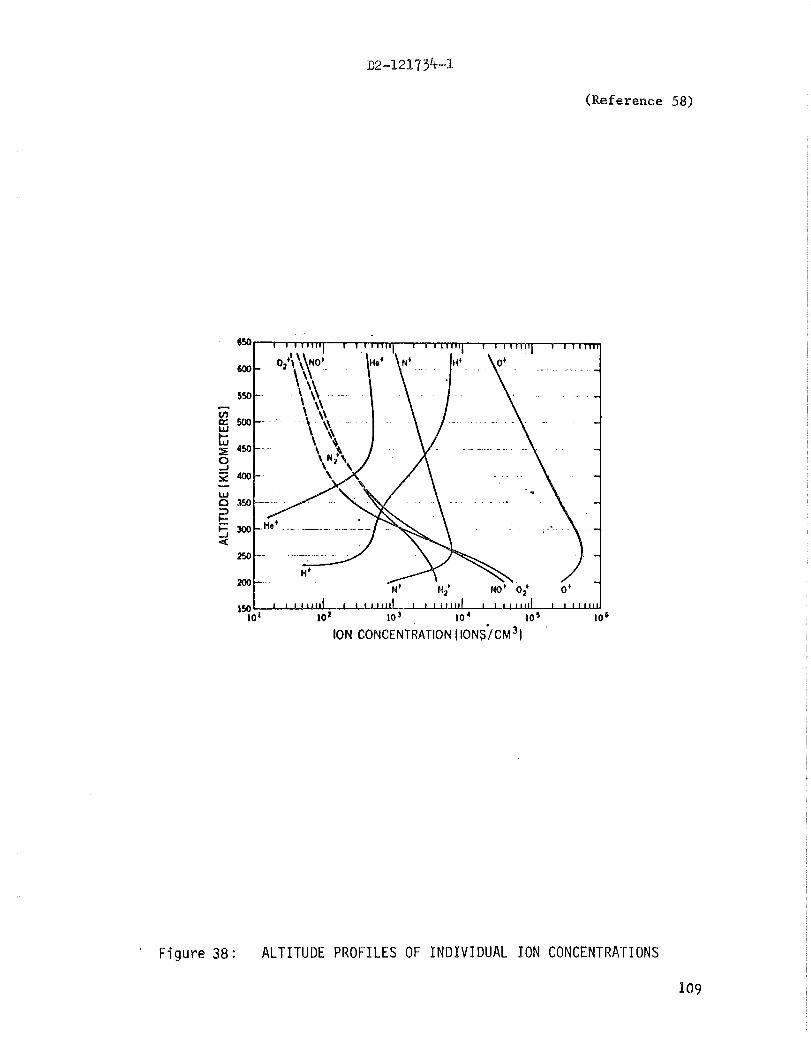
(Reference 58)
ION CONCENTRATION ( ION$CM~)
' F i g u r e 38: ALTITUDE PROFILES OF I N D I V I D U A L I O N CONCENTRATIONS
109

11OO
@W
% - w e
em B
COO I I roo
'elm
WO
400
, . W C W B O J I P ~ - PI'DWWCII W PLRCLWT
1 8.0 8E6. I . lPJ4
'Figure : IONIC COMPOSETION I N THE LATE AFTERNOON AT MIDLATITUDES
uo

(Reference 59)
F i g u r e 40: ION COMPOSITION MODEL OF THE POLAR IONOS?!!EF.C
(Reference 45) I"'" ' ' ' % I"" 9 8 , r r , . . I , 8 7-'T,
J l C A M A R C A , P E R U *-n rovcrctn 1 ~ c 4 - LOG" I, --- *a,,
. S P l t r ( 0 I
F i g u r e 41: CONTOURS OF ELECTRON DENSITY NEAR THE EQUATOR


(Reference 4 3 )
LL_LII_LI_LLU_LL! - u L u u . d R / Y W Y L T X ~ K N B / P W X X T B I N E W X I R I I ~ W I H
1949 1950 1951 IM
c ) Slough, I = 67'
19'999 19.50
13) Dakar, I = 23.5'
F igure 4::SEASONAL AND LONGTERM VARIATION OF f o F p DURING
k PERIOD OF DECREASING SOLAR ACTIV ITY
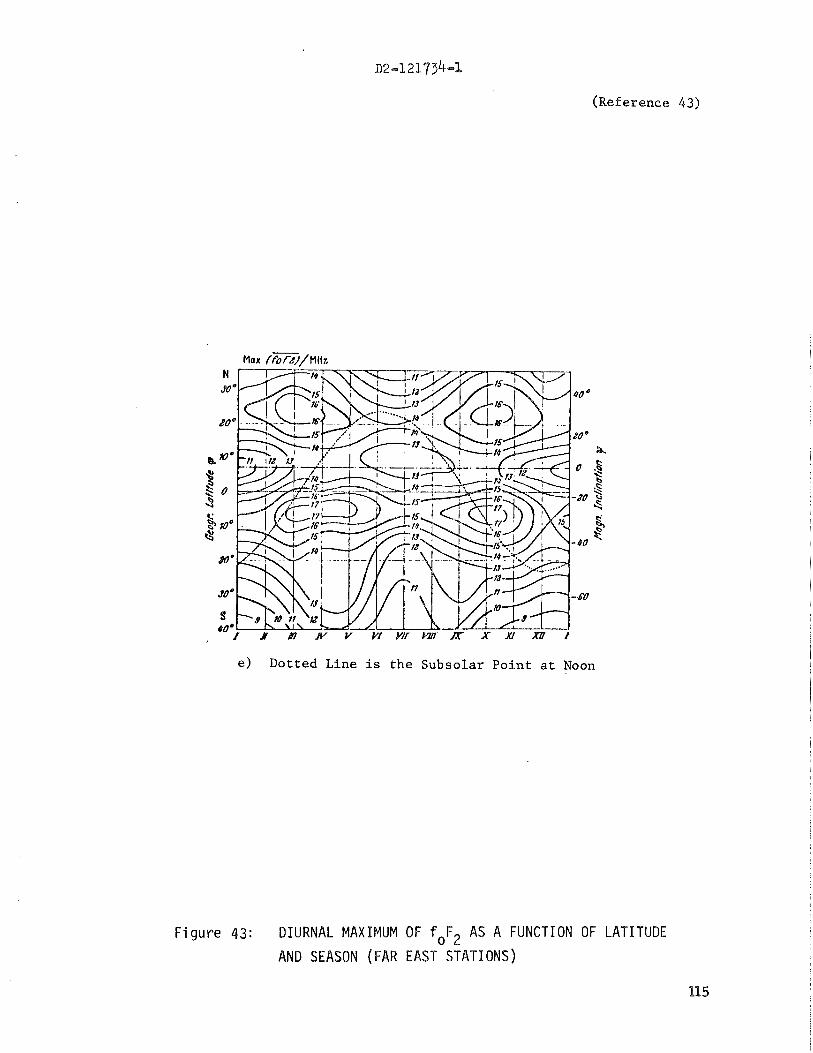
(Ref e r e n e e 4 3 )
e ) Dot ted Line is t h e Subso la r P o i n t a t Noon
F i g u r e 43: DIURNAL MAXIMUM OF f,F2 AS A FUNCTION OF LATITUDE
AND SEASON (FAR EAST STATIONS)

8 404 lit4 Ubs
IfUtERkTURt 1%)
a) March, 1963
BllIlYf A V t R A C t (0100-I400 E $1)
JULY IJ65
(Reference 45)
Tf HPitIAIURf I'F.1 b) July, 1963
F i g u r e 44: VARIATION OF T. , T,, ANO T,/Ti Y ITH HEIGHT CURING THE DAYTIME 1
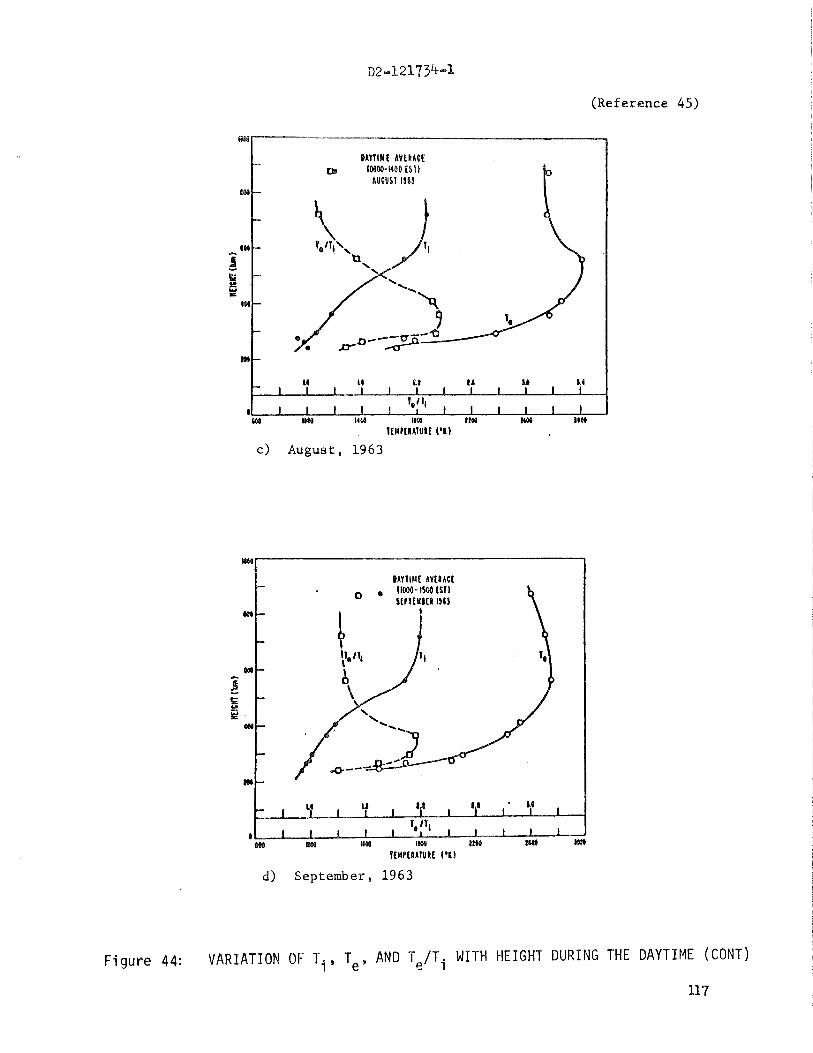
(Reference 45)
c ) August, 1963
d) September, 1963
F i g u r e 44: VARIATION OF Ti , T, , AND T,/T~ WITH HEIGHT DURING THE DAYTIME (CONT)
117

I A 1 1 t I 10 I 1 1
8 k . - ~ w nab i'f, UW , -v 1200 ID(
. IfMPtRAIUkf 1%)
e) December, 1963
IIUPtRAIUIf ( @ I 1
f ) January, 1964
(Reference! 45)
Figure 44: VARIATION OF Ti, T,, AND T,/Ti WITH HEIGHT DURING THE DAYTIME (CONT)

F i g u r e 45:
( R e f e renee 45)
E - .A
3.00 W
,OIL I I I t I I I
20 30 '40 50 60 70 80 90 DIP LATITUDE, deq
AVERAGE LATITUDINAL VARIATION OF THE ALOUETTE I O R B I T , SUMMER OF 1963
''0° - WINTER T WMMER
ELECTRON DENSITY AT THE
(Referenct 45)
6 L L _ ~ - L I U 90 60 30 0 50 60 W
DIP LarcYuoc, deg
F i g u r e 46 : MODEL LATITUDINAL VARIATION OF THE EFFECTIVE TEMPERATURE OF THE IONOSPHERE PLASMA ABOVE 800 KM
(Reference 45) STANFORO R63-64 STANFORD 1963
WIHTCR NI<+I'I SUI4UER OW
ARlEL I , JULY 1962
BRACE & KWY
O B ~ o w o m w w W LLTlTUOt, deq
F i g u r e 47: LAT ITUDINAL VARIATION OF MEAN I O N I C MASS AT AN ALTITUDE OF 808 KM

The i o n i c compositfon i s ~l-nder s t rong geomagnetic con t ro l , Figure b7 gives t h e mean mass a t about 800 Ian, Figures 48 t h o u g h 50 give a t 1000 km t y p i c a l i o n concentrat ions versus l a t i t u d e i n the dawn and dusk meridians, As mentioned previous ly the high a l t i t u d e polar ionosphere i s predominately H+,
Ambipolar d i f f u s i o n con t ro l s d e n s i t i e s wi th in t h e plasmasphere and i t s ex ten t i s con t ro l l ed by geomagnetic a c t i v i t y , F igwe5b shows t h e t y p i c a l dependence of t h e boundary upon t h e p lanetary index Kp, Typical e q u a t o r i a l dens i ty pro- f i l e s f o r qu ie t t imes a r e presented i n Figure 52. The hydromagnetic emissions t h a t generate ULF w h i s t l e r s may rep resen t a plasma i n s t a b i l i t y and thus the envelope of these da ta w i l l r ep resen t peak d e n s i t i e s ,
During d i s tu rbed times the ene rge t i c flow of plasma observed by Freema.n ( ~ e f . 57) can be expected. Figure 53 presents an example of the d i r e c t i o n a l f l u x of thermal H+ ions near synchronous a l t i t u d e . The extreme condit ion of d i r ec ted f l u x a t synchronous a l t i t u d e would be t h a t observed i n t h e s o l a r wind,
13,3.6 Magnetosphere
The inf luence of the E a r t h ' s magnetic f i e l d i s confined by the p r e s s w e of t h e s o l a r wind t o a region about t h e Ear th termed the magnetosphere. Although t h e high-voltage s o l a r a r r a y w i l l normally remain wi th in the magnetosphere, occa- s i o n a l l y s o l a s a c t i v i t y w i l l increase t h e v e l o c i t y of t h e s o l a r wind and compress t h e magnetosphere on t h e sunward s i d e t o the extent t h a t a synchronous-alti tude spacec ra f t w i l l pene t ra t e the boundary of the magnetosphere. The s o l a r a r r ay may then be exposed t o the extra-magnetospheric environment, as we l l as t o the t r an - s i t i o n region a t the edge of t h e magnetosphere.
The s o l a r wind, emit ted by t h e sun ' s corona, i s an ionized plasma of hydrogen and helium which streams pas t t he Ear th with a bulk v e l o c i t y of 300 t o 500 km/sec. Embedded i n t h i s plasma i s t h e in t e rp lane ta ry magnetic f i e l d , which near t h e Ear th has a f i e l d s t r e n g t h 07 about 5 3 (5x 10⁻⁹ ~ e s l a ) . The s o l a r wind bulk v e l o c i t y wi th r e spec t t o t h e E a r t h i s near ly e i g h t times the speed of sound i n t h e plasma, so a bow shock forms a t about 14 e a r t h r a d i i and t r a i l s around t h e Ear th i n a teardrop shape. Ins ide the bow shock we encounter the turbulent magnetosheath, a region of disordered magnetic f i e l d s and i r r e g u l a r f luxes of protons and e l ec t rons . A t about 10 Ear th r a d i i i n the d i r e c t i o n of the sun we encounter t h e magnetopause, a t h i n boundary between t h e megnetosheath and magnetosphere.
I n s i d e t h e magnetopause, which t r a i l s behind the Ear th i n t h e ant i - so lar d i r ec - t i o n forming the magnetic t a i l , the Ear th ' s magnetic f i e l d i s a dominant inf luence i n ordering charged p a r t i c l e motions, As we approach the Ear th , t h e s t r e n g t h of t h e magnetic f i e l d increases u n t i l it i s w e l l represented by t h e s t a b l e modified d ipole r ep resen ta t ion of Mead, and then by the model of Jenson and Cain.
13.3.6.1 So la r Wind and Storm Variat ions
An exce l l en t review of t h e s t a t e of knowledge of t h e s o l a r wind was w r i t t e n i n 1966 by DressLer ( ~ e f , 61) , The plasma experiments on t h e Pioneer, Vela, IMP and

D2-121*/34-*%
(Reference 50)
060-2 ALTITUDE I KILOMETERS1 1000 500 0 50010061500 --- 1965
I- 1
105 i d 103 102 101 loo 101 lo2 lo3 lo4 1105
L L A L % L - J 105 i d lo3 102 $0' lo0 101 lo2 103 lo4 105
lo00 500 0 500 lo00 1500 DAWN DUSK
3 I o n C o n c e n t r a t i o n ( I o n s / C M )
F i g u r e 48: CONCENTRATIONS OF H', o', N', AND He' AS A FUNCTION OF DIPOLE LATITUDE
I21

I on Concentrat ion ( IONS/CM~)
Figure 49: CONCENTRATIONS OF H', o', PIt, AND HE' FOR TWO ORBITS ON OCTOBER 14-15, 1965
12 2

(Reference 59) - - - ALTITUDE l KILOMETERS1
060-2 1 0 0 0 5 0 0 o ~ O O I O O O ~ ~ O O 1 953 DUSK I
I o n C o n c e n t r a t i o n ( IONS/CM~)
F i g u r e 50: COMPARISON OF DISTRIBUTIONS OF o', H', Nt, AND He+ OBSERVED AT VARIOUS ALTITUDES WITH THE EXTRAPOLATION OF THESE DATA TO A CONSTANT ! ,000-KILOMETER LEVEL ( S O L I D CURVES), FIELD-ALIGNED CHEMICAL AND
' D IFFUSIVE EQUIL IBRIUM ASSUMED,

(Reference 4 5 )
* - 40 +. - . - - * -
"PI * -
'a - - - B -
43 - e - 4. - 4-
- 8 l l I I I I I l l i 2 3 4 3 Q T I O I O
UC ILWAlN'S WRAMEYER, L
F i g u r e 51: REGRESSION OF THE SHELL PARAMETER OF THE C L I F F I N ELECTRON DENSITY WITH PLANETARY INDEX Kp FOR LOCAL NIGHT DURING THE SUMMER OF 1963

(Ref ercnce 5 5 )
Req (Earth Radii)
F i g u r e 52: EQUATORIAL PLASMA DENSITY DETERMINED FROM ULF WHISTLER ANALYSIS
I25

(Reference 57) I
T O SUN
' TIME: -2334 W T 0' COUNTS /ACCUMULATION JAN 13 1967 0 INTERVAL
F i g u r e 53: DIRECTIONAL FLOW OF PROTONS AT SYNCHRONOUS ALTITUDE AND POSITIVE ION ENERGY SPECTRUM (INSET)
1% 6

Explorer s a t e l l i t e s have revealed a reasonably consis tent p ic tu re of t h i s environment. A b r i e f descr ip t ion of the wind's general proper t ies i s appropr ia te ly given here.
The Solar Wind i s e f fec t ive ly a neu t ra l plasma flowing nearly r a d i a l l y from the sun, carrying the s o l a r magnetic f i e l d with it t o severa l astronomical u n i t s (Au) , It cons i s t s p r inc ipa l ly of protons, e l e t rons , an8 al$@a p a r t i c l e s with minor concentrations of heavier ions (O", 0'7, 0' , C , ~ e ' , of5). The hot n e u t r a l hydrogen densi ty i s l e s s than 1 percent of t h e proton densi ty. The plasma densi ty var ies as 1 /R2 and ranges between 1 and 100 cm-3 a t one AU with the t y p i c a l value of 5 cm-3. The alpha/proton dens i ty r a t i o var ies between 0.005 and 0.18 with 0.04 being typ ica l . The ions a l l have s imi la r ve loci ty d i s t r i b u t i o n s characterized by a bulk ve loc i ty between 270 and 800 km/sec, averaging 400 km/sec.
I n t h e coordinate frame moving with the bulk ve loc i ty the ion v e l o c i t i e s are represented we l l by a bimaxwellian d i s t r ibu t ion . Thus, the ion tempera- t u r e , genera l ly about 105O~, i s anisoptropic, with the temperature p a r a l l e l t o t h e magnetic f i e l d ( T ~ ~ ) t y p i c a l l y exceeding t h e temperature perpendicular t o t h e f i e l d ( T ) (Ref. 60). However, Pioneer 6 did observe T ~ " ~ T ~ ~ e a r l y i n t h e mission tRef. 64). A small component (- 2 percent) of plasma energized by t h e Ear th ' s magnetosphere has been detected not only i n the t a i l of the magnetosphere, but a l s o upstream from the dawn bow shock (Ref. 64).
The e lec t ron temperatwe i s genera l ly 1.5 t o 5 times the average ion temper- a t u r e and i s more near ly i s o t r o p i c ( ~ e f . 65). Typically T ~ ~ / T ~ fo r the e lec t rons i s 1.2 (Ref, 66). Thus the average e lec t ron thermal energy i s on the order of 25 eV ( T = 2 x 1 0 5 0 ~ ) and f a r exceeds t h e energy of bulk motion (-0.5 e ~ ) . The e lec t rons t non-thermal t a i l (E> 100 e ~ ) , when f i t t e d t o a bi-maxwellian d i s t r i b u t i o n , t y p i c a l l y y ie lds n=5 x and T11= 8 x 10⁵% ( ~ e f . 63, 66). Thus t h e e lec t ron f l u x across an imaginary surface exceeds t h e ion f l u x by a f a c t o r of 4.
The ion f luence spectrum r e s u l t i n g from t h e f luc tuat ions i n the densi ty and i n the speed and d i rec t ion of bulk flow i s t y p i c a . 1 1 ~ 30' t o 40' wide, and it peaks a t 0.8 keV and ranges from 0.3 keV t o 5 keV. The e lec t ron fluence spectrum i s e f f e c t i v e l y i so t rop ic , peaks a t 25 eV and contains a high energy t a i l with a few percent exceeding 100 eV.
The s o l a r a r ray w i l l penet ra te the magnetosheath only during l a rge magnetic storms, and the spacecraf t may never penetrate t h e bow shock t o reach t h e undisturbed s o l a r wind. However, a conservatively designed s o l a r ar ray would be capable of operating i n the s o l a r wind. Solar wind values t y p i c a l during l a rge magnetic storms are thus appropriate f o r the model environment.
l3.3.6.2 TrappedRadiation
H i g h energy protons (74.0 ~ e v ) and e lec t rons (70.5 ~ e v ) of the inner and outer r a d i a t i o n b e l t s axe trapped i n the Earth 's dipole-l ike magnetic f i e l d . These r a d i a t i o n b e l t s have been s tudied in tens ively since t h i e r discovery i n 1958 by Van Allen, and an enormous l i t e r a t u r e e x i s t s a t present , There axe exce l l en t reviews of t h i s l i t e r a t u r e (Ref. 34, 68, 69 ).

A s u b s t a n t i a l continuing e f f o r t by i M A and t h e A i r Force i s d i r ec ted t o defining the temporal and spat ia l - varba-bfon of t h e p a r t i c l e f l u e s , Data from s a t e l l i t e s has been compil.ed by Vette a d h i s co-workers i n t o proton and el-ectron model environments, We recommend the l a t e s t of these model environments f o r evalua t ing the r a d i a t i o n e f f e c t s on t h e high voltage s o l a r a r ray , For protons, t h i s environment would cons i s t of the AP5 map f o r the energy range from 0 , l t o 4 Mev, For 4 t o 30 IvIev the A P ~ map i s appl icable , while above 30 IvIev t h e APlmap remains current . For e lec t rons , t h e AE2 map w i t h t h e 1968 p r o j e c t i o n f o r the inner-be l t e l ec t rons i s applicable. A synchronou.~ a l t i t u d e e l e c t r o n environment has a l s o been develo~ed(AE3).
The low energy protons (E 4 1.00 k e ~ ) a re sf gn i f i c a n t a t synchronous a . l t i tude , The spectrum a t synchronous a . l t i t ude , derived from OGO-3 measurements of L, A . Frank, i s presented i n Figure 54,
Extrapola t ion of the AE3 synchronous a l t i t u d e model t o 10 keV i s s u f f i c i e n t l y accurate f o r our pu-rposes.
13.3.6.3 So la r F la re Ac t iv i ty
So la r a c t i v i t y can modffy the environment of t h e high voltage s o l a r a r r a y i n s e v e r a l ways:
o Large o p t i c a l f l a x e s , which are occasiontllly accompanied by x-ray and s o l a r p a r t i c l e emission, can s i g n i f i c a n t l y d i s t u r b the lower ionosphere. As t h e enhancement of the s o l a r electromagnetic spectrum i s a,t shor t wave le-ngths, t h e most pronounced changes occur deep i n the ionosphere,
o The e-nhanced s o l a s wind pressure associa ted wi th s o l a r a c t i v i t y can, a s mentioned before, compress t h e magnetosphere and produce s t rong time var ia- t i o n s i n t h e ou.ter-belt p a r t i c l e f'l.xces.
o Energet ic p a x t i c l e s emit ted by c e r t a i n o p t i c a l events can degrade s o l a r c e l l s ,
Variat ions i n t h e e l e c t r o n dens i ty produced by t h e la.rge opticd f l axes i s included i n t h e ionosphere model, Direc t ion iza t ion e f f e c t s on t h e spacecra.f t axe not s i g n i f i c a n t . Predic t ions of s o l a r p a r t i c l e a c t i v i t y expected i n s o l a r cycle 20 a r e given i n 'Ref. 70:
The g a l a c t i c cosmic-rays provide a low-level background of high energy p a r t i c l e s throughout t h e mission. S o l a r - m i n i m free-space f l u x measure- ments ( ~ e f . 71) show yearly doses of 12 r a d s and f luxes i n t h e order of 10 8
p r o t o n s / ~ m ~ - ~ e a s . These p a r t i c l e s a re not expec%ed t o produce any s i g n i f i c a n t problem f o r solezr arrw operat ion and they a r e mentioned only f o r completeness.
13*3*7 Meteoroids
Meteoroids, smal l p a r t i c l e s i n e l l i p t i c a l o r b i t s about the Sun, become meteors as they encounter the Ear th ' s atmosphere, Meteoroids heavier than lom2 grams become sufficiently luminous t o be observed v i s u a l l y or photographical ly,

Energy (KeV)
F i g u r e 54: TRAPPED PROTON SPECTRA AT SYNCHRONOUS ALTITUDE

The ion iza t ion t r a i l s l e f t by meteoroids heavier than 10-5 grams can be de tec ted by r a d i o means, Mo~e recen t ly s a t e l l i t e sensors have measured impact r a t e s of p a r t i c l e s having 10-1° t o low6 grams of mass.
Meteoroids a re be l ieved t o be a.lmost e n t i r e l y of cometary o r i g i n , A small f r a c t i o n of the annua.1 mass i n f l u x of meteors i s associa ted wi th meteor streams ( ~ e f , 72). Most meteor streams axe d is t inguished by t h e i r high geocentr ic ve loc i ty , u s u a . 1 1 ~ grea. ter than 30 km/sec. Some s t r e a m a r e i d e n t i f i e d wi th known comets. Most meteoroids ha.ve no observable a.ssoci- a t ions and are ca. l led spora,dic meteors when they encounter t h e atmosphere,
Velocity
The a.vera.ge of the observed meteor v e l o c i t i e s i n t h e atmosphere i s about 33 km/sec, When t h e observat ional bia.s i s removed t h e average ve loc i ty i s 16.5 km/sec (Ref, 73) . Meteors observed i n the atmosphere a re i n hypcr- b o l i c paths about t h e Ear th and hence have a. minimum veloc'ity of 11.2 kx/ sec, t h e escape speed. The ve loc i ty d i s t r i b u t i o n of meteoroids i s shown in Figure 55.
Flux
The most r e l i a b l e i n f o m a t i o n on meteoroid r a t e s i s obtained from ground- based photographs and from s a t e l l i t e penet ra t ion sensors . Neither of these methods provide the mass of the meteoroid d i r e c t l y . The luminous f l u x of photographic meteors i n t h e Ear th ' s atmosphere (Ref. 74) has been converted t o ti mass f l u x by a r e l a t i o n between mass and luminosi ty ( ~ e f , 73). The average ve loc i ty i s 16-5 ktn/sec and the cumulative f l u x i s given by
where N i s t h e number of meteoroids and M i s t h e i r mass.
When the influence of Ea r th ' s g r a v i t a t i o n a l f i e l d i s removed the corrected average v e l o c i t y becomes 14.2 km/sec and the f l u x i s
The s t m i g h t l i n e p o r t i o n of the f l u x curve i n Figure 56 i s given by the l a t t e r expression. The curve4 por t ion i n Figure 56 ha.s been derived from spacec ra f t measurements using t h e methods given i n references 75 and 76. Reference 77 gives a d d i t i o n a l j u s t i f i c a . t i o n . Radio da ta , a.lthough very extensive, i s not y e t s u f f i c i e n t l y co r rec tab le t o provide f l u x va.lues. I n Figure 56 t h e region between the s a t e l l i t e and photographic ranges i s provided by a l i n e a r in t e rpo la t ion .
S a t e l l i t e penet ra t ion r a . t e s are converted t o mass r a t e s by means of a penetra- t i o n equa,tion of the form
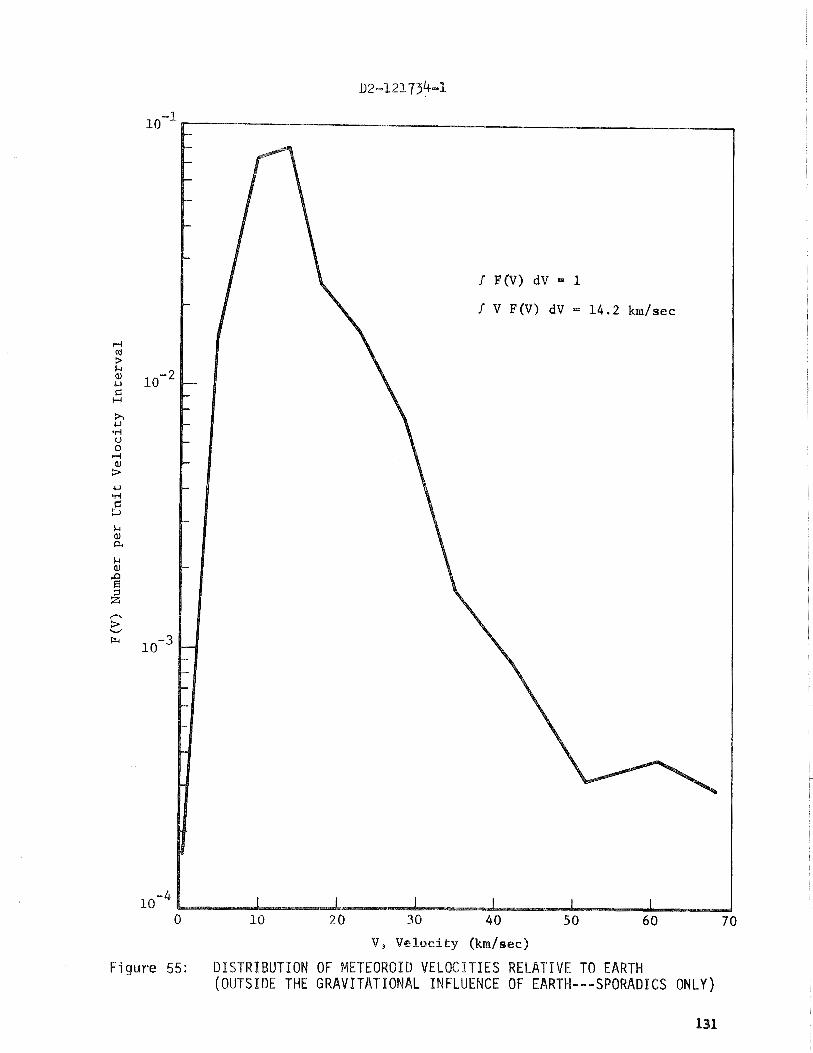
V, Velocity (km/sec)
Figure 55: DISTRIBUTION O F METEOROID VELOCITIES RELATIVE TO EARTH (OUTSIDE T H E GRAVITATIONAL INFLUENCE O F E A R T H - - - S P O W D I C S ONLY)

Log (Meteoroid Mass, grams)
Figure 56: METEOROID ENVIRONMENT NEAR EARTH ( I N THE ABSENCE OF EARTH'S GRAVITATIONAL FIELD)
where p i s the penetrated thickness, d i s the equivalent spher ica l diameter of t h e meteoroid,f i s i t s densi ty , M i s i t s mass and V i s the veloci ty r e l a - t i v e t o the spacecraf t , The average ve loc i ty f o r penet ra t ion of a s a t e l l i t e i n a very high o r b i t i s 17 km/sec, For a near-Earth s a t e l l i t e it i s 19 km/sec. This d i f ference i s a consequence of the g rea te r speed of both the s a t e l l i t e and the meteoroids i n low o r b i t s ,
The f l u x encountered by t h e s a t e l l i t e vaxies with o r b i t a l radius as a conse- quence of s a t e l l i t e motion and t h e focusing e f f e c t of t h e Ear th ' s g r a v i t a t i o n a l f i e l d on the meteoroids (Ref. 75). The mass f l u curve i n Figure 57 gives the v a r i a t i o n i n the r a t e which p a r t i c l e s of a given mass are swept up by t h e s a t e l l i t e , The penetrat ing f l u x i s the r a t e a t which a given thick- ness of mate r i a l would be penetrated.
Meteor Streams
The contr ibut ion by annual meteors streams t o the meteoroid mass i n f l u x i s about one percent per year. About 6 percent of the energy i n f Lux comes from streams (Ref. 72), The very large v i s u a l r a t e s of meteor streams r e s u l t s from t h e i r high atmosphere v e l o c i t i e s , the luminosity varying approximately as d. I n t h e peak i n t e n s i t y of an annual stream the penetrat ion r a t e would be a t most double the average r a t e (Ref. 72 and 73).
Physical Chara.cterist ics
The physica l consistency of meteors i s i n keeping with a cometary or ig in . They have l i t t l e s t r eng th , d i s in tegra t ing r e a d i l y i n the atmosphere. When observed they a re a t an a l t i t u d e between 70 and 120 km. Photographic meteors have an average densi ty of about 0.25 d c c (Ref, 78) and f a i n t r ad io meteors have a densi ty of 0.8 gm/cc (Ref, 79). I n the range 10-5 t o 1 gram the dens i ty can be r e l a t e d t o mass by
13.4 ENVlRONMJ3NTAL MODEL
The environment most important t o the high-voltage sola,r a r ray study i s the ionosphere. The micrometeoroid environment i s a l s o importa.nt. The geometric f i e l d , neutra.1 atmosphere, s o l a r spectrum, aurora l and polar storm p a r t i c l e s , and t h e ma.gnetosphere contr ibute only secondary e f f e c t s . However, they influence the spat ia .1 and temporal d i s t r i b u t i o n of t h e ionosphere. Hence t h e i r descr ip t ion i s necessary i n es tab l i sh ing t h e s i g n i f - icance of t h e varia. t ions i n the ionosphere model.
For t h i s study the t i l t e d dipole model of the geomagnetic f i e l d (Ref, 40) i s s u f f i c i e n t . If a more accurate near-Earth model were needed, then the appropriate one would be t h e 1960 Jensen and Cain f i e l d model ( ~ e f . 35) which has been graphical ly displayed by hor izonta l (Ref, 81) and merid- insl (Ref, 82) projec t ions . The modificat ion of the dipole f i e l d model a t synchronous a l t i t u d e caused by the s o l a r wind i n t e r a c t i o n i s described below i n the magnetospheric mode 1. 13 3

f-i tb U
9-4 n
n x
U
=3
0-1
€x L
L
0
ww
I-I
wl-
E-

The n e u t r a l atmosphere model f o r t h i s study w i l l be the 1962 Standard atmosphere (Ref. 37), and i t s supplement (Ref, 38) f o r the analysis of e f f e c t s of seasonal and s o l a r a c t i v i t y va r ia t ions of the exosphere.
13,4.3 Solar Spectrum
The model s o l a r spectrum (Figure 58) i s adapted from Reference 39. Also shown i s the Sun's 6 0 0 0 ~ ~ black body spectrum, which i s s u f f i c i e n t fo r est imating ar ray temperatures.
Rocket (Ref. 83, 84) and s a t e l l i t e ( ~ e f . 85 ) measurements have shown t h e peak f luxes of low-energy e lec t rons and protons i n the aurora l zone (Figure 59). Typically the f lux of e lec t rons of e n e r g y f 1 0 keV becomes 109 cmm2sec-lsr"~, The 1 t o 10 keV proton f l u x i s about the same. We consider the peak f l u x t o be more s i g n i f i c a n t t o the study than a t y p i c a l moderate storm f lux, The model therefore i s the a.urora1-storm peak f lux, 10" ~m"~sec- l s r " l , with t h e spectrum i n Figure 60 a t the top of the atmosphere.
13.4.5 Ionosphere
The plasma-density model, derived from t h e envelope of a l t i t u d e p r o f i l e s , i s shown i n Figure 6~ This model represents the peak e lec t ron dens i t i e s t h a t w i l l be encountered, Mean va.lues were not derived, but they would range between 114 and 1/10 of the values i n the model.
A t y p i c a l daytime p r o f i l e of e lec t ron and ion temperature was chosen f o r the model ( ~ i g u r e 62). The v a r i a t i o n of temperature with geomagnetic l a t i t u d e , a s previously discussed, should be considered i f s ign i f i can t . The 6 0 0 0 ' ~ temperature a t 1000 m i n the aurora l zone should be considered i f spacecraf t f l i g h t i n t h i s region i s planned.
The ionosphere composition i s under strong geomagnetic and l o c a l time control . We adopted f o r a model the composition measured by Brinton e t a 1 (Figure 38), bu t sca led so t h a t the t o t a l ion densi ty equa,ls t h e model e lec t ron densi ty . Should a p a r t i c u l a r i o n i c species become important t o t h e study, a peak d e n s i t y versus a l t i t u d e p l o t w i l l be included i n the model.
13.4.6 Magnetosphere
For t h e s o l a r wind model, the upper ion v e l o c i t i e s are those described i n s e c t i o n 13.3.6.2,
For t h i s study the trapped r a d i a t i o n model is tha. t of J, I, Vette and co- workers. The proton environment below synchronous a l t i t u d e consis ts of AP5 (0.1 t o 4 me^) , A P ~ (4-30 me^) and AP1 (> 30 me^) while t h e e lec t ron environment w i l l be the AE2 model-1968 predict ion. A t synchronous a l t i t u d e t h e mean AE3 e lec t ron model i s recommended and the proton spectrum i s a s presented i n F igwe 54,


(Reference 60)
Figure 59: DIURNAL VARIATION OF THE POSITION OF THE "AURORAL ZONE" AND SOFT ELECTRON FLUXES ON JUNE 30, 1967 ( K p = 3 )
(Reference 60)
'> W x oe d
W I)' -. W
'K <: m*
0 s U
?: ,$
a 5 I). . *
-
e O a n E C T E 0 ?OR - IITMOSPMERIC O E C T H )
w" d
I to 100
ENERGY KEV
Figure 60: SPECTRA OF AURORAL ZONE ELECTRONS

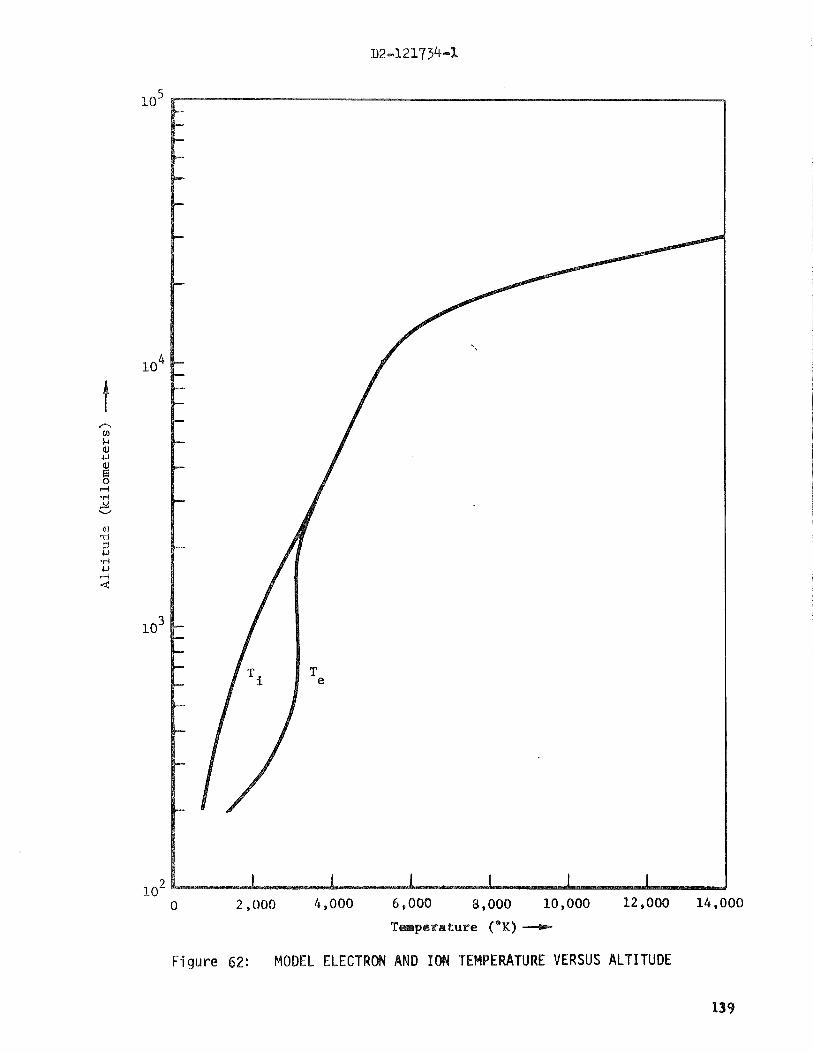
Figure 62: MODEL ELECTROM AND IM TEMPEMTUWE VERSUS ALTITUDE

The influences of so l a r ,rac"c%vlty on t he ionosphere, the so la r spectrum, and the sola2 wind have been included I n the appropr%a.te environment models. High-energy pa r t i c l e f luxes fo r the t i n e period of i n t e r e s t a,re ava.ilabls i n Reference 70.
13.4.7 Meteoroids
The model f o r cumula.tive meteoroid f l ux i s reproduced i n Figure 56, The veloci ty d i s t r ibu t ion i s given i n Figure 55 and the correction t o t he mass and energy f l ux diatrFbutions f o r near Earth o rb i t s i s given i n Figure 57,

I, Se l l en , J. M e Jr . and R e G . Kemp, " ~ e s e a r c h of Ion Beam Diagnost ics" , Report No. NASA CR-54692, prepared by TRW Systems under Contract NAS 3-6276 ( ~ e b . 1966)
2, Cole, C , K . , H. S . Ogawa and J. M. S e l l e n Jr., "operat ion of S o l a r C e l l Arrays i n D i lu t e Streaming plasmas", Report No. NASA CR-72376, prepared by TRW Sys tems under Cont rac t NPS~-10612 arch, 1968)
3. Selben, J. M e Jr., and R . J. Cybulski, "Environmental E f f e c t s on Laboratory and In-Fl ight Performance of Neu t r a l i za t ion Systems", Report No. NASA TMX-52093 (1965)
4. Chen, F. F., "E lec t r i c Probes", Plasma Diagnost ic Techniques, e d i t e d by R . H. Huddlestone and S. I. Leonard, Acedemic P res s , New York, pp. 113-200 (1965)
5. Xchott, L . , " ~ l e c t r i c a l ~ r o b e s " , Plasma Diagnost ics , e d i t e d by W, Lockte-Holtgresen, North Holland Publ i sh ing Co., Amsterdam; John Wiley & Sons Inc . , New Y r k , pp. 668-725 (1968)
6. Cole, R . , H. Ogawa, J. Se l l en , JY., perat at ion of So la r C e l l Arrays i n D i l u t e Streaming Plasma, NASA ~ ~ 7 2 3 7 6 , March, 1968.
7. Abstracts of papers presented i n Sess ion 5E of t h e 1969 Annual Meeting of t he Divis ion of Plasma Physics , he ld Nov. 12-15, 1969, B u l l e t i n of American Phys i ca l Soc ie ty , 2 (1969).
8, Burroughbridge, D . R. , "A Technique f o r Simulating t h e Ionospheric ~ las rna" , Goddard Space F l i g h t Center Report No. X-325-68- 172, (May , 1968)
9. Medved, D. B. , "on t h e Formation of S a t e l l i t e Elec t ron Sheaths Resul t ing from Secondary Emission and photoef fec ts ' I , I n t e r a c t i o n s of Space Vehicles 'with an I an ized Atmosphere, e d i t e d by S. F. S inger , P3rgarnon Press , pp, 305-321, (1967)
10, Batanov, G. M., "secondary Emission of No. 45 Glass Under t h e Ef fec t of P o s i t i v e Ions of Some Gases, Sovie t Physics S o l i d S t a t e 2, 1839 ( 1961) .
11. Greene, D . , "secondary Elec t ron Emission from Molybdenum p r d u c e d by Helium, Neon, Argon and ~ y d r o g e n " , Proc. Phys. Soc. (London), ~ 6 2 , 876 (1950).
12. Reynolds, T , W . and E. A. Richley, " P r o p e l l a ~ t Condensation on Surfaces Near an E l e c t r i c Rocket Exhaust", AIAA Paper No, 69-270, A I A A Seventh E l e c t r i c a l Propulsion Conference, arch 1969)
13. Eangmuir,I., "cur ren ts Limited by Space Charge Between Concentric spheres" , Phys. Rev. - 23, 49 (1924)

Schwartz, "~easurement Tech iques f6r bin-Fibs", Johnson Reprint Corporation, pp. 199P.272, (1967).
Colligan, J. S. , "1on Bombardment of Metal Surfaces", Vacuum ll, 272 (1961)
Hansen, R . G . and others, "Effects of Atomic Oxygen on ~olymers" , Journal of Palymer Science, Vol. A 3 , 2205 (1-965)
J a f f e , L. D . and J. B, Rit tenhaus, " ~ e h a v i o r of Materials i n Space ~ n v i r o n n e n t s " , JPL Technical Report No. 32-150 (NOV. 1, 1961)
Ki lpa t r i ck , W. D., "progress i n ~ i e l e c t r i c s " No. 7, p. 199, LDndon Heywood Books, ( 1967)
N. Riehl , e t a l , on Destructive Breakdown i n Mylar Films, Par t I," Z. Angewandte Physik -- 27, 261 (1969)
Whitehead, S., "Dielec t r ic Breakdlown of Sol ids , " Oxford (1953)
Fowler, R . H, and L. W. Nordheim, " ~ l e c t r o n Emission i n Intense E l e c t r i c F i e l d s , " Proc. Royal Society (London)
Nordheim, L. W . , he Effect of the Image Force on the Emission and Reflexion of Electrons by Metals , " Proc. Royal Society o on don) A121 626 (1928) C-.-L-
schottky, W., Physik Z. 15, 872 (1914) - Dobrezow, L. N., " ~ l e c t r o n and Ion Emission of Thoriated Wolfram i n Sodium ~ a p o u r , " J. Exp, Theor. Physics (USSR) - 17, 301 (1947)
Good, R . H . and E. W e MuEler, " ~ i e l d Emission a t Higher Temperatures," Handbuch de r Physik - 21, 190 (1956)
Kaminsky, M., " ~ t o m i c and Ion ic Impact Phenomena on Metal ~ u r f a c e s , " Academic Press , New York (1965)
I1 Hawley, R . and A. A . Zaky, Conduction and Breakdown i n High ~acuum," Progress i n Die lec t r i c s #7, p. 115, London Heywood Books, (1967)
Cooley and B e r r e t t , c and book of Space Environmental Ef fec t s on Solar C e l l Pawer systems ," Exotech Inc. , NASW-1345, a an. 1968)
" ~ e a . s i b i l i t ~ Study 30 Watts Per Pound Rollup Solar Array," F i n a l Report ND. 40067-4, Ryan Aeronautical Company, ( ~ u n e 1968)
Murray, William A. , The Bsebng Company, "What Par t s Lessons from Lunar o r b i t e r ? " Proceedings 1969 Annual Symposium on R e l i a b i l i t y - -
Binckley, W . G . , TRW Sys tem, "power System Configuration Study and R e l i a b i l i t y ~ n a l ~ s i s , " 3rd Quar ter ly Progreas Report, JPL Contract No. 951574

32. Tanner, T. E. , B e l l Telephone Laboratories, " ~ p e r a t i o n a l R e l i a b i l i t y of Components i n Selected Sys tems , " 1966 Annual Symposium on ReStabilLty.
33. "Tables of the SndivSdual and Cumulative Terms of the Poisson Dis t r ibut ion, " Defense Systems Department, General E l e c t r i c Company
34. Hess, W. N., he Radiat ion Belt and Magnetosphere," B l a i s d e l l Publishing Co. , Waltham, Mass,, ( 1968)
35. Jense, D. C . , and J. C. Cain, " ~ n Interim Magnetic ~ i e l d , " J. Geophys. Res., 67 3568, (1962) -
36. Mead, G. D., "~eformat ion of the Geomagnetic F ie ld by the Solar Wind," J. Geophys. Res., 9 1181, (1.964)
37. "U. S. Standard Atmosphere, 1962," Committee on Extension t o the Standard Atmosphere (COESA), Wash., D. C . , (~ecember 1962)
38. "u. S. Standard Atmosphere Supplements, 1966" NASA, ESSA, A i r Force, Wash., D. C . , (1966)
39. " ~ n t r o d u c t i o n t o Space science," W . N. Hess and G . D. Mead, e d i t o r s Gordon and Breach, New Ysrk, (1968) Pages 668 and 669
40. a and book of Geophysics and Space En-.dronments," A i r Force Cambridge Research Laboratories, ( 1965 )
41. "~onosphesic Radio Propagakion, " Kenneth Davies, National Bureau of Standards, ( 1965)
42. " ~ n t r o d u c t i o n t o Space sciences," Second Edit ion, Edited by W. N. Hess and G. D. Mead, Gordon and Breach Science Publishers, New York, (1968)
43. Rawer, K., and K. Suchy, '(Radio-observations of the lonosphere" i n Encyclopedia of Physics, Volume XLIX, Par t 2, Ed., S. Flugge, Springer-Verlag , New York, (1967)
44. Evans, J. V., " ~ h e o r y an33 Pract ice of Ionospheric Study by Thomson S c a t t e r ~ a d a r " Proceedings of the IEEE, - 57, (1969)
45. Electron Dlensity P r o f i l e s i n I ~ n o s p h e r e and Exosphere, Edited by J. Frihagen, N~rth-Holland, Amsterdam, (1966)
45. Bramley, E . N. , and M. Peart iffus us ion and Electromagnetic D r i f t i n t h e Equatorial. F2 ~ e g i o n , " J. Geophys. Res, 3, 4609, (1964)
47. S t e r l i n g , D. L., W. B, Hanson, R . J, Moffett and R . G . B ~ x t e r , "influence of Electromagnetic D r i f t s and Neutral A i r Winds on Some Features of the F2-Region," Southwest Center f o r Advanced Studies Report # s P - ~ ~ - o o ~ , Submitted t o the J. Geophys. Res. arch 1969)
48, Evans, J. V, , " ~ w i s e Behagpior of the F-Layer a t Mid Latitudes," J. Geophys. Res. 73, 3489 (1968) -
49. Brace, L. H., N, W . Spencer, and A. Dalgarno, " ~ e t a i l e d Behavior of t h e Midlatitude Ionosphere from E:xplorar XTIE Sa t e l l i t e , " Planet. Space Scf. 13, 647 (1965) -
30 0 Taylor, H. A. Jr., B. C, Brinton, M. W . Pharo, 111, and N. K. Rahman, "~he rma l Ions i n t he Exosphere; Evidence of Solar and Geomagnetic ~ o n t r o l , " J. Geophys. Res. 73, $521 (1968) -
51, Taylor, H, A. Jr., II. C. Brinton, and M. W e Pharo, 111, "contraction o f the Plasmasphere During Geomagnetically Disturbed Perf ods , J. Geophys . Res. a, 9619 (1968)
52. Binsack, J, H , , "~lasmapause Observations with the M.I.T. Experiment on IMP 2," J. Geophys. Raa. 72, 5231 (1967) -
53. Carpenter, D. L., C . G. Park, H. A. Taylor, Jr., and H. C. Brinton, "Multi-Experiment Detection of the Plasmapause from EOGO S a t e l l i t e s and Antarctic Grom'l ~ t a t i o n s , " J. Geophysics Res. &, 1837 (1969)
54. Liemohn, H. B e , J. F. Kenney, and W. Be Knaflich, roton on Densities i n t he Magnetosphere from Pear l Dispersion Measurements" Earth Planetary Sci . Let ters - 2, 360, (1967)
55. Kenney, J, F. , H. B. Knatlich an& H. B. Liemohn "~agnetospher ic Parameters Determined from Structure6 Mlcropulsations , " J. Geophys . Res. z, 67379 (1968)
55. Angerami, J. J, , "A Whistler Study of the Distr ibution of Thermal Electrons i n the Magnetosphere," Stanford Electronics Lab. Tech. Rept., 3412-7, (1966). See a l so D. L . Carpenter, " ~ h i s t l e r Studies of the Plasmapause i n the Magnetosphere, 2, Electron Density and Total Tube Electron Content nea.r the Knee i n the Magnetospheric Ianization, J. Geophys. Res. 'j'l, 711, (1966)
11 57. Freeman, J. W., Jr., Observation of Flow of Low-Energy Ions a t Synchronous Alti tude and Implications f o r Magnetospheric Convection," J. Geophys. Res. - 73, 4151, (1968)
$8, Brinton, H. C., M. W. Phars, 111, H. G. May., arid H. A. Taylor, Jr,, "Implications fo r Ionospheric Chemistry and Dynamics of a Direct Measurement of the Ion Comp~sition i n the F2 ~ e g i o n , " J. Geophys. Res, - 74, 2941, (1969)
59. B a ~ l s , P. M e , and T. E. Holzer, he Polar wind," J, Geophys. Res. a, 6846, (1968) and J. Geophys. Res4 ~7, 3734, (1969)
60, Fimrllay, J. A., P, L, Dyson, L. H. Brace, A , J. Zmuda and W. E. Radfora, "Ionospheric and Magnetic Observations a t 1000 lem During the Geomagnetic Storm and Aurora of May 25-26, 3.5167~" J. Geophys. Res. sp.pe 74, 3705, (1969)

61. Desaler , A. J. , Reviews of Geophys . 2, 1, (1967)
62. Hundhausen, Bame and Neaa, J, Geophys. Res. 72, 5265, (1967) 09-s
63. Wolfe, J. He, and D. D. McKiblen, Planet. Space Sciences 16, 953. (1968) --(....-
64. Ashbridge, Bame and Strong, J. Geophys. Res. a, 5777; (1968)
65. Montgomery, Bame and HunBhausen, J. Geophysical Res. 73,' 49999 (1968) CC-
66. Formisano, V. J. Geophys. Rea. 74, 355, (1969)
67, Frank, L. A . , Trans. Am. Geophys. Union, 49, 262, (1968)
68, Anderson, K. A. , " ~ n e r g e t i c Par t i c les i n the Earth 's Magnetic Field," Annual Reviews of Nuclear Science, Vol. 16, 291, (1961) -
69. Fi lk ins , R . W. , rapped Protons of the Inner Radiation Bel t , " 5. Geophys. Res. - 71, 97, (1966)
79, Webber, W . R . , and J. R . Thomas, "sunspot Number and Solar Cosmic Ray Predictions fo r Cycle 20, 1965-1975 With Preliminary Estimates fo r Cycle 21," Boeing Document No. D2-113522-1, ( ~ a y , 1967)
71, Curtis , S. B. and M. C. Wilkinson, "study of Radiation Hazards t o Man on Extended ~ i s s i o n s ," NASA CR-1037, ( M ~ Y 1968)
Erickson, J. E., ass Inf lux and Penetration Rate of Meteor Streams," J. Geophys. Hes. --. 74, 576-585, (1969)
Erickson, J. E., "velocity Dis t r ibut ion of Sporadic Photographic ~ e t e o r s , I 1 J . Geophys. Res ., 73, 3721-3726, (1968) - Hawkins, G. S., and E. K, L. Upton, "9he Inf lux Rate of Meteors i n the Earth 's Atmosphere, " Astrophys. J. - 128, 727, (1958)
Erickson, J. E., "Analysis of the Meteoroid Flux Measured by Explorer ~6 and Lunar o rb i t e r , " Astron. J. 74, 279-283, (1969)
"Space Vehicle Integrated Thermal P ro t ec t i on /~ t ruc tu r a l Meteoroid Protection System," A technical praposal t o NASA - Lewis Research Center (RFP C-358689) Boeing Docanent ~2-1210854, ( ~ u n e 1969)
Naunann, R . J., he Near-Earth Meteoroid Environment," NASA Rept. TN D-3717, (1966)
Jacchia, L. G . , F. Vernioni, and R . E. Briggs, " ~ n Analysis of the Atmospheric Trajectories of 413 Precisely Reduced Photographic ~ e t e o r s " , Smithsonian Contrib. Astrophys . s9 1, ( 1967)
Vernioni, F., " ~ h y s i c a b Characterist ics of 320 Faint Radio ~ e t e o r " , J, Geophys. - 71, 2749-2761, (1965)

00. Clif ton, S., and R. Naumann, "~egasuet S a t e l l i t e Measwments of Metetorof 6 Penetration, " NASA, Rep%. TN X-1316, ( 1966)
81. Dudziak, W. F., D, D. Kleinecke and T. J . Kostigen " ~ r a p h i c a l Displays (1 of Geomagnetic Geometry, if, E. Tempo Rept. RM 63 TMP-2, (April 1963)
82. Harrison, R. E. , R. W. Hubbard, F. L. Keller and J. I. Vette l lots of Constant B and Constant L f o r Various ~ongitudea," Aerospace Corp. Rept. TIB-169 (3510141) TR-4, ( ~ e ~ t . 1963)
83. Chase, L. M., "~pec t r a .1 Mea8urements of Auroral-Zone Par t ic les ," J. Geophys. Res. - 73, 3469, (1968)
11 84. Bernstein, W., G. T. Inouge, N. L. Sanders, and R. L. Wax, . Measurements of Precipi ta t ing 1-20 Kev protons and Electrons During a Breakup Aurora," J. Geophys. Res. - 74, 3609, (1969)
85. OtBrien, B. J., "~ighuLat i tude Geophysical Studies with S a t e l l i t e Injun 3, 3, Precipi ta t ion of Electrons in to the ~tmosphere," J. Geophys. Res. 2, 13, (1964)