higher ccl22 poor prognosis in cervical cancer patients
TRANSCRIPT

cancers
Article
Higher CCL22+ Cell Infiltration is Associated withPoor Prognosis in Cervical Cancer Patients
Qun Wang 1, Elisa Schmoeckel 2, Bernd P. Kost 1 , Christina Kuhn 1, Aurelia Vattai 1,Theresa Vilsmaier 1, Sven Mahner 1, Doris Mayr 2, Udo Jeschke 1,* andHelene Hildegard Heidegger 1
1 Department of Obstetrics and Gynecology, University Hospital, LMU Munich, 80377 Munich, Germany;[email protected] (Q.W.); [email protected] (B.P.K.);[email protected] (C.K.); [email protected] (A.V.);[email protected] (T.V.); [email protected] (S.M.);[email protected] (H.H.H.)
2 Department of Pathology, LMU Munich, 80377 Munich, Germany;[email protected] (E.S.); [email protected] (D.M.)
* Correspondence: [email protected]
Received: 20 November 2019; Accepted: 11 December 2019; Published: 12 December 2019 �����������������
Abstract: The chemokine CCL22 recruits regulatory T (T-reg) cells into tumor tissues and is expressedin many human tumors. However, the prognostic role of CCL22 in cervical cancer (CC) has not beendetermined. This study retrospectively analyzed the clinical significance of the expression of CCL22and FOXP3 in 230 cervical cancer patients. Immunohistochemical staining analyses of CCL22 andFOXP3 were performed with a tissue microarray. Double immunofluorescence staining, cell coculture,and ELISA were used to determine CCL22 expressing cells and mechanisms. The higher number ofinfiltrating CCL22+ cells (CCL22high) group was associated with lymph node metastasis (p = 0.004),Fédération Internationale de Gynécologie et d’Obstétrique (FIGO) stages (p = 0.010), therapeuticstrategies (p = 0.007), and survival status (p = 0.002). The number of infiltrating CCL22+ cells waspositively correlated with that of infiltrating FOXP3+ cells (r = 0.210, p = 0.001). The CCL22high
group had a lower overall survival rate (OS), compared to the CCL22low group (p = 0.001). However,no significant differences in progression free survival (PFS) were noted between the two groups.CCL22high was an independent predictor of shorter OS (HR, 4.985; p = 0.0001). The OS of thecombination group CCL22highFOXP3high was significantly lower than that of the combination groupCCL22lowFOXP3low regardless of the FIGO stage and disease subtype. CCL22highFOXP3high was anindependent indictor of shorter OS (HR, 5.284; p = 0.009). The PFS of group CCL22highFOXP3high
was significantly lower than that of group CCL22lowFOXP3low in cervical adenocarcinoma, butCCL22highFOXP3high was not an independent indicator (HR, 3.018; p = 0.068). CCL22 was primarilyexpressed in M2-like macrophages in CC and induced by cervical cancer cells. The findings of ourstudy indicate that cervical cancer patients with elevated CCL22+ infiltrating cells require moreaggressive treatment. Moreover, the results provide a basis for subsequent, comprehensive studies toadvance the design of immunotherapy for cervical cancer.
Keywords: CCL22; FOXP3; cervical cancer; macrophage; T-reg
1. Introduction
Cervical cancer is the second most prevalent tumor in developing countries and the fourth mostcommon cause of cancer-related deaths among women. Over half a million new cervical cancercases, and an estimated 265,700 deaths are reported each year worldwide [1,2]. Several factors
Cancers 2019, 11, 2004; doi:10.3390/cancers11122004 www.mdpi.com/journal/cancers

Cancers 2019, 11, 2004 2 of 22
including economic conditions, genetic factors, endocrine [3], and immunity play significant role inthe progression of cervical cancer. High-risk human papilloma virus is the primary cause of cervicalcancer (CC) [4]. Immunosuppression states like infection with HIV [5] or taking immunosuppressivedrugs [6] increases susceptibility to HPV infection and which subsequently causes cervical cancer.The current cervical cancer treatments include surgery, chemotherapy, and radiotherapy, but theseare not effective for the management of advanced local cervical cancer, metastatic and recurrenttumors [7]. Recently, immunotherapy, particularly the immune checkpoint inhibitors, has achieveda great breakthrough. For example, the use of Pembrolizumab, a PD-1 inhibitor, in the later-stagedand recurrent CC was authorized [8]. However, not all CC patients are sensitive to Pembrolizumab.Additional immune-related molecules should, therefore, be identified to explain the pathogenesis andimprove the treatment of cervical cancer.
The role and mechanism of immune cells in the development of cervical cancer has not beenadequately studied. Previous studies showed that the number of FOXP3+ regulatory T-cells that couldsuppress the innate and adaptive immunity systems [9,10] was higher in cervical cancer compared toother types of tumors [11] and suppressed immune responses [12]. On the one hand, it was reportedthat cervical cancer cells could secrete indoleamine 2,3-dioxygenase (IDO) to recruit FOXP3+ regulatoryT-cells [12]. On the other hand, cervical cancer cells can secrete a series of molecules such as PEG2, IL-6,CCL2, and IL-10 that differentiate and activate M2-like macrophages [13–16]. M2-like macrophageshave been widely accepted to play a role in the poor prognostic effect in CC [17]. M2-like macrophagespromoted the CC cell proliferation by the GM-CSF/HB-EGF paracrine loop [18]. The number ofM2-like macrophages was related to invasion patterns [19] and lymph node metastasis [20]. M2-likemacrophages participate in immune suppression in cancer [21], yet, its underlying mechanism inCC has not been sufficiently elucidated. Previous studies on cervical cancer indicated that M2-likemacrophages could decrease the presence of HPV16 E7 specific CD8+ T cells by diminishing HLA-DRexpression and increasing the expression of either IL-10 or CSF1R [22–24]. Activated macrophagesmay inhibit the number of CD4+ T cells by producing neopterin [25]. M2-like macrophages coulddecrease the percentage of HPV specific regulatory T cells by blocking IL-10 signaling [26]. However,the association of CCL22 from cervical cancer cells or macrophages and regulatory T cells is still elusive.
The C-C motif chemokine ligand 22 (CCL22) gene is a secreted protein that exertschemotactic activity for monocytes, dendritic cells, natural killer cells, and for chronically activatedT lymphocytes [27–30]. Accumulating studies indicate that CCL22 plays a tumor-promoting role inhuman cancer. In ovarian cancer, for instance, CCL22 was found to induce regulatory T (T-reg) cellsinto tumor mass and inhibit T cell immunity [31]. High expression of CCL22 in M2 macrophagesconfers resistance to 5-fluorouracil in colorectal cancer [32]. A previous study showed that the CCL22mRNA expression level was higher in CC tissue than in a normal cervix [33]. However, the function ofCCL22 in cervical cancer remains unknown.
The present study determined the functional role of CCL22 in infiltrating macrophages in cervicalcancer. The expression level of CCL22 and the FOXP3+ regulatory T-cell marker was measured using atissue microarray (TMA) with immunohistochemical staining. We further evaluated the correlationbetween clinical characteristics and CCL22 and FOXP3 expression. The findings of our study indicatedthat the number of CCL22+ cells was positively correlated with that of FOXP3+ cells (r = 0.210,p = 0.001). Moreover, group CCL22high had a significantly lower overall survival rate (OS), comparedto the CCL22low group (p = 0.001). There was, however, no significant difference in progression freesurvival (PFS). The OS of the combination group CCL22highFOXP3high was significantly lower than thatof group CCL22lowFOXP3low regardless of the FIGO stage and disease subtype (p < 0.05). The PFS ofgroup CCL22highFOXP3high was significantly lower than that of group CCL22lowFOXP3low in cervicaladenocarcinoma (p < 0.05). A double immunofluorescence staining indicated that M2-like macrophagesprimarily secreted CCL22. These results suggest that CCL22 secreted by M2 macrophages could recruitT-reg cells in cervical cancer and reduce the patient survival rate.

Cancers 2019, 11, 2004 3 of 22
2. Results
2.1. CCL22 Was Overexpressed in Cervical Squamous Cell Carcinoma and Endocervical Adenocarcinoma (CESC)
The GEPIA database was used to identify the expression profile of CCL22(http://gepia.cancer-pku.cn/) [34]. Transcript expression analysis for CCL22 was carried out in atotal of 319 samples including 13 normal and 306 CESC tissues across TCGA normal and GTEx data.Next, using the ANOVA method, 1 as the Log2FC cutoff value, 0.01 as the cutoff value of the significancelevel, the expression difference of CCL22 in CESC tissue was obtained (Figure 1). The CCL22 mRNAlevel in CESC tissue was much higher than that in normal cervical tissues.
TIMER database was also used to identify the correlation between T-regs, TAM2, and CCL22(https://cistrome.shinyapps.io/timer/) [35]. MRC1 (also named CD206) and FOXP3 represent M2macrophage and regulatory T-cells, respectively [12,36]. Correlation analysis for MRC1, FOXP3, andCCL22 was carried out in the CESC dataset from TCGA. The results showed that CCL22 was positivelycorrelated with MRC1 and FOXP3 (r = 0.329, p = 4.45 × 10⁻⁹; r = 0.385, p = 4.31 × 10⁻¹², respectively).MRC1 was positively correlated with FOXP3 (r = 0.43, p = 0.001). The UALCAN database was used toanalyze the survival rate in groups with differently expressed CCL22 in the CESC dataset from TCGA(http://ualcan.path.uab.edu/index.html) [37]. The result showed that although there was no significantdifference, and the OS of the high CCL22 expression group was lower than that of the low CCL22expression group in the long run (p = 0.069) (Figure S1).
Cancers 2020, 12, x FOR PEER REVIEW 3 of 20
2.1. CCL22 Was Overexpressed in Cervical Squamous Cell Carcinoma and Endocervical Adenocarcinoma (CESC)
The GEPIA database was used to identify the expression profile of CCL22 (http://gepia.cancer-pku.cn/) [34]. Transcript expression analysis for CCL22 was carried out in a total of 319 samples including 13 normal and 306 CESC tissues across TCGA normal and GTEx data. Next, using the ANOVA method, 1 as the Log2FC cutoff value, 0.01 as the cutoff value of the significance level, the expression difference of CCL22 in CESC tissue was obtained (Figure 1). The CCL22 mRNA level in CESC tissue was much higher than that in normal cervical tissues.
TIMER database was also used to identify the correlation between T-regs, TAM2, and CCL22 (https://cistrome.shinyapps.io/timer/) [35]. MRC1 (also named CD206) and FOXP3 represent M2 macrophage and regulatory T-cells, respectively [12,36]. Correlation analysis for MRC1, FOXP3, and CCL22 was carried out in the CESC dataset from TCGA. The results showed that CCL22 was positively correlated with MRC1 and FOXP3 (r = 0.329, p = 4.45 × 10⁻⁹; r = 0.385, p = 4.31 × 10⁻¹², respectively). MRC1 was positively correlated with FOXP3 (r = 0.43, p = 0.001). The UALCAN database was used to analyze the survival rate in groups with differently expressed CCL22 in the CESC dataset from TCGA (http://ualcan.path.uab.edu/index.html) [37]. The result showed that although there was no significant difference, and the OS of the high CCL22 expression group was lower than that of the low CCL22 expression group in the long run (p = 0.069) (Figure S1).
Figure 1. Transcripts expression level of CCL22 in CESC tissue explored using the GEPIA database. Red and grey colors denote the expression level in tumor tissue and normal tissue, respectively. CESC, cervical squamous cell carcinoma and endocervical adenocarcinoma. The asterisk (*) indicate significant higher CCL22 expression in tumor tissue compared to normal tissue.
2.2. The Association between the IRS of CCL22 in CC Cells, Infiltrating CCL22+ Cell and FOXP3+ Cell Counts with Clinical Characteristics
Tissue microarray by immunohistochemistry was performed to test the number of CCL22+ and FOXP3+ cells in a retrospective cohort of 230 cervical cancer cases, including 187 cases of squamous carcinoma and 43 cases of adenocarcinoma. As shown in Figure 2 and Figure 3, the immunoreactivity of CCL22 and FOXP3 protein were detected. The IRS of CCL22 expressed in cervical cancer cells was evaluated and the number of CCL22+ and FOXP3+ cells was counted. We found that CCL22 expressed in CC cells was significantly associated with the disease subtypes (p < 0.05). The higher
Figure 1. Transcripts expression level of CCL22 in CESC tissue explored using the GEPIA database.Red and grey colors denote the expression level in tumor tissue and normal tissue, respectively. CESC,cervical squamous cell carcinoma and endocervical adenocarcinoma. The asterisk (*) indicate significanthigher CCL22 expression in tumor tissue compared to normal tissue.

Cancers 2019, 11, 2004 4 of 22
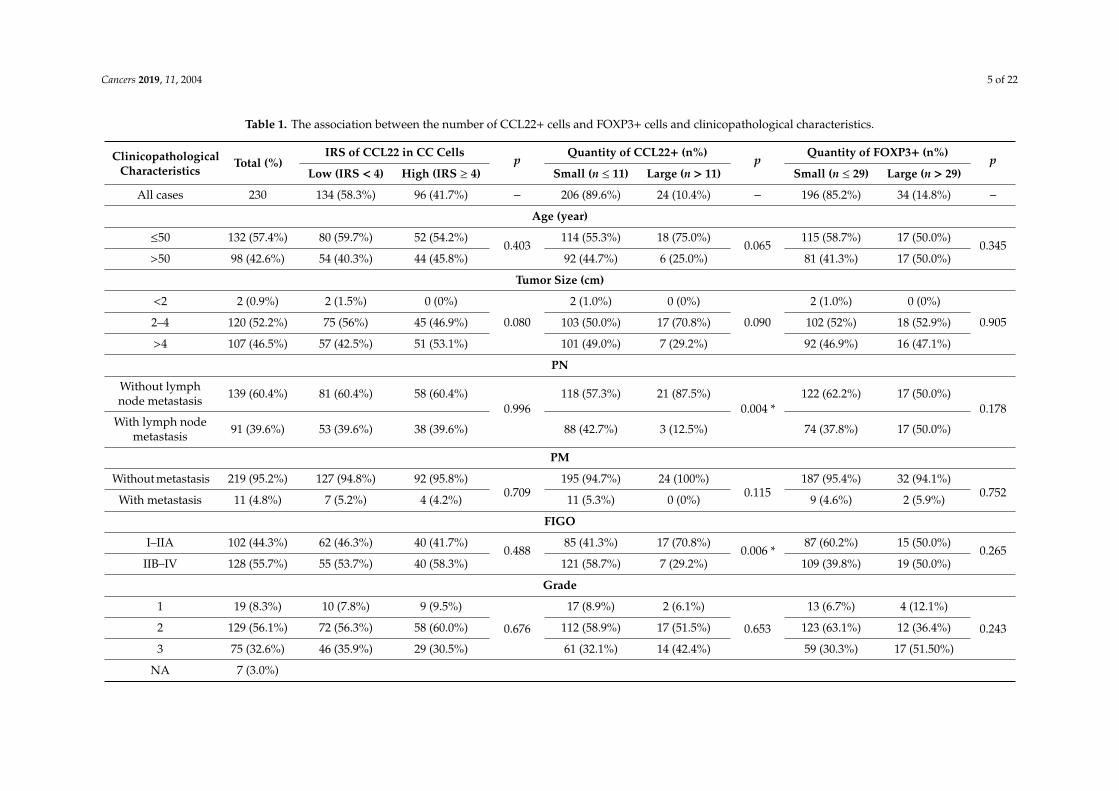
2.2. The Association between the IRS of CCL22 in CC Cells, Infiltrating CCL22+ Cell and FOXP3+ CellCounts with Clinical Characteristics
Tissue microarray by immunohistochemistry was performed to test the number of CCL22+ andFOXP3+ cells in a retrospective cohort of 230 cervical cancer cases, including 187 cases of squamouscarcinoma and 43 cases of adenocarcinoma. As shown in Figures 2 and 3, the immunoreactivity ofCCL22 and FOXP3 protein were detected. The IRS of CCL22 expressed in cervical cancer cells wasevaluated and the number of CCL22+ and FOXP3+ cells was counted. We found that CCL22 expressedin CC cells was significantly associated with the disease subtypes (p < 0.05). The higher numberof CCL22+ cells was significantly associated with lymph node metastasis (p < 0.05), FIGO stages(p < 0.05), therapeutic strategies (p < 0.05), and survival status (p < 0.05). The group with lower numberof CCL22 (+) cells had 42.7% (88/206) lymph node metastasis, 55.8% (115/206) FIGO stage I to II,38.3% (79/206) cases treated by surgery, and 11.2% (23/206) in death. The group with the higher number(n > 11) of CCL22 (+) cells had 12.5% (3/24) of cancer with lymph node metastasis, 83.3% (20/24) FIGOstage I to II, 70.8% (17/24) cases treated by surgery, and 37.5% (9/24) of cancer with death. The highernumber of FOXP3+ was significantly associated with grading (p < 0.05). The number of FOXP3+ cellswas significantly associated with disease subtypes (p < 0.05). The higher number (n > 29) of FOXP3+
cells was noted in 94.1% (32/34) with squamous carcinoma, while a lower number of FOXP3+ cells wasobserved in 79.1% (155/196) with squamous carcinoma (Table 1).
Cancers 2019, 11, 2004 5 of 22
Table 1. The association between the number of CCL22+ cells and FOXP3+ cells and clinicopathological characteristics.
ClinicopathologicalCharacteristics
Total (%)IRS of CCL22 in CC Cells
pQuantity of CCL22+ (n%)
pQuantity of FOXP3+ (n%)
pLow (IRS < 4) High (IRS ≥ 4) Small (n ≤ 11) Large (n > 11) Small (n ≤ 29) Large (n > 29)
All cases 230 134 (58.3%) 96 (41.7%) − 206 (89.6%) 24 (10.4%) − 196 (85.2%) 34 (14.8%) −
Age (year)
≤50 132 (57.4%) 80 (59.7%) 52 (54.2%)0.403
114 (55.3%) 18 (75.0%)0.065
115 (58.7%) 17 (50.0%)0.345
>50 98 (42.6%) 54 (40.3%) 44 (45.8%) 92 (44.7%) 6 (25.0%) 81 (41.3%) 17 (50.0%)
Tumor Size (cm)
<2 2 (0.9%) 2 (1.5%) 0 (0%)
0.080
2 (1.0%) 0 (0%)
0.090
2 (1.0%) 0 (0%)
0.9052–4 120 (52.2%) 75 (56%) 45 (46.9%) 103 (50.0%) 17 (70.8%) 102 (52%) 18 (52.9%)
>4 107 (46.5%) 57 (42.5%) 51 (53.1%) 101 (49.0%) 7 (29.2%) 92 (46.9%) 16 (47.1%)
PN
Without lymphnode metastasis 139 (60.4%) 81 (60.4%) 58 (60.4%)
0.996118 (57.3%) 21 (87.5%)
0.004 *122 (62.2%) 17 (50.0%)
0.178With lymph node
metastasis 91 (39.6%) 53 (39.6%) 38 (39.6%) 88 (42.7%) 3 (12.5%) 74 (37.8%) 17 (50.0%)
PM
Without metastasis 219 (95.2%) 127 (94.8%) 92 (95.8%)0.709
195 (94.7%) 24 (100%)0.115
187 (95.4%) 32 (94.1%)0.752
With metastasis 11 (4.8%) 7 (5.2%) 4 (4.2%) 11 (5.3%) 0 (0%) 9 (4.6%) 2 (5.9%)
FIGO
I–IIA 102 (44.3%) 62 (46.3%) 40 (41.7%)0.488
85 (41.3%) 17 (70.8%)0.006 *
87 (60.2%) 15 (50.0%)0.265
IIB–IV 128 (55.7%) 55 (53.7%) 40 (58.3%) 121 (58.7%) 7 (29.2%) 109 (39.8%) 19 (50.0%)
Grade
1 19 (8.3%) 10 (7.8%) 9 (9.5%)
0.676
17 (8.9%) 2 (6.1%)
0.653
13 (6.7%) 4 (12.1%)
0.2432 129 (56.1%) 72 (56.3%) 58 (60.0%) 112 (58.9%) 17 (51.5%) 123 (63.1%) 12 (36.4%)
3 75 (32.6%) 46 (35.9%) 29 (30.5%) 61 (32.1%) 14 (42.4%) 59 (30.3%) 17 (51.50%)
NA 7 (3.0%)

Cancers 2019, 11, 2004 6 of 22
Table 1. Cont.
ClinicopathologicalCharacteristics
Total (%)IRS of CCL22 in CC Cells
pQuantity of CCL22+ (n%)
pQuantity of FOXP3+ (n%)
pLow (IRS < 4) High (IRS ≥ 4) Small (n ≤ 11) Large (n > 11) Small (n ≤ 29) Large (n > 29)
Subtype
Squamouscarcinoma 187 (81.3%) 95 (70.9%) 92 (95.8%)
0.001 *171 (83.0%) 16 (66.7%)
0.091155 (79.1%) 32 (94.1%)
0.038 *Adenocarcinoma 43 (18.7%) 39 (29.1%) 4 (4.2%) 35 (17.0%) 8 (33.3%) 41 (20.9%) 2 (5.9%)
Progression
No 175 (76.1%) 99 (75.0%) 76 (80.0%)0.377
160 (78.8%) 15 (62.5%)0.072
149 (76.8%) 26 (78.8%)0.802
Yes 52 (22.6%) 33 (25.0%) 19 (20.0%) 43 (21.2%) 9 (37.5%) 45 (23.2%) 7 (21.2%)
NA 3 (1.3%)
Therapeutic Strategy
Surgery 96 (41.7%) 59 (44.0%) 37 (38.5%)
0.675
79 (38.3%) 17 (70.8%)
0.007 *
83 (42.3%) 13 (38.2%)
0.494Preoperativechemoradiotherapy 6 (2.6%) 3 (2.2%) 3 (3.1%) 6 (2.9%) 0 (0.0%) 4 (2.0%) 2 (5.9%)
Chemoradiotherapy 128 (55.7%) 72 (53.7%) 56 (58.3%) 121 (58.7%) 7 (29.2%) 109 (55.6%) 19 (55.9%)
Survival State
Alive 198 (86.1%) 114 (85.1%) 84 (87.5%)0.600
183 (88.8%) 15 (62.5%)0.002 *
170 (86.7%) 28 (82.4%)0.507
Death 32 (13.9%) 20 (14.9%) 12 (12.5%) 23 (11.2%) 9 (37.5%) 26 (13.3%) 6 (17.6%)
NA, not applicable as data not available. * p < 0.05.
Cancers 2019, 11, 2004 7 of 22
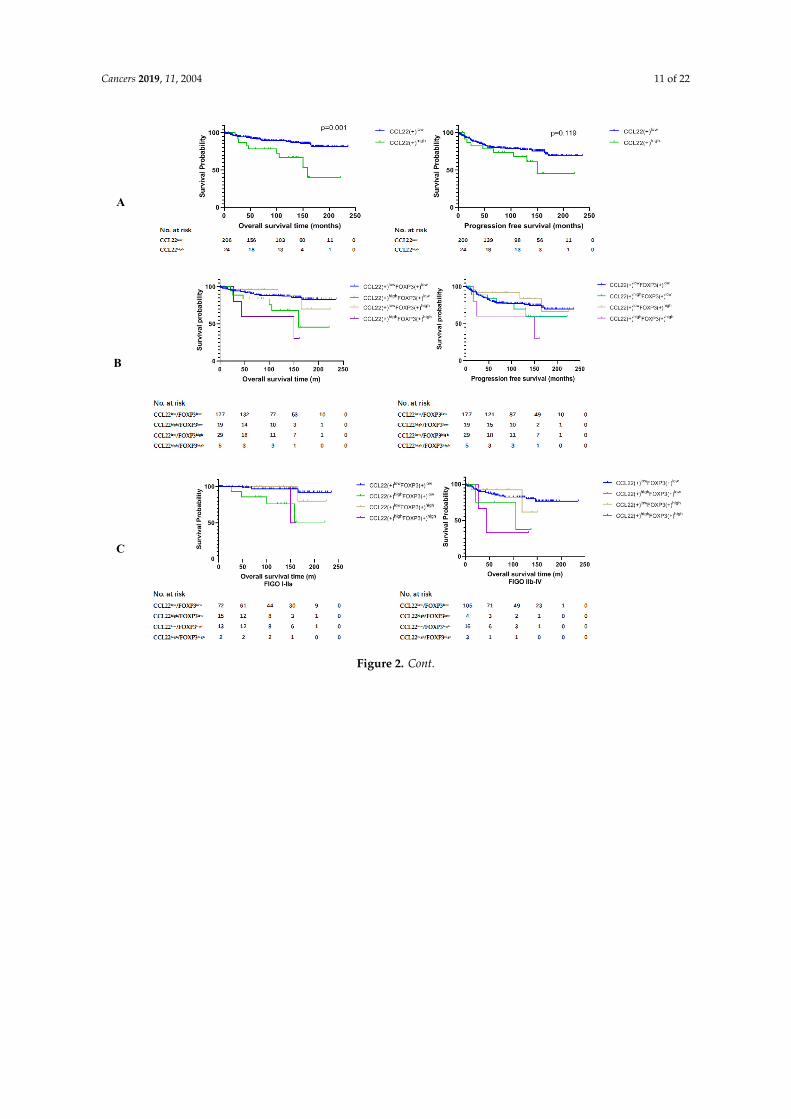
2.3. Higher Number of CCL22+ Cells Predicts Poor Prognosis of Patients with Cervical Cancer
We compared the overall survival rate (OS) and progression free survival (PFS) between groupCCL22low and group CCL22high and the combined groups of CCL22 and FOXP3. The results of thisstudy revealed that the OS of group CCL22high was significantly lower than that of group CCL22low
(p = 0.001) (Figure 2A, left). The OS of group CCL22highFOXP3low was significantly lower than that ofgroup CCL22lowFOXP3low (p = 0.022), while the OS of group CCL22highFOXP3high was significantlylower than that of group CCL22lowFOXP3low (p = 0.003). The OS of group CCL22high FOXP3high wassignificantly lower than that of group CCL22low FOXP3high (p = 0.019) (Figure 2B, left, Table 2). Therewas no significant difference in PFS between group CCL22low and group CCL22high (Figure 2A, right),but PFS of group CCL22highFOXP3high was significantly lower than that of group CCL22lowFOXP3high
(Figure 2B, right, Table 3).We further compared the OS and PFS of the four groups in low and high FIGO stages, respectively.
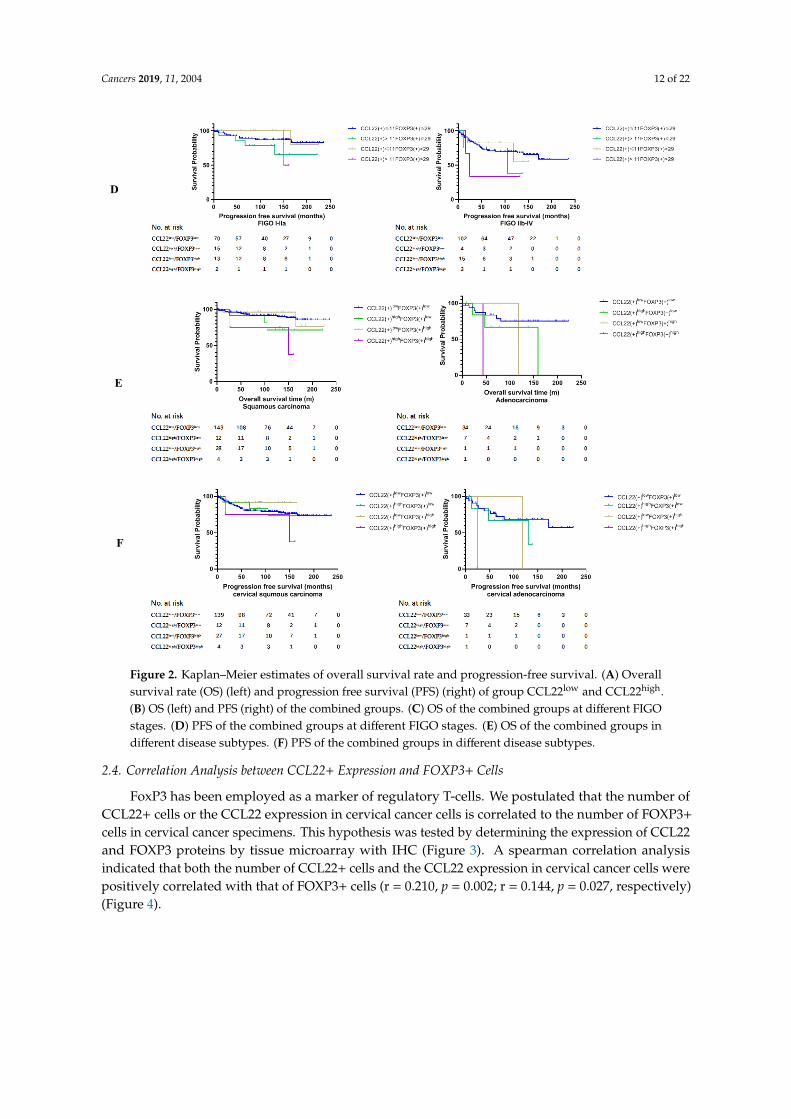
We found that the OS of CCL22highFOXP3low and CCL22highFOXP3high groups were significantly lowerthan those of the CCL22lowFOXP3low group in FIGO stage I–IIA (p = 0.001, p = 0.013, respectively)(Figure 2C, left, Table 4). The OS of the CCL22highFOXP3high group was significantly lower than thatof the CCL22lowFOXP3low group in FIGO stage IIB–IV (p = 0.029) (Figure 2C, right, Table 4). However,there was no significant difference in PFS among different groups in both low and high FIGO stages(p > 0.05) (Figure 2D, Table 5).
Due to the significant difference in the distribution of FOXP3(+) cells in cervical squamouscarcinoma and adenocarcinoma (Table 1), we further compared the OS and PFS of the four groupsin the two disease types, respectively. We found that the OS of the CCL22highFOXP3high group wassignificantly lower than that of the CCL22lowFOXP3high and CCL22lowFOXP3low groups in cervicalsquamous carcinoma (p = 0.023, p = 0.020, respectively) (Figure 2E, left, Table 6). The OS of groupCCL22highFOXP3high was significantly lower than that of group CCL22low FOXP3low in cervicaladenocarcinoma (p = 0.043) (Figure 2E, right, Table 6). There was no significant difference in PFS incervical squamous carcinoma (p > 0.05) (Figure 2F, left, Table 7). The PFS of group CCL22highFOXP3high
was significantly lower than that of group CCL22lowFOXP3low in cervical adenocarcinoma (p = 0.041)(Figure 2F, right, Table 7).
Subsequently, a multivariate analysis was done using the COX proportional hazards model forvariables that were significant in the univariate analysis was performed. For the OS analysis,we constructed two models with CCL22low vs. CCL22high or with CCL22lowFOXP3low vs.CCL22highFOXP3high. For the PFS, one model with CCL22lowFOXP3low vs. CCL22highFOXP3high
was constructed. The results showed that CCL22high and CCL22highFOXP3high were independentpredictors of shorter OS (HR 4.985, p = 0.0001; HR 5.284, p = 0.009; respectively). Although there weresignificant differences in PFS between group CCL22highFOXP3high and group CCL22lowFOXP3low,CCL22highFOXP3high was not an independent predictor of PFS (HR, 3.018; p = 0.068) (Table 8).
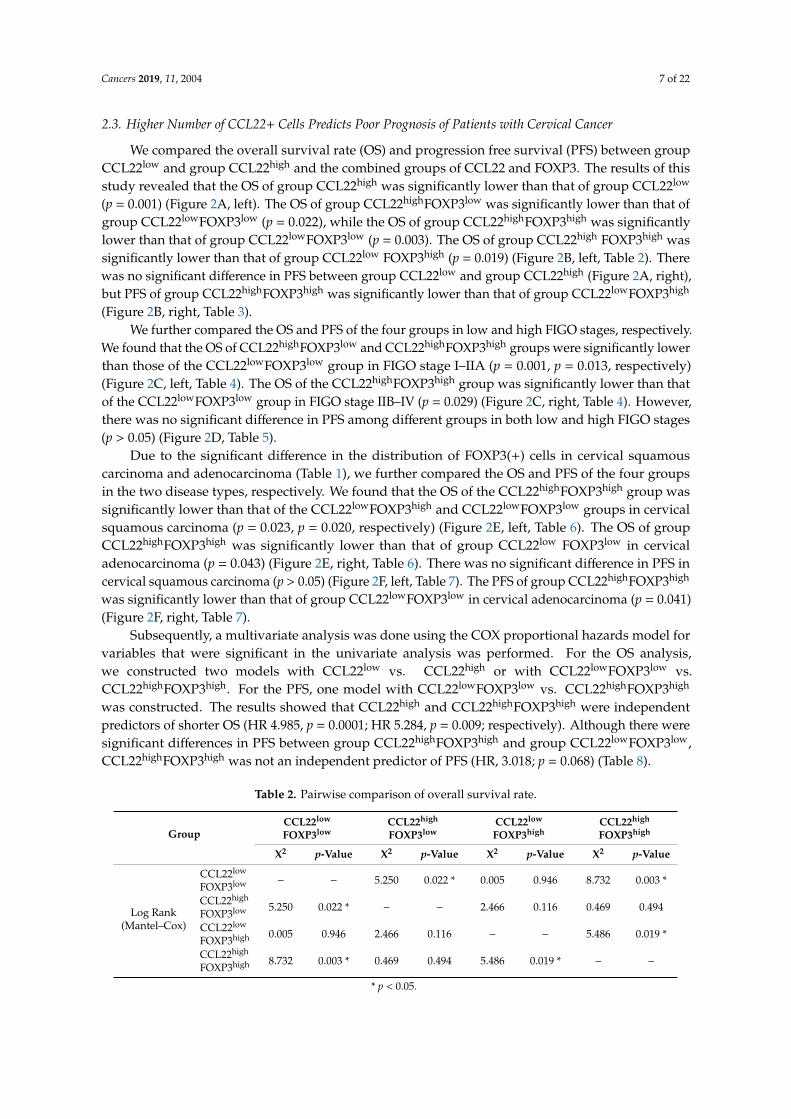
Table 2. Pairwise comparison of overall survival rate.
GroupCCL22low
FOXP3lowCCL22high
FOXP3lowCCL22low
FOXP3highCCL22high
FOXP3high
X2 p-Value X2 p-Value X2 p-Value X2 p-Value
Log Rank(Mantel–Cox)
CCL22low
FOXP3low − − 5.250 0.022 * 0.005 0.946 8.732 0.003 *
CCL22high
FOXP3low 5.250 0.022 * − − 2.466 0.116 0.469 0.494
CCL22low
FOXP3high 0.005 0.946 2.466 0.116 − − 5.486 0.019 *
CCL22high
FOXP3high 8.732 0.003 * 0.469 0.494 5.486 0.019 * − −
* p < 0.05.

Cancers 2019, 11, 2004 8 of 22
Table 3. Pairwise comparison of progression-free survival.
GroupCCL22low
FOXP3lowCCL22high
FOXP3lowCCL22low
FOXP3highCCL22high
FOXP3high
X2 p-Value X2 p-Value X2 p-Value X2 p-Value
Log Rank(Mantel–Cox)
CCL22low
FOXP3low − − 0.519 0.471 0.490 0.484 3.320 0.068
CCL22high
FOXP3low 0.519 0.471 − − 1.431 0.232 0.353 0.552
CCL22low
FOXP3high 0.490 0.484 1.431 0.232 − − 4.069 0.044 *
CCL22high
FOXP3high 3.320 0.068 0.353 0.552 4.069 0.044 * − −
* p < 0.05.
Table 4. Pairwise comparison of overall survival rate in different FIGO stages.
GroupCCL22low
FOXP3lowCCL22high
FOXP3lowCCL22low
FOXP3highCCL22high
FOXP3high
X2 p-Value X2 p-Value X2 p-Value X2 p-Value
I–IIa Log Rank(Mantel–Cox)
CCL22low
FOXP3low − − 10.547 0.001 * 0.263 0.608 6.107 0.013 *
CCL22high
FOXP3low 10.547 0.001 * − − 3.122 0.077 0.010 0.920
CCL22low
FOXP3high 0.263 0.608 3.122 0.077 − − 3.000 0.083
CCL22high
FOXP3high 6.107 0.013 * 0.010 0.920 3.000 0.083 − −
IIb-IV Log Rank(Mantel–Cox)
CCL22low
FOXP3low − − 2.575 0.109 0.013 0.911 4.761 0.029 *
CCL22high
FOXP3low 2.575 0.109 − − 0.896 0.344 0.119 0.730
CCL22low
FOXP3high 0.013 0.911 0.896 0.344 − − 1.891 0.169
CCL22high
FOXP3high 4.761 0.029 * 0.119 0.730 1.891 0.169 − −
* p < 0.05.
Table 5. Pairwise comparison of progression-free survival rate in different FIGO stages.
GroupCCL22low
FOXP3lowCCL22high
FOXP3lowCCL22low
FOXP3highCCL22high
FOXP3high
X2 p-Value X2 p-Value X2 p-Value X2 p-Value
I–IIa Log Rank(Mantel–Cox)
CCL22low
FOXP3low − − 1.967 0.161 0.301 0.583 1.413 0.235
CCL22high
FOXP3low 1.967 0.161 − − 2.888 0.089 0.029 0.864
CCL22low
FOXP3high 0.301 0.583 2.888 0.089 − − 3.000 0.083
CCL22high
FOXP3high 1.413 0.235 0.029 0.864 3.000 0.083 − −
IIb–IV Log Rank(Mantel–Cox)
CCL22low
FOXP3low − − 0.603 0.437 0.004 0.950 2.515 0.113
CCL22high
FOXP3low 0.603 0.437 − − 0.367 0.544 0.119 0.730
CCL22low
FOXP3high 0.004 0.950 0.367 0.544 − − 1.160 0.282
CCL22high
FOXP3high 2.515 0.113 0.119 0.730 1.160 0.282 − −

Cancers 2019, 11, 2004 9 of 22
Table 6. Pairwise comparison of overall survival rate in different disease subtypes.
GroupCCL22low
FOXP3lowCCL22high
FOXP3lowCCL22low
FOXP3highCCL22high
FOXP3high
X2 p-Value X2 p-Value X2 p-Value X2 p-Value
Squamouscarcinoma
Log Rank(Mantel–Cox)
CCL22low
FOXP3low − − 2.133 0.144 0.011 0.917 5.399 0.020
CCL22high
FOXP3low 2.133 0.144 − − 1.387 0.239 0.208 0.648
CCL22low
FOXP3high 0.011 0.917 1.387 0.239 − − 5.139 0.023 *
CCL22high
FOXP3high 5.399 0.020 * 0.208 0.648 5.139 0.023 − −
Adenocarcinoma Log Rank(Mantel–Cox)
CCL22low
FOXP3low − − 1.802 0.179 1.363 0.243 4.093 0.043 *
CCL22high
FOXP3low 1.802 0.179 − − 0.264 0.608 1.824 0.177
CCL22low
FOXP3high 1.363 0.243 0.264 0.608 − − 1.000 0.317
CCL22high
FOXP3high 4.093 0.043 * 1.824 0.177 1.000 0.317 − −
* p < 0.05.
Table 7. Pairwise comparison of progression-free survival in different disease subtypes.
GroupCCL22low
FOXP3lowCCL22high
FOXP3lowCCL22low
FOXP3highCCL22high
FOXP3high
X2 p-Value X2 p-Value X2 p-Value X2 p-Value
Squamouscarcinoma
Log Rank(Mantel–Cox)
CCL22low
FOXP3low − − 0.011 0.918 0.739 0.390 1.327 0.249
CCL22high
FOXP3low 0.011 0.918 − − 0.687 0.407 0.246 0.620
CCL22low
FOXP3high 0.739 0.390 0.687 0.407 − − 3.438 0.064
CCL22high
FOXP3high 1.327 0.249 0.246 0.620 3.438 0.064 − −
Adenocarcinoma Log Rank(Mantel–Cox)
CCL22low
FOXP3low − − 0.770 0.380 0.796 0.372 4.175 0.041 *
CCL22high
FOXP3low 0.770 0.380 − − 0.264 0.608 1.824 0.177
CCL22low
FOXP3high 0.796 0.372 0.264 0.608 − − 1.000 0.317
CCL22high
FOXP3high 4.175 0.041 * 1.824 0.177 1.000 0.317 − −
* p < 0.05.

Cancers 2019, 11, 2004 10 of 22
Table 8. Univariate and multivariate Cox regression analysis.
ClinicopathologicalVariables
Univariate Analysis Multivariate Analysis
PFS OS PFS OS (model 1) OS (model 2)
Age (≤50 years vs. >50 years)
HR 1.384 1.804 - - -
95%CI 0.804–2.385 0.897–3.629 - - -
p 0.241 0.098 - - -
Tumor Size (≤4 cm vs. >4 cm)
HR 3.063 4.188 2.652 5.564 5.487
95%CI 1.710–5.486 1.924–9.112 1.063–6.617 1.538–20.130 1.504–20.011
p 0.001 * 0.001 * 0.037 * 0.009 * 0.010 *
PN (Without Lymph Node Metastasis vs. Lymph Lode Metastasis)
HR 1.851 2.355 1.555 2.609 2.547
95%CI 1.065–3.218 1.162–4.774 0.756–3.200 1.032–6.596 0.988–6.562
p 0.029 * 0.017 * 0.231 0.043 * 0.053
PM (Without Metastasis vs. Metastasis)
HR 1.710 3.303 - - -
95%CI 0.531–5.508 0.999–10.924 - - -
p 0.369 0.050 - - -
FIGO (I–IIa vs. IIb–IV)
HR 2.630 2.913 1.088 0.584 0.599
95%CI 1.439–4.808 1.340–6.332 0.360–3.288 0.134–2.536 0.136–2.633
p 0.002 * 0.007 * 0.881 0.473 0.498
Grade (I vs. II–III)
HR 1.672 1.054 - - -
95%CI 0.520–5.375 0.320–3.472 - - -
p 0.388 0.931 - - -
Disease Subtype (Squamous Carcinoma vs. Adenocarcinoma)
HR 1.901 2.882 1.918 2.824 2.830
95%CI 1.043–3.466 1.408–5.899 1.038–3.545 1.359–5.869 1.361–5.883
p 0.036 * 0.004 * 0.038 * 0.005 * 0.005 *
Number of CCL22+ cells (CCL22low vs. CCL22high)
HR - 3.41 - 4.985 -
95%CI - 1.567–7.419 - 2.206–11.266 -
p - 0.002 * - 0.0001 * -
Number of CCL22+FOXP3+ cells (CCL22lowFOXP3low vs. CCL22highFOXP3high)
HR 2.806 5.355 3.018 - 5.284
95%CI 0.864–9.115 1.580–18.154 0.923–9.869 - 1.513–18.456
p 0.086 0.007 * 0.068 - 0.009 *
* p < 0.05
Cancers 2019, 11, 2004 11 of 22
Cancers 2020, 12, x FOR PEER REVIEW 6 of 20
significantly lower than that of the CCL22lowFOXP3high and CCL22lowFOXP3low groups in cervical squamous carcinoma (p = 0.023, p = 0.020, respectively) (Figure 2E, left, Table 6). The OS of group CCL22highFOXP3high was significantly lower than that of group CCL22low FOXP3low in cervical adenocarcinoma (p = 0.043) (Figure 2E, right, Table 6). There was no significant difference in PFS in cervical squamous carcinoma (p > 0.05) (Figure 2F, left, Table 7). The PFS of group CCL22highFOXP3high was significantly lower than that of group CCL22lowFOXP3low in cervical adenocarcinoma (p = 0.041) (Figure 2F, right, Table 7).
Subsequently, a multivariate analysis was done using the COX proportional hazards model for variables that were significant in the univariate analysis was performed. For the OS analysis, we constructed two models with CCL22low vs. CCL22high or with CCL22lowFOXP3low vs. CCL22highFOXP3high. For the PFS, one model with CCL22lowFOXP3low vs. CCL22highFOXP3high was constructed. The results showed that CCL22high and CCL22highFOXP3high were independent predictors of shorter OS (HR 4.985, p = 0.0001; HR 5.284, p = 0.009; respectively). Although there were significant differences in PFS between group CCL22highFOXP3high and group CCL22lowFOXP3low, CCL22highFOXP3high was not an independent predictor of PFS (HR, 3.018; p = 0.068) (Table 8).
A
C
B
Figure 2. Cont.
Cancers 2019, 11, 2004 12 of 22Cancers 2020, 12, x FOR PEER REVIEW 7 of 20
Figure 2. Kaplan–Meier estimates of overall survival rate and progression-free survival. (A) Overall survival rate (OS) (left) and progression free survival (PFS) (right) of group CCL22low and CCL22high. (B) OS (left) and PFS (right) of the combined groups. (C) OS of the combined groups at different FIGO stages. (D) PFS of the combined groups at different FIGO stages. (E) OS of the combined groups in different disease subtypes. (F) PFS of the combined groups in different disease subtypes.
Table 2. Pairwise comparison of overall survival rate.
Group
CCL22low FOXP3low
CCL22high FOXP3low
CCL22low FOXP3high
CCL22high FOXP3high
X2 p-Value X2 p-Value X2 p-Value X2 p-Value
Log Rank
(Mantel–Cox)
CCL22low FOXP3low − − 5.250 0.022 * 0.005 0.946 8.732 0.003 *
CCL22high FOXP3low
5.250 0.022 * − − 2.466 0.116 0.469 0.494
CCL22low FOXP3high
0.005 0.946 2.466 0.116 − − 5.486 0.019 *
D
E
F
Figure 2. Kaplan–Meier estimates of overall survival rate and progression-free survival. (A) Overallsurvival rate (OS) (left) and progression free survival (PFS) (right) of group CCL22low and CCL22high.(B) OS (left) and PFS (right) of the combined groups. (C) OS of the combined groups at different FIGOstages. (D) PFS of the combined groups at different FIGO stages. (E) OS of the combined groups indifferent disease subtypes. (F) PFS of the combined groups in different disease subtypes.
2.4. Correlation Analysis between CCL22+ Expression and FOXP3+ Cells
FoxP3 has been employed as a marker of regulatory T-cells. We postulated that the number ofCCL22+ cells or the CCL22 expression in cervical cancer cells is correlated to the number of FOXP3+
cells in cervical cancer specimens. This hypothesis was tested by determining the expression of CCL22and FOXP3 proteins by tissue microarray with IHC (Figure 3). A spearman correlation analysisindicated that both the number of CCL22+ cells and the CCL22 expression in cervical cancer cells werepositively correlated with that of FOXP3+ cells (r = 0.210, p = 0.002; r = 0.144, p = 0.027, respectively)(Figure 4).

Cancers 2019, 11, 2004 13 of 22Cancers 2020, 12, x FOR PEER REVIEW 11 of 20
Figure 3. CCL22 and FOXP3 expression in cervical cancer (CC) tissue microarray as determined by IHC. (A) IHC for CCL22. The scale is 100 and 200 μm, respectively; (B) IHC for FOXP3. The scale is 100 and 200 μm, respectively. The number of CCL22+ and FOXP3+ cells was counted and classified as either negative, less, or more.
Figure 4. Left: number of CCL22+ cells is associated with that of FOXP3+ cells (r = 0.210, p = 0.001). Right: IRS of CCL22 expressed in cervical cancer cells is associated with the number of FOXP3+ cells (r = 0.144, p = 0.027). The number of cells was counted at a magnification of 25× lens and calculated three times each in three different areas of the tissue microarray (TMA). The IRS of CCL22 in cervical cancer cells was evaluated at a magnification of 25× and evaluated by two independent researchers.
2.5. Identification of CCL22 Expressing Cells in Cervical Cancer
Placenta tissue was used as a positive control for CCL22 and CD68, and appendix tissue as a positive control tissue for CD163. Negative control regents with normal IgG were applied to check CCL22 (rabbit IgG), CD68 (mouse IgG), and CD163 (mouse IgG) antibody specificity (Figure 5 and Figure 6).
A previous study reported that CCL22 is expressed in myeloid cells such as dendritic cells and macrophages in the steady state [38]. This study, therefore, performed double immunofluorescence staining for CCL22, CD68, and CD163 to ascertain the expression of CCL22 in CC macrophages. CD68 and CD163 are specific markers for macrophages and M2-like macrophages, respectively [39]. We analyzed the percentage of CD68+/CCL22-, CD68+/CCL22+ and CD163+/CCL22-, CD163+/CCL22+
A
B
Figure 3. CCL22 and FOXP3 expression in cervical cancer (CC) tissue microarray as determined byIHC. (A) IHC for CCL22. The scale is 100 and 200 µm, respectively; (B) IHC for FOXP3. The scale is 100and 200 µm, respectively. The number of CCL22+ and FOXP3+ cells was counted and classified aseither negative, less, or more.
Cancers 2020, 12, x FOR PEER REVIEW 11 of 20
Figure 3. CCL22 and FOXP3 expression in cervical cancer (CC) tissue microarray as determined by IHC. (A) IHC for CCL22. The scale is 100 and 200 μm, respectively; (B) IHC for FOXP3. The scale is 100 and 200 μm, respectively. The number of CCL22+ and FOXP3+ cells was counted and classified as either negative, less, or more.
Figure 4. Left: number of CCL22+ cells is associated with that of FOXP3+ cells (r = 0.210, p = 0.001). Right: IRS of CCL22 expressed in cervical cancer cells is associated with the number of FOXP3+ cells (r = 0.144, p = 0.027). The number of cells was counted at a magnification of 25× lens and calculated three times each in three different areas of the tissue microarray (TMA). The IRS of CCL22 in cervical cancer cells was evaluated at a magnification of 25× and evaluated by two independent researchers.
2.5. Identification of CCL22 Expressing Cells in Cervical Cancer
Placenta tissue was used as a positive control for CCL22 and CD68, and appendix tissue as a positive control tissue for CD163. Negative control regents with normal IgG were applied to check CCL22 (rabbit IgG), CD68 (mouse IgG), and CD163 (mouse IgG) antibody specificity (Figure 5 and Figure 6).
A previous study reported that CCL22 is expressed in myeloid cells such as dendritic cells and macrophages in the steady state [38]. This study, therefore, performed double immunofluorescence staining for CCL22, CD68, and CD163 to ascertain the expression of CCL22 in CC macrophages. CD68 and CD163 are specific markers for macrophages and M2-like macrophages, respectively [39]. We analyzed the percentage of CD68+/CCL22-, CD68+/CCL22+ and CD163+/CCL22-, CD163+/CCL22+
A
B
Figure 4. Left: number of CCL22+ cells is associated with that of FOXP3+ cells (r = 0.210, p = 0.001).Right: IRS of CCL22 expressed in cervical cancer cells is associated with the number of FOXP3+ cells(r = 0.144, p = 0.027). The number of cells was counted at a magnification of 25× lens and calculatedthree times each in three different areas of the tissue microarray (TMA). The IRS of CCL22 in cervicalcancer cells was evaluated at a magnification of 25× and evaluated by two independent researchers.
2.5. Identification of CCL22 Expressing Cells in Cervical Cancer
Placenta tissue was used as a positive control for CCL22 and CD68, and appendix tissue as apositive control tissue for CD163. Negative control regents with normal IgG were applied to checkCCL22 (rabbit IgG), CD68 (mouse IgG), and CD163 (mouse IgG) antibody specificity (Figures 5 and 6).
A previous study reported that CCL22 is expressed in myeloid cells such as dendritic cells andmacrophages in the steady state [38]. This study, therefore, performed double immunofluorescencestaining for CCL22, CD68, and CD163 to ascertain the expression of CCL22 in CC macrophages. CD68and CD163 are specific markers for macrophages and M2-like macrophages, respectively [39]. We

Cancers 2019, 11, 2004 14 of 22
analyzed the percentage of CD68+/CCL22-, CD68+/CCL22+ and CD163+/CCL22-, CD163+/CCL22+
cells with eight slides. Our results showed that 55.22% (±14.32%) CCL22+CD68+ cells were foundon CD68+ cells, but 82.55% (±22.23%) CCL22+CD163+ cells were found on CD163+ cells (p = 0.014,Student’s t test). The results of our study indicate that M2-like macrophages primarily secrete CCL22.
Cancers 2020, 12, x FOR PEER REVIEW 12 of 20
cells with eight slides. Our results showed that 55.22% (±14.32%) CCL22+CD68+ cells were found on CD68+ cells, but 82.55% (±22.23%) CCL22+CD163+ cells were found on CD163+ cells (p = 0.014, Student’s t test). The results of our study indicate that M2-like macrophages primarily secrete CCL22.
Figure 5. Validation of antibody specificity by IHC. Placenta as positive control tissue for CCL22 and CD68, and appendix as positive control tissue for CD163. The scale is 200 μm.
Figure 5. Validation of antibody specificity by IHC. Placenta as positive control tissue for CCL22 andCD68, and appendix as positive control tissue for CD163. The scale is 200 µm.
Cancers 2020, 12, x FOR PEER REVIEW 12 of 20
cells with eight slides. Our results showed that 55.22% (±14.32%) CCL22+CD68+ cells were found on CD68+ cells, but 82.55% (±22.23%) CCL22+CD163+ cells were found on CD163+ cells (p = 0.014, Student’s t test). The results of our study indicate that M2-like macrophages primarily secrete CCL22.
Figure 5. Validation of antibody specificity by IHC. Placenta as positive control tissue for CCL22 and CD68, and appendix as positive control tissue for CD163. The scale is 200 μm.
Figure 6. Cont.

Cancers 2019, 11, 2004 15 of 22
Cancers 2020, 12, x FOR PEER REVIEW 13 of 20
Figure 6. Double fluorescence staining of cervical cancer detecting CD68+CCL22+ cells and CD163+CCL22+cells. Immunofluorescent staining of CCL22+ cells (in red) expressing CD68 (macrophages in green) and CD163 (M2 macrophages in green). These two sets of pictures of different cervical tumor samples are representative of eight tumors analyzed. Arrowheads in the merged picture (lower right) designate double-positive cells located in the stroma. 55.22% (±14.32%) CCL22+CD68+ cells were found on CD68+ cells, but 82.55% (±22.23%) CCL22+CD163+ cells were found on CD163+ cells (p = 0.014, Student’s t test). The solid line in white indicates a barrier between stroma and tumor nest. The image was shown in original magnification of 10× and 40×.
2.6. Cervical Cancer Cells Induced CCL22 in Monocytes
We cocultured monocytes with cervical cancer cells in a noncontact transwell system, which allowed the exchange of soluble factors, but prevented direct cell-cell contact. After coculture, ELISA assay demonstrated that the concentration of CCL22 in the supernatant of the lower chamber of
Figure 6. Double fluorescence staining of cervical cancer detecting CD68+CCL22+ cells andCD163+CCL22+cells. Immunofluorescent staining of CCL22+ cells (in red) expressing CD68(macrophages in green) and CD163 (M2 macrophages in green). These two sets of pictures ofdifferent cervical tumor samples are representative of eight tumors analyzed. Arrowheads in themerged picture (lower right) designate double-positive cells located in the stroma. 55.22% (±14.32%)CCL22+CD68+ cells were found on CD68+ cells, but 82.55% (±22.23%) CCL22+CD163+ cells werefound on CD163+ cells (p = 0.014, Student’s t test). The solid line in white indicates a barrier betweenstroma and tumor nest. The image was shown in original magnification of 10× and 40×.

Cancers 2019, 11, 2004 16 of 22
2.6. Cervical Cancer Cells Induced CCL22 in Monocytes
We cocultured monocytes with cervical cancer cells in a noncontact transwell system, whichallowed the exchange of soluble factors, but prevented direct cell-cell contact. After coculture, ELISAassay demonstrated that the concentration of CCL22 in the supernatant of the lower chamber ofcocultures was significantly higher (1405.4 ± 15.8, p < 0.05; 293.2 ± 13.3, p < 0.05; with Caski cells andHela cells, respectively) than that of monocytes (0.000007 ± 0.0000004) or cervical cancer cells alone(73.3 ± 13.7, p < 0.05; 10.4 ± 18.1, p < 0.05; Caski and HeLa cells, respectively) (Figure 7). These resultsindicated that cervical cancer cells could induce CCL22 in monocytes.
Cancers 2020, 12, x FOR PEER REVIEW 14 of 20
cocultures was significantly higher (1405.4 ± 15.8, p < 0.05; 293.2 ± 13.3, p < 0.05; with Caski cells and Hela cells, respectively) than that of monocytes (0.000007 ± 0.0000004) or cervical cancer cells alone (73.3 ± 13.7, p < 0.05; 10.4 ± 18.1, p < 0.05; Caski and HeLa cells, respectively) (Figure 7). These results indicated that cervical cancer cells could induce CCL22 in monocytes.
Figure 7. Cervical cancer cells induced CCL22 in monocytes. The left column graph representing the concentration of CCL22 in the supernatant from monocytes, Caski cells, and the cocultures of monocytes and Caski cells, respectively. The right column graph represents the concentration of CCL22 in the supernatant from monocytes, HeLa cells, and the cocultures of monocytes and HeLa cells, respectively. Each experiment was triplicated. * p < 0.05.
3. Materials and Methods
3.1. Bioinformatics
The GEPIA database was used to identify the expression profile of CCL22 (http://gepia.cancer-pku.cn/) [34]. Transcript expression analysis for CCL22 was carried out in a total of 316 samples including 13 normal and 303 CESC tissues across TCGA normal and GTEx data. Next, using ANOVA method, 1 as the Log2FC cutoff value, 0.01 as the cutoff value of the significance level, the expressing difference of CCL22 in CESC tissue was obtained. TIMER database was used to identify the correlation between T-regs, TAM2, and CCL22 (https://cistrome.shinyapps.io/timer/) [35]. UALCAN database was used to analyze survival rate in groups with differently expressed CCL22 in CESC dataset from TCGA (http://ualcan.path.uab.edu/index.html) [37].
3.2. Clinical Sample
The Institutional Review Board of the Ludwig-Maximilian University, Munich, (Number of approval: 337-06, 29 December 2006) approved this study. All patients provided written informed consent. Human cervical cancer tissue microarrays contained 230 samples from the patients diagnosed with CC between January 1994 and September 2002 consecutively from the Department of Obstetrics and Gynecology, LMU Munich. The age was from 22 to 83 years with a median age of 49 years. Clinicopathologic characteristics of patients are available in Table 1. Staging was performed according to the FIGO staging system. Primary treatment of CC consisted of type 3 radical hysterectomy with pelvic lymph-node dissection. Data including age, stage, lymph node metastasis, distant metastasis, and survival status were obtained from medical records. Data on tumor size, tumor grade, and lymph-node metastases were reviewed from pathology reports.
3.3. Tissue Microarray Construction
TMAs were constructed from 230 formalin-fixed, paraffin-embedded cervical cancer tissue specimens, including 187 cervical squamous cancer and 43 cervical adenocarcinoma. Briefly, to define representative tumor areas, an institutional pathologist reviewed the hematoxylin and eosin (HE)-
Figure 7. Cervical cancer cells induced CCL22 in monocytes. The left column graph representing theconcentration of CCL22 in the supernatant from monocytes, Caski cells, and the cocultures of monocytesand Caski cells, respectively. The right column graph represents the concentration of CCL22 in thesupernatant from monocytes, HeLa cells, and the cocultures of monocytes and HeLa cells, respectively.Each experiment was triplicated. * p < 0.05.
3. Materials and Methods
3.1. Bioinformatics
The GEPIA database was used to identify the expression profile of CCL22(http://gepia.cancer-pku.cn/) [34]. Transcript expression analysis for CCL22 was carried out in atotal of 316 samples including 13 normal and 303 CESC tissues across TCGA normal and GTEx data.Next, using ANOVA method, 1 as the Log2FC cutoff value, 0.01 as the cutoff value of the significancelevel, the expressing difference of CCL22 in CESC tissue was obtained. TIMER database was used toidentify the correlation between T-regs, TAM2, and CCL22 (https://cistrome.shinyapps.io/timer/) [35].UALCAN database was used to analyze survival rate in groups with differently expressed CCL22 inCESC dataset from TCGA (http://ualcan.path.uab.edu/index.html) [37].
3.2. Clinical Sample
The Institutional Review Board of the Ludwig-Maximilian University, Munich, (Number ofapproval: 337-06, 29 December 2006) approved this study. All patients provided written informedconsent. Human cervical cancer tissue microarrays contained 230 samples from the patients diagnosedwith CC between January 1994 and September 2002 consecutively from the Department of Obstetricsand Gynecology, LMU Munich. The age was from 22 to 83 years with a median age of 49 years.Clinicopathologic characteristics of patients are available in Table 1. Staging was performed accordingto the FIGO staging system. Primary treatment of CC consisted of type 3 radical hysterectomy withpelvic lymph-node dissection. Data including age, stage, lymph node metastasis, distant metastasis,and survival status were obtained from medical records. Data on tumor size, tumor grade, andlymph-node metastases were reviewed from pathology reports.

Cancers 2019, 11, 2004 17 of 22
3.3. Tissue Microarray Construction
TMAs were constructed from 230 formalin-fixed, paraffin-embedded cervical cancer tissuespecimens, including 187 cervical squamous cancer and 43 cervical adenocarcinoma. Briefly,to define representative tumor areas, an institutional pathologist reviewed the hematoxylin and eosin(HE)-stained whole-mount sections to define representative tumor areas. Subsequently, after retrievalof four 1.0-mm diameter tissue cores from the formalin-fixed paraffin-embedded tissue blocks of whichconsisted tumor specimens, they were arrayed on a 38 × 25 recipient paraffin block using an MTA-1manual tissue array (Beecher Instruments Inc., Silver Spring, MD, USA). Then, 3 µm sections werecut on a microtome and placed on glass slides for two replicates. One series was for staining CCL22and the other was for staining FoxP3. The presence of tumor tissue on the sections was verified byHE staining.
3.4. Immunohistochemistry
The TMA sections were deparaffinized in xylol for 20 min and rinsed in 100% ethanol. Then,20 min H2O2 incubation was performed to inhibit endogenous peroxidase reaction. Afterwards,the specimens were rehydrated in deescalating alcohol gradients, starting with 100% ethanol andending with distilled water. The pressure pot contained a sodium citrate buffer (pH = 6.0), whichconsisted of 0.1 m citric acid and 0.1 mM sodium citrate in distilled water. Then, samples were washedin PBS twice and incubated with a blocking solution (Regent 1, ZytoChem Plus HRP Polymer System(Mouse/Rabbit), Zytomed, Berlin, Germany) for 5 min. Incubation with the primary antibody wasperformed at 4 ◦C for 16 h. All antibodies used are listed in Table 4. Samples were washed twice in PBS(pH = 7.4) following every subsequent step. The blocking solutions (Regent 2) was applied for 20 minand HRP-Polymer (Regent 3) for 30 min. The chromogen-substrate staining was carried out usingthe Liquid DAB+ Substrate Chromogen System (Dako Scientifi, Glostrup, Denmark). The reactionwas stopped by applying distilled water. Finally, the slides were counterstained with Hemalaun for2 min and blued in tap water. The slides were dehydrated in an ascending alcohol gradient and coverslipped with Eukitt quick hardening mounting medium (Sigma Aldrich, St.Lousis, MO, USA). Humantonsil tissue was applied as positive control. All slides were analyzed using the microscope LeitzWetzlar (Wetzlar, Germany; Type 307-148.001 514686). The immunoreactive score (IRS) was used forevaluation of the intensity and distribution pattern of antigen expression. The semiquantitative scorewas calculated as follows: the optical staining intensity (grades: 0 = none, 1 = weak, 2 = moderate,3 = strong staining) was multiplied by the total percentage of positively stained cells (0 = none, 1 = 10%,2 = 11–50%, 3 = 51–80%, and 4 = 81% of the cells). This multiplication has a minimum of 0 and amaximum of 12. Two experience staff members analyzed the slides independently. Total number ofCCL22+ cells and FOXP3+ cells were counted in a magnification field of 40× lens three times each inthree different areas of each slide. The cutoff value was calculated by ROC curve. Cutoff values of 11and 27 were applied for CCL22+ cells and FOXP3+ cells, respectively.
3.4.1. Evaluation of CCL22+ Cells as Macrophages
For the visualization of CCL22 expressing cells in CC infiltrating cells, the same tissue sampleswith TMA were used. The antibodies are shown in Table 4. Double immunofluorescence staining forCCL22 and CD68 as a specific macrophage marker was performed to identify the CCL22 expressionin macrophages.
3.4.2. Evaluation of CCL22+ Cells as M2-Like Macrophages
In order to identify which subtype of macrophages express CCL22, the same tissue samples withTMA were used. The antibodies are shown in Table 9. Double immunofluorescence staining for CCL22and CD163 as a specific M2-like macrophage marker was performed.
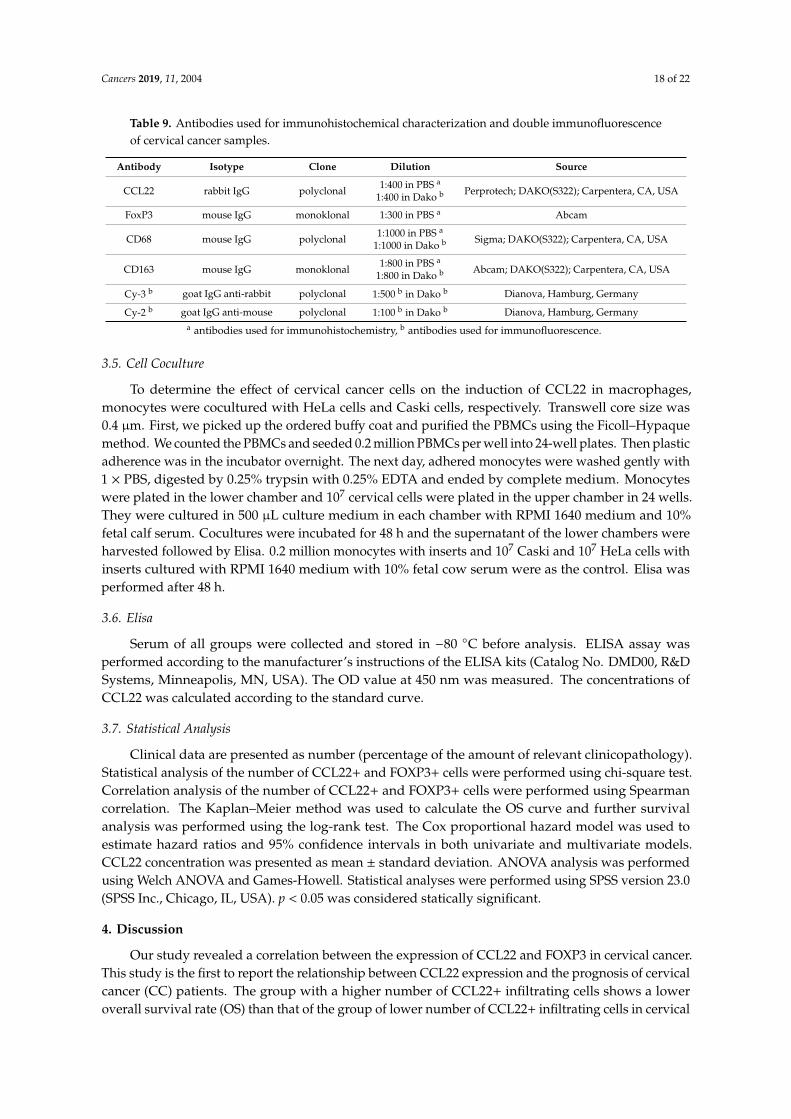
Cancers 2019, 11, 2004 18 of 22
Table 9. Antibodies used for immunohistochemical characterization and double immunofluorescenceof cervical cancer samples.
Antibody Isotype Clone Dilution Source
CCL22 rabbit IgG polyclonal 1:400 in PBS a
1:400 in Dako b Perprotech; DAKO(S322); Carpentera, CA, USA
FoxP3 mouse IgG monoklonal 1:300 in PBS a Abcam
CD68 mouse IgG polyclonal 1:1000 in PBS a
1:1000 in Dako b Sigma; DAKO(S322); Carpentera, CA, USA
CD163 mouse IgG monoklonal 1:800 in PBS a
1:800 in Dako b Abcam; DAKO(S322); Carpentera, CA, USA
Cy-3 b goat IgG anti-rabbit polyclonal 1:500 b in Dako b Dianova, Hamburg, Germany
Cy-2 b goat IgG anti-mouse polyclonal 1:100 b in Dako b Dianova, Hamburg, Germanya antibodies used for immunohistochemistry, b antibodies used for immunofluorescence.
3.5. Cell Coculture
To determine the effect of cervical cancer cells on the induction of CCL22 in macrophages,monocytes were cocultured with HeLa cells and Caski cells, respectively. Transwell core size was0.4 µm. First, we picked up the ordered buffy coat and purified the PBMCs using the Ficoll–Hypaquemethod. We counted the PBMCs and seeded 0.2 million PBMCs per well into 24-well plates. Then plasticadherence was in the incubator overnight. The next day, adhered monocytes were washed gently with1 × PBS, digested by 0.25% trypsin with 0.25% EDTA and ended by complete medium. Monocyteswere plated in the lower chamber and 107 cervical cells were plated in the upper chamber in 24 wells.They were cultured in 500 µL culture medium in each chamber with RPMI 1640 medium and 10%fetal calf serum. Cocultures were incubated for 48 h and the supernatant of the lower chambers wereharvested followed by Elisa. 0.2 million monocytes with inserts and 107 Caski and 107 HeLa cells withinserts cultured with RPMI 1640 medium with 10% fetal cow serum were as the control. Elisa wasperformed after 48 h.
3.6. Elisa
Serum of all groups were collected and stored in −80 ◦C before analysis. ELISA assay wasperformed according to the manufacturer’s instructions of the ELISA kits (Catalog No. DMD00, R&DSystems, Minneapolis, MN, USA). The OD value at 450 nm was measured. The concentrations ofCCL22 was calculated according to the standard curve.
3.7. Statistical Analysis
Clinical data are presented as number (percentage of the amount of relevant clinicopathology).Statistical analysis of the number of CCL22+ and FOXP3+ cells were performed using chi-square test.Correlation analysis of the number of CCL22+ and FOXP3+ cells were performed using Spearmancorrelation. The Kaplan–Meier method was used to calculate the OS curve and further survivalanalysis was performed using the log-rank test. The Cox proportional hazard model was used toestimate hazard ratios and 95% confidence intervals in both univariate and multivariate models.CCL22 concentration was presented as mean ± standard deviation. ANOVA analysis was performedusing Welch ANOVA and Games-Howell. Statistical analyses were performed using SPSS version 23.0(SPSS Inc., Chicago, IL, USA). p < 0.05 was considered statically significant.
4. Discussion
Our study revealed a correlation between the expression of CCL22 and FOXP3 in cervical cancer.This study is the first to report the relationship between CCL22 expression and the prognosis of cervicalcancer (CC) patients. The group with a higher number of CCL22+ infiltrating cells shows a loweroverall survival rate (OS) than that of the group of lower number of CCL22+ infiltrating cells in cervical

Cancers 2019, 11, 2004 19 of 22
cancer. However, the expression of CCL22 in cervical cancer cells seems not to affect the survival rate ofCC patients. Moreover, the OS of the group combining higher CCL22+ and FOXP3+ infiltrating cells islower than that of the group with a combined lower number of CCL22+ and FOXP3+ infiltrating cells.
In recent years, several studies have investigated the prognostic value of new immune checkpointssuch as CCL22. CCL22 belongs to a family of secreted proteins that play various roles inimmunoregulatory and inflammatory processes [27]. Previous research has reported that CCL22 is aprognostic predictor of various cancers. For instance, a report by Li et al. indicated that tumor secretionby CCL22 is an independent prognostic predictor of breast cancer [40]. Another study proved that thelevels of serum macrophage-derived CCL22 are associated with glioma risk and survival period [41].Besides, CCL22 predicts postoperative prognosis in patients with stage II/III gastric cancer [42].The prognostic value of CCL22 in cervical cancer has, however, not been investigated. This study revealsthat the CCL22high group had a lower OS, compared to the CCL22low group (p = 0.001). CCL22high
was an independent predictor of shorter OS (HR, 4.985; p = 0.0001). The OS of the combination groupCCL22highFOXP3high was significantly lower than that of the combination group CCL22lowFOXP3low
regardless of the FIGO stage and disease subtype. CCL22highFOXP3high was an independent indictorof shorter OS (HR, 5.284; p = 0.009). The PFS of group CCL22highFOXP3high was significantly lowerthan that of group CCL22lowFOXP3low in cervical adenocarcinoma, but CCL22highFOXP3high wasnot an independent indicator (HR, 3.018; p = 0.068). Therefore, the CCL22+ infiltrating cells or thecombination of CCL22 (+) and FOXP3 (+) cells are novel biomarkers that can be potentially used forcervical cancer prognosis. Since this study only had 5/230 samples with both a high number of CCL22+
and FOXP3+ infiltrating cells, increasing the sample size might provide a more reliable result.Previous studies reported that CCL22 could recruit FOXP3 (+) regulatory T-cells. Increased
CCL22 mRNA levels are correlated with increased FoxP3 mRNA levels in oral cancer specimens [43].In a B16F10 melanoma model, imiquimod (IQM) has been shown to reduce T-regs at the tumor siteby the downregulation of CCL22 production [44]. In cervical cancer, the CCL22 mRNA levels ofneoplastic foci and tumor periphery is positively correlated with FOXP3 [45]. In cervical cancer,however, the correlation between protein expression levels of CCL22 and FOXP3, and the cell sourceof CCL22 have not been determined. This study revealed a similar trend, that the protein level ofCCL22 from both cervical cancer cells and infiltrating cells was positively correlated with FOXP3.This correlation was defined by calculating the IRS of CCL22 expression in cervical cancer cells andcounting the number of CCL22+ and FOXP3+ cells. The association of the latter was better than theformer. Therefore, both cervical cancer cell-derived and infiltrating cell-derived cells might recruitT-regs, and the role of CCL22 from infiltrating cells was found to be more significant than that of CCL22from cervical cancer cells.
Several studies have investigated the source of CCL22. For instance, Huang et al. proved thatCCL22 was overexpressed in head and neck cancer cells [43]. CCL22 was found in macrophages oftongue squamous cell carcinoma [46]. Additionally, the secretion of CCL22 by M2-like macrophagesin colorectal cancer was proven [32]. However, CCL22 expression in cervical cancer has not beenpreviously determined. By performing a tissue microarray (TMA) using immunohistochemistry (IHC),we showed that CCL22 could be secreted by cervical cancer cells. Besides, double immunofluorescenceof CD163 and CCL22 showed that 82.55% (±22.23%) of CD163(+) cells were overlapped with CCL22(+) infiltrating cells. Therefore, CCL22 is secreted by M2-like macrophages and cervical cancer cells incervical cancer. Moreover, many studies proved that cervical cancer cells could induce monocytes intoM2 macrophages [18,42] which was consistent with the result in our study to some degree that CCL22in monocytes could be induced by cervical cancer cells. However, further studies need to be performedto show the effect of cervical cancer cells on M2 macrophages and the regulatory mechanisms of CCL22needs to be studied in the future. In conclusion, our findings suggest that the increase in CCL22 (+)infiltrating M2-like macrophage cells may recruit more T-regs in CC tissue and cause a poor prognosisfor cervical cancer patients. CCL22 could be a prognostic predictor and therapeutic target to identifyand treat cervical cancer patients with poorer clinical outcomes.

Cancers 2019, 11, 2004 20 of 22
5. Conclusions
Our study demonstrates that high CCL22(+) infiltrating cells particularly M2-like macrophagecells, is associated with a poor outcome of cervical cancer patients. CCL22 expression is positivelycorrelated with FoxP3 expression in cervical cancer. Thus, CCL22 may be a novel prognostic markerand therapeutic target for the treatment of cervical cancer.
Supplementary Materials: The following are available online at http://www.mdpi.com/2072-6694/11/12/2004/s1,Figure S1: Correlation analysis of CCL22, MRC1 and FOXP3 in CESC tissue as explored by the TIMER database.
Author Contributions: H.H.H.: project development, data collection. Q.W.: experiments, manuscript writing.H.H.H., B.P.K. and A.V.: data collection, manuscript editing. H.H.H. and Q.W. and T.V.: data analyses. E.S., D.M.and U.J.: supervision, data analyses. C.K. and Q.W.: experiments, methodology. S.M.: data analyses, supervision.
Funding: The China Scholarship Council (CSC) funded this study for Qun Wang.
Conflicts of Interest: S.M. reports grants and personal fees from AstraZeneca, personal fees from Clovis, grantsand personal fees from Medac, grants and personal fees from MSD. He also reports personal fees from Novartis,grants and personal fees from PharmaMar, grants and personal fees from Roche, personal fees from Sensor Kinesis,grants and personal fees from Tesaro, grants and personal fees from Teva, outside the submitted work. All otherauthors declare no conflict of interest.
References
1. Torre, L.A.; Bray, F.; Siegel, R.L.; Ferlay, J.; Lortet-Tieulent, J.; Jemal, A. Global cancer statistics, 2012. CA CancerJ. Clin. 2015, 65, 87–108. [CrossRef] [PubMed]
2. Ch, P.N.; Gurram, L.; Chopra, S.; Mahantshetty, U. The management of locally advanced cervical cancer.Curr. Opin. Oncol. 2018, 30, 323–329. [CrossRef]
3. Kessler, T.A. Cervical Cancer: Prevention and Early Detection. Semin. Oncol. Nurs. 2017, 33, 172–183.[CrossRef] [PubMed]
4. Walboomers, J.M.; Jacobs, M.V.; Manos, M.M.; Bosch, F.X.; Kummer, J.A.; Shah, K.V.; Snijders, P.J.F.; Peto, J.;Meijer, C.J.L.M.; Munoz, N. Human papillomavirus is a necessary cause of invasive cervical cancer worldwide.J. Pathol. 1999, 189, 12–19. [CrossRef]
5. Clifford, G.M.; Tully, S.; Franceschi, S. Carcinogenicity of Human Papillomavirus (HPV) Types in HIV-PositiveWomen: A Meta-Analysis From HPV Infection to Cervical Cancer. Clin. Infect. Dis. 2017, 64, 1228–1235.[CrossRef] [PubMed]
6. Feldman, C.H.; Liu, J.; Feldman, S.; Solomon, D.H.; Kim, S.C. Risk of high-grade cervical dysplasia andcervical cancer in women with systemic lupus erythematosus receiving immunosuppressive drugs. Lupus2017, 26, 682–689. [CrossRef]
7. Duenas-Gonzalez, A.; Campbell, S. Global strategies for the treatment of early-stage and advanced cervicalcancer. Curr. Opin. Obs. Gynecol. 2016, 28, 11–17. [CrossRef]
8. Borcoman, E.; Le Tourneau, C. Pembrolizumab in cervical cancer: Latest evidence and clinical usefulness.Adv. Med. Oncol. 2017, 9, 431–439. [CrossRef]
9. Toker, A.; Ohashi, P.S. Expression of costimulatory and inhibitory receptors in FOXP3(+) regulatory Tcells within the tumor microenvironment: Implications for combination immunotherapy approaches.Adv. Cancer Res. 2019, 144, 193–261. [CrossRef]
10. Miyara, M.; Sakaguchi, S. Natural regulatory T cells: Mechanisms of suppression. Trends Mol. Med. 2007, 13,108–116. [CrossRef]
11. Loddenkemper, C.; Hoffmann, C.; Stanke, J.; Nagorsen, D.; Baron, U.; Olek, S.; Huehn, J.; Ritz, J.-P.; Stein, H.;Kaufmann, A.M.; et al. Regulatory (FOXP3+) T cells as target for immune therapy of cervical intraepithelialneoplasia and cervical cancer. Cancer Sci. 2009, 100, 1112–1117. [CrossRef]
12. Visser, J.; Nijman, H.W.; Hoogenboom, B.N.; Jager, P.; Van Baarle, D.; Schuuring, E.; Abdulahad, W.;Miedema, F.; Van Der Zee, A.G.; Daemen, T. Frequencies and role of regulatory T cells in patients with(pre)malignant cervical neoplasia. Clin. Exp. Immunol. 2007, 150, 199–209. [CrossRef] [PubMed]

Cancers 2019, 11, 2004 21 of 22
13. Heusinkveld, M.; De Vos van Steenwijk, P.J.; Goedemans, R.; Ramwadhdoebe, T.H.; Gorter, A.; Welters, M.J.;Van Hall, T.; Van der Burg, S.H. M2 macrophages induced by prostaglandin E2 and IL-6 from cervicalcarcinoma are switched to activated M1 macrophages by CD4+ Th1 cells. J. Immunol. 2011, 187, 1157–1165.[CrossRef] [PubMed]
14. Sierra-Filardi, E.; Nieto, C.; Dominguez-Soto, A.; Barroso, R.; Sanchez-Mateos, P.; Puig-Kroger, A.;Lopez-Bravo, M.; Joven, J.; Ardavin, C.; Rodrguez-Fernandez, J.L.; et al. CCL2 shapes macrophagepolarization by GM-CSF and M-CSF: Identification of CCL2/CCR2-dependent gene expression profile.J. Immunol. 2014, 192, 3858–3867. [CrossRef] [PubMed]
15. Riley, J.K.; Takeda, K.; Akira, S.; Schreiber, R.D. Interleukin-10 receptor signaling through the JAK-STATpathway. Requirement for two distinct receptor-derived signals for anti-inflammatory action. J. Biol. Chem.1999, 274, 16513–16521. [CrossRef]
16. Kim, J.; Bae, J.S. Tumor-Associated Macrophages and Neutrophils in Tumor Microenvironment. Mediat.Inflamm. 2016, 2016, 6058147. [CrossRef]
17. Davidson, B.; Goldberg, I.; Kopolovic, J. Inflammatory response in cervical intraepithelial neoplasia andsquamous cell carcinoma of the uterine cervix. Pathol. Res. Pract. 1997, 193, 491–495. [CrossRef]
18. Rigo, A.; Gottardi, M.; Zamo, A.; Mauri, P.; Bonifacio, M.; Krampera, M.; Damiani, E.; Pizzolo, G.; Vinante, F.Macrophages may promote cancer growth via a GM-CSF/HB-EGF paracrine loop that is enhanced byCXCL12. Mol. Cancer 2010, 9, 273. [CrossRef]
19. Punt, S.; Thijssen, V.L.; Vrolijk, J.; De Kroon, C.D.; Gorter, A.; Jordanova, E.S. Galectin-1, -3 and -9 Expressionand Clinical Significance in Squamous Cervical Cancer. PLoS ONE 2015, 10, e0129119. [CrossRef]
20. Chen, X.J.; Han, L.F.; Wu, X.G.; Wei, W.F.; Wu, L.F.; Yi, H.Y.; Yan, R.-M.; Bai, X.; Zhong, M.; Yu, Y.; et al. ClinicalSignificance of CD163+ and CD68+ Tumor-associated Macrophages in High-risk HPV-related CervicalCancer. J. Cancer 2017, 8, 3868–3875. [CrossRef]
21. Hartwig, T.; Montinaro, A.; Von Karstedt, S.; Sevko, A.; Surinova, S.; Chakravarthy, A.; Taraborrelli, L.;Draber, P.; Lafont, E.; Vargas, F.A.; et al. The TRAIL-Induced Cancer Secretome Promotes a Tumor-SupportiveImmune Microenvironment via CCR2. Mol. Cell 2017, 65, 730–742. [CrossRef] [PubMed]
22. Lepique, A.P.; Daghastanli, K.R.; Cuccovia, I.M.; Villa, L.L. HPV16 tumor associated macrophages suppressantitumor T cell responses. Clin. Cancer Res. 2009, 15, 4391–4400. [CrossRef] [PubMed]
23. Hilders, C.G.; Munoz, I.M.; Nooyen, Y.; Fleuren, G.J. Altered HLA expression by metastatic cervical carcinomacells as a factor in impaired immune surveillance. Gynecol. Oncol. 1995, 57, 366–375. [CrossRef] [PubMed]
24. Walentowicz-Sadlecka, M.; Koper, A.; Krystyna, G.; Koper, K.; Basta, P.; Mach, P.; Skret-Magierlo, J.;Dutsch-Wicherek, M.; Sikora, J.; Grabiec, M.; et al. The analysis of metallothionein immunoreactivity instromal fibroblasts and macrophages in cases of uterine cervical carcinoma with respect to both the local anddistant spread of the disease. Am. J. Reprod. Immunol. 2013, 70, 253–261. [CrossRef] [PubMed]
25. Melichar, B.; Solichova, D.; Freedman, R.S. Neopterin as an indicator of immune activation and prognosis inpatients with gynecological malignancies. Int. J. Gynecol. Cancer 2006, 16, 240–252. [CrossRef] [PubMed]
26. Bolpetti, A.; Silva, J.S.; Villa, L.L.; Lepique, A.P. Interleukin-10 production by tumor infiltrating macrophagesplays a role in Human Papillomavirus 16 tumor growth. BMC Immunol. 2010, 11, 27. [CrossRef]
27. Godiska, R.; Chantry, D.; Raport, C.J.; Sozzani, S.; Allavena, P.; Leviten, D.; Mantovani, A.; Gray, P.W. Humanmacrophage-derived chemokine (MDC), a novel chemoattractant for monocytes, monocyte-derived dendriticcells, and natural killer cells. J. Exp. Med. 1997, 185, 1595–1604. [CrossRef]
28. Chang, M.; McNinch, J.; Elias, C., 3rd; Manthey, C.L.; Grosshans, D.; Meng, T.; Boone, T.; Andrew, D.Molecular cloning and functional characterization of a novel CC chemokine, stimulated T cell chemotacticprotein (STCP-1) that specifically acts on activated T lymphocytes. J. Biol. Chem. 1997, 272, 25229–25237.[CrossRef]
29. Schaniel, C.; Pardali, E.; Sallusto, F.; Speletas, M.; Ruedl, C.; Shimizu, T.; Seidl, T.; Andersson, J.; Melchers, F.;Rolink, A.G.; et al. Activated murine B lymphocytes and dendritic cells produce a novel CC chemokinewhich acts selectively on activated T cells. J. Exp. Med. 1998, 188, 451–463. [CrossRef]
30. Mantovani, A.; Gray, P.A.; Van Damme, J.; Sozzani, S. Macrophage-derived chemokine (MDC). J. Leukoc. Biol.2000, 68, 400–404.
31. Curiel, T.J.; Coukos, G.; Zou, L.; Alvarez, X.; Cheng, P.; Mottram, P.; Evdemon-Hogan, M.; Conejo-Garcia, J.R.;Zhang, L.; Burow, M.; et al. Specific recruitment of regulatory T cells in ovarian carcinoma fosters immuneprivilege and predicts reduced survival. Nat. Med. 2004, 10, 942–949. [CrossRef] [PubMed]

Cancers 2019, 11, 2004 22 of 22
32. Wei, C.; Yang, C.; Wang, S.; Shi, D.; Zhang, C.; Lin, X.; Xiong, B. M2 macrophages confer resistance to5-fluorouracil in colorectal cancer through the activation of CCL22/PI3K/AKT signaling. OncoTargets Ther.2019, 12, 3051–3063. [CrossRef] [PubMed]
33. Zhao, M.; Li, Y.; Wei, X.; Zhang, Q.; Jia, H.; Quan, S.; Cao, D.; Wang, L.; Yang, T.; Zhao, J.; et al. Negativeimmune factors might predominate local tumor immune status and promote carcinogenesis in cervicalcarcinoma. Virol. J. 2017, 14, 5. [CrossRef] [PubMed]
34. Tang, Z.; Li, C.; Kang, B.; Gao, G.; Li, C.; Zhang, Z. GEPIA: A web server for cancer and normal geneexpression profiling and interactive analyses. Nucleic Acids Res. 2017, 45, W98–W102. [CrossRef] [PubMed]
35. Li, T.; Fan, J.; Wang, B.; Traugh, N.; Chen, Q.; Liu, J.S.; Li, B.; Liu, X.S. TIMER: A Web Server for ComprehensiveAnalysis of Tumor-Infiltrating Immune Cells. Cancer Res. 2017, 77, e108–e110. [CrossRef] [PubMed]
36. Pedraza-Brindis, E.J.; Sanchez-Reyes, K.; Hernandez-Flores, G.; Bravo-Cuellar, A.; Jave-Suarez, L.F.;Aguilar-Lemarroy, A.; Gomez-Lomeli, P.; Lpez-Lopez, B.A.; Ortiz-Lazareno, P.C. Culture supernatantsof cervical cancer cells induce an M2 phenotypic profile in THP-1 macrophages. Cell. Immunol. 2016, 310,42–52. [CrossRef]
37. Chandrashekar, D.S.; Bashel, B.; Balasubramanya, S.A.H.; Creighton, C.J.; Ponce-Rodriguez, I.;Chakravarthi, B.; Varambally, S. UALCAN: A Portal for Facilitating Tumor Subgroup Gene Expression andSurvival Analyses. Neoplasia 2017, 19, 649–658. [CrossRef]
38. Vissers, J.L.; Hartgers, F.C.; Lindhout, E.; Teunissen, M.B.; Figdor, C.G.; Adema, G.J. Quantitative analysis ofchemokine expression by dendritic cell subsets in vitro and in vivo. J. Leukoc. Biol. 2001, 69, 785–793.
39. Jiang, S.; Yang, Y.; Fang, M.; Li, X.; Yuan, X.; Yuan, J. Co-evolution of tumor-associated macrophages andtumor neo-vessels during cervical cancer invasion. Oncol. Lett. 2016, 12, 2625–2631. [CrossRef]
40. Li, Y.Q.; Liu, F.F.; Zhang, X.M.; Guo, X.J.; Ren, M.J.; Fu, L. Tumor secretion of CCL22 activates intratumoralTreg infiltration and is independent prognostic predictor of breast cancer. PLoS ONE 2013, 8, e76379.[CrossRef]
41. Zhou, M.; Bracci, P.M.; McCoy, L.S.; Hsuang, G.; Wiemels, J.L.; Rice, T.; Zheng, S.; Kelsey, K.T.; Wrensch, M.R.;Wiencke, J.K. Serum macrophage-derived chemokine/CCL22 levels are associated with glioma risk, CD4 Tcell lymphopenia and survival time. Int. J. Cancer 2015, 137, 826–836. [CrossRef] [PubMed]
42. Wu, S.; He, H.; Liu, H.; Cao, Y.; Li, R.; Zhang, H.; Li, H.; Shen, Z.; Qin, J.; Xu, J. C-C motif chemokine 22predicts postoperative prognosis and adjuvant chemotherapeutic benefits in patients with stage II/III gastriccancer. Oncoimmunology 2018, 7, e1433517. [CrossRef]
43. Huang, Y.H.; Chang, C.Y.; Kuo, Y.Z.; Fang, W.Y.; Kao, H.Y.; Tsai, S.T.; Wu, L.-W. Cancer-associatedfibroblast-derived interleukin-1beta activates the pro-tumor CCL22 signaling in head and neck cancer. CancerSci. 2019, 110, 2783–2793. [CrossRef] [PubMed]
44. Furudate, S.; Fujimura, T.; Kambayashi, Y.; Kakizaki, A.; Hidaka, T.; Aiba, S. Immunomodulatory Effect ofImiquimod Through CCL22 Produced by Tumor-associated Macrophages in B16F10 Melanomas. AnticancerRes. 2017, 37, 3461–3471. [CrossRef] [PubMed]
45. Zhao, M.Y.; Zhao, J.; Yang, T.; Wang, L.; Pei, M.L.; Tian, S.J.; Yu, Y.; Yang, X.-F. Aberrant Expressions ofImmune Factors Facilitate the Disequilibrium of Immune Status in Cervical Cancer. Zhongguo Yi Xue Ke XueYuan Xue Bao 2016, 38, 522–527. [CrossRef] [PubMed]
46. Kimura, S.; Nanbu, U.; Noguchi, H.; Harada, Y.; Kumamoto, K.; Sasaguri, Y.; Nakayama, T. MacrophageCCL22 expression in the tumor microenvironment and implications for survival in patients with squamouscell carcinoma of the tongue. J. Oral Pathol. Med. 2019, 48, 677–685. [CrossRef]
© 2019 by the authors. Licensee MDPI, Basel, Switzerland. This article is an open accessarticle distributed under the terms and conditions of the Creative Commons Attribution(CC BY) license (http://creativecommons.org/licenses/by/4.0/).