higher education appropriations report - fy 2013-14dec 15, 2013 · amounts in operation line items...
TRANSCRIPT
FISCAL YEAR 2013-14 HIGHER EDUCATION
APPROPRIATIONS REPORT
A REPORT TO THE HOUSE AND SENATE APPROPRIATIONS
SUBCOMMITTEES ON HIGHER EDUCATION
Prepared by:
Kyle I. Jen, House Fiscal Agency Bill Bowerman, Senate Fiscal Agency
September 2013
APPROPRIATIONS SUBCOMMITTEES ON HIGHER EDUCATION HOUSE SUBCOMMITTEE MEMBERS SENATE SUBCOMMITTEE MEMBERS Rep. Al Pscholka, Chair Sen. Tonya Schuitmaker, Chair Rep. John Walsh, Majority Vice Chair Sen. Howard Walker, Majority Vice Chair Rep. Peter MacGregor Sen. Morris Hood III, Minority Vice Chair Rep. Rob VerHeulen Rep. Sam Singh, Minority Vice Chair Rep. Sean McCann Rep. Andrew Kandrevas
ACKNOWLEDGMENTS
Consistent with past practice, this report has been prepared to provide a precise record of how appropriation amounts in the FY 2013-14 Higher Education budget were calculated. The report was prepared by Kyle I. Jen, Deputy Director, House Fiscal Agency, and Bill Bowerman, Associate Director, Senate Fiscal Agency. Visit our web sites, www.house.mi.gov/hfa or www.senate.michigan.gov/sfa, for a copy of this report.


TABLE OF CONTENTS SUMMARY OF HIGHER EDUCATION APPROPRIATION ISSUES ..................................................................... 3 TABLES: Table 1: FY 2013-14 Higher Education Appropriations (2013 PA 60) .......................................................... 9 Table 1a: Enacted Appropriation Detail for University Operations .................................................................. 10 Table 1b: Tuition Restraint Compliance and Performance Funding Reallocation ........................................... 11 Table 2: Governor's Recommendation Appropriation Detail for University Operations ................................ 12 Table 3: Senate-Passed Appropriation Detail for University Operations ...................................................... 13 Table 4: House-Passed Appropriation Detail for University Operations ....................................................... 14 Table 5: State Appropriations Per Fiscal-Year-Equated Student (FYES) ..................................................... 15 Table 6: University Appropriation Funding Sources ...................................................................................... 16 Table 7: Indian Tuition Waiver Program ....................................................................................................... 17 Table 8: Martin Luther King, Jr.-Cesar Chavez-Rosa Parks Initiative ........................................................... 18 Table 9: Allocations for College Day, Future Faculty, and Visiting Professors ............................................. 18 Table 10: Resident Undergraduate Tuition and Fee Rates ............................................................................ 19
APPROPRIATION ADJUSTMENT DETAIL ........................................................................................................... 23 BOILERPLATE REPORT REQUIREMENTS Table 11: Reports Required by Higher Education Appropriations Act ............................................................ 33

SUMMARY OF HIGHER EDUCATION APPROPRIATION ISSUES


3
HIGHER EDUCATION P.A. 60 of 2013 – ARTICLE III
FULL-TIME EQUATED (FTE) POSITIONS/FUNDING SOURCE
FY 2012-13 YEAR-TO-DATE
FY 2013-14 GOV.'S REC.
FY 2013-14 SENATE
FY 2013-14 HOUSE
FY 2013-14 INITIAL
APPROPS.
CHANGES FROM FY 2012-13 YEAR-TO-DATE
AMOUNT PERCENT
GROSS ....................................................... 1,399,220,400 1,430,573,500 1,430,573,500 1,430,573,500 1,430,573,500 31,353,100 2.2
Less:
Interdepartmental Grants Received ......... 0 0 0 0 0 0 --
ADJUSTED GROSS ................................... 1,399,220,400 1,430,573,500 1,430,573,500 1,430,573,500 1,430,573,500 31,353,100 2.2
Less:
Federal Funds .......................................... 97,026,400 97,026,400 97,026,400 97,026,400 97,026,400 0 0.0
Local and Private ..................................... 0 0 0 0 0 0 --
TOTAL STATE SPENDING ........................ 1,302,194,000 1,333,547,100 1,333,547,100 1,333,547,100 1,333,547,100 31,353,100 2.4
Less:
Other State Restricted Funds ................... 200,565,700 200,565,700 200,565,700 200,565,700 200,565,700 0 0.0
GENERAL FUND/GENERAL PURPOSE... 1,101,628,300 1,132,981,400 1,132,981,400 1,132,981,400 1,132,981,400 31,353,100 2.8
PAYMENTS TO LOCALS .......................... 0 0 0 0 0 0 --
4
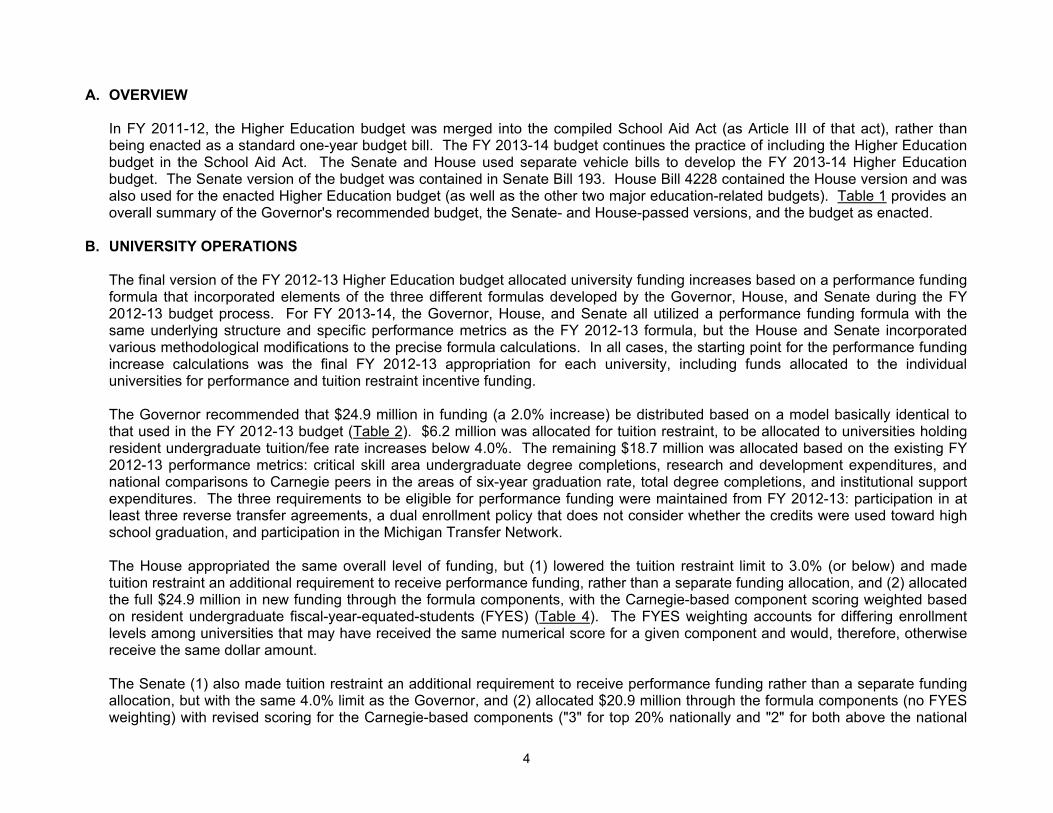
A. OVERVIEW In FY 2011-12, the Higher Education budget was merged into the compiled School Aid Act (as Article III of that act), rather than being enacted as a standard one-year budget bill. The FY 2013-14 budget continues the practice of including the Higher Education budget in the School Aid Act. The Senate and House used separate vehicle bills to develop the FY 2013-14 Higher Education budget. The Senate version of the budget was contained in Senate Bill 193. House Bill 4228 contained the House version and was also used for the enacted Higher Education budget (as well as the other two major education-related budgets). Table 1 provides an overall summary of the Governor's recommended budget, the Senate- and House-passed versions, and the budget as enacted.
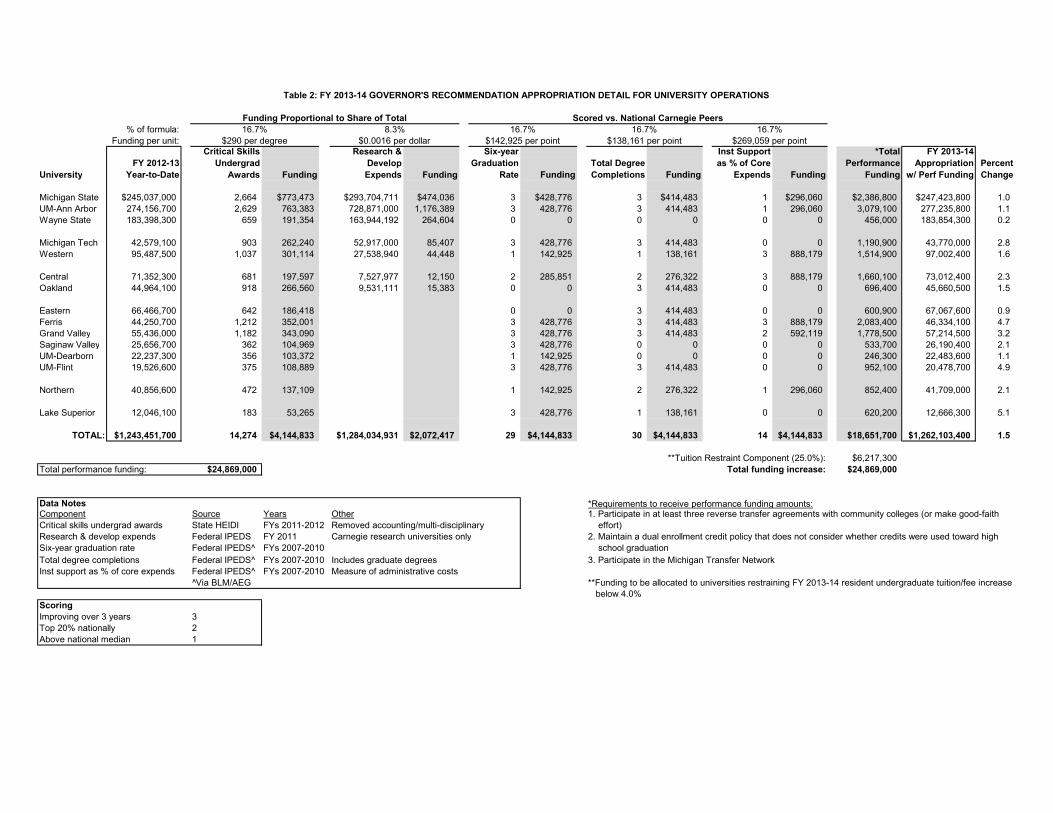
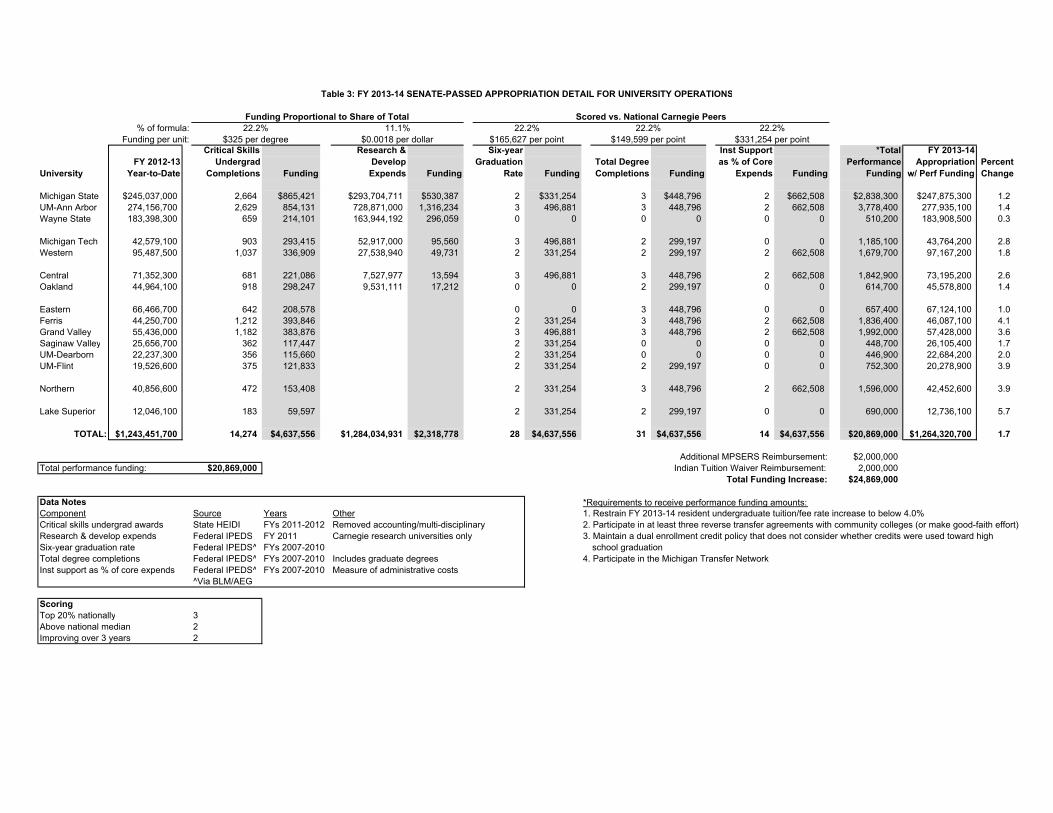
B. UNIVERSITY OPERATIONS The final version of the FY 2012-13 Higher Education budget allocated university funding increases based on a performance funding formula that incorporated elements of the three different formulas developed by the Governor, House, and Senate during the FY 2012-13 budget process. For FY 2013-14, the Governor, House, and Senate all utilized a performance funding formula with the same underlying structure and specific performance metrics as the FY 2012-13 formula, but the House and Senate incorporated various methodological modifications to the precise formula calculations. In all cases, the starting point for the performance funding increase calculations was the final FY 2012-13 appropriation for each university, including funds allocated to the individual universities for performance and tuition restraint incentive funding. The Governor recommended that $24.9 million in funding (a 2.0% increase) be distributed based on a model basically identical to that used in the FY 2012-13 budget (Table 2). $6.2 million was allocated for tuition restraint, to be allocated to universities holding resident undergraduate tuition/fee rate increases below 4.0%. The remaining $18.7 million was allocated based on the existing FY 2012-13 performance metrics: critical skill area undergraduate degree completions, research and development expenditures, and national comparisons to Carnegie peers in the areas of six-year graduation rate, total degree completions, and institutional support expenditures. The three requirements to be eligible for performance funding were maintained from FY 2012-13: participation in at least three reverse transfer agreements, a dual enrollment policy that does not consider whether the credits were used toward high school graduation, and participation in the Michigan Transfer Network. The House appropriated the same overall level of funding, but (1) lowered the tuition restraint limit to 3.0% (or below) and made tuition restraint an additional requirement to receive performance funding, rather than a separate funding allocation, and (2) allocated the full $24.9 million in new funding through the formula components, with the Carnegie-based component scoring weighted based on resident undergraduate fiscal-year-equated-students (FYES) (Table 4). The FYES weighting accounts for differing enrollment levels among universities that may have received the same numerical score for a given component and would, therefore, otherwise receive the same dollar amount. The Senate (1) also made tuition restraint an additional requirement to receive performance funding rather than a separate funding allocation, but with the same 4.0% limit as the Governor, and (2) allocated $20.9 million through the formula components (no FYES weighting) with revised scoring for the Carnegie-based components ("3" for top 20% nationally and "2" for both above the national
5
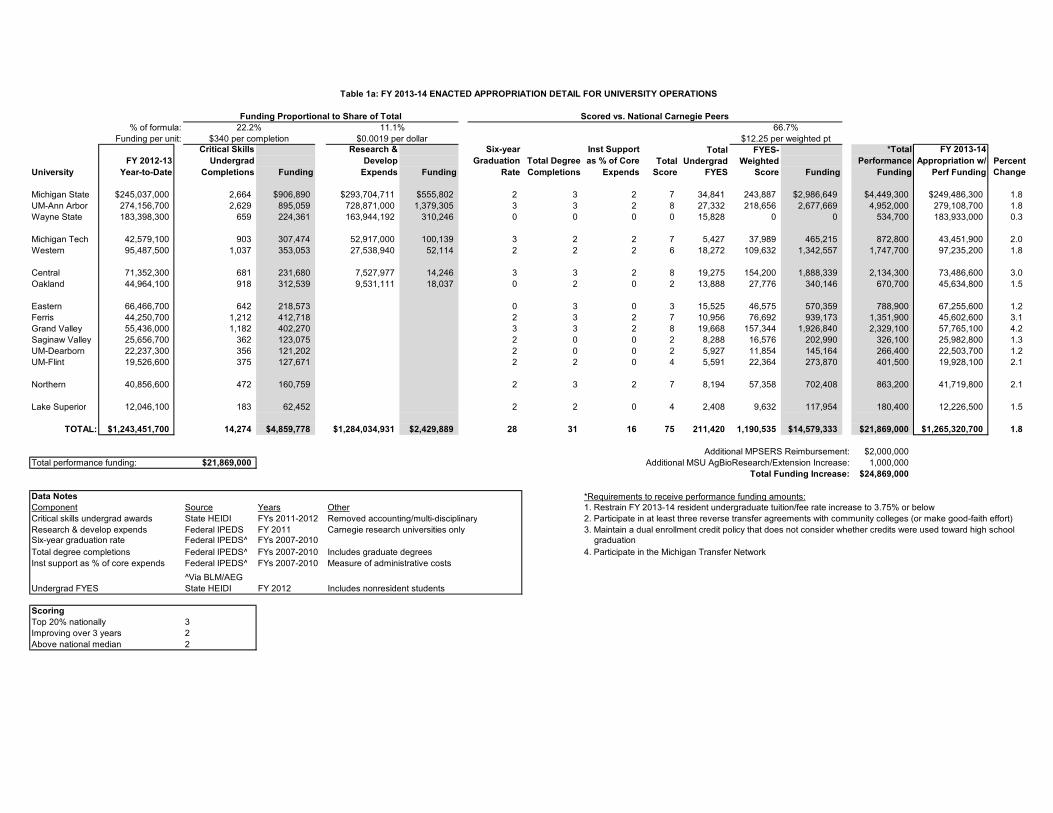
median and improving over 3 years, with intent to move to "1" for the final category in FY 2014-15) (Table 3). The remaining $4.0 million was appropriated for other university-related purposes (MPSERS and Indian Tuition Waiver reimbursement). The enacted Higher Education budget includes a $21.9 million (1.8%) increase for university operations (Table 1). The enacted budget makes tuition restraint an additional requirement to receive performance funding rather than a separate funding allocation, with a limit of 3.75% (or below). The $21.9 million in performance funding is allocated through the existing formula components: 22.2% ($4.9 million) based on critical skill area undergraduate degree completions. 11.1% ($2.4 million) based on research and development expenditures (only for universities in the “research university” Carnegie
classifications). 66.7% based on national comparisons to Carnegie peers in three areas (22.2% each): six-year graduation rate, total degree
completions, and institutional support as a percentage of core expenditures. This component incorporates weighting based on total undergraduate FYES (including nonresidents) and revised scoring based on the Senate-passed budget ("3" for top 20% nationally and "2" for both above the national median and improving over 3 years, with intent to move to "1" for the final category in FY 2014-15). (A technical adjustment was made to Michigan Tech's score for the institutional support metric in the final version of the budget, to reflect corrected federal IPEDS data.)
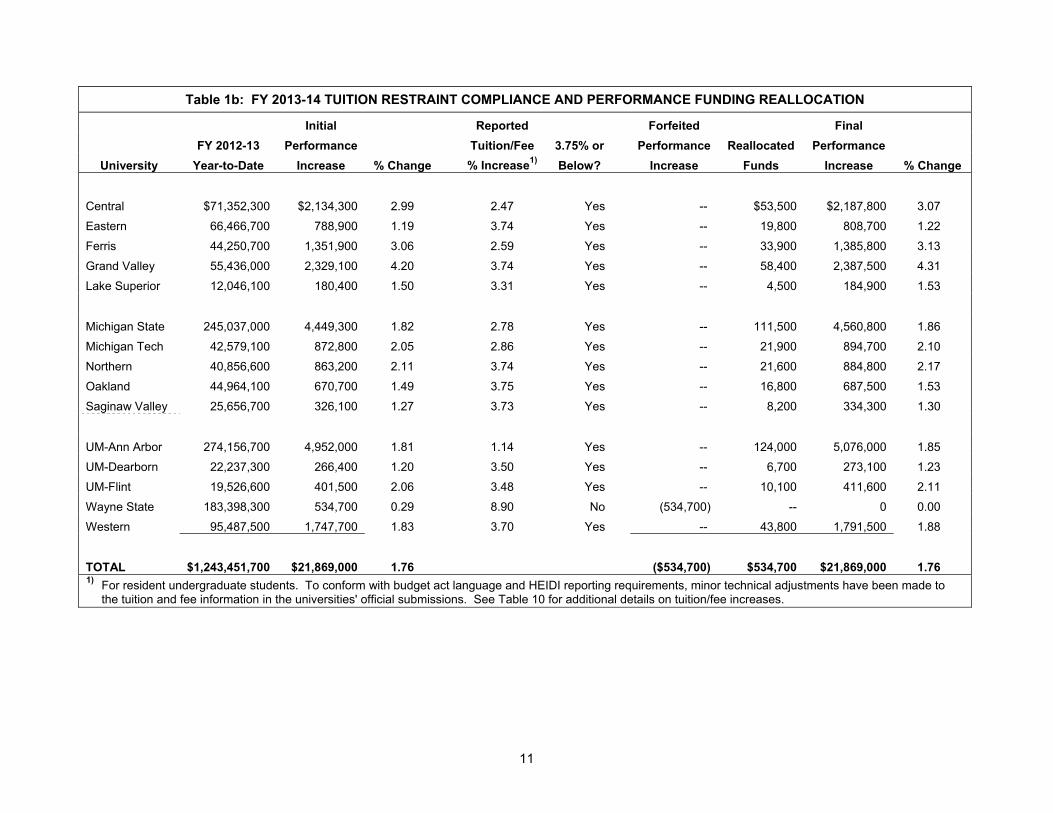
The remaining $3.0 million is appropriated for other university-related purposes (MPSERS reimbursement and MSU AgBioResearch and Extension; see below). The three FY 2012-13 requirements to be eligible for a performance funding increase are maintained in FY 2013-14, along with tuition restraint provisions. On September 10, 2012, the State Budget Director reported that all universities had certified their compliance with performance funding requirements, except Wayne State University, which adopted a resident undergraduate tuition and fee increase of 8.90%. Under provisions in Sec. 265a, Wayne State's initial performance funding increase of $534,700 is reallocated to the other 14 universities in proportion to their respective initial performance funding increases. Table 1a provides details on initial performance funding calculations and Table 1b provides calculations for the reallocation of Wayne State's performance funding. Note that, unless otherwise noted, tables in this document reflect initial university appropriation amounts, rather than amounts incorporating the reallocation of Wayne State's performance funding.
C. MICHIGAN PUBLIC SCHOOL EMPLOYEE RETIREMENT SYSTEM (MPSERS) The FY 2013-14 budget includes $2.4 million, $446,200 funded from the School Aid Fund and $2.0 million funded from GF/GP revenue, to partially offset MPSERS retirement contributions required from universities with employees in the retirement system (Central, Eastern, Ferris, Lake Superior State, Michigan Tech, Northern, and Western). This represents an increase of $2.0 million GF/GP from the FY 2012-13 level. These funds are provided over and above appropriations for general operations. Boilerplate (Sec. 246) provides that amounts allocated to each university will be based on each participating university's total retiree health care
6
premiums paid for MPSERS retirants in proportion to the total retiree health care premium for all participating universities for the immediately preceding fiscal year.
D. INDIAN TUITION WAIVERS
In FY 1996-97, funding totaling $2.4 million was added to university base appropriations for costs incurred by the universities under Public Act 174 of 1976, the Indian Tuition Waiver Act. Additional funding of $1.4 million was allocated for this purpose in FY 2007-08. Table 7 lists, for each university, the FY 1996-97 tuition waiver amount added to the base, the FY 2007-08 allocation amount, and an adjustment for across-the-board changes to university appropriations since FY 1996-97. The FY 2013-14 State appropriation increases for university operations were entirely based on performance funding. Therefore, no adjustments are made to estimated amounts in operation line items for the Indian Tuition Waiver Program. Note that these calculations reflect historical appropriation adjustments related to Indian Tuition Waivers, but the budget article does not contain language formally allocating the funds for that purpose. Additionally, the FY 2013-14 budget continues allocations to Bay Mills Tribal College ($100,000) and to Saginaw Chippewa Tribal College ($29,700) for tuition waiver costs that are passed through the appropriations to Lake Superior State University and Central Michigan University, respectively, under budget article language.
E. MARTIN LUTHER KING, JR.-CESAR CHAVEZ-ROSA PARKS INITIATIVE There were no policy changes for the six King-Chavez-Parks (KCP) Programs for FY 2013-14. Table 8 provides an overview of funding for the $1.8 million initiative. Table 9 lists the dollar amounts allocated from each university's appropriation for the College Day, Future Faculty, and Visiting Professors Programs. Because increases for university operations were based entirely on performance funding (with no across-the-board increase), amounts for each program are maintained at the FY 2012-13 level.
F. MSU AGBIORESEARCH AND EXTENSION The AgBioResearch and Extension programs operated by Michigan State University provide services throughout the state. The line items for the two programs were rolled together into a single line item called Agricultural Experiment and Cooperative Extension Activities in FYs 2011-12 and 2012-13. For FY 2013-14, the appropriation was unrolled, with the total increased by $2.1 million (3.8%). This increase was $1.0 million higher than the increase contained in the Governor's recommendation. FY 2013-14 appropriation amounts are $30.2 million for MSU AgBioResearch and $26.0 million for MSU Extension. Boilerplate sets performance goals for the program (Sec. 263a).
7
G. STATE COMPETITIVE SCHOLARSHIPS Public Act 208 of 1964 created the State Competitive Scholarship Program, which provides grants to students who score well on the American College Test (ACT) and have demonstrated financial need. The FY 2013-14 appropriation for the program was maintained at $18.4 million. The maximum award amount specified in boilerplate language (Sec. 251) remains at $575, although the Department of Treasury was able to increase the maximum award amount for FY 2013-14 to $630 due to a decline in the number of eligible students. For all three major state financial aid programs, state-level support continues to be funded primarily with federal Temporary Assistance to Needy Families (TANF) funding in order to improve the state's ability to meet federal TANF maintenance-of-effort (MOE) requirements.
H. TUITION GRANTS Public Act 313 of 1966 created the Tuition Grant Program, which provides grants to students with demonstrated financial need enrolled at Michigan independent colleges and universities. The FY 2013-14 appropriation for the program was maintained at $31.7 million. Provisions capping total awards at any institution at $3.0 million were retained, resulting in lower awards to students at Baker College and Davenport University. The maximum award amount specified in boilerplate language (Sec. 252) remains at $1,512, although the Department of Treasury was able to increase the maximum award amount for FY 2013-14 to $1,524 due to a decline in the number of eligible students. See statement under State Competitive Scholarships regarding TANF funding.
I. TUITION INCENTIVE PROGRAM The Tuition Incentive Program (TIP) promises to pay two years of associate's degree tuition (Phase I) and up to $2,000 at a four-year institution (Phase II) for Medicaid-eligible middle school and high school students who proceed to graduate from high school. The FY 2013-14 appropriation was increased by $3.2 million to a new level of $47.0 million based on a projected continued increase in the number of eligible students. The Governor had recommended moving TIP provisions into a separate governing statute, consistent with other major financial aid programs; the provisions were, however, retained in budget act language. See statement under State Competitive Scholarships regarding TANF funding (the $3.2 million increase for FY 2013-14 is, however, funded from GF/GP revenue).
8
J. CHILDREN OF VETERANS TUITION AND OFFICER'S SURVIVOR TUITION GRANT PROGRAMS Public Act 248 of 2005 established a new Children of Veterans Tuition Grant Program (CVTGP) to replace a program that had been created by Public Act 245 of 1935, which was repealed. Public Act 195 of 1996 established the Officer's Survivor Tuition Grant Program. Both programs are now funded in the Higher Education budget. For FY 2013-14, total funding for the programs was increased by $200,000, to a new level of $1.4 million due to a projected increase in the number of eligible CVTGP students. Of that amount, $100,000 is appropriated from contributions through the income tax check-off for the CVTGP, with the remainder funded from the GF/GP funds.
K. COLLEGE ACCESS PROGRAM An appropriation of $2.0 million GF/GP for the College Access Program was transferred from the Department of Education budget to the Higher Education budget, with no net increase in state appropriations. This funding is provided as a grant to the Michigan College Access Network, which seeks to increase college readiness, participation, and completion in Michigan through local college access networks, an online one-stop portal, public awareness campaigns, and other efforts. This grant was previously funded through federal revenue; federal funds were forfeited and replaced with state GF/GP funding due to violation of federal maintenance-of-effort requirements.
L. OTHER APPROPRIATIONS ITEMS Appropriations for other items in the Higher Education budget were all maintained at current-year levels: $3.2 million in federal funds for Project GEAR UP, $105,000 for Higher Education database maintenance, and $95,000 for dues to the Midwestern Higher Education Compact.
M. BOILERPLATE REPORTS Table 11 in the final section of this report provides a detailed list of reports required from public universities and other entities under the FY 2013-14 Higher Education budget article. Note that, because the Higher Education budget is now included in the compiled School Aid Act, only sections which changed from the prior year are included in the annual budget act. Sections that have not been changed or repealed remain in compiled law and are effective for FY 2013-14.
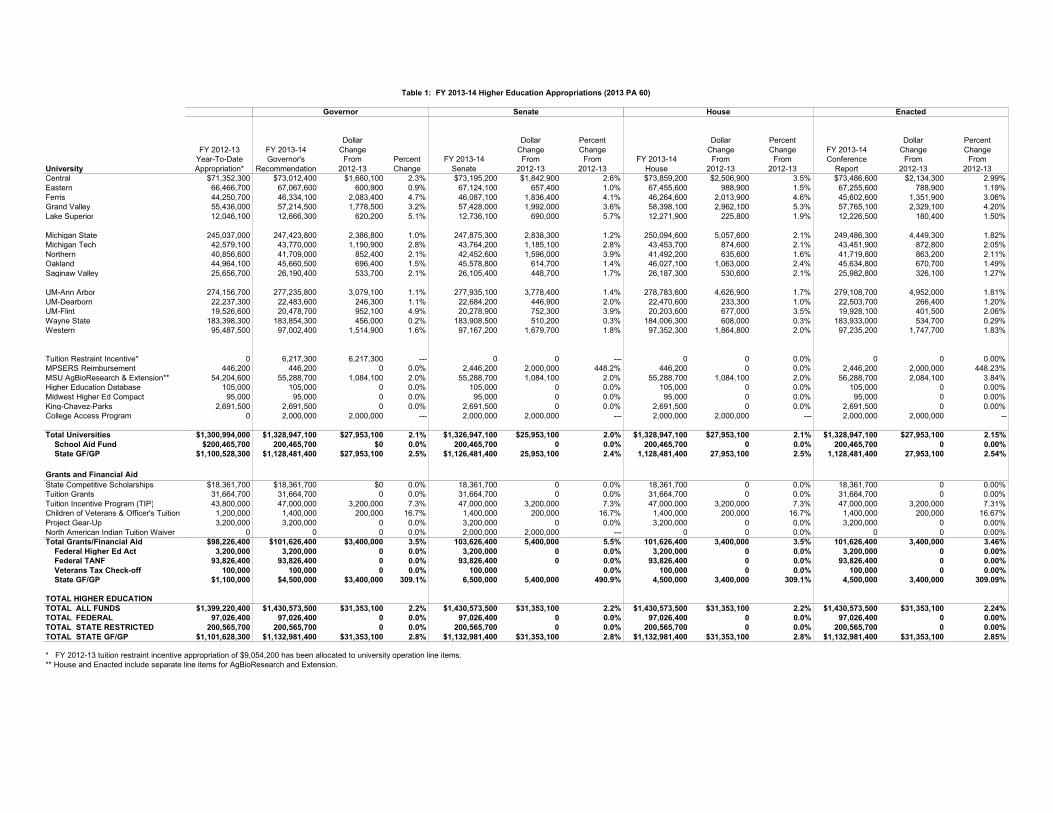
Table 1: FY 2013-14 Higher Education Appropriations (2013 PA 60)
Governor Senate House Enacted
Dollar Dollar Percent Dollar Percent Dollar PercentFY 2012-13 FY 2013-14 Change Change Change Change Change FY 2013-14 Change Change
Year-To-Date Governor's From Percent FY 2013-14 From From FY 2013-14 From From Conference From FromUniversity Appropriation* Recommendation 2012-13 Change Senate 2012-13 2012-13 House 2012-13 2012-13 Report 2012-13 2012-13Central $71,352,300 $73,012,400 $1,660,100 2.3% $73,195,200 $1,842,900 2.6% $73,859,200 $2,506,900 3.5% $73,486,600 $2,134,300 2.99%Eastern 66,466,700 67,067,600 600,900 0.9% 67,124,100 657,400 1.0% 67,455,600 988,900 1.5% 67,255,600 788,900 1.19%Ferris 44,250,700 46,334,100 2,083,400 4.7% 46,087,100 1,836,400 4.1% 46,264,600 2,013,900 4.6% 45,602,600 1,351,900 3.06%Grand Valley 55,436,000 57,214,500 1,778,500 3.2% 57,428,000 1,992,000 3.6% 58,398,100 2,962,100 5.3% 57,765,100 2,329,100 4.20%Lake Superior 12,046,100 12,666,300 620,200 5.1% 12,736,100 690,000 5.7% 12,271,900 225,800 1.9% 12,226,500 180,400 1.50%
Michigan State 245,037,000 247,423,800 2,386,800 1.0% 247,875,300 2,838,300 1.2% 250,094,600 5,057,600 2.1% 249,486,300 4,449,300 1.82%Michigan Tech 42,579,100 43,770,000 1,190,900 2.8% 43,764,200 1,185,100 2.8% 43,453,700 874,600 2.1% 43,451,900 872,800 2.05%Northern 40,856,600 41,709,000 852,400 2.1% 42,452,600 1,596,000 3.9% 41,492,200 635,600 1.6% 41,719,800 863,200 2.11%Oakland 44,964,100 45,660,500 696,400 1.5% 45,578,800 614,700 1.4% 46,027,100 1,063,000 2.4% 45,634,800 670,700 1.49%Saginaw Valley 25,656,700 26,190,400 533,700 2.1% 26,105,400 448,700 1.7% 26,187,300 530,600 2.1% 25,982,800 326,100 1.27%
UM-Ann Arbor 274,156,700 277,235,800 3,079,100 1.1% 277,935,100 3,778,400 1.4% 278,783,600 4,626,900 1.7% 279,108,700 4,952,000 1.81%UM-Dearborn 22,237,300 22,483,600 246,300 1.1% 22,684,200 446,900 2.0% 22,470,600 233,300 1.0% 22,503,700 266,400 1.20%UM-Flint 19,526,600 20,478,700 952,100 4.9% 20,278,900 752,300 3.9% 20,203,600 677,000 3.5% 19,928,100 401,500 2.06%Wayne State 183,398,300 183,854,300 456,000 0.2% 183,908,500 510,200 0.3% 184,006,300 608,000 0.3% 183,933,000 534,700 0.29%Western 95,487,500 97,002,400 1,514,900 1.6% 97,167,200 1,679,700 1.8% 97,352,300 1,864,800 2.0% 97,235,200 1,747,700 1.83%
Tuition Restraint Incentive* 0 6,217,300 6,217,300 --- 0 0 --- 0 0 0.0% 0 0 0.00%MPSERS Reimbursement 446,200 446,200 0 0.0% 2,446,200 2,000,000 448.2% 446,200 0 0.0% 2,446,200 2,000,000 448.23%MSU AgBioResearch & Extension** 54,204,600 55,288,700 1,084,100 2.0% 55,288,700 1,084,100 2.0% 55,288,700 1,084,100 2.0% 56,288,700 2,084,100 3.84%Higher Education Database 105,000 105,000 0 0.0% 105,000 0 0.0% 105,000 0 0.0% 105,000 0 0.00%Midwest Higher Ed Compact 95,000 95,000 0 0.0% 95,000 0 0.0% 95,000 0 0.0% 95,000 0 0.00%King-Chavez-Parks 2,691,500 2,691,500 0 0.0% 2,691,500 0 0.0% 2,691,500 0 0.0% 2,691,500 0 0.00%College Access Program 0 2,000,000 2,000,000 --- 2,000,000 2,000,000 --- 2,000,000 2,000,000 --- 2,000,000 2,000,000 --
Total Universities $1,300,994,000 $1,328,947,100 $27,953,100 2.1% $1,326,947,100 $25,953,100 2.0% $1,328,947,100 $27,953,100 2.1% $1,328,947,100 $27,953,100 2.15% School Aid Fund $200,465,700 200,465,700 $0 0.0% 200,465,700 0 0.0% 200,465,700 0 0.0% 200,465,700 0 0.00% State GF/GP $1,100,528,300 $1,128,481,400 $27,953,100 2.5% $1,126,481,400 25,953,100 2.4% 1,128,481,400 27,953,100 2.5% 1,128,481,400 27,953,100 2.54%
Grants and Financial AidState Competitive Scholarships $18,361,700 $18,361,700 $0 0.0% 18,361,700 0 0.0% 18,361,700 0 0.0% 18,361,700 0 0.00%Tuition Grants 31,664,700 31,664,700 0 0.0% 31,664,700 0 0.0% 31,664,700 0 0.0% 31,664,700 0 0.00%Tuition Incentive Program (TIP) 43,800,000 47,000,000 3,200,000 7.3% 47,000,000 3,200,000 7.3% 47,000,000 3,200,000 7.3% 47,000,000 3,200,000 7.31%Children of Veterans & Officer's Tuition 1,200,000 1,400,000 200,000 16.7% 1,400,000 200,000 16.7% 1,400,000 200,000 16.7% 1,400,000 200,000 16.67%Project Gear-Up 3,200,000 3,200,000 0 0.0% 3,200,000 0 0.0% 3,200,000 0 0.0% 3,200,000 0 0.00%North American Indian Tuition Waiver 0 0 0 0.0% 2,000,000 2,000,000 --- 0 0 0.0% 0 0 0.00%Total Grants/Financial Aid $98,226,400 $101,626,400 $3,400,000 3.5% 103,626,400 5,400,000 5.5% 101,626,400 3,400,000 3.5% 101,626,400 3,400,000 3.46% Federal Higher Ed Act 3,200,000 3,200,000 0 0.0% 3,200,000 0 0.0% 3,200,000 0 0.0% 3,200,000 0 0.00% Federal TANF 93,826,400 93,826,400 0 0.0% 93,826,400 0 0.0% 93,826,400 0 0.0% 93,826,400 0 0.00% Veterans Tax Check-off 100,000 100,000 0 0.0% 100,000 0.0% 100,000 0 0.0% 100,000 0 0.00% State GF/GP $1,100,000 $4,500,000 $3,400,000 309.1% 6,500,000 5,400,000 490.9% 4,500,000 3,400,000 309.1% 4,500,000 3,400,000 309.09%
TOTAL HIGHER EDUCATIONTOTAL ALL FUNDS $1,399,220,400 $1,430,573,500 $31,353,100 2.2% $1,430,573,500 $31,353,100 2.2% $1,430,573,500 $31,353,100 2.2% $1,430,573,500 $31,353,100 2.24%TOTAL FEDERAL 97,026,400 97,026,400 0 0.0% 97,026,400 0 0.0% 97,026,400 0 0.0% 97,026,400 0 0.00%TOTAL STATE RESTRICTED 200,565,700 200,565,700 0 0.0% 200,565,700 0 0.0% 200,565,700 0 0.0% 200,565,700 0 0.00%TOTAL STATE GF/GP $1,101,628,300 $1,132,981,400 $31,353,100 2.8% $1,132,981,400 $31,353,100 2.8% $1,132,981,400 $31,353,100 2.8% $1,132,981,400 $31,353,100 2.85%
* FY 2012-13 tuition restraint incentive appropriation of $9,054,200 has been allocated to university operation line items.** House and Enacted include separate line items for AgBioResearch and Extension.
% of formula:Funding per unit:
Total FYES-Total Undergrad Weighted Percent
University Score FYES Score Funding Change
Michigan State $245,037,000 2,664 $906,890 $293,704,711 $555,802 2 3 2 7 34,841 243,887 $2,986,649 $4,449,300 $249,486,300 1.8UM-Ann Arbor 274,156,700 2,629 895,059 728,871,000 1,379,305 3 3 2 8 27,332 218,656 2,677,669 4,952,000 279,108,700 1.8Wayne State 183,398,300 659 224,361 163,944,192 310,246 0 0 0 0 15,828 0 0 534,700 183,933,000 0.3
Michigan Tech 42,579,100 903 307,474 52,917,000 100,139 3 2 2 7 5,427 37,989 465,215 872,800 43,451,900 2.0Western 95,487,500 1,037 353,053 27,538,940 52,114 2 2 2 6 18,272 109,632 1,342,557 1,747,700 97,235,200 1.8
Central 71,352,300 681 231,680 7,527,977 14,246 3 3 2 8 19,275 154,200 1,888,339 2,134,300 73,486,600 3.0Oakland 44,964,100 918 312,539 9,531,111 18,037 0 2 0 2 13,888 27,776 340,146 670,700 45,634,800 1.5
Eastern 66,466,700 642 218,573 0 3 0 3 15,525 46,575 570,359 788,900 67,255,600 1.2Ferris 44,250,700 1,212 412,718 2 3 2 7 10,956 76,692 939,173 1,351,900 45,602,600 3.1Grand Valley 55,436,000 1,182 402,270 3 3 2 8 19,668 157,344 1,926,840 2,329,100 57,765,100 4.2Saginaw Valley 25,656,700 362 123,075 2 0 0 2 8,288 16,576 202,990 326,100 25,982,800 1.3UM-Dearborn 22,237,300 356 121,202 2 0 0 2 5,927 11,854 145,164 266,400 22,503,700 1.2UM-Flint 19,526,600 375 127,671 2 2 0 4 5,591 22,364 273,870 401,500 19,928,100 2.1
Northern 40,856,600 472 160,759 2 3 2 7 8,194 57,358 702,408 863,200 41,719,800 2.1
Lake Superior 12,046,100 183 62,452 2 2 0 4 2,408 9,632 117,954 180,400 12,226,500 1.5
TOTAL: $1,243,451,700 14,274 $4,859,778 $1,284,034,931 $2,429,889 28 31 16 75 211,420 1,190,535 $14,579,333 $21,869,000 $1,265,320,700 1.8
Additional MPSERS Reimbursement: $2,000,000Total performance funding: $21,869,000 Additional MSU AgBioResearch/Extension Increase: 1,000,000
Total Funding Increase: $24,869,000
Data Notes *Requirements to receive performance funding amounts:Component Source Years Other 1. Restrain FY 2013-14 resident undergraduate tuition/fee rate increase to 3.75% or belowCritical skills undergrad awards State HEIDI FYs 2011-2012 Removed accounting/multi-disciplinary 2. Participate in at least three reverse transfer agreements with community colleges (or make good-faith effort)Research & develop expends Federal IPEDS FY 2011 Carnegie research universities only 3. Maintain a dual enrollment credit policy that does not consider whether credits were used toward high schoolSix-year graduation rate Federal IPEDS^ FYs 2007-2010 graduationTotal degree completions Federal IPEDS^ FYs 2007-2010 Includes graduate degrees 4. Participate in the Michigan Transfer NetworkInst support as % of core expends Federal IPEDS^ FYs 2007-2010 Measure of administrative costs
^Via BLM/AEGUndergrad FYES State HEIDI FY 2012 Includes nonresident students
ScoringTop 20% nationally 3Improving over 3 years 2Above national median 2
Table 1a: FY 2013-14 ENACTED APPROPRIATION DETAIL FOR UNIVERSITY OPERATIONS
Funding Proportional to Share of Total Scored vs. National Carnegie Peers22.2% 11.1% 66.7%
*Total Performance
Funding
FY 2013-14 Appropriation w/
Perf FundingFY 2012-13
Year-to-Date
$340 per completion $0.0019 per dollar $12.25 per weighted ptCritical Skills
Undergrad Completions Funding
Research & Develop
Expends Funding
Six-year Graduation
RateTotal Degree Completions
Inst Support as % of Core
Expends
11
Table 1b: FY 2013-14 TUITION RESTRAINT COMPLIANCE AND PERFORMANCE FUNDING REALLOCATION
Initial Reported Forfeited Final FY 2012-13 Performance Tuition/Fee 3.75% or Performance Reallocated Performance
University Year-to-Date Increase % Change % Increase1) Below? Increase Funds Increase % Change
Central $71,352,300 $2,134,300 2.99 2.47 Yes -- $53,500 $2,187,800 3.07
Eastern 66,466,700 788,900 1.19 3.74 Yes -- 19,800 808,700 1.22
Ferris 44,250,700 1,351,900 3.06 2.59 Yes -- 33,900 1,385,800 3.13
Grand Valley 55,436,000 2,329,100 4.20 3.74 Yes -- 58,400 2,387,500 4.31
Lake Superior 12,046,100 180,400 1.50 3.31 Yes -- 4,500 184,900 1.53
Michigan State 245,037,000 4,449,300 1.82 2.78 Yes -- 111,500 4,560,800 1.86
Michigan Tech 42,579,100 872,800 2.05 2.86 Yes -- 21,900 894,700 2.10
Northern 40,856,600 863,200 2.11 3.74 Yes -- 21,600 884,800 2.17
Oakland 44,964,100 670,700 1.49 3.75 Yes -- 16,800 687,500 1.53
Saginaw Valley 25,656,700 326,100 1.27 3.73 Yes -- 8,200 334,300 1.30
UM-Ann Arbor 274,156,700 4,952,000 1.81 1.14 Yes -- 124,000 5,076,000 1.85
UM-Dearborn 22,237,300 266,400 1.20 3.50 Yes -- 6,700 273,100 1.23
UM-Flint 19,526,600 401,500 2.06 3.48 Yes -- 10,100 411,600 2.11
Wayne State 183,398,300 534,700 0.29 8.90 No (534,700) -- 0 0.00
Western 95,487,500 1,747,700 1.83 3.70 Yes -- 43,800 1,791,500 1.88
TOTAL $1,243,451,700 $21,869,000 1.76 ($534,700) $534,700 $21,869,000 1.76 1) For resident undergraduate students. To conform with budget act language and HEIDI reporting requirements, minor technical adjustments have been made to
the tuition and fee information in the universities' official submissions. See Table 10 for additional details on tuition/fee increases.
% of formula:Funding per unit:
University
Michigan State $245,037,000 2,664 $773,473 $293,704,711 $474,036 3 $428,776 3 $414,483 1 $296,060 $2,386,800 $247,423,800 1.0UM-Ann Arbor 274,156,700 2,629 763,383 728,871,000 1,176,389 3 428,776 3 414,483 1 296,060 3,079,100 277,235,800 1.1Wayne State 183,398,300 659 191,354 163,944,192 264,604 0 0 0 0 0 0 456,000 183,854,300 0.2
Michigan Tech 42,579,100 903 262,240 52,917,000 85,407 3 428,776 3 414,483 0 0 1,190,900 43,770,000 2.8Western 95,487,500 1,037 301,114 27,538,940 44,448 1 142,925 1 138,161 3 888,179 1,514,900 97,002,400 1.6
Central 71,352,300 681 197,597 7,527,977 12,150 2 285,851 2 276,322 3 888,179 1,660,100 73,012,400 2.3Oakland 44,964,100 918 266,560 9,531,111 15,383 0 0 3 414,483 0 0 696,400 45,660,500 1.5
Eastern 66,466,700 642 186,418 0 0 3 414,483 0 0 600,900 67,067,600 0.9Ferris 44,250,700 1,212 352,001 3 428,776 3 414,483 3 888,179 2,083,400 46,334,100 4.7Grand Valley 55,436,000 1,182 343,090 3 428,776 3 414,483 2 592,119 1,778,500 57,214,500 3.2Saginaw Valley 25,656,700 362 104,969 3 428,776 0 0 0 0 533,700 26,190,400 2.1UM-Dearborn 22,237,300 356 103,372 1 142,925 0 0 0 0 246,300 22,483,600 1.1UM-Flint 19,526,600 375 108,889 3 428,776 3 414,483 0 0 952,100 20,478,700 4.9
Northern 40,856,600 472 137,109 1 142,925 2 276,322 1 296,060 852,400 41,709,000 2.1
Lake Superior 12,046,100 183 53,265 3 428,776 1 138,161 0 0 620,200 12,666,300 5.1
TOTAL: $1,243,451,700 14,274 $4,144,833 $1,284,034,931 $2,072,417 29 $4,144,833 30 $4,144,833 14 $4,144,833 $18,651,700 $1,262,103,400 1.5
**Tuition Restraint Component (25.0%): $6,217,300Total performance funding: $24,869,000 Total funding increase: $24,869,000
Data Notes *Requirements to receive performance funding amounts:Component Source Years Other 1. Participate in at least three reverse transfer agreements with community colleges (or make good-faith Critical skills undergrad awards State HEIDI FYs 2011-2012 Removed accounting/multi-disciplinary effort)Research & develop expends Federal IPEDS FY 2011 Carnegie research universities only 2. Maintain a dual enrollment credit policy that does not consider whether credits were used toward high Six-year graduation rate Federal IPEDS^ FYs 2007-2010 school graduationTotal degree completions Federal IPEDS^ FYs 2007-2010 Includes graduate degrees 3. Participate in the Michigan Transfer NetworkInst support as % of core expends Federal IPEDS^ FYs 2007-2010 Measure of administrative costs
^Via BLM/AEG **Funding to be allocated to universities restraining FY 2013-14 resident undergraduate tuition/fee increase below 4.0%
ScoringImproving over 3 years 3Top 20% nationally 2Above national median 1
Six-year Graduation
Rate
Table 2: FY 2013-14 GOVERNOR'S RECOMMENDATION APPROPRIATION DETAIL FOR UNIVERSITY OPERATIONS
Funding Proportional to Share of Total Scored vs. National Carnegie Peers
$290 per degree $0.0016 per dollar $142,925 per point $138,161 per point $269,059 per point16.7% 8.3% 16.7% 16.7% 16.7%
FY 2013-14Appropriation
w/ Perf FundingPercentChange
FY 2012-13Year-to-Date Funding
Total Degree Completions Funding
Inst Support as % of Core
Expends Funding
*Total Performance
Funding
Critical Skills Undergrad
Awards Funding
Research & Develop Expends Funding
% of formula:Funding per unit:
University
Michigan State $245,037,000 2,664 $865,421 $293,704,711 $530,387 2 $331,254 3 $448,796 2 $662,508 $2,838,300 $247,875,300 1.2UM-Ann Arbor 274,156,700 2,629 854,131 728,871,000 1,316,234 3 496,881 3 448,796 2 662,508 3,778,400 277,935,100 1.4Wayne State 183,398,300 659 214,101 163,944,192 296,059 0 0 0 0 0 0 510,200 183,908,500 0.3
Michigan Tech 42,579,100 903 293,415 52,917,000 95,560 3 496,881 2 299,197 0 0 1,185,100 43,764,200 2.8Western 95,487,500 1,037 336,909 27,538,940 49,731 2 331,254 2 299,197 2 662,508 1,679,700 97,167,200 1.8
Central 71,352,300 681 221,086 7,527,977 13,594 3 496,881 3 448,796 2 662,508 1,842,900 73,195,200 2.6Oakland 44,964,100 918 298,247 9,531,111 17,212 0 0 2 299,197 0 0 614,700 45,578,800 1.4
Eastern 66,466,700 642 208,578 0 0 3 448,796 0 0 657,400 67,124,100 1.0Ferris 44,250,700 1,212 393,846 2 331,254 3 448,796 2 662,508 1,836,400 46,087,100 4.1Grand Valley 55,436,000 1,182 383,876 3 496,881 3 448,796 2 662,508 1,992,000 57,428,000 3.6Saginaw Valley 25,656,700 362 117,447 2 331,254 0 0 0 0 448,700 26,105,400 1.7UM-Dearborn 22,237,300 356 115,660 2 331,254 0 0 0 0 446,900 22,684,200 2.0UM-Flint 19,526,600 375 121,833 2 331,254 2 299,197 0 0 752,300 20,278,900 3.9
Northern 40,856,600 472 153,408 2 331,254 3 448,796 2 662,508 1,596,000 42,452,600 3.9
Lake Superior 12,046,100 183 59,597 2 331,254 2 299,197 0 0 690,000 12,736,100 5.7
TOTAL: $1,243,451,700 14,274 $4,637,556 $1,284,034,931 $2,318,778 28 $4,637,556 31 $4,637,556 14 $4,637,556 $20,869,000 $1,264,320,700 1.7
Additional MPSERS Reimbursement: $2,000,000Total performance funding: $20,869,000 Indian Tuition Waiver Reimbursement: 2,000,000
Total Funding Increase: $24,869,000
Data Notes *Requirements to receive performance funding amounts:Component Source Years Other 1. Restrain FY 2013-14 resident undergraduate tuition/fee rate increase to below 4.0%Critical skills undergrad awards State HEIDI FYs 2011-2012 Removed accounting/multi-disciplinary 2. Participate in at least three reverse transfer agreements with community colleges (or make good-faith effort)Research & develop expends Federal IPEDS FY 2011 Carnegie research universities only 3. Maintain a dual enrollment credit policy that does not consider whether credits were used toward high Six-year graduation rate Federal IPEDS^ FYs 2007-2010 school graduationTotal degree completions Federal IPEDS^ FYs 2007-2010 Includes graduate degrees 4. Participate in the Michigan Transfer NetworkInst support as % of core expends Federal IPEDS^ FYs 2007-2010 Measure of administrative costs
^Via BLM/AEG
ScoringTop 20% nationally 3Above national median 2Improving over 3 years 2
FY 2013-14Appropriation
w/ Perf FundingPercentChange
FY 2012-13Year-to-Date Funding
Total Degree Completions Funding
Inst Support as % of Core
Expends Funding
*Total Performance
Funding
Critical Skills Undergrad
Completions Funding
Research & Develop Expends Funding
Six-year Graduation
Rate
$325 per degree $0.0018 per dollar $165,627 per point $149,599 per point $331,254 per point
Table 3: FY 2013-14 SENATE-PASSED APPROPRIATION DETAIL FOR UNIVERSITY OPERATIONS
Funding Proportional to Share of Total Scored vs. National Carnegie Peers22.2% 11.1% 22.2% 22.2% 22.2%

% of formula:Funding per unit:
Resident FYES-Total Undergrad Weighted Percent
University Score FYES Score Funding Change
Michigan State $245,037,000 2,664 $1,031,298 $293,704,711 $632,048 3 3 1 7 28,978 202,846 $3,394,255 $5,057,600 $250,094,600 2.1UM-Ann Arbor 274,156,700 2,629 1,017,844 728,871,000 1,568,519 3 3 1 7 17,421 121,947 2,040,559 4,626,900 278,783,600 1.7Wayne State 183,398,300 659 255,139 163,944,192 352,805 0 0 0 0 15,479 0 0 608,000 184,006,300 0.3
Michigan Tech 42,579,100 903 349,654 52,917,000 113,877 3 3 0 6 4,094 24,564 411,033 874,600 43,453,700 2.1Western 95,487,500 1,037 401,485 27,538,940 59,263 1 1 3 5 16,782 83,910 1,404,080 1,864,800 97,352,300 2.0
Central 71,352,300 681 263,462 7,527,977 16,200 2 2 3 7 19,015 133,105 2,227,267 2,506,900 73,859,200 3.5Oakland 44,964,100 918 355,413 9,531,111 20,511 0 3 0 3 13,687 41,061 687,080 1,063,000 46,027,100 2.4
Eastern 66,466,700 642 248,557 0 3 0 3 14,749 44,247 740,392 988,900 67,455,600 1.5Ferris 44,250,700 1,212 469,335 3 3 3 9 10,256 92,304 1,544,538 2,013,900 46,264,600 4.6Grand Valley 55,436,000 1,182 457,454 3 3 2 8 18,710 149,680 2,504,620 2,962,100 58,398,100 5.3Saginaw Valley 25,656,700 362 139,958 3 0 0 3 7,782 23,346 390,652 530,600 26,187,300 2.1UM-Dearborn 22,237,300 356 137,829 1 0 0 1 5,703 5,703 95,429 233,300 22,470,600 1.0UM-Flint 19,526,600 375 145,185 3 3 0 6 5,297 31,782 531,813 677,000 20,203,600 3.5
Northern 40,856,600 472 182,812 1 2 1 4 6,765 27,060 452,799 635,600 41,492,200 1.6
Lake Superior 12,046,100 183 71,020 3 1 0 4 2,313 9,252 154,815 225,800 12,271,900 1.9
TOTAL: $1,243,451,700 14,274 $5,526,444 $1,284,034,931 $2,763,222 29 30 14 73 187,031 990,807 $16,579,333 $24,869,000 $1,268,320,700 2.0
Total performance funding: $24,869,000
Data Notes *Requirements to receive performance funding amounts:Component Source Years Other 1. Restrain FY 2013-14 resident undergraduate tuition/fee rate increase to 3.0% or belowCritical skills undergrad awards State HEIDI FYs 2011-2012 Removed accounting/multi-disciplinary 2. Participate in at least three reverse transfer agreements with community colleges (or make good-faith effort)Research & develop expends Federal IPEDS FY 2011 Carnegie research universities only 3. Maintain a dual enrollment credit policy that does not consider whether credits were used toward high school Six-year graduation rate Federal IPEDS^ FYs 2007-2010 graduationTotal degree completions Federal IPEDS^ FYs 2007-2010 Includes graduate degrees 4. Participate in the Michigan Transfer NetworkInst support as % of core expends Federal IPEDS^ FYs 2007-2010 Measure of administrative costs
^Via BLM/AEGResident Undergrad FYES State HEIDI FY 2012 Based on university residency definitions
ScoringImproving over 3 years 3Top 20% nationally 2Above national median 1
Table 4: FY 2013-14 HOUSE-PASSED APPROPRIATION DETAIL FOR UNIVERSITY OPERATIONS
Funding Proportional to Share of Total Scored vs. National Carnegie Peers22.2% 11.1% 66.7%
*Total Performance
Funding
FY 2013-14 Appropriation w/
Perf FundingFY 2012-13
Year-to-Date
$387 per completion $0.0022 per dollar $16.73 per weighted ptCritical Skills
Undergrad Completions Funding
Research & Develop
Expends Funding
Six-year Graduation
RateTotal Degree Completions
Inst Support as % of Core
Expends
15
Table 5: STATE APPROPRIATIONS PER FISCAL-YEAR-EQUATED STUDENT (FYES)
University
FY 2011-12
FYES1) FY 2012-13
Appropriation
FY 2012-13
Appropriation Per FYES
FY 2013-14 Appropriation2)
FY 2013-14 Appropriation
Per FYES Central 22,510 $71,352,300 $3,170 $73,540,100 $3,267 Eastern 18,434 66,466,700 3,606 67,275,400 3,650 Ferris 12,217 44,250,700 3,622 45,636,500 3,735 Grand Valley 22,347 55,436,000 2,481 57,823,500 2,588 Lake Superior 2,418 12,046,100 4,982 12,231,000 5,058
Michigan State 44,738 245,037,000 5,477 249,597,800 5,579 Michigan Tech 6,378 42,579,100 6,676 43,473,800 6,816 Northern 8,568 40,856,600 4,769 41,741,400 4,872 Oakland 16,319 44,964,100 2,755 45,651,600 2,797 Saginaw Valley 9,190 25,656,700 2,792 25,991,000 2,828
UM-Ann Arbor 42,918 274,156,700 6,388 279,232,700 6,506 UM-Dearborn 6,669 22,237,300 3,334 22,510,400 3,375 UM-Flint 6,733 19,526,600 2,900 19,938,200 2,961 Wayne State 23,873 183,398,300 7,682 183,398,300 7,682 Western 21,603 95,487,500 4,420 97,279,000 4,503
Total 264,915 $1,243,451,700 $4,694 $1,265,320,700 $4,776 1) FYES figures include nonresident and graduate-level students. One FYES is equal to 30 credit hours at the
undergraduate level. 2) Appropriation amounts reflect reallocation of performance funding due to Wayne State University's noncompliance
with tuition restraint.
16
Table 6: UNIVERSITY APPROPRIATION FUNDING SOURCES
University
FY 2013-14
Total Appropriation
FY 2013-14 School Aid Fund
Appropriation
FY 2013-14
GF/GP Appropriation
School Aid As % of Total
GF/GP As % of Total
Central $73,540,100 $11,284,600 $62,255,500 15.3 84.7 Eastern 67,275,400 10,706,400 56,569,000 15.9 84.1 Ferris 45,636,500 6,846,800 38,789,700 15.0 85.0 Grand Valley 57,823,500 8,727,800 49,095,700 15.1 84.9 Lake Superior 12,231,000 1,787,600 10,443,400 14.6 85.4 Michigan State 249,597,800 39,949,900 209,647,900 16.0 84.0 Michigan Tech 43,473,800 6,748,900 36,724,900 15.5 84.5 Northern 41,741,400 6,356,900 35,384,500 15.2 84.8 Oakland 45,651,600 7,148,400 38,503,200 15.7 84.3 Saginaw Valley 25,991,000 3,903,800 22,087,200 15.0 85.0 UM-Ann Arbor 279,232,700 44,536,300 234,696,400 15.9 84.1 UM-Dearborn 22,510,400 3,482,100 19,028,300 15.5 84.5 UM-Flint 19,938,200 2,942,900 16,995,300 14.8 85.2 Wayne State 183,398,300 30,160,600 153,237,700 16.4 83.6 Western 97,279,000 15,436,500 81,842,500 15.9 84.1
Total $1,265,320,700 $200,019,500 $1,065,301,200 15.8 84.2
Note: Appropriation amounts reflect reallocation of performance funding due to Wayne State University's noncompliance with tuition restraint.

17
Table 7: INDIAN TUITION WAIVER PROGRAM
University
Appropriation Added to Base in FY 1996-97
FY 2007-08 Allocation Based on
Unfunded Costs
Adjustment for Across-the-Board
Changes1)
Total Estimated FY 2013-14 Allocation
Central $144,117 $151,000 ($44,995) $250,122 Eastern 103,478 62,900 (24,624) 141,755 Ferris State 156,380 46,300 (28,983) 173,698 Grand Valley 114,121 169,200 (44,007) 239,314 Lake Superior 276,146 181,500 (68,015) 389,632 Michigan State 313,968 192,800 (75,041) 431,727 Michigan Tech 58,509 50,800 (16,493) 92,816 Northern 264,054 130,600 (57,787) 336,867 Oakland 50,610 50,300 (15,341) 85,570 Saginaw Valley 37,266 28,600 (9,872) 55,994 UM-Ann Arbor 432,567 139,500 (82,098) 489,969 UM-Dearborn 58,541 21,800 (11,603) 68,738 UM-Flint 54,531 21,100 (10,943) 64,688 Wayne State 169,537 94,700 (38,933) 225,304 Western 111,851 58,900 (25,082) 145,669 Total $2,345,676 $1,400,000 ($553,816) $3,191,860
1) Accounts for annual across-the-board adjustments to university operations appropriations since FY 1996-97. No
adjustments were made based on FY 2013-14 appropriation increases due to the fact that performance funding adjustments were not related to base appropriations.
Note: Amounts shown reflect historical budget adjustments related to Indian Tuition Waivers; no formal earmark of funds is made, except that $100,000 is allocated to Bay Mills Tribal College through Lake Superior State's appropriation and $29,700 is allocated to Saginaw Chippewa Tribal College through Central Michigan's appropriation (above and beyond amounts shown above).

18
Table 8: MARTIN LUTHER KING, JR.-CESAR CHAVEZ-ROSA PARKS INITIATIVE
King-Chavez-Parks Program Components:
FY 2013-14Funding
College Day - students in grades 6-11 visit campuses ........................................................................ $980,261 Allocations from each university's operations appropriations
Future Faculty Fellowships - stipends for graduate students pursuing postsecondary teaching ........ 992,911Visiting Professors - payments for visiting professors who lecture on campuses ............................... 138,960Subtotal ................................................................................................................................................ $2,112,132
Select Student Support Services - grants for student retention projects ............................................. $1,956,100 Appropriated in a separate unit as grant programs
College/University Partnership - grants to increase number of transfer students ............................... 586,800Morris Hood, Jr. Educator Development - grants to increase completion of K-12 teaching degrees .. 148,600Subtotal ................................................................................................................................................ $2,691,500
Total ..................................................................................................................................................... $4,803,632
Table 9: FY 2013-14 ALLOCATIONS FOR COLLEGE DAY, FUTURE FACULTY, AND VISITING PROFESSORS
University College Day Future Faculty Visiting ProfessorsCentral ........................................................... $73,656 $98,238 $9,264 Eastern .......................................................... 87,537 97,974 9,264 Ferris .............................................................. 45,539 29,533 9,264 Grand Valley .................................................. 31,037 29,533 9,264 Lake Superior ................................................ 11,671 29,533 9,264 Michigan State ............................................... 181,623 98,328 9,264 Michigan Tech ............................................... 29,974 98,328 9,264 Northern ......................................................... 33,512 29,533 9,264 Oakland ......................................................... 51,816 98,328 9,264 Saginaw Valley .............................................. 21,045 29,533 9,264 UM-Ann Arbor ................................................ 148,640 98,328 9,264 UM-Dearborn ................................................. 27,323 29,533 9,264 UM-Flint ......................................................... 24,140 29,533 9,264 Wayne State .................................................. 125,297 98,328 9,264 Western ......................................................... 87,451 98,328 9,264 Total .............................................................. $980,261 $992,911 $138,960Note: Amounts reflect minimum funding allocations for each component under budget act language. Universities may
opt to expend additional funds from their appropriations.
19
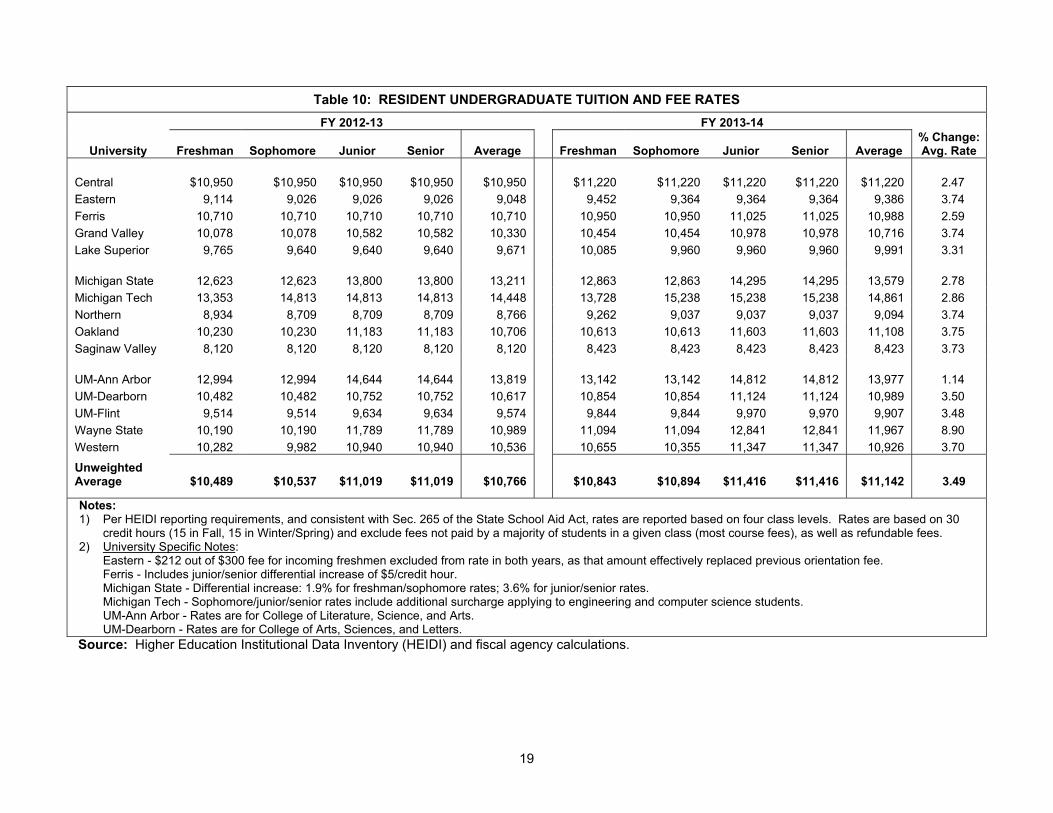
Table 10: RESIDENT UNDERGRADUATE TUITION AND FEE RATES FY 2012-13 FY 2013-14
University Freshman Sophomore Junior Senior Average Freshman Sophomore Junior Senior Average % Change: Avg. Rate
Central $10,950 $10,950 $10,950 $10,950 $10,950 $11,220 $11,220 $11,220 $11,220 $11,220 2.47 Eastern 9,114 9,026 9,026 9,026 9,048 9,452 9,364 9,364 9,364 9,386 3.74 Ferris 10,710 10,710 10,710 10,710 10,710 10,950 10,950 11,025 11,025 10,988 2.59 Grand Valley 10,078 10,078 10,582 10,582 10,330 10,454 10,454 10,978 10,978 10,716 3.74 Lake Superior 9,765 9,640 9,640 9,640 9,671 10,085 9,960 9,960 9,960 9,991 3.31 Michigan State 12,623 12,623 13,800 13,800 13,211 12,863 12,863 14,295 14,295 13,579 2.78 Michigan Tech 13,353 14,813 14,813 14,813 14,448 13,728 15,238 15,238 15,238 14,861 2.86 Northern 8,934 8,709 8,709 8,709 8,766 9,262 9,037 9,037 9,037 9,094 3.74 Oakland 10,230 10,230 11,183 11,183 10,706 10,613 10,613 11,603 11,603 11,108 3.75 Saginaw Valley 8,120 8,120 8,120 8,120 8,120 8,423 8,423 8,423 8,423 8,423 3.73 UM-Ann Arbor 12,994 12,994 14,644 14,644 13,819 13,142 13,142 14,812 14,812 13,977 1.14 UM-Dearborn 10,482 10,482 10,752 10,752 10,617 10,854 10,854 11,124 11,124 10,989 3.50 UM-Flint 9,514 9,514 9,634 9,634 9,574 9,844 9,844 9,970 9,970 9,907 3.48 Wayne State 10,190 10,190 11,789 11,789 10,989 11,094 11,094 12,841 12,841 11,967 8.90 Western 10,282 9,982 10,940 10,940 10,536 10,655 10,355 11,347 11,347 10,926 3.70
Unweighted Average $10,489 $10,537 $11,019 $11,019 $10,766 $10,843 $10,894 $11,416 $11,416 $11,142 3.49
Notes: 1) Per HEIDI reporting requirements, and consistent with Sec. 265 of the State School Aid Act, rates are reported based on four class levels. Rates are based on 30
credit hours (15 in Fall, 15 in Winter/Spring) and exclude fees not paid by a majority of students in a given class (most course fees), as well as refundable fees. 2) University Specific Notes:
Eastern - $212 out of $300 fee for incoming freshmen excluded from rate in both years, as that amount effectively replaced previous orientation fee. Ferris - Includes junior/senior differential increase of $5/credit hour. Michigan State - Differential increase: 1.9% for freshman/sophomore rates; 3.6% for junior/senior rates. Michigan Tech - Sophomore/junior/senior rates include additional surcharge applying to engineering and computer science students. UM-Ann Arbor - Rates are for College of Literature, Science, and Arts. UM-Dearborn - Rates are for College of Arts, Sciences, and Letters.
Source: Higher Education Institutional Data Inventory (HEIDI) and fiscal agency calculations.

APPROPRIATION ADJUSTMENT DETAIL


23
CENTRAL MICHIGAN UNIVERSITY
FY 2012-13 Year-to-Date Gross Appropriation ...................................................................... $71,352,300
Changes From FY 2012-13 Year-to-Date Appropriation: Performance Funding ................................................................................................................. 2,134,300 Redistribution of Forfeited Funds ............................................................................................... 53,500 Total Changes ............................................................................................................................ 2,187,800
FY 2013-14 Initial Gross Appropriation .................................................................................. $73,540,100
EASTERN MICHIGAN UNIVERSITY
FY 2012-13 Year-to-Date Gross Appropriation ...................................................................... $66,466,700
Changes From FY 2012-13 Year-to-Date Appropriation: Performance Funding ................................................................................................................. 788,900 Redistribution of Forfeited Funds ............................................................................................... 19,800 Total Changes ............................................................................................................................ 808,700
FY 2013-14 Initial Gross Appropriation .................................................................................. $67,275,400
FERRIS STATE UNIVERSITY
FY 2012-13 Year-to-Date Gross Appropriation ...................................................................... $44,250,700
Changes From FY 2012-13 Year-to-Date Appropriation: Performance Funding ................................................................................................................. 1,351,900 Redistribution of Forfeited Funds ............................................................................................... 33,900 Total Changes ............................................................................................................................ 1,385,800 FY 2013-14 Initial Gross Appropriation .................................................................................. $45,636,500

24
GRAND VALLEY STATE UNIVERSITY
FY 2012-13 Year-to-Date Gross Appropriation ...................................................................... $55,436,000
Changes From FY 2012-13 Year-to-Date Appropriation: Performance Funding ................................................................................................................. 2,329,100 Redistribution of Forfeited Funds ............................................................................................... 58,400 Total Changes ............................................................................................................................ 2,387,500
FY 2013-14 Initial Gross Appropriation .................................................................................. $57,823,500
LAKE SUPERIOR STATE UNIVERSITY
FY 2012-13 Year-to-Date Gross Appropriation ...................................................................... $12,046,100
Changes From FY 2012-13 Year-to-Date Appropriation: Performance Funding ................................................................................................................. 180,400 Redistribution of Forfeited Funds ............................................................................................... 4,500 Total Changes ............................................................................................................................ 184,900
FY 2013-14 Initial Gross Appropriation .................................................................................. $12,231,000
MICHIGAN STATE UNIVERSITY
FY 2012-13 Year-to-Date Gross Appropriation ...................................................................... $245,037,000
Changes From FY 2012-13 Year-to-Date Appropriation: Performance Funding ................................................................................................................. 4,449,300 Redistribution of Forfeited Funds ............................................................................................... 111,500 Total Changes ............................................................................................................................ 4,560,800 FY 2013-14 Initial Gross Appropriation .................................................................................. $249,597,800
25
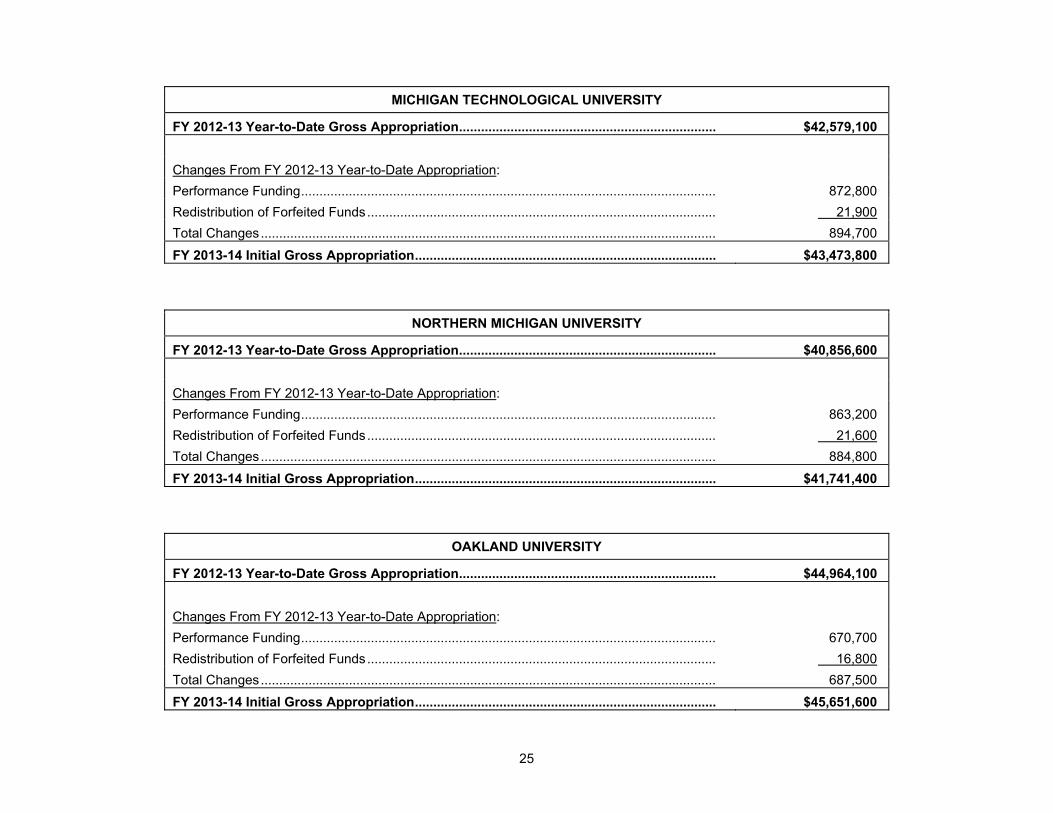
MICHIGAN TECHNOLOGICAL UNIVERSITY
FY 2012-13 Year-to-Date Gross Appropriation ...................................................................... $42,579,100
Changes From FY 2012-13 Year-to-Date Appropriation: Performance Funding ................................................................................................................. 872,800 Redistribution of Forfeited Funds ............................................................................................... 21,900 Total Changes ............................................................................................................................ 894,700
FY 2013-14 Initial Gross Appropriation .................................................................................. $43,473,800
NORTHERN MICHIGAN UNIVERSITY
FY 2012-13 Year-to-Date Gross Appropriation ...................................................................... $40,856,600
Changes From FY 2012-13 Year-to-Date Appropriation: Performance Funding ................................................................................................................. 863,200 Redistribution of Forfeited Funds ............................................................................................... 21,600 Total Changes ............................................................................................................................ 884,800
FY 2013-14 Initial Gross Appropriation .................................................................................. $41,741,400
OAKLAND UNIVERSITY
FY 2012-13 Year-to-Date Gross Appropriation ...................................................................... $44,964,100
Changes From FY 2012-13 Year-to-Date Appropriation: Performance Funding ................................................................................................................. 670,700 Redistribution of Forfeited Funds ............................................................................................... 16,800 Total Changes ............................................................................................................................ 687,500 FY 2013-14 Initial Gross Appropriation .................................................................................. $45,651,600
26
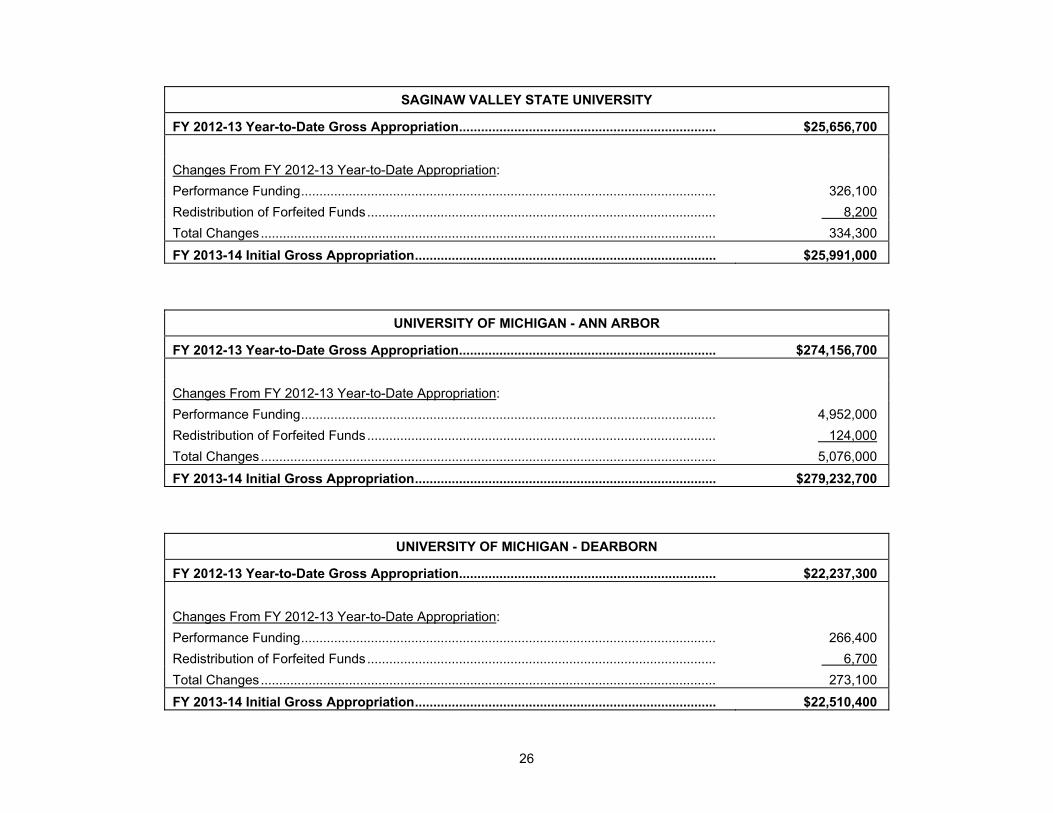
SAGINAW VALLEY STATE UNIVERSITY
FY 2012-13 Year-to-Date Gross Appropriation ...................................................................... $25,656,700
Changes From FY 2012-13 Year-to-Date Appropriation: Performance Funding ................................................................................................................. 326,100 Redistribution of Forfeited Funds ............................................................................................... 8,200 Total Changes ............................................................................................................................ 334,300
FY 2013-14 Initial Gross Appropriation .................................................................................. $25,991,000
UNIVERSITY OF MICHIGAN - ANN ARBOR
FY 2012-13 Year-to-Date Gross Appropriation ...................................................................... $274,156,700
Changes From FY 2012-13 Year-to-Date Appropriation: Performance Funding ................................................................................................................. 4,952,000 Redistribution of Forfeited Funds ............................................................................................... 124,000 Total Changes ............................................................................................................................ 5,076,000
FY 2013-14 Initial Gross Appropriation .................................................................................. $279,232,700
UNIVERSITY OF MICHIGAN - DEARBORN
FY 2012-13 Year-to-Date Gross Appropriation ...................................................................... $22,237,300
Changes From FY 2012-13 Year-to-Date Appropriation: Performance Funding ................................................................................................................. 266,400 Redistribution of Forfeited Funds ............................................................................................... 6,700 Total Changes ............................................................................................................................ 273,100 FY 2013-14 Initial Gross Appropriation .................................................................................. $22,510,400

27
UNIVERSITY OF MICHIGAN - FLINT
FY 2012-13 Year-to-Date Gross Appropriation ...................................................................... $19,526,600
Changes From FY 2012-13 Year-to-Date Appropriation: Performance Funding ................................................................................................................. 401,500 Redistribution of Forfeited Funds ............................................................................................... 10,100 Total Changes ............................................................................................................................ 0
FY 2013-14 Initial Gross Appropriation .................................................................................. $19,938,200
WAYNE STATE UNIVERSITY
FY 2012-13 Year-to-Date Gross Appropriation ...................................................................... $183,398,300
Changes From FY 2012-13 Year-to-Date Appropriation: Performance Funding ................................................................................................................. 534,700 Forfeited Funds .......................................................................................................................... (534,700) Total Changes ............................................................................................................................ 0
FY 2013-14 Initial Gross Appropriation .................................................................................. $183,398,300
WESTERN MICHIGAN UNIVERSITY
FY 2012-13 Year-to-Date Gross Appropriation ...................................................................... $95,487,500
Changes From FY 2012-13 Year-to-Date Appropriation: Performance Funding ................................................................................................................. 1,747,700 Redistribution of Forfeited Funds ............................................................................................... 43,800 Total Changes ............................................................................................................................ 1,791,500 FY 2013-14 Initial Gross Appropriation .................................................................................. $97,279,000

28
MPSERS RETIREE HEALTH CARE
FY 2012-13 Year-to-Date Gross Appropriation ...................................................................... $446,200
Changes From FY 2012-13 Year-to-Date Appropriation: Increase State Contribution ........................................................................................................ 2,000,000 FY 2013-14 Initial Gross Appropriation .................................................................................. $2,446,200
MSU AGBIORESEARCH AND MSU EXTENSION
FY 2012-13 Year-to-Date Gross Appropriation ...................................................................... $54,204,600
Changes From FY 2012-13 Year-to-Date Appropriation: Funding Increase ........................................................................................................................ 2,084,100 Eliminate Roll-up Appropriation .................................................................................................. (56,288,700)MSU AgBioResearch ................................................................................................................. 30,243,900 MSU Extension ........................................................................................................................... 26,044,800 Total Changes ............................................................................................................................ 2,084,100 FY 2013-14 Initial Gross Appropriation .................................................................................. $56,288,700
STATE AND REGIONAL PROGRAMS
Higher Education Data Base ...................................................................................................... $105,000 Midwestern Higher Education Compact ..................................................................................... 95,000 FY 2012-13 Year-to-Date Gross Appropriation ...................................................................... $200,000 Changes From FY 2012-13 Year-to-Date Appropriation: Transfer in College Access Program from Department of Education ........................................ 2,000,000
FY 2013-14 Initial Gross Appropriation .................................................................................. $2,200,000
29
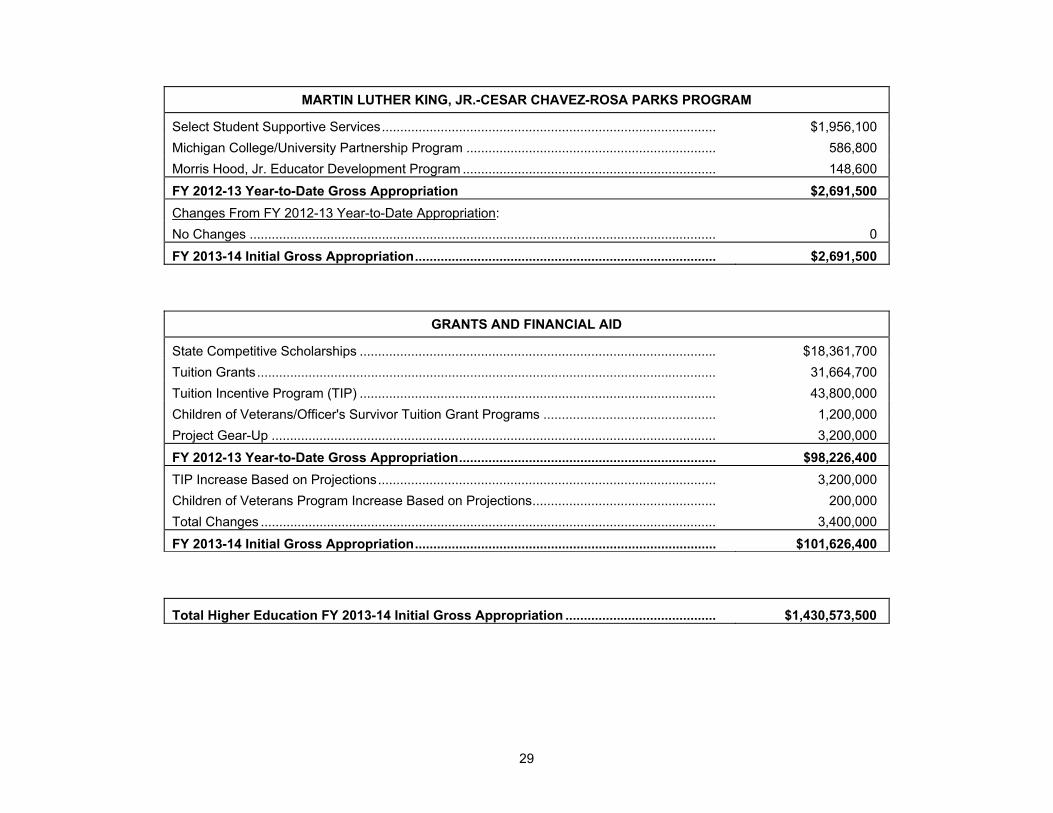
MARTIN LUTHER KING, JR.-CESAR CHAVEZ-ROSA PARKS PROGRAM
Select Student Supportive Services ........................................................................................... $1,956,100 Michigan College/University Partnership Program .................................................................... 586,800 Morris Hood, Jr. Educator Development Program ..................................................................... 148,600
FY 2012-13 Year-to-Date Gross Appropriation $2,691,500 Changes From FY 2012-13 Year-to-Date Appropriation: No Changes ............................................................................................................................... 0
FY 2013-14 Initial Gross Appropriation .................................................................................. $2,691,500
GRANTS AND FINANCIAL AID
State Competitive Scholarships ................................................................................................. $18,361,700 Tuition Grants ............................................................................................................................. 31,664,700 Tuition Incentive Program (TIP) ................................................................................................. 43,800,000 Children of Veterans/Officer's Survivor Tuition Grant Programs ............................................... 1,200,000 Project Gear-Up ......................................................................................................................... 3,200,000
FY 2012-13 Year-to-Date Gross Appropriation ...................................................................... $98,226,400 TIP Increase Based on Projections ............................................................................................ 3,200,000 Children of Veterans Program Increase Based on Projections .................................................. 200,000 Total Changes ............................................................................................................................ 3,400,000
FY 2013-14 Initial Gross Appropriation .................................................................................. $101,626,400
Total Higher Education FY 2013-14 Initial Gross Appropriation ......................................... $1,430,573,500

BOILERPLATE REPORT REQUIREMENTS

33
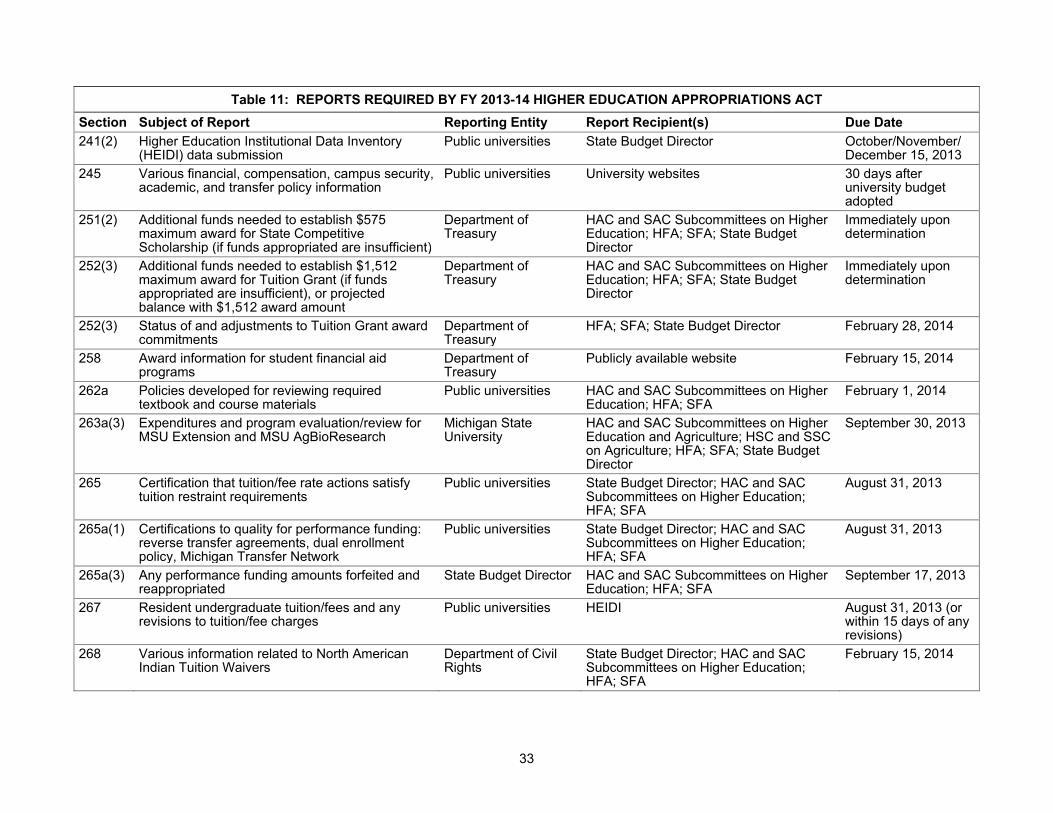
Table 11: REPORTS REQUIRED BY FY 2013-14 HIGHER EDUCATION APPROPRIATIONS ACT Section Subject of Report Reporting Entity Report Recipient(s) Due Date 241(2) Higher Education Institutional Data Inventory
(HEIDI) data submission Public universities State Budget Director October/November/
December 15, 2013245 Various financial, compensation, campus security,
academic, and transfer policy information Public universities University websites 30 days after
university budget adopted
251(2) Additional funds needed to establish $575 maximum award for State Competitive Scholarship (if funds appropriated are insufficient)
Department of Treasury
HAC and SAC Subcommittees on Higher Education; HFA; SFA; State Budget Director
Immediately upon determination
252(3) Additional funds needed to establish $1,512 maximum award for Tuition Grant (if funds appropriated are insufficient), or projected balance with $1,512 award amount
Department of Treasury
HAC and SAC Subcommittees on Higher Education; HFA; SFA; State Budget Director
Immediately upon determination
252(3) Status of and adjustments to Tuition Grant award commitments
Department of Treasury
HFA; SFA; State Budget Director February 28, 2014
258 Award information for student financial aid programs
Department of Treasury
Publicly available website February 15, 2014
262a Policies developed for reviewing required textbook and course materials
Public universities HAC and SAC Subcommittees on Higher Education; HFA; SFA
February 1, 2014
263a(3) Expenditures and program evaluation/review for MSU Extension and MSU AgBioResearch
Michigan State University
HAC and SAC Subcommittees on Higher Education and Agriculture; HSC and SSC on Agriculture; HFA; SFA; State Budget Director
September 30, 2013
265 Certification that tuition/fee rate actions satisfy tuition restraint requirements
Public universities State Budget Director; HAC and SAC Subcommittees on Higher Education; HFA; SFA
August 31, 2013
265a(1) Certifications to quality for performance funding: reverse transfer agreements, dual enrollment policy, Michigan Transfer Network
Public universities State Budget Director; HAC and SAC Subcommittees on Higher Education; HFA; SFA
August 31, 2013
265a(3) Any performance funding amounts forfeited and reappropriated
State Budget Director HAC and SAC Subcommittees on Higher Education; HFA; SFA
September 17, 2013
267 Resident undergraduate tuition/fees and any revisions to tuition/fee charges
Public universities HEIDI August 31, 2013 (or within 15 days of any revisions)
268 Various information related to North American Indian Tuition Waivers
Department of Civil Rights
State Budget Director; HAC and SAC Subcommittees on Higher Education; HFA; SFA
February 15, 2014
34
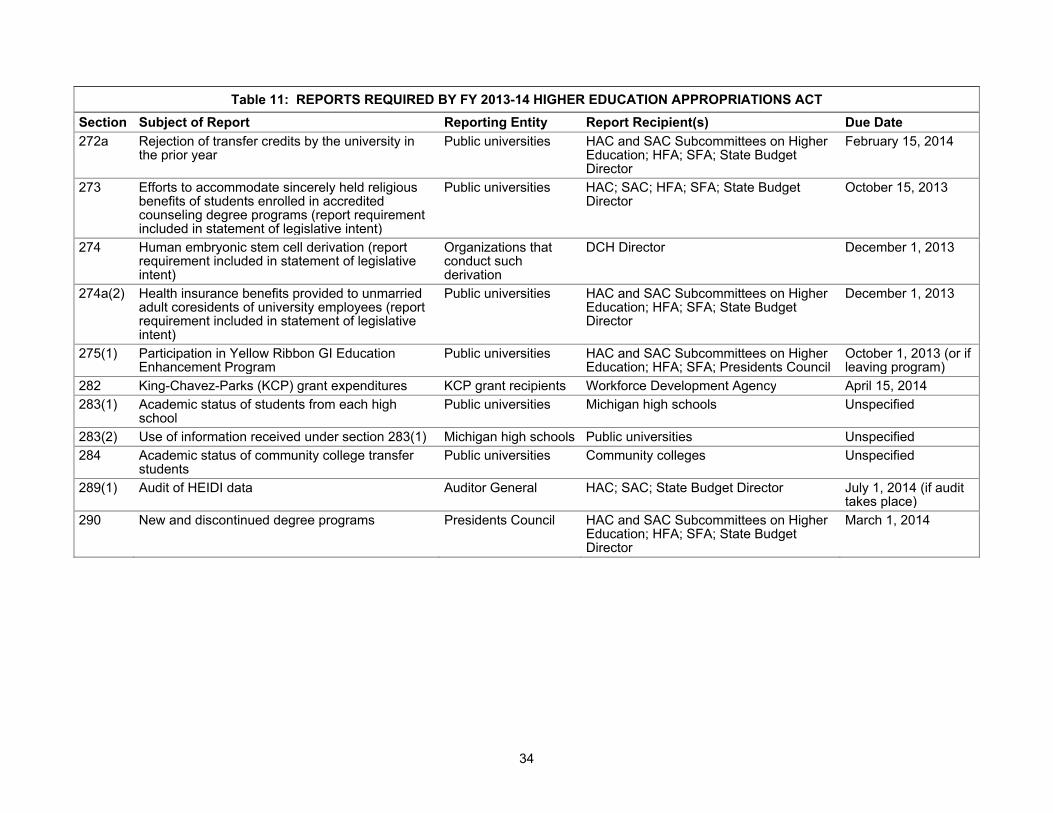
Table 11: REPORTS REQUIRED BY FY 2013-14 HIGHER EDUCATION APPROPRIATIONS ACT Section Subject of Report Reporting Entity Report Recipient(s) Due Date 272a Rejection of transfer credits by the university in
the prior year Public universities HAC and SAC Subcommittees on Higher
Education; HFA; SFA; State Budget Director
February 15, 2014
273 Efforts to accommodate sincerely held religious benefits of students enrolled in accredited counseling degree programs (report requirement included in statement of legislative intent)
Public universities HAC; SAC; HFA; SFA; State Budget Director
October 15, 2013
274 Human embryonic stem cell derivation (report requirement included in statement of legislative intent)
Organizations that conduct such derivation
DCH Director December 1, 2013
274a(2) Health insurance benefits provided to unmarried adult coresidents of university employees (report requirement included in statement of legislative intent)
Public universities HAC and SAC Subcommittees on Higher Education; HFA; SFA; State Budget Director
December 1, 2013
275(1) Participation in Yellow Ribbon GI Education Enhancement Program
Public universities HAC and SAC Subcommittees on Higher Education; HFA; SFA; Presidents Council
October 1, 2013 (or if leaving program)
282 King-Chavez-Parks (KCP) grant expenditures KCP grant recipients Workforce Development Agency April 15, 2014283(1) Academic status of students from each high
school Public universities Michigan high schools Unspecified
283(2) Use of information received under section 283(1) Michigan high schools Public universities Unspecified284 Academic status of community college transfer
students Public universities Community colleges Unspecified
289(1) Audit of HEIDI data Auditor General HAC; SAC; State Budget Director July 1, 2014 (if audit takes place)
290 New and discontinued degree programs Presidents Council HAC and SAC Subcommittees on Higher Education; HFA; SFA; State Budget Director
March 1, 2014

