higher tier 5-7 test - pearson global...
TRANSCRIPT
Exploring Science edition © Pearson Education Limited 2008365
Higher Tier 5-7 Test
1 a Fibre and starch are made from the same chemicals but provide different parts of a balanced diet.
i What type of nutrient or food substance is starch? ______________________
[1 mark]
ii What is formed by the digestion of starch? ______________________
[1 mark]
b Not all the substances that we eat or drink are good for our bodies. Name one substance that we can drink, which may be harmful.
___________________________________________________________________________________
[1 mark]
c The product of digestion of starch is used in respiration, which occurs in the cells of our bodies.
i Write the word equation for the respiration reaction that occurs in our cells to release energy.
______________ + ______________ ______________ + ______________
[2 marks]
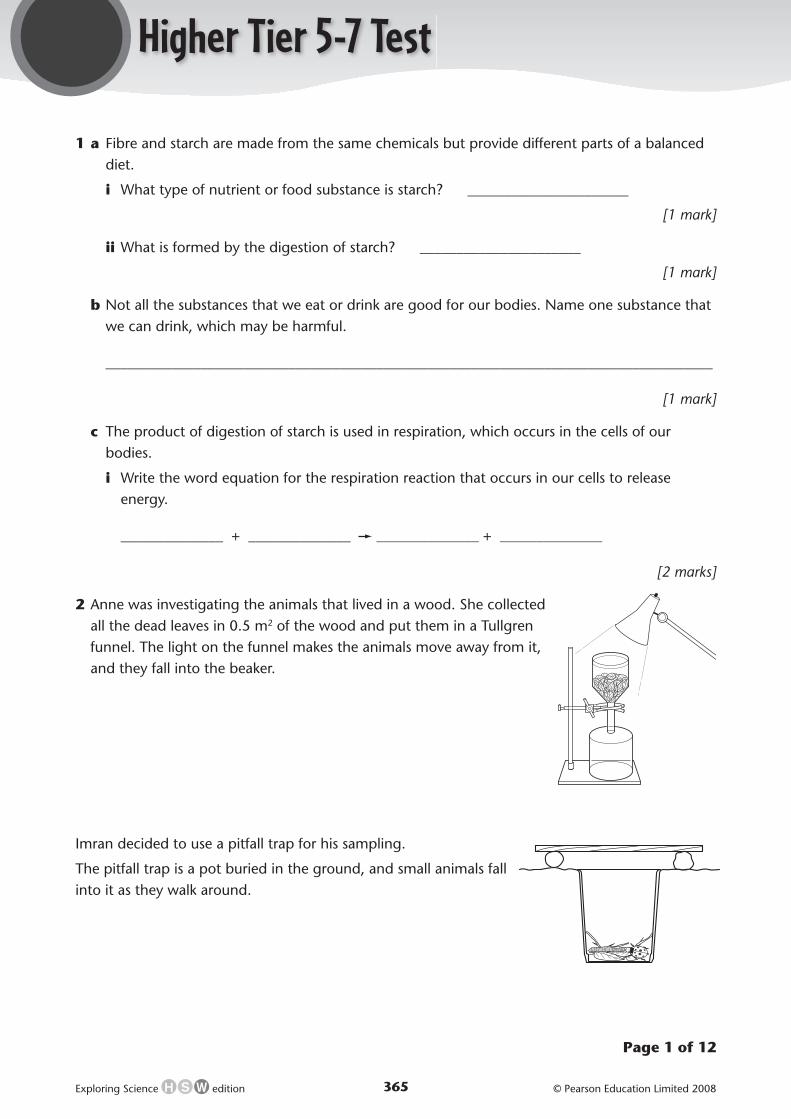
2 Anne was investigating the animals that lived in a wood. She collected all the dead leaves in 0.5 m2 of the wood and put them in a Tullgren funnel. The light on the funnel makes the animals move away from it, and they fall into the beaker.
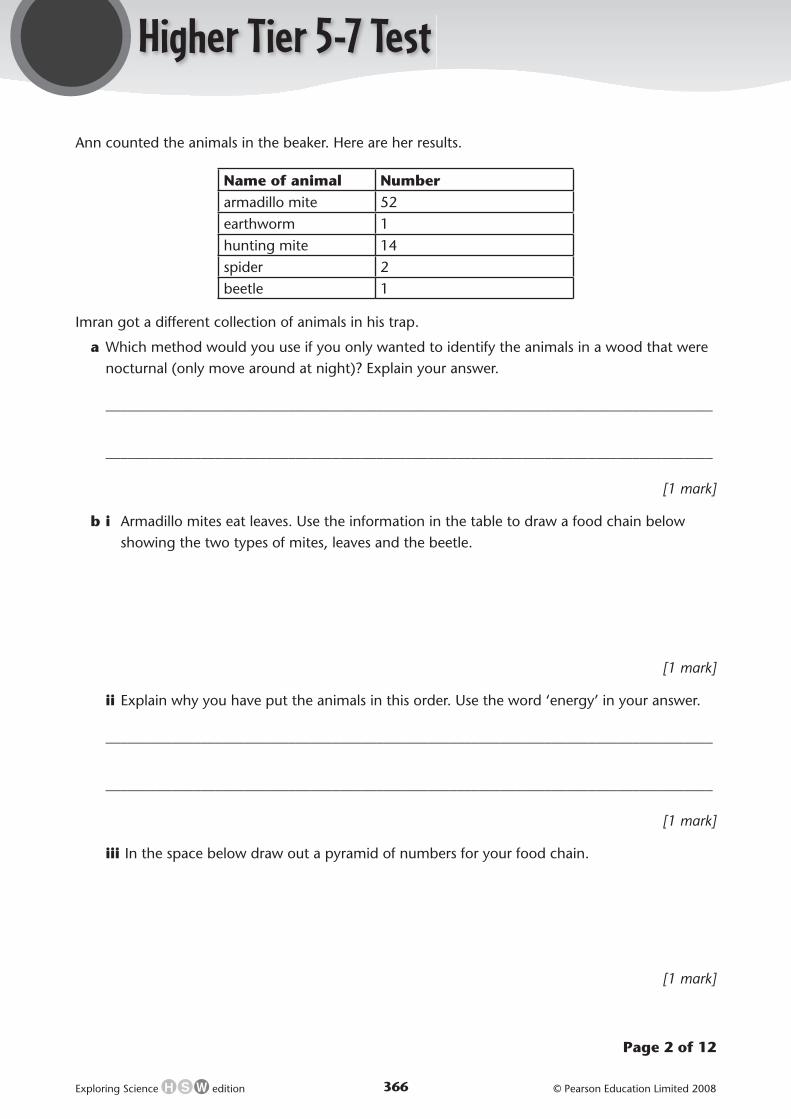
Imran decided to use a pitfall trap for his sampling.
The pitfall trap is a pot buried in the ground, and small animals fall into it as they walk around.
Page 1 of 12
Exploring Science edition © Pearson Education Limited 2008366
Higher Tier 5-7 Test
Ann counted the animals in the beaker. Here are her results.
Name of animal Numberarmadillo mite 52earthworm 1hunting mite 14spider 2beetle 1
Imran got a different collection of animals in his trap.
a Which method would you use if you only wanted to identify the animals in a wood that were nocturnal (only move around at night)? Explain your answer.
___________________________________________________________________________________
___________________________________________________________________________________
[1 mark]
b i Armadillo mites eat leaves. Use the information in the table to draw a food chain below showing the two types of mites, leaves and the beetle.
[1 mark]
ii Explain why you have put the animals in this order. Use the word ‘energy’ in your answer.
___________________________________________________________________________________
___________________________________________________________________________________
[1 mark]
iii In the space below draw out a pyramid of numbers for your food chain.
[1 mark]
Page 2 of 12

Exploring Science edition © Pearson Education Limited 2008367
Higher Tier 5-7 Test
c The wood being investigated has a total area of 150 m2.
Look at Anne’s results, and calculate how many armadillo mites you would expect to fi nd in the whole wood.
___________________________________________________________________________________
[1 mark]
d Imran counts the armadillo mites in his sample, and calculates that there would only be 50 of them in the wood. Why do you think Imran’s sample gives a different answer for the total number of armadillo mites?
___________________________________________________________________________________
___________________________________________________________________________________
[1 mark]
e If the animals in a pitfall trap are not counted quickly, the results may not be accurate. Explain why not.
___________________________________________________________________________________
___________________________________________________________________________________
[1 mark]
3 Some disinfectants are supposed to be mixed with water before they are used. Helen investigated the most cost – effective dilution for a type of household disinfectant.
She used Petri dishes with agar jelly in them. The jelly was covered with bacteria. She soaked discs of paper in different dilutions of disinfectant and put the discs onto the jelly.
Helen sealed the dishes and left them for a week. This is what the dishes looked like at the end of a week.
Petri dish
disc of paper soaked in disinfectant
forceps
agar jelly covered with bacteria
1
3 4
2 5
7 8
6
Page 3 of 12

Exploring Science edition © Pearson Education Limited 2008368
Higher Tier 5-7 Test
These are the dilutions that Helen used.
Disc 1 2 3 4 5 6 7 8Volume of disinfectant (cm3) 1 1 1 1 1 1 1 1Volume of water (cm3) 0 1 2 3 4 5 6 7
a Helen thinks that the result for disc 3 is wrong, and she must have dipped the paper disc in the wrong mixture.
Explain why Helen does not think that this is a reliable result.
___________________________________________________________________________________
___________________________________________________________________________________
[1 mark]
b i Based on Helen’s results, and ignoring result 3, how should this disinfectant be diluted when it is used?
___________________________________________________________________________________
[1 mark]
ii Explain your answer.
___________________________________________________________________________________
___________________________________________________________________________________
[1 mark]
iii Why should you not use a stronger mixture than the one you recommend?
___________________________________________________________________________________
___________________________________________________________________________________
[1 mark]
c Why did Helen seal the dishes?
___________________________________________________________________________________
___________________________________________________________________________________
[1 mark]
Page 4 of 12
Exploring Science edition © Pearson Education Limited 2008369
Higher Tier 5-7 Test
The label on the bottle of disinfectant says that it can be used for kitchen worktops and bathroom surfaces, and for cleaning toilets and drains.
d How could you test the disinfectant to fi nd out if it is effective for all the suggested uses?
Explain what you would do, why you would do it, and how you would make sure you collect enough data.
___________________________________________________________________________________
___________________________________________________________________________________
___________________________________________________________________________________
[3 marks]
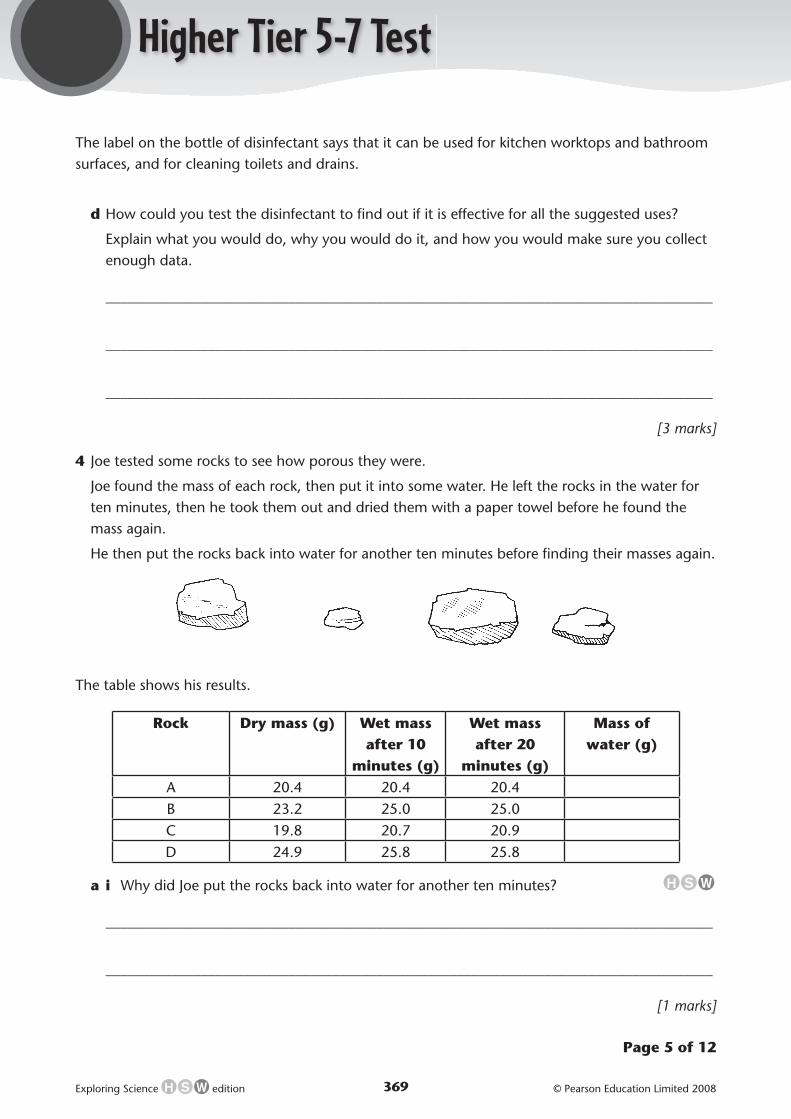
4 Joe tested some rocks to see how porous they were.
Joe found the mass of each rock, then put it into some water. He left the rocks in the water for ten minutes, then he took them out and dried them with a paper towel before he found the mass again.
He then put the rocks back into water for another ten minutes before fi nding their masses again.
The table shows his results.
Rock Dry mass (g) Wet mass after 10
minutes (g)
Wet mass after 20
minutes (g)
Mass of water (g)
A 20.4 20.4 20.4B 23.2 25.0 25.0C 19.8 20.7 20.9D 24.9 25.8 25.8
a i Why did Joe put the rocks back into water for another ten minutes?
___________________________________________________________________________________
___________________________________________________________________________________
[1 marks]
Page 5 of 12
Exploring Science edition © Pearson Education Limited 2008370
Higher Tier 5-7 Test
ii Joe got slightly different results after the second ten minutes. What does this show?
___________________________________________________________________________________
___________________________________________________________________________________
[1 mark]
iii What should Joe do next with the rocks to make sure his results are as accurate as possible?
___________________________________________________________________________________
___________________________________________________________________________________
[1 mark]
b Calculate the mass of water absorbed by each rock, and fi ll in the last column of the table.
[1 mark]
c Joe wants to fi nd out how porous each type of rock is. What does he have to do with his results before he can decide which is the most porous type of rock?
___________________________________________________________________________________
___________________________________________________________________________________
[1 mark]
Joe wanted to fi nd out if there was a relationship between the porosity of a rock and its density. He needs to measure the volume of each rock to work out the density.
d Describe how Joe can measure the volume of each piece of rock.
___________________________________________________________________________________
___________________________________________________________________________________
[2 marks]
Page 6 of 12

Exploring Science edition © Pearson Education Limited 2008371
Higher Tier 5-7 Test
e i When Joe has worked out the density of each piece of rock, what can he do with his results to fi nd out if there is a relationship?
___________________________________________________________________________________
___________________________________________________________________________________
[1 mark]
ii What will he see if there is a relationship?
___________________________________________________________________________________
___________________________________________________________________________________
[1 mark]
5 Fran and Carol want to see if adding salt to water changes the boiling point of the water. They use this apparatus (right).
The graph shows their results.
Fran and Carol are talking about their experiment.
a How could Fran and Carol get more accurate results if they did their experiment again?
___________________________________________________________________________________
[1 mark]
heat
25cm³water
100
102
104
106
108
110
10 2 3 4 5
Mass of salt added (g)
Bo
ilin
g p
oin
t o
f wat
er (º
C)
I noticed therewas some salt left in the water when we added 5g, even when the water had started to boil.
It was difficult toread the thermometer accurately – oneresult was between two marks so I guessed it was 105.5 degrees.
Fran Carol
Page 7 of 12
Exploring Science edition © Pearson Education Limited 2008372
Higher Tier 5-7 Test
b Look at Fran’s comment. What does this tell you about the accuracy of the last point on the graph? (The result for 5 g salt.)
___________________________________________________________________________________
[1 mark]
c Fran wants to try the experiment with different masses of salt, so she can plot more points on the graph.
Suggest three different masses of salt she could use, and explain why you chose them.
___________________________________________________________________________________
___________________________________________________________________________________
___________________________________________________________________________________
[2 marks]
d Use the results from the experiment to work out the solubility of salt at 100 °C.
Show your working, and include units with your answer.
Solubility = mass of solute
volume of solvent
___________________________________________________________________________________
___________________________________________________________________________________
___________________________________________________________________________________
[2 marks]
6 Matt is using this apparatus for an investigation.
The three rods are all made of different materials. There is a drawing pin stuck to the end of each rod with a blob of wax.
Matt heats the ends of the rods with a Bunsen burner, and times how long it takes for the pins to fall off.
Exploring Science Copymasters - PhysicsAW/P3d/4/fig 1Mac/eps/Ilustrator 8.01/BW s/sText: Meridien Roman 9/10.5ptPEARSONStudio: Peters & Zabransky
Page 8 of 12
Exploring Science edition © Pearson Education Limited 2008373
Higher Tier 5-7 Test
a i How should Matt show his results? Tick one box.
pie chart line graph bar chart scatter graph
ii Explain why you chose this way of displaying the results.
___________________________________________________________________________________
___________________________________________________________________________________
[1 mark]
Sue says it would be easier for Matt to do the experiment if he heats the three rods separately. Matt says his experiment is more accurate if he heats them all at once, as shown in the diagram above.
b What is one advantage of heating all the rods at once?
___________________________________________________________________________________
___________________________________________________________________________________
[1 mark]
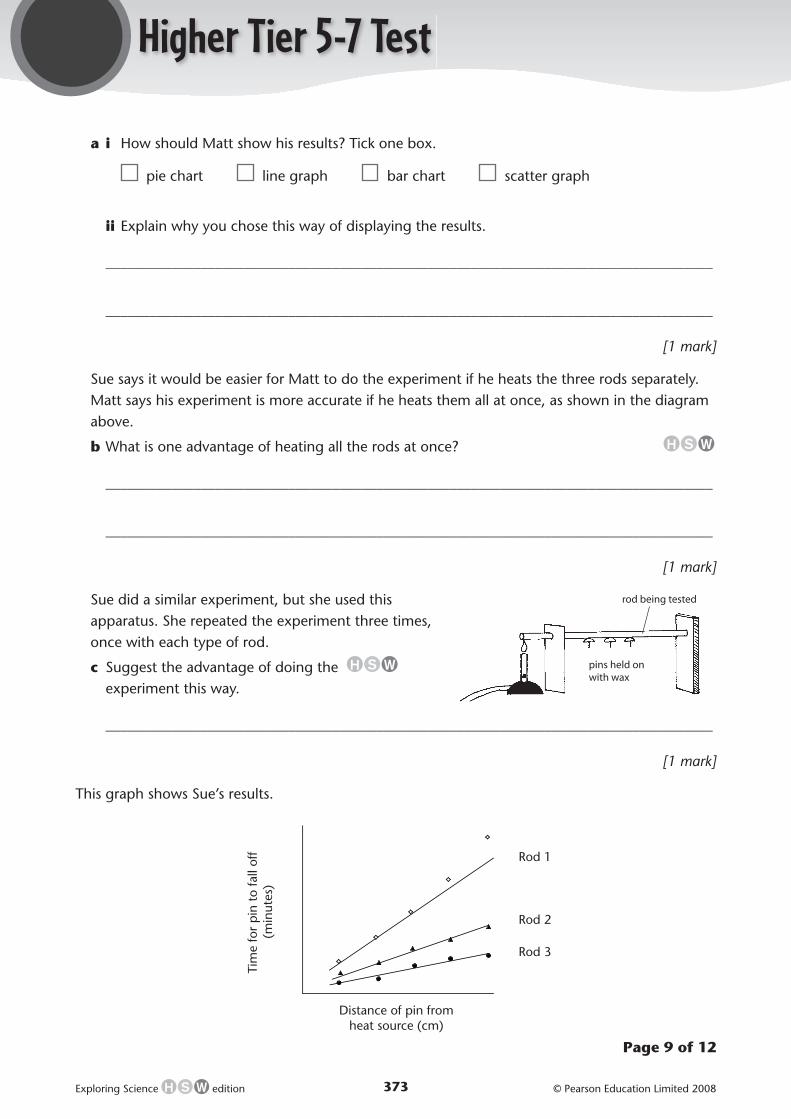
Sue did a similar experiment, but she used this apparatus. She repeated the experiment three times, once with each type of rod.
c Suggest the advantage of doing the experiment this way.
___________________________________________________________________________________
[1 mark]
This graph shows Sue’s results.
rod being tested
pins held on with wax
Tim
e fo
r p
in t
o fa
ll of
f(m
inut
es)
Distance of pin from heat source (cm)
Rod 1
Rod 2
Rod 3
Page 9 of 12
Exploring Science edition © Pearson Education Limited 2008374
Higher Tier 5-7 Test
d Sue tested a copper rod, a glass rod and an iron rod. Sue found out from a textbook that copper is a better conductor of heat than iron.
i Which number represents the copper rod? ____________________________________
ii Explain why you chose this line.
___________________________________________________________________________________
___________________________________________________________________________________
[1 mark]
e Suggest why Sue’s results for Rods 1, 2 and 3 do not all lie on straight lines.
___________________________________________________________________________________
___________________________________________________________________________________
[1 mark]
f What is the advantage of drawing a line of best fi t through each set of results?
___________________________________________________________________________________
___________________________________________________________________________________
[1 mark]
g Suggest why the results for Rod 1 bend away above the graph line for the pins that are further from the source of heat.
___________________________________________________________________________________
___________________________________________________________________________________
h Do you think that Sue has enough evidence to say which of these three materials is the best conductor of heat? Explain your answer.
___________________________________________________________________________________
___________________________________________________________________________________
[1 mark]
Page 10 of 12
Exploring Science edition © Pearson Education Limited 2008375
Higher Tier 5-7 Test
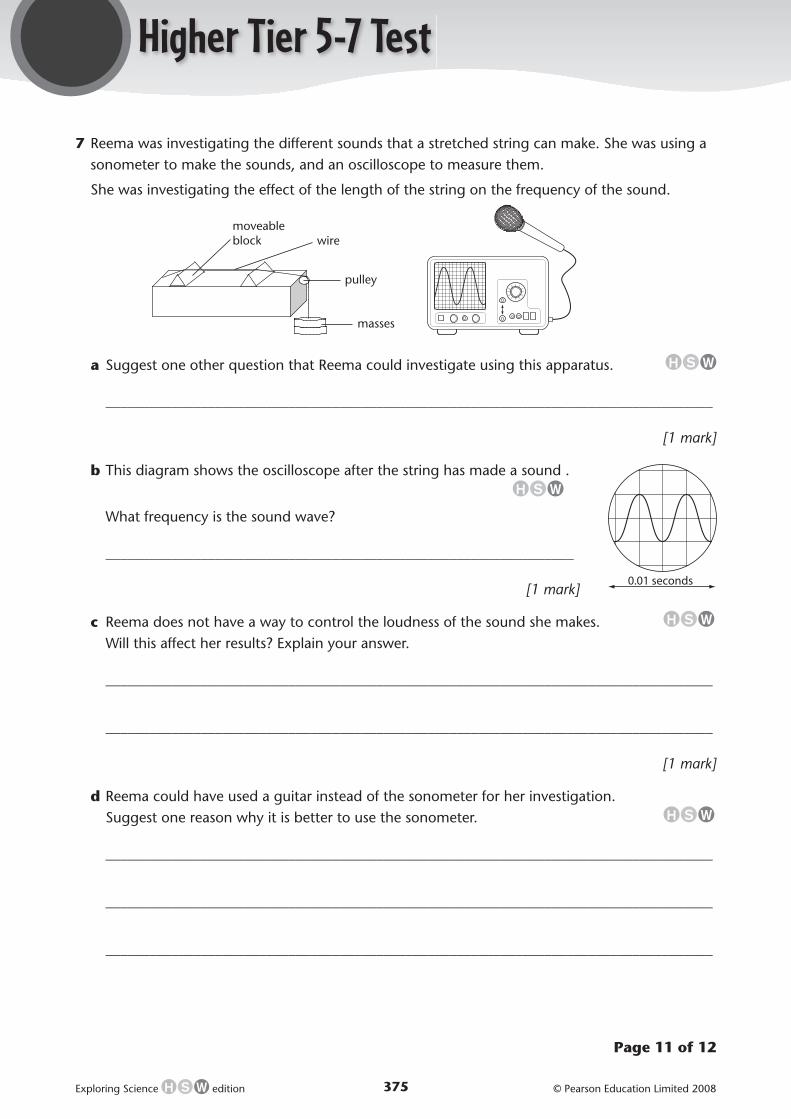
7 Reema was investigating the different sounds that a stretched string can make. She was using a sonometer to make the sounds, and an oscilloscope to measure them.
She was investigating the effect of the length of the string on the frequency of the sound.
a Suggest one other question that Reema could investigate using this apparatus.
___________________________________________________________________________________
[1 mark]
b This diagram shows the oscilloscope after the string has made a sound .
What frequency is the sound wave?
________________________________________________________________
[1 mark]
c Reema does not have a way to control the loudness of the sound she makes. Will this affect her results? Explain your answer.
___________________________________________________________________________________
___________________________________________________________________________________
[1 mark]
d Reema could have used a guitar instead of the sonometer for her investigation. Suggest one reason why it is better to use the sonometer.
___________________________________________________________________________________
___________________________________________________________________________________
___________________________________________________________________________________
moveable block wire
pulley
masses
0.01 seconds
Page 11 of 12
Exploring Science edition © Pearson Education Limited 2008376
Higher Tier 5-7 Test
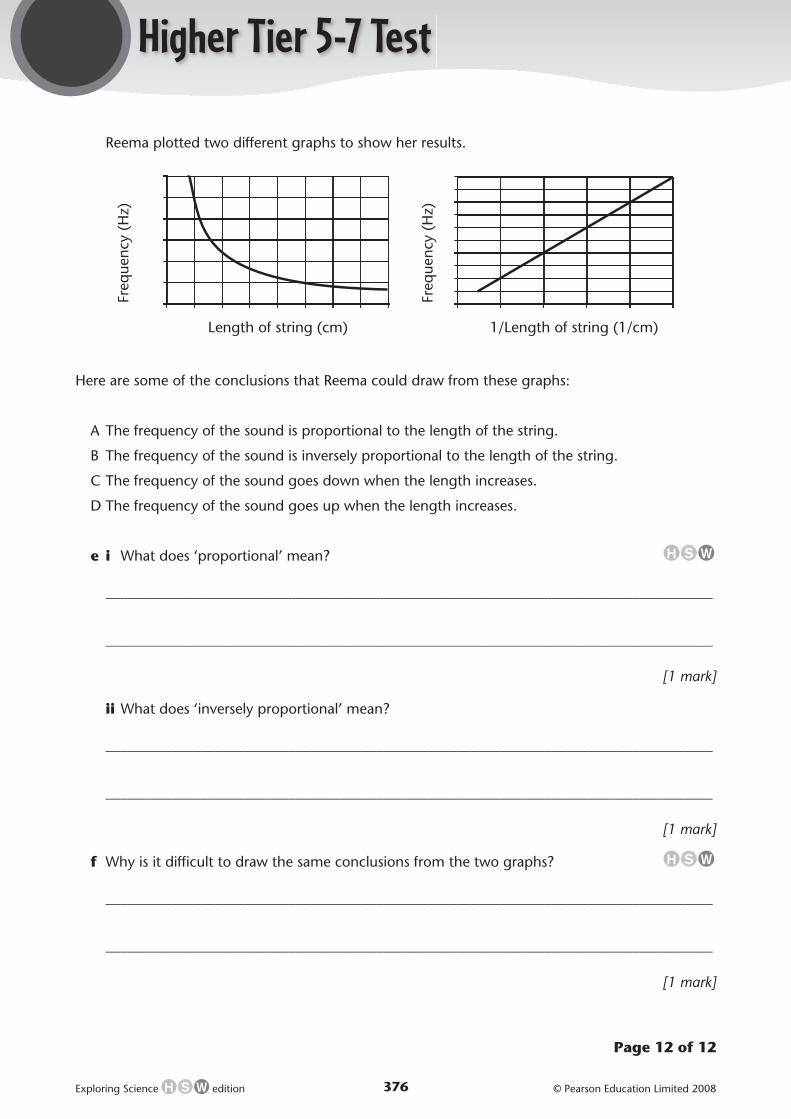
Reema plotted two different graphs to show her results.
Here are some of the conclusions that Reema could draw from these graphs:
A The frequency of the sound is proportional to the length of the string.
B The frequency of the sound is inversely proportional to the length of the string.
C The frequency of the sound goes down when the length increases.
D The frequency of the sound goes up when the length increases.
e i What does ‘proportional’ mean?
___________________________________________________________________________________
___________________________________________________________________________________
[1 mark]
ii What does ‘inversely proportional’ mean?
___________________________________________________________________________________
___________________________________________________________________________________
[1 mark]
f Why is it diffi cult to draw the same conclusions from the two graphs?
___________________________________________________________________________________
___________________________________________________________________________________
[1 mark]
Length of string (cm) 1/Length of string (1/cm)
Freq
uenc
y (H
z)
Freq
uenc
y (H
z)
Page 12 of 12