highlighting trends in the south african mining industry ... › en › assets › pdf ›...
TRANSCRIPT

www.pwc.co.za/mining
SA Mine5th edition
Highlighting trends in the South African mining industry
November 2013

The information contained in this publication is provided for general information purposes only, and does not constitute the provision of legal or professional advice in any way. Before making any decision or taking any action, a professional adviser should be consulted. No responsibility for loss to any person acting or refraining from action as a result of any material in this publication can be accepted by the author, copyright owner or publisher.

Contents
1 6
2 7
3 8
4 9
5
Executive summary
1
Boardroom dynamics
39
The South African mining industry
5
Financial performance
41
Integrating risk into business strategy
17
Glossary
55
Safety
29
Companies included in the analysis
59
Improving value to stakeholders
33 10About PwC
63

1 Highlighting trends in the South African mining industry

PwC 1
1. Executive summary

2 Highlighting trends in the South African mining industry
Highlights
Current year R ’billions
Prior year R ’billions
Difference R ’billions
% change
Revenue from ordinary activities
332 330 2 0%
Adjusted EBITDA
92 123 (31) (26%)
Impairment charge
25 2 23 1485%
Net profit 25 68 (43) (64%)
Distribution to shareholders
30 35 (5) (14%)
Net operating cash flows
74 112 (38) (34%)
Capital expenditure
73 67 6 9%
Total assets 694 659 35 5%
Welcome to the fifth in our series of publications highlighting trends in the South African mining industry.
The significant decrease in profitability of the industry resulted in a substantial contraction in market capitalisation of South African mining stocks. This decrease is in line with global mining counterparts who are also struggling with higher costs and lower prices.
A weakening rand over the period somewhat shielded the South African mining industry from the decline, with rand prices remaining relatively flat. Unfortunately, flat prices will not support the industry’s significantly increased cost base.
Generally, balance sheets remained strong, with stable liquidity. However, increased gearing was needed for companies to fund sustaining capital expenditure and in some cases operating losses. The R25 billion impairment provisions raised highlights the difficulty to make long term decisions in volatile markets.
The mining industry still adds significant value to the South African economy with regards to GDP contribution, employment, tax and export revenues. The importance of this contribution was recognised by the willingness of government, labour and business to sign a framework agreement to support the sustainability of the industry. Leadership will be required from all stakeholders to ensure long-term optimisation of the industry as opposed to the threat of instant gratification claims by stakeholders.
It is imperative that mining companies rethink risk and the risk landscape in which they operate, as gone are the days when risks for mining companies were limited to health and safety matters.
Mining companies now need to integrate risk and performance management and they need to evolve risk management to be more predictive in order to anticipate and plan for potential negative events.
Safety statistics underline the long-term focus on safety and the resulting improvements achieved.
The 2013 financial year was marred by labour unrest leading up to and following the Marikana tragedy. In addition, local cost pressures, lower production and international demand weakness resulted in shrinking margins and wide ranging impairment provisions.

PwC 3
We trust you will find this publication to be of value and look forward to sharing future trends with you. We would appreciate any feedback you may have to share with us.
Scope
Our findings are based on the financial results of mining companies with a primary listing on the Johannesburg Stock Exchange (JSE), as well as those with a secondary listing on the JSE whose main operations are in Africa.
We only included companies with a market capitalisation of more than R200 million at the end of June 2013 and excluded companies with suspended listings. In all, 37 companies met these criteria. Section 9 provides a list of all mining companies included in this report.
Our selection criteria excluded global mining companies Anglo American1 and BHP Billiton. Although both of these companies have South African roots, their global exposure and size mean that they do not necessarily reflect trends in the South African mining environment.
While many of the entities that are included also have international exposure, the bulk of their operations are in Africa. A global view on mining is provided in our Mine: A confidence crisis publication.2
Wescoal Holdings Limited and Sibanye Gold have been included for the first time in the 2013 publication, although the Sibanye results were previously incorporated in Gold Fields’ results.
Hwange Colliery Company and Forbes & Manhattan Coal have been excluded, as their market capitalisation has declined below the threshold noted above. First Uranium Corporation has been excluded as it has disposed of all its operations. Great Basin Gold has also been excluded as a result of its suspended listing.
The findings of this report are based on publicly-available information, predominantly annual reports, for financial years ending no later than 30 June 2013. Where annual reports were not available, we have used preliminary reviewed results.
Hein Boegman African Mining Leader
Andries Rossouw Project Leader
1 Kumba Iron Ore and Anglo American Platinum are included in our analysis.
2 http://www.pwc.com/gx/en/mining/publications/mining/mine-a-confidence-crisis.jhtml

4 Highlighting trends in the South African mining industry4 Highlighting trends in the South African mining industry

PwC 5
2. The South African mining industry

6 Highlighting trends in the South African mining industry
Market capitalisation
The 2013 financial year saw a continued decrease in the market capitalisation of mining companies. The market capitalisation for the top 37 companies analysed in this publication declined by 28% from R833 billion to R597 billion at 30 June 2013.
Gold mining companies were the hardest hit, losing R109.6 billion (48%) of their market capitalisation following the decline in the gold price. The biggest contributors to the decrease were AngloGold Ashanti, Gold Fields and Harmony.
After gold, platinum mining companies lost R75.8 billion (29%) of their market capitalisation. The biggest contributors to the decrease were Anglo American Platinum and Impala Platinum.
Figure 1: Market capitalisation by commodity
Source: PwC analysis
Diversified mining companies’ contribution to market capitalisation have continued to increase over the last number of years.
Market capitalisation of the top 10 declined by R228.9 billion (30%) to R544.6 billion. The bulk of the top-10 companies saw their market capitalisation decline with the exception of Lonmin and Assore, which have grown in value since 2012.
Although the composition of the top 10 remained consistent, the gold producers moved down the order with AngloGold Ashanti and Harmony both dropping one place. Gold Fields dropped two positions after unbundling its Sibanye Gold assets. Combined, these gold assets would only have dropped one position. There were no other changes in companies’ rankings.
2012
2013
27%
20%
40%
47%
2%
Other
2%
Platinum
Diversified
Gold
31%31%

PwC 7
Figure 2: Market capitalisation of the top-10 mining companies (R ‘billions)
Source: Business Day
Market capitalisation of the 37 companies improved after 30 June 2013 and as at 30 September 2013, had increased by 19% to reach R708.7 billion.
The top 10 also improved their overall market capitalisation during this period. However, Gold Fields and Harmony lost further ground with Harmony dropping out of the top 10 and being replaced by Northam Platinum.
The scale of the challenges facing the industry is reflected in the relative decline in the JSE Mining Index in comparison to the JSE All Share Index over the last two years. Despite the JSE All Share Index reaching record levels and the exchange posting steady increases in overall market capitalisation since 2010, the market capitalisation of the mining sector has declined.
30 June 2012 30 June 2011
30 June 201330 September 2013
Harmony Gold
Lonmin
African Rainbow Minerals
Gold Fields
Assore
Exxaro Resources
AngloGold Ashanti
Impala Platinum
Anglo American Platinum
Kumba Iron Ore 148149
177156
11880
131165
7859
85115
5454
107109
5952
6864
6145
4231
3438
7571
4332
3640
3022
2032
1516
3339

8 Highlighting trends in the South African mining industry
Figure 3: Market capitalisation: Mining vs JSE
June 2011 = 100
Source: I-Net Bridge
Although the challenging local mining environment, particularly relating to labour, played a role in the decrease in market capitalisation, a significant contributor was the global economic environment.
The impact of the global economic environment on the mining industry is apparent when one compares the movements of the HSBC Global Mining Index to the JSE Mining Index in US-dollar terms. There is an almost perfect correlation between these indices with variances almost exclusively explained by price movements in the different baskets of commodities. The only exception is the period from August to October 2012, when the tragic Marikana violence and its aftermath resulted in the JSE Mining Index dipping below the Global Mining Index.
Figure 4: JSE Mining Index vs HSBC Global Mining Index
June 2011 = 100
Source: I-Net Bridge
40
60
80
100
120
140
160
Sep2013
Jun2013
Mar2013
Dec2012
Sep2012
Jun2012
Mar2012
Dec2011
Sep2011
Jun2011
JSE All Share Index JSE Mining Index
40
50
60
70
80
90
100
110
Sep2013
Jun2013
Mar2013
Dec2012
Sep2012
Jun2012
Mar2012
Dec2011
Sep2011
Jun2011
HSBC Global Mining Index JSE mining index (USD based)

PwC 9
Contribution by commodity
Figure 5: Percentage of mining revenue per commodity 2012 vs 2013
Source: Stats SA
Despite a price decrease, coal maintained its strong position as the leading South African mining commodity revenue generator.
The increase in the rand price of platinum was offset by lower sales volumes resulting in revenue consistent with the previous year. However, the overall decrease in mining revenue resulted in an increase in share for platinum revenues.
The decrease in gold production more than offset the increase in average gold price achieved for the year.
Iron ore recorded its first decrease in revenue in the last 10 years. The decrease was the result of an average 5% lower iron ore price and lower sales despite good production.
Figure 6 depicts the relative breakdown of revenues per commodity for the 12 months to June. The long-term increase trend was mainly rand price driven and was partially offset by lower production.
In the last year, the mixed bag of rand price increases and decreases could not offset the general decrease in production volumes (as shown in Figure 13), resulting in a decrease in overall revenue.
2012
2013
19%17%
21%
22%
12%
Iron ore
13%
PGMs
Coal
Other
22%20%
Gold
26%
28%

10 Highlighting trends in the South African mining industry
Figure 6: Annual mining revenue per commodity (R ‘billions)
Source: Stats SA, PwC analysis
Figure 7: Annual revenue per commodity (R ‘billions)
Source: Stats SA, PwC analysis
Iron ore
GoldPGMsCoal
2013
2012
2011
2010
2009
2008
2007
2006
2005
2004
Other
345.4
358.4
310.2
233.5
242.2
236.5
196.3
137.6
110.5
105.2
201120122013
Other
Iron ore
Gold
PGMs
Coal
96
94
77
77
77
82
70
78
58
59
67
55
43
43
39

PwC 11
A slowdown in prices
We calculated real rand prices for commodities by applying mining unit cost inflation to rand commodity prices. Of the three main revenue-generating commodities in South Africa, gold is the only commodity to have gained in real rand terms over the last 10 years. Many would argue that that is merely a result of artificially low gold prices in 2002 and 2003. The price of coal, despite significant volatility above 2003 price levels, is back where it was 10 years ago, while platinum is experiencing the same low prices it suffered after its price collapsed in 2008.
Figure 8: Indexed real rand prices per commodity
June 2003 = 100
Source: World Bank, PwC analysis
The financial challenge faced by mining companies is apparent in the decreases in real rand prices. Gold has dropped by more than 32% since it achieved a 10-year high in the previous financial year. Similarly, platinum has proceeded to fall to its lowest real price in the last decade with a 31% decline on its highest price since 2008. Coal dropped by 45% from its 2011 high.
Real prices are lower as a result of the significant cost pressures, subdued global demand, partially offset by the weaker rand. Not factored into these real prices, and often overlooked by investors, is the increased cost of capital expenditure required to maintain production.
Although there are still demand-side pressures on prices, these low price levels are not sustainable. This is especially true for platinum where South Africa supplies more than 70% of global primary production.
Mining companies have an ever-diminishing capacity to continue absorbing operational cash outflows in unprofitable operations. A decline in local production as a result of closure of marginal mines, lack of new and sustaining investment and more expensive deeper mines will add significant supply-side upward pressure on prices.
0
50
100
150
200
250
300
350
400
450
Jun-13Jun-12Jun-11Jun-10Jun-09Jun-08Jun-07Jun-06Jun-05Jun-04Jun-03
Coal Platinum Gold

12 Highlighting trends in the South African mining industry
Judging by the significant growth in platinum-backed exchange-traded funds (ETFs), this view seems to be shared by investors. Realising these investments and unknown quantities of inventory held by consumers will initially offset excess demand requirements and could assist in reducing volatility when demand-side growth resumes.
Even for gold and coal, where South Africa contributes a smaller portion of global supply, it is likely that supply-side cost pressures that are not unique to South Africa may also ensure a recovery in prices.
Figure 9: Indexed USD prices per commodity (July 2010 = 100)
July 2010 = 100
Source: World Bank, PwC analysis
While the 2009-2011 period was characterised by a recovery in overall commodity prices from the lows of the 2008 financial crisis, 2012 saw a slowdown in this recovery with gold being the only commodity to gain value.
In 2013, gold gave away all its gains of the last three years. A weakening rand over the period somewhat shielded the South African mining industry from this decline with rand prices remaining relatively flat and actually increasing in 2013.
Unfortunately, flat prices will not support the industry’s significantly increased cost base. The weaker rand is also likely to add to inflationary cost pressure, which means that there will only be temporary respite.
70
80
90
100
110
120
130
140
150
Sep-13Jun-13Dec-12Jun-12Dec-11Jun-11Dec-10Jul-10
Coal Platinum Gold Iron ore

PwC 13
Figure 10: Indexed ZAR price per commodity (July 2010=100)
July 2010 = 100
Source: World Bank, PwC analysis
Platinum price: a basket case?
Although the platinum price already reflects the pressure the platinum industry is experiencing, the reality is that the situation is actually worse than it appears.
Platinum mining companies generally generate revenue from five platinum group metals (PGMs): platinum, palladium, rhodium, ruthenium and iridium. In addition, revenue is also generated from products such as gold, nickel, copper, cobalt and chrome.
The basket price reflecting total revenue from these metals per platinum ounce is the true indication of a platinum company’s ability to generate revenue. This price is not only dependent on the individual prices of each commodity, but also on the commodity content extracted.
In South Africa, the Merensky Reef, UG2 Reef and Plat Reef are mined. In the current price environment, Merensky has the most profitable basket price. Unfortunately, most platinum companies have mined out most of their shallow Merensky and are now producing from the less-profitable UG2 or deeper Merensky. The result is a decrease in revenue for the same tonnes mined.
In Figure 11, we calculated an indicative basket price for platinum, palladium, rhodium and nickel, which make up more than 92% of PGM producers’ revenues. This basket price does not include revenue generated from iridium, ruthenium, gold, copper, cobalt, chrome and other by-products.
The calculation is based on the aggregated production of the four largest PGM producers included in the analysis for the 12 months to June 2013.
To demonstrate the negative impact of the change in reef mix, we also calculated the basket price using the production for these entities for the
70
90
110
130
150
170
190
Sep-13Jun-13Dec-12Jun-12Dec-11Jun-11Dec-10Jul-10
Coal Platinum Gold Iron ore

14 Highlighting trends in the South African mining industry
12 months ending June 2008.
Figure 11: Indicative platinum basket price of the four main revenue generating PGMs
USD/Ptoz 2013production basket
USD/Ptoz 2008production basket
1 500
2 000
2 500
3 000
Sep-13Jun-13Jun-12Jun-11Jun-10Jun-0910 000
15 000
20 000
25 000
R/Ptoz 2013production basket
R/Ptoz 2008production basket
US
D
ZA
R
Source: PwC analysis
The annual effective growth rate in rand terms for these five years was only 5.8%. Considering the decrease in total production and the significant increase in costs makes the challenge faced by the platinum industry all the more apparent.
Production
Iron ore is still the only commodity with significant production gains over the last 10 years. Flat production in 2013 was a result of strike action and a ramp up of new production replacing old production. With new mines ramped up, production is likely to remain at these levels subject to sufficient demand.
Gold production continued to decline. The decline in gold production is indicative of the ever-increasing depths of existing mines, technical difficulties experienced by start-up operations and a continually growing cost base. The recent decrease in the gold price is likely to put
further pressure on production as marginal mines are mothballed.
PGM production has been severely impacted by industrial action in the last two years and by mine closures in the low price environment. However, supply and demand fundamentals should improve the price environment and result in increased production in the long term. The lack of and deferral of investment in platinum mines and the long lead time in increasing production would probably negate any significant medium-term increases to production levels in excess of the 2008 levels.
Coal had a solid performance over the last 10 years with marginal increases in production in the last two years. Investment in export infrastructure should assist in an increase in coal production as long as coal prices do not deteriorate further.
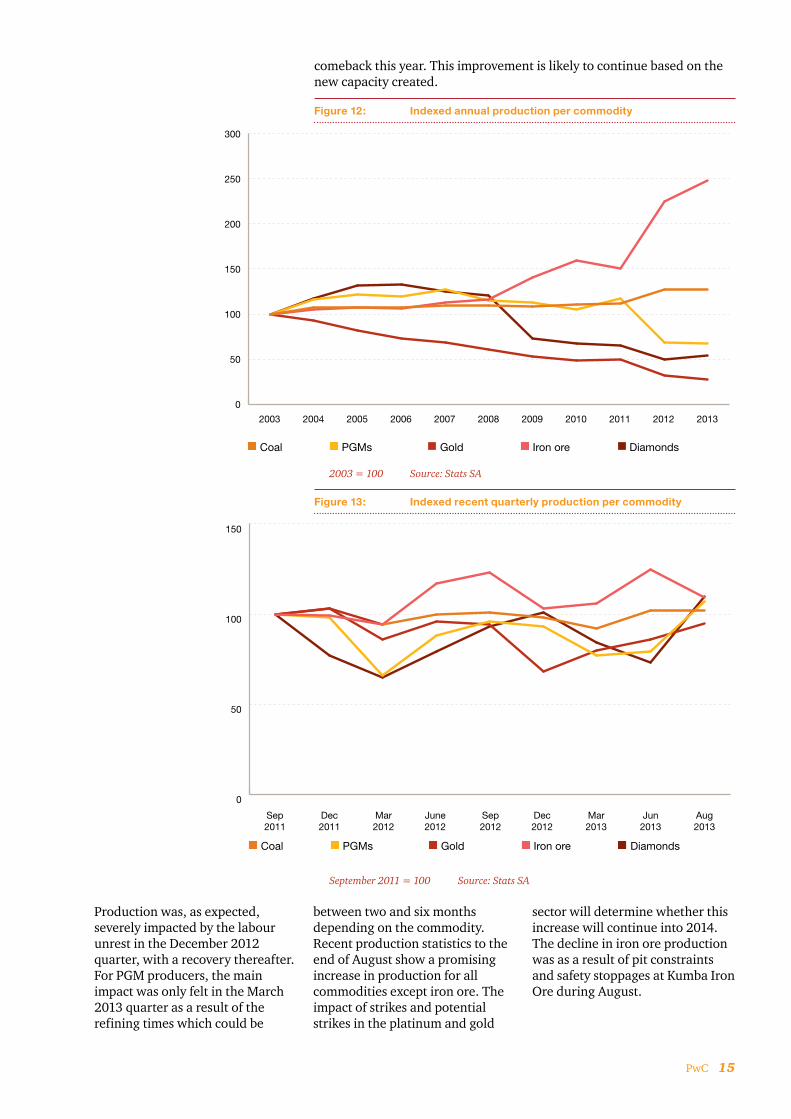
Diamonds, which were the most severely impacted by the global economic crises and pressure on disposable income, made a
PwC 15
comeback this year. This improvement is likely to continue based on the new capacity created.
Figure 12: Indexed annual production per commodity
2003 = 100 Source: Stats SA
Figure 13: Indexed recent quarterly production per commodity
0
50
100
150
200
250
300
Coal PGMs Gold Iron ore Diamonds
2003 2004 2005 2006 2007 2008 2009 2010 2011 2012 2013
0
50
100
150
Coal PGMs Gold Iron ore Diamonds
Sep2011
Dec2011
Mar2012
June2012
Sep2012
Dec2012
Mar2013
Jun2013
Aug2013
Production was, as expected, severely impacted by the labour unrest in the December 2012 quarter, with a recovery thereafter. For PGM producers, the main impact was only felt in the March 2013 quarter as a result of the refining times which could be
between two and six months depending on the commodity. Recent production statistics to the end of August show a promising increase in production for all commodities except iron ore. The impact of strikes and potential strikes in the platinum and gold
sector will determine whether this increase will continue into 2014. The decline in iron ore production was as a result of pit constraints and safety stoppages at Kumba Iron Ore during August.
September 2011 = 100 Source: Stats SA

16 Highlighting trends in the South African mining industry16 Highlighting trends in the South African mining industry

PwC 17
3. Integrating risk into business strategy

18 Highlighting trends in the South African mining industry
Risks facing the mining industry
Mining companies have traditionally been good at disclosing the risks they face but linking performance and risk management in practice remains a challenge.
Significant industry risks include volatile commodity prices, labour unrest and rising costs. Large impairments due to underperforming assets and capital projects have been a recent feature of mining financial results. These have prompted companies to implement cost management and cash preservation strategies, which have resulted in retrenchments and difficult wage negotiations. There is resulting uncertainty regarding the sustainability of some industry sectors.
In the prior year, the most commonly-disclosed risks related to the regulatory, political and legal environment, followed closely by employee skills and safety. While these remain relevant, the changing risk landscape has shifted priorities to managing labour unrest, price volatility and financial sustainability as a result of cost pressures.
The table below shows the top risk categories disclosed by companies and is not intended to be a comprehensive list of risks:
Top risk categories disclosed by companies
Risks Mitigation strategies
Labour unrest
The industry has seen an increase in labour unrest and violent strike action over increased wages and employment conditions. Inter-union rivalries have exacerbated already difficult wage negotiations.
Ongoing business disruptions and work stoppages lead to significant production and other losses.
• Formalising relations with trade unions.
• Increased focus on direct communication with employees.
• Engagement with stakeholders including the Chamber of Mines, government and labour representatives to find sustainable solutions to industrial relations challenges.
Socio-economic impact
Mining developments have led to an influx of workers to surrounding communities, attracted by the prospect of direct or indirect employment.
The scale of the influx combined with a lack of service delivery, the use of housing benefits for other purposes and slow progress on social upliftment projects has resulted in a reality which falls well short of community expectations.
• Implementing comprehensive stakeholder engagement programmes to improve understanding socio-economic problems, integrating solutions into social and labour plans and maintaining open communication to address expectation gaps.
• Better co-ordination of social upliftment programmes by stakeholders.
Volatile commodity prices and foreign exchange fluctuations
The market price for commodities continues to be very volatile due to global economic conditions that are beyond the control of South African companies. This creates uncertainty and could have a negative impact on revenue, cash flows, profitability and asset values.
Transactions denominated in foreign currencies expose companies to exchange rate fluctuations.
• Identification and implementation of cost cutting and efficiency measures. As prices are largely outside management’s control, cost performance has become a key measure of management performance.
• Extensive business reviews and restructures.
• Close monitoring of the rand/dollar exchange rate to allow early responses.
Energy cost increases and power fluctuations
Power shortages remain a key problem hindering growth in the mining sector, negatively affecting production and employee safety. Mining operations are dependent on electricity supplied by the State-owned power generating company.
Energy prices are likely to continue to rise significantly as the electricity provider is authorised to raise prices by an average of 8% in each of the next five years.
• Minimise energy and water consumption by promoting efficient processes and adopting appropriate technologies.
• Identifying and removing bottlenecks and wasteful activities.

PwC 19
Risks Mitigation strategies
Safety and employee health
Failure to achieve high safety levels may result in safety stoppages in terms of Section 54 of the Mine Health and Safety Act. This impacts employee welfare, production and a company’s licence to operate.
Exposure to noise and dust are significant occupational health risks, especially given historic silicosis claims in the industry.
• Regular safety awareness campaigns and implementation of safety transformation programmes.
• Linking of safety results to remuneration.
• Enhanced reporting systems.
• Medical surveillance performed in compliance with legislation.
Loss of social licence to operate
Non-compliance with Social and Labour Plan (SLP) approved targets may lead to mining licences being suspended or cancelled.
• Driving existing SLP programmes to comply with or exceed the Mining Charter requirements.
• Proactive socio-economic activities in communities in which companies operate.
• Deliver on SLP projects on time and in full.
• Align contractors with SLP requirements.
Resource nationalism and regulatory uncertainty
Increased state intervention in the mining sector is evident as it seeks to increase income from the sector. This includes resource nationalism, taxes and export levies that impact on financial performance and may discourage investment.
The Government has confirmed an intention to increase taxation and otherwise raise revenue.
In the run-up to the 2014 national elections, the Government has shown in principle support for a windfall tax on miners. A windfall tax was proposed as a funding option for social welfare programmes in South Africa (refer to the State Intervention in the Minerals Sector (SIMS) document adopted at the ANC’s 2012 Mangaung National Conference).
• More transparent communication with government / regulators in an effort to create a better understanding of the sector’s challenges and profitability.
• Enhanced measurement and communication of local economic share value contributions.
• Communication of strategy to broad spectrum of stakeholders.
Infrastructure
Lack of or insufficient infrastructure capacity, access, development and funding may lead to lost opportunities and financial losses as well as decreased competitiveness and market share. Future sustainability and growth depends on infrastructure development keeping pace with demand.
• Identification of other stakeholders to co-develop a solution with shared benefits and to extend infrastructure.
• Collaboration with government and other stakeholders on a plan to improve and align existing infrastructure and take on new initiatives.
Events that stop or delay production
Factors which potentially hinder the achievement of production and growth targets include unexpected geological conditions, logistical constraints, labour relations, and compliance with environmental legislation.
This may result in significant increases in construction costs or delays in construction, regulatory interventions, work stoppages, increased production costs and increases in liabilities. This could lead to contract breaches and subsequent reputational damage.
• Management oversight of operational and project performance through regular briefings.
• Increased effectiveness of procurement activities.
• Accelerate business improvement for current projects.
• Regular interaction with unions and other stakeholders.

20 Highlighting trends in the South African mining industry
Other risks
In addition to the generic risk areas identified above, we now highlight specific risks that we expect to be topical in the coming year:
• Short-term gratification versus long-term sustainability;
• Attractiveness for foreign direct investment;
• Labour capacity and capability;
• Compliance with the Mining Charter; and
• Availability of economically-viable gold reserves in South Africa.
Alignment of stakeholder interests
The risk of stakeholders pursuing maximisation of short-term gratification at the expense of longer-term sustainability and value is real as manifested by:
• Demand for higher dividends instead of reinvestment;
• Government drive to maximise short-term tax revenue;
• Organised labour demands for excessive salary increases, unconnected to increased productivity or long term viability;
• Unions competing for a larger share of the existing workforce instead of looking for solutions which secure existing jobs and grow the workforce;
• Management incentives which drive short-term profit targets at the expense of longer-term profits; and
• Communities demanding short-term benefits instead of deriving the longer-term social advantages of improved infrastructure and education.
Leadership will be required from all stakeholders to ensure the long-term optimisation of the industry.

PwC 21
Losing out to other regions for foreign direct investment
South Africa has an unparalleled resource base and should be very attractive to foreign direct investment. However, the capital required to develop its mineral resources is significant. Recent adverse publicity has had a negative impact on investor sentiment.
Various surveys which measure aspects of a country’s attractiveness to foreign investors are discussed below.
In its Global Competitiveness Report 2013-2014, the World Economic Forum rated South Africa 53rd of 148 countries in terms of competitiveness. On the positive side, South Africa did well on measures of the accountability of its private institutions (2nd), financial markets (3rd), efficiency of the legal framework (13th), intellectual property protection (18th), property rights (20th), challenging and settling disputes (12th), efficiency of the market for goods and services (28th), business sophistication (35th) and innovation (39th). However, there were governance concerns relating to the wastefulness of government spending (79th), lack of general public trust in politicians (98th), diversion of public funds (99th) and security concerns (109th).
The main concern in terms of competitiveness related to the volatility of the labour market. Industrial action in the mining sector over the last two years underlines these concerns, with labour market efficiency (116th), health of the labour force (133rd), wage flexibility (144th), quality of the education system (146th), rigid labour legislation (147th) and labour and employer relations (148th) highlighting serious challenges facing the country.
The Fraser Institute’s annual Survey of Mining Companies 2012/2013 includes national policies and mineral resources in its assessment of the perceptions of the mining companies surveyed. Survey findings are impacted by individual experiences and sentiments which have a powerful influence on investment decisions. According to the survey, South Africa ranked 64th out of 96 jurisdictions for policy potential and 77th for mineral potential, assuming current regulations and land use restrictions.
The survey findings correlate with the decline in foreign direct investment (FDI) in South Africa, illustrated in Figure 12. Leading up to 2008, FDI in all developing economies, and especially Africa, benefited from the global commodities boom. This was followed by a decline after the 2008 financial crisis, with lows reached in 2010 and a subsequent recovery. Unfortunately, in the second half of 2012 South Africa lost a significant amount of FDI following the Marikana tragedy and ensuing industry-wide labour disputes. Despite total FDI growth for Africa in 2012, South Africa’s inbound FDI decreased.

22 Highlighting trends in the South African mining industry
Figure 14; Foreign direct investment in Africa ( USD millions)
Source: World Investment Report 2013
Threats to jobs
According to the Department of Labour, in the 12 months to June 2013 theminingindustryshedmorethan20 000jobs(seeFigure20).Moreretrenchments could follow given low margins, ongoing cost pressures and volatility in commodity prices. As a percentage of total, South Africa’s labour costs are among the highest globally. Among the major South African producers, labour costs average around 45%, with deep-level underground mines above 50%. In other mining territories, labour generally makes up 30%-40% of total expenses.
Recently agreed multi-year wage agreements should ensure stability but a higher labour cost base will pressurise margins and threaten the sustainability of marginal mines. Companies will look at ways to reduce their wage bill or to increase output with the same wage input. There is a high likelihood of further job losses through natural attrition and retrenchments on mine closures.
Additional retrenchments would increase pressure on the relationship between mining companies and trade unions. Competition for membership between the National Union of Mineworkers (NUM) and the Association of Mineworkers and Construction Union (AMCU) will further exacerbate these difficulties as they compete in demanding wage increases.
The impact of more job cuts would further worsen community sentiment towards mining companies.
0 10 000 20 000 30 000 40 000 50 000 60 000 70 000
East Africa
Central AfricaWest AfricaNorth Africa
South Africa Southern Africa excluding South Africa
2012
2011
2010
2009
2008
2007
PwC 23
Migrant labour
The migrant labour system was identified as a long-term challenge in the framework agreement for a Sustainable Mining Industry entered into by business, labour and government under the leadership of Deputy President Kgalema Motlanthe in June 2013.
Mining companies have had to change traditional methods of engaging with labour and the communities in which they operate. Cyril Ramaphosa, senior politician, businessman and former trade union leader, has stated that the current turmoil in the mining industry was in large measure due to the result of its inability to attend adequately to the economic and social needs of the people most directly involved in the industry – the workers and the communities that hosted them. The migrant labour issue therefore has become synonymous with community issues.
Migrant labourers, mostly from the Eastern Cape and Lesotho, are not fully resident in the areas where they work and tend to migrate home on an annual basis. The impact of displacement has become an issue for mining companies as migrant workers are not fully invested in the local community. Living-out allowances created informal settlements as migrant workers often preferred to use the cash benefit for other purposes. In many cases, workers are supporting families in rural areas as well as second families in local communities around the mines. In turn, these communities have become dependent on migrant workers.
The decline in the mining industry and rising living costs have made the situation worse for migrant workers, who end up sending less money to their place of origin – creating a further social issue. One of the extremely negative results of the strikes has been a growing dependence on micro-lenders, which has seen many workers being subjected to garnish orders in a spiral of debt.
But some progress has been made. A recent study by researcher Kelly Forrest suggests that migrant labour has decreased since the apartheid era. Forrest says that today only 30% of all workers are migrant labourers, whereas the majority were migrant labourers in the 1970s. She believes the Mining Charter and the Immigration Act have contributed to the decline in migrant labour.
The challenges relating to the remaining 30% will remain in the short term. The migrant labour system requires modernisation. One option could be to allow migrant workers to return home more frequently, which would help ensure that the support to their families is more consistent and may help stabilise the family unit.
Mining companies have a key role to play, in conjunction with local government, in ensuring labour force stability by improving surrounding communities. Infrastructure and community development is essential to reduce dependency on migrant labour.
Compliance with the Mining Charter
Many South African companies have met or exceeded the Mining Charter requirements to be met by 2014. However, there is concern that these targets could be moved and, in the case of housing, may not be met.

24 Highlighting trends in the South African mining industry
One objective of the Mining Charter is to significantly improve mineworkers’ living conditions, which entails the conversion of existing single-sex hostels into family-friendly units and attaining a one-person-per-room occupancy rate. While many mines have made progress, others are still in the process of these conversions. Parliament’s mineral resources portfolio committee considers that the implementation of the Mining Charter requirement has generally been slow.
A lack of compliance could lead to suspension or cancellation of mining rights as contemplated in Section 47, and criminal sanctions in terms of Sections 89 and 99 of the Charter. Given the existing pressures of labour unrest and rising costs, investors would have cause for concern at penalties for non-compliance.
The President of South Africa called for state intervention to improve the living conditions of those residing in and around mining towns in his 2013/2014 State of the Nation Address and the Department of Human Settlements (DHS) has subsequently earmarked R1.6 billion for this purpose.
Decline in SA gold output
Recently, South Africa was overtaken by Peru and fell to sixth place in terms of gold production. An increase in rand gold prices over the last 10 years has shielded gold companies from the impact of cost increases to an extent.
Recent decreases in gold prices mean that the spot gold price is below the average cost of operating and sustaining capital expenditure. The sector will remain under serious pressure while this is the case.
Structural change to reduce the cost base for deep-level mines may be required to make gold mines more competitive unless technological advances come to the fore.
Platinum’s experience over the last five years is likely to be repeated in the gold industry if prices do not recover. South Africa does not have the same dominant position in gold production as is it does for other commodities and so is more vulnerable to negative price movements in the long term.
Mining disputes: Taking action, preventing problems
In our experience, mining houses are involved in a disproportionately high share of disputes compared to other industries. Disputes in the mining industry also tend to be higher in value due to the scale of the operations.
The concept of mining is relatively simple (though the practical activity is very scientific): identify a viable ore body, decide how to extract it and put the necessary infrastructure in place to take the ore to the end user. However, mining has become a very complex business, largely due to the unique dynamics of stakeholder engagement and expectation. The level of involvement of government, organised labour, communities, employer umbrella bodies and others in the supply chain is higher than in other business activities. The sensitivities around social consequences, protection of jobs and the environment are potential catastrophes if not well managed. A global rise in mineral resources nationalism has also added fuel to the mining fire.
24 Highlighting trends in the South African mining industry

PwC 25
The tendency for mine development to be greenfield and located in rural and under-developed communities is logical but adds to the complexity of planning, funding and getting projects into production. There’s no other industry where expectations of an employer to meaningfully contribute to the greater good, over and above providing much needed jobs, are as high. Mining is effectively already subject to super taxes every year – in the form of corporate social responsibility programmes, sponsorships and infrastructural improvements.
Labour disputes are particularly topical in the South African context. Industry insiders confidentially admit that they should have addressed this issue more proactively. It is astonishing that prior to the Marikana tragedy of August 2012, labour unrest did not feature among the priority concerns of the large mining houses and was not identified as a major risk in industry surveys. Executive compensation is a particular bone of contention, especially when compared to those of underground workers.
Disputes with governments over mining licenses and agreements, royalties and other taxes, particularly when there is a change in regime and the playing field, are not unusual. The relationship between big mining houses and government departments has also been fractious. Allegations of a lack of understanding and arrogance have resulted in a strictly regulated compliance environment.
Ownership of valuable mining rights has been contested in some high profile cases. Mining’s ‘licence to operate’ is a serious issue. Delays in bringing projects on line have led to serious impairments in some global players’ recent financial statements.
The mining industry is also in the unusual position of having a largely (up to 90%) rand denominated cost base and a US dollar income stream. Simply put, the industry is not only at the mercy of a global price, but its financial performance changes dramatically through an uncontrollable exchange rate factor. A weak rand is great news in the short run for mining companies, while a strong rand inevitably brings commercial disputes, particularly in contract mining, as the pie becomes too small to comfortably share. Breach of contract and warranty claims are also common in tougher economic cycles.
Furthermore, mines often operate on a joint-venture or multi-shareholder basis and the potential for arguments over cost allocations and commercial decisions is real. Business takeovers and amalgamations also lead to disagreements as the industry consolidates and there are different interpretations of sale agreements. Mines need roads, ports and other costly infrastructure and capital projects or EPC contracts are a common source of disputes, particularly when the economics change or things go wrong. Environmental protection, safety issues and closure costs also contribute to tensions and complexities in how mining companies are run.
So how do these complexities manifest themselves as business challenges? These issues result in various forms of legal dispute and social conflict which have real and measurable costs. The more obvious and direct ones are legal expenses, fines and delays in decisions being implemented. Less obvious costs can include reputational damage, management time, unrecovered fixed costs and a reduction in future profitability.
PwC 25

26 Highlighting trends in the South African mining industry
Easier said than done, steps mining companies can take to manage these issues proactively include:
• Avoid disputes. Contract sensibly and include appropriate dispute clauses. The devil really is in the detail a pricing escalation formula that is missing a bracket can be very expensive. Capital project disputes can be minimised through ‘front-end loading’.
• Negotiate honestly, posturing just takes time.
• Consider the bigger picture and don’t try to impose your solution. The long-term consequences could be much more serious.
• Implement a clear dispute policy, be responsible and follow good governance practices. Do not allow emotions, personalities or face saving to drive the dispute agenda. Where disputes are unavoidable, refer to King III and consider the alternatives for now and later, including third-party facilitation and dispute bodies. Attorneys may be required to enforce rights, but may not be the optimal first port of call.
• Analyse the dispute logically with decision trees and outcome probabilities.
• Manage expectations. Pressure on financial results should not be the motivator for how and when a dispute is resolved.
• Engage stakeholders in a genuine and timely fashion.
• Formalise any settlement clearly and precisely.
• Document why the interests of the parties involved have diverged and what could have been done to minimise the problem – ‘lessons learned’.
Disputes are a normal part of business and should be recognised as complex problems to be solved. Early identification of the commercial issues can save pain and money later.
Infrastructure in Zambia: a case study
A large number of South African mining companies are investing in the rest of Africa. The large value of impairment provisions raised by international mining companies in the remainder of Africa has once again highlighted the significant infrastructure requirements and challenges faced in these countries.
Although South Africa has experienced limitations regarding issues such as rail infrastructure, electricity and water, the local position is significantly better than in most mining countries in Africa. There is also a recognition of these shortcomings and a focus to address these.
On the back of global copper demand Zambia is also faced with growth limitations as a result of its infrastructure deficiencies. This case study looks at the challenges faced by Zambia and its efforts to address these.
Enhanced infrastructure key to unlocking growth potential
Zambia is Africa’s largest and the world’s seventh-largest copper producer. Copper mining has historically been the mainstay of the economy, contributing over 20% of GDP.
Zambia is also the world’s fourth-largest producer of cobalt, with other mining production including gemstones, ferrous metals, precious metals and industrial minerals. There is growing development of other resources such as emeralds.
Discovery of copper for commercial production took place in 1895 and it was finally commercialised in the 1920s. The mines were privately owned during the colonial period. Following Zambia’s independence in 1964,

PwC 27
the government of President Kaunda nationalised the entire mining industry. However, following a period of falling copper prices and stagnating production, the Zambian copper mining industry was privatised in the 1990s.
In 2012, copper production of 800 000 tons exceeded the previous peak achieved in 1972 of 700 000 tons, with projections that copper production should reach 1.5 million tons by 2016 on account of major new projects coming on-stream.
Infrastructure
Inadequate infrastructure is one of the key factors restraining development of the Zambian mining industry. The World Bank’s Global Competitiveness Report 2012-2013, ranks Zambia 118 out of 148 countries in terms of infrastructure quality, lagging behind other major African producers such as Ghana and South Africa. The challenges posed by the lack of infrastructure development can be summarised as follows:
• Smeltingcapacity
The Ministry of Mines acknowledges that smelting capacity will be insufficient to cater for the increased production coming on-stream by 2015. Current smelting capacity stands at 800 000 tons per annum with current projects expected to increase capacity to 1.2 million tons. This will leave an anticipated deficit of 300 000 tons. Further investment in efficient smelters is therefore essential.
• Roads
The Zambian economy is overwhelmingly reliant on road transport, which is currently the only reliable mode of transport for both freight and passengers. The relatively poor state of Zambia’s road network is exacerbated by serious damage caused by trucks carrying copper, other minerals and mining equipment. Given that Zambia is a large, landlocked country, this poses a barrier to further development in the mining sector.
The Zambian Government is implementing the Link Zambia 8000 road project, which aims to increase the capacity of the road network by undertaking 15 major road projects between 2012 and 2015 as well as upgrading existing routes.
• Rail
While rail transport is generally regarded as the most competitive means of transport for bulk commodities, the Zambian rail networks are currently unreliable and inefficient. Over the years, a lack of investment has led to a gradual deterioration in the rail network causing a fall in cargo traffic and a reduction in average speed from 60km/hr to 15km/hr.
The Zambian Government acknowledges these problems and has committed to enhancing the rail transport system. Part of the proceeds of a USD750-million Eurobond issued in 2012 has been invested in the rail sector. Progress to date includes the completion of the Chipata rail line connecting Zambia, Malawi and Mozambique. New and improved cargo trains are being acquired to facilitate transportation of minerals and other cargo to the ports in Dar es Salaam, Tanzania and Maputo, Mozambique.
There is scope to integrate the Zambian rail system further with the Democratic Republic of Congo’s mineral-rich Katanga region. Other potential improvements include a rail line to link the country to Walvis Bay, Namibia where Zambia has been granted access to build a dry port that could significantly enhance its access to export markets.
• Powersupply
Zambia is home to approximately 40% of the SADC region’s water resources and its power sector is dominated by hydro-electric power generation. Zambia’s hydro power resource potential is estimated at 6 000MW, but only around 1 900MW is currently utilised.
To support the energy supply infrastructure for mining activities, the Zambian Government established a private sector operator, Copperbelt Energy Corporation (CEC), to supply electricity to mines. CEC operates around 900km of transmission lines and 38 major substations. It obtains most of its supply from the state-owned power company, ZESCO.

28 Highlighting trends in the South African mining industry
CEC also generates 80MW from its own gas turbine generation facilities. This demonstrates that the private sector can make an important contribution in delivering the infrastructure needs of the Zambian mining sector. However, given that the domestic sector suffers from regular power shortages, it is imperative to encourage further investment in power supply to safeguard sustainable growth in the mining sector.
The power supply deficit is currently 250MW and will grow significantly without substantial investment. Another issue is the quality of supply, with current fluctuations having the potential to damage electrical equipment.
• Watersupply
The high demand for water in the mining sector for processes such as product dilution, extraction, heating, cooling, dust control and waste separation, poses a critical challenge for Zambia, which has low seasonal rainfall. Pipelines connecting mining and processing facilities with water resources are required.
About 40% of drinking water for Zambia’s major cities is derived from the Kafue River, which is also the destination for some mine effluent. Further investment is required to diversify water supply and undertake environmental protection. Such measures are critical to balance the demands of the domestic and mining sectors for water.
Outlook
It is imperative that the Zambian Government continues to prioritise the development of infrastructure to support economic growth in the mining and other sectors. This requires an integrated programme, including the following key elements:
• Innovativefundingforgovernmentprojects,buildingonthesuccessful2012Eurobondissuance.Thismustbeunderpinned by accountable and transparent expenditure on suitable projects in transport, power, water and other key infrastructure.
• EnhancedcooperationbetweentheGovernmentanditsinternationalpartnerstoensurethatexternalfunding for infrastructure projects are focused on key strategic priorities including enhancing road/rail connectivity to major regional ports.
• Encouragingfurtherprivateinvestmenttobuildonthesuccessfuloperationofprivate-sectorpowersupplytothe mining sector.
• Theminingsectorshouldbeabletorelyonapredictabletaxregime,includingappropriateincentivesfor investment such as duty-free importation of capital equipment and enhanced capital allowances for prospecting and exploration.

PwC 29
4. Safety
30 Highlighting trends in the South African mining industry
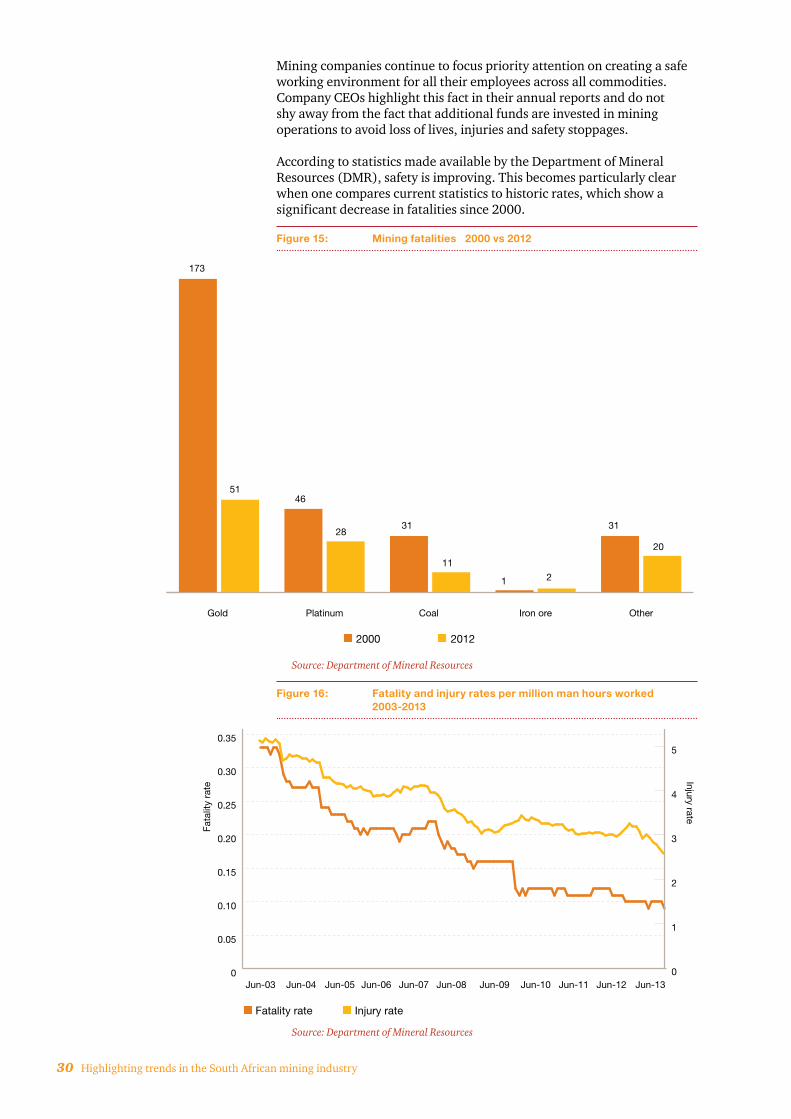
Mining companies continue to focus priority attention on creating a safe working environment for all their employees across all commodities. Company CEOs highlight this fact in their annual reports and do not shy away from the fact that additional funds are invested in mining operations to avoid loss of lives, injuries and safety stoppages.
According to statistics made available by the Department of Mineral Resources (DMR), safety is improving. This becomes particularly clear when one compares current statistics to historic rates, which show a significant decrease in fatalities since 2000.
Figure 15: Mining fatalities 2000 vs 2012
Source: Department of Mineral Resources
Figure 16: Fatality and injury rates per million man hours worked 2003-2013
Source: Department of Mineral Resources
OtherIron oreCoal PlatinumGold
20122000
173
5146
2831
11
1 2
31
20
Fatality rate Injury rate
Fata
lity
rate
Injury rate
0
0.05
0.10
0.15
0.20
0.25
0.30
0.35
0.40
Jun-13Jun-12Jun-11Jun-10Jun-09Jun-08Jun-07Jun-06Jun-05Jun-04Jun-030
1
2
3
4
5
6

PwC 31
All major commodities (gold, platinum, coal and iron ore) have shown a decrease in fatalities, injuries and accidents between 2011 and 2012, with the trend continuing through the first half of 2013. The fatality rate per million hours worked has shown a steady decrease since 2003.
Figure 17: Fatalities per commodity for the years ending 30 June
Source: Department of Mineral Resources
Despite the improvement, it is unfortunate that during periods of significant labour unrest, there is an increase in injury rates, as shown by the long-term graph.
Figure 18: Injuries per commodity for the years ending 30 June
Source: Department of Mineral Resources
OtherIron oreCoal PlatinumGold
20122011 2013
49
56
39 41
118
2 2
1820
44
2015
0
19
1,4421,560
1,404 1,364
252 256
25 21
350262
1,247 1,321
265
17
215
20122011 2013
OtherIron oreCoal PlatinumGold

32 Highlighting trends in the South African mining industry
Companies realise that the cost of lost production due to self-imposed and Section 54 closures is real and are continuing to invest in safety.
The top-10 companies’ individual safety performances are set out in Figure 19.
Figure 19: Top-10 companies’ lost-time injury frequency per million man hours
Source: PwC analysis of company sustainability reporting
Of the top-10 companies that disclosed lost-time injury frequency rates, Kumba Iron Ore reflected the best safety record with regard to lost-time injuries. Harmony showed the best improvement over the previous year, while a total of six companies improved their statistics compared to the prior year.
201120122013
Northam
Anglo Platinum
Harmony
AngloGold Ashanti
Gold Fields
Impala Platinum
Lonmin
African Rainbow Minerals
Exxaro Resources
Kumba Iron Ore 0.40.5
0.6
1.01.5
2.2
1.3
2.52.1
4.24.7
5.9
4.25.0
4.9
5.14.7
4.4
5.36.3
6.9
5.37.3
8.3
5.86.4
5.9
7.59.5
6.7

PwC 33
5. Improving value to stakeholders

34 Highlighting trends in the South African mining industry
The mining industry adds significant value to our country and its people. Stakeholders in the mining industry include employees and their families, unions representing them, the Government as regulators and custodians of tax income for the country, investors, suppliers and customers.
The monetary benefit received by each of these stakeholders is often summarised by companies in their value added statements.
It is a lot more difficult to quantify benefits resulting from costs that assist in uplifting communities or protecting the environment for future generations.
A third of the companies included in this analysis – representing approximately 60% of revenue for all companies analysed – provided readily available value added statements.
Although we could not ensure consistency in disclosures in all cases, we made certain adjustments based on information shared in annual reports (e.g. employee taxes) to ensure a level of consistency.
The accompanying table shows how the value created, being the difference between income and direct purchases, was distributed to the various stakeholders.
Value distributed
2013 2012 2011* 2010*
Funds reinvested
37% 27% 32% 43%
Employees 36% 27% 30% 36%
Shareholder dividends
20% 20% 11% 12%
Direct taxes 11% 10% 11% 9%
Employee taxes
7% 6% 6% 6%
Mining royalties
3% 3% 1% 1%
Borrowings 4% 2% 3% 5%
Community investments
2% 1% N/A N/A
Funds (utilised)/retained
(20%) 4% 6% (12%)
Total value created
100% 100% 100% 100%
* Comparatives were taken from our 2011 publication to illustrate the cycle impact
Source: PwC analysis
Total value created for these entities decreased by 17% from R142 billion to R118 billion on the back of lower profitability for the year. The decrease in value highlights the fixed-term nature of employee benefits and reinvestment of funds to already committed projects in the short term.
This is particularly evident when one compares 2013 to 2010, another year with depressed results. The reality is that in both 2010 and 2013, the industry had to utilise cash resources and borrowings to fund operations.

PwC 35
The value received by employees represented 36% (2012: 27%) of the value created. The value presented, as a percentage, increased from the prior year as a result of the increased salaries and wages, despite the decrease in value. Kumba Iron Ore’s exceptional results mask the real impact of the decrease in value. If one were to exclude Kumba Iron Ore from this breakdown, then employees received 46% (2012:36%) of value created.
This occurred in an environment of decreasing employment. According to Stats SA, the average number of employees decreased by 1.7% for the year to June 2013, compared to the prior year, highlighting the inflexibility in the labour market despite the weak industry performance. However, the number of employees employed in June 2013 was 4.3% less than in June of the prior year which suggests the possibility of a more pronounced decrease in average for 2014.
Figure 20: Directly employed mining employees (Thousands)
Source: Stats SA
This high percentage of value received by employees is not sustainable and is expected to move back to a longer-term average of 30% through either a return to profitability or, if that is not possible, through a decrease in the number of employees.
It should be noted that this amount excludes benefits from share schemes for employees, which are reflected as part of shareholders’ dividends and share-based payments. In some instances, this is substantial.
The state received 21% (2012: 19%) consisting of direct tax, mining royalties and tax on employee income deducted from employees’ salaries. The increase in percentage relates to employee taxes, which increased with employee benefits as discussed above, and direct income taxes which lag the cycle.
The actual contribution received by the state is significantly higher, with indirect taxes like VAT, import and export duties also being collected. As more companies start to report their total payments made to governments in line with the Extractive Industries Transparency Initiative, we will in future be able to assess that contribution better.
460
470
480
490
500
510
520
530
540
Sep
Dec
Mar
Jun
Sep
Dec
Mar
Jun
Sep
Dec
Mar
Jun
Sep
Dec
Mar
Jun
Sep
Dec
Mar
Jun
Sep
Dec
Mar
Jun
2007 2008 2009 2010 2011 2012 2013

Distributions to shareholders remained consistent at 20% of value created and therefore decreased significantly in rand terms, highlighting the volatility of returns to shareholders. This distribution is skewed by the phenomenal performance of Kumba Iron Ore and the resulting dividend of R17.3 billion (2012: R19.0 billion). Excluding Kumba Iron ore, shareholders received only 7% of value created (2012: 10%).
Funds reinvested in the form of acquisitions and capital additions made up 37% (2012: 27%) of the total value created. This high percentage of reinvestment required to maintain production levels in the mining industry puts pressure on additional distributions to employees and investors.
It goes without saying that to create more value for all stakeholders, it will be necessary to increase the size of the pie. An increase in the number of profitable mines will increase the total benefits received by employees, the Government and investors. It will also provide greater resources for mining companies to spend in and on the communities in the vicinity of their operations.
Creating an environment with adequate infrastructure, less policy and regulatory uncertainty and a skilled, yet flexible workforce should attract investment and benefit all stakeholders.
To create value sustainably, stakeholders need to accept that suppliers of labour, capital and resources need to be compensated fairly and equitably, particularly since these stakeholders cannot operate in isolation.
Maximising value from processes
Over the past few years, the mining industry has experienced massive volatility in both its operations and ability to sustain market share. Operational decisions have often been made for short-term survival or growth rather than long-term sustainability.
In order to address these challenges, mining companies need to become more agile, global businesses. Agility can be achieved by having a solid foundation and understanding how all the functions of the business integrate.
Mining companies need structures for key business activities and functions at both an operational and corporate level. Managing the supply chain, purchasing, sales and manufacturing, strategic intent and operational effectiveness are all important to address stakeholder value.
They need to have a holistic view of their enterprises by linking roles, legislation, risks and controls, policies and systems to each activity in order to understand the potential areas of improvement. Management needs to become proactive in meeting daily challenges with the flexibility to meet unique requirements of all operations.
In essence mining companies need to achieve:
• Alignmentbetweenbusinessstrategy with mining operations and plans;
• Greatershareholdervalueby managing costs based on strategic drivers;
• Agilityandflexibilityinthebusiness to deal with changing market conditions and regulatory requirements;
• Standardisedend-to-endprocesses that allow easy incorporation of any new business entities;
• Fully-integratedoperationstoimprove trading capabilities;
• Proactiveoperationsmanagement by understanding risks on the ground (e.g. shortages of skills and equipment requirements); and
• Overallvisibilityoftheentirebusiness to manage costs.
Integrating mine technical data to create value
There is an immense demand to integrate information sets from across the organisation, including mining technical data (created in technical domains such as geology, mine planning and surveying), and commercial data created in supporting business domains such as finance and accounting, human resources and supply chain management.
While commercial ERP solutions have largely succeeded in the integration of the supporting business functions, such integration is much harder to achieve in the technical disciplines, where fragmented specialist systems are still the standard.
The non-integrated nature of the mining technical systems and services domain leaves significant areas (including mineral asset valuation), open to interpretation by technical and commercial disciplines, generally represented by a competent or qualified person within each mining organisation.
36 Highlighting trends in the South African mining industry

A specific issue related to this reality is the fact that mining companies are unable to track the status of resources and reserves continuously. This is mainly due to the time-consuming nature of manually integrating and interpreting the data that describes the state and status of the mineral assets.
Among other things, decisions regarding the application of capital to the mineral assets are impeded by the lack of integration between the financial and mining technical domains, as is the tracking and reporting against capital projects at a granular level. The recent development of the GeoInventory provides a possible solution.
GeoInventory provides a system and method for mineral asset management, accounting and analysis by:
• Amalgamatingandintegratingbig volumes of fragmented mining technical datasets into a spatially-referenced, standards-based mining technical database;
• Leveragingtheabilitytoprocessbig volumes of data in an efficient manner, employing current and future big data platforms, including but not limited to so-called in-memory databases; and
• Continuouslytranslatingtheeffect of changes in the state and status of the real mineral asset, as described in the integrated, spatially-referenced mining database, into standard stock management transactions for processing in conventional inventory management systems.
The resulting mineral asset inventory can provide mining companies with a range of business-critical optimisation opportunities, including:
• Theabilitytoprovidereal-time,reliable resource and reserve reporting in compliance with regulatory codes, as and when required;
• Theabilitytoprovidefinancialand other business input into the production planning processes through analysis of the mineral asset inventory;
• Theabilitytovisuallyintegrateoperational and commercial reporting;
• Theabilitytovastlyimprovethespeed and accuracy of reserve and resource audits through reliable access to datasets and transaction records in both the mineral asset inventory and the integrated underlying mining technical datasets; and
• Scenariobuildingandtesting,especially as it pertains to the interaction of the commercial and mining technical domains.
When combining this with the recent advance in the ERP world in the form of in-memory computing, companies can perform real-time analytics on any aspect of the mineral assets, whether technical, financial or combined.
PwC 37

38 Highlighting trends in the South African mining industry38 Highlighting trends in the South African mining industry

PwC 39
6. Boardroom dynamics
40 Highlighting trends in the South African mining industry
Board composition
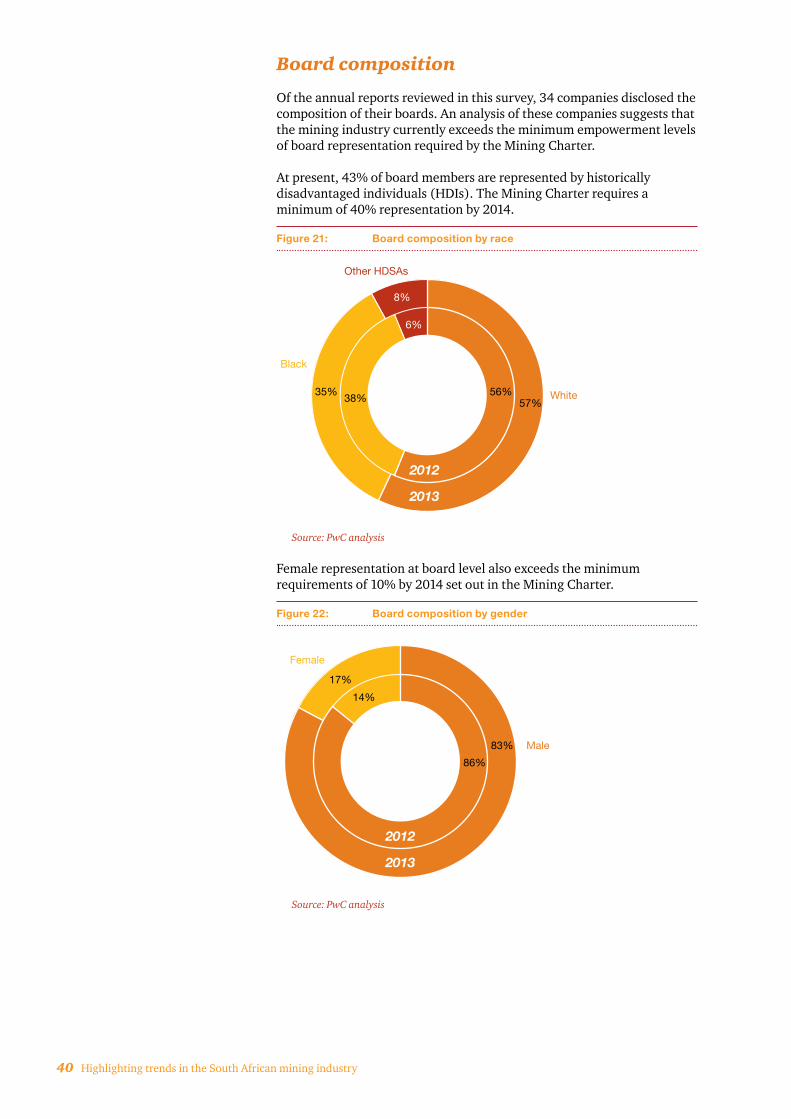
Of the annual reports reviewed in this survey, 34 companies disclosed the composition of their boards. An analysis of these companies suggests that the mining industry currently exceeds the minimum empowerment levels of board representation required by the Mining Charter.
At present, 43% of board members are represented by historically disadvantaged individuals (HDIs). The Mining Charter requires a minimum of 40% representation by 2014.
Figure 21: Board composition by race
Source: PwC analysis
Female representation at board level also exceeds the minimum requirements of 10% by 2014 set out in the Mining Charter.
Figure 22: Board composition by gender
Source: PwC analysis
2012
2013
8%
56%57%
Black
White
Other HDSAs
38%35%
6%
2012
2013
14%
17%
86%
83% Male
Female

PwC 41
7. Financial performance

42 Highlighting trends in the South African mining industry
Six-year summary
The information included for the six-year summary provided in this section differs from the rest of our analysis as it includes the aggregated results of those top companies reported on in each edition of SA Mine. The column for 2012 presented below relates to the results of the companies included in our previous edition, while in the financial review, we analyse the results of this year’s top 37 companies for both 2013 and 2012.
The reason for the difference in revenue for 2012 in this summary and the income statement used in the financial performance section relates to the discontinued operations excluded from revenue, notably Exxaro’s mineral sands business and entities excluded from the publication offset by new entities included.
Six-year summary
2013 R ‘billions
2012 R ‘billions
2011 R ‘billions
2010 R ‘billions
2009 R ‘billions
2008 R ‘billions
Revenue 332 339 303 227 237 218
Adjusted EBITDA 92 123 101 48 85 84
Net profit 25 65 55 20 15 54
Adjusted EBITDA margin 28% 36% 33% 21% 36% 39%
Net profit margin 7% 19% 18% 9% 6% 25%
Cash flow from operating activities 74 112 62 40 59 73
Total capital expenditure 73 70 55 58 62 57
Total assets 694 650 595 548 509 470
Source: PwC analysis
The six-year summary shows recovery in revenue and profitability since the financial crisis of 2008. However, it also puts the severity of the current year’s low profit results in perspective. Cost pressures have all but eroded margins to be at similar levels as the lows experienced during the economic crises.
Financial performance for 2013
Income statementCurrent year
R ‘billionsPrior year R ‘billions
Difference R ‘billions % change
Revenue from ordinary activities 332 330 2 0%
Operating expenses (240) (207) (33) 16%
Adjusted EBITDA 92 123 (31) (26%)
Impairment (charge)/reversal (25) (2) (23) 1485%
Depreciation (30) (27) (3) 11%
PBIT 37 94 (57) (61%)
Net interest (0) 2 (2) (111%)
Tax expense (16) (29) 13 (46%)
Discontinued operations 4 1 3 319%
Net profit 25 68 (43) (64%)
Adjusted EBITDA margin 28% 37% (9%)
Net profit margin 7% 21% (14%)
Source: PwC analysis

PwC 43
As expected given the turmoil in the industry, financial performance was disappointing.
Revenue
Revenue was flat on last year as the rand price-driven increase in gold revenue was offset by lower sales volumes among almost all commodities.
Revenue
Current year
R ‘billions
Prior year
R ‘billions
Difference
R ‘billions
% change
Gold 118 112 6 5%
Platinum 99 105 (6) (6%)
Other 115 113 2 2%
Source: PwC analysis
As expected, production was severely impacted by the strikes that started in the platinum sector before spilling over to other mines. The National Treasury estimates that R10.1 billion was lost in production in platinum and gold mining as a result of strikes and that the GDP growth rate in 2012 was 0.5% lower at 2.5% as a result of the industrial action in the mining industry.
A few examples from annual reports indicate the severe impact of industrial action on financial performance:
• Anglo American Platinum: Two months of unprotected strikes resulting in305 600ouncesoflostproductionequatingtoR6.0billioninrevenue;
• Lonmin:1.8milliontonnesequivalentto110 000ouncesofplatinumin lost production;
• ImpalaPlatinum:Six-weekstrikeresultingin191 000ouncesoflostplatinum production;
• GoldFields:116 000and29 000ouncesofgoldlostduetoillegalstrikes at KDC East and Beatrix Mines respectively;
• AngloGold Ashanti: Total cash cost of USD33/oz relating to the impact of the strike in South Africa. Had there been no strike in South Africa, cash generation would have been at least USD200 million better; and
• Kumba Iron Ore: Five million tonnes of final product lost as a result of unprotected strikes at the Sishen Mine.
Operating expenses
Operating expenses increased by 16%, which is very much in line with the 13% (16% if adjusted for the 2012 Impala strike) of the prior year. This increase occurred despite the no-work-no-pay strike and significant decrease in production at most entities. If the strike-affected platinum companies are excluded from the operating expenses analysis, then the real increase is 23%, indicating the significant cost pressure being experienced by the industry.
A breakdown of operating expenses for companies that disclosed expenses by nature (representing 75% of aggregated revenue) is depicted in the table that follows, with the year-on-year increase also included in the table.
Income statementCurrent year
R ‘billionsPrior year R ‘billions
Difference R ‘billions % change
Revenue from ordinary activities 332 330 2 0%
Operating expenses (240) (207) (33) 16%
Adjusted EBITDA 92 123 (31) (26%)
Impairment (charge)/reversal (25) (2) (23) 1485%
Depreciation (30) (27) (3) 11%
PBIT 37 94 (57) (61%)
Net interest (0) 2 (2) (111%)
Tax expense (16) (29) 13 (46%)
Discontinued operations 4 1 3 319%
Net profit 25 68 (43) (64%)
Adjusted EBITDA margin 28% 37% (9%)
Net profit margin 7% 21% (14%)
Source: PwC analysis

44 Highlighting trends in the South African mining industry
Breakdown of operating expenses
Year-on-year increase/
(decrease)
Year-on-year increase/(decrease)
Cost component Current year Prior year
Employee benefits and contractors 14.3% 9.8%
Consumables and mining supplies 14.6% 13.5%
Utilities 17.2% 21.1%
Exploration 55.1% 38.9%
Royalties (11.0%) 32.8%
Transportation costs 32.1% 15.3%
Other 58.9% 3.4%
Source: PwC analysis
Figure 23: Breakdown of operating expenses
Source: PwC analysis
Labour costs
Although the share of labour costs as a percentage of total operating expenses decreased from 43% to 42%, when one compares this year with the last, it is still by far the biggest cost component in the South African mining industry.
Labour cost percentages vary from above 50% for the deep-level conventional mines to below 30% for those companies that mine predominantly opencast.
Given the above-inflation increases seen in recent years and lower productivity, this cost component is likely to remain the biggest for some time.
2012
2013
4%3%
43%42%
11%
Transportation
12%
Consumables and mining supplies
Employment benefits and contractors
Other
10%
10%Utilities (waterand electricity)
4% 3%
6%7%
23%
22%
Exploration
Royalties

PwC 45
Average total guaranteed package year-on-year increase in the mining industry.
Employee category 2013 2012 2011 2010 2009 2008
Executive 6.50% 8.30% 8.80% 8.20% 8.00% 10.50%
Management 7.00% 8.10% 8.80% 8.20% 8.00% 10.90%
Key specialist 6.30% 8.90% 10.70% 8.20% 8.17% 10.90%
General staff 7.20% 8.40% 8.50% 8.30% 8.17% 10.80%
Unionised staff 7.20% 8.30% 8.90% 8.40% 8.78% 11.30%
Total average lift to payroll 7.20% 8.40% 8.80% 8.30% 8.28% 10.70%
Average consumer price index 5.78%* 5.70% 4.98% 4.29% 7.70% 11.53%
*Year-to-date average CPI as at August 2013
Sources: PwC Remchannel biannual Salary and Wage Movement Survey, Stats SA
The increase in total employee costs was 14.3%, which is significantly higher than the percentages reflected for guaranteed packages. Although this percentage includes the impact of changes in staff numbers, the reality is that total production decreased, indicating a significant decline in productivity in the industry over the last few years.
Mining companies have to continue to evaluate various means to improve productivity and optimise output.
Consumables and mining supplies
As expected in the prior year, consumables and supplies increased at rates well above inflation. The weaker rand has contributed to this increase.
Utilities
The 17.2% increase in utility expenses, including electricity and water, is lower than the prior year increase of 21.1%, reflecting downtime experienced during the strikes. The lower electricity increase rate of 8% awarded by the national energy regulator, NERSA, is also likely to result in this increase moderating in the coming year, albeit still at above CPI inflation rates.
As utilities already represent 10% of total operating costs, it is essential not only from a power security point of view, but also from a cost-saving perspective, that companies focus on opportunities to decrease their power consumption.
Exploration costs
It is pleasing to note that the increase in exploration expenditure continued this year as mines have resumed exploration spending following the cash preservation strategies necessary in the previous few years. For the long-term sustainability of the industry, it is essential that companies maintain their exploration programmes. However, given the discretionary nature of these expenses, we expect this category to decrease next year as companies take action to protect their cash resources.

46 Highlighting trends in the South African mining industry
Royalties
Royalty expenses reflect existing contractual royalty payments as well as mining royalties paid to the fiscus. The decrease is as a result of lower profitability, which impacts the royalty percentage applied to the stable revenue.
Transportation costs
This cost component impacts the bulk commodity producers most. The 32.1% increase is mainly the result of increasing magnetite output from Palabora Mining Company, which required road transport. The company is actively engaging with Transnet to increase rail capacity to meet its needs.
Excluding transport costs associated with Palabora, the increase is 23%, reflecting the above-inflation increases in fuel and electricity prices as well as higher iron ore volumes.
Impairment provisions
As expected, and consistent with the global trend, there were significant impairments recognised in the current year. The R25 billion impairment provision equates to 34% of the current year capital expenditure and 6% of total mining assets.
The significant pressure on those platinum mines with the lower PGM basket price and increased cost pressures has shown with a number of mines put on care and maintenance. A total of R16.7 billion was impaired by platinum companies. Anglo American Platinum contributed R6,7 billion, Lonmin R4,9 billion, Impala Platinum R2,3 billion and Aquarius R2 billion. It is unlikely that shafts put on care and maintenance will be brought back into production in the short term given the difficult environment.
Gold companies impaired R6.6 billion in the current year. The bulk of this impairment relates to international investments where the weakening rand could not protect the mines’ recoverable amount. Harmony impaired R2.7 billion of its Hidden Valley project in Papua New Guinea, AngloGold Ashanti’s Obuasi mine in Ghana was impaired by R2.3 billion and Gold Fields impaired R0.6 billion of assets in Australia.
Impairment in the current year was mainly the result of economic factors. Although one would hope for minimal impairment next year, there is a real risk that the gold industry, which is currently enjoying a temporary respite thanks to the weak rand, might have to critically assess its position next year. The outcome of disputes in the Zimbabwe indigenisation process might also result in impairment considerations for next year.
Depreciation
Despite production declining, which is conventionally used as the basis for decreasing depreciation, depreciation actually increased by 11%. This is a result of the higher cost base for new additions and acquisitions.
Net interest
The low level of finance costs reflects the traditionally low levels of gearing maintained by most South African mining companies. However, the movement from net interest received to a marginal net interest paid in the current year reflects the increased borrowings required by mining companies to fund operations. Not included in this cost is borrowing costs capitalised against the development cost of qualifying assets.
Taxation
The effective tax rate of 43% is well above the prior year’s rate of 31% and the statutory rate of 28%. This increase is as a result of non-deductible impairment provisions, where no deferred tax assets could be raised, partially offset by a reduction in the maximum gold mining tax rate from 43% to 34% with the abolishment of secondary tax on companies (STC).

PwC 47
Net profit
The 64% decrease in net profit is a result of the R25 billion impairment and the decrease in the EBITDA margin from 37% to 20%. Only seven companies achieved an EBITDA that is above the average.
Companies with EBITDA above 30%
Current year Prior year
Pan African Resources 57% 45%
Kumba Iron Ore 54% 68%
Assore 44% 52%
Gold Fields 41% 48%
AngloGold Ashanti 38% 47%
Source: PwC analysis
The picture is very different when considered on a commodity-specific basis.
EBITDA by commodity
Current year R ‘billions
Prior year R ‘billions
Difference R ‘billions % change
EBITDA
Gold 41 48 (7) (14%)
Platinum 13 22 (9) (43%)
Other 38 53 (15) (28%)
Current year %
Prior year %
Difference %
EBITDA margin
Gold 34% 43% (9%)
Platinum 13% 21% (8%)
Other 33% 47% (14%)
Source: PwC analysis
Although these margins seem to indicate that the industry is still profitable, the lower EBITDA means that the platinum companies could not fund their R14 billion capital expenditure, which is mainly of a sustaining nature, from EBITDA.
Gold companies could barely fund their R32 billion capital expenditure from profits after taking into account R9 billion in taxes paid.

48 Highlighting trends in the South African mining industry
Net profit by commodity
Current year R ‘billions
Prior year R ‘billions
Difference R ‘billions % change
Gold 11 23 (12) (53%)
Platinum (14) 7 (21) (283%)
Other 28 38 (10) (27%)
Source: PwC analysis
Foreign exchange impact
The impact of the rand exchange rate on performance is quite substantial when compared to global mining performance. When converting the income statements of the aggregated companies at the average rates applicable to their specific years, there is a difference in the pro-forma performance.
In dollar terms, revenue was lower by 8% compared to the slight increase in rand terms. Adjusted EBITDA was lower by 31% (rand: 26%) and net profit lower by 65% (rand: 64%).
With lower dollar commodity prices masked by a weaker rand, the performance in dollar terms is weaker than in rand terms.
Income statement in USD
Current year USD ‘billions
Prior year USD ‘billions
Difference R ‘billions % change
Revenue from ordinary activities 41 45 (4) (8%)
Operating expenses (30) (28) (2) 6%
Adjusted EBITDA 11 17 (6) (31%)
Impairment (charge)/reversal (3) (0) (3) 100%
Depreciation (3) (4) (1) 3%
PBIT 5 13 (8) (63%)
Net interest (0) 0 (0) (106%)
Tax expense (2) (4) 2 (50%)
Discontinued operations 1 0 1 100%
Net profit 3 9 (6) (65%)
Source: PwC analysis

PwC 49
Cash flows
Current year R ’billions
Prior year R ’billions
Difference R ‘billions % change
Cash flows related to operating activities
Cash generated from operations 94 128 (34) (27%)
Other (2) 4 (6) (139%)
Income taxes paid (18) (20) 2 (9%)
Net operating cash flows 74 112 (38) (34%)
Cash flows related to investing activities
Purchase of PPE (73) (67) (6) 9%
Purchase of investments (10) (12) 2 (21%)
Sale of investments 4 3 1 46%
Other (4) (1) (3) 400%
Net investing cash flows (83) (77) (6) 8%
Cash flows related to financing activities
Proceeds from ordinary shares issue
1 2 (1) (71%)
Proceeds from interest bearing liabilities
68 19 49 256%
Repayment of interest bearing liabilities
(35) (18) (17) 89%
Distribution to shareholders (30) (35) 5 (14%)
Net financing activities 4 (32) 36 (114%)
Net increase/(decrease) in cash and cash equivalents
(5) 4 (9) (222%)
Cash and cash equivalents at the beginning of period
45 41 4 10%
Cash and cash equivalents at the end of the year
40 45 (5) (11%)
Source: PwC analysis
Cash flows from operating activities
The ability to convert profits into cash is crucial for any company. The 26% decrease in adjusted EBITDA translated into a 34% decrease in cash generated from operations. As tax payments typically lag accounting profits, the 64% decrease in net profit did not impact the taxes paid in 2013 in the same way, as taxes paid only decreased by 9%. We don’t expect the total tax contribution to decline as rapidly owing to other tax payments such as royalties and employee-related taxes being less sensitive to net financial performance.
Cash flows from investing activities
The low-price environment caused companies to reconsider their capital expenditure. Capital expenditure only increased by 9% in the year, which is lower than the prior year. A decrease in capital expenditure was already in place for platinum producers. We expect a decrease in capital expenditure by gold mining companies to follow in the next year.Net decrease of R38
billion (34%)
Net outflow increase of R6 billion (8%)
Operating cash inflows were down R38 billion and investing cash flows were up R6 billion. Overall cash balances were maintained through the issue of debt.

50 Highlighting trends in the South African mining industry
Figure 24: Capital expenditure per commodity (R billions)
Source: PwC analysis
PlatinumGold
31.8
21.6
24.422.3
Other
17.2
20.1
2013 2012 2013 2012 2013 2012
Of the aggregated capital expenditure, 60% was incurred by only five companies:
• AngloGold Ashanti (R13.6 billion, up from R10.2 billion);
• Gold Fields (R10.2 billion, up from R7.3 billion);
• Anglo American Platinum (R7.2 billion, down from R7.5 billion);
• Impala Platinum (R6.4 billion, down from R7.3 billion); and
• Kumba Iron Ore (R5.4 billion, down from R5.8 billion).
Given the uncertainty in commodity prices and announcements of reduced spending by companies, we expect the levels of capital expenditure to be lower next year. This anticipated decrease in expenditure will negatively impact service providers to the industry.
Cash flows from financing activities
Equity
The proceeds from equity issuances continue to decrease as depressed share prices meant share issues were all but off the table. The most notable issuances of ordinary shares were the R0.7 billion rights issue by Pan African Resources for the acquisition of Evander Gold Mines and the R1.3 billion raised by Coal of Africa.
Borrowings
With the decrease in cash generated from operations, mining companies increased their debt to maintain cash levels and fund working capital and capital expenditure.NetdebtofR33 billionwasraisedduringthe year, increasing the gearing ratio to 13%.
Distributions to shareholders
The decline in performance negatively impacted distributions to shareholders. Only 17 companies included in our analysis paid dividends. Of these, 59% of the distribution to shareholders is a result of the R18 billion dividend paid by Kumba Iron Ore.

PwC 51
Financial position
Current year R ‘billions
Prior year R ‘billions
Difference R ‘billions % change
Current assets
Cash and cash equivalents 45 45 0 0%
Inventories 58 50 8 17%
Receivables and other current assets 41 40 1 1%
Assets held for sale 1 18 (17) (94%)
Total current assets 146 154 (8) (6%)
Non-current assets
Mining and production assets 449 421 28 7%
Goodwill 11 13 (2) (14%)
Investments 51 33 18 56%
Derivative financial assets 0 0 0 29%
Other non-current assets 37 38 (1) (4%)
Total non-current assets 548 505 43 9%
Total assets 694 659 35 5%
Share capital and reserves
Share capital 255 245 10 4%
Reserves and non-controlling interest 143 151 (8) (6%)
Total equity 398 396 2 1%
Current liabilities
Accounts payable and other liabilities 79 81 (2) (2%)
Interest bearing liabilities 24 18 6 30%
Total current liabilities 103 100 3 4%
Non-current liabilities
Interest bearing liabilities 83 54 29 54%
Deferred taxation liabilities 73 77 (4) (5%)
Derivative financial liabilities 1 1 (0) (30%)
Other non-current liabilities 36 28 8 26%
Liabilities held for sale 0 3 (3) (86%)
Total non-current liabilities 193 163 30 18%
Total liabilities 296 263 33 13%
Total equity and liabilities 694 659 35 5%
Key ratios Current year Prior year Global mine ratios
Net borrowings (R ‘billions) 62 27
Gearing percentage (percentage) 13% 6% 24%
Solvency ratio (times) 2.3 2.5 2.2
Current ratio (times) 1.4 1.5 1.6
Acid ratio (times) 0.8 1.0 1.1
Source: PwC analysis

52 Highlighting trends in the South African mining industry
Sound financial position
Solvency ratios remained strong despite a marginal weakening and remain comparable to global benchmarks. This relative financial strength provides the industry with flexibility to operate and, where necessary, invest for the future. However, the low acid ratio could negatively impact on companies’ short-term flexibility.
These ratios are all derived from historical cost-carrying amounts and therefore do not necessarily reflect the true fair-value trends. Market capitalisation as a multiple of carrying amounts weakened from 2.1 to 1.6. This indicates investors’ scepticism about the sustainability of the industry.
At an individual company level, as at 30 June 2013 there were 20 (2012: 19)companieswithnetbookvaluesexceedingthemarketcapitalisation of the company. This weakening from the prior year occurred despite the significant impairments processed. The market capitalisation for six entities weakened to the extent that they are now included in the list.
Net asset value as a percentage of market capitalisation
Current year Prior year
Eastern Platinum 876% 437%
Wesizwe Platinum 532% 256%
Sentula Mining 281% 225%
Firestone Energy 258% 203%
Keaton Energy Holdings 247% 137%
Village Main Reef 212% 107%
Metmar 199% 96%
Harmony Gold Mining Company 185% 103%
Jubilee Platinum 181% 242%
Coal of Africa 176% 91%
BuildMax 175% 115%
Gold One 165% 51%
Royal Bafokeng Platinum 158% 127%
Wits Gold 155% 53%
Merafe Resources 153% 133%
Zambia Coppper Investments 144% 162%
Trans Hex Group 140% 141%
Gold Fields 115% 61%
Petmin 106% 83%
Aquarius Platinum 101% 194%
Source: PwC analysis
The preceding table shows a disconnec between the market perception of value for these companies and managements’ perception of the fair value of the underlying assets. This difference may be attributable to incomplete information available to the market, differing perceptions over development successes and different long-term price assumptions. These companies face a tough task convincing the market of their value.

PwC 53
Workingcapital
Therewerenine(2012: six)companieswithcurrentratiosoflessthanoneand17(2012: 12)companieswithacidratiosoflessthanone.Thelevels of working capital increased during the year as seen from the increase in inventory, which was funded through short-term debt. Of the companies included, 13 improved their current ratios and 11 their acid ratios.
Financing for sustainability
South African mining companies and banks have traditionally been conservative when it comes to funding mining projects. While the gearing ratio increased to 13% in the current year, this is still much lower than the global average of 24%.
Ofthe37companiesanalysed,22(2012: 18)wereinanetborrowingposition.Ofthetop-10companies,80%(2012: 70%)wereinanetborrowingposition,asopposedto38%(2012: 30%)oftheremainderofthe 37 companies reviewed. The disparity in this ratio may indicate that financial institutions prefer to provide finance based on strong balance sheets rather than the project-specific finance required by mid-tier and junior miners.

54 Highlighting trends in the South African mining industry54 Highlighting trends in the South African mining industry
PwC 55
8. Glossary
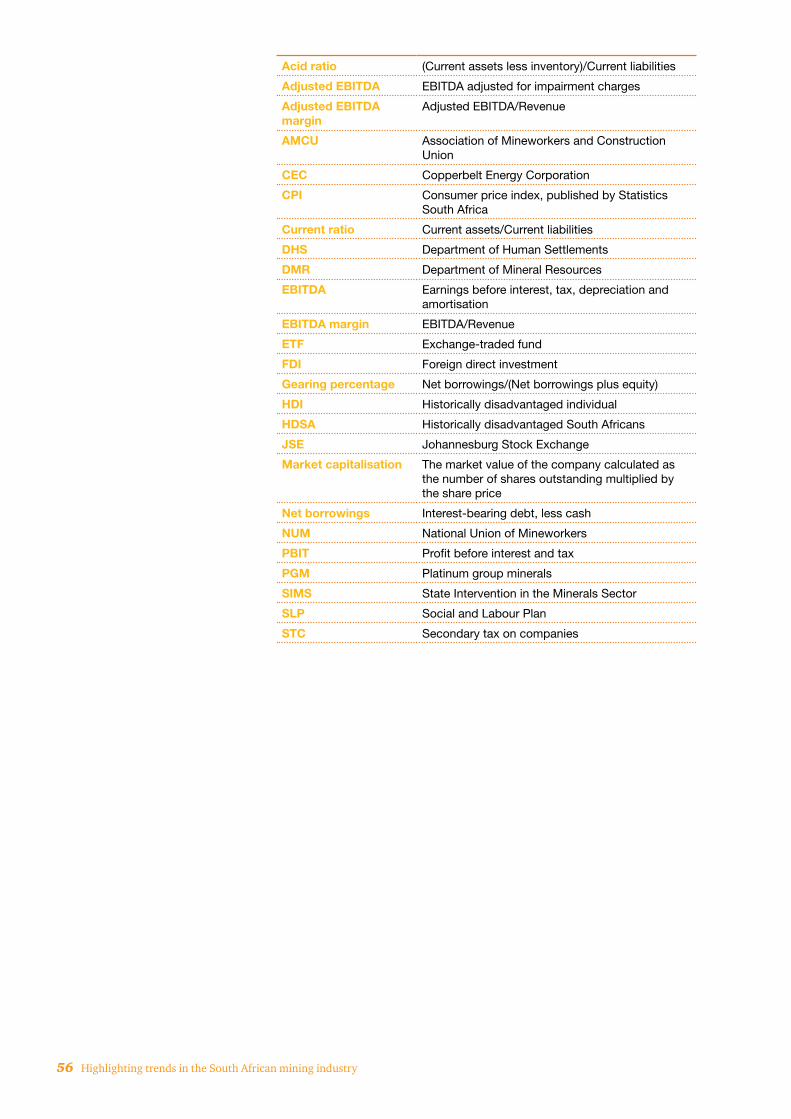
56 Highlighting trends in the South African mining industry
Acid ratio (Current assets less inventory)/Current liabilities
Adjusted EBITDA EBITDA adjusted for impairment charges
Adjusted EBITDA margin
Adjusted EBITDA/Revenue
AMCU Association of Mineworkers and Construction Union
CEC Copperbelt Energy Corporation
CPI Consumer price index, published by Statistics South Africa
Current ratio Current assets/Current liabilities
DHS Department of Human Settlements
DMR Department of Mineral Resources
EBITDA Earnings before interest, tax, depreciation and amortisation
EBITDA margin EBITDA/Revenue
ETF Exchange-traded fund
FDI Foreign direct investment
Gearing percentage Net borrowings/(Net borrowings plus equity)
HDI Historically disadvantaged individual
HDSA Historically disadvantaged South Africans
JSE Johannesburg Stock Exchange
Market capitalisation The market value of the company calculated as the number of shares outstanding multiplied by the share price
Net borrowings Interest-bearing debt, less cash
NUM National Union of Mineworkers
PBIT Profit before interest and tax
PGM Platinum group minerals
SIMS State Intervention in the Minerals Sector
SLP Social and Labour Plan
STC Secondary tax on companies

PwC 57

58 Highlighting trends in the South African mining industry58 Highlighting trends in the South African mining industry

PwC 59
9. Companies included in the analysis

60 Highlighting trends in the South African mining industry
Company Year end
African Rainbow Minerals Limited June 2013
Anglo American Platinum Limited December 2012
AngloGold Ashanti Limited December 2012
Aquarius Platinum Limited June 2013
Assore Limited June 2013
Atlatsa Resources December 2012
BuildMax Limited February 2013
Coal of Africa Limited June 2013
DRDGOLD Limited June 2013
Eastern Platinum Limited December 2012
Exxaro Resources Limited December 2012
Firestone Energy Limited June 2013
Gold Fields Limited December 2012
Goliath Gold Mining Limited December 2012
Gold One International Limited December 2012
Harmony Gold Mining Company Limited June 2013
Impala Platinum Holdings Limited December 2012
Jubilee Platinum plc June 2013
Keaton Energy Holdings Limited March 2013
Kumba Iron Ore Limited December 2012
Lonmin plc September 2012
Merafe Resources Limited December 2012
Metmar Limited February 2013
Northam Platinum Limited June 2013
Palabora Mining Company Limited December 2012
Pan African Resources Limited June 2013
Petmin Limited June 2013
Royal Bafokeng Platinum Limited December 2012
Sentula Mining Limited March 2013
Sephaku Holdings Limited June 2013
Sibanye Gold Limited December 2012
Trans Hex Group Limited March 2013
Village Main Reef Limited June 2013
Wescoal Holdings Limited March 2013
Wesizwe Platinum Limited December 2012
Witwatersrand Consolidated Gold Resources Limited December 2012
Zambia Copper Investments Limited March 2013

PwC 61
Basis for compiling this report
We aggregated the financial results of mining companies with a primary listing on the Johannesburg Stock Exchange (JSE) and mining companies whose main operations are in Africa and that have a secondary listing on the JSE, for the financial year ends to June 2013. We used a cut-off market capitalisation of R200 million and excluded all companies with suspended listings.
Our selection criteria excluded global mining companies Anglo American and BHP Billiton. Although both these companies have South African roots, their global exposure and size means that they do not necessarily reflect trends in the South African mining environment. A large number of the entities included also have international exposure. However, the bulk of their operations are in Africa.
The results aggregated in this report have been sourced from information that is publicly available, primarily annual reports or reviewed results made available to shareholders. Companies have different year ends and report under different accounting regimes.
Information has been aggregated for the financial years of individual companies and no adjustments have been made to take into account different reporting requirements and year ends. As such, the financial information shown for 2013 covers reporting periods from 1 October 2011 to 30 June 2013, with each company’s results included for the 12-month financial reporting period that falls into this time frame.
Information for the previous year comprises information for the 37 companies selected in the current year, except where indicated otherwise.
All currency figures in this publication are reported in South African rand, except where specifically stated otherwise. The results of companies that report in currencies other than the rand have been translated at the average rand exchange rate for the financial year, with balance-sheet items translated at the closing rand exchange rate.
Some diversified companies undertake part of their activities outside the mining industry. No attempt has been made to exclude such non-mining activities from the aggregated financial information.
Contributors
Janandre Lamprecht
Charity Malenga
Colm Tonge
Ferdi Linde
Frans Minnaar
Frans Murray
Jayne Mammatt
Luyanda Mngadi
Nthato Makhetha
Pieter Theron
Tessa Lavers
Wiehann Joubert

62 Highlighting trends in the South African mining industry62 Highlighting trends in the South African mining industry

PwC 63
10. About PwC
About PwC
PwC helps organisations and individuals create the value they’re looking for. We’re a network of firms in 157 countries with more than 184 000 people who are committed to delivering quality in assurance, tax and advisory services.
We have 1 500 dedicated mining professionals in various key mining territories across the world.
Tell us what matters to you and find out more by visiting us at www.pwc.co.za/mining

64 Highlighting trends in the South African mining industry
Powering the future: Mining excellence
While issues faced by miners across the industry may be similar, we understand that ‘value’ means different things to different people. That’s why at PwC it’s not just about providing the ‘right’ answers. Our team of mining specialists remain focused on relationships to help our clients navigate the complex mining world and deliver on objectives. We are passionate about mining and have a team of highly skilled professionals exclusively focused on improving efficiency and adding value across the industry.
In South Africa, we offer clients:
Leading edge knowledge and insight
We have made considerable investments to ensure our people are not only technically strong, but also have strong industry experience and expertise. Our thought leadership programme is focused on providing in-depth commentary on the key issues faced by miners in today’s complex operating arena.
Our comprehensive industry insight programme includes:
• Flagship publications such as SA Mine, Mine and Mining Deals;
• Webcasts available at pwc.com, and
• The Insight Series providing deep dives into the issues most important to miners
Connections to our vast network of mining experts and global client portfolio
We have the widest network of mining experts who work out of strategic hubs across the globe to help better connect you to vital mining markets.
Our connections provide:
• Collaborative cross-border account management, which ensures seamless client service;
• A global community of mining leaders, allowing our clients to connect with key players in all markets to maximise deal potential; and
• A well-connected and mobile workforce.
The delivery of an experience that meets our clients’ definition of ‘value’

PwC 65
With mining experts working in each key mining area across South Africa, our teams are helping clients deliver on specific projects and organisational growth aspirations. We offer advisory, tax and audit services to global corporations and locally-listed companies.
Mining Excellence@PwC complements this with:
• A suite of niche mining consulting capabilities focused on optimising value across mining operations and effectively managing risk; and
• A comprehensive client feedback programme to ensure we are consistently delivering on individual client needs.
Contacts
Global Mining Leader John Gravelle Toronto, Canada T: +1 416 869 8727 E: [email protected]
Africa Mining Leader Hein Boegman Johannesburg, South Africa T: +27 11 797 4335 E: [email protected]
Jock O’Callaghan Melbourne, Australia +61 (3) 8603 6137 [email protected]
SteveRalbovsky Phoenix, U.S.A T: +1 (602) 364 8193 E: [email protected]
RonaldoValino Rio de Janiero, Brazil T: + 55 21 3232 6139 E: [email protected]
John Campbell Moscow, Russia T: +7 (495) 967 6279 E: [email protected]
Jason Burkitt London, UK T: +44 (20) 7213 2515 E: [email protected]
Ken Su Beijing, China T: +86 (10) 6533 7290 E: [email protected]
KameswaraRao Hyderabad, India T: +91 40 6624 6688 E: [email protected]
SachaWinzenried Jakarta, Indonesia T: +62 21 5289 0968 E: [email protected]

To learn more about the issues raised in this report and our services, please contact:
Hein Boegman African Mining Leader +27 (11) 797 4335 [email protected]
Andries Rossouw Mining Assurance Partner +27 (11) 797 4060 [email protected]
Faan Lombard Mining Assurance Partner +27 (11) 797 4407 [email protected]
Megan Naidoo Mining Assurance Partner +27 (11) 797 4013 megan.naidoo.za.pwc.com
Sizwe Masondo Mining Assurance Partner +27 (11) 797 5393 [email protected]
Chantal Marais Mining Assurance Partner +27 (11) 797 4171 [email protected]
Hendrik Odendaal Mining Assurance Partner +27 (11) 797 4010 [email protected]
Michal Kotze Mining Assurance Partner +27 (11) 797 4603 [email protected]
Dion Shango Mining Assurance Partner +27 (11) 797 4166 [email protected]
Jean-Pierre van Staden Mining Assurance Partner +27 (11) 797 5367 [email protected]
Pieter Hough Mining Assurance Partner +27 (11) 797 4158 [email protected]
Troopti Naik Tax Partner +27 (11) 797 4351 [email protected]
Simon Venables Deals Leader +27 (11) 797 5660 [email protected]
Gert Meiring Tax Partner +27 (11) 797 5506 [email protected]
Anton van Wyk Advisory Mining Leader +27 (11) 797 5338 [email protected]
Jayne Mammatt Sustainability & Integrated Reporting Partner +27 (11) 797 4128 [email protected]
Duncan Adriaans Mining Assurance Partner +27 (21) 815 3099 [email protected]
Kevan Moodley Mining Assurance Partner +27 (53) 807 9202 [email protected]
66 Highlighting trends in the South African mining industry


©2013 PricewaterhouseCoopers (“PwC”), the South African firm. All rights reserved. In this document, “PwC” refers to PricewaterhouseCoopers in South Africa, which is a member firm of PricewaterhouseCoopers International Limited (PwCIL), each member firm of which is a separate legal entity and does not act as an agent of PwCIL. (13-14075)
Printed on triple green