highlights from the q1 2015 experian-oliver wyman market intelligence report
TRANSCRIPT
1
© 2015 Experian Information Solutions, Inc. All rights reserved. Experian and the marks used herein are service marks or registered trademarks of Experian Information Solutions, Inc. Other product and company names mentioned herein are the trademarks of their respective owners. No part of this copyrighted work may be reproduced, modified, or distributed in any form or manner without the prior written permission of Experian. Experian Public.
Unique insights on the consumer credit market
Highlights from the Q1 2015 Experian–Oliver Wyman Market Intelligence Report

2 © 2015 Experian Information Solutions, Inc. All rights reserved. Experian Public.
Experian-Oliver Wyman Market Intelligence Report Introduction
Linda Haran
Senior Director Experian Decision Sciences
Alan Ikemura
Senior Product Manager Experian Decision Sciences
Today’s Speakers:
3 © 2015 Experian Information Solutions, Inc. All rights reserved. Experian Public.
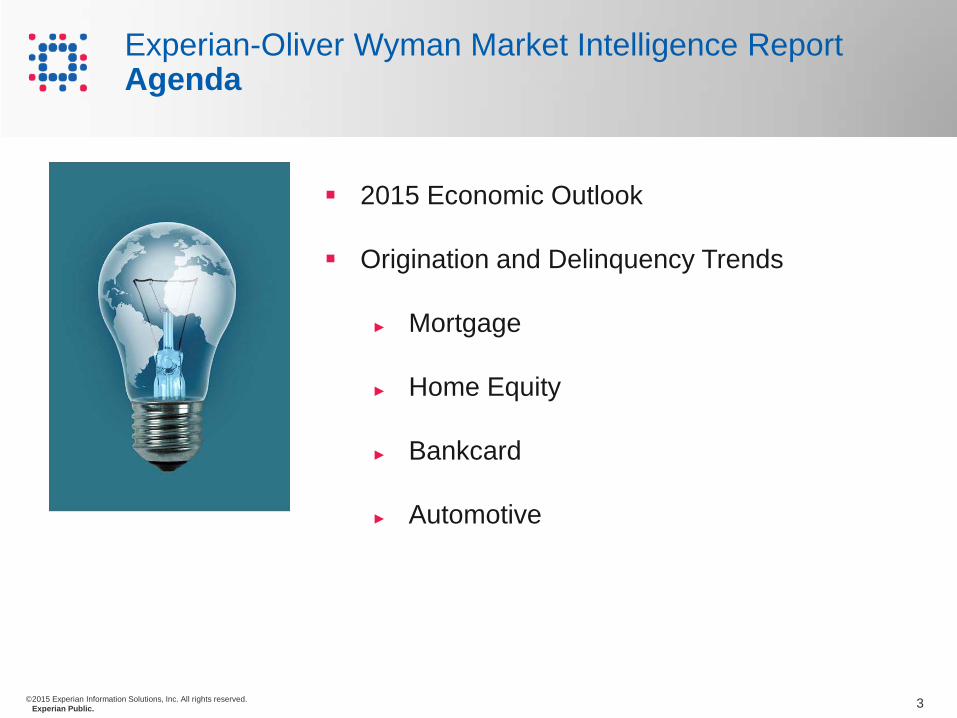
2015 Economic Outlook
Origination and Delinquency Trends
► Mortgage
► Home Equity
► Bankcard
► Automotive
Experian-Oliver Wyman Market Intelligence Report Agenda

4 © 2015 Experian Information Solutions, Inc. All rights reserved. Experian Public.
Economic Trends
5 © 2015 Experian Information Solutions, Inc. All rights reserved. Experian Public.
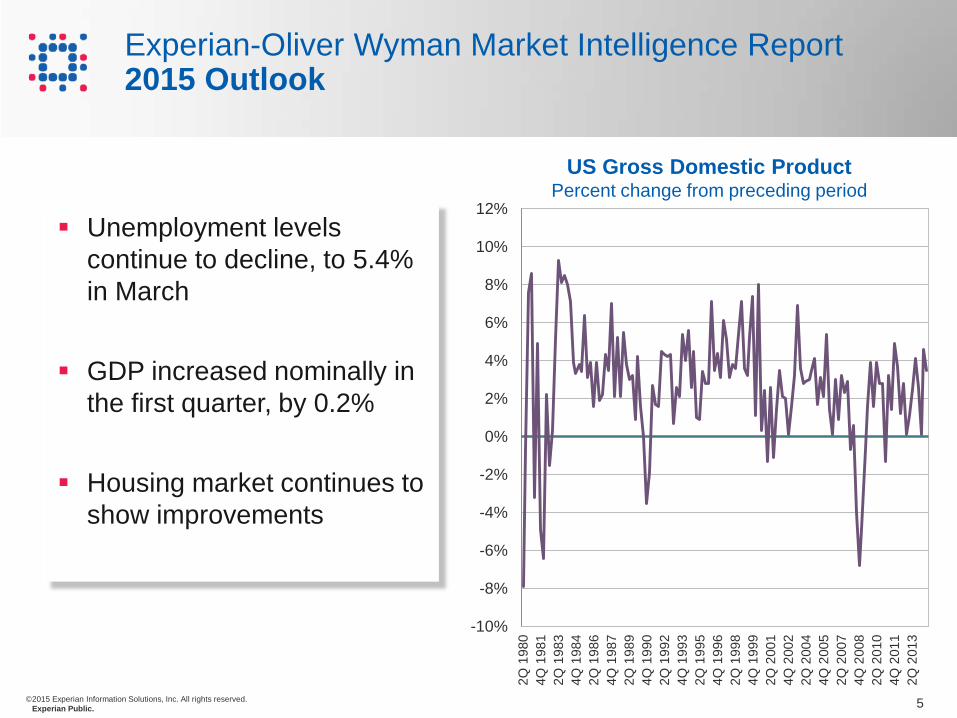
Experian-Oliver Wyman Market Intelligence Report 2015 Outlook
Unemployment levels continue to decline, to 5.4% in March
GDP increased nominally in the first quarter, by 0.2%
Housing market continues to show improvements
-10%
-8%
-6%
-4%
-2%
0%
2%
4%
6%
8%
10%
12%
2Q 1
980
4Q 1
981
2Q 1
983
4Q 1
984
2Q 1
986
4Q 1
987
2Q 1
989
4Q 1
990
2Q 1
992
4Q 1
993
2Q 1
995
4Q 1
996
2Q 1
998
4Q 1
999
2Q 2
001
4Q 2
002
2Q 2
004
4Q 2
005
2Q 2
007
4Q 2
008
2Q 2
010
4Q 2
011
2Q 2
013
US Gross Domestic Product Percent change from preceding period
6 © 2015 Experian Information Solutions, Inc. All rights reserved. Experian Public.
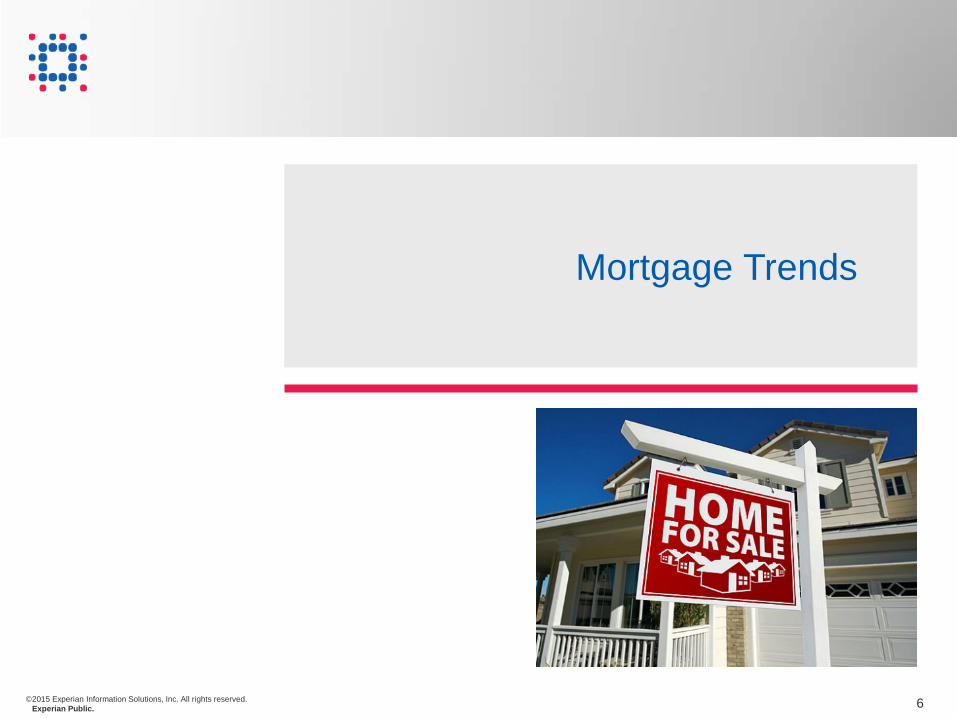
Mortgage Trends

7 © 2015 Experian Information Solutions, Inc. All rights reserved. Experian Public.
Experian-Oliver Wyman Market Intelligence Report Q1 2015 Origination Trends | Mortgage
$0
$100
$200
$300
$400
$500
$600
2011Q4
2012Q1
2012Q2
2012Q3
2012Q4
2013Q1
2013Q2
2013Q3
2013Q4
2014Q1
2014Q2
2014Q3
2014Q4
2015Q1
$416 $407 $436 $508 $537 $515 $555 $441 $317 $253 $350 $386 $374 $316
Mortgage origination volume (in $BNs)
YoY increase of 25%
8 © 2015 Experian Information Solutions, Inc. All rights reserved. Experian Public.
$0
$50
$100
$150
$200
$250
2011Q4
2012Q1
2012Q2
2012Q3
2012Q4
2013Q1
2013Q2
2013Q3
2013Q4
2014Q1
2014Q2
2014Q3
2014Q4
2015Q1
Midwest Northeast South Atlantic South Central West
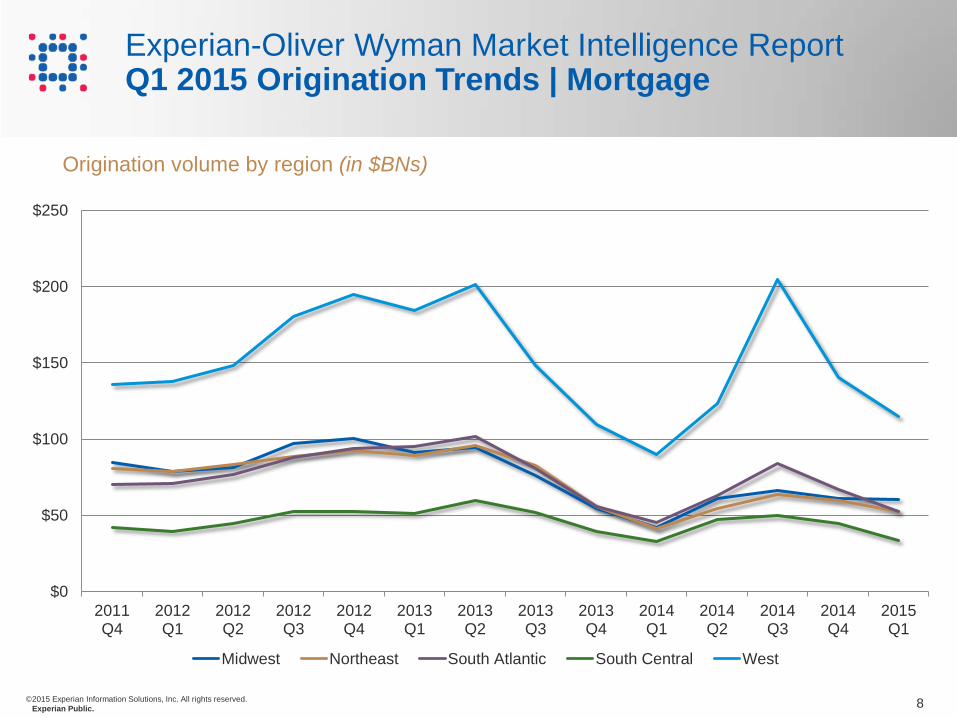
Experian-Oliver Wyman Market Intelligence Report Q1 2015 Origination Trends | Mortgage
Origination volume by region (in $BNs)

9 © 2015 Experian Information Solutions, Inc. All rights reserved. Experian Public.
0.0%
0.5%
1.0%
1.5%
2.0%
2.5%
2011Q4
2012Q1
2012Q2
2012Q3
2012Q4
2013Q1
2013Q2
2013Q3
2013Q4
2014Q1
2014Q2
2014Q3
2014Q4
2015Q1
30-59 60-89 90-180
Mortgage delinquency rates as % of balances
Experian-Oliver Wyman Market Intelligence Report Q1 2015 Delinquency Trends | Mortgage

10 © 2015 Experian Information Solutions, Inc. All rights reserved. Experian Public.
Experian-Oliver Wyman Market Intelligence Report Q1 2015 Delinquency Trends | Mortgage
30+ dpd balance exposure (in $BNs)
$7.0
$7.2
$7.4
$7.6
$7.8
$8.0
$8.2
$8.4
$8.6
$8.8
$9.0
$0
$100
$200
$300
$400
$500
$600
2011Q4
2012Q1
2012Q2
2012Q3
2012Q4
2013Q1
2013Q2
2013Q3
2013Q4
2014Q1
2014Q2
2014Q3
2014Q4
2015Q1
30+ dpd Exposure Balances O/S
30+ delinquency exposure continues to decline while balances see steady increases

11 © 2015 Experian Information Solutions, Inc. All rights reserved. Experian Public.
0%
1%
2%
3%
4%
5%
6%
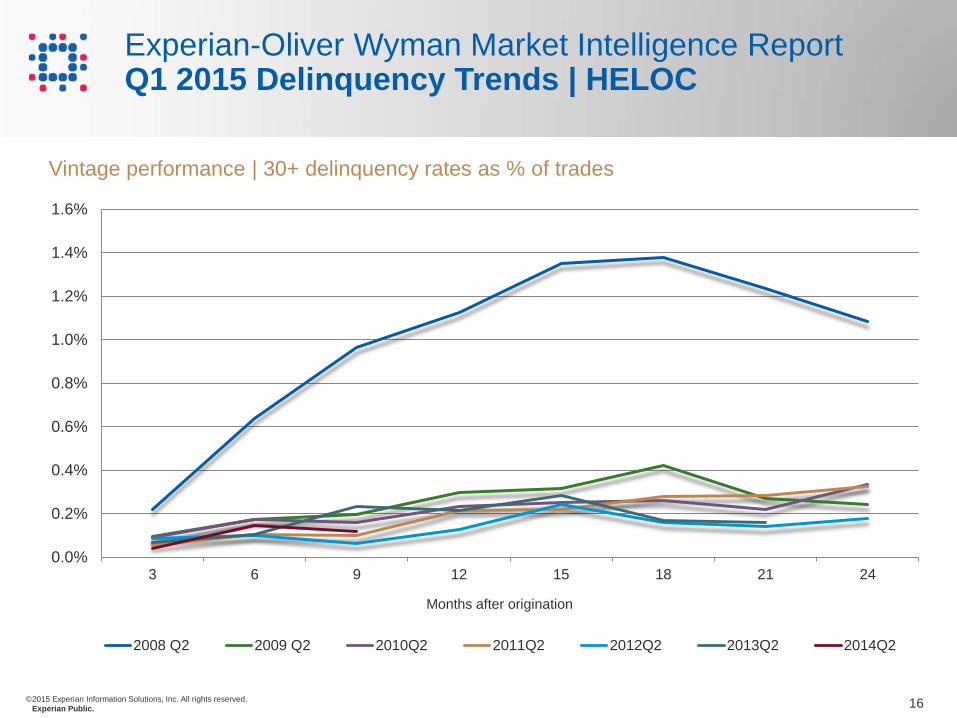
3 6 9 12 15 18 21 24
Months after origination
2008 Q2 2009 Q2 2010Q2 2011Q2 2012Q2 2013Q2 2014Q2
Experian-Oliver Wyman Market Intelligence Report Q1 2015 Delinquency Trends | Mortgage
Vintage performance | 30+ delinquency rates as % of trades

12 © 2015 Experian Information Solutions, Inc. All rights reserved. Experian Public.
Home Equity Trends
13 © 2015 Experian Information Solutions, Inc. All rights reserved. Experian Public.
$0
$5
$10
$15
$20
$25
$30
$35
$40
2011Q4
2012Q1
2012Q2
2012Q3
2012Q4
2013Q1
2013Q2
2013Q3
2013Q4
2014Q1
2014Q2
2014Q3
2014Q4
2015Q1
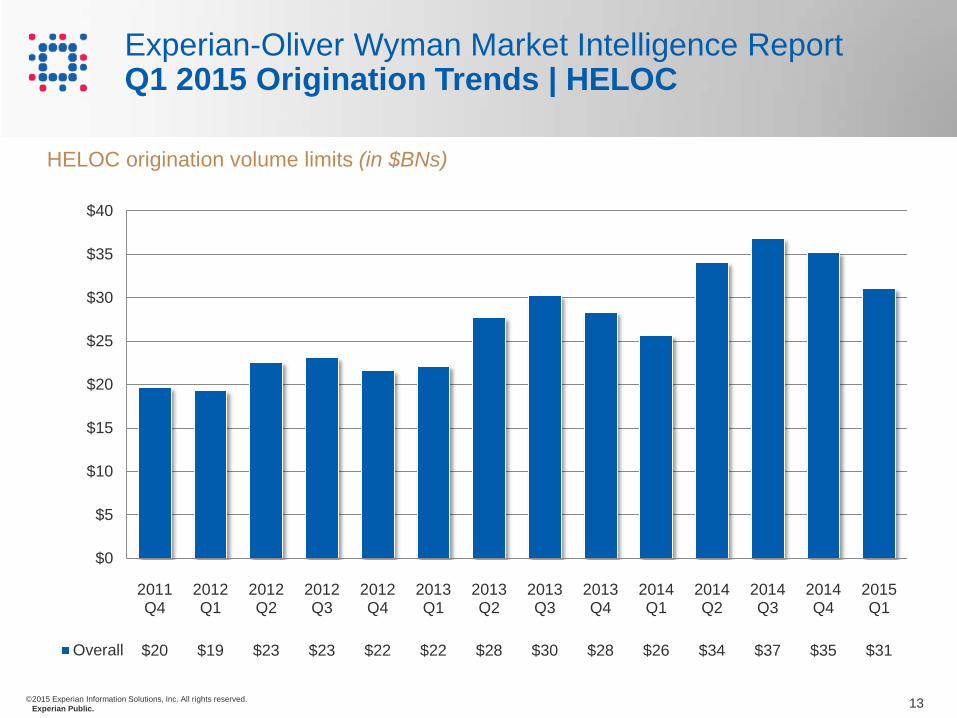
Overall $20 $19 $23 $23 $22 $22 $28 $30 $28 $26 $34 $37 $35 $31
HELOC origination volume limits (in $BNs)
Experian-Oliver Wyman Market Intelligence Report Q1 2015 Origination Trends | HELOC
14 © 2015 Experian Information Solutions, Inc. All rights reserved. Experian Public.
$0.0
$2.0
$4.0
$6.0
$8.0
$10.0
$12.0
2011Q4
2012Q1
2012Q2
2012Q3
2012Q4
2013Q1
2013Q2
2013Q3
2013Q4
2014Q1
2014Q2
2014Q3
2014Q4
2015Q1
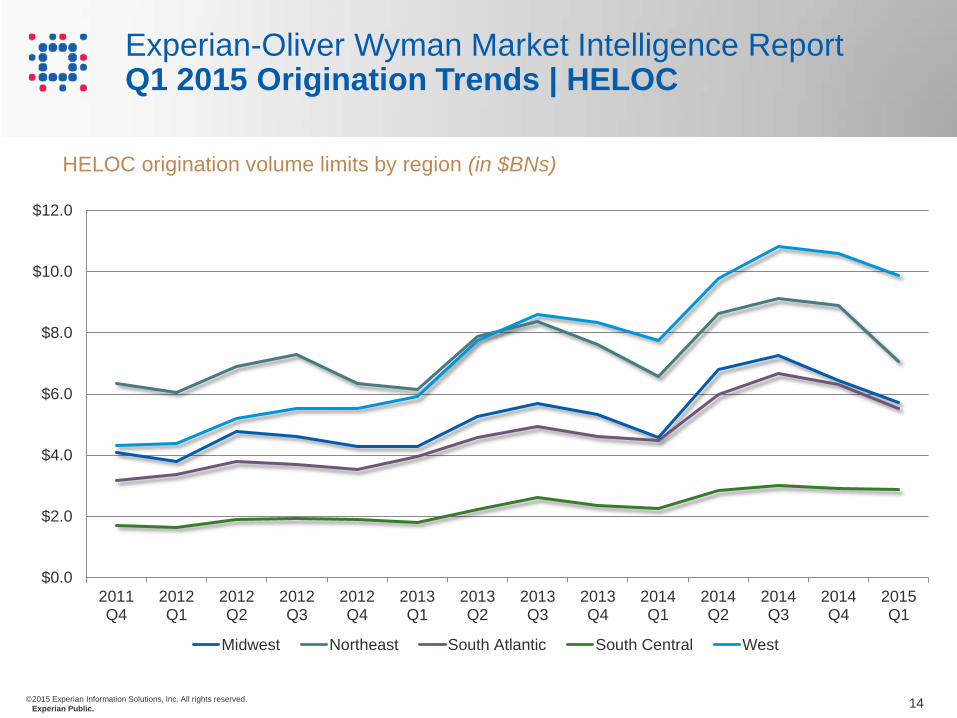
Midwest Northeast South Atlantic South Central West
Experian-Oliver Wyman Market Intelligence Report Q1 2015 Origination Trends | HELOC
HELOC origination volume limits by region (in $BNs)

15 © 2015 Experian Information Solutions, Inc. All rights reserved. Experian Public.
0.0%
0.2%
0.4%
0.6%
0.8%
1.0%
1.2%
2011Q4
2012Q1
2012Q2
2012Q3
2012Q4
2013Q1
2013Q2
2013Q3
2013Q4
2014Q1
2014Q2
2014Q3
2014Q4
2015Q1
30-59 60-89 90-180
HELOC delinquency rates as % of balances
Experian-Oliver Wyman Market Intelligence Report Q1 2015 Delinquency Trends | HELOC
16 © 2015 Experian Information Solutions, Inc. All rights reserved. Experian Public.
0.0%
0.2%
0.4%
0.6%
0.8%
1.0%
1.2%
1.4%
1.6%
3 6 9 12 15 18 21 24
Months after origination
2008 Q2 2009 Q2 2010Q2 2011Q2 2012Q2 2013Q2 2014Q2
Experian-Oliver Wyman Market Intelligence Report Q1 2015 Delinquency Trends | HELOC
Vintage performance | 30+ delinquency rates as % of trades
17 © 2015 Experian Information Solutions, Inc. All rights reserved. Experian Public.
Bankcard Trends

18 © 2015 Experian Information Solutions, Inc. All rights reserved. Experian Public.
$0
$10
$20
$30
$40
$50
$60
$70
$80
$90
2012Q2
2012Q3
2012Q4
2013Q1
2013Q2
2013Q3
2013Q4
2014Q1
2014Q2
2014Q3
2014Q4
2015Q1
$57 $57 $61 $59 $63 $68 $77 $71 $77 $81 $80 $77
Bankcard origination volume (in $BNs)
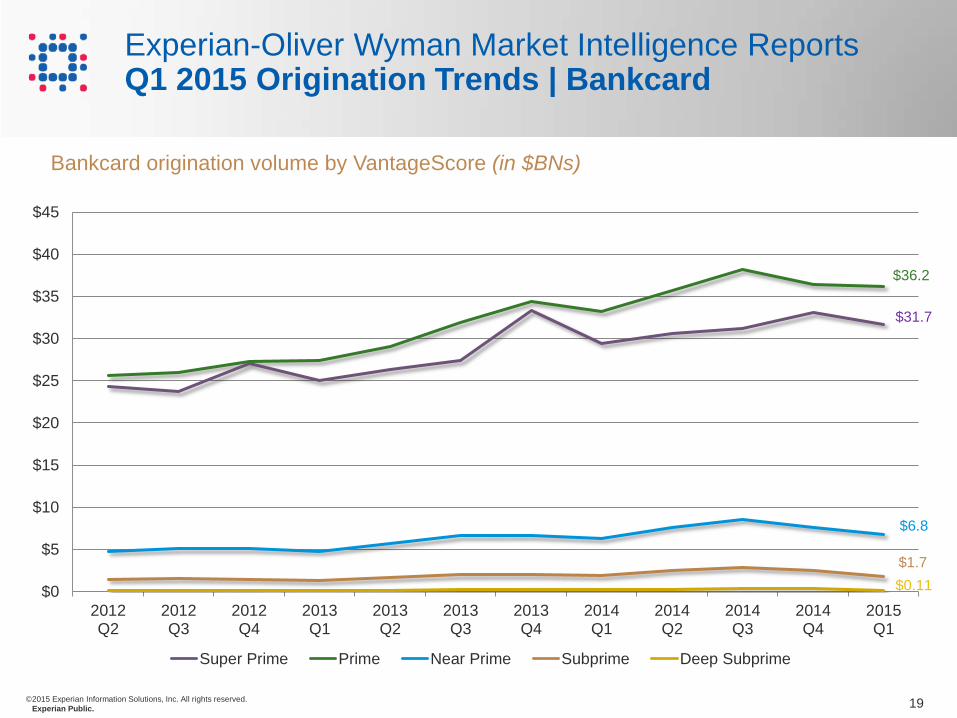
Experian-Oliver Wyman Market Intelligence Reports Q1 2015 Origination Trends | Bankcard
19 © 2015 Experian Information Solutions, Inc. All rights reserved. Experian Public.
$36.2
$6.8
$1.7
$0
$5
$10
$15
$20
$25
$30
$35
$40
$45
2012Q2
2012Q3
2012Q4
2013Q1
2013Q2
2013Q3
2013Q4
2014Q1
2014Q2
2014Q3
2014Q4
2015Q1
Super Prime Prime Near Prime Subprime Deep Subprime
Experian-Oliver Wyman Market Intelligence Reports Q1 2015 Origination Trends | Bankcard
Bankcard origination volume by VantageScore (in $BNs)
$0.11
$31.7

20 © 2015 Experian Information Solutions, Inc. All rights reserved. Experian Public.
$0
$2,000
$4,000
$6,000
$8,000
$10,000
$12,000
SuperPrime
Prime NearPrime
Subprime DeepSubprime
Q1 2014 Q1 2015
Average limit per new trade by VantageScore (in $s)
-30.0%
-25.0%
-20.0%
-15.0%
-10.0%
-5.0%
0.0%
Super Prime Prime Near Prime
Subprime Deep Subprime
-0.6% -3.2%
-17.5%
-8.8%
-25.9%
Experian-Oliver Wyman Market Intelligence Reports Q1 2015 Origination Trends | Bankcard
YoY % change in average limit by VantageScore
$9,604
$5,209
$2,277
$966 $509
$9,543
$5,382
$2,497
$1,171 $686
21 © 2015 Experian Information Solutions, Inc. All rights reserved. Experian Public.
0%
1%
2%
3%
4%
5%
6%
7%
8%
9%
550
560
570
580
590
600
610
620
630
640
650
2012Q2
2012Q3
2012Q4
2013Q1
2013Q2
2013Q3
2013Q4
2014Q1
2014Q2
2014Q3
2014Q4
2015Q1
Balances O/S Unemployment
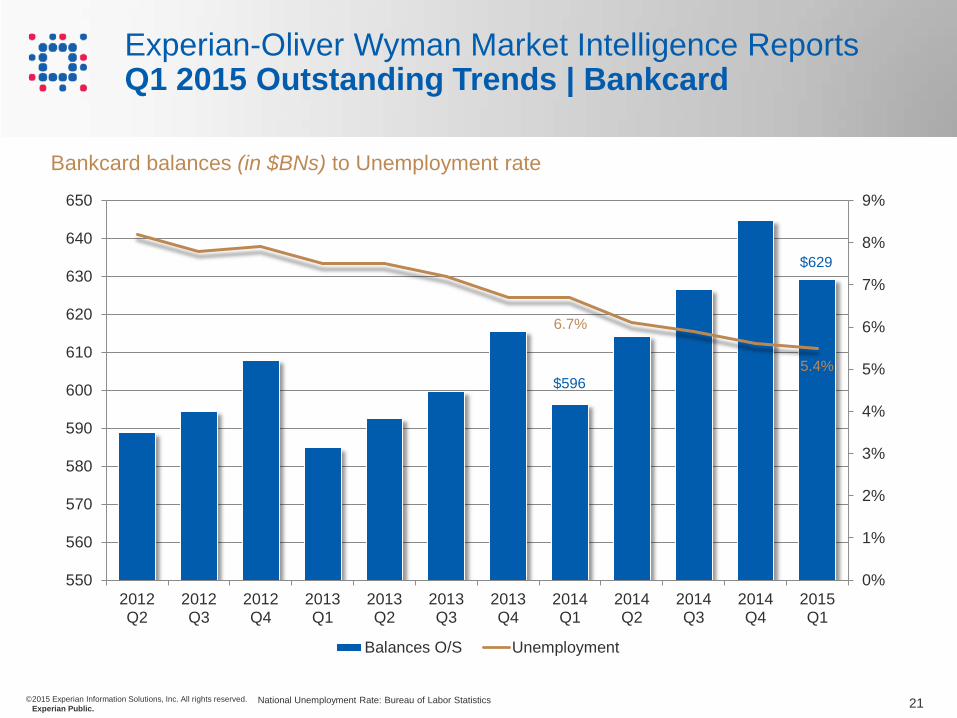
Experian-Oliver Wyman Market Intelligence Reports Q1 2015 Outstanding Trends | Bankcard
Bankcard balances (in $BNs) to Unemployment rate
National Unemployment Rate: Bureau of Labor Statistics
6.7%
$629
5.4% $596

22 © 2015 Experian Information Solutions, Inc. All rights reserved. Experian Public.
0.0%
0.5%
1.0%
1.5%
2.0%
2.5%
3.0%
3.5%
4.0%
4.5%
5.0%
2012Q2
2012Q3
2012Q4
2013Q1
2013Q2
2013Q3
2013Q4
2014Q1
2014Q2
2014Q3
2014Q4
2015Q1
30-59 DPD 60-89 DPD 90-180 DPD Charge-offs
Bankcard delinquency rates as % of balances
Experian-Oliver Wyman Market Intelligence Reports Q1 2015 Delinquency Trends | Bankcard
4.33%
1.28%
0.78%
0.48%

23 © 2015 Experian Information Solutions, Inc. All rights reserved. Experian Public.
Auto Trends

24 © 2015 Experian Information Solutions, Inc. All rights reserved. Experian Public.
$0
$20
$40
$60
$80
$100
$120
$140
$160
2012Q2
2012Q3
2012Q4
2013Q1
2013Q2
2013Q3
2013Q4
2014Q1
2014Q2
2014Q3
2014Q4
2015Q1
$107 $116 $109 $115 $132 $135 $121 $127 $142 $146 $133 $134
Auto origination volume (in $BNs) $555BN
+8%
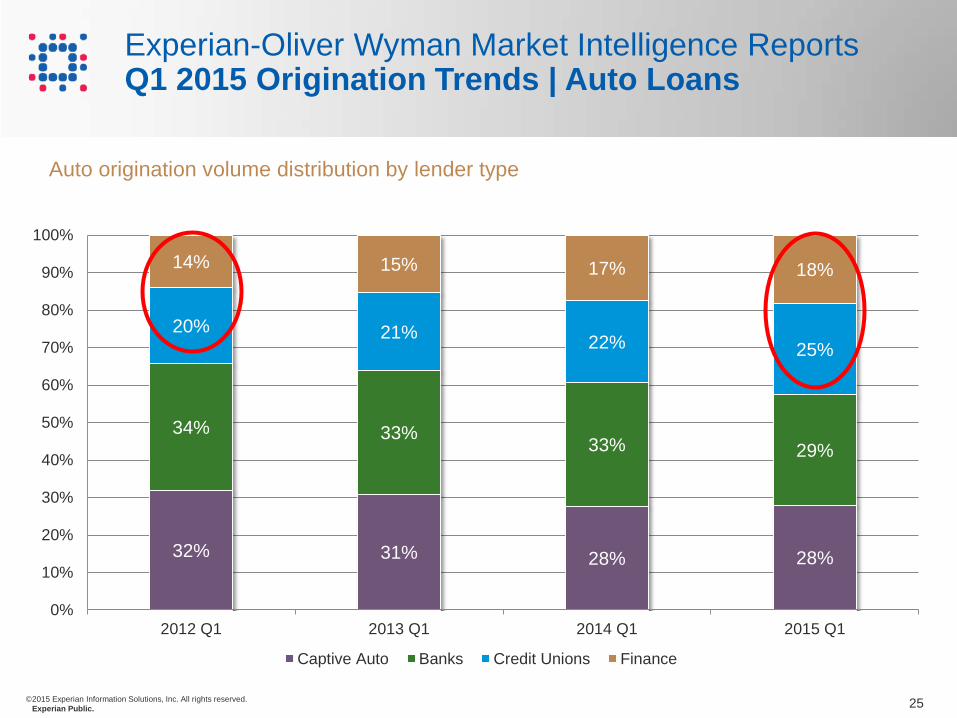
Experian-Oliver Wyman Market Intelligence Reports Q1 2015 Origination Trends | Auto Loans
$515BN
25 © 2015 Experian Information Solutions, Inc. All rights reserved. Experian Public.
32% 31% 28% 28%
34% 33% 33% 29%
20% 21% 22% 25%
14% 15% 17% 18%
0%
10%
20%
30%
40%
50%
60%
70%
80%
90%
100%
2012 Q1 2013 Q1 2014 Q1 2015 Q1
Captive Auto Banks Credit Unions Finance
Experian-Oliver Wyman Market Intelligence Reports Q1 2015 Origination Trends | Auto Loans
Auto origination volume distribution by lender type
26 © 2015 Experian Information Solutions, Inc. All rights reserved. Experian Public.
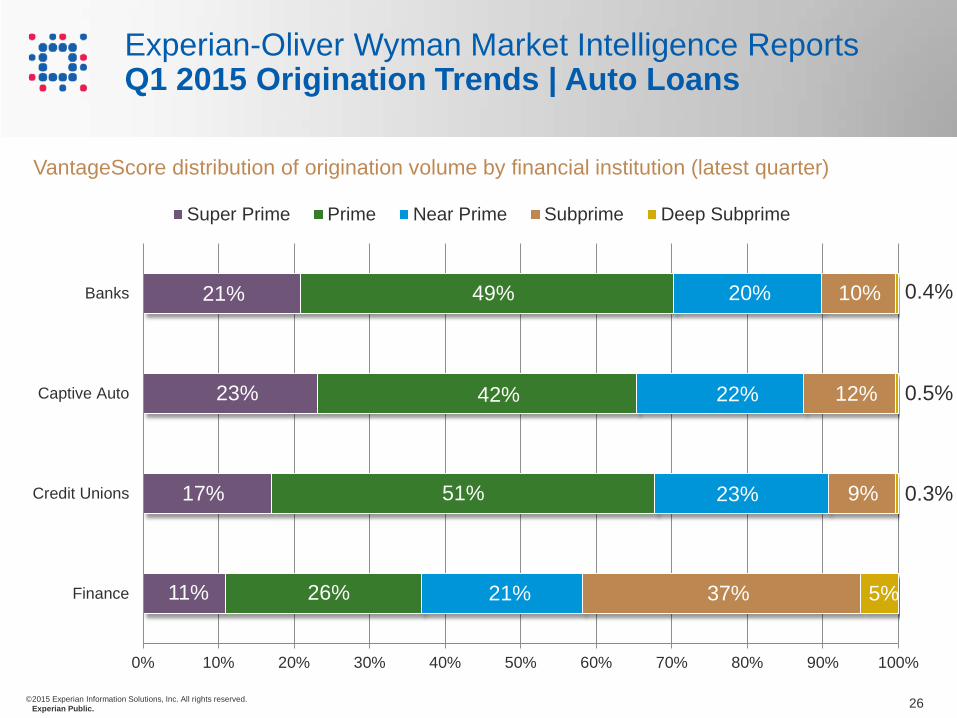
Finance
Credit Unions
Captive Auto
Banks
0% 10% 20% 30% 40% 50% 60% 70% 80% 90% 100%
Super Prime Prime Near Prime Subprime Deep Subprime
Experian-Oliver Wyman Market Intelligence Reports Q1 2015 Origination Trends | Auto Loans
VantageScore distribution of origination volume by financial institution (latest quarter)
21% 10% 20% 49%
42% 23% 22% 12%
17% 51% 23% 9%
11% 26% 21% 37% 5%
0.4%
0.5%
0.3%
27 © 2015 Experian Information Solutions, Inc. All rights reserved. Experian Public.
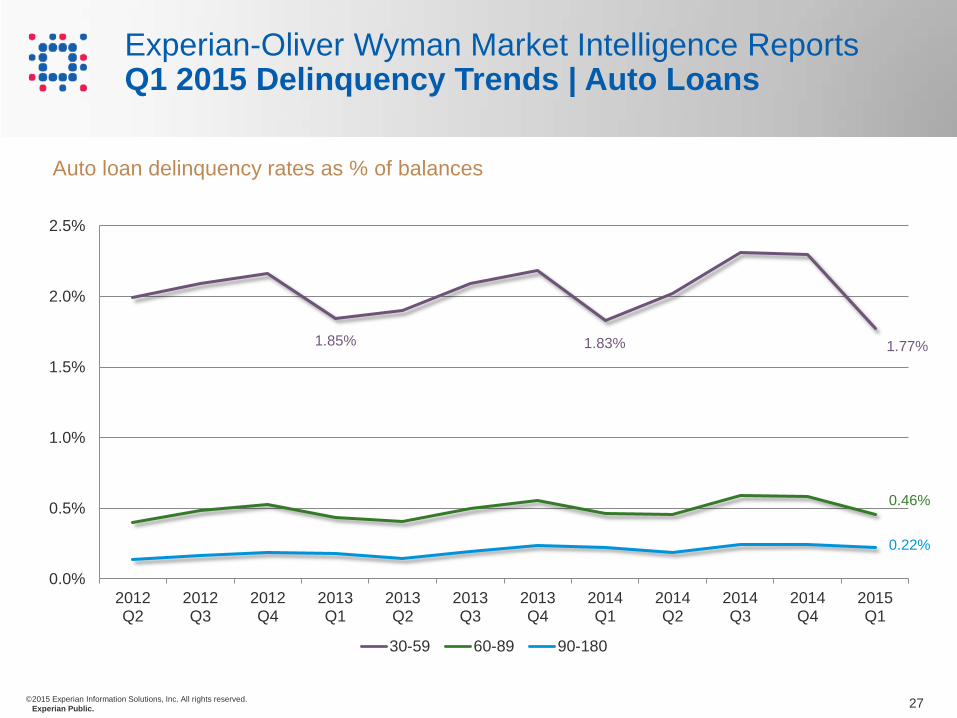
0.0%
0.5%
1.0%
1.5%
2.0%
2.5%
2012Q2
2012Q3
2012Q4
2013Q1
2013Q2
2013Q3
2013Q4
2014Q1
2014Q2
2014Q3
2014Q4
2015Q1
30-59 60-89 90-180
Auto loan delinquency rates as % of balances
1.83% 1.85% 1.77%
Experian-Oliver Wyman Market Intelligence Reports Q1 2015 Delinquency Trends | Auto Loans
0.46%
0.22%

28 © 2015 Experian Information Solutions, Inc. All rights reserved. Experian Public.
Experian-Oliver Wyman Market Intelligence Report Q1 2015 Summary
Economy slowed in the quarter, but steady ► Unemployment continues to decline ► GDP relatively flat; consumer confidence stable
Real estate showing signs of life ► 1st Mortgage: 25% increase YoY ► HELOC originations: still generating over $30BN/quarter ► Strong loan performance for both portfolios
Bankcard increases, but slower than prior quarters ► 8% YoY and 6% YoY for originations and balances, respectively ► Delinquency remains near all-time lows
Auto growing through continuing channel diversification ► 6% YoY growth; Credit Unions and Finance categories now
represent over 40% of originations ► Delinquency back in check after slight upticks in previous
quarters

29 © 2015 Experian Information Solutions, Inc. All rights reserved. Experian Public.
Experian-Oliver Wyman Market Intelligence Report IntelliView
*NEW* Segment by Experian-exclusive scores
*NEW* Overlay key macroeconomic indicators
A unique combination of industry leading assets from Experian and Oliver Wyman
Benchmark your portfolio performance against peers and industry to gain a competitive advantage
Quickly and easily respond to what-if scenarios and run multiple iterations as needed
IntelliView v1.2 now available!
30 © 2015 Experian Information Solutions, Inc. All rights reserved. Experian Public.
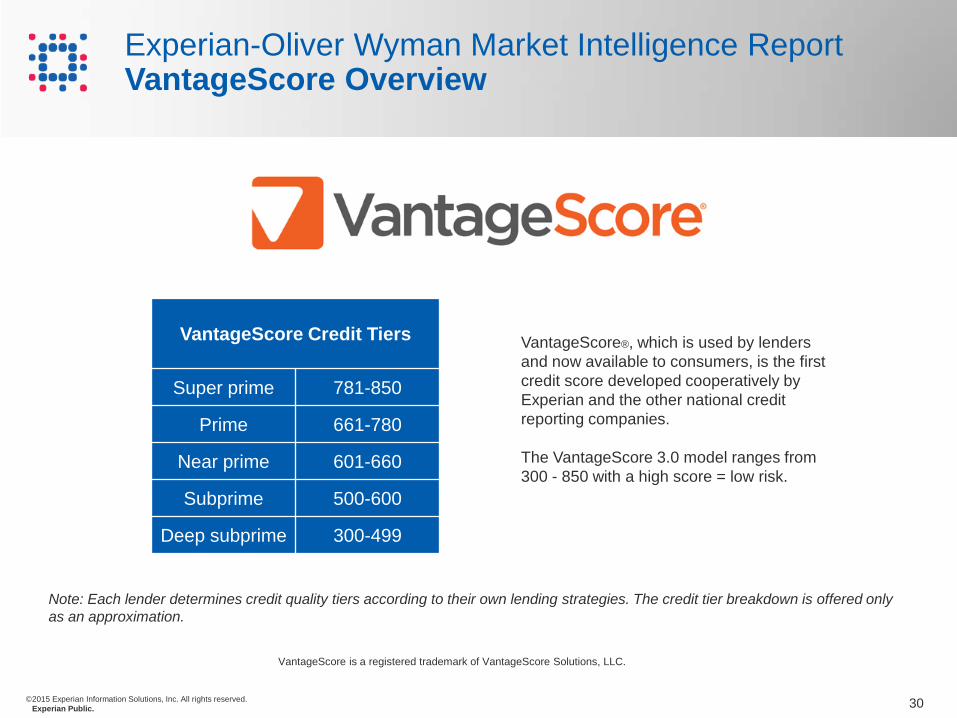
Experian-Oliver Wyman Market Intelligence Report VantageScore Overview
VantageScore Credit Tiers
Super prime 781-850
Prime 661-780
Near prime 601-660
Subprime 500-600
Deep subprime 300-499
VantageScore®, which is used by lenders and now available to consumers, is the first credit score developed cooperatively by Experian and the other national credit reporting companies. The VantageScore 3.0 model ranges from 300 - 850 with a high score = low risk.
Note: Each lender determines credit quality tiers according to their own lending strategies. The credit tier breakdown is offered only as an approximation.
VantageScore is a registered trademark of VantageScore Solutions, LLC.
