highlights maiden jorc resource of for personal use only · 2016-02-28 · highlights • maiden...
TRANSCRIPT

Highlights • Maiden JORC resource of 131.1Mt @7.9% TGC at the Mahenge Project
• 10.4Mt of contained graphite with 40% of resource tonnes in the Indicated category
• High grade portion of 37.6Mt @10.2% TGC or 16.6 Mt @11.1% TGC
• Third largest graphite resource in Africa, or fourth largest Globally (JORC compliant)
• Scoping study results expected in March and graphite marketing underway
Black Rock Mining Limited (ASX.BKT) (“Black Rock Mining” or “the Company”) is pleased to announce the maiden JORC Mineral Resource from its 100% owned Mahenge Project in Tanzania.
The global resource of 131.1Mt@ 7.9% TGC hosts 10.4Mt of contained graphite, making the Mahenge Project the largest and highest grade flake graphite resource in Tanzania. In Global terms, Mahenge is the third largest JORC compliant graphite resource in Africa or the fourth largest in the World.
Chairman Stephen Copulos commented: “This large-scale maiden resource is an excellent outcome for Black Rock Mining shareholders and justifies our commitment to explore the Mahenge region. Credit goes to our highly capable exploration team for discovering, mapping and drilling the bulk of the resource in a six-month period, and thanks go to our shareholders for their strong support during the exploration phase. The large resource with significant higher-grade portions and straightforward metallurgy are the key building blocks for the current scoping study. Early stage conceptual economic studies are quite positive and we expect to release the scoping study findings in March”.
The large Mahenge mineral resource offers significant flexibility for potential development into a long life (+30 year) mining operation. It has potential to be mined from multiple zones at low strip ratios, high-graded to accelerate capital payback in early years and can be scaled up in future due to the large resource. Metallurgical test work indicates straightforward production of coarse graphite flake with excellent purities. The scoping study will be released in March and if positive will lead directly into a pre-feasibility study (PFS). Significant interest has been expressed by engineering contractors to conduct the PFS.
Our objective is to commercialise the Mahenge Project. The current scoping study is near completion and will provide high-level project economic data. The Company expects this to lead into a detailed pre feasibility study during the June Quarter to generate detailed information on mining, processing and plant costs. Metallurgical work is planned to continue after the first phase report is released in March with the objective of further improving graphite product specifications. The Marketing process is well underway following the appointment of an experienced commodities marketing specialist in earlier in the year.
Black Rock Mining delivers the largest and highest-grade graphite resource in Tanzania
29 February 2016
For
per
sona
l use
onl
y
2
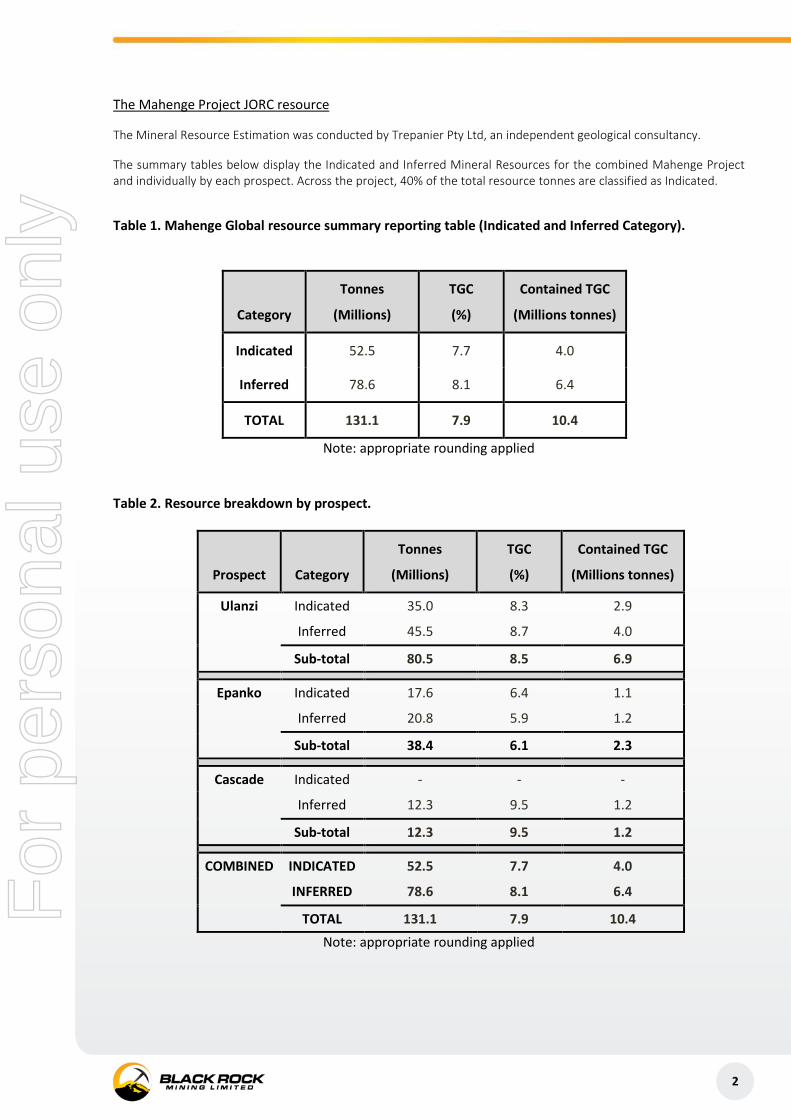
The Mahenge Project JORC resource
The Mineral Resource Estimation was conducted by Trepanier Pty Ltd, an independent geological consultancy.
The summary tables below display the Indicated and Inferred Mineral Resources for the combined Mahenge Project and individually by each prospect. Across the project, 40% of the total resource tonnes are classified as Indicated.
Table 1. Mahenge Global resource summary reporting table (Indicated and Inferred Category).
Category
Tonnes
(Millions)
TGC
(%)
Contained TGC
(Millions tonnes)
Indicated 52.5 7.7 4.0
Inferred 78.6 8.1 6.4
TOTAL 131.1 7.9 10.4
Note: appropriate rounding applied Table 2. Resource breakdown by prospect.
Prospect Category
Tonnes
(Millions)
TGC
(%)
Contained TGC
(Millions tonnes)
Ulanzi Indicated 35.0 8.3 2.9
Inferred 45.5 8.7 4.0
Sub-total 80.5 8.5 6.9
Epanko Indicated 17.6 6.4 1.1
Inferred 20.8 5.9 1.2
Sub-total 38.4 6.1 2.3
Cascade Indicated - - -
Inferred 12.3 9.5 1.2
Sub-total 12.3 9.5 1.2
COMBINED INDICATED 52.5 7.7 4.0
INFERRED 78.6 8.1 6.4
TOTAL 131.1 7.9 10.4 Note: appropriate rounding applied
For
per
sona
l use
onl
y

3
Mahenge Project global resource breakdown by cut-off grades
Table 3 and Figure 1 below shows the Mahenge global resource at varying cut-off grades and the corresponding grade-tonnage curve respectively. Of note is that a significant high-grade resource is contained within the global 131.1Mt @7.9% TGC resource. At a 9% cut-off, a high-grade portion of 37.6Mt@ 10.2% TGC is available (highlighted) or at a 10% cut-off, a 16.6.Mt resource exists at 11.1% TGC. Table 3. Mahenge global resource by grade cut-off.
Figure 1.Global Mahenge TGC% grade-tonnage curve.
3-D Resource Images
For
per
sona
l use
onl
y

4
The following images show the elevated surface expression of the Epanko north, Ulanzi and Cascade resources, and their extensions to depth (Figures 2 & 3). The bodies of mineralisation show excellent geological continuity along strike and down dip. Very low strip ratios are anticipated with a large portion of the mineral resource favorably positioned along the steep ridges forming topographic highs. The high grade Cascade zone of mineralisation shows significant potential to the south and will be the target of further drilling in the June quarter.
Figure 2. Epanko resource outline projected from surface to depth – view looking -45° to 330.
Figure 3. Ulanzi and Cascade resource outlines projected from surface– view looking -35° to 000°.
Ulanzi
Cascade For
per
sona
l use
onl
y
5
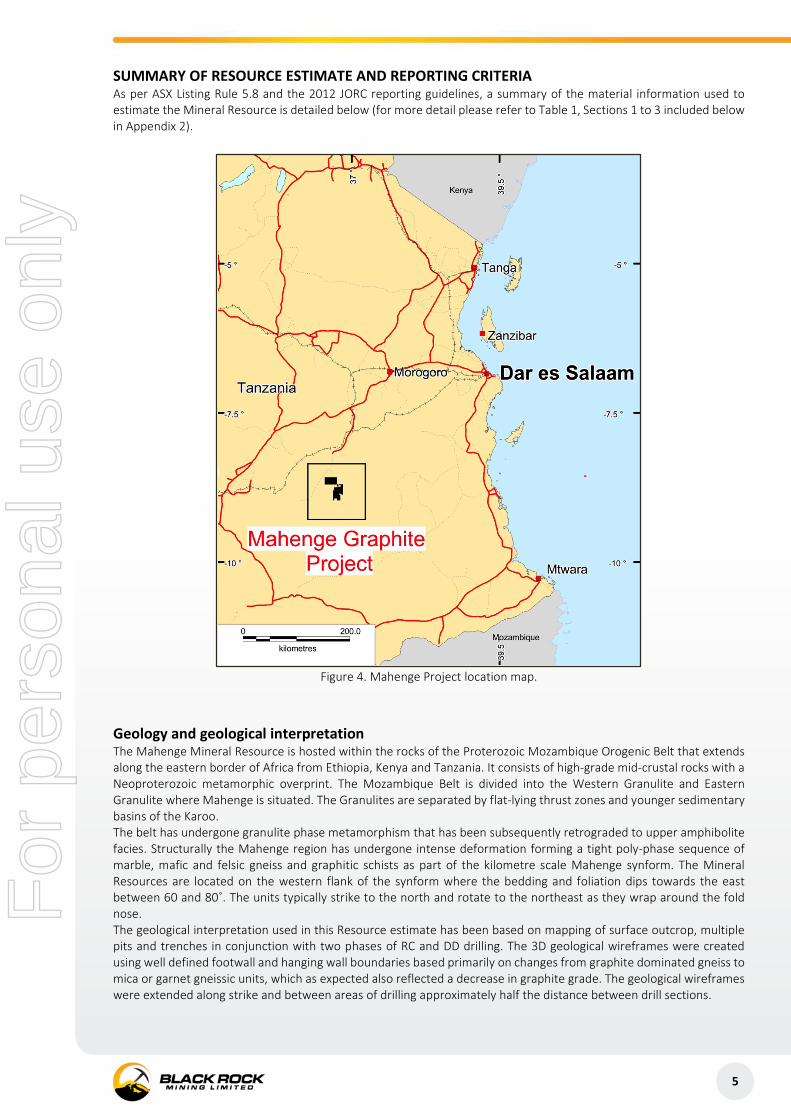
SUMMARY OF RESOURCE ESTIMATE AND REPORTING CRITERIA As per ASX Listing Rule 5.8 and the 2012 JORC reporting guidelines, a summary of the material information used to estimate the Mineral Resource is detailed below (for more detail please refer to Table 1, Sections 1 to 3 included below in Appendix 2).
Figure 4. Mahenge Project location map.
Geology and geological interpretation The Mahenge Mineral Resource is hosted within the rocks of the Proterozoic Mozambique Orogenic Belt that extends along the eastern border of Africa from Ethiopia, Kenya and Tanzania. It consists of high-grade mid-crustal rocks with a Neoproterozoic metamorphic overprint. The Mozambique Belt is divided into the Western Granulite and Eastern Granulite where Mahenge is situated. The Granulites are separated by flat-lying thrust zones and younger sedimentary basins of the Karoo. The belt has undergone granulite phase metamorphism that has been subsequently retrograded to upper amphibolite facies. Structurally the Mahenge region has undergone intense deformation forming a tight poly-phase sequence of marble, mafic and felsic gneiss and graphitic schists as part of the kilometre scale Mahenge synform. The Mineral Resources are located on the western flank of the synform where the bedding and foliation dips towards the east between 60 and 80˚. The units typically strike to the north and rotate to the northeast as they wrap around the fold nose. The geological interpretation used in this Resource estimate has been based on mapping of surface outcrop, multiple pits and trenches in conjunction with two phases of RC and DD drilling. The 3D geological wireframes were created using well defined footwall and hanging wall boundaries based primarily on changes from graphite dominated gneiss to mica or garnet gneissic units, which as expected also reflected a decrease in graphite grade. The geological wireframes were extended along strike and between areas of drilling approximately half the distance between drill sections.
For
per
sona
l use
onl
y

6
Figure 5. Tenement map. The resource is contained entirely within PL7802/2012. Green outlines are graphitic schists mapped in
the tenements; blue solid outlines show the locations of the Ulanzi, Epanko North and Cascade Resource locations.
Drilling techniques and hole spacing The Mahenge estimation has been based on a combination of reverse circulation (RC) and diamond core (DD) drilling with the majority of the sample and geological data from two campaigns of RC (6inch) and DD drilling (PQ and HQ). The Company has used 100m x 100m, 100m x 50m and 50m x 50m grid drill spacing, which has been sufficient to show geological, and grade continuity. The drilling has been oriented perpendicular to the mineralisation or as close to perpendicular as possible subject to drill access. The drill collars have been surveyed using a high accuracy differential global position (DGPS) measurements for the X/Y co-ordinates and the Z component extracted from intersecting the collar position with a high quality digital terrain model and photographic imagery flown for the Company. There is a high degree of confidence in the locations of the collars and trenches based on numerous DGPS pick-ups and the high definition topographic and photographic survey. Sampling and sub-sampling techniques The trenches were sampled using 2m composites with samples taken from in-situ oxide, transition or fresh rock as a continuous chip channel sample across the trench wall. Pit samples were taken as individual point samples at the base of the pit. The surface samples weighed between 2.5 and 3.5kg. A high degree of care was taken to ensure no transported material was sampled from the trenches or pits. There was no sub-sampling from the pits or trenches.
For
per
sona
l use
onl
y

7
At the drill rig the RC samples were split using a 3-tier riffle splitter to 1m intervals then composited as two x 1m samples with a combined weight of approximately 3.0kg. Samples in excess of 3kg were riffle split to reduce the weight to approximately 3kg. The calico samples bags were uniquely numbered and recorded prior to bagging in polyweave bags. After geological and geotechnical logging the diamond core was half cored and then quarter cored. The quarter core was composited to 2m intervals which were placed into uniquely numbered calico bags and then bagged into polyweaves. All of the polyweave bags were secured with a numbered plastic security tag prior to submission to the. There were no sub-sampling techniques past the sample dispatch from Mahenge. Sample analysis method The trench, RC and diamond core samples were sent to Mwanza in Tanzania for preparation and the pulps were then sent to Brisbane for carbon analysis using Total Graphitic Carbon (TGC) C-IR18 LECO Total Carbon. Graphitic C is determined by digesting sample in 50% HCl to evolve carbonate as CO2. Residue is filtered, washed, dried and then roasted at 425C. The roasted residue is analysed for carbon by high temperature Leco furnace with infrared detection. Method Precision is ± 15% with a reporting limit of 0.02 to 100% All TGC analysis has been carried out by certified laboratory – ALSchemex. TGC is the most appropriate method to analyse for graphitic carbon and it is a total analysis. ALSChemex inserted its own standards and blanks and completed its own QAQC for each batch of samples. No failures were reported. Black Rock has employed its own QA/QC strategy that involved field duplicates, blanks, insertion of certified reference material and check analysis using a secondary laboratory. The Company is satisfied that TGC results are accurate and precise and no systematic bias has been introduced. Deleterious element analysis was also conducted using a multi-element ICP method. Cut-off grades Grade envelopes have been wireframed to an approximate 4 to 5% TGC cut-off allowing for continuity of the mineralised zones. Based on visual and statistical analysis of the drilling results and geological logging of the graphite rich zones, this cut-off tends to be a natural geological change and coincides with the contact between the graphite rich gneiss and the other adjacent country rocks (i.e. garnet gneisses and occasional marbles). Estimation Methodology Drilling, surface test pit, trench sampling and geological mapping data was utilised to control the interpretation of the mineralised zones. Six domains were wireframed to with contacts determined by coincident geology (graphitic gneiss) and a significant increase in TGC grade (> 4-5% TGC). Grade estimation was by Ordinary Kriging (“OK”) for Total Graphitic Carbon (TGC %) using GEOVIA Surpac™ software into the 6 domains. The estimate was resolved into 10m (E) x 25m (N) x 10m (RL) parent cells that had been sub-celled at the domain boundaries for accurate domain volume representation. Estimation parameters were based on the variogram models, data geometry and kriging estimation statistics. Potential top-cuts were evaluated by completing an outlier analysis using a combination of methods including grade histograms, log probability plots and other statistical tools. Based on this statistical analysis of the data population, no top-cuts were required. Classification criteria The Mineral Resource has been classified on the basis of confidence in the geological model, continuity of mineralised zones, drilling density, available mapping, pit sampling and trenching data, confidence in the underlying database and the available bulk density information. The Mahenge Mineral Resource in part has been classified as Indicated with the remainder as Inferred according to JORC 2012. Minimum drill spacing for Indicated Resources is 100m (northing) by 50-75m (easting) with larger drill spacing zones categorized as Inferred Resources. Mining and metallurgical methods and parameters Initial indications are that the Mineral Resources at Mahenge will be amendable to conventional open pit mining with low strip ratios and conventional crush, grind and flotation processing to produce a potential saleable graphite concentrate. Metallurgical sample composites were prepared at Bureau Veritas Minerals laboratory in Perth from 1/2 cut diamond drill core from the DD drilling programmes. The representative composite samples comprise: Epanko North fresh, Epanko oxide, Ulanzi fresh and Ulanzi oxide materials. The ore composites were generated to assess the ore's amenability to beneficiation by froth flotation and also to identify the nature, flake size and occurrence of the graphite in a selection of drill core samples and flotation products.
For
per
sona
l use
onl
y

8
Preliminary metallurgical test work on the fresh (primary) mineralisation for Epanko north has returned the following results (refer to ASX announcement 22/02/2016):
• 54.2% of the flake size falls within the coarse (>180 micron) and very coarse (jumbo) flake in concentrate with
average grades in concentrate of 98.27% TGC
• 86.2% of the flake size greater than 75microns in size has a weighted average of 97.88% TGC
• High purity and coarse flake concentrate achieved through a straight forward three-stage flotation process
The Company believes that the combination of large tonnage, high TGC grades, potential for low cost mining and straightforward conventional processing, the Mahenge project could produce a saleable graphite concentrate and shows good potential for economic extraction. Cross sections
Figures 6,7, and 8 show cross sectional views at Ulanzi, Epanko north and Cascades.
Figure 6. Ulanzi cross section at 9041850N.
For
per
sona
l use
onl
y

9
Figure 7. Epanko north combined Cross section using sections 9037 550 and 9037600N.
Figure 8. Cascades cross section at 9041850N.
For
per
sona
l use
onl
y

10
Figure 9. View of Ulanzi block model.
Additional Drill programme for April/May 2016
The next drill programme post the conclusion of the wet season is planned for the June Quarter to:
1. Define additional zones of high-grade surface mineralisation at Ulanzi, particularly the eastern flank
2. Convert a higher proportion of the current Inferred resource into the Indicated category by increasing drill hole density
3. Establish a larger resource from the 1km long Cascades west lode at sufficient drillhole density to return Indicated classification and obtain core samples for metallurgical test work of this zone
The Company anticipates an increase in the resource size however the primary aim is to increase the confidence in the resource and report a higher proportion to Indicated Mineral Resources with an emphasis on delineating near surface high-grade zones. This is expected to improve potential project economics.
Whilst there is excellent potential to further increase the size of the Mahenge resource by drilling along strike of existing resource areas, the Company believes it has a sufficient resource size as stands and will focus on maximizing the near surface high grade potential. A reconnaissance exploration programme is planned for the Epanko northeast structure and Kituti, targeting zones with potential for >15% TGC mineralisation as satellite pits.
For
per
sona
l use
onl
y

11
Summary
• The Mahenge project has delivered the largest and highest grade flake deposit in Tanzania with a maiden
global resource of 131.1Mt @7.9% TGC and 40% of resource tonnes in the Indicated category. It is the
fourth largest JORC graphite resource in the World
• Within this resource is a higher grade portion of 37.6Mt @ 10.2% TGC, or 16.6Mt@ 11.1% TGC, providing
potential to selectively mine higher grade portions
• Metallurgical test work indicates a high proportion of coarse flake at high purities can be processed
through a relatively simple three stage flotation process
• Scoping studies are well advanced with results expected in March. Marketing work is underway
Overall, this is an excellent outcome for shareholders. The Mahenge project has potential to deliver attractive economics due to its large size, high grades and extensive surface outcrop that offers low strip ratios. Metallurgical studies to date indicate a straight forward processing flowsheet. The scoping study is progressing as planned and is expected to be released during March. The Company’s ongoing focus is to develop this resource into a low cost mining operation. For further information please contact: Mr. Steven Tambanis Mr. Gabriel Chiappini
Managing Director Director
Office: +61 8 9320 7550 +61 8 9320 7550
Email: [email protected] Email: [email protected]
About Black Rock Mining
Black Rock Mining Limited is an Australian based company listed on the Australian Securities Exchange. The Company has graphite tenure in the Mahenge region, Tanzania, a country which hosts World-class graphite mineralisation. Drilling of the Epanko north Ulanzi and Cascade prospects was completed in 2015. The Company plans to announce its Mahenge JORC compliant resource in February 2016. The company is building a skill and knowledge base to become an explorer, developer and diversified holder of graphite resources. Shareholder value will be added by:
• identifying and securing graphite projects with economic potential • focussing on tenure with scale potential that can be commercialised by converting into JORC compliant resources; and • taking these resources into production
Our focus is on establishing a JORC resource from three advanced prospects at Mahenge, whilst further adding resource upside through exploration at Kituti.
For
per
sona
l use
onl
y

12
Competent Person’s Statement
The information in this report that relates to Exploration Results and Exploration Targets is based on and fairly represents information and supporting documentation prepared by Mr Steven Tambanis (Managing Director of Black Rock Mining Limited). Mr Tambanis is a member of the Australian Institute of Mining and Metallurgy and has sufficient experience of relevance to the styles of mineralisation and types of deposits under consideration, and to the activities undertaken to qualify as Competent Persons as defined in the 2012 Edition of the Joint Ore Reserves Committee (JORC) Australasian Code for Reporting of Exploration Results, Mineral Resources and Ore Reserves. Mr Tambanis consents to the inclusion in this report of the matters based on his information in the form and context in which they appear. The information in this report that relates to Mineral Resources is based on and fairly represents information compiled by Mr Lauritz Barnes, (Consultant with Trepanier Pty Ltd) and Mr Steven Tambanis (Managing Director of Black Rock Mining Limited). Mr Barnes and Mr Tambanis are members of the Australian Institute of Mining and Metallurgy and have sufficient experience of relevance to the styles of mineralisation and types of deposits under consideration, and to the activities undertaken to qualify as Competent Persons as defined in the 2012 Edition of the Joint Ore Reserves Committee (JORC) Australasian Code for Reporting of Exploration Results, Mineral Resources and Ore Reserves. Specifically, Mr Tambanis is the Competent Person for the database, geological model and completed the site inspection. Mr Barnes is the Competent Person for the resource estimation. Mr Barnes and Mr Tambanis consent to the inclusion in this report of the matters based on their information in the form and context in which they appear.
For
per
sona
l use
onl
y
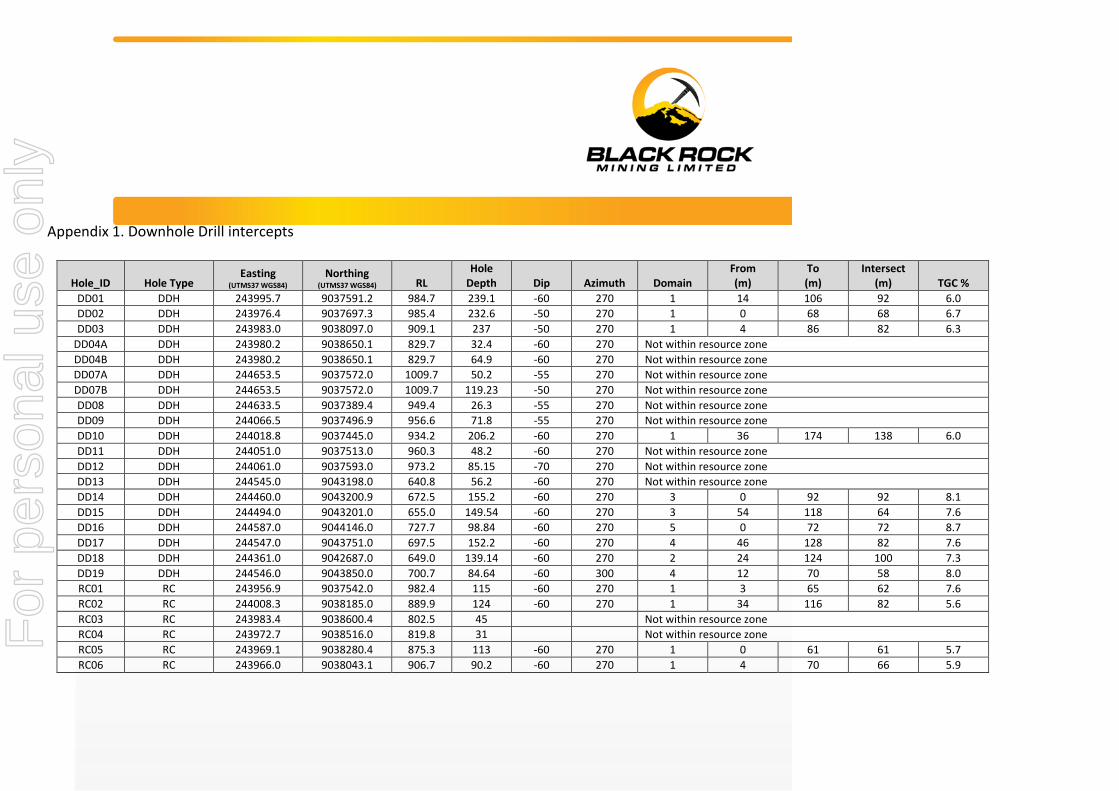
Appendix 1. Downhole Drill intercepts
Hole_ID Hole Type Easting
(UTMS37 WGS84) Northing
(UTMS37 WGS84) RL Hole
Depth Dip Azimuth Domain From (m)
To (m)
Intersect (m) TGC %
DD01 DDH 243995.7 9037591.2 984.7 239.1 -60 270 1 14 106 92 6.0 DD02 DDH 243976.4 9037697.3 985.4 232.6 -50 270 1 0 68 68 6.7 DD03 DDH 243983.0 9038097.0 909.1 237 -50 270 1 4 86 82 6.3
DD04A DDH 243980.2 9038650.1 829.7 32.4 -60 270 Not within resource zone DD04B DDH 243980.2 9038650.1 829.7 64.9 -60 270 Not within resource zone DD07A DDH 244653.5 9037572.0 1009.7 50.2 -55 270 Not within resource zone DD07B DDH 244653.5 9037572.0 1009.7 119.23 -50 270 Not within resource zone DD08 DDH 244633.5 9037389.4 949.4 26.3 -55 270 Not within resource zone DD09 DDH 244066.5 9037496.9 956.6 71.8 -55 270 Not within resource zone DD10 DDH 244018.8 9037445.0 934.2 206.2 -60 270 1 36 174 138 6.0 DD11 DDH 244051.0 9037513.0 960.3 48.2 -60 270 Not within resource zone DD12 DDH 244061.0 9037593.0 973.2 85.15 -70 270 Not within resource zone DD13 DDH 244545.0 9043198.0 640.8 56.2 -60 270 Not within resource zone DD14 DDH 244460.0 9043200.9 672.5 155.2 -60 270 3 0 92 92 8.1 DD15 DDH 244494.0 9043201.0 655.0 149.54 -60 270 3 54 118 64 7.6 DD16 DDH 244587.0 9044146.0 727.7 98.84 -60 270 5 0 72 72 8.7 DD17 DDH 244547.0 9043751.0 697.5 152.2 -60 270 4 46 128 82 7.6 DD18 DDH 244361.0 9042687.0 649.0 139.14 -60 270 2 24 124 100 7.3 DD19 DDH 244546.0 9043850.0 700.7 84.64 -60 300 4 12 70 58 8.0 RC01 RC 243956.9 9037542.0 982.4 115 -60 270 1 3 65 62 7.6 RC02 RC 244008.3 9038185.0 889.9 124 -60 270 1 34 116 82 5.6 RC03 RC 243983.4 9038600.4 802.5 45 Not within resource zone RC04 RC 243972.7 9038516.0 819.8 31 Not within resource zone RC05 RC 243969.1 9038280.4 875.3 113 -60 270 1 0 61 61 5.7 RC06 RC 243966.0 9038043.1 906.7 90.2 -60 270 1 4 70 66 5.9
For
per
sona
l use
onl
y
14
Hole_ID Hole Type Easting
(UTMS37 WGS84) Northing
(UTMS37 WGS84) RL Hole
Depth Dip Azimuth Domain From (m)
To (m)
Intersect (m) TGC %
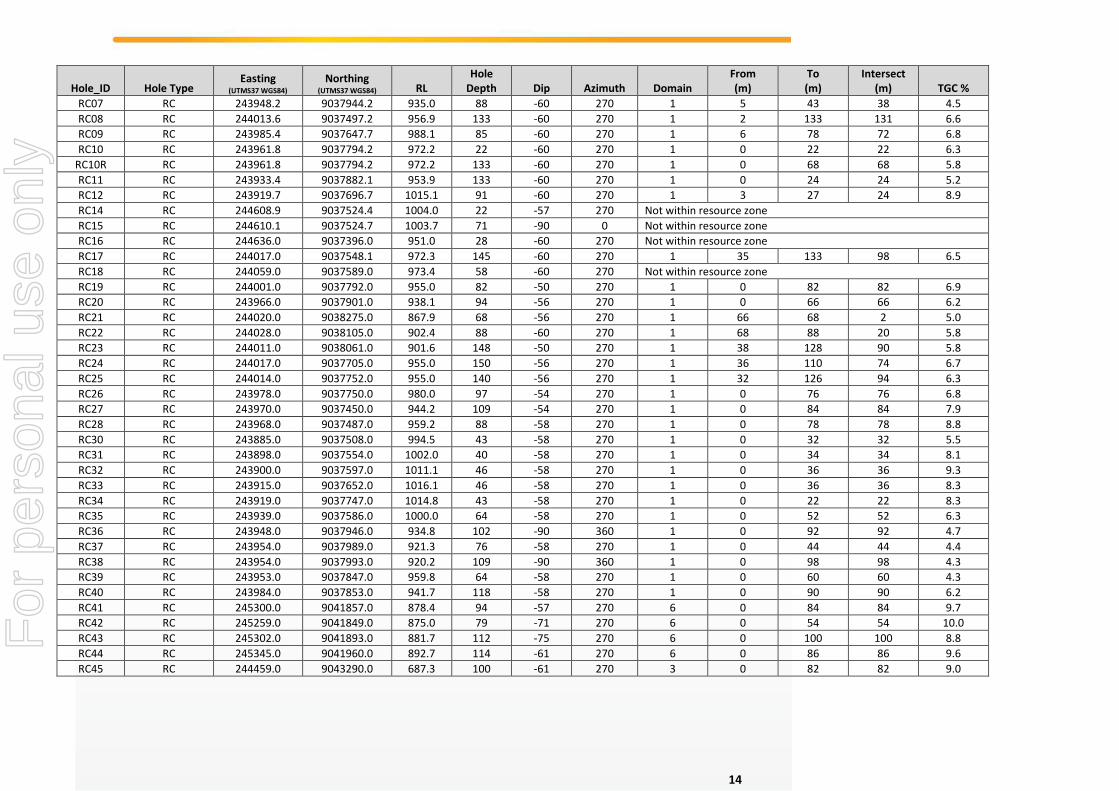
RC07 RC 243948.2 9037944.2 935.0 88 -60 270 1 5 43 38 4.5 RC08 RC 244013.6 9037497.2 956.9 133 -60 270 1 2 133 131 6.6 RC09 RC 243985.4 9037647.7 988.1 85 -60 270 1 6 78 72 6.8 RC10 RC 243961.8 9037794.2 972.2 22 -60 270 1 0 22 22 6.3
RC10R RC 243961.8 9037794.2 972.2 133 -60 270 1 0 68 68 5.8 RC11 RC 243933.4 9037882.1 953.9 133 -60 270 1 0 24 24 5.2 RC12 RC 243919.7 9037696.7 1015.1 91 -60 270 1 3 27 24 8.9 RC14 RC 244608.9 9037524.4 1004.0 22 -57 270 Not within resource zone RC15 RC 244610.1 9037524.7 1003.7 71 -90 0 Not within resource zone RC16 RC 244636.0 9037396.0 951.0 28 -60 270 Not within resource zone RC17 RC 244017.0 9037548.1 972.3 145 -60 270 1 35 133 98 6.5 RC18 RC 244059.0 9037589.0 973.4 58 -60 270 Not within resource zone RC19 RC 244001.0 9037792.0 955.0 82 -50 270 1 0 82 82 6.9 RC20 RC 243966.0 9037901.0 938.1 94 -56 270 1 0 66 66 6.2 RC21 RC 244020.0 9038275.0 867.9 68 -56 270 1 66 68 2 5.0 RC22 RC 244028.0 9038105.0 902.4 88 -60 270 1 68 88 20 5.8 RC23 RC 244011.0 9038061.0 901.6 148 -50 270 1 38 128 90 5.8 RC24 RC 244017.0 9037705.0 955.0 150 -56 270 1 36 110 74 6.7 RC25 RC 244014.0 9037752.0 955.0 140 -56 270 1 32 126 94 6.3 RC26 RC 243978.0 9037750.0 980.0 97 -54 270 1 0 76 76 6.8 RC27 RC 243970.0 9037450.0 944.2 109 -54 270 1 0 84 84 7.9 RC28 RC 243968.0 9037487.0 959.2 88 -58 270 1 0 78 78 8.8 RC30 RC 243885.0 9037508.0 994.5 43 -58 270 1 0 32 32 5.5 RC31 RC 243898.0 9037554.0 1002.0 40 -58 270 1 0 34 34 8.1 RC32 RC 243900.0 9037597.0 1011.1 46 -58 270 1 0 36 36 9.3 RC33 RC 243915.0 9037652.0 1016.1 46 -58 270 1 0 36 36 8.3 RC34 RC 243919.0 9037747.0 1014.8 43 -58 270 1 0 22 22 8.3 RC35 RC 243939.0 9037586.0 1000.0 64 -58 270 1 0 52 52 6.3 RC36 RC 243948.0 9037946.0 934.8 102 -90 360 1 0 92 92 4.7 RC37 RC 243954.0 9037989.0 921.3 76 -58 270 1 0 44 44 4.4 RC38 RC 243954.0 9037993.0 920.2 109 -90 360 1 0 98 98 4.3 RC39 RC 243953.0 9037847.0 959.8 64 -58 270 1 0 60 60 4.3 RC40 RC 243984.0 9037853.0 941.7 118 -58 270 1 0 90 90 6.2 RC41 RC 245300.0 9041857.0 878.4 94 -57 270 6 0 84 84 9.7 RC42 RC 245259.0 9041849.0 875.0 79 -71 270 6 0 54 54 10.0 RC43 RC 245302.0 9041893.0 881.7 112 -75 270 6 0 100 100 8.8 RC44 RC 245345.0 9041960.0 892.7 114 -61 270 6 0 86 86 9.6 RC45 RC 244459.0 9043290.0 687.3 100 -61 270 3 0 82 82 9.0
For
per
sona
l use
onl
y
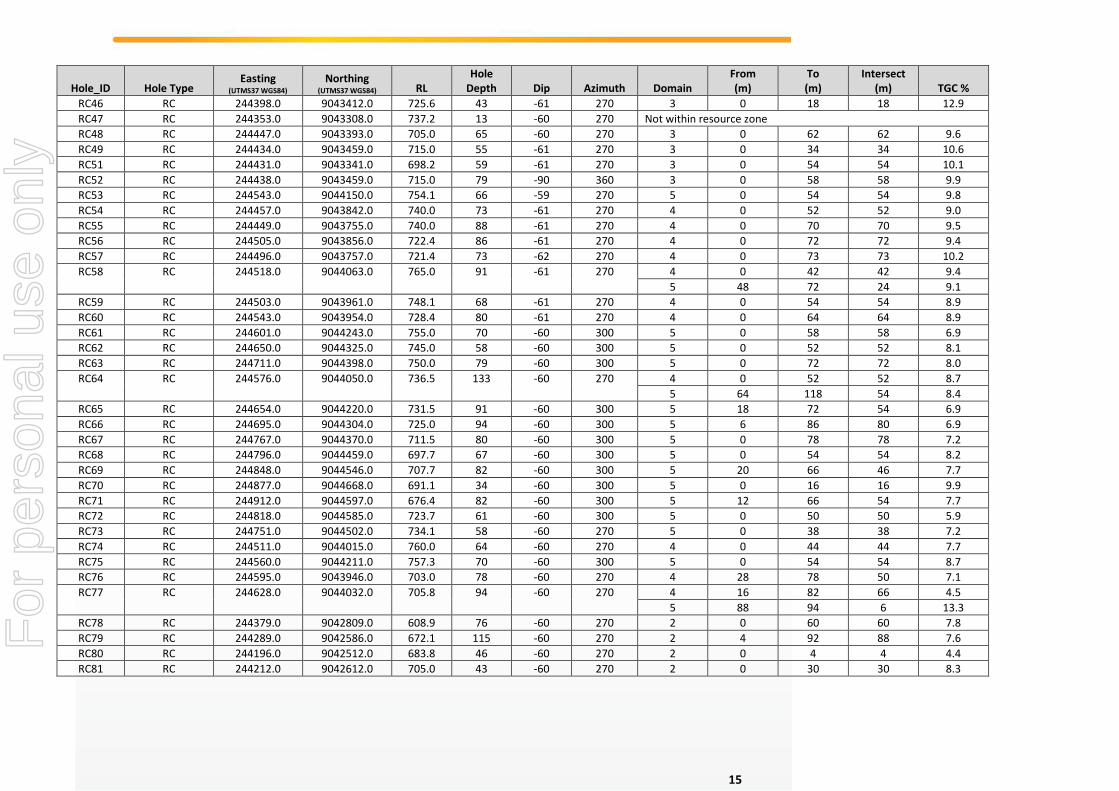
15
Hole_ID Hole Type Easting
(UTMS37 WGS84) Northing
(UTMS37 WGS84) RL Hole
Depth Dip Azimuth Domain From (m)
To (m)
Intersect (m) TGC %
RC46 RC 244398.0 9043412.0 725.6 43 -61 270 3 0 18 18 12.9 RC47 RC 244353.0 9043308.0 737.2 13 -60 270 Not within resource zone RC48 RC 244447.0 9043393.0 705.0 65 -60 270 3 0 62 62 9.6 RC49 RC 244434.0 9043459.0 715.0 55 -61 270 3 0 34 34 10.6 RC51 RC 244431.0 9043341.0 698.2 59 -61 270 3 0 54 54 10.1 RC52 RC 244438.0 9043459.0 715.0 79 -90 360 3 0 58 58 9.9 RC53 RC 244543.0 9044150.0 754.1 66 -59 270 5 0 54 54 9.8 RC54 RC 244457.0 9043842.0 740.0 73 -61 270 4 0 52 52 9.0 RC55 RC 244449.0 9043755.0 740.0 88 -61 270 4 0 70 70 9.5 RC56 RC 244505.0 9043856.0 722.4 86 -61 270 4 0 72 72 9.4 RC57 RC 244496.0 9043757.0 721.4 73 -62 270 4 0 73 73 10.2 RC58 RC 244518.0 9044063.0 765.0 91 -61 270 4 0 42 42 9.4
5 48 72 24 9.1 RC59 RC 244503.0 9043961.0 748.1 68 -61 270 4 0 54 54 8.9 RC60 RC 244543.0 9043954.0 728.4 80 -61 270 4 0 64 64 8.9 RC61 RC 244601.0 9044243.0 755.0 70 -60 300 5 0 58 58 6.9 RC62 RC 244650.0 9044325.0 745.0 58 -60 300 5 0 52 52 8.1 RC63 RC 244711.0 9044398.0 750.0 79 -60 300 5 0 72 72 8.0 RC64 RC 244576.0 9044050.0 736.5 133 -60 270 4 0 52 52 8.7
5 64 118 54 8.4 RC65 RC 244654.0 9044220.0 731.5 91 -60 300 5 18 72 54 6.9 RC66 RC 244695.0 9044304.0 725.0 94 -60 300 5 6 86 80 6.9 RC67 RC 244767.0 9044370.0 711.5 80 -60 300 5 0 78 78 7.2 RC68 RC 244796.0 9044459.0 697.7 67 -60 300 5 0 54 54 8.2 RC69 RC 244848.0 9044546.0 707.7 82 -60 300 5 20 66 46 7.7 RC70 RC 244877.0 9044668.0 691.1 34 -60 300 5 0 16 16 9.9 RC71 RC 244912.0 9044597.0 676.4 82 -60 300 5 12 66 54 7.7 RC72 RC 244818.0 9044585.0 723.7 61 -60 300 5 0 50 50 5.9 RC73 RC 244751.0 9044502.0 734.1 58 -60 270 5 0 38 38 7.2 RC74 RC 244511.0 9044015.0 760.0 64 -60 270 4 0 44 44 7.7 RC75 RC 244560.0 9044211.0 757.3 70 -60 300 5 0 54 54 8.7 RC76 RC 244595.0 9043946.0 703.0 78 -60 270 4 28 78 50 7.1 RC77 RC 244628.0 9044032.0 705.8 94 -60 270 4 16 82 66 4.5
5 88 94 6 13.3 RC78 RC 244379.0 9042809.0 608.9 76 -60 270 2 0 60 60 7.8 RC79 RC 244289.0 9042586.0 672.1 115 -60 270 2 4 92 88 7.6 RC80 RC 244196.0 9042512.0 683.8 46 -60 270 2 0 4 4 4.4 RC81 RC 244212.0 9042612.0 705.0 43 -60 270 2 0 30 30 8.3
For
per
sona
l use
onl
y

16
Hole_ID Hole Type Easting
(UTMS37 WGS84) Northing
(UTMS37 WGS84) RL Hole
Depth Dip Azimuth Domain From (m)
To (m)
Intersect (m) TGC %
RC82 RC 244261.0 9042692.0 694.9 49 -60 270 2 0 40 40 8.2 RC83 RC 244248.0 9042604.0 692.9 90 -60 270 2 0 60 32 9.3 RC84 RC 244312.0 9042699.0 673.2 112 -60 270 2 0 76 76 7.6 RC85 RC 244403.0 9042923.0 593.8 55 -60 270 2 0 52 52 7.7 RC86 RC 244471.0 9042920.0 596.7 119 -60 270 2 0 112 112 7.3 RC87 RC 244424.0 9042816.0 611.3 106 -60 270 2 8 92 84 9.4
For
per
sona
l use
onl
y

1
JORC Code, 2012 Edition – Table 1 report template Section 1 Sampling Techniques and Data (Criteria in this section apply to all succeeding sections.)
Criteria JORC Code explanation Commentary
Sampling techniques
• Nature and quality of sampling (eg cut channels, random chips, or specific specialised industry standard measurement tools appropriate to the minerals under investigation, such as down hole gamma sondes, or handheld XRF instruments, etc). These examples should not be taken as limiting the broad meaning of sampling.
• Include reference to measures taken to ensure sample representivity and the appropriate calibration of any measurement tools or systems used.
• Aspects of the determination of mineralisation that are Material to the Public Report.
• In cases where ‘industry standard’ work has been done this would be relatively simple (eg ‘reverse circulation drilling was used to obtain 1 m samples from which 3 kg was pulverised to produce a 30 g charge for fire assay’). In other cases more explanation may be required, such as where there is coarse gold that has inherent sampling problems. Unusual commodities or mineralisation types (eg submarine nodules) may warrant disclosure of detailed information.
• The Company has taken all care to ensure no material containing additional carbon has contaminated the samples
• The trenches were sampled using 2m composites with samples taken from insitu oxide, transition or fresh rock as a continuous chip channel across the trench walls or along a clean exposed trench floor
• The pit samples were taken as induvial point samples at the base of the pit
• All samples are individually labeled and logged • Diamond drill sampling consisted of quarter core sampling of diamond
core on a 2m sample interval. • RC samples were riffle split on an individual 1m interval then
composited as two x 1m samples which were submitted to the laboratory
Drilling techniques
• Drill type (eg core, reverse circulation, open-hole hammer, rotary air blast, auger, Bangka, sonic, etc) and details (eg core diameter, triple or standard tube, depth of diamond tails, face-sampling bit or other type, whether core is oriented and if so, by what method, etc).
• Both diamond core (HQ single tube) and reverse circulation (6” face sampling) drilling methods have been used. All core is oriented using a spear or ACE back-end orientation device
Drill sample recovery
• Method of recording and assessing core and chip sample recoveries and results assessed.
• Measures taken to maximise sample recovery and ensure representative nature of the samples.
• Whether a relationship exists between sample recovery and grade and whether sample bias may have occurred due to preferential loss/gain of fine/coarse material.
• Diamond Drill sample recoveries have been measured for all holes and found to be acceptable. Method was linear metre core recovery for every meter drilled.
• RC recoveries were estimated by measuring the weight of every 1m interval. Grade /recovery correlation was found to be acceptable.
• Twin hole comparison of RC vs Diamond indicates that no sample bias has occurred for graphite
Logging • Whether core and chip samples have been geologically and geotechnically logged to a level of detail to support appropriate Mineral Resource estimation, mining studies and metallurgical studies.
• Pits and trenches were logged for geology and structures, Photographs were also recorded for the trench samples
• All drill holes have been comprehensively logged for lithology, mineralisation, recoveries, orientation, structure and RQD (core). All
For
per
sona
l use
onl
y

2
Criteria JORC Code explanation Commentary
• Whether logging is qualitative or quantitative in nature. Core (or costean, channel, etc) photography.
• The total length and percentage of the relevant intersections logged.
drill holes have been photographed. Sawn diamond core has been retained for a record in core trays. RC chips stored in both chip trays and 1-3kg individual metre samples as a record.
Sub-sampling techniques and sample preparation
• If core, whether cut or sawn and whether quarter, half or all core taken.
• If non-core, whether riffled, tube sampled, rotary split, etc and whether sampled wet or dry.
• For all sample types, the nature, quality and appropriateness of the sample preparation technique.
• Quality control procedures adopted for all sub-sampling stages to maximise representivity of samples.
• Measures taken to ensure that the sampling is representative of the in situ material collected, including for instance results for field duplicate/second-half sampling.
• Whether sample sizes are appropriate to the grain size of the material being sampled.
• The pit and trench samples were not sub sampled • Diamond core samples were halved with one half then quartered. A
quarter core sample was taken for laboratory analysis. The remaining quarter core sample is retained for a record and a half core sample retained for metallurgical testwork.
• RC samples were collected for every down-hole metre in a separate RC bag. Each metre sample was split through a three-tier riffle splitter and a 1.5kg sample taken of each metre. Two one-metre samples, totaling 3kg in weight were composited for assay submission. Field duplicates were taken to test precision up to the compositing and splitting stage
• Samples sizes for the all medium ie trenches, pits DD and RC drilling was appropriate for this style of graphite mineralisation
Quality of assay data and laboratory tests
• The nature, quality and appropriateness of the assaying and laboratory procedures used and whether the technique is considered partial or total.
• For geophysical tools, spectrometers, handheld XRF instruments, etc, the parameters used in determining the analysis including instrument make and model, reading times, calibrations factors applied and their derivation, etc.
• Nature of quality control procedures adopted (eg standards, blanks, duplicates, external laboratory checks) and whether acceptable levels of accuracy (ie lack of bias) and precision have been established.
• The samples were sent to Mwanza in Tanzania for preparation and pulps were then sent to Brisbane for carbon analysis: Total Graphitic Carbon (TGC) C-IR18 LECO Total Carbon.
• Graphitic C is determined by digesting sample in 50% HCl to evolve carbonate as CO2. Residue is filtered, washed, dried and then roasted at 425C. The roasted residue is analysed for carbon by high temperature Leco furnace with infra red detection. Method Precision: ± 15% Reporting Limit:0.02 – 100 %
• Some of the samples were analysed for Multi-elements using ME-ICP81 sodium peroxide fusion and dissolution with elements determined by ICP.
• Some of the samples were analysed for Multi-elements using ME-MS61 for 48 elements using a HF-HNO3-HClO4 acid digestion, HCl leach followed by ICP-AES and ICP-MS analysis.
• Some of the samples were analysed for Multi-elements using ME-MS81 using lithium borate fusion and ICP-MS determination for 38 elements.
• All analysis has been carried out by certified laboratory – AS chemex. TGC is the most appropriate method to analyse for graphitic carbon and it is total analysis. ALS Chemex inserted its own standards and blanks and completed its own QAQC for each batch of samples. No failures were noted
For
per
sona
l use
onl
y

3
Criteria JORC Code explanation Commentary
• BKT inserted certified standard material, blank or duplicate at a rate of one in twenty samples.
• Approximately 1/40 sample pulps were re-submitted from the primary Laboratory (ALSCHEMEX) to a secondary Laboratory (SGS) in Johannesburg, South Africa. No Bias or issues with accuracy or precision were observed between the two data sets.
• Based on the QA/QC strategy employed by BKT for the duration of the exploration programs at Mahenge BKT is satisfied the TGC results are accurate and precise and no systematic bias has been introduced
Verification of sampling and assaying
• The verification of significant intersections by either independent or alternative company personnel.
• The use of twinned holes. • Documentation of primary data, data entry procedures, data
verification, data storage (physical and electronic) protocols. • Discuss any adjustment to assay data.
• The data has been manually updated into a master spreadsheet and a GIS database, considered to be appropriate for this exploration program.
• Drill intersections have been checked by a consultant geologist as part of the data validation process and errors corrected prior to resource estimation
• Twin holes were used to compare diamond Vs RC drilling. Correlation of results was excellent
• There has been no adjustment of assay data
Location of data points
• Accuracy and quality of surveys used to locate drill holes (collar and down-hole surveys), trenches, mine workings and other locations used in Mineral Resource estimation.
• Specification of the grid system used. • Quality and adequacy of topographic control.
• A handheld GPS was used to identify the positions of the pits in the field
• The handheld GPS has an accuracy of +/- 5m • The datum is used is: WGS84, zone 37 south • Drill collars have been surveyed with a DGPS for sub-metre accuracy
for the x/y position and the Ulanzi, Cascade and Epanko north prospects have been surveyed with a high resolution aerial drone to generate an accurate contour map and high resolution photo image. This high definition topographic survey has been used to provide the z component for the drill collars
• The locations and RLs of the trenches have been checked using the detailed aerial/topo survey and modified accordingly for both x/y and z components
• BKT is satisfied the location of trenches, pits and drill holes have been located with a high degree of accuracy
Data spacing and distribution
• Data spacing for reporting of Exploration Results. • Whether the data spacing and distribution is sufficient to establish the
degree of geological and grade continuity appropriate for the Mineral
• Data spacing and distribution is considered to be appropriate for the estimation of a Mineral Resource.
For
per
sona
l use
onl
y

4
Criteria JORC Code explanation Commentary
Resource and Ore Reserve estimation procedure(s) and classifications applied.
• Whether sample compositing has been applied.
• The company has used 100 x 100 or 100 x 50 or 50 x 50 grid spacing which has been sufficient to show geological and grade continuity
• The drill spacing is appropriate for Resource Estimation • No further sample compositing has been applied post the sub-
sampling stage
Orientation of data in relation to geological structure
• Whether the orientation of sampling achieves unbiased sampling of possible structures and the extent to which this is known, considering the deposit type.
• If the relationship between the drilling orientation and the orientation of key mineralised structures is considered to have introduced a sampling bias, this should be assessed and reported if material.
• Drilling is oriented perpendicular to mineralisation or as close to perpendicular to mineralisation as possible.
• The orientation of the drill direction has not introduced a sample bias
Sample security
• The measures taken to ensure sample security. • The samples were taken under the supervision of an experienced geologist employed as a consultant to BKT
• The samples were transferred under BKT supervision from site to the local town of Mahenge where the samples were then transported from Mahenge to Dar es Salaam and then transported to Mwanza where they were inspected and then delivered directly to the ALS Chemex process facility.
• Chain of custody protocols were observed to ensure the samples were not tampered with post-sampling and until delivery to the laboratory for preparation and analysis
• Tamper proof plastic security tags were fastened to the samples bags. No evidence of sample tampering was reported by the receiving laboratory
• Transport of the pulps from Tanzania to Australia was under the supervision of ALS Chemex
Audits or reviews
• The results of any audits or reviews of sampling techniques and data. • Trenching and drilling information collected by BKT has been evaluated for sampling techniques, appropriateness of methods and data accuracy by an external geological consultant
Section 2 Reporting of Exploration Results (Criteria listed in the preceding section also apply to this section.)
Criteria JORC Code explanation Commentary
Mineral tenement
• Type, reference name/number, location and ownership including agreements or material issues with third parties such as joint
• The sampling was undertaken on granted license PL 7802/2012 • It has an area of 293km2
For
per
sona
l use
onl
y
5
Criteria JORC Code explanation Commentary
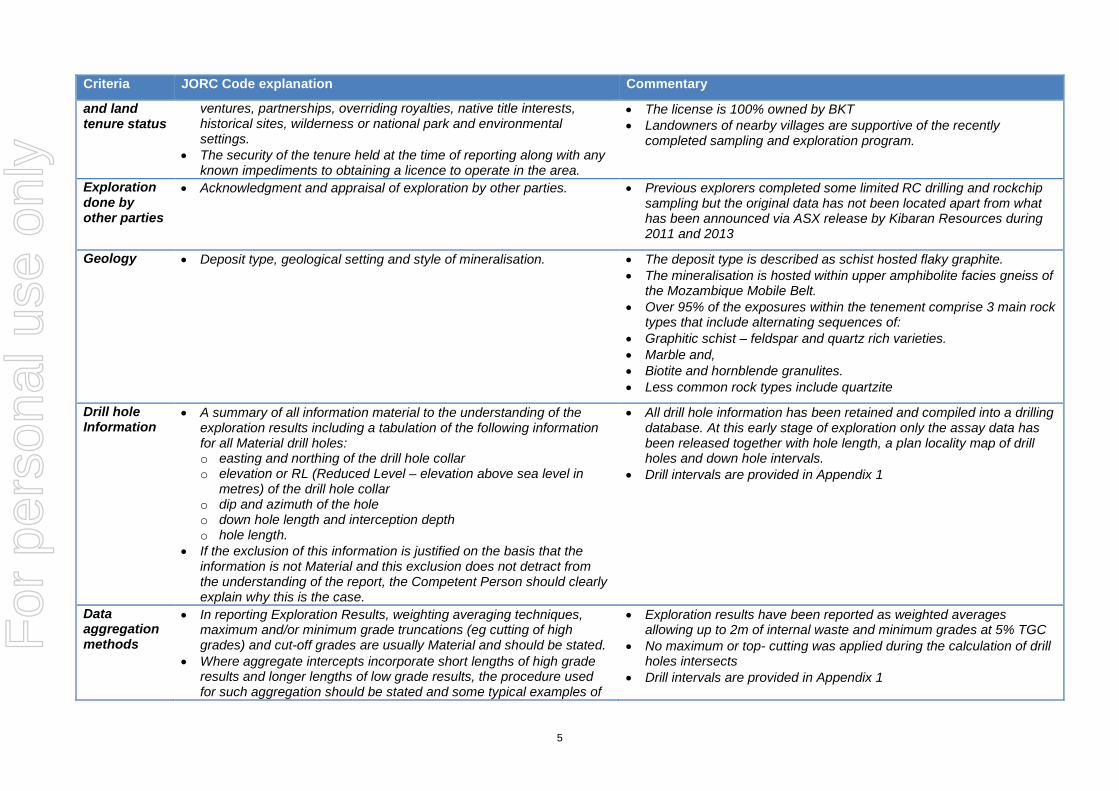
and land tenure status
ventures, partnerships, overriding royalties, native title interests, historical sites, wilderness or national park and environmental settings.
• The security of the tenure held at the time of reporting along with any known impediments to obtaining a licence to operate in the area.
• The license is 100% owned by BKT • Landowners of nearby villages are supportive of the recently
completed sampling and exploration program.
Exploration done by other parties
• Acknowledgment and appraisal of exploration by other parties. • Previous explorers completed some limited RC drilling and rockchip sampling but the original data has not been located apart from what has been announced via ASX release by Kibaran Resources during 2011 and 2013
Geology • Deposit type, geological setting and style of mineralisation. • The deposit type is described as schist hosted flaky graphite. • The mineralisation is hosted within upper amphibolite facies gneiss of
the Mozambique Mobile Belt. • Over 95% of the exposures within the tenement comprise 3 main rock
types that include alternating sequences of: • Graphitic schist – feldspar and quartz rich varieties. • Marble and, • Biotite and hornblende granulites. • Less common rock types include quartzite
Drill hole Information
• A summary of all information material to the understanding of the exploration results including a tabulation of the following information for all Material drill holes: o easting and northing of the drill hole collar o elevation or RL (Reduced Level – elevation above sea level in
metres) of the drill hole collar o dip and azimuth of the hole o down hole length and interception depth o hole length.
• If the exclusion of this information is justified on the basis that the information is not Material and this exclusion does not detract from the understanding of the report, the Competent Person should clearly explain why this is the case.
• All drill hole information has been retained and compiled into a drilling database. At this early stage of exploration only the assay data has been released together with hole length, a plan locality map of drill holes and down hole intervals.
• Drill intervals are provided in Appendix 1
Data aggregation methods
• In reporting Exploration Results, weighting averaging techniques, maximum and/or minimum grade truncations (eg cutting of high grades) and cut-off grades are usually Material and should be stated.
• Where aggregate intercepts incorporate short lengths of high grade results and longer lengths of low grade results, the procedure used for such aggregation should be stated and some typical examples of
• Exploration results have been reported as weighted averages allowing up to 2m of internal waste and minimum grades at 5% TGC
• No maximum or top- cutting was applied during the calculation of drill holes intersects
• Drill intervals are provided in Appendix 1
For
per
sona
l use
onl
y

6
Criteria JORC Code explanation Commentary
such aggregations should be shown in detail. • The assumptions used for any reporting of metal equivalent values
should be clearly stated. Relationship between mineralisation widths and intercept lengths
• These relationships are particularly important in the reporting of Exploration Results.
• If the geometry of the mineralisation with respect to the drill hole angle is known, its nature should be reported.
• If it is not known and only the down hole lengths are reported, there should be a clear statement to this effect (eg ‘down hole length, true width not known’).
• Drill hole results are reported as down-hole metres. • Sufficient drilling, mapping and trenching has been completed at the
main prospects to understand the orientation of mineralised lodes.A range of drill holes angles were used during the exploration program with the majority drilled at -60˚ (refer to Appendix 1)
Diagrams • Appropriate maps and sections (with scales) and tabulations of intercepts should be included for any significant discovery being reported These should include, but not be limited to a plan view of drill hole collar locations and appropriate sectional views.
• Figures show plan location of drill holes, appropriately scaled and referenced.
• Refer to images in the main body of the text
Balanced reporting
• Where comprehensive reporting of all Exploration Results is not practicable, representative reporting of both low and high grades and/or widths should be practiced to avoid misleading reporting of Exploration Results.
• All drill holes have been reported in their entirety. • All drilling results have been reported in past Exploration
announcements
Other substantive exploration data
• Other exploration data, if meaningful and material, should be reported including (but not limited to): geological observations; geophysical survey results; geochemical survey results; bulk samples – size and method of treatment; metallurgical test results; bulk density, groundwater, geotechnical and rock characteristics; potential deleterious or contaminating substances.
• 1 in 10 samples from the first drill programme were assayed for deleterious elements using a 40 element ICP method. No deleterious elements were observed, with background (low) levels of uranium and thorium.
• 758 bulk density measurements using the water displacement method from the oxide (limited) transitional and fresh zones.
• The samples for the bulk density measurements were taken from diamond drill core.
• Every diamond hole drilled used in this Resource Estimate has had intervals tested for bulk density generating a high quality dataset.
Further work • The nature and scale of planned further work (eg tests for lateral extensions or depth extensions or large-scale step-out drilling).
• Diagrams clearly highlighting the areas of possible extensions, including the main geological interpretations and future drilling areas, provided this information is not commercially sensitive.
• Further drilling is planned for the first half of 2016 to define easterly extensions of mineralisation at Ulanzi and to drill 1km strike length of Cascade west lode, with the intention of defining additional high grade, near surface resources
• Ongoing metallurgical testwork – flotation and particle size optimization
• Additional bulk density testwork is planned, particularly focused on the oxide and transition material.
For
per
sona
l use
onl
y

7
Section 3 Estimation and Reporting of Mineral Resources (Criteria listed in section 1, and where relevant in section 2, also apply to this section.)
Criteria JORC Code explanation Commentary
Database integrity
• Measures taken to ensure that data has not been corrupted by, for example, transcription or keying errors, between its initial collection and its use for Mineral Resource estimation purposes.
• Data validation procedures used.
• The drillhole database was compiled by BKT as Excel spreadsheets. • Maps, lithology, drill holes, trenches and test pit samples were also
supplied for use in GIS format (Mapinfo/Discover) and Excel spreadsheets.
• The drillhole database was converted to MS Access and linked to Geovia Surpac™ (industry standard resource modelling and estimation software). No material errors were identified in the database supplied in visual checks and through the Surpac connect processes.
• Normal data validation checks were completed on import to spreadsheets and tabfiles.
Site visits • Comment on any site visits undertaken by the Competent Person and the outcome of those visits.
• If no site visits have been undertaken indicate why this is the case.
• Steven Tambanis, Competent Person, has regularly worked on site from July 2014 to December 2015, covering all aspect of work from early exploration through to the completion of drilling in December 2015
Geological interpretation
• Confidence in (or conversely, the uncertainty of ) the geological interpretation of the mineral deposit.
• Nature of the data used and of any assumptions made. • The effect, if any, of alternative interpretations on Mineral Resource
estimation. • The use of geology in guiding and controlling Mineral Resource
estimation. • The factors affecting continuity both of grade and geology.
• The confidence in the geological interpretation is considered robust for the purposes of reporting an Inferred Resource. Graphite is hosted within graphitic gneisses of the Mahenge Scarp. These graphite rich zones generally strike NS and dip to the east at 60-80° and are interpreted to originate from graphitic sedimentary units of the Mahenge Scarp.
• The geological interpretation is supported by geological mapping and drill hole logging and mineralogical studies completed on drill programme.
• A weathered zone (oxide and transition) of reasonably uniform depth (averaging 25m) was interpreted based on the geological logs and coded into the block model.
• No alternative interpretations have been considered at this stage. • The graphitic gneiss units are known to be continuous in strike length
for up to 22km
Dimensions • The extent and variability of the Mineral Resource expressed as length (along strike or otherwise), plan width, and depth below surface to the upper and lower limits of the Mineral Resource.
• The modelled mineralized zone for Ulanzi has dimensions of 2,500m (surface trace striking 020) with four zones averaging in thickness of between 50-60m and ranging between 400m and 760m RL (AMSL).
For
per
sona
l use
onl
y

8
Criteria JORC Code explanation Commentary
• The modelled mineralized zone for Epanko has dimensions of 1,025m (surface trace striking 000) averaging in thickness of between 55-80m and ranging between 640m and 1,025m RL (AMSL).
• The modelled mineralized zone for Cascade has dimensions of 525m (surface trace striking 020) averaging in thickness 70m and ranging between 700m and 900m RL (AMSL).
Estimation and modelling techniques
• The nature and appropriateness of the estimation technique(s) applied and key assumptions, including treatment of extreme grade values, domaining, interpolation parameters and maximum distance of extrapolation from data points. If a computer assisted estimation method was chosen include a description of computer software and parameters used.
• The availability of check estimates, previous estimates and/or mine production records and whether the Mineral Resource estimate takes appropriate account of such data.
• The assumptions made regarding recovery of by-products. • Estimation of deleterious elements or other non-grade variables of
economic significance (eg sulphur for acid mine drainage characterisation).
• In the case of block model interpolation, the block size in relation to the average sample spacing and the search employed.
• Any assumptions behind modelling of selective mining units. • Any assumptions about correlation between variables. • Description of how the geological interpretation was used to control
the resource estimates. • Discussion of basis for using or not using grade cutting or capping. • The process of validation, the checking process used, the comparison
of model data to drill hole data, and use of reconciliation data if available.
• Grade estimation using Ordinary Kriging (OK) was completed using Geovia Surpac™ software for TGC (%)
• Drill spacing typically ranges from 50m to 100m. • Drillhole samples were flagged with wireframed domain codes.
Sample data was composited for TGC to 2m using a best fit method with a minimum of 50% of the required interval to make a composite. These were combined with 2m spaced trench samples plus individual 50m by 50m spaced base of test pit assays.
• Potential influences of extreme sample distribution outliers were investigated to determine whether they needed to be reduced by top-cutting on a domain basis. The investigation used a combination of methods including grade histograms, log probability plots and statistical tools. Based on this, it was determined that no top cuts were required.
• Directional variograms were modelled by domain using traditional variograms. Nugget values for TGC are low (around 15%) and structure ranges up to 270m.
• Block model was constructed with parent blocks of 10m (E) by 25m (N) by 10m (RL) and sub-blocked to 5m (E) by 12.5m (N) by 5m (RL). All estimation was completed to the parent cell size. Discretisation was set to 5 by 5 by 2 for all domains.
• Three estimation passes were used with differing distances at Epanko vs. Ulanzi and Cascade. This was done due to a tighter drill spacing at Epanko. At Ulanzi and Cascade, the first pass had a limit of 150m, the second pass 300m and the third pass searching a large distance to fill the blocks within the wireframed zones. At Epanko, the first pass had a limit of 75m, the second pass 150m and the third pass searching a large distance to fill the blocks within the wireframed zones. Each pass used a maximum of 24 samples, a minimum of 8 samples and maximum per hole of 5 samples.
• Search ellipse sizes were based primarily on a combination of the variography and the trends of the wireframed mineralized zones.
For
per
sona
l use
onl
y
9
Criteria JORC Code explanation Commentary
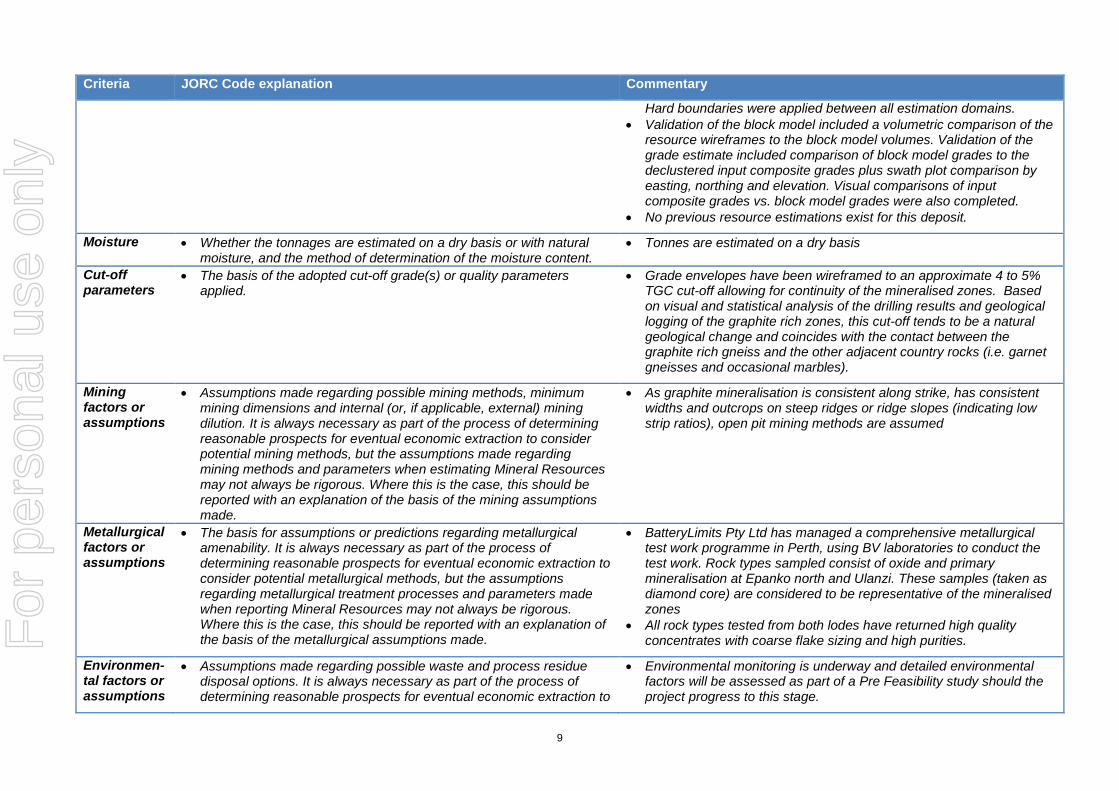
Hard boundaries were applied between all estimation domains. • Validation of the block model included a volumetric comparison of the
resource wireframes to the block model volumes. Validation of the grade estimate included comparison of block model grades to the declustered input composite grades plus swath plot comparison by easting, northing and elevation. Visual comparisons of input composite grades vs. block model grades were also completed.
• No previous resource estimations exist for this deposit.
Moisture • Whether the tonnages are estimated on a dry basis or with natural moisture, and the method of determination of the moisture content.
• Tonnes are estimated on a dry basis
Cut-off parameters
• The basis of the adopted cut-off grade(s) or quality parameters applied.
• Grade envelopes have been wireframed to an approximate 4 to 5% TGC cut-off allowing for continuity of the mineralised zones. Based on visual and statistical analysis of the drilling results and geological logging of the graphite rich zones, this cut-off tends to be a natural geological change and coincides with the contact between the graphite rich gneiss and the other adjacent country rocks (i.e. garnet gneisses and occasional marbles).
Mining factors or assumptions
• Assumptions made regarding possible mining methods, minimum mining dimensions and internal (or, if applicable, external) mining dilution. It is always necessary as part of the process of determining reasonable prospects for eventual economic extraction to consider potential mining methods, but the assumptions made regarding mining methods and parameters when estimating Mineral Resources may not always be rigorous. Where this is the case, this should be reported with an explanation of the basis of the mining assumptions made.
• As graphite mineralisation is consistent along strike, has consistent widths and outcrops on steep ridges or ridge slopes (indicating low strip ratios), open pit mining methods are assumed
Metallurgical factors or assumptions
• The basis for assumptions or predictions regarding metallurgical amenability. It is always necessary as part of the process of determining reasonable prospects for eventual economic extraction to consider potential metallurgical methods, but the assumptions regarding metallurgical treatment processes and parameters made when reporting Mineral Resources may not always be rigorous. Where this is the case, this should be reported with an explanation of the basis of the metallurgical assumptions made.
• BatteryLimits Pty Ltd has managed a comprehensive metallurgical test work programme in Perth, using BV laboratories to conduct the test work. Rock types sampled consist of oxide and primary mineralisation at Epanko north and Ulanzi. These samples (taken as diamond core) are considered to be representative of the mineralised zones
• All rock types tested from both lodes have returned high quality concentrates with coarse flake sizing and high purities.
Environmen-tal factors or assumptions
• Assumptions made regarding possible waste and process residue disposal options. It is always necessary as part of the process of determining reasonable prospects for eventual economic extraction to
• Environmental monitoring is underway and detailed environmental factors will be assessed as part of a Pre Feasibility study should the project progress to this stage.
For
per
sona
l use
onl
y

10
Criteria JORC Code explanation Commentary
consider the potential environmental impacts of the mining and processing operation. While at this stage the determination of potential environmental impacts, particularly for a greenfields project, may not always be well advanced, the status of early consideration of these potential environmental impacts should be reported. Where these aspects have not been considered this should be reported with an explanation of the environmental assumptions made.
Bulk density • Whether assumed or determined. If assumed, the basis for the assumptions. If determined, the method used, whether wet or dry, the frequency of the measurements, the nature, size and representativeness of the samples.
• The bulk density for bulk material must have been measured by methods that adequately account for void spaces (vugs, porosity, etc), moisture and differences between rock and alteration zones within the deposit.
• Discuss assumptions for bulk density estimates used in the evaluation process of the different materials.
• The Company has completed specific gravity testwork on 757 drill core samples across the Epanko and Ulanzi deposits using Hydrostatic Weighing (uncoated).
• Of these 757 samples, 373 are from within the modelled mineralised domains, primarily from fresh material (354 samples) and transition (19 samples).
• Statistical analysis of the samples and comparison against depth and TGC grade identified a subjective relationship between bulk density (BD) and TGC grade. As such, the BD used for fresh material was the average for the deposits (90% confidence interval) at 2.73 g/cm3 (with a standard deviation of 0.05).
• For the modelled oxide/transition zone (19% of the reported tonnage), there were only 19 samples available. Whilst the analysis of these samples produced the same BD as the fresh material, it was decided to use a slightly reduced BD of 2.6 g/cm3. It is planned to increase the number of measurements on transition material samples in the next phase of work.
• For the modelled oxide zone (4% of the reported tonnage), there were no BD measurements completed to date. It is planned to complete a representative number of measurements on oxide material samples in the next phase of work using appropriate measuring techniques for the material type. For this resource, an oxide BD of 1.9 g/cm3 has been assumed.
Classification • The basis for the classification of the Mineral Resources into varying confidence categories.
• Whether appropriate account has been taken of all relevant factors (ie relative confidence in tonnage/grade estimations, reliability of input data, confidence in continuity of geology and metal values, quality, quantity and distribution of the data).
• Whether the result appropriately reflects the Competent Person’s view of the deposit.
• The Mineral Resource has been classified on the basis of confidence in the geological model, continuity of mineralised zones, drilling density, confidence in the underlying database and the available bulk density information. Maximum drill spacing for Inferred Resource classification is 100m (northing) by 50-75m (easting). Coarser drill spacing is categorised into the Inferred Resource category.
• All factors considered; the resource estimate has in part been assigned to Indicated with the remainder as Inferred Resources.
For
per
sona
l use
onl
y

11
Criteria JORC Code explanation Commentary
• The result reflects the Competent Person’s view of the deposit.
Audits or reviews
• The results of any audits or reviews of Mineral Resource estimates. • Whilst Mr. Barnes (Competent Person) is considered Independent of the Company, no third party review has been conducted.
Discussion of relative accuracy/ confidence
• Where appropriate a statement of the relative accuracy and confidence level in the Mineral Resource estimate using an approach or procedure deemed appropriate by the Competent Person. For example, the application of statistical or geostatistical procedures to quantify the relative accuracy of the resource within stated confidence limits, or, if such an approach is not deemed appropriate, a qualitative discussion of the factors that could affect the relative accuracy and confidence of the estimate.
• The statement should specify whether it relates to global or local estimates, and, if local, state the relevant tonnages, which should be relevant to technical and economic evaluation. Documentation should include assumptions made and the procedures used.
• These statements of relative accuracy and confidence of the estimate should be compared with production data, where available.
• The relative accuracy of the Mineral Resource estimate is reflected in the reporting of the Mineral Resource as per the guidelines of the 2012 JORC Code.
• The statement relates to global estimates of tonnes and grade.
For
per
sona
l use
onl
y