highlights of the 2013 index of economic...
TRANSCRIPT
Terry MillerKim R. Holmes
Edwin J. FeulnerIn partnership with
2013 Index of Economic FreedomPromoting Economic Opportunity and Prosperity
Highlights of the
Highlights of the 2013 Index of Economic Freedom
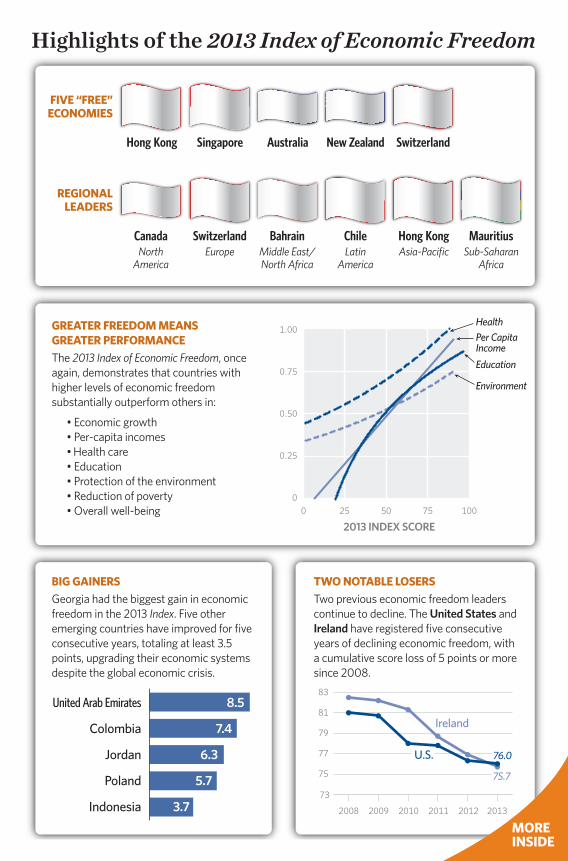
FIVE “FREE” ECONOMIES
REGIONAL LEADERS
Hong Kong
Asia-PacificHong Kong
Singapore Australia New Zealand
Sub-Saharan Africa
MauritiusLatin
America
ChileNorth
America
Canada
Switzerland
EuropeSwitzerland
Middle East/ North Africa
Bahrain
GREATER FREEDOM MEANS GREATER PERFORMANCEThe 2013 Index of Economic Freedom, once again, demonstrates that countries with higher levels of economic freedom substantially outperform others in:
• Economic growth • Per-capita incomes • Health care • Education • Protection of the environment • Reduction of poverty • Overall well-being
2013 INDEX SCORE
1.00
0.50
0.75
0.25
00 25 50 75 100
HealthPer Capita IncomeEducation
Environment
BIG GAINERSGeorgia had the biggest gain in economic freedom in the 2013 Index. Five other emerging countries have improved for five consecutive years, totaling at least 3.5 points, upgrading their economic systems despite the global economic crisis.
TWO NOTABLE LOSERSTwo previous economic freedom leaders continue to decline. The United States and Ireland have registered five consecutive years of declining economic freedom, with a cumulative score loss of 5 points or more since 2008.
73
75
77
79
81
83
2008 2009 2010 2011 2012 2013
United Arab Emirates
Colombia
Jordan
Poland
Indonesia
8.5
7.4
6.3
5.7
3.7
Ireland
U.S. 76.0
75.7
MORE INSIDE

Highlights of the 2013 Index of Economic Freedom
CHANGING OF THE GUARD IN EUROPEA significant realignment of European countries is underway in terms of economic freedom. Eight countries recorded their highest economic freedom scores ever in the 2013 Index , while five others have scores equal to or below their scores from nearly 20 years ago , when the Index began recording economic freedom.
Russia
Sweden
Turkey
Ukraine
Finland
France
Spain
Norway
Poland
Italy
Germany
Belarus
Romania
UnitedKingdom
Latvia
Ireland
Austria
SerbiaBulgaria
Greece
Hungary
Lithuania
Estonia
Portugal
Georgia
Croatia
SlovakiaCzech
Republic
Belgium
Moldova
Denmark
Switzerland
Albania
Armenia
Slovenia
Macedonia
Netherlands
Bosnia & HerzegovinaMontenegro
Cyprus
Luxembourg
Malta
Liechtenstein
Black Sea
Sea of Azov Caspian
Sea
■ Free ■ Mostly Free ■ Moderately Free ■ Mostly Unfree ■ Repressed ■ Not Ranked
Kosovo
Iceland
ECONOMIC FREEDOM: CHANGES SINCE 2012
Property Rights 0Freedom from Corruption +0.2
Fiscal Freedom +0.3Government Spending +1.3
Business Freedom –0.1Labor Freedom –0.8Monetary Freedom –0.7
Trade Freedom 0Investment Freedom +1.5Financial Freedom +0.2
RULE OF LAW
LIMITED GOVERNMENT
REGULATORY EFFICIENCY
OPEN MARKETS
FREEDOM COMPONENT SCORES
Europe
North America
Sub-Saharan Africa
Asia-Pacific
Middle East/ North Africa
South and Central America/ Caribbean
+0.5
+0.3
0
–0.1
–0.3
–0.6
REGIONAL SCORES

1 Hong Kong 89.32 Singapore 88.03 Australia 82.64 New Zealand 81.45 Switzerland 81.06 Canada 79.47 Chile 79.08 Mauritius 76.99 Denmark 76.110 United States 76.011 Ireland 75.712 Bahrain 75.513 Estonia 75.314 United Kingdom 74.815 Luxembourg 74.216 Finland 74.017 Netherlands 73.518 Sweden 72.919 Germany 72.820 Taiwan 72.721 Georgia 72.222 Lithuania 72.123 Iceland 72.124 Japan 71.825 Austria 71.826 Macau 71.727 Qatar 71.328 United Arab Emirates 71.129 Czech Republic 70.930 Botswana 70.631 Norway 70.532 Saint Lucia 70.433 Jordan 70.434 South Korea 70.335 The Bahamas 70.136 Uruguay 69.737 Colombia 69.638 Armenia 69.439 Barbados 69.340 Belgium 69.241 Cyprus 69.042 Slovakia 68.743 Macedonia 68.244 Peru 68.245 Oman 68.146 Spain 68.047 Malta 67.548 Hungary 67.349 Costa Rica 67.050 Mexico 67.051 Israel 66.952 Jamaica 66.853 El Salvador 66.754 Saint Vincent
and The Grenadines66.7
55 Latvia 66.556 Malaysia 66.157 Poland 66.058 Albania 65.259 Romania 65.160 Bulgaria 65.061 Thailand 64.162 France 64.163 Rwanda 64.164 Dominica 63.9
65 Cape Verde 63.766 Kuwait 63.167 Portugal 63.168 Kazakhstan 63.069 Turkey 62.970 Montenegro 62.671 Panama 62.572 Trinidad and Tobago 62.373 Madagascar 62.074 South Africa 61.875 Mongolia 61.776 Slovenia 61.777 Ghana 61.378 Croatia 61.379 Uganda 61.180 Paraguay 61.181 Sri Lanka 60.782 Saudi Arabia 60.683 Italy 60.684 Namibia 60.385 Guatemala 60.086 Burkina Faso 59.987 Dominican Republic 59.788 Azerbaijan 59.789 Kyrgyz Republic 59.690 Morocco 59.691 Lebanon 59.592 The Gambia 58.893 Zambia 58.794 Serbia 58.695 Cambodia 58.596 Honduras 58.497 Philippines 58.298 Tanzania 57.999 Gabon 57.8100 Brazil 57.7101 Benin 57.6102 Belize 57.3103 Bosnia and Herzegovina 57.3104 Swaziland 57.2105 Fiji 57.2106 Samoa 57.1107 Tunisia 57.0108 Indonesia 56.9109 Vanuatu 56.6110 Nicaragua 56.6111 Mali 56.4112 Tonga 56.0113 Yemen 55.9114 Kenya 55.9115 Moldova 55.5116 Senegal 55.5117 Greece 55.4118 Malawi 55.3119 India 55.2120 Nigeria 55.1121 Pakistan 55.1122 Bhutan 55.0123 Mozambique 55.0124 Seychelles 54.9125 Egypt 54.8126 Côte d’Ivoire 54.1127 Djibouti 53.9128 Niger 53.9129 Guyana 53.8
130 Papua New Guinea 53.6131 Tajikistan 53.4132 Bangladesh 52.6133 Cameroon 52.3134 Mauritania 52.3135 Suriname 52.0136 China 51.9137 Guinea 51.2138 Guinea-Bissau 51.1139 Russia 51.1140 Vietnam 51.0141 Nepal 50.4142 Central African Republic 50.4143 Micronesia 50.1144 Laos 50.1145 Algeria 49.6146 Ethiopia 49.4147 Liberia 49.3148 Burundi 49.0149 Maldives 49.0150 Togo 48.8151 Sierra Leone 48.3152 Haiti 48.1153 São Tomé and Príncipe 48.0154 Belarus 48.0155 Lesotho 47.9156 Bolivia 47.9157 Comoros 47.5158 Angola 47.3159 Ecuador 46.9160 Argentina 46.7161 Ukraine 46.3162 Uzbekistan 46.0163 Kiribati 45.9164 Chad 45.2165 Solomon Islands 45.0166 Timor-Leste 43.7167 Congo, Rep. of 43.5168 Iran 43.2169 Turkmenistan 42.6170 Equatorial Guinea 42.3171 Congo, Dem. Rep. of 39.6172 Burma 39.2173 Eritrea 36.3174 Venezuela 36.1175 Zimbabwe 28.6176 Cuba 28.5177 North Korea 1.5N/A Afghanistan N/AN/A Iraq N/AN/A Kosovo N/AN/A Libya N/AN/A Liechtenstein N/AN/A Somalia N/AN/A Sudan N/AN/A Syria N/A
Rank Country Overall Score Rank Country Overall Score Rank Country Overall Score
0–49.9 REPRESSED
ECONOMIC FREEDOM SCORE
50–59.9 MOSTLY UNFREE60–69.9 MODERATELY FREE70–79.9 MOSTLY FREE80–100 FREE
2013 INDEx Of ECONOMIC fREEDOM COuNtRy RaNkINgS

The Heritage Foundation | heritage.org/index 1
On a worldwide basis, the advance of economic freedom has ground
to a halt. Since peaking in 2008, when the average economic freedom score reached 60.2 on the Index 0–100 scale, global economic freedom has failed to advance, and this year’s average score of 59.6 is no better than the score a full decade ago in 2003.
Still, there are bright spots around the world:
• Four Asia–Pacific economies and Switzerland earned the designa-tion as truly “free” economies in the 2013 Index.
• Seven emerging economies and one advanced economy joined those considered “mostly free” in the 2013 Index, raising the num-ber of countries in that category to 30. The eight countries are Geor-gia, United Arab Emirates, the Czech Republic, Botswana, Nor-way, Jordan, South Korea, and the Bahamas.
• T h e s c o r e s o f 9 1 c o u n t r i e s improved, and 24 recorded their highest scores ever in the Index.
• Five emerging economies have recorded notable increases in economic freedom over the past five years, maintaining high eco-
nomic growth rates despite the difficult international economic environment. The five countries
Economic FreedomGlobal Patterns
56
57
58
59
60
61
1995 2000 2005 2010 2013
Source: 2013 Index of Economic Freedom.
Chart 1 heritage.org
Global AverageEconomic Freedom
Average Score in the Index of Economic Freedom Since 1995
57.1
60.2
57.6
59.659.4
59.6
57.6
59.659.4
59.6

2 Highlights of the 2013 Index of Economic Freedom
are Colombia, Indonesia, Jor-dan, Poland, and the United Arab Emirates.
• Every region continues to be repre-sented by at least one of the top 20 freest economies, but some notable reshuffling has occurred in the 2013 Index.
EcOnOmic LEadErs in dEcLinE
The overall stagnation observed in worldwide levels of economic freedom has coincided with signifi-cant setbacks in countries previously regarded as leaders in economic free-
dom. In particular, the United States and Ireland, which had risen in previ-ous years as high as fourth place in the rankings, have seen their scores drop sub-stantially in recent years. Both suffered declines in economic freedom again this year.
Seventy-eight coun-tries registered declines i n e c o n o m i c f r e e d o m in the 2013 Index , and another eight recorded no change in overall score. It remains to be seen wheth-er the global economy is undergoing the leading edge of a fundamental realignment of countries along the continuum of e c o n o m i c f r e e d o m o r whether the breaks in progress in many coun-tries are just transitory manifestations of a loss of commitment to advanc-
ing economic freedom.
LimitEd GOvErnmEnt EnhancEs EcOnOmic dynamism
A pleasant surprise in the Index rankings this year was the strong evi-dence that many countries are put-ting substantial effort into getting their fiscal houses in order. The Index category that measures restraint in government spending showed one of the largest improvements of any of the 10 economic freedoms, with the worldwide average score rising from 59.8 to 61.1. Fiscal freedom improved as well, with many countries continu-
Source: 2013 Index of Economic Freedom.
Chart 2 heritage.org
Higher Government SpendingEquals Lower Economic Growth
–5%–20%
–15%–10%
–5%0
5%10%
15%20%
25%30%
10%
5%
0
Change in GDP, 2008–2011
Change in Government Spendingas a Percentage of GDP, 2008–2011
Trend Line, Advanced Economies
Trend Line, Developing Economies

The Heritage Foundation | heritage.org/index 3
ing efforts to streamline tax systems and lower marginal rates.
Three years of data are now avail-able on the impact of government stimulus on economic growth rates. The 2011 Index first reported the neg-ative impact of government spending in the early days of the global reces-sion for advanced economies that are members of the Organisation for Economic Cooperation and Develop-ment (OECD). The full data set now available for a much greater number of countries shows a similar negative relationship between increases in government spending and economic growth.
Interestingly, the relationship is far more negative in the case of advanced economies than it is for developing and emerging economies (correlation coefficient –0.46 ver-sus –0.09). Over the past three years, countries that have increased govern-ment spending have tended to record lower economic growth rates.
markEt-OpEninG mEasurEs cOntinuE, but rEGuLatOry EFFiciEncy dEcLinEs
The economic freedom category that improved the most in the 2013 Index is investment freedom. Aver-age scores in this category increased to 52.2 from 50.7 in the 2012 Index. Countries clearly continue to rec-ognize the benefits of integrating as fully as possible into global economic markets.
Regulatory efficiency, by contrast, declined significantly. Average scores dropped in every economic freedom related to regulatory efficiency, with labor freedom suffering the most. Many countries apparently believe
that improvements in well-being for poorer workers can be achieved through legislative fiat. Even top-ranked Hong Kong has experimented with a minimum wage, and labor mar-ket rigidities and bureaucratic and costly business regulations continue to drive many people into informal types of economic activity, particu-larly in developing countries.
thE ruLE OF LawThe 2013 Index focuses on the
impact on economic growth and social well-being of the rule of law, one of the four pillars of economic freedom. The five essays included in a Special Focus Section provide a comprehensive overview of the sub-ject. Measures in the Index related to the rule of law include indices related to the protection of property rights and corruption, and the composite of these two indicators is even more highly correlated than overall eco-nomic freedom scores with high lev-els of per capita GDP. Those countries that have improved the rule of law over the past five years show an aver-age growth rate of 4.4 percent over the period, while those economies where the rule of law has declined have grown less than 3 percent per year on average.
Not surprisingly, the rule-of-law indicators are highly correlated with high levels of investment and job growth. Their impact is more striking within the developing and emerging countries than it is for more advanced economies (coefficient of correlation 0.70 versus 0.53), perhaps because there is more variability in scores among the developing and emerging countries. The Index thus regards the

4 Highlights of the 2013 Index of Economic Freedom
rule of law as a foundational aspect of economic freedom, essential for achieving economic progress and societal prosperity.
EcOnOmic FrEEdOm and prOspErity
The results of the 2013 Index rein-force the conclusion that advancing economic freedom in the areas of rule of law, limited government, regu-latory efficiency, and open markets is the most effective way to generate broad-based economic dynamism, creating more opportunities for peo-ple to work, higher levels of produc-tivity, and gains from market opening and trade that elevate prosperity and reduce human poverty. This multi-
dimensional relationship between economic freedom and true human progress has been empirically docu-mented in the Index over the past 19 years, and other similar studies have confirmed its findings.
The most basic benefit of eco-nomic freedom, confirmed now with data covering 19 years, is the strong relationship between economic free-dom and levels of per capita income. For countries that achieve scores that reflect even moderate levels of economic freedom (60 or above), the relationship between economic freedom and per capita GDP is high-ly significant. Countries moving up the economic freedom scale show increasingly high levels of average income.
0
10,000
20,000
30,000
40,000
$50,000
Source: 2013 Index of Economic Freedom. heritage.orgChart 3
Economic Freedom Promotes Prosperity
Five Freest CountriesFive Least Free Countries
GDP per Capita (Purchasing Power Parity)
Asia-Pacific
Middle East/ North Africa
Europe Americas Sub-Saharan Africa
$43,140$41,577
$35,848 $35,403
$7,459$5,357
$7,732
$13,723
$8,948$5,093

The Heritage Foundation | heritage.org/index 5
Given the strength and empiri-cal durability of the relationship between higher levels of economic freedom and greater prosperity, it can only be regarded as a human tragedy that the majority of the world’s peo-ple still live in countries where eco-nomic freedom is either repressed or heavily regulated.
The governments of China and India bear a special responsibility in this regard. The policy environments that they set for economic activity affect the lives of more than 2.5 bil-
lion people. Both economies are con-sidered “mostly unfree.”
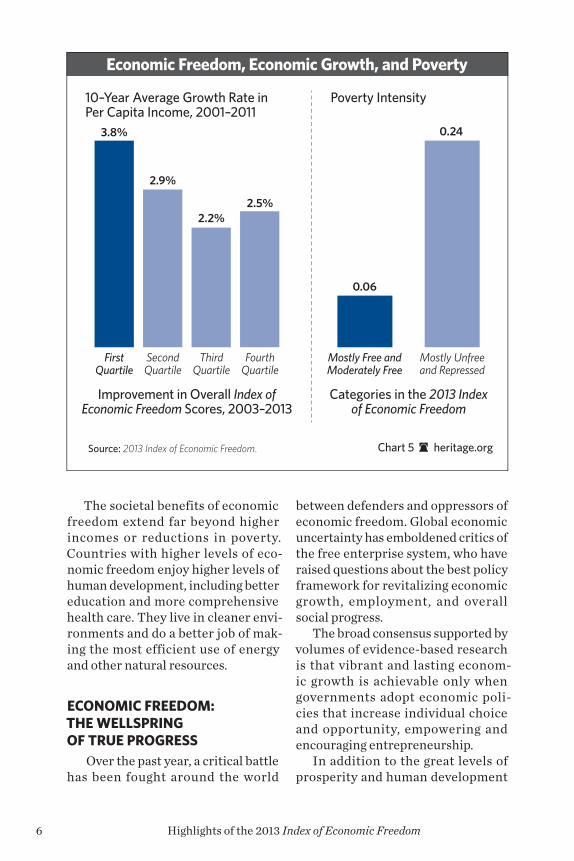
Greater levels of economic free-dom have had a major positive impact on poverty levels over the past decade. Based on the United Nations Multidi-mensional Poverty Index, the inten-sity of poverty in countries whose economies are considered mostly free or moderately free is only one-fourth the level in countries that are rated less free. Poverty rates have declined more significantly in freer countries as well.
20 30 40 50 60 70 80 90
Overall Score in the 2013 Index of Economic Freedom
Correlation: 0.66R2 = 0.44
Trend Line
China
India
60 or less: “Mostly Unfree” or “Repressed”
$100
$1,000
$10,000
$100,000
Source: 2013 Index of Economic Freedom. Chart 4 heritage.org
GDP per Capita (Purchasing Power Parity)
Asian Giants Lag in Economic Freedom
Each circle represents a nation in the Index of Economic Freedom
50025010010
Population (millions)
6 Highlights of the 2013 Index of Economic Freedom
The societal benefits of economic freedom extend far beyond higher incomes or reductions in poverty. Countries with higher levels of eco-nomic freedom enjoy higher levels of human development, including better education and more comprehensive health care. They live in cleaner envi-ronments and do a better job of mak-ing the most efficient use of energy and other natural resources.
EcOnOmic FrEEdOm: thE wELLsprinG OF truE prOGrEss
Over the past year, a critical battle has been fought around the world
between defenders and oppressors of economic freedom. Global economic uncertainty has emboldened critics of the free enterprise system, who have raised questions about the best policy framework for revitalizing economic growth, employment, and overall social progress.
The broad consensus supported by volumes of evidence-based research is that vibrant and lasting econom-ic growth is achievable only when governments adopt economic poli-cies that increase individual choice and opportunity, empowering and encouraging entrepreneurship.
In addition to the great levels of prosperity and human development
First Quartile
Second Quartile
Third Quartile
Fourth Quartile
3.8%
2.9%
2.2%2.5%
Improvement in Overall Index ofEconomic Freedom Scores, 2003–2013
Source: 2013 Index of Economic Freedom. Chart 5 heritage.org
10–Year Average Growth Rate in Per Capita Income, 2001–2011
Mostly Free and Moderately Free
Mostly Unfree and Repressed
0.06
0.24
Categories in the 2013 Indexof Economic Freedom
Poverty Intensity
Economic Freedom, Economic Growth, and Poverty
The Heritage Foundation | heritage.org/index 7
induced by high levels of economic freedom, the higher growth rates spurred by advances in economic freedom tend to inspire a virtuous cycle of openness and resilience, trig-gering even further improvements in economic freedom. The result is a sort of compounding that has cre-ated in the countries with the high-est levels of economic freedom a level of prosperity and human well-being unmatched in human history.
Greater economic freedom also provides more fertile ground for effective and democratic governance. It empowers people to exercise greater control of their daily lives. By increasing options, economic free-dom ultimately nurtures political reform as well. Economic freedom makes it possible for individuals to gain the economic resources neces-sary to challenge entrenched inter-ests or compete for political power, thereby encouraging the creation of more pluralistic societies.
timE tO rEnEw cOmmitmEnt tO EcOnOmic FrEEdOm
The current period of uncertain and fragile global economic perfor-mance represents a critical oppor-tunity to ponder the principles that can revitalize economic growth. The results of the 2013 Index of Economic Freedom document economic policy stagnation in many countries around the world and record a general decline in the momentum for increas-ing freedom. If we are to restore eco-nomic growth, that decline is going to have to be reversed, most importantly in countries like the United States and Ireland that once led the charge for greater freedom.
As Friedrich A. Hayek once observed, “If old truths are to retain their hold on men’s minds, they must be restated in the language and con-cepts of successive generations.” That need has never been more evident to those who carry on the fight for great-er economic freedom and the broader understanding and acceptance of the fundamental principles on which prosperity is based.

8 Highlights of the 2013 Index of Economic Freedom
Economic freedom rests on the empowerment of the individual,
nondiscrimination, and open com-petition. None of these requirements can exist in a society that lacks effec-tive rule of law. A special section of the 2013 Index of Economic Freedom provides four unique perspectives on the rule of law and its relationship to economic freedom and prosperity.
thE ruLE OF Law and dEvELOpmEnt
The Index of Economic Freedom provides unambiguous confirmation of the importance of the rule of law to economic growth and prosperity. Both of the rule-of-law indicators in the Index demonstrate a high degree of predictive power with respect to per capita incomes. The coefficient of correlation between the prop-erty rights indicator and per capita incomes is 0.76 (1.00 equals perfect correlation). For freedom from cor-ruption, the coefficient is 0.81. Taken together, the rule-of-law indicators are highly predictive of per capita GDP, irrespective of other factors or the overall level of economic freedom.
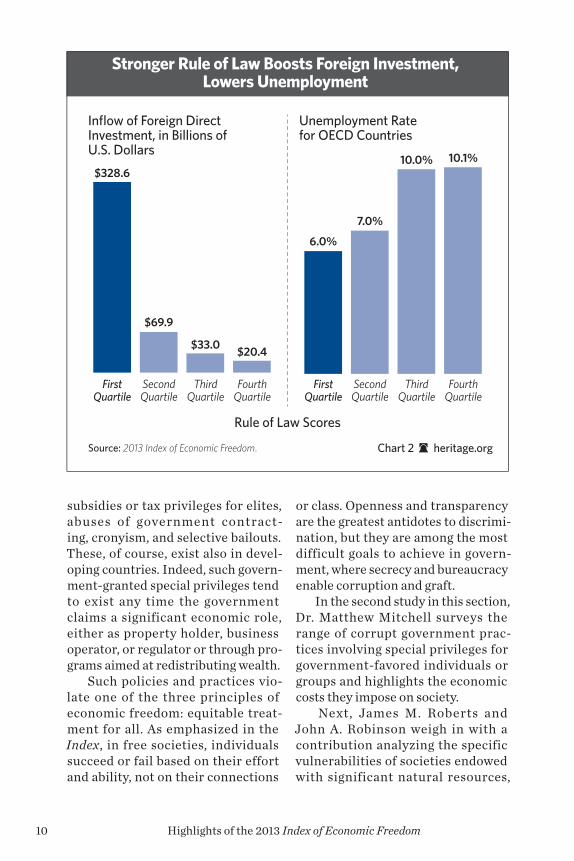
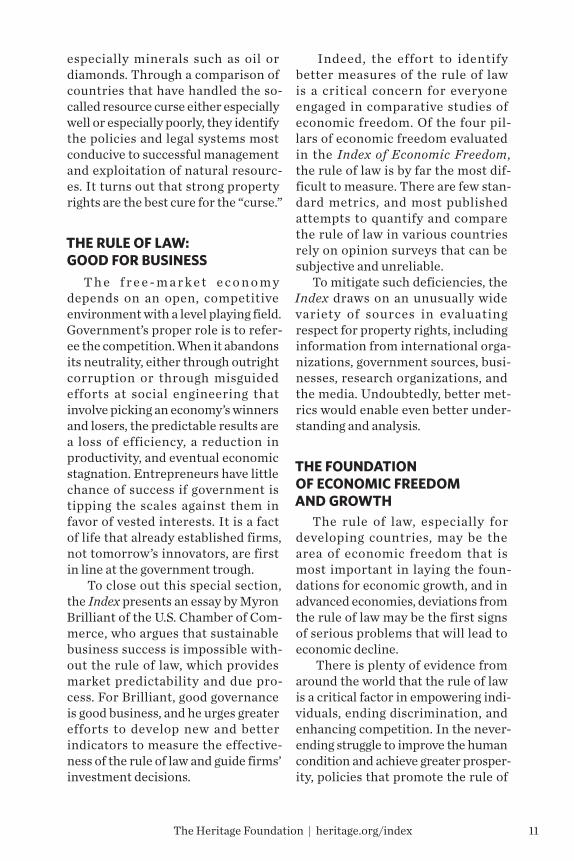
The rule of law is a critically important factor in determining which countries attract dynamic
flows of global investment capital. Countries with rule-of-law scores in the top quarter have recorded levels of inward foreign direct investment that exceed levels in the lower three quarters combined.
There is also evidence of a strong relationship between rule of law and employment. Available data from the Organisation for Economic Co-operation and Development (OECD) allow a comparison between unem-ployment rates and Index rule-of-law scores for OECD members. The top quartile of OECD members in terms of rule of law had unemployment rates averaging about 6 percent in 2011. Members that scored in the bot-tom half on rule of law averaged about 10 percent unemployment.
Given the obvious importance of property rights and freedom from cor-ruption in underpinning high levels of economic performance, it is vital that we sharpen our overall understand-ing of the rule of law, its various mani-festations, and the ways in which it affects economic achievement.
thE ruLE OF Law and dEmOcracy
The relationship between the rule of law and economic development
the rule of LawEdwin J. Feulner, Ph.D.

The Heritage Foundation | heritage.org/index 9
was explored in depth in research by Dr. Robert J. Barro that was published in the 2000 Index of Economic Free-dom. In a groundbreaking chapter, Dr. Barro was among the first to question the relationship between the promo-tion of democracy and development, highlighting the practical differences between democracy and the more gen-eral concept of rule of law and conclud-ing that rule of law, by empowering individuals within a stable and predict-able environment, is the more reliable factor in promoting development.
Dr. Barro returns to the Index this year with an updated version of that study based on improved data and new research. His conclusion, how-ever, is the same: Efforts to promote the rule of law can bear substantial fruit in promoting development; pro-motion of democracy, by contrast, is uncertain at best in spurring econom-
ic growth or laying a solid foundation for economic freedom.
At a time when the Middle East is in turmoil, with political systems in rapid evolution or even revolu-tion, Barro’s study provides a solid basis on which to evaluate the likely success of attempts by aid donors to support greater levels of freedom and broad-based economic development throughout the region.
EquitabLE trEatmEnt undEr thE Law
In developing countries, advances in the rule of law often involve such basics as the implementation of con-stitutional legal frameworks, land titling procedures, and the struggle against petty corruption. In advanced economies, corruption often takes more subtle forms, involving special
$0
$20,000
$40,000
$60,000
0 20 40 60 80 100 0 20 40 60 80 100 0 20 40 60 80 100
Source: 2013 Index of Economic Freedom. Chart 1 heritage.org
GDP per Capita (Purchasing Power Parity)
Property Rights Score
Freedom from Corruption Score
Rule of LawScore
Correlation: 0.76R2 = 0.58
Correlation: 0.80R2 = 0.64
Correlation: 0.79R2 = 0.62
The E�ective Rule of Law Propels Prosperity
Trend Lines
10 Highlights of the 2013 Index of Economic Freedom
subsidies or tax privileges for elites, abuses of government contract-ing, cronyism, and selective bailouts. These, of course, exist also in devel-oping countries. Indeed, such govern-ment-granted special privileges tend to exist any time the government claims a significant economic role, either as property holder, business operator, or regulator or through pro-grams aimed at redistributing wealth.
Such policies and practices vio-late one of the three principles of economic freedom: equitable treat-ment for all. As emphasized in the Index, in free societies, individuals succeed or fail based on their effort and ability, not on their connections
or class. Openness and transparency are the greatest antidotes to discrimi-nation, but they are among the most difficult goals to achieve in govern-ment, where secrecy and bureaucracy enable corruption and graft.
In the second study in this section, Dr. Matthew Mitchell surveys the range of corrupt government prac-tices involving special privileges for government-favored individuals or groups and highlights the economic costs they impose on society.
Next, James M. Roberts and John A. Robinson weigh in with a contribution analyzing the specific vulnerabilities of societies endowed with significant natural resources,
Source: 2013 Index of Economic Freedom. Chart 2 heritage.org
Stronger Rule of Law Boosts Foreign Investment,Lowers Unemployment
Rule of Law Scores
First Quartile
Second Quartile
Third Quartile
Fourth Quartile
$328.6
$69.9
$33.0 $20.4
Inflow of Foreign DirectInvestment, in Billions ofU.S. Dollars
First Quartile
Second Quartile
Third Quartile
Fourth Quartile
6.0%
7.0%
10.0% 10.1%
Unemployment Ratefor OECD Countries
The Heritage Foundation | heritage.org/index 11
especially minerals such as oil or diamonds. Through a comparison of countries that have handled the so-called resource curse either especially well or especially poorly, they identify the policies and legal systems most conducive to successful management and exploitation of natural resourc-es. It turns out that strong property rights are the best cure for the “curse.”
thE ruLE OF Law: GOOd FOr businEss
T h e f r e e - m a r k e t e c o n o m y depends on an open, competitive environment with a level playing field. Government’s proper role is to refer-ee the competition. When it abandons its neutrality, either through outright corruption or through misguided efforts at social engineering that involve picking an economy’s winners and losers, the predictable results are a loss of efficiency, a reduction in productivity, and eventual economic stagnation. Entrepreneurs have little chance of success if government is tipping the scales against them in favor of vested interests. It is a fact of life that already established firms, not tomorrow’s innovators, are first in line at the government trough.
To close out this special section, the Index presents an essay by Myron Brilliant of the U.S. Chamber of Com-merce, who argues that sustainable business success is impossible with-out the rule of law, which provides market predictability and due pro-cess. For Brilliant, good governance is good business, and he urges greater efforts to develop new and better indicators to measure the effective-ness of the rule of law and guide firms’ investment decisions.
Indeed, the effort to identify better measures of the rule of law is a critical concern for everyone engaged in comparative studies of economic freedom. Of the four pil-lars of economic freedom evaluated in the Index of Economic Freedom, the rule of law is by far the most dif-ficult to measure. There are few stan-dard metrics, and most published attempts to quantify and compare the rule of law in various countries rely on opinion surveys that can be subjective and unreliable.
To mitigate such deficiencies, the Index draws on an unusually wide variety of sources in evaluating respect for property rights, including information from international orga-nizations, government sources, busi-nesses, research organizations, and the media. Undoubtedly, better met-rics would enable even better under-standing and analysis.
thE FOundatiOn OF EcOnOmic FrEEdOm and GrOwth
The rule of law, especially for developing countries, may be the area of economic freedom that is most important in laying the foun-dations for economic growth, and in advanced economies, deviations from the rule of law may be the first signs of serious problems that will lead to economic decline.
There is plenty of evidence from around the world that the rule of law is a critical factor in empowering indi-viduals, ending discrimination, and enhancing competition. In the never-ending struggle to improve the human condition and achieve greater prosper-ity, policies that promote the rule of

12 Highlights of the 2013 Index of Economic Freedom
law may well deserve a claim of prece-dence over other desirable objectives.
The first and most important role of governments is to preserve the peace while simultaneously respect-ing human rights, dignity, and free-dom. It is the rule of law that enables
peaceful resolution of conflict and ensures integrity in government’s interactions with individuals. The studies in this special section repre-sent an effort to better understand, measure, and promote this key aspect of economic freedom.
Business FreedomLabor Freedom
Monetary Freedom
REGULATORY EFFICIENCY
LIMITED GOVERNMENT
Fiscal FreedomGovernment Spending
RULE OF LAW Property RightsFreedom from Corruption
0 20 40 60 80 100
0 20 40 60 80 100
0 20 40 60 80 100
OPENMARKETS
Trade FreedomInvestment Freedom
Financial Freedom0 20 40 60 80 100
43.440.6
77.261.1
64.660.673.7
74.552.248.8
The rule of law continues to be undermined by political instability, particularly in the Middle East and North Africa. Corruption has worsened in some countries as state interference in economic activity has grown, and perceptions of corruption in Europe and the South America/Caribbean region have increased significantly. Respect for property rights declined in 16 countries; only nine countries improved their property rights scores.
Despite the challenging economic and political environments, tax-system reform has progressed, and the growth of government spending was at least marginally restrained in a number of countries. The average top individual income tax rate is 28.4 percent, and the average top corporate tax rate is 24.3 percent. The average overall tax burden as a percentage of GDP is 22.4 percent, and average government spending as a share of GDP is 35.1 percent.
While some countries have continued to streamline and modernize their business frame-works, reforms have stalled in many others, seemingly as a result of some combination of reform fatigue and complacency. For the world as a whole, labor freedom has declined significantly. In a large number of countries, increases in the minimum wage have exceeded labor productivity growth. Inflationary pressures have inched up around the world.
Trade freedom remained essentially unchanged, with little apparent momentum for further liberalization. Investment freedom improved substantially as many countries sought to ease the foreign investment process. Progress in financial freedom was largely stagnant, reflecting a lack of reform in developing countries and uncertainty in advanced economies. The global financial system remains highly vulnerable to the ongoing European sovereign debt crisis.
The Ten Economic Freedoms: A Global Look

Founded in 1973, The Heritage Foundation is a research and educational institution— a think tank—whose mission is to formulate and promote conservative public policies based on the principles of free enterprise, limited government, individual freedom, traditional American values, and a strong national defense.
We believe the principles and ideas of the American Founding are worth conserving and renewing. As policy entrepreneurs, we believe the most effective solutions are consistent with those ideas and principles. Our vision is to build an America where freedom, opportu-nity, prosperity, and civil society flourish.
Heritage’s staff pursues this mission by performing timely, accurate research on key policy issues and effectively marketing these findings to our primary audiences: members of Congress, key congressional staff members, policymakers in the executive branch, the nation’s news media, and the academic and policy communities.
Governed by an independent Board of Trustees, The Heritage Foundation is an indepen-dent, tax-exempt institution. Heritage relies on the private financial support of the general public—individuals, foundations, and corporations—for its income, and accepts no govern-ment funds and performs no contract work. Heritage is one of the nation’s largest public policy research organizations. Its hundreds of thousands of individual members make it the most broadly supported think tank in America.
For more information, or to support our work, please contact The Heritage Foundation at (800) 544-4843 or visit heritage.org.
The Wall Street Journal is the world’s leading business publication with more than two million subscribers and is the largest U.S. newspaper by total paid circulation. The Wall Street Journal franchise, with a global print audience of 3.5 million, comprises The Wall Street Journal, The Wall Street Journal Asia, and The Wall Street Journal Europe. The Wall Street Journal Online at WSJ.com is the leading provider of business and financial news and analysis on the Web with more than one million subscribers and 34 million visitors per month worldwide. WSJ.com is the flagship site of The Wall Street Journal Digital Network, which also includes MarketWatch.com, Barrons.com, AllThingsD.com, and FINS.com and SmartMoney.com. The Journal holds 34 Pulitzer Prizes for outstanding journalism, and, in 2012, was ranked No. 1 in BtoB’s Media Power 50 for the 13th consecutive year.

0
10,000
20,000
30,000
40,000
$50,000
Free
Freedom Category in the 2013 Index of Economic Freedom
Mostly Free Moderately Free Mostly Unfree Repressed
$44,488
$35,228
$15,822
$5,475 $5,462
Sources: Terry Miller, Kim R. Holmes, and Edwin J. Feulner, 2013 Index of Economic Freedom (Washington, D.C.: The Heritage Foundation and Dow Jones & Company, Inc., 2013), http://www.heritage.org/index, and International Monetary Fund, World Economic Outlook Databases, http://www.imf.org/external/ns/cs.aspx?id=28 (accessed November 6, 2012).
Chart 3 heritage.org
GDP per Capita (Purchasing Power Parity)
Greater Economic Freedom, Higher Standard of Living
Sources: Terry Miller, Kim R. Holmes, and Edwin J. Feulner, 2013 Index of Economic Freedom (Washington, D.C.: The Heritage Foundation and Dow Jones & Company, Inc., 2013), http://www.heritage.org/index; J.W. Emerson, A. Hsu, M.A. Levy, A. de Sherbinin, V. Mara, D.C. Esty, and M. Jaiteh, 2012 Environmental Performance Index and Pilot Trend Environmental Performance Index (New Haven: Yale Center for Environmental Law and Policy, 2012), http://epi.yale.edu/downloads (accessed November 7, 2012); and United Nations, Human Development reports, http://hdr.undp.org/en/reports (accessed November 7, 2012).
Chart 5 heritage.org
Variables Calibrated to 0-to-1 Scale
Overall Score in 2013 Index of Economic Freedom
Four Clear Trends: Economic Freedom Is Key to Overall Well-Being
1.0
0.5
0
0 25 50 75 100
Health
Per Capita Income
Education
Environment
This graphic shows trend lines for four variables related to the quality of life and economic freedom. Together they present a clear trend: nations with more economic freedom enjoy greater overall well-being. The first three trends are from the U.N.’s Human Development reports; the fourth is from Yale University’s Environmental Performance Index.
For almost two decades, The Heritage Foundation has partnered with The Wall Street Journal to measure the impact of liberty and the free market around the world, producing the annual Index of Economic Freedom.The Index demonstrates the strong connection between prosperity and economic freedom, with metrics related to government spending, trade freedom, and the rule of law. • Updated economic freedom data for 185 economies• More than 30 all-new charts and maps• Foreword and Preface from Wall Street Journal Editorial Page Editor Paul A. Gigot
and Heritage Foundation President Dr. Edwin J. Feulner• Analysis from leading researchers, including Harvard University’s Dr. Robert Barro• New special section dedicated to the Rule of Law• Online tools, like customized comparison charts and an interactive heat map
The Heritage Foundation • 214 Massachusetts Avenue, NE • Washington, DC 20002 • heritage.orgThe Wall Street Journal • Dow Jones & Co. • 200 Liberty Street • New York, NY 10281 • www.wsj.com
Economic Freedom Promotes Prosperity
Heritage.org/Index