highly selective mercury detection at partially … x-ray diffraction (xrd), and scanning electron...
TRANSCRIPT

MATERIALSORIGINAL RESEARCH ARTICLE
published: 22 December 2014doi: 10.3389/fmats.2014.00033
Highly selective mercury detection at partially oxidizedgraphene/poly(3,4-ethylenedioxythiophene):poly(styrenesulfonate) nanocomposite film-modifiedelectrode
Nael G.Yasri 1,2,3†, Ashok K. Sundramoorthy 2*†,Woo-Jin Chang1,4* and Sundaram Gunasekaran2*1 Department of Mechanical Engineering, University of Wisconsin-Milwaukee, Milwaukee, WI, USA2 Department of Biological Systems Engineering, University of Wisconsin-Madison, Madison, WI, USA3 Department of Chemistry, Faculty of Science, University of Aleppo, Aleppo, Syria4 Great Lakes WATER Institute, School of Freshwater Sciences, University of Wisconsin-Milwaukee, Milwaukee, WI, USA
Edited by:Emilia Morallon, Universidad deAlicante, Spain
Reviewed by:Santosh Kumar Yadav, DrexelUniversity, USACesar Alfredo Barbero, UniversidadNacional de Rio Cuarto, Argentina
*Correspondence:Ashok K. Sundramoorthy andSundaram Gunasekaran, Departmentof Biological Systems Engineering,University of Wisconsin-Madison, 460Henry Mall, Madison, WI 53706, USAe-mail: [email protected],[email protected];[email protected];Woo-Jin Chang, Department ofMechanical Engineering, University ofWisconsin-Milwaukee, 3200 N.Cramer Street, Milwaukee, WI53211,USAe-mail: [email protected]†Nael G. Yasri and Ashok K.Sundramoorthy have contributedequally to this work.
Partially oxidized graphene flakes (po-Gr) were obtained from graphite electrode by an elec-trochemical exfoliation method. As-produced po-Gr flakes were dispersed in water with theassistance of poly(3,4-ethylenedioxythiophene)/poly(styrenesulfonate) (PEDOT:PSS). Thepo-Gr flakes and the po-Gr/PEDOT:PSS nanocomposite (po-Gr/PEDOT:PSS) were charac-terized by Raman spectroscopy, Fourier transform-infrared spectroscopy (FT-IR), UV–Visspectroscopy, X-ray diffraction (XRD), and scanning electron microscopy (SEM). In addi-tion, we demonstrated the potential use of po-Gr/PEDOT:PSS electrode in electrochemicaldetection of mercury ions (Hg2+) in water samples. The presence of po-Gr sheets inPEDOT:PSS film greatly enhanced the electrochemical response for Hg2+. Cyclic voltam-metry measurements showed a well-defined Hg2+ redox peaks with a cathodic peak at0.23V, and an anodic peak at 0.42V. Using differential pulse stripping voltammetry, detec-tion of Hg2+ was achieved in the range of 0.2–14 µM (R2
=0.991), with a limit of detectionof 0.19 µM for Hg2+. The electrode performed satisfactorily for sensitive and selectivedetection of Hg2+ in real samples, and the po-Gr/PEDOT:PSS film remains stable on theelectrode surface for repeated use.Therefore, our method is potentially suitable for routineHg2+ sensing in environmental water samples.
Keywords: graphene flakes, mercury determination, PEDOT:PSS-modified electrode, heavy metal analysis, electro-chemical exfoliation
INTRODUCTIONMercury (Hg) is an essential element in the industry; however,the metal and its compounds are extremely dangerous to humanhealth and to the environment. Although the use of Hg is regulatedin many countries, it is still used in several domestic and industrialapplications, which has led to the accumulation of Hg residues inlandfills, soils, and streams (Seco-Reigosa et al., 2014). As a result,the focus of numerous investigations has been on closely mon-itoring Hg present in the environment (Pesavento et al., 2009).Standard methods for Hg analysis include: cold vapor atomicabsorption spectrometry (CVAAS) (EPA, 2007a) and inductivelycoupled plasma-mass spectrometry (ICP-MS) (EPA,2007b). SomeHg-monitoring applications, without requiring sample pretreat-ment, depend upon point-of-use sensors that are simple, rapid,stable, reliable, and inexpensive. Accordingly, various methodshave been developed such as colorimetric (Liu et al., 2010), flu-orometric (Wang et al., 2014a), magnetic (Najafi et al., 2013),electrochemical (Martin-Yerga et al., 2013), etc. The electroanalyt-ical techniques have played a major role in simplified testing for Hg
and have been approved by many regulatory bodies (EPA, 1996). Ingeneral, many electroanalytical or colorimetric methods rely upona change in electrical signal following a reaction (amalgamation)of gold (Au) or other precious metals with Hg, either at the elec-trode or within the sample solution to selectively bind with thetarget mercury ions (Hg2+) (Welch et al., 2004; Martin-Yergaet al., 2013). The major drawbacks in using Au for sensing Hgare the significant effect of the sample matrix (Botasini et al.,2013) and the structural changes on the sensor material causedby the amalgam formation (Welch et al., 2004; Martin-Yerga et al.,2013), which require some additional chemical, electrochemical,and mechanical pretreatment of the sample (Anandhakumar et al.,2012).
Some electrochemical methods for sensing Hg use the conju-gation of functional groups, such as the donor ligands of nitrogen(N) or sulfur (S) present in amino acids or conducting polymers,such as poly (3,4-ethylenedioxythiophene) (PEDOT), which havea strong binding preference for Hg2+ (Chow and Gooding, 2006;Giannetto et al., 2011; Anandhakumar et al., 2012). In the case of
www.frontiersin.org December 2014 | Volume 1 | Article 33 | 1
Yasri et al. Mercury detection on graphene/PEDOT:PPS-modified electrode
PEDOT, although it contains S, which can endow two unpairedelectrons, it may not be possible to use PEDOT by itself due to thelow signal sensitivity, high insolubility, and intractability (Martin-Yerga et al., 2013). Therefore, to produce a stable and flexiblepolymer, a conventional poly(styrenesulfonate) (PSS) is incorpo-rated into PEDOT to form PEDOT:PSS (Vacca et al., 2008), whichis an excellent copolymer because of its high conductivity, envi-ronmental stability (Wang et al., 2014b). To date, the potentials ofPEDOT:PSS for electrode modification and electrochemical sens-ing of toxic metal ions have been seldom reported (Anandhakumaret al., 2011; Yasri et al., 2011; Rattan et al., 2013).
Due to high electrical conductivity, biocompatibility, and theexceptional surface-to-volume ratio, graphene (Gr) received moreattention in various applications, including chemical and biosen-sors (Hill et al., 2011; Sundramoorthy and Gunasekaran, 2014).Recently, incorporating Gr on the working electrode surface toenhance the electrochemical signal for analytical applicationshas become fairly common (Mikolaj and Zbigniew, 2012; Sun-dramoorthy and Gunasekaran, 2014). Generally, Gr or reducedgraphene oxide (rGO) are used for sensor applications (Yang andGunasekaran, 2013; Yang et al., 2013). Gr can be obtained fromgraphite by mechanical cleavage (Jayasena and Subbiah, 2011),chemical exfoliation (Zhang et al., 2010), thermal decomposi-tion (Wang et al., 2012), or electrochemical exfoliation (Lowet al., 2013). Among other methods, electrochemical exfoliationof graphite electrode is considered a simple, rapid, and “green”method, as the use of toxic or corrosive reducing reagents orstabilizers are avoided in this method (Su et al., 2011; Singhet al., 2012; Chang et al., 2013; Gee et al., 2013; Mao et al.,2013).
The electrochemical exfoliation of graphite can be achievedby a one or two-step process. In a two-step process, in the firststep, graphite electrode is activated in an electrolyte solution ata relatively low bias voltage. During this part of the process, theelectrode expands due to the intercalation of electrolyte (usuallyLi+ or Na+) ions into the graphite lattice (Zhong and Swager,2012). The second step involves applying a higher bias voltage toensure exfoliation of the expanded graphite electrode and sepa-rating Gr flakes into the solution (Qi et al., 2011; Su et al., 2011;Zhang et al., 2012; Gee et al., 2013; Li et al., 2013). For example,when lithium ion (Li+) is used as an electrolyte, −3.0 V of staticbias voltage is applied to intercalate Li+ into graphite electrode(Wang et al., 2011). In this work, we have electrochemically syn-thesized partially oxidized Gr (po-Gr) flakes to study its potentialapplication in detecting mercury (Hg2+) ions with PEDOT:PSS.The po-Gr/PEDOT:PSS conducting film readily conjugates withHg2+ in water and allowed us to do selective detection of Hg2+ inreal samples.
MATERIALS AND METHODSREAGENTSWe used analytical-grade chemicals from Fisher, Acros Organ-ics, and Sigma-Aldrich (USA). Supporting electrolytes were pre-pared using HNO3 or NaCl. Stock solution of 10× 10−4 MHg2+ was prepared using mercury nitrate [Hg(NO3)2] andused after further dilution. All aqueous solutions were preparedusing deionized water with 18.2 MΩ cm (EMD, Millipore). The
PEDOT:PSS sample was received from CIDETEC research group(San Sebastian, Spain) (Istamboulie et al., 2010).
ELECTROCHEMICAL SYNTHESIS OF po-GrThe po-Gr flakes were obtained by electrochemical exfoliationof graphite sheet. Briefly, a two-electrode cell was used with apiece of flexible graphite sheet (Graphitestore, Inc., USA) as aworking electrode and a platinum (Pt) wire were placed paral-lel to and about 10 mm away from the graphite electrode whichserved as a counter electrode. The electrodes were connected to aDC power supply (Tektronix PS 280). About 10 mm of the work-ing and counter electrodes were immersed into 25 mL containing0.1 M HClO4 and 0.1 M NaCl which served as an electrolyte. Theexfoliation was performed by applying DC bias on the workingelectrode. Initially, a potential of −2.5 V was applied for 60 min tofacilitate the electrochemical expansion of graphite electrode byintercalation of Na+ ions into graphite layers; after which, a poten-tial of+10 V was applied for another 60 min to achieve exfoliation.The electrolyte solution containing the exfoliated po-Gr flakes wasvacuum filtrated (using membrane with a pore size 0.4 µm) andwashed with deionized water many times to remove the residualelectrolyte.
PREPARATION OF po-Gr/PEDOT:PSS DISPERSIONThe obtained po-Gr flakes were dried at 60°C for 30 min,and then dispersed in 10 mL PEDOT:PSS solution by a probesonicator (Sonics, VibraCell VCX130) for 15 min. Later, thepo-Gr/PEDOT:PSS dispersion was centrifuged for 30 min at2,000 rpm (Sorvall Super T21) and the supernatant was used forfurther characterization. The po-Gr flakes were also dispersed inwater (without PEDOT:PSS) for 15 min by probe sonicator andcentrifuged at 2,000 rpm for 30 min to collect supernatant for con-trol studies. All experiments were performed at room temperature(25± 3°C).
PREPARATION OF po-Gr/PEDOT:PSS-MODIFIED ELECTRODEA 10 µL sample of po-Gr/PEDOT:PSS or po-Gr dispersion wasplaced on a well cleaned (after mirror-like polishing with aluminapowder) glassy carbon electrode (GCE) surface and dried in anair-oven for 30 min to evaporate solvents. By this method, po-Gr/PEDOT:PSS or po-Gr film-coated electrode was obtained andgently washed by immersing in water for about 5 min to removeunbounded materials from the electrode surface. For Raman mea-surements, the po-Gr film prepared on glass substrate was reducedwith hydrazine in pH 9.0 water solution at 80°C for 2 h (Park et al.,2011).
ELECTROCHEMICAL MEASUREMENTS AND CHARACTERIZATIONElectrochemical measurements were performed by using an elec-trochemical workstation (660D, CH Instruments). A 10-mL vol-ume, three-electrode system was used with GCE, Ag/AgCl (3 MKCl), and Pt wire as working, reference, and counter electrode,respectively. The GCE was used either bare or after modificationwith po-Gr film, PEDOT:PSS film, or po-Gr/PEDOT:PSS film. Theelectrochemical responses of the bare GCE and modified GCE’stoward Hg2+ were examined with cyclic voltammetry (CV) in0.05 M HNO3 as an electrolyte.
Frontiers in Materials | Carbon-Based Materials December 2014 | Volume 1 | Article 33 | 2
Yasri et al. Mercury detection on graphene/PEDOT:PPS-modified electrode
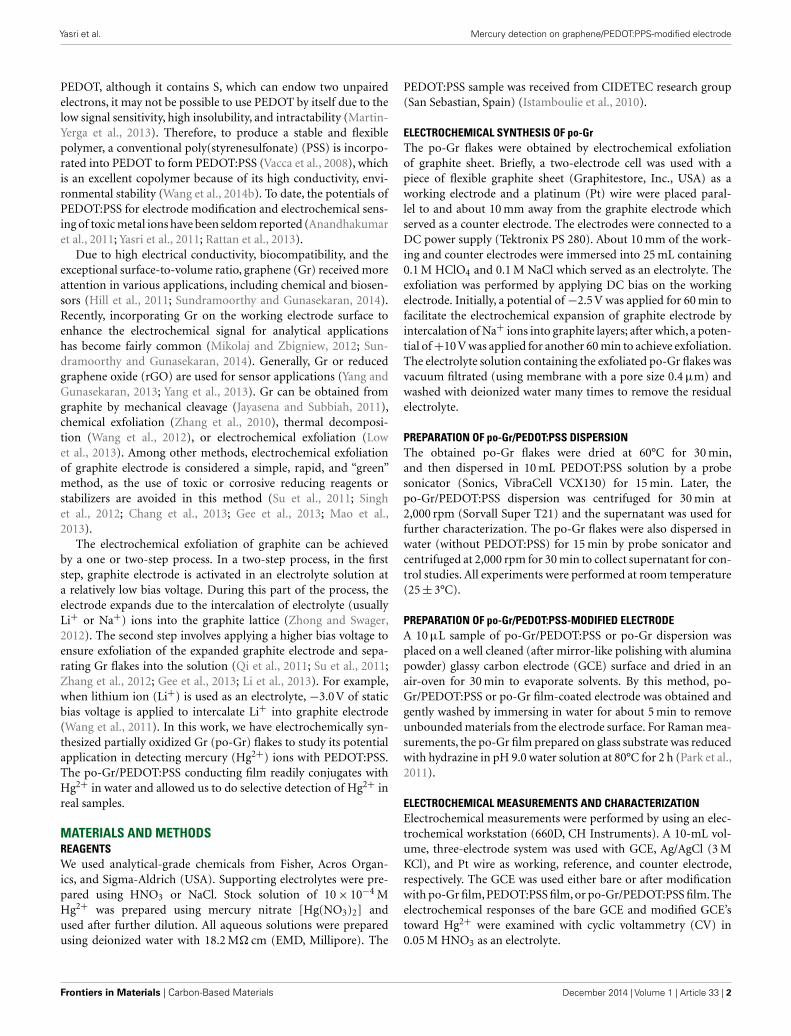
FIGURE 1 | Schematic representation of electrochemical synthesis of po-Gr and electrochemical detection of mercury (Hg2+) at po-Gr-PEDOT:PSSfilm-coated electrode by differential pulse stripping voltammetry (DPSV).
Electrochemical impedance spectroscopy (EIS) measurementswere performed in a solution containing 2.5 mM [Fe(CN)6]4-/3-
and 0.1 M KCl supporting electrolyte in the frequency range of1–106 Hz. Differential pulse stripping voltammetry (DPSV) wasperformed by applying deposition and then stripping steps withthe following parameters: initial potential, −0.2 V; final poten-tial, 0.8 V; amplitude, 50 mV; pulse width, 0.2 s; pulse period, 0.5 s;sample width, 0.0169 s; and deposition time, 2 min. During thedeposition period, the solution was stirred at 800 rpm, and thepotential was held at −0.30 V. The DPSV voltammograms wererecorded upon injection of Hg2+ ions in the range of 0.2–14.0 µMin 0.05 M HNO3. The interferences of some metal ions (Ca2+,Fe2+, Co2+, Ni2+, Cd2+, Zn2+, Cr6+, and Pb2+) on the determi-nation of 6.0 µM Hg2+ in 0.05 M HNO3 were also investigated byadding their respective nitrate salts.
The surface morphology of po-Gr flakes was studied by scan-ning electron microscopy (SEM) (LEO1530, Gemini FESEM, CarlZeiss). Further characterizations were performed on dry samplesusing Raman spectroscopy (LabRAM Aramis Horiba Jobin YvonConfocal Raman Microscope, wavelength: 532 nm) and attenuatedtotal reflectance-Fourier transform-infrared spectroscopy (ATR-FT-IR) (Spectrum 100, PerkinElmer). UV–Vis spectra of po-Grand po-Gr/PEDOT:PSS dispersed in water were obtained usinga spectrophotometer (Lambda 25, PerkinElmer). X-ray diffrac-tion (XRD) pattern of samples were measured using Bruker D8Discover diffractometer.
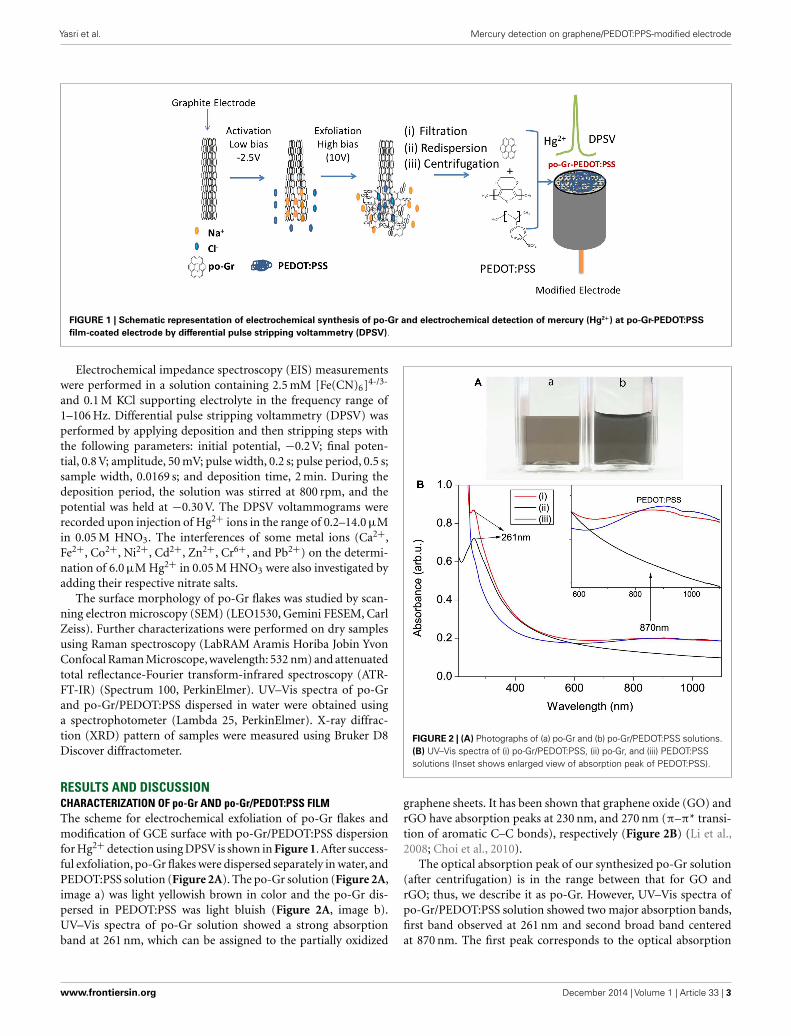
RESULTS AND DISCUSSIONCHARACTERIZATION OF po-Gr AND po-Gr/PEDOT:PSS FILMThe scheme for electrochemical exfoliation of po-Gr flakes andmodification of GCE surface with po-Gr/PEDOT:PSS dispersionfor Hg2+ detection using DPSV is shown in Figure 1. After success-ful exfoliation, po-Gr flakes were dispersed separately in water, andPEDOT:PSS solution (Figure 2A). The po-Gr solution (Figure 2A,image a) was light yellowish brown in color and the po-Gr dis-persed in PEDOT:PSS was light bluish (Figure 2A, image b).UV–Vis spectra of po-Gr solution showed a strong absorptionband at 261 nm, which can be assigned to the partially oxidized
FIGURE 2 | (A) Photographs of (a) po-Gr and (b) po-Gr/PEDOT:PSS solutions.(B) UV–Vis spectra of (i) po-Gr/PEDOT:PSS, (ii) po-Gr, and (iii) PEDOT:PSSsolutions (Inset shows enlarged view of absorption peak of PEDOT:PSS).
graphene sheets. It has been shown that graphene oxide (GO) andrGO have absorption peaks at 230 nm, and 270 nm (π–π* transi-tion of aromatic C–C bonds), respectively (Figure 2B) (Li et al.,2008; Choi et al., 2010).
The optical absorption peak of our synthesized po-Gr solution(after centrifugation) is in the range between that for GO andrGO; thus, we describe it as po-Gr. However, UV–Vis spectra ofpo-Gr/PEDOT:PSS solution showed two major absorption bands,first band observed at 261 nm and second broad band centeredat 870 nm. The first peak corresponds to the optical absorption
www.frontiersin.org December 2014 | Volume 1 | Article 33 | 3

Yasri et al. Mercury detection on graphene/PEDOT:PPS-modified electrode
FIGURE 3 | Raman spectra of (A) pristine graphite sheet, (B) po-Gr flakes (as-synthesized from electrochemical exfoliation), (C) po-Gr film (aftercentrifugation), and (D) po-Gr film after reduction with hydrazine (532 nm laser was used) (*peak is assigned to the glass substrate).
Table 1 |The D, G, 2D bands and ID/IG ratio were estimated from the Raman spectrum of pristine graphite sheet, po-Gr flakes, po-Gr film
(prepared after centrifugation), and po-Gr film after chemical reduction using hydrazine.
Samples D band intensity
at ~1353 cm−1
G band intensity
at ~1594 cm−1
ID/IG 2D band intensity
at ~2718 cm−1
Graphite sheets 38.58 752.02 0.051 345.24
po-Gr flakes (without centrifuging) 196.08 631.87 0.310 282.18
po-Gr film (prepared after centrifuging) 574.58 535.62 1.073 165.68
po-Gr film after reduction with hydrazine 400.60 324.64 1.234 122.50
of the po-Gr and the second peak corresponds to the oxidizedPEDOT:PSS (light blue) (Gustafsson-Carlberg et al., 1995; Pet-tersson et al., 1999; Tarabella et al., 2012). For comparison, we alsomeasured UV–Vis spectra of PEDOT:PSS solution, which showsa broad optical absorption band centered at 870 nm (Figure 2B).This study provides evidence that po-Gr sheets are stabilized inPEDOT:PSS solution.
Raman spectra of the (a) pristine graphite sheet, (b) as-synthesized po-Gr flakes, (c) po-Gr film prepared from waterdispersion after centrifugation, and (d) po-Gr film after reduc-tion with hydrazine are presented in Figure 3. The spectra showD, G, and 2D bands for all samples (Table 1). For pristine graphitesheet, almost insignificant D band was observed, because of highlycrystalline structure of graphite without defects (Figure 3A). How-ever, Raman spectrum of the other three samples (Figures 3B–D)showed significant changes upon exfoliation, following redisper-sion in water and after reduction with hydrazine (Table 1). The Gband is characteristic of sp2-hybridized C=C bonds in graphenesheets (Childres et al., 2013); whereas, the D band is associated with
structural defects and partially disordered structures of the sp2domain (Childres et al., 2013). The 2D band located at 2718 cm−1
originates from a double-resonance process (Krauss et al., 2009;Yan et al., 2011). The calculated values of ID/IG listed in Table 1.Su et al. (2011)) show that it changed significantly from 1.073to 1.234 after reduction with hydrazine, indicating that restora-tion of C–C bonds in the graphene lattice, and a decrease inthe average size of graphene domains (Lee et al., 2014). Thisstudy supports our understanding that as synthesized grapheneflakes contain significant defects, due to functional groups gen-erated upon electrochemical exfoliation at high voltage (Moraleset al., 2011). ID/IG ratio (0.310) of as-synthesized graphene flakesis relatively small compared to po-Gr film (after centrifugation),which may be due to the presence of large graphene flakes with-out complete exfoliation (Figure 3B). Therefore, it was necessaryto disperse po-Gr flakes in a suitable dispersant with a probesonicator to achieve complete exfoliation of graphene sheets.In this work, we used PEDOT:PSS to disperse po-Gr flakes inwater.
Frontiers in Materials | Carbon-Based Materials December 2014 | Volume 1 | Article 33 | 4

Yasri et al. Mercury detection on graphene/PEDOT:PPS-modified electrode
FIGURE 4 | FT-IR Spectra of po-Gr flakes, po-Gr film (prepared aftercentrifugation), po-Gr/PEDOT:PSS film, and PEDOT:PSS film(highlighted area in the figure shows the –OH stretch due to partialoxidation of po-Gr sheets).
The as-synthesized po-Gr flakes, po-Gr film (after centrifuga-tion), PEDOT:PSS film, and po-Gr/PEDOT:PSS film were charac-terized by FT-IR (Figure 4). For as-synthesized po-Gr flakes, nosignificant bands were observed, which may be due to the incom-plete exfoliation process. Indeed, after successful redispersion inwater and following centrifugation, po-Gr film on glass showedsignificant bands at ~3430 (OH stretch), 2337 (CO2 stretch),1722 (C=O stretch), and 1637 cm−1(OH bending and C=Cstretch)(Pham et al., 2011). The FT-IR spectrum of PEDOT:PSSshowed peaks at 1372, 1289, 1124, 1023, 1002 cm−1, which arederived from PEDOT:PSS (Alemu Mengistie et al., 2013; Yoo et al.,2014). The IR bands at 1160 and 1023 cm−1 are assigned to SO3−
of the PSS. Further, the FT-IR spectrum of po-Gr/PEDOT:PSSconsists bands of PEDOT:PSS, which proves that po-Gr sheetswrapped with the polymer structure (Figure 4).
Surface morphology of po-Gr sheets was also studied by SEM.SEM images of the exfoliated po-Gr film show wrinkled or foldedthin sheets with the lateral dimension of 1–3 µm (Figure 5A).The XRD spectrum of graphite sheet exhibits an intense peak at26.5°, corresponding to d-spacing of 0.34 nm (Figure 5B). How-ever, after electrochemical exfoliation, po-Gr flakes exhibit a broadpeak at ~16 to 23° and another intense peak at 26.52°. The broadpeak at ~16 to 23° indicates the presence of functional groupscontaining oxygen, which is formed during electrochemical exfo-liation (Figure 5B) (Fang et al., 2009). There is also slight shift inthe peak position of po-Gr flakes from graphite after electrochem-ical exfoliation from 26.50 to 26.52 (inset of Figure 5B), whichmay due to intercalation of ions into the graphene layers.
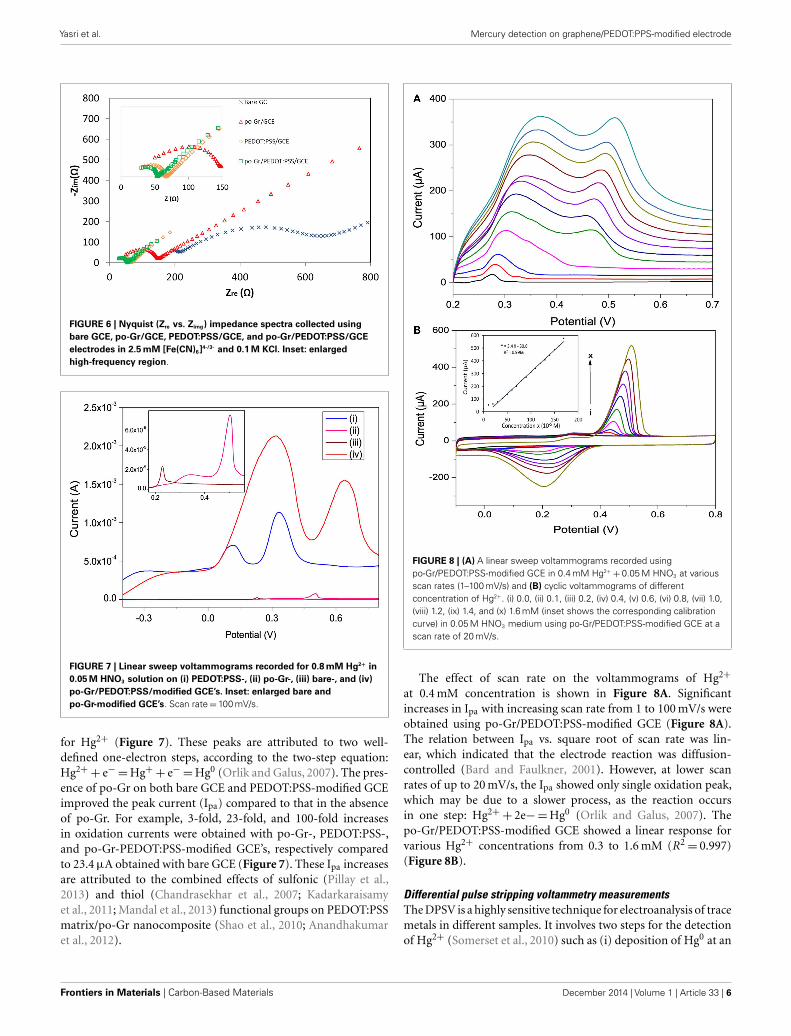
ELECTROCHEMICAL IMPEDANCE STUDIESFigure 6 is the Nyquist plot of the modified GCE’s in 2.5 mM[Fe(CN)6]4-/3- in 0.1 M KCl. The semicircular part in the high-frequency region represents electron-transfer-limiting processwith its effective diameter equal to Faradaic charge transfer
FIGURE 5 | (A) SEM image of po-Gr sheets and (B) XRD patterns ofpristine graphite sheet and po-Gr flakes (inset shows enlarged view of peak002). The distorted peak in the range of 15–24 θ is assigned to the partiallyoxidized parts of graphene flakes.
resistance (Rct), which is responsible for the electron transferkinetics of redox reactions at the electrode-electrolyte interface(Kumar et al., 2010; Yang and Gunasekaran, 2013). The Rct valuesof po-Gr/GCE (Rct= 144 Ω), PEDOT:PSS/GCE (Rct= 65 Ω), andpo-Gr/PEDOT:PSS/GCE (Rct= 54 Ω), modified electrodes werelower than that for bare electrode (Rct= 228 Ω), indicating higherconductivity as a result of modification processes (Figure 6). Gen-erally poor conductivity of GO-modified electrode is due to thepresence of excessive oxygenated species, which accentuates theinsulating characteristics (Yang and Gunasekaran, 2013). The Rct
for po-Gr film is also higher than for PEDOT:PSS/GCE and po-Gr/PEDOT:PSS/GCE’s perhaps due to the presence of oxygenatedspecies associated with po-Gr, which may affect conductivity of theelectrode. However, when po-Gr sheets present in PEDOT:PSS, itimproves the conductivity of the electrode (Figure 6).
DETECTING Hg2+
Linear sweep voltammetryThe linear sweep voltammograms (LSVs) of Hg2+ recordedon bare, po-Gr/PEDOT:PSS-, PEDOT:PSS-, and po-Gr-modifiedGCE’s in 0.05 M HNO3 show two electrochemical oxidation peaks
www.frontiersin.org December 2014 | Volume 1 | Article 33 | 5
Yasri et al. Mercury detection on graphene/PEDOT:PPS-modified electrode
FIGURE 6 | Nyquist (Zre vs. Zimg) impedance spectra collected usingbare GCE, po-Gr/GCE, PEDOT:PSS/GCE, and po-Gr/PEDOT:PSS/GCEelectrodes in 2.5 mM [Fe(CN)6]4-/3- and 0.1 M KCl. Inset: enlargedhigh-frequency region.
FIGURE 7 | Linear sweep voltammograms recorded for 0.8 mM Hg2+ in0.05 M HNO3 solution on (i) PEDOT:PSS-, (ii) po-Gr-, (iii) bare-, and (iv)po-Gr/PEDOT:PSS/modified GCE’s. Inset: enlarged bare andpo-Gr-modified GCE’s. Scan rate=100 mV/s.
for Hg2+ (Figure 7). These peaks are attributed to two well-defined one-electron steps, according to the two-step equation:Hg2+
+ e−=Hg++ e−=Hg0 (Orlik and Galus, 2007). The pres-ence of po-Gr on both bare GCE and PEDOT:PSS-modified GCEimproved the peak current (Ipa) compared to that in the absenceof po-Gr. For example, 3-fold, 23-fold, and 100-fold increasesin oxidation currents were obtained with po-Gr-, PEDOT:PSS-,and po-Gr-PEDOT:PSS-modified GCE’s, respectively comparedto 23.4 µA obtained with bare GCE (Figure 7). These Ipa increasesare attributed to the combined effects of sulfonic (Pillay et al.,2013) and thiol (Chandrasekhar et al., 2007; Kadarkaraisamyet al., 2011; Mandal et al., 2013) functional groups on PEDOT:PSSmatrix/po-Gr nanocomposite (Shao et al., 2010; Anandhakumaret al., 2012).
FIGURE 8 | (A) A linear sweep voltammograms recorded usingpo-Gr/PEDOT:PSS-modified GCE in 0.4 mM Hg2+
+0.05 M HNO3 at variousscan rates (1–100 mV/s) and (B) cyclic voltammograms of differentconcentration of Hg2+. (i) 0.0, (ii) 0.1, (iii) 0.2, (iv) 0.4, (v) 0.6, (vi) 0.8, (vii) 1.0,(viii) 1.2, (ix) 1.4, and (x) 1.6 mM (inset shows the corresponding calibrationcurve) in 0.05 M HNO3 medium using po-Gr/PEDOT:PSS-modified GCE at ascan rate of 20 mV/s.
The effect of scan rate on the voltammograms of Hg2+
at 0.4 mM concentration is shown in Figure 8A. Significantincreases in Ipa with increasing scan rate from 1 to 100 mV/s wereobtained using po-Gr/PEDOT:PSS-modified GCE (Figure 8A).The relation between Ipa vs. square root of scan rate was lin-ear, which indicated that the electrode reaction was diffusion-controlled (Bard and Faulkner, 2001). However, at lower scanrates of up to 20 mV/s, the Ipa showed only single oxidation peak,which may be due to a slower process, as the reaction occursin one step: Hg2+
+ 2e−=Hg0 (Orlik and Galus, 2007). Thepo-Gr/PEDOT:PSS-modified GCE showed a linear response forvarious Hg2+ concentrations from 0.3 to 1.6 mM (R2
= 0.997)(Figure 8B).
Differential pulse stripping voltammetry measurementsThe DPSV is a highly sensitive technique for electroanalysis of tracemetals in different samples. It involves two steps for the detectionof Hg2+ (Somerset et al., 2010) such as (i) deposition of Hg0 at an
Frontiers in Materials | Carbon-Based Materials December 2014 | Volume 1 | Article 33 | 6

Yasri et al. Mercury detection on graphene/PEDOT:PPS-modified electrode
FIGURE 9 |The effect of (A) deposition time at −0.3 V vs. Ag/AgCl and (B) deposition potential for 120 s on the DPSV stripping responses of 6 µM ofHg2+ at po-Gr/PEDOT:PSS-modified GCE in 0.05 M HNO3.
optimized potential for a certain duration and (ii) anodic strip-ping of deposited Hg0. As shown in Figure 8B, the reduction ofHg2+ occurs at 0.21 V vs. Ag/AgCl. The effects of the depositionpotential and time on the Hg stripping responses were investigatedaccordingly. The stripping peak currents at different depositionpotentials (from −0.5 to +0.2 V) showed that the best strippingsignal was obtained in the range of −0.30 to 0.0 V vs. Ag/AgCl(Figure 9B). Based on these results, a deposition potential of−0.30 V was selected for further investigation. Figure 9A shows therelationship between the Hg stripping signal against the depositiontime at −0.3 V vs. Ag/AgCl using po-Gr/PEDOT:PSS-modifiedelectrode. The peak current becomes fairly stable after 120 s ofdeposition.
The anodic DPSV response of the po-Gr/PEDOT:PSS-modifiedelectrode with successive Hg2+ concentrations in 0.05 M HNO3
solution are presented in Figure 10. A linear variation of the I pa
was observed for concentrations ranging from 0.2 to 14.0 µM(R2= 0.991), with a sensitivity of 8.72 µA/µM. The limit of detec-
tion (LOD) and limit of quantification (LOQ) were calculatedas LOD= 3.3 SD/b and LOQ= 10 SD/b, where SD is the stan-dard deviation of five reagent blank determinations and b is theslope of the calibration curve (Shrivastava and Gupta, 2011).Using po-Gr/PEDOT:PSS-modified GCE, the LOD and LOQwere found to be 0.19 and 0.58 µM for Hg2+, respectively. ThisLOD is lower than dithiodianiline-derivative-modified electrode(~2.1 µM) (Somerset et al., 2010) and silver ink screen-printedelectrode (~0.5 µM) (Chiu et al., 2008). The po-Gr-PEDOT:PSS-modified GCE also exhibited excellent stability and reproducibilitywith relative standard deviation (RSD) of 0.93% for 10 succes-sive measurements of 6.0 µM Hg2+ in 0.05 M HNO3 solution.The RSD for six similarly prepared electrodes tested under thesame conditions was 1.6%. LOD of Hg2+ at Au-PEDOT carboncomposite film was ~5 µM (Anandhakumar et al., 2012). In addi-tion, Au-PEDOT film-modified electrode may not be suitable forrepeated use because of amalgam formation with AuNPs. Amal-gam formation on the electrode surface affects reproducibilityof analytical response. It is necessary to regenerate or activatethe electrode surface each time with ethylenediaminetetraaceticacid (Giannetto et al., 2011). Electrochemical response of Hg2+
at po-Gr/PEDOT:PSS-modified GCE is not dependent on amal-gam formation, so it offers reproducible measurements withoutthe need for regeneration or electrode activation.
FIGURE 10 | DPSV curves for different Hg2+ concentrations (0, 0.2, 1.0, 3.0,5.0 7.0, 9.0, 11.0, and 14.0 µM) in 0.05 M HNO3 usingpo-Gr/PEDOT:PSS-modified GCE (inset shows calibration plot of peakcurrent vs. Hg2+ concentration). The reduction voltage is −0.30V vs.Ag/AgCl for 120 s, then DPSV stripping in the range −0.2 to 0.8V vs.Ag/AgCl at increments of 4 mV, amplitude 0.05V, pulse width 0.2 s, andpulse period 0.5 s.
EFFECT OF INTERFERENCEThe influence of various common interfering metal cations (Ca2+,Zn2+, Ni2+, Cr6+, As3+, Cd2+, Co2+, Fe2+, and Cu2+) in thepresence of 6.0 µM Hg2+ in 0.05 M HNO3 were tested usingthe po-Gr/PEDOT:PSS-modified GCE. The interference effect wascalculated as:
Interference (%) =IHg − IHg+interferent
IHg× 100
where, I Hg= peak current for Hg2+, I Hg+ interferent= peak cur-rent for Hg2+ plus added interferent. The data in Table 2 indicatethat the performance of the po-Gr-PEDOT:PSS-modified GCEwas unaffected by the tested interferents. The stripping peak cur-rent of Hg2+ exhibited no change in the presence of Zn2+, Cd2+,Ca2+, As3+, or Ni2+ ions even at concentrations each at morethan 300 times that of Hg2+. Assuming an acceptable interference
www.frontiersin.org December 2014 | Volume 1 | Article 33 | 7

Yasri et al. Mercury detection on graphene/PEDOT:PPS-modified electrode
Table 2 | Interference study of other metal ions on the DPSV
measurement of 6.0 µM Hg2+ using po-Gr/PEDOT:PSS-modified GCE.
Metal ion Ratio of
interfering
cation/Hg2+
Hg2+ measured
(µM) (Mean±SD)
RSD
(%)
Interference (%)
Hg2+ 0 6.09±0.112 1.83 0.0
Ca2+ 330 5.94±0.014 0.24 −2.5
Zn2+ 330 5.93±0.022 0.38 −2.6
Ni2+ 330 5.97±0.021 0.36 −2.0
Cr6+ 33 5.88±0.010 0.18 −3.4
As3+ 330 5.98±0.020 0.41 −1.8
Cd2+ 330 5.90±0.023 0.39 −3.1
Co2+ 330 5.78±0.024 0.42 −5.1
Fe2+ 10 6.49±0.036 0.97 +6.7
Cu2+ 16 6.38±0.052 0.82 +4.8
Table 3 | Comparison of Hg2+ content determined by using
po-Gr/PEDOT:PSS/GCE and by standard cold vapor atomic
absorption spectroscopy (CVAAs) method in unknown samples.
Sample Our sensor (ppm),
(mean±SD; n=3)
CVAAS method (ppm),
(mean±SD; n=3)
1 15.08±0.042 15.00±0.05
2 18.94±0.084 19.00±0.05
3 4.17±0.112 420±0.05
of ±5% (Fifield and Kealey, 2000), only Cu2+ at 16 times thatof Hg2+ and Fe2+, at 10 times that of Hg2+, can be consideredas interferents. DPSV of a solution containing Fe2+, Cu2+, andHg2+, exhibited oxidation peaks for Fe2+ at 0.44 V and for Cu2+
at−0.024 V vs. Ag/AgCl (Figure S1 in Supplementary Material).
VALIDATION WITH REAL SAMPLE TESTSThe performance of the po-Gr/PEDOT:PSS-modified GCE wasevaluated by comparing test results with those determined accord-ing to US Environmental Protection Agency (EPA) Method 245.1(EPA, 2007a) using CVAAS performed at the Wisconsin State Lab-oratory of Hygiene. The data obtained by measuring Hg2+ contentin three unknown laboratory waste samples (Table 3) provide anexcellent validation of proposed method.
CONCLUSIONWe synthesized po-Gr from graphite sheets by electrochemicalexfoliation using HClO4/NaCl solution as an electrolyte. The po-Gr and po-Gr-PEDOT:PSS film were characterized using SEM,Raman, FT-IR, XRD, and UV–Vis spectroscopy. Both EIS and CVmeasurements proved that the presence of po-Gr enhanced theelectrochemical catalytic properties of PEDOT:PSS material. Thepo-Gr/PEDOT:PSS-modified GCE exhibited higher catalytic peakcurrent for Hg2+ compared to bare and PEDOT:PSS-modifiedGCE. The Gr-PEDOT:PSS/GCE was stable and reproducible fordetermining Hg2+ at micromolar levels. The LOD determined byDPSV was 0.19 µM, and the detection was linear in the range of0.2–14.0 µM (R2
= 0.991). The sensor response was not affected
by other metal ions. Accurate selective detection of Hg2+ in labora-tory water samples showed that our method is suitable for routineHg2+ sensing in environmental samples.
ACKNOWLEDGMENTSThe authors are thankful to funding support to Nael G. Yasrithrough Scholar Rescue Fund Fellowship. Authors would also liketo thank Prof. Thierry Noguer (Université de Perpignan Via Domi-tia) for cooperation and supplying the sensitized PEDOT:PSSsample.
SUPPLEMENTARY MATERIALThe Supplementary Material for this article can be found onlineat http://www.frontiersin.org/Journal/10.3389/fmats.2014.00033/abstract
REFERENCESAlemu Mengistie, D.,Wang, P.-C., and Chu, C.-W. (2013). Effect of molecular weight
of additives on the conductivity of PEDOT:PSS and efficiency for ITO-freeorganic solar cells. J. Mater. Chem. A 1, 9907–9915. doi:10.1039/c3ta11726j
Anandhakumar, S., Mathiyarasu, J., Lakshmi, K., Phani, N., and Yegnaraman, V.(2011). Simultaneous determination of cadmium and lead using PEDOT/PSSmodified glassy carbon electrode. Am. J. Anal. Chem. 2, 470–474. doi:10.4236/ajac.2011.24056
Anandhakumar, S., Mathiyarasu, J., and Phani, K. L. N. (2012). Anodic strippingvoltammetric detection of mercury(ii) using Au-PEDOT modified carbon pasteelectrode. Anal. Methods 4, 2486–2489. doi:10.1039/c2ay25170a
Bard, A. J., and Faulkner, L. R. (2001). Electrochemical Methode; Fundamentals andApplications. New York: John Wiley & Sons, INC.
Botasini, S., Heijo, G., and Mendez, E. (2013). Toward decentralized analysis of mer-cury (II) in real samples. A critical review on nanotechnology-based method-ologies. Anal. Chim. Acta 800, 1–11. doi:10.1016/j.aca.2013.07.067
Chandrasekhar, S., Chopra, D., Gopalaiah, K., and Guru Row, T. N. (2007). The gen-eralized anomeric effect in the 1,3-thiazolidines: evidence for both sulphur andnitrogen as electron donors. Crystal structures of various N-acylthiazolidinesincluding mercury(II) complexes. Possible relevance to penicillin action. J. Mol.Struct. 837, 118–131. doi:10.1016/j.molstruc.2006.10.034
Chang, C. F., Truong, Q. D., and Chen, J. R. (2013). Graphene sheets synthesized byionic-liquid-assisted electrolysis for application in water purification. Appl. Surf.Sci. 264, 329–334. doi:10.1016/j.apsusc.2012.10.022
Childres, I., Jauregui, L. A., Park, W., Cao, H., and Chen, Y. (2013). “Raman spec-troscopy of graphene and related materials,” in Developments in Photon andMaterials Research, ed. J. I. Jang (New York: Nova Science Publishers).
Chiu, M.-H., Zen, J.-M., Kumar, A. S., Vasu, D., and Shih, Y. (2008). Selective cos-metic mercury analysis using a silver ink screen-printed electrode with potassiumiodide solution. Electroanalysis 20, 2265–2270. doi:10.1002/elan.200804307
Choi, E.-Y., Han, T. H., Hong, J., Kim, J. E., Lee, S. H., Kim, H. W., et al. (2010). Non-covalent functionalization of graphene with end-functional polymers. J. Mater.Chem. 20, 1907–1912. doi:10.1039/b919074k
Chow, E., and Gooding, J. J. (2006). Peptide modified electrodes as electrochemicalmetal ion sensors. Electroanalysis 18, 1437–1448. doi:10.1002/elan.200603558
EPA. (1996). Mercury in Aqueous Samples and Extracts by Anodic Stripping Voltam-metry (ASV) (Method 7472). Boston: EPA. Available from: http://www.epa.gov/osw/hazard/testmethods/sw846/pdfs/7472.pdf
EPA. (2007a). Determination of Mercury in Water by Cold Vapor AtomicAbsorption Spectrometry (Method 245.1). Cincinnati, OH: U.S. EPA. Avail-able at: http://water.epa.gov/scitech/methods/cwa/bioindicators/upload/2007_07_10_methods_method_245_1.pdf
EPA. (2007b). Determination of Trace Elements In Waters And Wastes by Induc-tively Coupled Plasma – Mass Spectrometry (Method 200.8). Cicinnati, OH:US EPA. Available at: http://water.epa.gov/scitech/methods/cwa/bioindicators/upload/2007_07_10_methods_method_200_8.pdf
Fang, M., Wang, K., Lu, H., Yang, Y., and Nutt, S. (2009). Covalent polymer func-tionalization of graphene nanosheets and mechanical properties of composites.J. Mater. Chem. 19, 7098–7105. doi:10.1039/b908220d
Fifield, F. W., and Kealey, D. (2000). Principles and Practice of Analytical Chemistry.Oxford: Blackwell Science Ltd.
Frontiers in Materials | Carbon-Based Materials December 2014 | Volume 1 | Article 33 | 8
Yasri et al. Mercury detection on graphene/PEDOT:PPS-modified electrode
Gee, C. M., Tseng, C. C., Wu, F. Y., Chang, H. P., Li, L. J., Hsieh, Y. P., et al. (2013).Flexible transparent electrodes made of electrochemically exfoliated graphenesheets from low-cost graphite pieces. Displays 34, 315–319. doi:10.1016/j.displa.2012.11.002
Giannetto, M., Mori, G., Terzi, F., Zanardi, C., and Seeber, R. (2011). Compos-ite PEDOT/Au nanoparticles modified electrodes for determination of mercuryat trace levels by anodic stripping voltammetry. Electroanalysis 23, 456–462.doi:10.1002/elan.201000469
Gustafsson-Carlberg, J. C., Inganäs, O., Andersson, M. R., Booth, C., Azens, A.,and Granqvist, C. G. (1995). Tuning the bandgap for polymeric smart win-dows and displays. Electrochim. Acta 40, 2233–2235. doi:10.1016/0013-4686(95)00169-F
Hill, E. W., Vijayaragahvan, A., and Novoselov, K. (2011). Graphene sensors. Sens.J. IEEE 11, 3161–3170. doi:10.1109/JSEN.2011.2167608
Istamboulie, G., Sikora, T., Jubete, E., Ochoteco, E., Marty, J.-L., and Noguer,T. (2010). Screen-printed poly(3,4-ethylenedioxythiophene) (PEDOT): a newelectrochemical mediator for acetylcholinesterase-based biosensors. Talanta 82,957–961. doi:10.1016/j.talanta.2010.05.070
Jayasena, B., and Subbiah, S. (2011). A novel mechanical cleavage method for synthe-sizing few-layer graphenes. Nanoscale Res. Lett. 6, 95. doi:10.1186/1556-276X-6-95
Kadarkaraisamy, M., Thammavongkeo, S., Basa, P. N., Caple, G., and Sykes, A. G.(2011). Substitution of thiophene oligomers with macrocyclic end caps andthe colorimetric detection of Hg(II). Org. Lett. 13, 2364–2367. doi:10.1021/ol200442k
Krauss, B., Lohmann, T., Chae, D. H., Haluska, M., Von Klitzing, K., and Smet, J. H.(2009). Laser-induced disassembly of a graphene single crystal into a nanocrys-talline network. Phys. Rev. B 79, 165428. doi:10.1103/Physrevb.79.165428
Kumar, S. A., Cheng, H.-W., Chen, S.-M., and Wang, S.-F. (2010). Preparationand characterization of copper nanoparticles/zinc oxide composite modifiedelectrode and its application to glucose sensing. Mater. Sci. Eng. C 30, 86–91.doi:10.1016/j.msec.2009.09.001
Lee, K. H., Lee, B., Hwang, S.-J., Lee, J.-U., Cheong, H., Kwon, O.-S., et al.(2014). Large scale production of highly conductive reduced graphene oxidesheets by a solvent-free low temperature reduction. Carbon N. Y. 69, 327–335.doi:10.1016/j.carbon.2013.12.031
Li, D., Muller, M. B., Gilje, S., Kaner, R. B., and Wallace, G. G. (2008). Process-able aqueous dispersions of graphene nanosheets. Nat. Nanotechnol. 3, 101–105.doi:10.1038/nnano.2007.451
Li, Y.-F., Chen, S.-M., Lai, W.-H., Sheng, Y.-J., and Tsao, H.-K. (2013).Superhydrophilic graphite surfaces and water-dispersible graphite colloids byelectrochemical exfoliation. J. Chem. Phys. 139, 64703–64714. doi:10.1063/1.4817680
Liu, D., Qu,W., Chen,W., Zhang,W.,Wang, Z., and Jiang, X. (2010). Highly sensitive,colorimetric detection of mercury(II) in aqueous media by quaternary ammo-nium group-capped gold nanoparticles at room temperature. Anal. Chem. 82,9606–9610. doi:10.1021/ac1021503
Low, C. T. J., Walsh, F. C., Chakrabarti, M. H., Hashim, M. A., and Hussain, M. A.(2013). Electrochemical approaches to the production of graphene flakes andtheir potential applications. Carbon N. Y. 54, 1–21. doi:10.1016/j.carbon.2012.11.030
Mandal, S., Banerjee, A., Lohar, S., Chattopadhyay, A., Sarkar, B., Mukhopadhyay, S.K., et al. (2013). Selective sensing of Hg2+ using rhodamine–thiophene conju-gate: red light emission and visual detection of intracellular Hg2+ at nanomolarlevel. J. Hazard. Mater. 261, 198–205. doi:10.1016/j.jhazmat.2013.07.026
Mao, M., Wang, M., Hu, J., Lei, G., Chen, S., and Liu, H. (2013). Simultaneous elec-trochemical synthesis of few-layer graphene flakes on both electrodes in proticionic liquids. Chem. Commun. (Camb) 49, 5301–5303. doi:10.1039/c3cc41909f
Martin-Yerga, D., Gonzalez-Garcia, M. B., and Costa-Garcia, A. (2013). Elec-trochemical determination of mercury: a review. Talanta 116, 1091–1104.doi:10.1016/j.talanta.2013.07.056
Mikolaj, D., and Zbigniew, S. (2012). “Nanoparticles and Nanostructured MaterialsUsed in Modification of Electrode Surfaces,” in Functional Nanoparticles for Bio-analysis, Nanomedicine, and Bioelectronic Devices, Vol. 1. Washington: AmericanChemical Society, 313–325. doi:10.1021/bk-2012-1112.ch012
Morales, G. M., Schifani, P., Ellis, G., Ballesteros, C., Martínez, G., Barbero, C., et al.(2011). High-quality few layer graphene produced by electrochemical intercala-tion and microwave-assisted expansion of graphite. Carbon N. Y. 49, 2809–2816.doi:10.1016/j.carbon.2011.03.008
Najafi, E., Aboufazeli, F., Zhad, H. R., Sadeghi, O., and Amani, V. (2013). A novelmagnetic ion imprinted nano-polymer for selective separation and determina-tion of low levels of mercury(II) ions in fish samples. Food Chem. 141, 4040–4045.doi:10.1016/j.foodchem.2013.06.118
Orlik, M., and Galus, Z. (2007). “Electrochemistry of mercury,” in Encyclopedia ofElectrochemistry, Vol. 7 (New York: Wiley-VCH Verlag GmbH & Co. KGaA),958–991. doi:10.1002/9783527610426.bard072406
Park, S., An, J., Potts, J. R., Velamakanni, A., Murali, S., and Ruoff, R. S.(2011). Hydrazine-reduction of graphite- and graphene oxide. Carbon N. Y. 49,3019–3023. doi:10.1016/j.carbon.2011.02.071
Pesavento, M., Alberti, G., and Biesuz, R. (2009). Analytical methods for deter-mination of free metal ion concentration, labile species fraction and metalcomplexation capacity of environmental waters: a review. Anal. Chim. Acta 631,129–141. doi:10.1016/j.aca.2008.10.046
Pettersson, L. A. A., Johansson, T., Carlsson, F., Arwin, H., and Inganäs, O. (1999).Anisotropic optical properties of doped poly(3,4-ethylenedioxythiophene).Synth. Met. 101, 198–199. doi:10.1016/S0379-6779(98)01215-6
Pham, V. H., Cuong, T. V., Hur, S. H., Oh, E., Kim, E. J., Shin, E. W., et al. (2011).Chemical functionalization of graphene sheets by solvothermal reduction ofa graphene oxide suspension in N-methyl-2-pyrrolidone. J. Mater. Chem. 21,3371–3377. doi:10.1039/c0jm02790a
Pillay, K., Cukrowska, E. M., and Coville, N. J. (2013). Improved uptake of mer-cury by sulphur-containing carbon nanotubes. Microchem. J. 108, 124–130.doi:10.1016/j.microc.2012.10.014
Qi, B., He, L., Bo, X. J.,Yang, H. J., and Guo, L. P. (2011). Electrochemical preparationof free-standing few-layer graphene through oxidation-reduction cycling. Chem.Eng. J. 171, 340–344. doi:10.1016/j.cej.2011.03.078
Rattan, S., Singhal, P., and Verma, A. L. (2013). Synthesis of PEDOT:PSS (poly(3,4-ethylenedioxythiophene))/poly(4-styrene sulfonate))/ngps (nanographiticplatelets) nanocomposites as chemiresistive sensors for detection of nitroaro-matics. Polym. Eng. Sci. 53, 2045–2052. doi:10.1002/pen.23466
Seco-Reigosa, N., Cutillas-Barreiro, L., Nóvoa-Muñoz, J. C., Arias-Estévez, M.,Fernández-Sanjurjo, M., Álvarez-Rodríguez, E., et al. (2014). Mixtures includingwastes from the mussel shell processing industry: retention of arsenic, chromiumand mercury. J. Clean. Prod. 84, 680–690. doi:10.1016/j.jclepro.2014.01.050
Shao, Y., Wang, J., Wu, H., Liu, J., Aksay, I. A., and Lin, Y. (2010). Graphene basedelectrochemical sensors and biosensors: a review. Electroanalysis 22, 1027–1036.doi:10.1002/elan.200900571
Shrivastava, A., and Gupta, V. (2011). Methods for the determination of limit ofdetection and limit of quantitation of the analytical methods. Chron. Young Sci.2, 21–25. doi:10.4103/2229-5186.79345
Singh, V. V., Gupta, G., Batra, A., Nigam, A. K., Boopathi, M., Gutch, P. K., et al.(2012). Greener electrochemical synthesis of high quality graphene nanosheetsdirectly from pencil and its spr sensing application. Adv. Funct. Mater. 22,2352–2362. doi:10.1002/adfm.201102525
Somerset, V., Leaner, J., Mason, R., Iwuoha, E., and Morrin, A. (2010). Develop-ment and application of a poly(2,2’-dithiodianiline) (PDTDA)-coated screen-printed carbon electrode in inorganic mercury determination. Electrochim. Acta55, 4240–4246. doi:10.1016/j.electacta.2009.01.029
Su, C. Y., Lu, A. Y., Xu, Y., Chen, F. R., Khlobystov, A. N., and Li, L. J. (2011). High-quality thin graphene films from fast electrochemical exfoliation. ACS Nano 5,2332–2339. doi:10.1021/nn200025p
Sundramoorthy, A. K., and Gunasekaran, S. (2014). Applications of graphene inquality assurance and safety of food. Trends Anal Chem 60, 36–53. doi:10.1016/j.trac.2014.04.015
Tarabella, G., Nanda, G., Villani, M., Coppede, N., Mosca, R., Malliaras, G. G., et al.(2012). Organic electrochemical transistors monitoring micelle formation. ChemSci 3, 3432–3435. doi:10.1039/c2sc21020g
Vacca, P., Petrosino, M., Miscioscia, R., Nenna, G., Minarini, C., Della Sala, D., et al.(2008). Poly(3,4-ethylenedioxythiophene):poly(4-styrenesulfonate) ratio: struc-tural, physical and hole injection properties in organic light emitting diodes. ThinSolid Films 516, 4232–4237. doi:10.1016/j.tsf.2007.12.143
Wang, J. Z., Manga, K. K., Bao, Q. L., and Loh, K. P. (2011). High-yield synthesisof few-layer graphene flakes through electrochemical expansion of graphite inpropylene carbonate electrolyte. J. Am. Chem. Soc. 133, 8888–8891. doi:10.1021/ja203725d
Wang, L., Fang, G., Ye, D., and Cao, D. (2014a). Carbazole and triazole-containingconjugated polymer as a visual and fluorometric probe for iodide and mercury.Sens Actuators B Chem 195, 572–580. doi:10.1016/j.snb.2014.01.081
www.frontiersin.org December 2014 | Volume 1 | Article 33 | 9
Yasri et al. Mercury detection on graphene/PEDOT:PPS-modified electrode
Wang, Z., Xu, J., Yao, Y., Zhang, L., Wen, Y., Song, H., et al. (2014b). Facile prepara-tion of highly water-stable and flexible PEDOT:PSS organic/inorganic compositematerials and their application in electrochemical sensors. Sens Actuators B Chem196, 357–369. doi:10.1016/j.snb.2014.02.035
Wang, Z.-L., Xu, D., Huang, Y., Wu, Z., Wang, L.-M., and Zhang, X.-B. (2012).Facile, mild and fast thermal-decomposition reduction of graphene oxide in airand its application in high-performance lithium batteries. Chem. Commun. 48,976–978. doi:10.1039/c2cc16239c
Welch, C. M., Nekrassova, O., Dai, X., Hyde, M. E., and Compton, R. G. (2004). Fabri-cation, characterisation and voltammetric studies of gold amalgam nanoparticlemodified electrodes. Chemphyschem 5, 1405–1410. doi:10.1002/cphc.200400263
Yan, K., Peng, H., Zhou, Y., Li, H., and Liu, Z. (2011). Formation of bilayer Bernalgraphene: layer-by-layer epitaxy via chemical vapor deposition. Nano Lett. 11,1106–1110. doi:10.1021/nl104000b
Yang, J., and Gunasekaran, S. (2013). Electrochemically reduced graphene oxidesheets for use in high performance supercapacitors. Carbon N. Y. 51, 36–44.doi:10.1016/j.carbon.2012.08.003
Yang, J., Yu, J.-H., Rudi Strickler, J., Chang, W.-J., and Gunasekaran, S. (2013). Nickelnanoparticle–chitosan-reduced graphene oxide-modified screen-printed elec-trodes for enzyme-free glucose sensing in portable microfluidic devices. BiosensBioelectron 47, 530–538. doi:10.1016/j.bios.2013.03.051
Yasri, N. G., Halabi, A. J., Istamboulie, G., and Noguer, T. (2011). Chronoampero-metric determination of lead ions using PEDOT:PSS modified carbon electrodes.Talanta 85, 2528–2533. doi:10.1016/j.talanta.2011.08.013
Yoo, D., Kim, J., and Kim, J. (2014). Direct synthesis of highly conductive poly(3,4-ethylenedioxythiophene):poly(4-styrenesulfonate) (PEDOT:PSS)/graphenecomposites and their applications in energy harvesting systems. Nano Res. 7,717–730. doi:10.1007/s12274-014-0433-z
Zhang, L., Li, X., Huang, Y., Ma, Y., Wan, X., and Chen, Y. (2010). Controlled syn-thesis of few-layered graphene sheets on a large scale using chemical exfoliation.Carbon N. Y. 48, 2367–2371. doi:10.1016/j.carbon.2010.02.035
Zhang, W. Y., Zeng, Y., Xiao, N., Hng, H. H., and Yan, Q. Y. (2012). One-step electro-chemical preparation of graphene-based heterostructures for Li storage. J. Mater.Chem. 22, 8455–8461. doi:10.1039/c2jm16315b
Zhong, Y. L., and Swager, T. M. (2012). Enhanced electrochemical expansion ofgraphite for in situ electrochemical functionalization. J. Am. Chem. Soc. 134,17896–17899. doi:10.1021/ja309023f
Conflict of Interest Statement: The authors declare that the research was conductedin the absence of any commercial or financial relationships that could be construedas a potential conflict of interest.
Received: 27 September 2014; accepted: 03 December 2014; published online: 22December 2014.Citation: Yasri NG, Sundramoorthy AK, Chang W-J and Gunasekaran S(2014) Highly selective mercury detection at partially oxidized graphene/poly(3,4-ethylenedioxythiophene):poly(styrenesulfonate) nanocomposite film-modified elec-trode. Front. Mater. 1:33. doi:10.3389/ fmats.2014.00033This article was submitted to Carbon-Based Materials, a section of the journal Frontiersin Materials.Copyright © 2014 Yasri, Sundramoorthy, Chang and Gunasekaran. This is an open-access article distributed under the terms of the Creative Commons Attribution License(CC BY). The use, distribution or reproduction in other forums is permitted, providedthe original author(s) or licensor are credited and that the original publication in thisjournal is cited, in accordance with accepted academic practice. No use, distribution orreproduction is permitted which does not comply with these terms.
Frontiers in Materials | Carbon-Based Materials December 2014 | Volume 1 | Article 33 | 10