highly successful performance tuning of an informix database
TRANSCRIPT

Notices and Disclaimers Copyright © 2015 by International Business Machines Corporation (IBM). No part of this document may be reproduced or transmitted in any form without written permission from IBM.
U.S. Government Users Restricted Rights - Use, duplication or disclosure restricted by GSA ADP Schedule Contract with IBM.
Information in these presentations (including information relating to products that have not yet been announced by IBM) has been reviewed for accuracy as of the date of initial publication and could include unintentional technical or typographical errors. IBM shall have no responsibility to update this information. THIS DOCUMENT IS DISTRIBUTED "AS IS" WITHOUT ANY WARRANTY, EITHER EXPRESS OR IMPLIED. IN NO EVENT SHALL IBM BE LIABLE FOR ANY DAMAGE ARISING FROM THE USE OF THIS INFORMATION, INCLUDING BUT NOT LIMITED TO, LOSS OF DATA, BUSINESS INTERRUPTION, LOSS OF PROFIT OR LOSS OF OPPORTUNITY. IBM products and services are warranted according to the terms and conditions of the agreements under which they are provided.
Any statements regarding IBM's future direction, intent or product plans are subject to change or withdrawal without notice.
Performance data contained herein was generally obtained in a controlled, isolated environments. Customer examples are presented as illustrations of how those customers have used IBM products and the results they may have achieved. Actual performance, cost, savings or other results in other operating environments may vary.
References in this document to IBM products, programs, or services does not imply that IBM intends to make such products, programs or services available in all countries in which IBM operates or does business.
Workshops, sessions and associated materials may have been prepared by independent session speakers, and do not necessarily reflect the views of IBM. All materials and discussions are provided for informational purposes only, and are neither intended to, nor shall constitute legal or other guidance or advice to any individual participant or their specific situation.
It is the customer’s responsibility to insure its own compliance with legal requirements and to obtain advice of competent legal counsel as to the identification and interpretation of any relevant laws and regulatory requirements that may affect the customer’s business and any actions the customer may need to take to comply with such laws. IBM does not provide legal advice or represent or warrant that its services or products will ensure that the customer is in compliance with any law.

Notices and Disclaimers (con’t)
Information concerning non-IBM products was obtained from the suppliers of those products, their published announcements or other publicly available sources. IBM has not tested those products in connection with this publication and cannot confirm the accuracy of performance, compatibility or any other claims related to non-IBM products. Questions on the capabilities of non-IBM products should be addressed to the suppliers of those products. IBM does not warrant the quality of any third-party products, or the ability of any such third-party products to interoperate with IBM’s products. IBM EXPRESSLY DISCLAIMS ALL WARRANTIES, EXPRESSED OR IMPLIED, INCLUDING BUT NOT LIMITED TO, THE IMPLIED WARRANTIES OF MERCHANTABILITY AND FITNESS FOR A PARTICULAR PURPOSE.
The provision of the information contained herein is not intended to, and does not, grant any right or license under any IBM patents, copyrights, trademarks or other intellectual property right.
• IBM, the IBM logo, ibm.com, Aspera®, Bluemix, Blueworks Live, CICS, Clearcase, Cognos®, DOORS®, Emptoris®, Enterprise Document Management System™, FASP®, FileNet®, Global Business Services ®, Global Technology Services ®, IBM ExperienceOne™, IBM SmartCloud®, IBM Social Business®, Information on Demand, ILOG, Maximo®, MQIntegrator®, MQSeries®, Netcool®, OMEGAMON, OpenPower, PureAnalytics™, PureApplication®, pureCluster™, PureCoverage®, PureData®, PureExperience®, PureFlex®, pureQuery®, pureScale®, PureSystems®, QRadar®, Rational®, Rhapsody®, Smarter Commerce®, SoDA, SPSS, Sterling Commerce®, StoredIQ, Tealeaf®, Tivoli®, Trusteer®, Unica®, urban{code}®, Watson, WebSphere®, Worklight®, X-Force® and System z® Z/OS, are trademarks of International Business Machines Corporation, registered in many jurisdictions worldwide. Other product and service names might be trademarks of IBM or other companies. A current list of IBM trademarks is available on the Web at "Copyright and trademark information" at: www.ibm.com/legal/copytrade.shtml.

Agenda
• The Performance Team approach • Tools for identifying performance issues
3

The Mountains • Jan 2014, CPU utilization was pegged on QA
§ Preventing movement of new system version to production
• CPU utilization on Prod was around 60 - 70%
Mon Tue Wed Thu Fri
4

ITS Database Performance Team
• Team of DBAs and Developers with singular focus to identify and fix performance issues
• 100 separate issues identified in over 18 months
• ~50% reduction in CPU utilization during primary work hours
• ~50% reduction in total database reads
5

Quantitative Analysis Approach
• Find meaningful metrics § Server CPU utilization § Bufreads § SQL Response time
• Ganglia – CPU utilization of server • SMI – System Monitoring Information tables
§ Number of reads per table (bufreads) § Capturing and storing every 30 minutes
• iWatch – 100% capture of SQL § Sits outside of db server, so no impact on performance § SYSSQLTRACE flushed too quickly to be of much use (for us) § Captures parameter marker values for each statement
6

Performance Team Cycle
SMI Metrics and iWatch
User Requested
• Select items to address • Team consensus for tuning
approach • Assignment to individuals to
work on • Review proposed solutions • Capture supporting
documentation and before/after benchmarks
Performance Team (30 minute weekly meeting)
Performance Tuning Log
Deploy to QA and Production
7

60-70% CPU Utilization by database during primary
work hours
30% CPU Utilization by database during primary
work hours
Week of 2/3/14
Week of 8/10/15
Production Server CPU Utilization Mon Tue Wed Thu Fri
• Blue: CPU used by the database • Red: CPU used by Operating System
Before
After
Mon Tue Wed Thu Fri
8
60%
30%

Total Reads Over Time
0.00
1.00
2.00
3.00
4.00
5.00
6.00
7.00
8.00
9.00
10.00
1/31/2014 2/28/2014 3/31/2014 4/30/2014 5/31/2014 6/30/2014 7/31/2014 8/31/2014
Total Bufreads (billions) per Day
9

Breakdown of Problems Solved
Reason Number Indexing 14 SQL 15 DB Configuration 3 Application Design 8
10
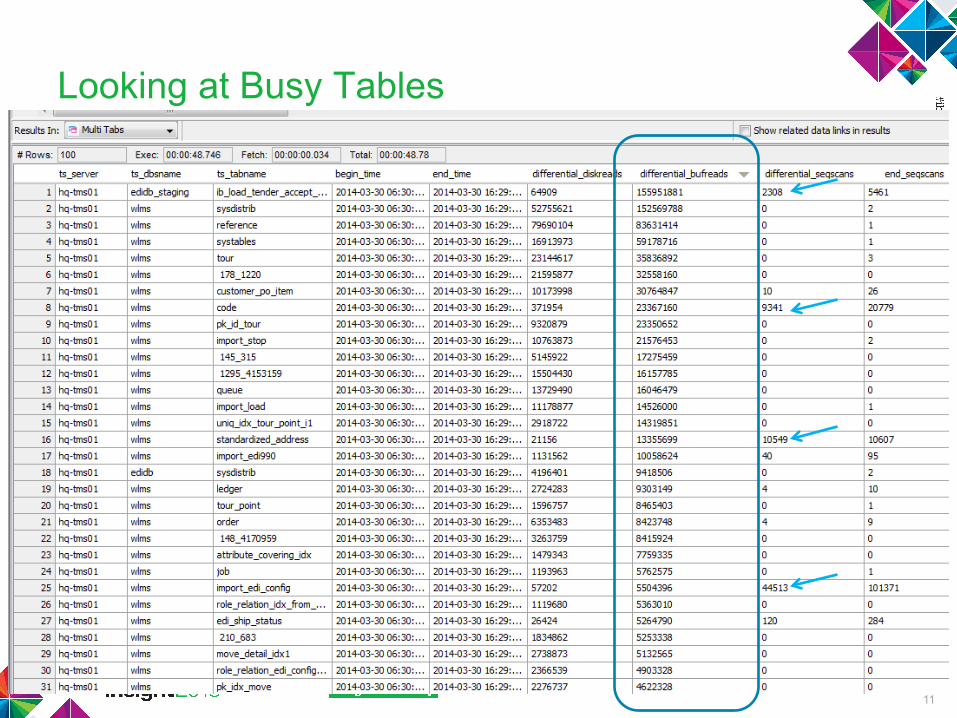
Looking at Busy Tables
11

Tracking Down Problems With Ganglia
12

Show me all SQL between 12:45 and 12:55 with > 1 sec Response Time Sort by Response Time desc
Using iWatch To Find SQL
13

The Full SQL SELECT DISTINCT t.id AS tour_id FROM wlms:move m, wlms:move_detail md, wlms:tour t, wlms:v_order_to_job_ids v, wlms:attribute loadtype_attr WHERE m.move_id = md.move_id AND md.tour_id = t.id AND t.id = v.t_id AND t.control_role_id = ? AND loadtype_attr.from_class_id = 32 AND loadtype_attr.from_id = t.id AND EXISTS( SELECT 1 FROM wlms:reference WHERE from_class_id=32 AND from_id=t.id AND status_cid = 1249 AND type_cid=1251 AND reference_num = ?)) AND NOT EXISTS( SELECT DISTINCT md2.move_detail_id FROM wlms:move_detail md2, wlms:v_order_to_job_ids v2, wlms:attribute loadtype_attr2 WHERE md2.active = 1 AND md2.move_id = m.move_id AND md2.seq_num > md.seq_num AND v2.t_id = md2.tour_id AND loadtype_attr2.from_class_id = 32 AND loadtype_attr2.from_id = v2.t_id AND loadtype_attr2.value_cid IN(6315, 2014) AND t.create_date >= today-? UNITS DAY)
14

Are Sequential Scans an I/O problem or a CPU problem?
• In our case, a CPU problem • When sequential scanning, every row needs to be compared
against the query predicates • Most DBMS invoke “prefetching” to read ahead to bring pages
into memory before they are needed • Buffer pools are polluted with unnecessary pages • Using an index significantly reduces the rows being read and
needing to be compared
15

SQL for Performance (Application Design)
• The best SQL is no SQL • Don’t do more than you need to do
§ “Work smart, not hard”
• Only retrieve the columns that you need § Reduces IO for sorts and network traffic back to application § Provides opportunity for “index-only” SQL
• Verify that the predicates that are important for your SQL are supported by indexes § Work with your DBA
• Run on RO (HDR Read-Only) or RSS (Remote Standalone Secondary) if you can
16

Large Volume Processing (Application Design)
Well-designed batch process
Running an online transaction many,
many times
≠
Which mode of transportation is the most efficient to haul 10,000 lbs?
17

SQL for Performance (SQL Design)
• Work with DBA to ensure that filtering columns are indexed • Avoid functions on columns used in predicates
§ Instead of: where date(record_update_ts) = ‘2014-03-03’ § Use: where record_update_ts between ‘2014-03-03-00:00:00.000’ and ‘2014-3-03-11:59:59.000’
§ Or create a function based index • Avoid the “OR” predicate if you can
§ Can often rewrite with a “UNION” • Avoid joining to complex Views
§ Difficult for Optimizer to push local predicates up into view § Views often do more than is needed § Tradeoff with ease of development and maintenance § Consider replacing complex views with stored procedures or functions
• For OLTP use parameter markers for values that change, for OLAP use literals
• Push functions to as late as possible in query
18

Reducing Function Calls in SQL select distinct t.id as tour_id,
get_code_desc(t.type_cid) as type_cid_description, get_role_info('name', '', t.bill_to_role_id) as bill_to_role_name
from tour t inner join tour_point tp on t.id = tp.tour_id inner join activity a on tp.id = a.tour_point_id
where a.create_date > '2014-01-01 00:00:00.001' select subq.id as tour_id,
get_code_desc(subq.type_cid) as type_cid_description, get_role_info('name', '', subq.bill_to_role_id) as bill_to_role_name
from ( select distinct t.id, t.type_cid, t.bill_to_role_id from tour t inner join tour_point tp on t.id = tp.tour_id inner join activity a on tp.id = a.tour_point_id where a.create_date > '2014-01-01 00:00:00.001' ) subq
• The DISTINCT gets rid of 1,393,945 duplicate records in the result set. • By rewriting this you eliminate 2,787,890 function calls. • The query goes from 8:45 minutes to 1:57 minutes to run.
Before
After
19

Agenda
• The Performance Team approach • Tools for identifying performance issues
20

Helpful Metrics
• Sysmaster:sysptprof § Real time values for bufreads, pagreads, seqscans, etc for all
tables and indexes
• Syssqltrace, syssessions, syssesprof § Recently executed SQL statements and associated session info
• iWatch § Vendor tool that captures all executed SQL statements and
parameter markers § Zero impact on db performance, span port sits outside db server
and sends a copy of ip traffic to iWatch server
• Ganglia § Open source monitor that captures CPU, I/O, Memory, Network
traffic
21

Historical Capture of sysptprof
• Every 30 minutes § Insert into server_stats:tab_stats
select current year to fraction, a.* from sysptprof a
§ Exclude unnecessary system tables and databases § Add a “group by” if you have fragmented tables § Keep two week history
• We reset sysptprof every day at 5 pm with “onstat –z” • Bufreads
§ “logical” or “memory” reads. § Incremented every time db engine requests the read of a page from the buffers
• Pagreads § “physical” or “disk” reads. § Incremented every time page is not found in buffer and read has to go to disk
• Seqscans § Full scan of table
22

Today’s top Tables/Indexes in sysptprof by bufreads select first 50
dbsname, a.tabname table_or_index_name, c.tabname tabname_if_index,
bufreads, pagreads, seqscans, bufwrites, pagwrites
from sysmaster:sysptprof a left join wlms:informix.sysindexes b on a.tabname = b.idxname left join wlms:informix.systables c on b.tabid = c.tabid order by bufreads desc;
The key for this query is that we reset stats with “onstat –z” each day at 5 pm so you are always looking at what has happened
since that time.
23

Today’s top Tables/Indexes in sysptprof by bufreads
24

Pct of reads by Table/Index SELECT first 100 CURRENT timestamp, dbsname, a.tabname, d.tabname tabname_if_index, bufreads, cast(bufreads *100/tot_bufreads AS DECIMAL(5, 2)) pct_of_bufreads, a.pagreads, cast(a.pagreads *100/tot_pagreads AS DECIMAL(5, 2)) pct_of_pagreads, seqscans, tot_pagreads, tot_bufreads FROM sysptprof a INNER JOIN( SELECT sum(pagreads) tot_pagreads, sum(bufreads) tot_bufreads FROM sysptprof) b ON 1=1 LEFT JOIN wlms:informix.sysindexes c ON a.tabname = c.idxname LEFT JOIN wlms:informix.systables d ON c.tabid = d.tabid ORDER BY pct_of_bufreads DESC
25

Pct of Reads by Table/Index
26

Top SQL in syssqltrace by bufreads select first 100 sql_sid, b.username, b.hostname,
c.bufreads session_bufreads, sql_tablelist, sql_bfreads, sql_pgreads, sql_executions,sql_runtime, sql_totaltime,sql_avgtime,sql_begintxtime, sql_finishtime, sql_actualrows, sql_statement
from syssqltrace a, syssessions b, syssesprof c where a.sql_sid = b.sid and b.sid = c.sid --and lower(sql_tablelist) like '%ledger%' order by sql_bfreads desc
Additional filtering on sql_tablelist
27

Top SQL in syssqltrace by bufreads SQL Statement text is way over to the right
SQL Bufreads
Session Bufreads
28

Top SQL in syssqltrace by bufreads with HVARS
Set sqltrace level to “high” to capture host variables SELECT first 100 sql_sid, b.username, b.hostname, c.bufreads session_bufreads, sql_tablelist, sql_bfreads, sql_pgreads, sql_executions, sql_actualrows, d.sql_hvar_id, d.sql_hvar_data, sql_statement FROM syssqltrace a, syssessions b, syssesprof c, syssqltrace_hvar d WHERE a.sql_sid = b.sid AND b.sid = c.sid AND a.sql_address = d.sql_address --and lower(sql_tablelist) like '%resource%' ORDER BY sql_bfreads DESC, d.sql_address, d.sql_hvar_id
29

Top SQL in syssqltrace by bufreads with HVARS
Host Variable data
30

select first 100 c.ts_server, c.ts_dbsname, c.ts_tabname, c.ts_date_time begin_time, d.ts_date_time end_time, d.ts_bufreads - c.ts_bufreads differential_bufreads, ((d.ts_pagreads)- ( c.ts_pagreads)) differential_pagreads , (d.ts_seqscans - c.ts_seqscans) differential_seqscans, c.ts_bufreads begin_bufreads, d.ts_bufreads end_bufreads, ( c.ts_pagreads) begin_pagreads, (d.ts_pagreads) end_pagreads , c.ts_seqscans begin_seqscans, d.ts_seqscans end_seqscans from (select ts_server, ts_date_time,ts_dbsname, ts_tabname, ts_bufreads, ts_isreads, ts_pagreads, ts_seqscans from server_stats:tab_stats a where ts_date_time = (select min(ts_date_time) from server_stats:tab_stats b where a.ts_server = b.ts_server and a.ts_dbsname = b.ts_dbsname and b.ts_date_time >= '2015-08-03 06:20:00') and a.ts_server = 'hq-tms02') c inner join (select ts_server, ts_date_time,ts_dbsname, ts_tabname,ts_bufreads, ts_isreads, ts_pagreads, ts_seqscans from server_stats:tab_stats a where ts_date_time = (select max(ts_date_time) from server_stats:tab_stats b where a.ts_server = b.ts_server and a.ts_dbsname = b.ts_dbsname and b.ts_date_time <= '2015-08-03 16:10:00') and a.ts_server = 'hq-tms02') d on c.ts_server = d.ts_server and c.ts_dbsname = d.ts_dbsname and c.ts_tabname = d.ts_tabname order by differential_bufreads desc
Calculate Diff
Get metrics at beginning of time period
Get metrics at end of time period
Top tables/indexes by bufreads for a long time interval (> 30 minutes)
31

Top tables/indexes by bufreads for a long time
interval (> 30 minutes)
32

Top tables/indexes by bufreads for a short time interval (< 30 minutes) page 1of 2
SELECT first 1000 current year to second start_time, a.dbsname, a.tabname, b.tabname tabname_if_index, bufreads, pagreads, seqscans FROM sysmaster:sysptprof a LEFT JOIN sysindexes c ON a.tabname = c.idxname LEFT JOIN systables b ON b.tabid = c.tabid ORDER BY bufreads DESC INTO TEMP startreads; -- wait for some time interval before running the rest of the SQL
Get metrics at beginning of time period
33

-- wait for some time interval before running the rest of the SQL SELECT first 1000 current year to second finish_time, a.dbsname, a.tabname, b.tabname tabname_if_index, bufreads, pagreads, seqscans FROM sysmaster:sysptprof a LEFT JOIN sysindexes c ON a.tabname = c.idxname LEFT JOIN systables b ON b.tabid = c.tabid ORDER BY bufreads DESC INTO TEMP finishreads; SELECT s.start_time, f.finish_time, f.dbsname, f.tabname, f.tabname_if_index, f.bufreads - s.bufreads delta_bufreads, f.pagreads - s.pagreads delta_pagreads, f.seqscans - s.seqscans delta_seqscans FROM startreads s JOIN finishreads f ON s.tabname = f.tabname AND s.dbsname = f.dbsname WHERE f.bufreads - s.bufreads > 0 ORDER BY delta_bufreads DESC;
Get metrics at end of time period
Calculate delta
34
Top tables/indexes by bufreads for a short time interval (< 30 minutes) page 2of 2

35
Top tables/indexes by bufreads for a short time interval (< 30 minutes)

Bufreads for a table over time select ts_server,
ts_date_time, ts_dbsname, ts_tabname, ts_bufreads, ts_pagreads, ts_seqscans
from server_stats:tab_stats a where ts_tabname = 'ledger' and ts_server = 'hq-tms01' order by ts_date_time desc
36

Bufreads for a table over time
Onstat -z
37

Query Tuning Tool • Tool to measure bufreads/pagreads/seqscans for each table/index that occur
during the execution of a query • Limits measurement to just the tables/indexes used by your query • Not perfect, as tables might be accessed by other queries during your test • SYSSQLTRACE just gives total bufreads
Get “start” table/index stats
Run Query
Get “finish” table/index stats
Calculate difference between start and finish
38

Query Tuning Tool – page1 of 3 -- temp tables: tabnames, dbname, startreads, finishreads -- build temp table with table info -- You will need to update the table list as needed to reflect -- which tables are in your query. select tabname from systables a where tabname in (‘ledger‘,’tour’,’i_tour’) into temp tabnames; -- build temp table with db info -- You will need to update this to reflect which database you are using for your query. select 'wlms' dbname from sysmaster:sysdual a into temp dbname; -- Priming read to sysptprof (seems to give better consistency of stats from sysptprof) select a.tabname, bufreads, pagreads, seqscans from sysmaster:sysptprof a join tabnames b on a.tabname = b.tabname join dbname c on a.dbsname = c.dbname ;
Update items in red
39

Query Tuning Tool – page 2 of 3 -- Query sysmaster:sysptprof to obtain the "start" values for bufreads and pagreads for tables and indexes in your query. select 'table' obj_type, a.tabname, ' ' tabname_if_index, bufreads, pagreads, seqscans from sysmaster:sysptprof a join tabnames b on a.tabname = b.tabname join dbname c on a.dbsname = c.dbname union all select 'index' obj_type ,c.idxname, a.tabname, bufreads, pagreads, seqscans from tabnames a join systables b on a.tabname = b.tabname join sysindexes c on b.tabid = c.tabid join sysmaster:sysptprof d on d.tabname = c.idxname join dbname e on d.dbsname = e.dbname into temp startreads; -- Below is the SQL statement that you are tuning. Replace this statement with the SQL that you are working with. SELECT * from mytable;
This is your query!
Get metrics for tables
Get metrics for indexes
40

Query Tuning Tool – page 3 of 3 -- Query sysmaster:sysptprof to obtain the "finish" values select 'table' obj_type, a.tabname, ' ' tabname_if_index, bufreads, pagreads, seqscans from sysmaster:sysptprof a join tabnames b on a.tabname = b.tabname join dbname c on a.dbsname = c.dbname union all select 'index' obj_type ,c.idxname, a.tabname, bufreads, pagreads, seqscans from tabnames a join systables b on a.tabname = b.tabname join sysindexes c on b.tabid = c.tabid join sysmaster:sysptprof d on d.tabname = c.idxname join dbname e on d.dbsname = e.dbname into temp finishreads; -- Produce "delta" report of non-zero differences between start and finish temp tables select f.obj_type, f.tabname, f.tabname_if_index, f.bufreads - s.bufreads delta_bufreads, f.pagreads - s.pagreads delta_pagreads, f.seqscans - s.seqscans delta_seqscans from startreads s join finishreads f on s.tabname = f.tabname where f.bufreads - s.bufreads > 0 order by f.obj_type desc, tabname_if_index,f.tabname ;
Only show tables/indexes with > 0 bufreads
41

Query Tuning Tool – Results • Remember, if other queries are running at the same time, their
bufreads/pagreads/seqscans will be included in these numbers • Best results on a relatively quiet database • Or, run repeatedly and look for consistent results
42
Why? Bonus Question: Why does pk_id_tour index have 30 reads and the tour table only has 10 reads?

Buffer Reads Trend Monitor
• “Canary in a Gold Mine” • Daily script to look for tables/indexes with > 50% in bufreads
compared to two week rolling average • Utilizes our historical capture of sysptprof • Only looking at tables/indexes with > 50 million daily bufreads • Put this query in a script and run daily, send an email if any
tables/indexes qualify
43

Buffer Reads Trend Monitor SELECT a.ts_server, a.ts_date_time, a.ts_dbsname, a.ts_tabname, a.ts_bufreads, round(b.avg_bufreads,0) avg_breads, round((a.ts_bufreads/b.avg_bufreads)*100 - 100,0) pct_increase FROM tab_stats a INNER JOIN( SELECT ts_server, ts_dbsname, ts_tabname, avg(ts_bufreads) avg_bufreads FROM server_stats:tab_stats b WHERE date(ts_date_time) < today - 2 AND weekday(ts_date_time) IN(1, 2, 3, 4, 5) AND extend(ts_date_time, hour to minute) BETWEEN '16:15' AND '16:45' and ts_server in ( 'hq-tms01' ,'hq-tms02') GROUP BY ts_server, ts_dbsname, ts_tabname)b ON a.ts_server = b.ts_server AND a.ts_dbsname = b.ts_dbsname AND a.ts_tabname = b.ts_tabname WHERE a.ts_server in ( 'hq-tms01' ,'hq-tms02') AND date(ts_date_time) = today - 1 AND extend(ts_date_time, hour to minute) BETWEEN '16:15' and '16:45' AND a.ts_bufreads >(1.5 * b.avg_bufreads) AND a.ts_bufreads > 50000000
Get average bufreads for M-F
44
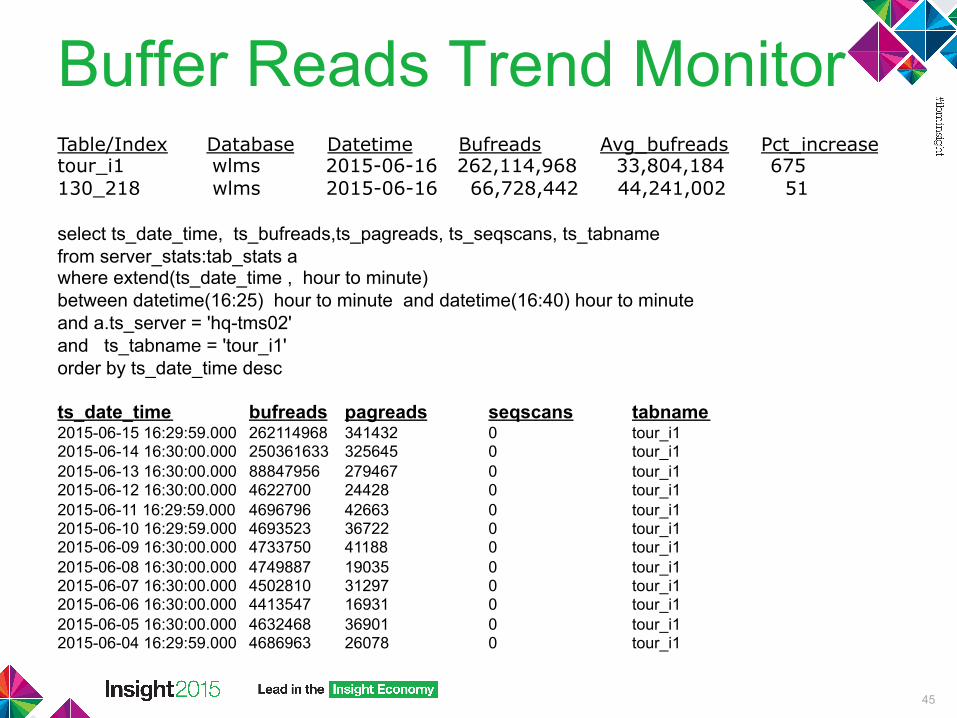
Buffer Reads Trend Monitor Table/Index Database Datetime Bufreads Avg_bufreads Pct_increase tour_i1 wlms 2015-06-16 262,114,968 33,804,184 675 130_218 wlms 2015-06-16 66,728,442 44,241,002 51 select ts_date_time, ts_bufreads,ts_pagreads, ts_seqscans, ts_tabname from server_stats:tab_stats a where extend(ts_date_time , hour to minute) between datetime(16:25) hour to minute and datetime(16:40) hour to minute and a.ts_server = 'hq-tms02' and ts_tabname = 'tour_i1' order by ts_date_time desc ts_date_time bufreads pagreads seqscans tabname 2015-06-15 16:29:59.000 262114968 341432 0 tour_i1 2015-06-14 16:30:00.000 250361633 325645 0 tour_i1 2015-06-13 16:30:00.000 88847956 279467 0 tour_i1 2015-06-12 16:30:00.000 4622700 24428 0 tour_i1 2015-06-11 16:29:59.000 4696796 42663 0 tour_i1 2015-06-10 16:29:59.000 4693523 36722 0 tour_i1 2015-06-09 16:30:00.000 4733750 41188 0 tour_i1 2015-06-08 16:30:00.000 4749887 19035 0 tour_i1 2015-06-07 16:30:00.000 4502810 31297 0 tour_i1 2015-06-06 16:30:00.000 4413547 16931 0 tour_i1 2015-06-05 16:30:00.000 4632468 36901 0 tour_i1 2015-06-04 16:29:59.000 4686963 26078 0 tour_i1
45

• Find the right metrics to measure • Look for bad things • Fix them!!
Summary
46

Questions?
47

We Value Your Feedback!
Don’t forget to submit your Insight session and speaker feedback! Your feedback is very important to us – we use it
to continually improve the conference.
Access your surveys at insight2015survey.com to quickly submit your surveys from your smartphone, laptop or
conference kiosk.
48

© 2015 IBM Corporation
Thank You