highway accidents and related factors - transportation...
TRANSCRIPT

A'/? HIGHWAY R E S E A R C H B O A R D
Bulletin 91
Highway Accidents and Related Factors
L I B R A R Y
MOV 2 01957
National Academy of Sciences-
National Research Council
H I G H W A Y R E S E A R C H B O A R D Officers and Members of the Executive Committee
1954
OFFICERS
G. DONALD KENNEDY, Chairman K . B . WOODS, Vice Chairman
FRED BURGGRAF, Director ELMER M . WARD, Assistant Director
Executive Committee
FRANCIS V . DU PONT, Commissumer, Bureau of Public Roads
HAL H . HAIiE, Executive Secretary, American AsaodatioH of State Highway Officials
Louis JOBDAN, Executive Secretary, Division of Engineering and Industrial Research, National Research Council
R. H. BALDQCK, State Highway Engineer, Oregon State Highway Commission
PYKE JOHNSON, Consultant, Automotive Safety Foundation
G. DONALD KENNEDY, Executive Vice President, Portland Cement Association
0. L . KiPP, Assistant Commissioner and Chief Engineer, Miimesota Department of Highways
BURTON W . MARSH, Director, Safety and Traffic Engineering Department, American AutomabUe Association
C. H. SCHOLER, Head, Applied Mechanics Department, Kansas State College
REX M . WHITTON, Chief Engineer, Missouri State Highway Departm^t
K. B , Wooite, Director, Joint Highway Research Project, Purdue University
Editorial Staff
FRED BURGGRAF ELMER M . WARD W . J . MILLER
2101 Constitution Avenue Washington 25, D . C.
The opiiiions and conclusions expressed in this publication are those of the authors and not necessarily those of tiie Highway Research Board.

HIGHWAY R E S E A R C H BOARD BuUetin 91
Highway Accidents and Related Factors
PRESENTED AT THE
Thirty-Third Annual Meeting January 12-15, 1954
1954 Washington, D. C.

Department of Traffic and Operations Wilbur S. Smith, Chairman
Associate Director, Bureau of Highway Traffic Yale University
David M. Baldwin, Director, Traffic Division, National Safety Council Donald S. Berry, Assistant Director, Institute of Transportation and
Traffic Engineering, University of California James S. Burch, Engineer of Statistics and Planning, North Carolina
State Highway and Public Works Commission Thomas J . Carmichael, Administrative Engineer, General Motors
Proving Ground F . B. Crandall, Traffic Engineer, Oregon State Highway Commission J . E . P. Darrell , Traffic and Planning Engineer, Minnesota Department
of Highways Henry K. Evans, Highway Transportation Specialist, Chamber of Com
merce of the United States Bruce D. Greenshields, Professor of Civi l Engineering (Executive
Officer), the George Washington University E . H. Holmes, Chief, Highway Transport Research Branch, Bureau of
Public Roads Robert S. Holmes, Executive Assistant, Wald Industries, Inc. B. A. Lefeve, Director, Bureau of Planning, New York Department of
Public Works J . C a r l McMonagle, Director, Planning and Traffic Division, Michigan
State Highway Department Burton W. Marsh, Director, Traffic Engineering and Safety Department,
American Automobile Association Theodore M. Matson, Director, Bureau of Highway Traff ic , Yale Uni
versity D. Grant Mickle, Director, Traffic Engineering Division, Automotive
Safety Foundation William J . Miller, Traffic and Planning Engineer, Delaware State High
way Department J . P. Mills, Jr . , Traffic and Planning Engineer, Virginia Department of
Highways C. A. Rothrock, State Planning Engineer, State Road Commission of West
Virginia H. P. Stockton, J r . , Manager, Texas Highway Plannii^ Survfey, Texas
Highway Department M. M. Todd, Executive Secretary, Institute of Traffic Engineers, Yale
University G. M. Webb, Traffic Engineer, California Division of Highways
11

Contents PSYCHOLOGY OF T R I P GEOGRAPHY
Heinz Haber, Robert Brenner and Slade Hulbert 1
Appendix A: Hypoxia^ 9 Appendix B: Hypnosis 12 Appendix C: Some Statistical Plans 13
Discussion Charles M. Noble 16 James S. Burch 17 T.W. Forbes 18 Sidney J . Williams 18 Closure: Heinz Haber, Robert Brenner and Slade Hulbert . 19
RURAL INTERSECTION ACCIDENTS William J . Miller, Jr 21
E F F E C T O F SHOULDER WIDTH ON ACCIDENTS ON TWO-LANE TANGENTS
D.M. Belmont 29
E F F E C T OF ENFORCEMENT ON V E H I C L E SPEEDS James Stannard Baker 33
AUTOMOBILE-BARRIER IMPACTS D. M, Severy and J . H. Mathewson 39
111

Psychology of Trip Geography HEINZ HABER, ROBERT BRENNER, and SLADE HULBERT Institute of Transportation and Traffic Engineering, University of California
THE authors deductively analyze highway accident focal points in terms of possible causative factors related to driver behavior. A concept is developed which the authors call "psychology of trip geography." This concept demonstrates that known psychological-behavior patterns can combine with the geography of the area over which a particular trip • is planned to produce driver conditions conducive to accidents. Some of the recognized psychological behavior patterns considered are: the setting of aspiration levels, the rigid adherence to previously made plans, the general performance let-down incident to nearing completion of a task. Trip geography has reference not only to terrain and weather but also to the spatial layout of origins and destinations coupled with logical stopping places en route.
The authors state their belief that the psychology of trip geography leads to prolonged driving and other imsafe driving practices which, in turn, increase the likelihood of an accident. In this context, seemingly unrelated accident-causing factors, such as reduced tactile sensitivity, highway hypnosis, and hypoxia (mountain sickness), are demonstrated to f i t meaningfully into the framework provided by the new concept. Prolonged driving reduces the tactile sensitivity of the driver; the importance of tactile cues for the driving task is discussed. Arguments are advanced for the increased likelihood of hypnotic and hypoxic effects also resulting from prolonged driving.
Pertinent literature in the fields of psychology, physiology, aviation medicine, and highway safety is cited in support of the various hypotheses advanced by the authors.
• ONE of the explanations for the continued occurrence of accidents on the open road is that higher speeds prevail there. I t is true that the severity of an accident usually will increase with increasing speed; however, speed per se does not necessarily explain the occurrence of the accident. Moreover, many accidents involve late model cars in good mechanical condition. Furthermore, there are an increasing number of accidents on modem freeways and other types of well-designed, limited-access roads. The conclusion must follow that there is some causative factor for open-road accidents that is not found in speed itself or in the condition and design of the vehicle or the road. It is reasonable to conclude that this causative factor can well be sought in the physiological and psychological conditions underlying the behavior of the driver operating his vehicle, be it an old or late model, be it on a good or poor road.
There are any number of factors that can affect the condition of a driver and reduce his ability to drive safely. These factors can be considered as force complexes. Alcohol, for one, has been the subject of many studies, and its importance if fully recognized; fatigue, also, has received widespread attention, a l though its role is not as well understood as that of alcohol; road hypnosis and so-called hypnagogic effects have been discussed in recent years; hypoxia (mountain sickness) has been considered, particularly in the mountainous western states; and, no doubt, others could be added to this list. Yet, to the best knowledge of the authors, no single framework has ever been formulated into which any of these complexes, or any combination of them, would f i t logically. Such a framework would have to show how individual complexes can combine to produce cumulative effects and, most important, why drivers permit themselves, either knowingly or

unlmowingly, to fall victim to the effects of any of these complexes. Once such a framework were Identified, knowledge of its existence would provide invaluable assistance to persons planning accident-prevention programs. An analytical study was accordingly initiated by staff members of the Institute of Transportation and Traffic Engineering of the University of California to look for some framework that would satisfy these conditions.
At the outset, it became apparent that meaningful results would most likely be achieved l?y studying some section or sections of our highways where there are high frequencies of accidents. The reasoning was that such sections mark locations where the force complexes are maximum and hence where a framework within which they operate would most easily be recognized. Such sections have been occasionally referred to in the past as "accident-prone mileage." However, for our present purpose the expression "accident focal point" appears preferable.
Attention of the authors was directed by traffic authorities of New Mexico to what seemed to be an accident focal point, namely the 160 miles of US 66 from the Arizona-New Mexico border to Albuquerque. In 1952 the fatal accident rate on this road was 18.5 fatal accidents per 100 million vehicle miles. The death rate (number of deaths per 100 million vehicle miles) can be expected to be greater than this fatal accident rate of 18. 5. The National Safety Council reports in the 1953 edition of "Accident Facts" that the national rural death rate for 1952 was 9.8. It was accordingly decided to study this section of road in detail with a view to attacking the general problem of the framework of vehicle accident causation.
POSSIBLE FRAMEWORK OF ACCIDENT CAUSATION
By definition, a particular section of road becomes an accident focal pomt by reason of the high frequency of accidents occurring there. It follows that there is some unique characteristic of the section that distinguishes i t from other sections of the same road, and from sections of other roads. But if the causative factor is to be sought in the physiological and psychological state of the driver, then a seeming impasse is reached, since
accident focal points are established in terms of unique characteristics of the road. The impasse would be heightened if it were established that the population of drivers using the accident stretch was the same as that using other sections of the same road and, similarly, that road design, condition of vehicles, and surrounding countryside were the same over i l l sections of the road.
The impasse, however, can be partially resolved by postulating that physiological and psychological changes take place in the driver as he proceeds along on a road and that such changes are related to space-time considerations unique to the road. To state this in another way: A driver would not be in the same psychological and physiological state from one space-time point to another and the extent of the difference is somehow related to the road in question. This space-time-psychological framework immediately makes evident an interaction between geography, trip plans, and driver conditions, respectively.
To illustrate this framework, let us postulate a trip from Los Angeles to the eastern seaboard via US 66. The driver leaves Los Angeles in the early morning, planning to stop overnight in Flagstaff, Arizona, 450 miles away. He is able to average between 50 and 60 mph. over this stretch because he maintains a high constant speed during the latter part of the trip between Kingman and Flagstaff. As a consequence, the driver is able to reach his originally planned goal for the day. Flagstaff, sooner than he had anticipated. His early arrival, combined with his awareness of the high average speed he was able to maintain, particularly over the last stretch, causes him to decide to go on to the next "logical" stopping place, which, in this case, would be Albuquerque, New Mexico. Some place between Flagstaff and Albuquerque he is involved in an accident.
A possible explanation for this accident would be that the driver was in an over-fatigued state and, hence, was unable to cope with or respond successfully to some minor condition on the road. This overfatigue could have been the direct result of his having underestimated the time and driving effort necessary for him to reach his new goal, Albuquerque. Moreover, it could well be that he was unaware of this encroaching overfatigue. Both the under-

estimation and the unawareness of fatigue could have been increased by the driver's satisfaction with his previous accomplish-
1 ment. This reasoning is supported by the 1 work of Child and Whiting U), who dem-I onstrated that successful performance in
creases the aspiration level for succeeding performance. A generalization of this psychological phenomenon in the trip situation is that an overestimation of the travel time and effort necessary to cover one leg of a trip promotes a tendency to underestimate the time and effort needed to complete the next leg. Thus, the geography of the terrain over which the particular trip was planned can interact with known psychological behavior patterns to produce a driver condition conducive to accidents.
This is one example of a new concept that the authors propose to call "psychology of trip geography." It represents a framework into which the various interacting accident-force complexes can logically be fitted.
PSYCHOLOGY OF TRIP GEOGRAPHY Geography, in the usual sense, refers
to terrain features such as desert, mountains, typical weather, etc. Trip geography includes not only these, but also such elements as distribution of and distances between large cities, origin and destination points, sightseeing points, desirable eating and overnight accommodations, fill ing stations, road conditions, alternate routes, and other physical features influencing planning and execution of the trip.
The psychological tactors involved ai e over and underestimating travel time and effort, inability or reluctance to change plans to cope with altered trip situations, injudiciously changing plans to meet an altered trip situation, consistently setting aspiration levels either too high or too low, and general performance letdown upon approachmg the destination. This latter point can be related to a recognized phenomenon in work psychology in which the performance of the individual decreases as the end of his work period approaches (2, 3). Some other generally recognized factors that belong in this category are a tendency to assign and try to cover a particularly great distance on the first day of a long trip, a tendency to compare
accumulated travel time with that of previous trips (either the same trip or trips of similar distance and duration), and a tendency to change plans toward the end of the trip by taking on an unduly high load of travel time and effort to reach the destmation, particularly home.
Psychology of trip geography can also lead to a better understanding of accidents associated with shorter trips. Drivers commuting over short distances habitually allow fixed travel times between regularly travelled points. When an imexpected delay occurs, even normally cautious drivers force themselves to make up the lost time by increasing speed and taking unusual chances. The military pass situation is another striking example of the same phenomenon: military personnel tend to maximize their time away from base and then, faced with the stringent necessity of being back at a prescribed time, take undue risk on the road. Both are examples of unsatisfactory adjustment to unforeseen delays and of poor trip planning, even over short distances.
The psychological phenomena, in turn, can result in driving practices and conditions that can be expected to increase accident likelihood: practices and conditions like speeding up to arrive at the time estimated, trying to cover a previously planned distance at all cost, taking chances that are not normally taken, driving in an overfatigued state, interruption of the physiological day-night cycle (4, 5), general unawareness of reduced driving efficiency, and a general lowering of attention and caution.
For these reasons, the authors believe that this combination of psychology and trip geography represents a generally occurring phenomenon that hitherto has not been defined, and that could readily account for a number of accident focal points throughout the nation for which no other explanation has been advanced. It can even override effects of other accident producing conditions that have been examined very carefully in the past such as road conditions, weather conditions, visibility, glare, driver characteristics, and condition and type of equipment.
INTERACTING FORCES WITHIN THE FRAMEWORK
At this point, it is in order to consider

how individual accident force complexes interact within the framework provided by psychology of trip geography. To do this, let us turn again to US 66 m New Mexico, f i rs t assessing it critically for prevalence of individual force complexes, and then examinmg the ways in which these forces can interact.
The f i rs t force complex that suggests itself is hypoxia, in view of the fact that this stretch of road leads through territory with an average elevation of about 6,500 feet above sea level, with a peak of 7,300 feet at the Continental Divide. In individuals exposed to altitudes of up to 7,300 feet above sea level, the following psychophysiological effects of hypoxia have been demonstrated to appear: (1) increase in depth of breathing in some mdividuals; (2) Increase of pulse rate in some individuals (pulse rate, however, returns to normal if the exposure is prolonged for more than one hour); (3) slight impairment of night vision and (in the low-pressure chamber) a decline of twilight visual acuity (the latter, however, is restored to normal within 24 hours of actual exposure to altitudes of about6,500 to 10,000 feet); (4) tremor of the hands in some individuals; and (5) slight impairment of sensitivity to pressure on the skin.
In addition to these symptoms, a certain percentage of the driving population can be expected to react with slight sleepiness, headaches, and lassitude. However, demonstrable effects of generally impairing nature occur only at higher altitudes. This fact is the basis for the existing Air Force regulation that oxygen equipment is not mandatory when flying at altitudes below 10,000 feet. Of course, the experimental results in the field of hypoxia were obtained largely from a select group of individuals who, with few exceptions, were students, mountain climbers, sportsmen, and personnel of the Armed Forces. These represent a selection of young, f i t people who can be expected to be in better than average physical condition. The driving population using US 66 in New Mexico probably has a different altitude-fitness composition. However, the extent to which these differences are a factor in accidents can only be conjectured at this time. Therefore, hypoxia by itself seems to be, at most, only a contributing factor in the high accident rate on this highway. A more-complete treatment of hypoxia
is presented in Appendix A. A second force complex that was sug
gested by the nature of the terrain is related to so-called road hypnosis. This phenomenon seems plausible because of the monotonous countryside and the comparative lack of curves and obvious changes of grade. Various aspects of hypnotic effects have been reported, including velocitiza-tion, high-speed hypnosis, and hjrpnagogic hallucinations. However, it would be unreasonable to conclude that monotony of road and countryside is a necessary and sufficient condition for road hypnosis, of itself, to produce an accident focal point since otherwise accident focal points would prevail on all monotonous roads. A more-complete treatment of road hypnosis is presented in Appendix B.
Thus, both the hypoxia and the road-hypnosis force complexes when considered by themselves, appear to have limited significance and probably are not responsible for any large number of accidents. However, it can readily be demonstrated that when considered within the psychology of trip geography framework, they can be appraised from a new perspective and, thereby, possibly achieve significance.
There are many ways in which various individual force complexes can combine or interact within the framework of the psychology of trip geography. The authors believe the most important to be related to fatigue. There are several reasons for this: First, one of the most-frequently occurring unsafe conditions in the cross-country driver is fatigue.^ Second, as was pointed out, psychology of trip geography can be a primary reason underlying fatigue, and thus explain it better than any other explanation hitherto advanced. This fatigue then acts as a catalyst in the accident causation system, serving to heighten the effect of otherwise unimportant force complexes. This leads to a consideration of plausible interactions between driver fatigue and single accident force complexes.
A study has been made by Luft (6) on the stress combination of hypoxia and light exercise. He observed a marked reduction in altitude tolerance and a depone of the authors had occasion to discuss the accident problem on US 66 with police officers patrolling this road. The officers volunteered the information that they frequently hac stopped weaving cars only to fmd the drivers in an extremely over-fatigued state

layed recovery from the symptoms associated with exposure to altitude during light exercise. Since driving can be considered mild exercise, the mild hypoxia present at altitudes between 6,500 and 7,300 feet may impair driving efficiency. Moreover, hypoxia alone, particularly in the healthy individual, may be vinimpor-tant, but i t may assume a certain importance in combination with the fatigue resulting from psychology of trip geography.
Another way in which psychology of trip geography, through its resultant fatigue effects, can interact with altitude is in impairing vision. Rose (7) has observed a reduction of twilight visual acuity and of night vision upon exposure to 31m-ulated altitudes between 6,500 and 10,000 feet (see Appendix A). A study by Petronio (8) reports a lowering of the light stimulus threshold and a contraction of the size of the field of vision in fatigued subjects, and an earlier study by Bujas (9) also reports a narrowing of the visual field in fatigued subjects.
Concerning the mteraction between hypnosis and fatigue, a paper byLahy (10), in which he cites work by Pieron, ifi re l evant. In this study of fatigue effects on truck drivers in relation to their work planning (planning the hours of driving), Lahy points out that " i t is in effect necessary as shown by Pieron that the physiological day-night rhythms, upon which the equilibrium of the body's recovery is based, are not disturbed. Here we have a most probable reason for the hypnagogic hallucinations which plague the driver and are, of course, likely to produce serious road accidents." Psychology of trip geography could result in disruption of this physiological day-night rhythm and, consequently, in increased likelihood of such illusions and their attendant dangers.
There is another aspect of fatigue that merits attention in this study: aeromedical research has revealed the importance of the body's system of mechanical senses in the proper control of aircraft. It has been shown that this system, and particularly the pressure sense of the skin, affords many important cues to the pilot, enabling him to fly properly.
The importance of the pressure sense was demonstrated by an experiment conducted by Strughold (11). He describes it as follows:
Without the cutaneous sensations, perception of the movements of our body m space becomes inaccurate. This was demonstrated by an experiment in 1928. I had my superficial gluteal nerves anesthetized and took a flight in a small airplane as passenger. I often had the feeling that the aircraft had slippedaway under my body, and I was glad to stand again on my nonanesthe-tized feet after landing . . . . The pressure sense of the skin can be impaired by pressure itself. It has already been mentioned that because of its rapid adaptation, pressure sensation fades rapidly after a constant prolonged deformation, because the specific stimulus is the change in pressure, not the pressure as such. Prolonged firm pressure can also reduce the excitability of the tactile receptors. Everybody has experienced numbness of his buttocks after he has remained in the seated position for several hours . . . . The decreased excitability of the tactile receptors is apparently related to the interruption of blood circulation and thus of oxygen supply. I consider the effect of pressure on the pressure sense to be of definite importance to aviation; for, one can conceive that after long flights downdrafts will not be recognized and compensated for fully and rapidly enough by a pilot whose buttocks have been numbed by pressure. This may have a disastrous effect during landing.
These observations, to a certain degree, also seem to apply to the driving task, but to the knowledge of the authors, there are no reports concerning the importance of tactile cues in controlling an automobile.*
These tactile cues are possibly more significant than is generally assumed. The importance of visual cues as compared to tactile and postural cues for determining body position has been investigated by Witkin (12). His subjects were placed in a spatially ambiguous position and asked to adjust both a rod and their body position to what they perceived to be the vertical. It was demonstrated that the tactile and postural cues outweighed visual cues in the determination of the body's position in space. The author states:
The scores show that when a visual field was present, the rod was tilted considerably less from the upright of the field than was the body. This finding reflects the fact that the position of an external item such as the rod is determined . . . predominantly on a visual basis, 1. e., by its relation to the surroundmg field. Perception of body position, on the other hand, depends much more upon specific body experiences, which are affected by rotation, and is less influenced by the surrounding field. ' This was first pointed out by K Reismann in a personal communication.

The cues that inform us of linear and curvilinear accelerations and decelerations of the car are very strong as we can easily demonstrate to ourselves when riding in a car as a passenger. If one's eyes are closed while the car is being driven through a series of curves, stops, and starts, the strength of the resulting tactile and proprioceptive cues wil l become startlingly apparent. Changes in speed or direction are immediately perceived. These sensations are received through the tactile surface of the skin at all those places in contact with the auto seat, and there can be little doubt that we make use of these kinesthetic cues in the proper execution of the driving task. The impending slipping of a car in a curve may be f i rs t perceived by means of these tactile cues rather than through visual cues. Frequently, the car may sti l l be in proper visual alignment in its lane at the time it begins to slip, and the visual cues alone do not give the driver sufficient time to detect impending slipping and to make proper corrections.
As has been shown in the previous section of this report, the psychology of trip geography may cause a driver to remain seated in his car for a rather extended period of time. . As a result, the driver gradually becomes less sensitive to pressure and, hence, less sensitive to a source of cues that are likely to be important to his ability to drive safely. This effect could further interact with mild hypoxia, since Loewy and Wittkower (13) found that the sensitivity to pressure on the skin is slightly impaired at heights as low as 5,100 feet. This latter phenomenon is a second-order interaction to be expected on high-altitude roads.
There is another relation between tactile cues for the driving task and psychology of trip geography. This concerns the sudden transfer of the driver from an open road to a traffic situation that requires frequent stops, starts, and turns. With lessened tactile sensitivity, he may not perform the traffic maneuver as ski l l fully as usual.' This may explain why cross-country drivers become involved in accidents in traffic situations they encounter en route. 'Plans are being made to investigate experimentally the importance of tactile cues in driving
REMEDIAL MEASURES
The authors have presented a concept, psychology of trip geography, that was developed entirely by deductive reasoning with no experimental and little empirical verification. Certainly there are many aspects of the conc&pt that could readily be subjected to rigorous experimental scrutiny, thereby - providing information on the interaction of psychological behavior patterns with trip geography specifics. In addition to verifying the importance of the concept, such studies would provide direction for specific remedial actions. A program of this nature is now being planned by the Institute of Transportation and Traffic Engineering. Possibly other research organizations will choose to study the same problem. Several possible statistical plans for doing this are presented in Appendix C.
Long-range experimental studies are expensive and, what is more important when lives are at stake, extremely time-consuming. During the long periods of time the programs would have to be in progress before meaningful results could be obtained, the conditions under study would continue to cause accidents with the accompanying loss of lives. It would seem a strong deductive argument indicating that a particular condition is contributing to loss of lives should be sufficient justification for proceeding with remedial measures without waiting for experimental verification of the argument. For this reason, the authors Twant to encourage all those who are active in accident prevention to have the concept of psychology of trip geography in mind as they consider their accident problems. This, in essence, highlights the primary objective in presenting this report at this time, admittedly without supporting evidence. Recognition of this concept can provide meaningful direction to groups such as motor clubs, highway officials, traffic engineers, enforcement agencies, company safety directors, and other persons directing accident prevention programs.
To demonstrate this, let us return to the New Mexico example. In this instance the psychology of trip geography led us to the following considerations: Albuquerque wil l continue to be a frequently sought-after, one-day goal of travellers starting

from Los Angeles. People who are susceptible to mountain sickness wil l not be legislated off the highway and wil l continue to drive over this section of the road. Similarly, it is not likely that hypnosis-producing aspects of the highway and the vehicle wi l l be altered in the foreseeable future. Consequently, the most effective recourse would be to create an awareness in the driver of the nature of the psychology of trip geography. This, in turn, would have a positive effect on his trip planning and his subsequent trip attitudes.
Little is known about driver attitudes and how to Influence them (14) but, again, i t Is entirely in order to proceed with some program if there is a reasonable likelihood that i t wil l influence trip attitudes. With reference to psychology of trip geography, such a program would consist of three stages: First, acquainting the driver with the ways in which psychotogy of trip geography can affect him (this is already being done to a certain extent by motor clubs, travel agents, gasoline companies, and other groups which provide tr ip planning services); second, warning the driver of the imminent hazards as he approaches the accident focal point; and third, continually reminding the driver of the presence of hazards as he passes over the accident stretch of the road.
Applying this procedure to US 66 would involve the following three-point program: (1) Groups providing trip planning services in the Los Angeles area would point out to drivers the nature of the possible effects associated with the psychology of trip geography as i t applies to their proposed trip. These explanations would be similar to those presented in this paper. (2) At the Arizona-New Mexico state line, pamphlets repeating the information given in the trip planning stage would be distributed to drivers. (3) Road signs would be installed along the road in question, with messages related to the pamphlet and trip-planning information.
Some of the messages that might be placed on the road signs could refer to such items as: (1) the accident record of US 66, with particular reference to out-of-state drivers; (2) the possible i l l effects of altitude, particularly as regards those road users with asthmatic, cardiac, and vascular histories, (3) the tendency for drivers to be unaware of the altitude reached on the road, due to the compara
tive lack of sharp curves and steep grades; (4) the hazards of road hypnosis owing to the monotony of the road, particularly during the night; (5) the tendency to assume an unduly high load of travel time and distance, and the consequent dangers of driving in an over-fatigued state; (6) the loss of driving efficiency, particularly in the tactile facilities, if driving is extended beyond a reasonable time; and (7) the possible interaction among and accumulation of the i l l effects likely to occur on this road.
Two types of road signs could be used. One type would simply reiterate some of the most-impressive and locally pertinent items of information already contained in the pamphlet; the second type would give the elevation. The signs could be arranged either at regular intervals along the road, or at equal elevation increments. Both types of signs would serve not only as sources of information but also as reminders of the hazards of this road. Even if altitude has no effect upon the accident picture the elevation markers would nevertheless serve a purpose in that they could be expected to focus the driver's attention upon his task in relation to this particular situation.
SUMMARY AND CONCLUSIONS The authors deductively analyzed high
way accident focal points in terms of possible causative factors related to driver behavior and formulated a new concept called psychologjf of trip geography. This concept makes i t possible to understand how known psychological behavior patterns can combine with the geography of the area over which a particular trip is planned to produce driver conditions conducive to accidents. Some of the recognized psychological behavior patterns considered are: the setting of aspiration levels; the rigid adherence to previously made plans; and the general performance letdown incident to nearing completion of a task. Trip geogrs^hy has reference not only to terrain and weather but also to the spatial layout of origins and destinations, coupled with logical stopping places en route.
The authors stated their belief that the psychology of trip geography leads to prolonged driving and other unsafe driving practices which, in turn, increase the

8
likelihood of an accident. In this context, seemingly unrelated accident - causing factors, such as reduced tactile sensitivity, highway hypnosis, and hypoxia (mountain sickness), were demonstrated to f i t meaningfully into the framework provided by the new concept. Arguments were then advanced for the increased likelihood of hypnotic, hypoxic, and reduced-tactile-sensitivity effects resulting from prolonged driving.
ACKNOWLEDGEMENTS The authors are indebted to J. H.
Mathewson, assistant director, Institute of Transportation and Traffic Engineering, University of California, for his many constructive contributions and suggestions for studying this problem.
The attention of the institute was first drawn to the problem by W. A. Huggins, executive secretary. Coordinating Committee of State Officials on Traffic Safety, State of California. Appreciation is due him for his efforts in bringing together representatives of New Mexico and members of the institute staff.
The keen Interest demonstrated by Charles P. Dunwiddie, director, Governor's Traffic Safety Coordinating Committee, State of New Mexico, who discussed the problem in detail with the staff and submitted useful numerical data, is gratefully acknowledged.
REFERENCES 1. Child, I . L . and Whiting, J .W.M.
"Determinants of Level of Aspiration: Evidence from Everday L i f e , " Jovr: Abnormal and Social Psychol., 44, 303-314, 1949.
2. Ghiselli, E.E. and Brown, C. W. "Industrial Psychology, "McGraw-Hill Book Co., Inc., 1948.
3. Vernon, H. M. "Industrial Fatigue and Efficiency," Dutton, New York, 1921.
4. Strughold, H. "Physiological Day-Night Cycle in Global Flights." Joum. Avia. Med., 23, 464, 1942.
5. Kleltman, N. "Sleep and Wakefulness. " The University of Chicago Press, Ch.icago, 111., 1939.
6. Luft, U. C. "Altitude Tolerance." Chapter IV-J of "German AviationMedlcine World W a r n , " Vol. I . p. 304, U.S. Government Printing Office, Washington 25, D.C. , 1950.
7. Rose, H. W. ,"Study of Acclimatization During a Two-Week Exposure to Moderate Altitude (10,000 feet); Effect of A l t i tude Adaptation on Night Vision and Ocular Muscle Balance." Project No. 21-02-029, report No. 1; USAF School of Aviation Medicine, Randolph Field, Texas, March, 1949.
8. Petronio, G. "Behavior of the Light Stimulus Threshold and the Field of Vision in Fatigued Subjects. "Arch. Ottalmol, 47, 19+, 1940. (abstracted review, original not seen.)
9. Bujas, Z. "Le Retrecissement du champ visuel comme Test de Fatigue," (Narrowing of the visual field as a test of fatigue). Annce psychol. 38, 186-197, 1938.
10. Lahy, B. "Les Conducteurs de 'doids lourds' Analyse du metier. Etude de la Fatigue et Organization du Travail," (Truck drivers, analysis of work, study of fatigue and organization of work) Travail hum., 5, 35-54, 1937.
11. Strughold, H. "The Mechanore-ceptors of Skin and Muscles Under Flying Conditions," Chapter X-B of "German Aviation Medicine World War H , " Vol. H, p. 994. U. S. Government Printing Office, Washington 25, D.C. , 1950.
12. Witkin, H.A. "Further Studies of Perception of the Upright When the Direction of the Force Acting on the Body is Changed,"J. Exper. Psychol. 43, 9-20, 1952.
13. Loewy,A. andWittkower. "Weitere Untersuchimgen zur Physiologie des Hoe-henklimas," Archiv. f .d . ges. Physiol., 233, 622, 1933.
14. Case, H.W. "Attidues - What Are They? How Are They Changed," Transactions 1940 National Safety Congress, 31, 75-81.
15. Armstrong, H. G. "Principles and Practices of Aviation Medicine," 3rd ed.; The Williams & Wilkins Co., Baltimore, 1952.
16. McFarland, R.A. "Psycho-Physiological Studies At High Altitude in the Andes; n . Sensory and Motor Responses during Acclimatization." Journ. Comp. Psychol., 23, 227, 1937.
17. Goralewski, G. "Zentralnerven-system und Anoxaemie. I I . " Arbeits-physiol., 9, 392, 1937.
18. McFarland, R.A. "Psycho-Physiological Studies at High Altitudes in the Andes, I . The Fffects of RapidAscents

by Aeroplane and Train." Journ. Comp. Psychol., 23, 191, 1937.
19. McFarland, R.A. "The Psychological Effects of Oxygen Deprivation (Anoxemia) on Human Behavior." Arch, of Psych. No. 145, New York, Dec., 1932.
20. Air Service Medical. Washington, D.C., Government Printing Office, 1918.
21. Graybiel, A . , Missiuro, W., Di l l , D. B . , and Edward, H. T. "Experimentally Induced Asphyxiation in Cardiac Patients." Journ. Avia. Med., 8, 178, 1937.
22. Anon. "Car Drivers Who Suffer From RoaiJHypnotism," Let. Digest, 69, 56-57, June 4, 1921.
23. Bramesfeld, E. and Jung, H. "Un-fallverursachende Daemmerzustaende bei Flugzeugfuehrern." ( Accident - causing trance-like state in pilots) Indus. Psycho-techn., 9, 193-210, 1932.
24. Sheridan, Hy. "Hypnosis in the Cockpit." Flying, 46, 12-13+, May 1950, discussion 47, 28-29+, August, 1950.
25. Anon. "Expressways and Traffic Accidents," Tax Economics Bulletin, 17,
No. 6, 37, November-December, 1952. Published by American Petroleum Industries Committee of the American Petroleum Institute.
26. Mosely, A. L . "Hypnagogic Hallucinations in Relation to Accidents," The Amer. Psychologist, i . No. 8, 407, August, 1953 (Abstract).
27. Jenness, A. and Wible, C. L . "Respiration and Heart Action in Sleep and Hypnosis," J. Gen. Psychol. 16, 197-222, 1937.
28. Nygard, J. W. "Cerebral Circulation PrevailingDuringSleep and Hypnosis." J. Exp. Psychol. 24, 1-20, 1939.
29. Dynes, John B. "Objective Method for Distinguishing Sleep from the Hypnotic Trance." Arch. Neurol. Psychiat., Chicago, 57, 84-93, 1947.
30. Williams, G. W. "Hypnotized Drives Car," Science Digest, 24, 33. July, 1948.
31. McNamar, Q. "Psychological Statistics," John Wiley and Sons,Inc., New York, 1949.
APPENDIX A
Hyp The problem of mountain sickness or
hypoxia has been the subject of intense studies during the past 25 years since the exposure to altitude became routine in the operation of aircraft, and the majority of the problems of aviation medicine center around this phenomenon. Most investigations in the field of hypoxia, however, deal with conditions existing at altitudes over 10,000 feet above sea level;relatively few studies have been made of effects of human exposure to altitudes below 10,000 feet. Enough material is available, however, to pass judgment on the validity of the hypoxia hypothesis.
The objective and subjective effects of hypoxia are related to a drop in the oxj^en saturation of arterial blood that occurs with exposure to altitude. The oxygen saturation of the arterial blood is dependent upon the oxygen partial pressure existing in the air breathed by the individual. Al l the quantities involved (oxygen saturation, alveolar oxygen tension, and partial pressure of oxygen in breathing air) decrease with increasing altitude. Both the oxygen
oxia partial pressure of atmospheric air and that of alveolar air decrease very nearly according to a logarithmic law, while the oxygen saturation of arterial blood behaves differently (see Fig. A). The oxygen saturation of arterial blood at sea level is about 96 to 97 percent, and it drops only slightly up to 10,000 feet: at this level, the oxygen saturation of arterial blood is stil l approximately 87 to 89 percent. This is the main reason why a healthy organism is only slightly affected by altitudes up to about 10,000 feet.
Exposure to altitudes ranging between 10,000 and 30,000 feet, on the other hand, results in a steep drop of the oxygen saturation of arteria 1 blood. It is in this range that the typical symptoms of altitude sickness occur. Armstrong (15) lists a number of subjective symptoms in the order of their frequency as they are experienced at various altitudes between 12,000 and 16,000 feet (see Table A).
In general, with increasing altitude the number and intensity of the symptoms listed in Table A increase, and the time required

10
for symptoms to develop is shortened. There are essentially two classes of
psychological reactions to exposure to altitude: some individuals react with outbursts of hilarity, uncontrollable laughter or at least with pronounced euphoria; others feel fatigued, depressed, and sleepy. In
the depth of breathing is increased con -! slderably. At 12,000 feet, lung ventilation is apt to increase as much as 20 to j 100 percent over the sea-level values.' Increase of depth of breathing becomes noticeable in some individuals at heights { of 4,000 feet. The rate of breathing, how-
X
I UJ
a.
160 ISO 140 130 120 110 100 90 80 70 60 501 40 30 20 I 0
0
•'I V i
\ 1
\ >
\ «s
>
5 10 15 20 25 30 35 40 45 ALTITUDE-THOUSANDS OF FEET
- 0 , PARTIAL PRESSURE IN ATMOSPHERIC AIR - 0 , PARTIAL PRESSURE IN ALVEOLAR AIR - SATURATION OF ARTERIAL BLOOD
Figure A.
some individuals, exposure to altitude produces severe headaches, dizziness, a definite feeling of sickness accompanied by vomiting, muscular weakness, and mental confusion or even prostration.
TABLE A SUBJECTIVE SYMPTOMS OF ALTITUDE SICKNESS
12,000 Altitude (feet)
14,000 16,000
Sleepiness Headache Headache Headache Altered Altered
respiration respiration Altered Sleepiness Psychological
respiration impairment Lassitude Psychological Euphoria
impairment Fatigue Lassitude Sleepiness Psychological Fatigue Lassitude
impairment Euphoria Euphoria Fatigue
But disregarding physiological details, the following objective symptoms become manifest In a human being exposed to altitude:
Respiration. Upon exposure to altitude.
ever, does not exhibit any significant Increase.
Pulse. The pulse rate begins to Increase at a height of about 4,000 feet and becomes rapid at altitudes of 14,000 feet. A mean Increase of 27 beats per minute is observed at these heights. At altitudes below 12,000 feet, the pulse rate generally returns to normal If the exposure is prolonged for more than an hour.
The Senses. Night vision is the func-tlon of the eye f i r s t affected by altitude. This effect Is demonstrable at altitudes as low as 4,000 feet. Rose (7) studied twi light visual acuity at simulated altitudes (in a low pressure chamber) and observed a marked decline imder these conditions, but the twilight visual acuity was restored to normal within 24 hours at actual a l t i tudes of about 6,500 to 10,000 feet. At higher altitudes (above 15,000 feet) accommodation, depth perception, and light perception are decreased. McFarland (16)

11
has studied the increased latency and the unusual quality and intensity of visual afterimages observed at higher altitude. The deviations from the normal after-image phenomena are demonstrable at altitudes af about 9,000 to 10,000 feet and become pronoimcedat altitudes of 18,000 to 20,000 feet. Hearing is not normally affected below 16,000 to 18,000 feet. The senses of touch and pain are markedly dulled at ^Igh elevations. Loewy and Wittkower (13) found a slight impairment of sensitivity to pressure on the skin at heights as low as 5,100 feet. i Neuromuscular Effects. The f irs t neuro-muscular effect to appear upon exposure to increasing levels of altitude is tremor of the hands. Goralewski (17) reports that 30.7 percent of a total of 58 subjects exhibited tremor when exposed to a height between 4,000 and 10,000 feet. At higher altitudes (12,000 to 30,000 feet) the following symptoms appear in this order: clumsiness and Incoordination of finer muscular movements, slow-down of movements, cramps, andfinally paralysis. These phenomena have also been studied extensively by other authors using handwriting tests.
Psychophysical Effects. This realm of phenomena was explored in a series of ambitious studies by McFarland (16 , 18, 19) using airplanes and during an expedition to the Andes. The effects do not become demonstrable below a height of about 12,000 feet. Simple reaction in response to an optical stimulus was impaired slightly only at the highest elevations (20,000 feet). The variability of response, however, was increased at lower levels (14,000 feet). At lower and medium altitudes (6,000 to 10,000 feet), a number Df authors have observed an increased response of the reflex mechanisms that has been explained as a f i r s t compensatory reaction of the organism in response to a condition of mild hypoxia. McFarland further observed a slight decrease in momentary memory and, at higher ele-v ations (14,000 to 20,000 feet) a signif
icant reduction in mental capacity and volition, accompanied by mental fatigue and inability to concentrate.
Adaptation to Altitude. After a period of time, an organism exposed to altitude acquires a certain degree of altitude f i t ness. A person transposed from sea level to altitudes of 10,000 to 15,000 feet is apt to lose the major symptoms of altitude sickness within a period of a few days. Full adaptation, manifested by an increase in red cells and hemoglobin concentration in the blood, is acquired after a continuous stay at altitude for periods ranging from 2 weeks to 2 months. Upon return to sea level, the altitude adaptation is gradually lost withm about the same length of time.
Pathological Aspects. Schneider (20) and Graybiel, et al, (2irhave demonstrated that defects of the vascular system (arteriosclerosis) and the heart have a pronounced effect upon altitude fitness due to the inability of impaired vascular and cardiac systems to cope with hypoxia. Armstrong (15) assumes that anemias and respiratory diseases such as asthma and pneumonia are also apt to impair altitude fitness.
Concerning the altitudes encountered on highways in western sections of the United States the following can be concluded: As can be expected from the oxygen-saturation curve of arterial blood as a function of altitude, no major disturbances and symptoms of hypoxia should be present below 8,000 to 10,000 feet. There are, however, several passes in the West that lead well above the 10,000 feet altitude mark, such as Independence Pass (12,095 feet). Iceberg Pass (11,800 feet), and Milner Pass (10,759 feet). Red Mountain Pass (10,900 feet). In California there are a number of passes that reach close to 10,000 feet, such as Tioga Pass and Sonora Pass. At these altitudes the psychophysiological consequences of hypoxia could indeed, for a sizeable percentage of the population, result in a serious impairment of driver efficiency.

12
APPENDIX B
Hypnosis
So-called hypnotic effects may be a causative factor in accidents, particularly single car accidents, occurring on roads such as US 66. However, there is little experimental evidence in the available literature on this subject. Each writer seems convinced of the occurrence of the driver-hypnosis phenomenon, but usually does not go beyond anecdotal reports and conjectural statements (22, 23, 24).
To date, IHere are three types of postulated hypnotic effects. G.W. Williams (25) has pointed out two types. The first, which he calls "velocitization," refers to the driver's inability to appreciate his actual speed in terms of stopping distance when travelling at high speeds, and the second, which he terms "high-speed hypnosis," is a state of trance brought about by traversing mile after mile of monotonous highway. The third effect, "hypnagogic hallucinations,"has been discussed by A. L . Mosely (26). He reports instances of long-distance drivers who imagined they saw something on the road and had to make emergency stops. This phenomenon typically occurred: (1) at night, (2) on long distance runs, (3) while the vehicle was moving, (4) while the driver activity was at a low level, (5) while the driver was feeling fatigued and sleepy. The hallucinated object required an emergency stop to avoid collision, which procedure the driver carried out without knowing the situation was not real.
Most drivers have experienced velocitization when entering a low speed zone after having driven many miles at high speed. Under these conditions, travelling at a low speed is usually perceived as though one were travelling at a still slower pace. It is reasonable to assume that the tendency to underestimate relatively low speeds under these conditions is merely an extension of a similar tendency for underestimation that was present while travelling at the higher speed. This assumption is supported by the known tendency of drivers to underestimate braking distance as speed increases. Perhaps velocitization is better explained as an habituation effect in which the driver accommodates to the high speed, and then
experiences a lag or delay in accommodating to the reduced speed.
All that seems required for velocitization to occur is a relatively brief period (about 15 minutes or longer) of driving on a good highway at a fairly constant and, high (50 mph. or greater) speed. If ve-l locitization does occur, it could be a contributing factor to highway accidents that, involve errors in braking time. i
Of these three effects, high speed hypnosis bears the greatest resemblance to the hypnotic trance as publicly demonstrated by professional entertainers. Indeed, one of the strongest arguments for the validity of high-speed hypnosis is found in the similarity that exists between certain prolonged driving conditions and known trance-inducing procedures. For example, the driving situation often presents such conditions as the monotonous hum of the engine, extended stretches of flat, tangent highway over uniform terrain, highly repetitious vibration patterns, and long periods of concentration on a single task. These conditions have their counterpart in the procedure often used by hypnotists, namely prolonged concentration on a single aspect of the environment such as a bright spot of light and uniform and repetitious external stimuli (e. g., remaining seated in a quiet room). One factor not encountered in the driving situation that occurs in many hypnotic procedures is the verbal suggestion of sleep given by the hypnotist. However, there is reason to believe that this factor of verbal suggestion only accelerates the hypnotic process and that prolonged exposure to the conditions previously mentioned will, by itself, be sufficient to produce a trance like state.
Many studies (27, 28, 29) have shown that a hypnotic trance closely resembles the waking state and is entirely different from that of sleep. It has also been shown that a person can perform driving functions while he is in such a state, but that his ability to react to sudden, unexpected road conditions such as a dip or curve m the road, would be expected to be impaired (30). Thus, the increased susceptibility

13
of drivers to accidents while they are in a hypnotic state is apparent.
The third aspect of driver hypnosis, specifically, hypnagogic hallucinations of objects or persons on the highway, probably occurs more often than has been reported. This is indicated by many instances where driver illusions are mentioned in casual conversation with drivers, especially with drivers on cross-country trips. There are many possible reasons why accident reports would not be expected to contam mention of hallucinations: (1) the hallucinating driver may be killed, (2) the emotional shock involved may cause imconscious forgetting or repression of the hallucinations, (3) the possibility of guilt may also cause such repression, (4) the possible consequences of admitting hallucination may bring about willful
withholding of information, and (5) the driver may never become aware of having hallucinated. Consequently, even in cases where they do occur and cause accidents, it is quite likely that hallucinations will be overlooked as causual factors, making it extremely difficult to isolate this particular aspect of driver hypnosis and establish its importance as an accident causing factor.
It is entirely possible that any or all of the above-mentioned aspects of hypnotic effect on drivers can be operating on highways and thereby contributing to the accidents that occur. However, since so little is known about tne necessary conditions for the occurrence of these phenomena, specific conclusions as to their prevalence cannot be made at present.
APPENDIX C
Some Statistical Plans Analyses of accidents can be directed
toward a number of problems relating to psychology of trip geography or toward force complexes, such as hypoxia and hypnosis, that fit into a framework provided by the concept. But whether or not a particular analysis can be performed is determined entirely by whether or not the appropriate road usage information has also been collected. For example, hypotheses relating to the difference between male and female driving accidents can be tested only when the amounts of male and female driving are known. It is almost axiomatic that little if anything can be learned from accident data without the attendant usage information, which is the mandatory experimental control on the accident information. Several statistical plans will be developed here that will demonstrate the importance of usage in formation. The hypotheses considered are related to psychology of the US 66 trip geography in New Mexico.
California authorities would be concerned with the involvement of California drivers in accidents on this road. Hence, a problem of immediate interest would be whether or not the ratio of California driver accidents to other driver accidents is greater than the ratio of the number of
California vehicles using the road to the number of other vehicles using the road. The same problem restated from the stanc^oint of New Mexico authorities, would be whether or not nonresident drivers suffer a percentage of the accidents higher than the percentage of nonresident vehicles using the road. To solve either of these problems, it is first necessary to weight the accident experience of the two classes of drivers (California versus others or New Mexico versus others) according to the numbers of vehicles of each particular class using the road during the time in question. Normally, there will be some difference between the two weighted ac -cident experiences. The problem to be solved statistically is whether such an observed difference is indicative of a real difference between the two classes of drivers, or whether the observed difference IS merely the result of chance variation. One statistical plan for solving this problem is described below; it utilizes the well known chi-square test of independence, which IS usually described in detail in any statistics textbook (31.).
Let Vn represent the volume of nonresident vehicles using the road during some period of time, and let An represent the number of accidents involving these

14
nonresident vehicles. Similarly, let Vp and Ar represent respectively the volume and number of accidents mvolving resident vehicles. Vn, An, Vr, Ay all pertain to the same period of time (Table B).
TABLE B Resident Nonresident ToUl
Volume Accidents Volume Accidents Volume Accidents
r \
A n
V A
A „ - ( A ) V „
TJ L X (1)
(A)'^r (A)Ti 1-df
If t^e Chi square value calculated as shown in Equation 1 is greater than the pertinent tabulated value, it can be concluded that the difference between resident and nonresident accident experience is greater than that which would be expected by chance; if the calculated value IS less thai\ the tabulated value, then it can be concluded that the difference was no greater than what would be expected by chance. It should be noted that the only usage information required for this analysis is the volume of resident and nonresident drivers using the road during the period of time under consideration, but without it the analysis could not properly be performed.
Another problem of particular interest involves the determination of whether or not the residence of the driver involved in an accident (resident or nonresident) is related to his direction of travel (east-bound or westbound). Statistically, this hypothesis pertains to the mdependence of the residence of the accident driver from his direction of travel. The previously described chi-square procedure can be used to test this more detailed hypothesis, the only difference being that more detailed usage data is required.
Let the subscripts e and w represent eastbound and westbound directions of travel respectively (Table C). Ver represents the volume of eastbound, resident drivers during some period of time. Awn represents the number of accidents involving westbound, nonresident drivers, etc. The hypothesis of independence could be tested by computing the chi-square statistics according to Equation 2. The hypothesis would be rejected or ac
cepted if the computed statistic was greaterj or less respectively than the pertinent tabulated value.
Resident Nonresident Totals Volume Accidents Volume Accidents Volume Accidents
East-bound
Aer
Westbound V
wr
A wr V
wn
i "wn V
w
K
Total V r
A r \
A n V A
Aer-(A )Vj [ A , , - (A) ^wr
(A) —
A^^ - (A) ^enl' / "v^ L
(2;
(A)- en
- (A) wn
V — — --^i-df (A) "wn ^ i r
An interesting group of possible analyses deals with the large number of possible interactions between the various postulated
INCREASNG ACCIOENT UKELIHOOD
Figure B. Hypothetical e f f ec t s on a c c i dent l ikelihood of (1) increasing time on road, I . e . , f a t i e u e , (2) a t t i tude , and
(3) fatigue X att i tude i n t e r a c t i o n .
accident-causing factors. Each interaction would have to be studied separately because some might require different statistical plans than others. The interaction
15
of most apparent interest in this study deals with the relation between psychology lof trip geography and altitude since this 'particular combination seems to be unique on Highway 66.
\ ' ' ' N EASTBOUND / \ / ' 1 \WESTBOUN0
Tei Twi
TIME ON ROAD
Figure C. D i s t r ibut ion of time on road at Point 1.
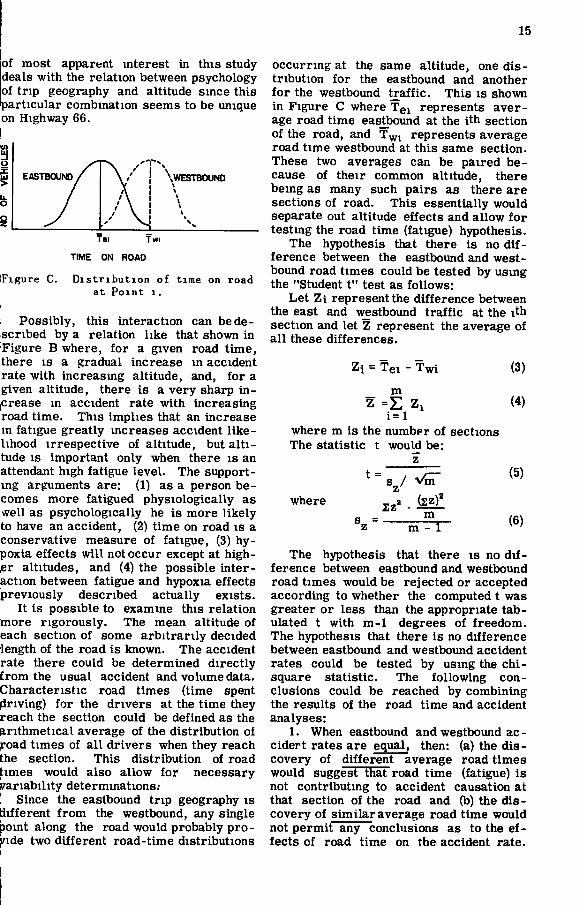
i Possibly, this interaction can bede-[scribed by a relation like that shown in iFigure B where, for a given road time, there is a gradual increase in accident rate with increasmg altitude, and, for a given altitude, there is a very sharp in-jcrease m accident rate with increasing road time. This implies that an increase in fatigue greatly increases accident likelihood irrespective of altitude, but altitude IS important only when there is an attendant high fatigue level. The supporting arguments are: (1) as a person becomes more fatigued physiologically as well as psychologically he is more likely to have an accident, (2) time on road is a conservative measure of fatigue, (3) hypoxia effects will not occur except at high-,er altitudes, and (4) the possible interaction between fatigue and hypoxia effects previously described actually exists.
It is possible to examine this relation more rigorously. The mean altitude of each section of some arbitrarily decided length of the road is known. The accident rate there could be determined directly from the usual accident and volume data. Characteristic road times (time spent firiving) for the drivers at the time they reach the section could be defined as the ^.rithmetical average of the distribution of j:oad times of all drivers when they reach the section. This distribution of road
imes would also allow for necessary R^anability determmationsj ! Since the eastbound trip geography is different from the westbound, any single point along the road would probably pro-s ide two different road-time distributions
occurring at the same altitude, one distribution for the eastbound and another for the westbound traffic. This is shown in Figure C where Tgi represents average road time eastbound at the i h section of the road, and T^i represents average road time westbound at this same section. These two averages can be paired because of their common altitude, there being as many such pairs as there are sections of road. This essentially would separate out altitude effects and allow for testing the road time (fatigue) hypothesis.
The hypothesis that there is no difference between the eastbound and westbound road times could be tested by using the "Student t" test as follows:
Let Zi represent the difference between the east and westbound traffic at the ith section and let Z represent the average of all these differences.
Zi = Tei - Twi
m z = E
i = l where m is the number of sections The statistic t would be:
z t
where 2Z'
/ Vi^ > (sz)'
m
(3)
(4)
(5)
(6)
The hypothesis that there is no difference between eastbound and westbound road times would be rejected or accepted according to whether the computed t was greater or less than the appropriate tabulated t with m-1 degrees of freedom. The hypothesis that there is no difference between eastbound and westbound accident rates could be tested by using the chi-square statistic. The following conclusions could be reached by combining the results of the road time and accident analyses:
1. When eastbound and westbound ac -cidert rates are equal, then: (a) the discovery of different average road times would suggest that road time (fatigue) is not contributing to accident causation at that section of the road and (b) the discovery of similar average road time would not permit any conclusions as to the effects of road time on the accident rate.

16
2. When eastbound and westbound rates are different, then: (a) the discovery of different average road times would suggest that road time (fatigue) is important, assuming these differences are in the same direction as those of the accident rates and (b) the discovery of similar road times would suggest that road time is not contributing to the accident situation at this section of the highway.
This IS necessarily a fairly complex statistical treatment, but the key to it, just as with the simpler chi-square tests, is the availability of appropriate usage information, which, in this case, is the distribution of road times.
There are many more simple, enum-erative types of statistical analyses that could readily be performed. Such analyses can give positive evidence of the
presence or absence of specific accident causes, and an increased general understanding of the accident problem on this] section of the road. The only data requirements are accident information alongi with the appropriate road usage informa-j tion. Of course, the road usage information must pertain to the same period of time as the accident information. Highway 66 seems to be particularly suited for such statistical study. Road usage information could be collected reason-, ably inexpensively yet accurately since there are a minimum number of cross roads. Because the accident experience there is high, the effectiveness of accident prevention measures should be de-i tectable through statistical analysis, and a long range statistical program on thei accident experience on this road should produce meaningful and useful results.
Discussion
CHARLES M. NOBLE, Chief Engineer, New Jersey Turnpike Authority — The writer has long been interested in psychological studies pertaining to highway accidents.^ It is encouraging to note the increased attention being given this subject and although progress has been slow, greater interest and application of talent to the problem should result in increasing knowledge in this relatively unknown field. It is believed that the Institute of Transportation and Traffic Engineering of the University of California could well join forces and work closely with the Committee on Highway Safety Research of which Dr. T.W. Forbes is technical director so that the overall effort can be effectively coordinated.
The writer agrees that if accident statistics show that certain highway areas have a high accident rate and if the causes of such accidents are known, a program of corrective measures should be promptly tried out and evaluated. Only in this way can the psychological approach be proved effective. Public information is a useful and powerful tool in this effort so the public can be informed where dangerous stretches of highway are located, the
'"Thoughts on Highway Design Research as Related to Safety of Vehicle Operations." Page 242, Proceedings of the Highway Research Board, 1937, Vol. 17
causes of accidents in these areas and the prevalent human errors that lead up to such accidents.
The policy of applying corrective measures as soon as they have been devised has been followed by the New Jersey Turnpike. Every accident is studied and causes determined when possible. Then every practical means for accident reduction is! applied. As rapidly as promising mea-j sures are developed, they are put intoj effect and the results observed. To date,i the analyses indicate that human error and mechanical failure are responsible rather than the design of the highway.' Augmentation of police personnel provec an effective measure in accident reduction!
It is interesting to compare the New' Jersey Turnpike 1952 and 1953 accident and fatality rates. It is evident that thd application of safety measures has ren suited in lowering these rates:
T952 1953 (a) Accident rate 5^7T WTL (b) Fatality rate 6.11 4.14
(per 100 million vehicle-miles) To date it has not been feasible to determine the individual effect of each of th^ various measures utilized.
It'is noted that a standard operating procedure has been promulgated to coveij those cases involving restricted visi-

17
bility and other effects of adverse weather. It is noted that the 1953 New Jersey Turnpike accident rate is only 9 percent of the national rate and the fatality rate is approximately 60 percent of the national rate.
One of the critical accident problems on the New Jersey Turnpike is occasioned by rear-end collisions where one vehicle smashes into the back of another, often without any indication that the driver saw the vehicle ahead. This indicates that the driver lost depth perception and the ability to determine how far a vehicle is ahead. Obviously, this situation is more serious at night.
Because of this accident experience which seems to be widespread nationally, the New Jersey, Pennsylvania, and Ohio turnpike commissions recently met in Harrisburg, at the request of the Pennsylvania commission to consider the drafting of uniform regulations concerning rear lighting and rear bumpers for trucks. A committee has been appointed from the staffs of the three commissions and this committee is now at work drafting recommendations.
It is noted that newspaper publicity although sometimes painful can be beneficial inasmuch as it serves to warn the public that the driver after all must still drive the car. The public generally has become so used to the many scientific miracles unfolded during the last 40 years that many motorists gain the impression that somehow engineers have been able to design highways which make it unnecessary for the driver to actually drive the car. Publicizing the continued need for driver responsibility is a worth while effort and the public press can also contribute toward public safety by emphasizing habits which are inherently dangerous and inevitably lead to accidents, such as bumper riding, passing on the right, etc.
It seems to me that a most-important contribution by the authors of this paper is in pointing out that certain areas of highway may be dangerous, not because of their physical characteristics but because of their location relative to trip origins. This thought deserves much consideration and should be the basis of effective safety publicity.
In conclusion, I am glad to see this activity in the field of driver psychology
and hope that it will be pressed forward in a coordinated and purposeful manner.
JAMES S. BURCH, Engineer of Statistics and Planning, North Carolina State Highway and Public Works Commission — "The authors have presented a concept — that was developed entirely by deductive reasoning with no experimental and little empirical verification."
That sentence is perhaps the most significant in the 10,000-word text. The paper employs dozens of phrases such as: a possible explanation; the authors believe; can only be conjectured; probably, may, may be, could be; appear to have; seem to apply, may explain.
The three-author paper appears to be a psychological dissertation or postulation on an hypothesis and, therefore, an academic discussion, rather than a research paper. Since it isolates no variables and develops no new knowledge, it has value only in the field of discussions of possibility.
Three readings leave this capsule impression. Overfatigue is probably the special contributing factor to this high accident record. That fatigue contributes to accidents is a conclusion which has been accepted as true in the safety field for the past 50 years or more. Drivers who do not know this are doomed to accident involvement.
To one who has spent 30 years in the highway field, the remedial measures suggested are either inadequate or impractical. If the highway officials believe this concept to have merit, they could have uniformed troopers stop all out-of-state cars moving east in the late afternoon, at this section, and strongly advise a 10-minute break, to overcome hypnosis, hypoxia, fatigue, depressed cutaneous sensations, and other such phenomena.
The major merit in the paper is stated as follows: "The authors want to encourage all those who are active in accident prevention to have the concept of psychology of trip geography in mind as they consider their accident problems. This, in essence, highlights the primary objective in presenting this report at this time, admittedly without supporting evidence."
It is encouraging to note that the Institute of Transportation and Traffic Engineering is now planning a program to verify the importance of the concept and
18
provide direction for specific remedial actions.
It has long been known that the weakest aspect of the vehicle-road-driver combination involves basic shortcomings of the driver. It is to be hoped that the study program suggested can contribute new and definite knowledge about such shortcomings in a way that can be reliably accepted as true by the public and leaders in the field of highway safety. The paper falls far short of this goal, as stated by the authors.
T.W. FORBES, NRC Committee on highway Safety Research^ — The formulation of an hypothesis for a particular problem based on information from other areas of scientific research is one of the fundamental first steps which has often led to research in a new direction and resulted in new information. The authors have formulated such an hypothesis regarding possible causes of accidents on a certain stretch of highway in New Mexico on the basis of fatigue and altitude effects. They have cited a wide range of studies on such effects from aviation physiology and psychology and have pointed out that these factors may be both interacting and additive. They have also called attention to certain known perfectly normal but i l lusory sensations which may play a part in highway accident causation.
This hypothesis furnishes a possible alternative explanation for what has been widely called "highway hypnosis," without accurate formulation or verification, and perhaps even with an aura of mystery. As a more straightforward explanation the authors' hypothesis seems more acceptable scientifically. To the best of the writer's knowledge, little valid evidence for true hypnotic characteristics has been shown for the wide range of driver reports to which the term "hypnosis" has been so generally and loosely applied.
The title "Psychology of Trip Geography" IS perhaps unfortunate since the impression from the title may obscure what seem to be important phases of the paper. On analysis it can be seen that the title refers only to certain details of the hypothesis, 1. e., possible reasons why drivers become overfatigued.
' The opinions expressed are those of the author personally and not necessarily of any organization with which he is connected.
Inclusion of specifications lor remedial' measures also seems unfortunate since| this might give the impression (undoubtedlyi unintended by the authors, we are sure) that they consider their statement of the hypothesis sufficient without further test. Moreover, the expedients suggested, such as signs along the highway aiid pamphlets, have not always proved very effective in other applications where they have been used.
Incidental mention m the text and Appendix Bon hypnosis somewhat uncritically introduce "highway hypnosis," "velocitiza-tion" and "hypnagogic hallucinations," apparently implying that these are true hypnotic effects. It is not very clear' whether this is part of the hypothesis or merely extraneous information.
As with all hypotheses, this one must be put to experimental test, and Appendix C gives some plans for a statistical analysis of accident records. However, it seems improbable that this approach alone will be sufficient to prove or disprove the hypothesis since numerous factors of the hypothesis may be averaged out in this type of analysis. Such an analysis may furnish some clues but for evaluation of some of the factors hypothesized, other experimental methods would seem to be indicated.
Bearing all this in mind, however, the formulation on a basis of measurable variables of an alternate hypothesis to the somewhat loose and unformulated hypothesis of highway accidents caused by "highway hypnosis" seems to the writer an important contribution toward fresh thinking and the stimulation of research.' If psychological explanations and true hypnotic effects are to be included in the hypothesis, however, the formulation should be sufficiently definite and clear to allow experimental evaluation.
SIDNEY J . WILLIAMS, Assistant to the President, National Safety Council - We may agree that the fatal accident rate on this section of highway probably is un-, usually high. We may further agree that contributing personal factors include hypoxia or mountain sickness, even in mild form at these altitudes; road hypnosis including hallucinations; and, importantly,' the cumulative effect of these and other' influences.
The novel concept presented is, of

19
course, the "psychology of trip geography." (Is this cumbersome term necessary? Why not "trip psychology?") Here is postulated a driver leaving Los Angeles for the East, intending to stop overnight at Flagstaff, then deciding to push on to Albuquerque; result, haste plus fatigue, etc., equals an accident. A plausible idea, but why didn't the authors rough-check it against the record? Did many of these accidents involve east-bound out-of-state drivers in the late afternoon or evening?
Apparently the psychology of trip geography boils down to this: many drivers try to go too far. in one day, or in one hour. Will they be dissuaded by pamphlets handed out at the state line, or by road signs to be read at 70 plus ? Hardly. By advice from their trip-planning services? Perhaps. The State of Washington has recently found that vigorous enforcement against violators (speed and other) is a potent dissuader.
Assuredly, we all need to know more about personal factors contributing to accidents. And knowledge generally starts with hypotheses. Thus we are grateful to these authors, if only for giving us something to shoot at.
HEINZ HABER, ROBERT BRENNER, SLADE HULBERT, Closure — The authors are gratified by the stimulating discussion of their paper and wish to extend their thanks to the discussors.
Williams and F orbes question the wording of the title of the concept, "psychology of trip geography." This concept pertains to the manner in which psychological aspects of driver behavior interact with trip planning and certam geographical specifications of trips. It was decided that all three terms, "psychology, ""trip," and "geography" necessarily appear in the title. The authors recognize that the concept title is somewhat cumbersome, and therefore suggest that the concept be referred to in the future as "PTG." For example, one could refer to a driver's adherence at all costs to a previously fixed trip schedule as "poor PTG adjustment."
Noble's comments support the contention that it is m order to proceed with remedial techniques that hold promise of reducing accidents. The authors are quick to agree that highway officials who are in
timately familiar with the problems of a particular accident focal point are best qualified to devise immediate remedial methods. It is desirable that careful measurements be ultimately made to verify the effectiveness of the remedial measure.
The authors believe the remarks of Forbes concerning highway hypnosis correctly emphasize their contention that " . . . there is little experimental evidence in the available literature on the subject . . . " and " . . . since so little is known about the necessary conditions for the occurrence of these phenomena specific conclusions as to their prevalence cannot be made at present."
The postulated trip to Albuquerque is only " . . . one example of the concept . . . . " If this is not recognized, the generality of the concept might not be fully understood. Overfatigue is only one accident producing condition that may engulf the driver who makes poor PTG adjustments. Many other accident producing conditions such as increased aggressiveness, impatience, speeding, etc., can be expected to result from poor PTG adjustments.
The authors are fully aware that the ideas presented in this paper have not been developed beyond the stage of hypothetical thinking. Eventually, these hypotheses must be subjected to the scrutiny of experimental research and verification. Meanwhile, however, these ideas may serve the purpose of realigning our thinking and opening a new approach to the highway accident problem. In the past, an accident on the road has been looked upon as a singular event which occurs at a certain place and at a certain time. Practically the entire work and effort that went into investigating the causes of an accident were directed toward elucidating the circumstances surrounding the vehicle, location and time of the accident, and the condition of the driver at the place and time of the accident. In practically all instances of accident investigation, the individual accident is traced back not more than a few hundred feet m space, and 30 seconds or so in time. The authors believe that accident causation should better be traced back 400 to 600 miles in space, and up to and possibly more than 12 hours in time. From this point of view an automobile accident is not considered a singular event, but the sudden
20
culmination of a series of events of which the actual accident is only the conspicuous end product. The extension of the accident causuality in space and time, of course, makes it relate to a much greater section of the highway plant, to the geography of the highway plant, to its operational characteristics, and to the manner of its use by the driving population.
In order to put the ideas surrounding psychology of trip geography to use, information is needed on the average driving and trip planning habits of the population. It IS perhaps a significant point that practically no information is available in this field. This lack of information can be explained by the fact that, in the past, investigations of accidents were confined to the immediate place and time where they occurred. The only reliable information on trip planning and execution is available through the records of truck fleets and bus companies. We do not know, however, how the average private citizen executes a trip and in what manner he uses the highway plant: m other words we do not know PTG behavior.
A second thought that comes to mind in relation to psychology of trip geography is the fact that the modern automobile in conjunction with the modern road outperforms man by a wide margin. Only 20 years ago the automobile and the road constituted a system of only moderate reliability. Trips exceeding 400 miles and 12 hours could not be made with the same ease and regularity as is possible today at any time. Before the advent of the modern luxury car equipped with balloon tires, coil springs, automatic transmissions, power steering, and power brakes, the driver could hardly over-extend his natural facilities of attention, alertness, and delicate judgment. In
other words, before he could be more or! less subconsciously overcome by mental and psychological fatigue, his natural physical fatigue, or mechanical failure of his car, or road difficulties prevented him from continuing his driving. Today, both the reliability and ease of operating a! modern car on a modern highway cause the driver to reach the limit of psychophysical performance long before there is any chance that his equipment will fail. There can be little doubt but that the great, increase in performance of our modernj transportation plant has influenced the driving and trip-planning habits of the average driver. It can be concluded that this development makes it necessary to put greatly increased emphasis on problems of mental and psychophysical fatigue, the role of tactile sensitivity in the driving task, and the natural limits of man's performance of a physically easy, but psychophysically strenuous task.
An avenue of approach to abetter understanding of the problems at hand suggests itself. (1) collection of PTG behavior in-, formation such as trip planning and ex-j ecution by the average driver in different sections of the country; (2) studies on the importance of tactile cues in the driving task; and (3) studies of psychophysical performance and limits, in relation to the driving task.
It is to be hoped that work in these research areas will lead to a better understanding of the accident problem. Research in this field requires that thej problem be considered in terms of the geography of the entire country, the! physical and engineering characteristics of the highway plant and the vehicle, and the peculiarities of the driving task in relation to known psychological behavioB patterns. ;

Rural Intersection Accidents WILLIAM J . MILLER, JR. , Traffic and Planning Engineer Delaware State Highway Department
A STUDY has been made of all the rural intersections in one state to develop information which would indicate the intersections of rural highways which have had the highest accident frequency and also the greatest number of accidents. This study was performed in Delaware by the Traffic and Planning Division of the state highway department. The information obtained is being made available for the use of enforcement agencies through state police and local police channels to engineering agencies, and educational channels.
In the study traffic-volume statistics and accident statistics for each intersection are gathered together, and by the use of key punch cards and tabulating equipment, statistical information Is gathered.
There were 2,914 intersections studied; 1,235 (25. 8 percent) out of the 4,784 accidents reported by state police during 1952 were studied, (these were the accidents occurring at intersections in the state). Tabulations were made showing the accident frequency in each county and also various tables were made showing the frequency of occurrence by intersections, by accidents, by traffic volumes, and by other features. The study pointed out the high-hazard locations and the relatively low percentage of intersections which can expect accident occurrence, particularly in the low-volume groups.
• IN Delaware, as in most of the other states in the country, the increase in the volume of traffic on highways seems to bring with it an increase in the number of vehicular accidents. The frequency with which these accidents occur and the location of the occurrences has prompted a study to develop information which would indicate the intersections in the state on rural highways which have had the highest accident frequency experience during the year 1952.
It is intended that the information obtained will be made available for the use of enforcement agencies through state and local police channels, to engineering agencies, particularly the state highway department, and to education channels with the particular thought that pointed publicity might better educate the motorists about the Intersections pointed out in this report. Thus the three E's are immediately covered, but considerable time, study, and effort will be necessary to effectively reduce any accident experiences at these or at any other intersections.
This has been a large job. Only the facts that Delaware is a small state and that traffic-volume information is readily available on each rural road and that the
cooperation of the state police in furnishing good accident information to the state highway department have made it possible for the work to be done at all, much less with the accuracy which we think is reflected in the study.
It is to be pointed out that the purpose of the study is not to develop sensationalism concerning the accident experience or the physical characteristics of the given intersections.
We are pomting at, as best we can, what has happened at each rural intersection in the state. We hope by our analysis of the accidents and the conditions which existed when they occurred, to be in a position to suggest changes which may reduce the accident frequency at the various intersections where the frequency is particularly alarming. Whether the suggestions apply to engineering, education, or enforcement, they are primarily m-tended to help our state reduce the number and severity of traffic accidents.
METHOD OF COMPILING DATA In Delaware the highway department
has under its control all rural roads in the state, and the Traffic and Planning Division of the department has kept accurate records
21

22
I I ii NEW CASTLE COUNTY
11
1 - 2 0181 237 237 021 08 00 03887 0177000 3 01 E of HockeBsm 2 - 2 0101 225 225 267 06 00 02985 0182000 3 15 W of Tyler McConnell Bridge 3 - 2 0218 334 334 333 09 00 05289 0214000 3 09 General Motors Plant 4 - 2 0348 387 387 026 05 01 03474 0253000 3 13 S of Newark 5 - 2 0237 033 033 006 55 00 43329 0288000 2 01 Basin Corner 6 - 2 0029 050 050 220 23 00 18952 0301000 2 13 Edgemoor 7 - 2 0375 003 003 340 05 00 04346 0317000 3 14 E of Chriatiana 8 - 2 0244 006 006 340 09 01 08672 0352000 3 13 S E of Newport 9 - 2 0050 023 023 043 06 00 07077 0369000 3 13 Marsh Rd and Washington St
10 - 2 0392 032 032 387 20 00 20730 0378000 2 01 Glasgow 11 - 2 0240 033 055 003 35 00 37789 0394000 2 01 Hare's Corner 12 - 2 0643 028 028 369 19 00 20887 0401000 2 01 Roger's Corner 13 - 2 0211 Oil Oil 031 08 01 08785 0401000 3 14 Limestone Rd 14 - 2 0214 Oil Oil 021 11 00 11211 0409000 2 01 Greenliank 15 - 2 0001 024 024 017 17 00 22577 0485000 2 13 Naaman's 16 - 2 0324 Oil Oil 0112 08 00 10704 0488000 3 01 N E. of Limestone Rd 17 - 2 0491 022 441 438 09 00 12917 0524000 2 13 N Bound Lane — Odessa 18 - 2 0384 032 032 005 13 01 20248 0569000 2 13 Bear 19 - 2 0633 Oil 272 333 06 00 09727 0592000 3 15 W of Price's Corner 20 - 2 0011 004 017 221 06 00 10073 0613000 3 13 Naaman's Rd and Concord Pike 21 - 2 0380 033 033 032 27 01 45941 0621000 2 01 State Road 22 - 2 0388 032 032 048 10 00 17564 0641000 3 13 X Roads - W of Bear 23 - 2 0054 004 004 210 06 00 10714 0652000 3 13 Murphy Rd and Concord Pike 24 - 2 0248 006 006 336 08 00 16460 0751000 2 02 Newport — Mam X Roads 25- 2 0055 004 203 232 07 00 15511 0809000 3 13 Blue Ball 26- 2 0584 001 030 487 05 00 12189 0890000 3 19 Paddock Restaurant - Smyrna 27 - 2 0216 Oil 271 0112 06 00 15575 0947000 2 13 Price's Corner 28- 2 0225 033 028 033 17 00 44880 0964000 2 01 S of Roger's Comer on 33 29 - 2 0016 024 024 050 08 00 23672 1080000 2 01 Claymont 30- 2 0049 024 024 502 05 00 16637 1214000 2 13 Market St and Lea Blvd 31 - 2 0637 056 056 019 08 00 27044 1234000 3 01 N C Avenue Overpass 32 - 2 0644 033 029 369 10 00 38315 1398000 4 01 Kent Manor Inn 33 - 2 0015 024 024 207 05 00 22009 1607000 2 13 Claymont 34- 2 0639 033 033 056 10 00 44960 1641000 3 01 To Memorial Bridge — Famhurst
KENT COUNTY 1 - 1 0669 289 078 078 03 00 00660 0080000 3 15 Little Masten's Comer 2 - 1 0247 046 047 048 03 00 01628 0198000 3 01 X Roads - Hartly 3 - 1 0286 027 025 024 13 00 09068 0255000 2 01 Cooper's Comer 4 - 1 0149 041 048 041 03 00 02760 0336000 3 01 Everett's Comer 5 - 1 0312 003 024 024 09 00 08371 0339000 3 01 Betty's Lunch — S of Dover 6 - 1 0015 039 009 001 12 00 13824 0420000 2 13 Mam X Roads — Smyrna 7 - 1 0304 027 026 027 03 00 03536 0430000 3 13 E of Rising Sun 8 - 1 0216 070 003 025 06 00 07600 0462000 2 01 Silver Lake — N of Dover 9 - 1 0101 007 002 088 10 00 13058 0477000 2 13 Markland's — N. of Dover
10 - 1 0310 029 024 024 05 00 06574 0480000 2 14 X Roads — E of Camden 11 - 1 0305 027 027 356 08 00 04201 0511000 3 14 X Roads — S of Moore's Lake 12 - 1 0018 041 039 454 04 00 06109 0557000 2 17 Pleasanton's Garage 13 - 1 0207 016 007 051 07 00 10763 0561000 2 13 Latex Corner — E of Dover 14 - 1 0016 039 039 065 04 00 06421 0586000 2 15 Smyrna — Commerce and Main 15 - 1 0701 005 006 060 05 00 08348 0609000 2 01 X Roads — E of Harrington 16 - 1 0608 005 034 057 05 00 08402 0613000 2 13 X Roads — E of Felton 17 - 1 0835 024 024 105 03 00 05534 0673000 3 14 W. ofStarhill 18 - 1 0837 005 031 032 04 00 07568 0691000 3 13 X Roads — Canterbury 10 - 1 0124 154 1020 002 03 00 05329 0709000 3 14 N of Melody Club 20 - 1 0044 043 001 001 03 00 06098 0742000 3 13 Welfare Home — Smyrna 21 - 1 0284 071 003 003 03 00 06250 0760000 4 13 Dover —Wyoming Ave AGoveraor'sAve 22 - 1 0211 007 024 007 06 00 13404 0815000 5 01 S. of Loockerman St Ext —E Dover 23 - 1 0103 014 002 045 04 00 12297 1122000 3 13 Bishop's Comer
E USSEX COUNTY 1 - 3 0474 013 013 4040 15 00 06983 0170000 3 01 S of Bridgeville 2 - 3 0210 016 016 013 13 00 07124 0200000 4 13 X Roads — Greenwood 3 - 3 0605 024 024 248 07 00 04022 0210000 3 13 N of MiUsboro Pond 4 - 3 0218 016 016 036 03 00 01784 0217000 3 09 E of Greenwood 5 - 3 1111 052 052 382 03 00 01972 0237000 3 09 Roxana 6 - 3 0447 013 013 040 07 02 05361 0280000 3 13 E of Bridgeville — Entire 7 - 3 0308 014 014 018 05 00 05186 0379000 4 01 Wescoat's Corner — Lewis 8 - 3 0966 113 334 337 04 00 04320 0394000 3 14 % Way — MiUsboro and Dagsboro 9 - 3 0757 113 113 432 03 00 03424 0417000 3 13 W ofStockley
10 - 3 0716 113 113 339 04 00 04834 0441000 3 14 S of MiUsboro 11 - 3 0320 014 024 270 04 00 05115 0468000 3 06 Way — Lewes and Rehoboth 12 - 3 0567 113 113 018 03 00 04294 0522000 2 01 N W of Georgetown 13 - 3 0586 113 113 028 03 00 04496 0547000 2 01 W of Georgetown 14 - 3 0821 113 113 020 03 00 04553 0554000 4 13 N of Bett's Pond — MiUsboro 15 - 3 0494 014 014 0140 03 00 04705 0572000 3 14 W of Rehoboth 16 - 3 0336 014 014 274 03 00 04831 0588000 3 13 Midway 17 - 3 0922 0130 0130 485 04 00 07458 0681000 3 IS Way — Laurel and Sealord 18 - 3 1236 0130 0130 024 05 00 09950 0726000 2 13 X Roads — Center of Laurel 19 - 3 0859 0130 0130 534 03 00 06006 0737000 4 14 N ofSeaford 20 - 3 0627 013 013 046 03 00 06166 0750000 3 14 X Roads—N of Clear Brook—S B 21 - 3 0890 0130 0130 020 04 00 10649 0972000 2 09 Blades, Delaware 22 - 3 1207 0130 0130 028 03 00 09346 1137000 3 13 N. Laurel Limits

23
TABLE 2 TRAFFIC AND ACCIDENT PICTURE AT ALL RURAL INTERSECTIONS
County
Number of intersections
Number of Accidents
1952
Average Traffic Per Intersection for Year 1952
Average Number of Vehicles
per Accident 1952
Total Number
of Vehicles 1952
Percent of Total
Intersections
Percent of Total
Accidents
Percent ol Total
Vehicles Kent 819 254 446,700 1,440,300 365,829,000 28.1 20 6 19 9 New Castle 625 672 1,413,800 1,314,900 883,632,000 21 5 54 4 48,2 Sussex 1,470 309 398,800 1,897,000 586,168,000 SO. 4 5 0 31.9 Total State 2,914 1,235 629,900 1,486,300 1, 835,629,000 100.0 100.0 100.0
for several years of the traffic-volume changes which occur on these highways.
Also, for several years the Traffic and Planning Division has received copies of state-police records so that copies of all accident reports are on file in this office. When these reports are received, in their order of occurrence, the information is cross-filed so that the number of accidents on specific roads is known.
Thus, we have the two-most-important pieces of information for this study: traffic volumes on rural roads and the accident reports for the same roads.
It is for this reason, particularly, that the study is limited to rural intersections. The study does not include intersections in urban areas or in other large incorporated towns. It does not include intersections where suburban streets intersect rural highways. At these latter locations, where the accident information is generally available, the traffic information is not. Also, details of accumulating 3uch information would be tremendous and 3eyond the scope of this project
During the course of this study each rural intersection in the state was assigned
a number. A tabulation was made which contained the county, the intersection number, the numbers for the roads making the intersection, the number of accidents occurring at the intersection in 1952, the number of fatalities occurring at the intersection in 1952, the 1952 24-hour annual average traffic volume entering the intersection (obtained by dividing by two the 24-hour annual average volume for each leg of the intersection, then adding these half-leg totals together), the accident rate or the number of vehicles entering the intersection per year for each accident which occurred (the yearly traffic divided by the number of accidents which occurred), the type of traffic controls present (stop sign, traffic signal, etc.), and the system class of the intersection (two primary roads, a primary and a secondary road, etc.).
When the information was obtained for the three counties, it was coded and then punched on IBM punch cards for analysis purposes. Thus, it can be seen that the routine usedfor accumulating the information was relatively simple and yet quite tedious.
TABLE 3
NUMBER OF INTERSECTIONS BY NUMBER OF ACCIDENTS FOR ALL INTERSECTIONS Average Number Total
Number of Number of Total Average Traffic of Vehicles Number Accidents Intersections Accidents Per Intersection per Accident of Vehicles
None 1 2 3 4 5
10 11 - 15 16 - 20 21 -30 31 - 40 41 - 50 51 - 60
Total
2,388 331 90 36 19 10
2,914
1952
331 180 108 76 50 48 28 48 36 40 77 73 50 35
55 1,235
1952 355,800
1,210,500 1,828,900 2,273,500 2,984,600 3,544,700 3,520,100 3,253,700 5,508,700 3,216,500
10,393,000 4,164,700 9,954,000
11,843,000 13,793,000
15,815,000 629,900
1952
1,210,500 914,400 757,800 746,100 708,900 586,700 464,800 688,600 357,400
1,039,300 324,500 545,400 473,700 394,100
287.500 1,486,300
(798,400)
1952 849,590,000 400,677,000 164,598,000 81,846,000 56,707,000 35,447,000 28,161,000 13,015,000 33,052,000 12,866,000 41,572,000 24,988,000 39,816,000 23,686,000 13,793,000
15,815,000
Percent Percent Intersections Accidents
81 90 11.40 3 10 1 20 .70 40 30 10 20
.10
.10 20 15
.15
1,835,629,000 100.00
26 8 14.6 8 7 6.2 4.1 3.9 2.3 3 9 2.9 3.2 6.2 5.9 4 1 2 8
4.4 100.00
Percent Total
Vehicles 46 3 21.8 9 0 4.5 3.1 1.9 1.5 .7
1.8 7
2.2 1.3 2.2 1.3
100.0

24
CLASSIFICATION AND EVALUATION OF DATA
The tabulated information which had been punched on cards was sorted into three county groups and, in some instances, statewide groups which were the basic working arrangements. The information which follows was then obtained from the punched cards. Obviously, other data could be determined and still can be if the need presents itself.
Z& 1
206 19 9
the intersection for each accident that occurred and the last 1,122,000 cars entered the intersection for each accident whichi occurred.
In Sussex County the listing contains 22 intersections, representing those at which three or more accidents were reported as having occurred in 1952. The first intersection listed indicates that 170,000 cars entered the intersection for each accident and the last 1,137,000.
In order to obtain workable groups and
50 4
*:«•:•:
:i-:-:-K-a
KENT COUNTY NEW CA5TLE COUNTY SUSSEX COUNTY
- PERCENT OF E U R A L INTERSECTIONS IN S T A T E
- P E R C E N T OF R U R A L INTERSECTION A C C I D E N T S IN S T A T E .
- P E R C E N T OF TOTAL VEHICLES ENTERING INTERSECTIONS IN EACH COUNTY.
Figure 1. T r a f f i c and accident picture at a l l rura l road i n t e r sections, 1952.
Table 1 lists information by counties showing the order of occurrence of accident frequency from the highest frequency, or most occurrences per number of vehicles entering the intersection, to the lowest frequency.
The New Castle County listing contains 34 intersections, representing those at which five or more accidents were reported as having occurred in 1952. The first intersection listed shows that 177,000 cars entered the intersection for each accident which occurred, while at the lower end of the table more than 1,641,000 vehicles entered the intersection for each accident which occurred.
In Kent County the listing contains 23 intersections, representing those where three or more accidents were reported as having occurred in 1952. The first intersection indicates that 80,000 cars entered
realistic results, it was necessary to eliminate intersections from these listings which showed high frequencies with perhaps one or two accidents accompanied by low traffic volumes. Thus, the limit^ described above were arbitrarily set. The intersections with the low frequencies are eliminated from this part of the study bul not from the whole study and certainly noi from consideration when means for accident prevention are explored.
Table 2 is a traffic-and-accident tabU by counties at all rural intersections showing the intersections, number of accidents average traffic per intersection, and average number of vehicles per accident This table shows that there are 2,914 rural intersections in Delaware and that 1,23! accidents were reported as having occurret at these intersections in 1952.
An analysis of the percentages showi

25
70
40
O . i o o o lOeO'Zfoo 2Soo.Soao sooo-Jfioo tfioo-topoo lOaoo-ISOoo tSflac-700oo ZOflOo-sttfiea 3aflM-4v»> A^tMO
^ - PERCENT OF RURAL \ N T E R S E C T I O N S IN S T A T E .
- P E R C E N T OF R U R A L I N T E R S E C T I O N A C C I D E N T S IN S T A T E .
- P E R C E N T OF TOTAL VEHICLES ENTERING mTER5ECTI0N5 IN STATE.
Figure 2. Rural intersect ions by t r a f f i c groupings showing comparison of percent of i n t e r s e c t i o n s , percent of acc idents , and
percent of total vehicles , 1952.
on the table is indicated in Figure 1. A close relationship exists between the percentage of accidents occurring at intersections in each county compared with the percentage of vehicles entering inter
sections in the counties. There are indicated close relationships between traffic volumes and numbers of accidents but little relationship between numbers of intersections and numbers of accidents.
AVERAGE NUMBEE OF V E H \ C L E S PER ACCIDENT
2,000,000
1,500,000
1,000,000
500,000 lllllll... 0 - 1 0 0 0 ipoo-ZSOO 2SOO,saao Sooa-7soa ISOo-nwio lopoo-IBfloo tsaoo-20peo 70oae-3^»oo 3tioaa-4«ooa 4o,ooo~Soo9o
T R A F F I C VOLUME G E O U P S ENTERING BURAL INTEBSECTIONS ^
Figure 3. Rural intersections by t r a f f i c volume groupings showing average number of vehicles entering m t f rsections per accident in
each group, 1* 52.

26
Table 3 is a statewide table showing the number of intersections by the number of accidents. There were 2,388 rural intersections (81. 9%) in the state at which no accidents were reported as having occurred. Of the vehicles entering intersections in the state, 46. 3 percent were represented at these accident-free intersections. It also shows that the intersection with zero or one accident together represent 93. 3 percent of the rural intersections in the state.
A tabulation (Table 4) where the number of accidents are paired with the number of intersections at which they occurred has been made from Table 3. There is, of course, a consistent dropoff in the number of intersections with high accident occurrences and a dropoff in the number of intersections with high volumes of traffic.
TABLE 4 NUMBER OF INTERSECTIONS BY NUMBER OF ACCIDENTS,
ALL RURAL INTERSECTIONS, 1952 Number of Accidents Number of Intersections
None 2,388 1 331 2 90 3 36 4 19 5 10
Q 6 7
0 4 8 6
9 4 10 4
11 - 15 6 16 - 20 4 21 - 30 2 31 - 40 1 41 - 50 None 51 - 60 1_ Total 2,914
Table 5 is a statewide table showing all rural intersections by traffic groupings. These traffic groups represent the 24-hour annual average traffic entering the intersections.
From Table 5 we made up Figure 2, which indicates that there was a close relation between the percentage of accidents and the percentage of vehicles entering intersections in the various traffic volume groups. In the three-highest-volume groups, the percent of accidents strays more from the close relation indicated in the lower groupings where the percentages agree closely.
A point of great interest seems here to be that the elimination of 0. 55 percent of the intersections (16) would eliminate 20. 3 percent of the intersection accidents.
This information is more-strikingly pointed out by Figure 3, where the average
number of vehicles entering the intersection per accident were paired with traffic volume groups. In the study, the intersection with the greatest number of vehicles entering intersections per accident, as far as traffic groups are concerned, is in the group where 7,500-9,900 vehicles enter per day. Also, there is a decided drop in the number entering per accident in the groups over 20,000 per day. These groups are the 0. 55 percent of the intersections referred to a short time back where 20.3 percent of the intersection accidents occurred.
This could be a good take off point to set up a priority list of intersections to be eliminated, remembering that some of these intersections have relatively good frequency rates and others relatively poor. The accident-frequency occurrence, and the related property damages and injuries, plus the normal inconveniences and delays inherent in high-volume intersections would certainly point to a separation as the logical solution in many cases.
SUMMARY A total number of 2,914 intersections
is included in this study. This represents the number of rural highway intersections in Delaware.
The total number of accidents occurring at these intersections was 1,235 in 1952: (1) Kent County had 819 intersections, 254 accidents at these intersections; (2) New Castle County had 625 intersections, 672 accidents at these intersections; and (3) Sussex County had 1,470 intersections, 309 accidents at these intersections.
The total number of vehicles in 1952 entering the 2,914 intersections was 1,835,629,000. This is an average of 629,000 per intersection, and an average of 1,486,300 per accident.
There were no accidents reported at 2,388 of the 2,914 intersections in 1952.
At the 526 intersections where at least one accident occurred, the total number of vehicles for 1952 was 986,039,000, an average of 1, 874,600 per intersection, and an average of 798,400 per accident: (l)Kent County had 134 (25.4 %) inter-1 sections with at least one accident, and 20. 5 percent of the intersection accidents occurred in this county; (2) New Castle County had 196 (37. 3%) .intersections with

27
at least one accident and 54. 4 percent of the intersection accidents occurred m this county; and (3) Sussex County had 196 (37.3%) intersections with at least one accident, and 25.1 percent of the intersection accidents occurred in this county.
cent of the accidents, and 9. 6 percent of the total vehicles of all intersections. All of these intersections are in New Castle County.
The study, so far as it has gone, has determined the intersections in each county which have had the most accident occur-
TABLE 5 NUMBER OF INTERSECTIONS BY TRAFFIC GROUPINGS FOR ALL INTERSECTIONS
Traffic Groups Number of Accidents - Daily - Intersections 1952 1952 Less than 1,000 1 ,987 145 111,700 1,000-2,499 382 139 567,100 2,500-4,999 244 189 1,272,900 5,000-7,499 133 171 2,223,400 7,500-9,999 72 116 3,038,700 10,000-14,999 55 136 4,412,200 15,000-19,999 2S 88 6,182,400 20,000-29,999 10 97 8,164,600 30,000-39,999 2 45 13,889,000 40,000-49,999 4 109 16,344,800 50,000-59,999 - - -
Total 2,914 1,235 629,900
Average Number Total Average Traffic of Vehicles Number Per Intersection per Accident of Vehicles
1952
1,530,300 1,558,400 1,644,700 1,729,300 1, 886,100 1,784,400 1,756,400
841,700 617,300 599,800
Of the 2,914 intersections there were 1,987 (68. 2%) where less than 1,000 vehicles entered the intersection daily. Only 145 (11. 7fo) accidents at these intersections: (1) In Kent County 648(79.1%) intersections out of 819 had an average daily traffic of less than 1,000; there were 54 (21. 3%) accidents at these intersections; an average of 1,298,900 vehicles per accident for 1952, (2) In New Castle County 290 (46.4%) intersections out of 625 had an average daily traffic of less than 1,000; there were 30 (4.5%) accidents at these intersections; an average of 1,145,900 vehicles per accident m 1952. (3) In Sussex County 1,049 (71.4%) intersections out of 1,470 had an average daily traffic of less than 1,000; there were 61 (19. 7%) accidents at these intersections, an average of 1,924,200 vehicles per accident for 1952.
There was a total of 4,784 accidents reported by state police during 1952; 1,235 (25. 8%) of these accidents were at intersections, not including accidents occurring in Wilmington.
New Castle County, with a figure of 910,100, had thehighestnumber of vehicles entering intersections per accident of the three counties. The state average was 798,400. Intersections with accidents only.
Statewide intersections with an average daily traffic of over 20,000 represented
percent of the intersections, 20, 3 per-
1952
221,892,000 216,617,000 310,584,000 295,715,000 218,786,000 242,673,000 154,559,000 81,646,000 27,778,000 65,379,000
Percent Percent Intersections Accidents
Percent ToUl
Vehicles
68 20 11.7 12.1 13 10 11 3 11.8 8.37 15.3 16.9 4.56 13.8 16.1 2.47 9.5 U.9 1.89 11 0 13.2
86 7 1 8.4 .34 7.9 4 5 07 3.6 1 5 14 8 8 3.6
100 00 100.0 100.0 1,486,300 1,835,629,000 100 00
rences in 1952 and, also, those intersections where the frequency of accidents has been greatest. The information is intended to enable us to concentrate our best efforts to reduce or eliminate any vehicle hazards or conditions which could cause the accidents, and to advise as many people in and out of our state to operate their vehicles in accordance with the conditions which exist particularly at these locations, as well as on all other roads in the state. It is not felt that the accident experience in Delaware for intersections can be considered bad. The study Indicates 93.3 percent of the intersections had one or less accidents in 1952. It would be well if this could be said for all the intersections. It is for this type of performance which we strive.
CONCLUSION The results of the Delaware 1952 Rural
Intersection Accident Study were presented to the people in Delaware in a somewhat different form than that which is being presented here. For the local purposes the five intersections in each county which had the most-serious accident frequencies were discussed in detail and sketches of the intersections were presented showing the number and types of accidents which occurred.
In Delaware as a result of the study it was recommended that the state police be
28
furnished copies of the report and that they be instructed to keep under constant surveillance the activities of the motor-vehicle operators as they approach the intersections which have the highest accident frequencies in each county.
It was recommended that the state highway department promptly act upon the intersections which can be assisted by good engineering practices. Particular attention should be given to the construction of separate roadways where heavy traffic volumes cross. The campaign for having controlled access legislation in the states should be vigorously pursued, since the report indicated that this type of highway construction will positively reduce the number and frequency of accidents on Delaware highways.
It was recommended that copies of the report be made available to the press, < radio and television stations, to the Delaware Safety Council, to the Governor's Highway Safety Committee, and to other interested commercial and industrial industries irx order that widespread interest and knowledge concerning the conditions at the intersections studied might be attained.
In the end the responsibility for accidents rests primarily with the driver. The accidents are caused. They do not just happen. This is merely another phase' in the education of the motor-vehicle operator. He now knows in Delaware the intersections at which most accidents havei occurred and should be in abetter position to adjust himself accordingly.

Effect of Shoulder Width on Accidents on Two-Lane Tangents O. M. BELMONT, Associate Research Engineer Institute of Transportation and Traffic Engineering University of California
California accident records for 1948 were examined for the relation between shoulder width and accident occurrence on two-lane tangents. For similar traffic volumes, shoulders 6 feet wide were safer than narrower shoulders and, also, (at volumes over 5,000 vehicles per day) safer than wider shoulders.
# THE purpose of this study was to examine the relation between highway shoulder widths and accident occurrence on two-lane tangents. The California Division of Highways made the study possible by providing, for two-lane roads of the California Interstate Highway System, the number of accidents reported for 1948, the corresponding shoulder and lane widths, and estimates of traffic volume.
The data used were for rural road sections, with 55-mph. speed limit, of bituminous or concrete pavement, without structures or intersections (except private driveways), and predominantly straight and level. Some curves are included, but sections containing many or severe curves have been eliminated. The study is limited to paved or treated shoulders, some being of concrete but the large majority bituminous. It is believed that in all cases the shoulders were visually distinguishable from the roadway proper. Included are 533 miles of road, on which 1,333 accidents were reported for 1948.
The road sections were grouped by traffic volume and shoulder width as shown in the Table. (Groups with a mileage of less than a mile have been omitted.) From the 46 points listed, the following regression equations^ were obtained
= .4766 + . 02202
V A = -. 0567 (if S<6')
+ . 02287 V v m + . 3175 (1)
V m (2)
v T = . 1 0 1 8 +.01971 + .4514 Vm (if S<6') + .005485 V v m (if S>6', andv> 5000) (3)
'The square root of the number of accidents was chosen as the dependent variable because of its nearly constant variance, very desirable m regression analysis.
Where A = number of accidents V = average daily traffic volume m = length of the road section S = shoulder width
Values of V5"givenby Equation 1, which does not give effect to shoulder width, and by Equation 3, which does, are shown in Table 1 for comparison with the observed values of VK.
For Equations 1, 2, and 3, the values of the correlation index R* are 0. 824, 0. £56, and 0. 900 respectively. The difference in the first two values shows a significant^ tendency, in the data analyzed, for accident rates to be lower on roads having shoulders of 6 feet or more than on roads with narrower shoulders. The difference m the last two values shows that, for traffic of over 5,000 vehicles per day, accident rates were significantly lower with 6-foot shoulders than with wider shoulders.
The analysis considers only three shoulder widths: less than 6 feet, 6 feet, and more than 6 feet. (Preliminary i n vestigation indicated that the data are too erratic to permit study of finer distinctions in width). It should be emphasized that the comparison is between 6-foot shoulders and the entire group of widths below, or above 6 feet. It cannot be directly deduced that the 6-foot shoulders were safer than 5-foot or 7-foot shoulders.
Figure 1 shows the observed relation between accident rates and the three categories of shoulder width, consolidating the data of Table 1. The corresponding values given by Equation 3 are shown in Figure 2. A warning may be useful: Even if the
'The F test shows that the difference inR* is significant at thi 0 01-level for Equations 1 and 2 and at the 0. 001-level for Equations 2 and 3.
29

30
theoretical relations are fundamentally sound, the values found for the constants in the equations are subject to error because of the large difference between reported and actual accident rates.
It may be seen in Figure 1 that for comparable traffic volumes, accident rates for 6-foot shoulders were (1) uniformly lower than for narrower shoulders and (2) at volumes over 5,000 vehicles per day, lower than for wider shoulders.
Preliminary investigation indicated that the data would not yield an effect of lane width on accidents. Table 1 indicates lane widths (showing pavement widths as rounded averages per mile), and a glance at the column may suffice
to show that the effects attributed to shoulder width are not due to differences in lane width.
It is easy to find reasons why shoulders of about 6 feet should be safer than narrower shoulders. Very narrow shoulders may induce drivers to keep away from the pavement edge (2) reducing clearance between passing vehicles. Narrow shoulders certainly restrict emergency maneuverability. Shoulders narrower than about 6 feet may prevent parking off the roadway. But these reasons do not imply much gain in shoulders wider than about 6 feet. It is true that trucks may need as much as 8 feet for parking, and that additional width may be useful in working on a disabled vehicle. But shoulders wider than
TABLE 1 ACCIDENT DATA GROUPED BY TRAFFIC VOLUME AND SHOULDER WIDTH
Average Shoulder Average No of Miles Accidents Daily Traffic Width
f t . Pavement
Width Accidents Per Mile
VA from VA"from V S L A m A/m V X Equation 1 Equation 3
500-900 8 24 1 5.7 2 1.0 1.9 1.3 1,000-1,400 2 22 3 4.0 .7 1 7 2.0 2.4
10 20 1 3.2 3 1 0 1.8 1.3 11 22 2 7.5 .3 1.4 2.6 2 0
1,500-1,900 2 21 7 6.1 1 1 2 6 2.7 3.2 3 21 44 22 3 2.0 6 6 4.8 6 1 4 22 7 3.0 2.3 2.6 2.0 2 3 5 20 22 10 7 2 0 4. 7 3.4 4 3 8 22 50 68 4 .7 7 1 8.0 6. 8
2,000-2,900 3 20 49 12.6 3.9 7.0 4.2 5 0 4 20 7 5.7 1.2 2.6 2.9 3.4 5 22 22 14.2 1.6 4.7 4.4 5.3 6 21 10 14 7 .7 3 2 4.6 3. 8 7 20 3 1 1 2.6 L 7 1.6 1.1 8 24 25 56 8 .4 5.0 8.3 7.1
3, 000-3,900 4 22 21 13.5 1.6 4 6 5.2 3 9
6. 0 5 27 14 6.5 2.2 3. 7
5.2 3 9 4 3
6 20 39 26 8 1 5 6. 2 7.0 6. 0 8 21 49 34 6 1 4 7 0 8.0 6. 8
4,000-4,900 4 28 14 4 9 2.9 3.7 3 6 3.9 5 16 11 2 7 4 0 3. 3 3.0 3.1 6 23 35 11 1 3 1 5. 9 5.3 4 4 7 21 2 1 2 1.6 1 4 2. 1 1. 5 8 20 52 24 3 2.1 7 2 7.8 6.7
5,000-6,400 3 20 41 8 6 4 8 6 4 5.6 6. 0 6 36 26 9.5 2.7 5 1 5.4 4. 5 7 20 36 9 4 3.8 6.0 5.7 6. 0 8 21 84 20 9 4.0 9.2 8. 1 8.8
6,500-7,900 2 20 12 1.0 12 0 3 5 2.3 2. 2 3 18 51 9.5 5.4 7. 1 6.3 6. 7 4 21 15 3 5 4.2 3 9 4.1 4. 2 5 22 15 2.6 5. 8 3 9 3.6 3. 6 7 22 57 8 4 6.8 7.5 6.0 6.4 8
10 20 64 17 5 3.7 8.0 8.3 9 0 8
10 20 9 1.5 6.0 3.0 2.8 2 7 8,000-9,400 2 20 35 5.5 6.4 5 9 5.3 5.5
3 19 53 9 9 5.3 7.3 6.9 7. 2 4 20 10 3.6 2.8 3.2 4.3
6.2 4. 3
6 20 35 7.9 4.5 5.9 4.3 6.2 5. 2 8
9 20 110 22.7 4.8 10. 5 10.1 11.1 8
9 '20 9 3.4 2.6 3.0 4. 2 4. 3 10 20 15 1 7 8.6 3.9 3.2 3.2
9,500-10,900 8 20 138 18.2 7 6 11. 7 9.9 i a 9 11,000-12,400 2 20 8 1.1 7.1 2.8 2.9 2. 8
6 20 12 3.2 3.8 3.5 4.8 4. 0 10 20 8 1.1 7.5 2.8 3.0 3.0

31
r h
/ y y
/ < / / *
—0 5>e' D S = 6'-A 5 < 5' r
J
—0 5>e' D S = 6'-A 5 < 5'
2 3 4 5 6 7 8 9 10 If 12 13 Average Daily Traffic-thousands
F i g u r e 1. Observed r e l a t i o n between a c c i d e n t r a t e s and shoulder widths.
8
t j o S >e' Q S =
< B
o S >e' Q S =
<
/ 7 : < a / / / 9 1
Figure 2.
Average Daily Traffic-thousands
H i e o r e t i c a l r e l a t i o n between accident r a t e s and shoulder widths.
about 6 feet may have serious disadvantages. For example, in congested traffic they may be used for passing on the right.
Such considerations lend support to the conclusions reached by the statistical analysis. The data analyzed contain, however, several weaknesses — some curves are included, for example, and there is a scarcity of 6-foot shoulder points at high volumes. The conclusions must therefore be regarded as being far from def
initely established. It may be noted that they receive considerable confirmation from Raff's results (1.), which also point to an optimum shoulder width somewhere between 5 feet and 8 feet. The negative conclusions reported by Raff are apparently based on the absence of a significant linear relationship between accident rates and shoulder widths. This would be quite compatible with the more-complicated relationship found in the present paper.

32
R E F E R E N C E S Board, 1953. Table 9, p. 28. 2. Taragin, A, and Eckhardt, H. G . ,
"Effect of Shoulders on Speed and Lateral 1. Raff, Morton S . , "Interstate High- Placement of Motor Vehicles," Proceed-
way-Accident Study," in Traffic-Accident Ings, Highway Research Board, v. 32, Studies, Bulletin No. 74, Highway Research 1953, p. 371-382.

Effect of Enforcement on Vehicle Speeds JAMES STANNARD BAKER, Director of Research Traffic Institute, Northwestern University
As a deterrent to people who would otherwise drive faster than the law permits, police activity on the highway is believed to work in three ways: (1) the visible presence of a patrol unit presents the immediate possibility of enforcement against violators at that time and place; (2) the general belief that speed laws are enforced on a highway will deter drivers from exceeding the legal speed limits, even if no patrol unit is known to be in the vicinity; (3) a general belief that traffic laws are enforced in a community or other area will stimulate compliance with the speed laws in that community.
Pilot studies have been made at the Traffic Institute, Northwestern University, in a cooperative project with the Bureau of Public Roads to e:Q>lore questions raised by the first and third effects of enforcement on speeds mentioned above.
Various methods of measuring the speeds of vehicles were studied, and It was found that two types of recording speed meters were suitable.
Of six different means of describing speed considered, it was decided that the most practical for the purpose of the study is the average excess speed, which is the sum of the amount by which each vehicle exceeds the speed limit divided by the total number of vehicles.
Studies were made of the effects on average excess speed of both a standing patrol unit and a moving patrol unit for traffic within limited distances from the unit. Studies also were made of vehicle speeds in Chicago before and after a substantial increase in the level of law enforcement.
• TRADITIONALLY the legislative branch of government has established maximum speeds for various types of roadways; the executive branch, as represented by police agencies, has the responsibility of arresting drivers who exceed these speeds; and the judicial branch has had the duty of penalizing such violators. In some places the establishment of speed zones has been delegated by the legislative branch of government to traffic engineers in the executive branch.
From the administrative (police) standpoint, we are interested in knowing how much and what kind of activity will be necessary to fulfill the obligations imposed by legal speed limits on the administrative and judicial agencies and what effect such enforcement will have on the accidents which speed laws are Intended to prevent.
As a deterrent to people who would otherwise drive faster than the law permits, police activity on the highway is believed to work in three ways:
1. The visible presence of a patrol unit oresents the immediate possibility of en
forcement against violators at that time and place. A question arises as to how far from the patrol unit such influence extends; in other words, what is the "halo" of law observants surrounding a standing or moving patrol unit. A secondary question arises as to the relative effectiveness of patrol units of various degrees of recognized ability.
2. The belief on the part of drivers that speed laws are enforced on a highway will deter some drivers from exceeding the legal speed limits, even if no patrol unit is known or believed to be in the vicinity. How much enforcement is necessary to produce such a belief to the extent necessary to get a given degree of compliance with the law ? A second question arises as to how long it will take after enforcement is applied for driver behavior to be affected and how long the law observance will continue after enforcement activity has ceased.
3. A belief that traffic laws are enforced in a community or other area, will stimulate compliance with all laws, including the speed laws, in that community.
33
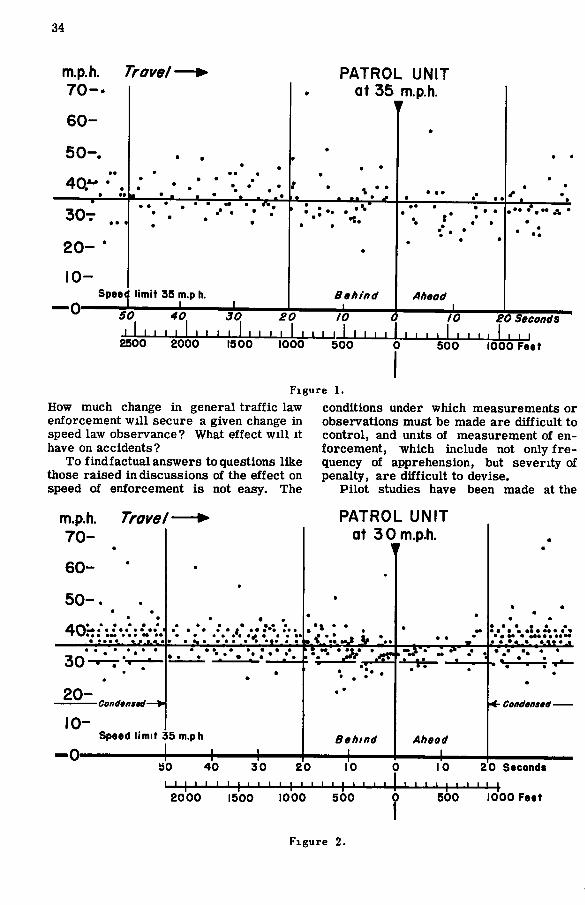
34
m.p.h. Travel- P A T R O L U N I T 7 0 - .
6 0 -
5 0 -
• ••
• • • •• . • • • • • * • • • • " • • •
e L-i i • • - -*
a t 3 5
• •
• • •
t • ^ • •
m.p.h.
•
• • • •
• « •
• •
3 0 T
• • •
2 0 - *
1 0 -Speec
— 0 4
. • • . • • • . : • • • • . •
limit 35 m.p h. 1 1
' . * : • . . . • . •«•
•
Behind 1
• • • •
. • • . .
Ahead
—* i * • • • • • • • A • •
• . :
' I ' I • I I • • • ' I I ' ' ' I • ' • • I r I I I I I 2500 2000 1500 1000 500
I I I I I I I _l_J_l 500 1000 Feet
F i g u r e 1.
How much change in general traffic law enforcement will secure a given change in speed law observance? What effect will it have on accidents?
To findf actual answers to questions like those raised in discussions of the effect on speed of enforcement is not easy. The
Travel-m.p.h. 7 0 -
6 0 -
5 0 - .
• • • • • • • • • •
conditions under which measurements or observations must be made are difficult to control, and units of measurement of enforcement, -which include not only frequency of apprehension, but severity of penalty, are difficult to devise.
Pilot studies have been made at the
P A T R O L U N I T a t 3 0 m . p . h .
J •.: L.
> • • • • • !• a • • • • • • • • « • • •• • •••• . •••• ' . • . • A . * . . M f . t
3 0 -
2 0 -Condtnstd- • CondMsad-
1 0 -Speed limit 35 m.ph
• 0 1 h Behind Ahead
A-bO
i-L. 40 I I 1
30 20 I ' I ' ' '
10 10 20 Seconds I I I I I I I I I I I I
2000 1500 1000 500 500 1000 Feet
F i g u r e 2.

35
traffic institute in a cooperative project with the Bureau of Public Roads to explore questions raised by the first and third effects of enforcement on speeds mentioned above, namely: (1) the effect of a patrol
the amount of law violation. First there was a problem of economically measuring vehicle speeds with enough accuracy, particularly at the higher speeds which are of primary interest in studies of this kind.
Cars 0 to 1025 feet ahead 50
• 10
Patro/ at speed limit
y\
- Jr / ^ —Normal ^ y
30 40 50 Miles per hour
50 CorsO to 900 feet a heed
f z o h
1
V 1 # P f l l r o J S P e t d
w — s p e e d l i m i t
M m * \ NernMl
t P ^ - l — -20 30 40 50
Miles per hour 60
Cors Oto 1025 feet behind Cors 0 to 900 feet behind 50
§40
•5 20 « >
-*—Patrol at speed limit
30 4.0 50 Miles per hour
P o f r o / S p e e d
Speed i i f f l i t O 40
Normal
30 40 50 Miles Per hour 60
50 Cars 1025 to 2530feet behind
Patrol at
i s speed limit
: / Normal
J
"20 30 ^ 50 Miles per hour 60
Cors 900to2200 feet behind P a t r o l SpMd
Speed
o r m a l
30 4 0 -5 0 Milts per hour 60
Figure 3. F f f e c t of p a t r o l motorcycle moving at speed l i m i t on v e h i c l e s within s i g h t .
unit on speeds of nearby vehicles and (2) effect of increased enforcement on vehicle speeds m Chicago.
MEASUREMENTS OF S P E E D LAW VIOLATIONS
Much of the effort in these studies went into finding suitable means of measuring
Figure 4. F.ffect of p a t r o l motorcycle moving at 5 mph. below speed l i m i t on v e h i c l e s
w i t h i n s i g h t .
Hand timing with stop watches was found unsatisfactory, especially where traffic volumes are high. Two types of recording speed meters appeared to be most suitable: (1) the radar meter where traffic volume is low and (2) a specially designed device, not commercially available, operating from road tubes. Automatically
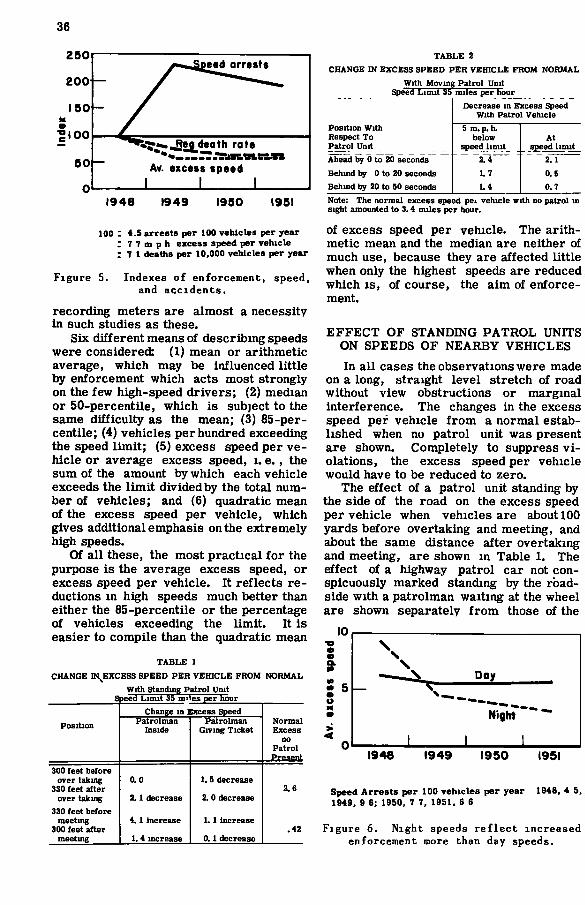
eed arrests
^ •^^y^dea th rate
Av. excess speed
1948 1949 1950 1951
ICQ : 4.5 arrests per 100 vehicles per year : 7 7 m p h excess speed per vehicle : 7 1 deaths per 10,000 vehicles per year
F i g u r e 5. Indexes of enforcement, speed, and a c c i d e n t s .
recording meters are almost a necessity in such studies as these.
Six different means of describing speeds were considered: (1) mean or arithmetic average, which may be influenced little by enforcement which acts most strongly on the few high-speed drivers; (2) median or 50-percentile, which is subject to the same difficulty as the mean; (3) 85-per-centile; (4) vehicles per hundred exceeding the speed limit; (5) excess speed per vehicle or average excess speed, i . e., the sum of the amount by which each vehicle exceeds the limit divided by the total number of vehicles; and (6) quadratic mean of the excess speed per vehicle, which gives additional emphasis on the extremely high speeds.
Of all these, the most practical for the purpose is the average excess speed, or excess speed per vehicle. It reflects reductions in high speeds much better than either the 85-percentile or the percentage of vehicles exceeding the limit. It is easier to compile than the quadratic mean
CHANGE IN^EXC
S!
TABLE 1 ESS SPEED PER VEHICLE FROM NORMAL
With Standing Patrol Unit peed Limit 35 miles per hour
Position Change m Excess Speed
Normal Excess
no Patrol Present
Position Patrolman Inside
Patrolman Giving Ticket
Normal Excess
no Patrol Present
300 feet before over taking
330 feet after over taking
330 feet before meeting
300 feet after meetmg
0. 0
2.1 decrease
4.1 increase
1. 4 increase
1.5 decrease
2.0 decrease
1.1 increase
0,1 decrease
2.6
.42
Decrease in Excess Speed With Patrol Vehicle
5 m. p. h below At
speed limit speed limit
TABLE 2 CHANGE IN EXCESS SPEED PER VEHICLE FROM NORMAL
With Moving Patrol Unit Speed Limit 35 miles per hour
Position With Respect To Patrol Unit Ahead ^ 0 to 20 seconds ~ Behud by 0 to 20 seconds Behind by 20 to 50 seconds Note: The normal excess speed pei vehicle with no patrol in sight amounted to 3.4 miles per hour.
of excess speed per vehicle. The arithmetic mean and the median are neither of much use, because they are affected little when only the highest speeds are reduced which is , of course, the aim of enforcement.
E F F E C T OF STANDING PATROL UNITS ON SPEEDS OF NEARBY V E H I C L E S
In all cases the observations were made on a long, straight level stretch of road without view obstructions or marginal interference. The changes in the excess speed per vehicle from a normal established when no patrol unit was present are shown. Completely to suppress v i olations, the excess speed per vehicle would have to be reduced to zero.
The effect of a patrol unit standing by the side of the road on the excess speed per vehicle when vehicles are about 100 yards before overtaking and meeting, and about the same distance after overtaking and meeting, are shown in Table 1. The effect of a highway patrol car not conspicuously marked standing by the roadside with a patrolman waiting at the wheel are shown separately from those of the
1948 1949 1950
Speed Arres ts per 100 vehicles per year 1949, 9 6: 1950. 7 7, 1951, 6 6
1951
1948, 4 5,
F i g u r e 6. Night speeds r e f l e c t i n c r e a s e d enforcement more than day speeds.

37
same patrol unit in which the officer appears to be giving a ticket to a stopped driver.
These figures suggest some slowing of traffic overtaking the standing patrol unit both before and after overtaking, but little effect on traffic in the opposite direction. We would logically expect that drivers would be more influenced by the likelihood of a patrol car giving pursuit when it was headed the same way than when it was headed in the opposite direction. However, the figures obtained in this pilot study cannot be considered significant. Each condition reported represents fewer than 50 vehicles observed and the standard error of the differences is in no case less than a third of the difference. Hence larger samples must be studied to get truly significant data. It was estimated that from 150 to 200 cars would have to be observed to get reliable data.
E F F E C T OF MOVING PATROL UNIT ON SPEEDS O F NEARBY V E H I C L E S
A similar pilot study was made of the effect of a motorcycle patrolman in motion. The location was a long stretch of dual highway. The patrolman passed the check point at a predetermined speed about every 8 minutes in one direction. He couldbe seen by cars as much as half a mile behind him and a quarter of a mile ahead. For each vehicle passing the check point two things were recorded: (1) its speed and (2) the number of seconds by which it preceeded or followed the patrolman. With the patrolman at a constant known speed, his distance ahead of or behind the observed vehicle could be computed.
The observations of vehicles with respect to the patrol vehicle for a number of passes of the patrol vehicle were combined. The observations made when the patrolman was moving at exactly the posted speed limit of 35 miles per hour are shown in Figure 1. Each point represents one vehicle observed. Normally (that is when the patrolman was not in sight), more than half of the cars exceeded the speed limit and of those which did so half exceeded it by more than 5 mph. This I S shown by the points at the extreme right and left (more than 20 seconds ahead of or behind the patrolman). Just behind the patrol unit the number of vehicles
exceeding the limit seems to be reduced a little, but for about 1,000 feet ahead few exceed the limit, and of those only one exceeded it by more than 5 mph. The high speed of this one suggests that it may have been an error m observation.
A similar (but larger) number of observations was made with the patrol unit moving 5 mph. lower than the posted limit. These are shown in Figure 2 and even more clearly indicate fhat the effect of the unit is limited to about 1,000 feet or less ahead and only a few-hundred feet behind. The increased number of cases immediately following the patrolman and the decreased number ahead shows that traffic normally going faster hesitates to overtake and forms a tail or que behind the patrolman.
The same data can be shown by speed-distribution curves for vehicles observed when the patrolman was in sight compared to the normal curve when he was not in sight (Figs. 3 and 4). Note that there's a substantial difference in the speeds of the vehicles in sight ahead: less for those following; for those in sight but about 1,000 to 2,000 feet behind, almost no difference. Table 2 gives the effect of the moving patrol unit in terms of decrease in average excess speed for intervals before and after patrol.
Al l of these data are from short pilot studies in which the volume of data were insufficient to be conclusive. Full-scale studies should be made which would show more precisely the effect on speeds of the presence of a patrol vehicle at a greater range of distances from the vehicle and, also, for different degrees of conspicuous-ness of the vehicle.
E F F E C T OF INCREASED E N F O R C E MENT ON V E H I C L E SPEEDS IN
CHICAGO To get some idea of what effect over
all enforcement has on behavior and accidents, a special study was made.
In connection with a substantial increase in the level of law enforcement in Chicago, speed observations were made by day and night, at eight selected typical locations, before enforcement was increased and the first and third year following. Figure 5 shows how the increase in arrests for speed (which remained a fairly constant percentage of arrests for all hazardous
38
traffic violations) resulted, either alone or in connection with arrests for other offenses in reductions in excess speed per vehicle, and a similar but smaller reduction in the traffic-accident death rate. Thus, somewhat more than doubling arrests for hazardous traffic law violations results m slightly less than halving the excess speed per vehicle. The death rate also dropped but not quite so much.
Figure 6 shows how the night speeds responded more to the additional ei\force-ment than day speeds did. At the eight points studied the average excess speed at night was, to begin with, considerably higher than by day, nearly athird, infact. Possibly this may have been because there was little night enforcement. With the increase in enforcement there was a con-spicjous, but not specifically recorded, improvement in selectivity of enforce
ment, which increased the amount of night enforcement more than the day enforcement. How important this effect is , we do not know. The apparent effect on speed seemed to have no comparable effect on accidents by night and day. The percent of total fatal accidents between 8 p. m. and 6 a. m. was 46 in 1948 and "47, 44, and 42 respectively in the three following years.
No records were available to show what changes there were in the severity of penalties. Further studies of this sort should be repeated when suitable opportunity presents itself in communities which are prepared to make substantial and continuing increases in city-wide enforcement. As a result of such studies, it is to be hoped that some kind of formula might be devised which would permit some estimate of the amount of enforcement necessary to secure a given level of accidents.

Automobile-Barrier Impacts D.M. S E V E R Y and J . H. MATHEWSON Department of Engineering, University of California
This paper describes thefirst of a series of proposed tests through which (1) the protective or restraining features of an automobile chest-type, lap-type and shodlder-type safety belt will be evaluated and (2) an engineering analysis of the collapse characteristics of an automobile structure on impact will be made. The study of the collision properties of the car should lead to a better understanding of the nature of deceleration by collision and the causes of departure of collision-deceleration patterns from the theoretically ideal pattern of uniform deceleration. There should follow the determination of those structural modifications which, in the case of headon type collision, will provide automobiles with improved progressive collapse characteristics.
The automobile used in this test was a 1937 Plymouth which had been instrumented with mechanical and electrical accelerometers and electrical strain gages. An instrumented anthropometric dummy was secured by a chest-type safety belt to an instrumented seat. The instrumented car was accelerated by pushing, guided by remote control, and allowed to coast into a fixed barrier. The barrier was constructed of large diameter utility poles backed up by dirt so as to provide an essentially nonyielding wall.
A high-speed motion-picture camera and several accessory movie cameras were directed at the point of impact. The instrumented or crash car was suitably calibrated with visual markers to facilitate accurate evaluation of the deceleration pattern of the car during impact through subsequent film analysis.
# A S a general economy measure, the research engineer attempts to reduce the system under analysis to a laboratory model where observations may be made under conditions which are more-easily controlled. After considering a variety of laboratory models, it was decided that none of them could be developed to accurately duplicate all of the possible reactions of the automobile under impact without exceeding the time and cost of full-scale investigation. Full-scale automobile impact studies eliminate the unknown factors which appear when attempting to interpret the laboratory findings in terms of their application to the full-scale device.
With these problems in mind, crashing test cars into a fixed barrier appeared to be the system which provided the best experimental control without deviation from the concept that the tests should duplicate the physical conditions common to the severe impact. A barrier 8 feet high and 14 feet wide was constructed of large-diameter utility poles backed by suitable cross members and braces and several tons of dirt.
A truck was used to pusn the instrumented car up to the desired speed, to provide a mobile position for the remote-control operator, and for carrying the Hathaway 12-channel recording oscillograph. The truck 'puUed the trailer used to carry the portable power unit. An electrical cable which could be paid out rapidly from the pushing vehicle linked the instruments in the two vehicles. The car was guided by remote control to crash into the barrier. Electronic, mechanical, and photographic instrumentation were used to record decelerations, strains, and the other dynamic phenomena under observation during the impact.
An instrumented human subject and an instrumented anthropometric dummy, secured by a chest-type safety belt, simulated the drivers of this 1937 Plymouth test car for the low- and high-speed tests, respectively.
The first impact test was made at approximately 10 mph. with a human subject as well as the dummy in the car. Both the subject and dummy were restrained by safety belts which passed horizontally
39

40
I
F i g u r e 1. The t e s t car and dummy.
across their chests and ander their arms to rigid anchorages behind them. The belts were made of 3-inch nylon webbing attached to 40-G hardware. In the interests of safety it was considered inadvisable to use a human subject at higher speeds. The test to destruction was executed at a speed of 25 mph. The dummy sustained some damage to the neck and arms at the peak deceleration of approximately 24 G, but the failures were essentially those associated with construction details not corrected during the dummy's modification for these tests. The restraining device gave a satisfactory performance.
The barrier-impact technique provides a practical means for studying the reactions of automobiles and motorists under destructive impact conditions. For the particular car used in tne test, the bumper and its fastenings were crushed in a distance of 12 inches without absorbing any significant amount of energy. The frame of the car absorbed on impact less than a fourth of the car's kinetic energy. The deceleration pattern indicated a higher G loading than there would have been if the automobile design had provided energy absorption upon impact by the progressive collapse of the forward structure. The intact portions of the car frame appear to reach peak rates of deceleration somewhat higher than the adjacent upper parts of the automobile body. One of the more-significant contributions of this crash-injury program to date, has been the development of a testing technique suitable for conducting controlled automobile crashes which yield adequate and reasonably accurate scientific data without hazard to research personnel.
THE T E S T CAR A 1937 four-door Plymouth sedan was
modified for the crash in the following manner:
1. The front and rear doors on the driver side were removed to provide an unobstructed view of the dummy (Fig. 1). This provision allowed the dummy's movements during impact to be photographed by the high-speed camera. The removal of the doors did not affect the car's structural properties significantly. Experience has shown that doors frequently fly open under similar conditions of impact, and the cabin structure of the automobile was not subjected to decelerative forces sufficient to produce a permanent set in the cabin structure, even without the doors.
2. Windshield and window glass were removed.
3. The front and rear seats of the car were removed.
4. A specially designed seat and seat support were installed in place of the standard car seats. The purpose of this structure was to provide a rigid mount for the seat which would allow the strain elements attached to the seat to be free from detecting the unrelated, complex, high-frequency vibrations which generally mask the principal forces of deceleration in this type of crash.
The two seat and foot rest supports were secured to two parallel 4-by-6-inch steel I beams mounted longitudinally on the floor of the car (Fig. 1). This permitted the loading of the seat and footrest during impact to be detected by electric strain gages.
5. A vertical I-beam member secured
F i g u r e 2. Remote c o n t r o l s t e e r i n g apparatus.

41
to the horizontal member provided a T post to which the terminal mounts and strain gage elements of the safety belt were secured,
6. Remote steering was provided by a large pulley bolted to the steering wheel and, as shown in Figure 2, actuated by a cable joining it to the pulley of a selsyn, mounted on the horizontal I beam between the legs of the dummy. This selsyn was connected electrically with a similar unit on the instrument truck used for remote control.
7. The test-car parking brake was rigged so that it could be actuated mechanically from the instrumented truck.
8. All items in the car cabin which were inadequately secured were removed or bolted down to prevent their shifting forward during impact.
THE INSTRUMENTED TRUCK AND T R A I L E R
A iVz-ton Chevrolet carryall was used to push the test car into the barrier and to carry the electrical recording equipment (Fig. 3). A horizontal deck, 4 feet deep and 6 feet wide was built over the engine hood of the truck to provide an area on which to lay the excess length of instrumentation wires used to connect the test car with the instrument truck. The wires were bound together to form a cable, and this cable was laid on the deck in a manner which prevented it from snagging as it was drawn rapidly from the decelerating truck by the test car coasting on into the barrier.
The wires from the test-car steering selsyn were routed through the common
F i g u r e 3. XVi-ton c a r r y a l l used t o push t e s t c a r i n t o b a r r i e r .
F i g u r e 4. Twelve-channel r e c o r d i n g o s c i l l o g r a p h .
cable to the instrument-truck control selsyn and power source. The control selsyn was operated from a vantage point on the cable deck of the instrument truck.
The instrument truck carried a Hathaway 12-channel recording oscillograph and accessory equipment (Fig. 4) and pulled a 6-foot, two-wheel trailer which carried the portable 115-volt power unit.
THE' ANTHROPOMETRIC DUMMY The phase of this research project
concerning the development and evaluation of devices appropriate for restraining the motorist against the effects of crash deceleration suggested the need for a test dummy. This seemed advisable owing to the small amount of information known about the deceleration pattern of the crashing automobile and the effects of such irregularities on the human body secured by restraints of new design. Eventual evaluation of the voluntary limits of such protective devices must, of course, be made by human subjects, possibly preceded by tests made on live animals having anatomy comparable with the human body, e. g. , apes.
The anthropometric dummy developed by the Institute of Transportation and Traffic Engineering, University of California, will be referred to for simplicity as the I T T E Dummy. In addition to the requirement that this dummy should have the physical appearance of man, it was considered necessary that it should have a total weight
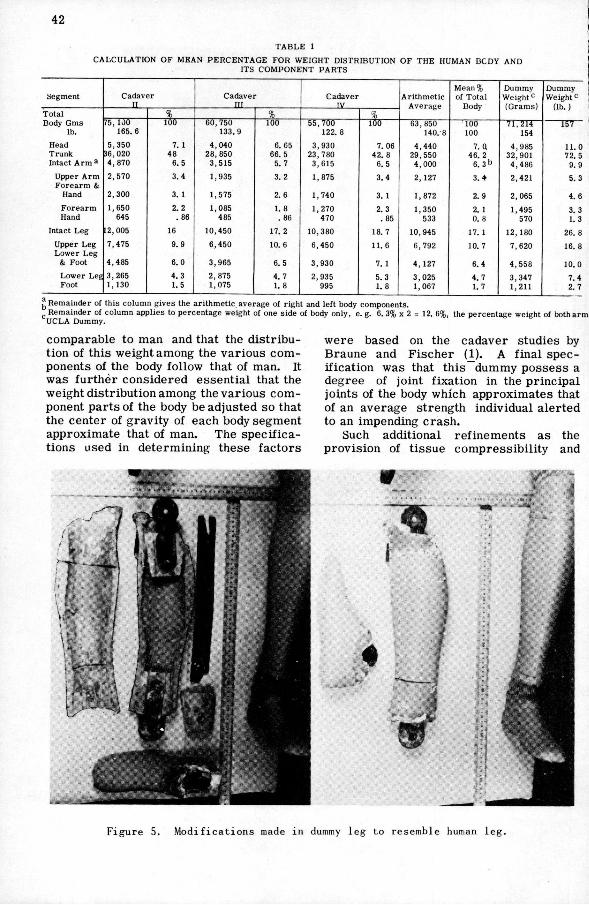
42
CALCULATION OF MEAN P E R C E N T A G E FOR WEIGHT DISTRIBUTION OF THE HUMAN BODY AND ITS COMPONENT PARTS
Segment Cadaver 11
Cadaver III
Cadaver TV
Arithmetic Average
Mean% of Total
Body
Dummy Weight'^ (Grams)
Dummy Weight c
(lb.) Total % % %
Arithmetic Average
Mean% of Total
Body
Dummy Weight'^ (Grams)
Dummy Weight c
(lb.)
Body Gms 75, 100 lOO 60,750 100 55,700 100 63, 850 100 71,214 157 lb. 165. 6 133.9 122. 8 140. 8 100 154
Head 5,350 7. 1 4,040 6. 65 3,930 7. 06 4,440 7. Q 4,985 11. 0 Trunk i6,020 48 28,850 66. 5 23, 780 42. 8 29,550 46. 2 32,901 72. 5 Intact Arm ^ 4,870 6. 5 3,515 5. 7 3,615 6.5 4,000 6. 3 b 4,486 9.9
Upper Arm 2,570 3.4 1,935 3. 2 1,875 3.4 2,127 3.4 2,421 5. 3 Forearm &
Hand 2,300 3. 1 1,575 2. 6 1,740 3. 1 1,872 2.9 2,065 4.6 Forearm 1,650 2. 2 1,085 1. 8 1,270 2. 3 1,350 2. 1 1,495 3. 3 Hand 645 . 86 485 . 86 470 . 85 533 0. 8 570 1. 3
Intact Leg 12,005 16 10,450 17. 2 10,380 18. 7 10,945 17. 1 12,180 26. 8 Upper Leg 7,475 9. 9 6,450 10. 6 6,450 11. 6 6,792 10. 7 7,620 16. 8 Lower Leg
& Foot 4,485 6.0 3,965 6. 5 3,930 7. 1 4, 127 6.4 4,558 10.0 Lower Leg 3,265 4. 3 2,875 4. 7 2,935 5. 3 3,025 4. 7 3,347 7.4 Foot 1, 130 1. 5 1,075 1. 8 995 1. 8 1,067 1. 7 1,211 2. 7
Remainder of this column gives the arithmetic, average of right and left body components. Remainder of column applies to percentage weight of one side of body only, e. g. 6. 3% x 2 :
UCLA Dummy. 12. 6%, the percentage weight of tioth arm.
comparable to man and that the distribution of this weight among the various components of the body follow that of man. It was further considered essential that the weight distribution among the various component parts of the body be adjusted so that the center of gravity of each body segment approximate that of man. The specifications used in determining these factors
were based on the cadaver studies by Braune and Fischer (1). A final specification was that this dummy possess a degree of joint fixation in the principal joints of the body which approximates that of an average strength individual alerted to an impending crash.
Such additional refinements as the provision of tissue compressibility and
1
F i g u r e 5. M o d i f i c a t i o n s made i n dummy l e g t o resemble human l e g .

43
tissue resiliency, as well as muscle return, could not be incorporated in this experimental model, since this would involve the expenditure of time and funds far in excess of practical limits.
TABLE 2 MEAN PERCENTAGE FOR
CENTER OF GRAVITY LOCATION (Atter W. Braune and O. Fischer)
Segment Proximal Distal Total Body Head Trunk (and neck) Intact Arm
a b c
0 . 9 4 "
a b c
0.06 Upper Arm Forearm and Hand
.47
.47 .53 .53
Forearm Hand (slightly flexed
• « e .58^
Intact Leg . 89 ' . 11 Upper Leg Lower Leg and Foot
.44
.52 .56 .48
Lower Leg Foot
.42
.43 .58 .57
. 1 c m under Promontory, 4 cm in front of 2nd Sacral vertebra. In the fossa tarlnt 0. 7 behind the Sella turcica, exacUy in Sagittal plane.
.At first Lumbar vertebra (near the medial plane). In upper arm just above elbow axis, 1. 5 cm in front of bone. 5. 5 cm p, 1 cm In front of the center of m Meta carpal near
J skin of the palm. To knee |0int , although entire leg Is being considered.
An unusually well-designed articulated manikin was purchased and modified along the lines already indicated. This was necessary, since there was no commercially produced anthropometric test dummy on the market at that time. The principal modifications were those concerning the strength and weight distribution of the dummy. An example of such a revision is shown by Figure 5. The lower leg was reinforced by the addition of %-by-2-inch iron stock of a length sufficient to allow it to serve the purpose of the tibia in the human counterpart. The other segments of the dummy were strengthened as required. Access doors were provided for the mounting of accelerometers in the head and chest cavities. The plaster-cardboard covering of the head and trunk were resurfaced with a tough fiberglass boat cloth. This was securely bonded to the plaster surfaces with an application of cold-cure boat resin.
Data for the I T T E Dummy
Table 1 provides the data upon which the weight distribution of the dummy was based. Table 2 supplies the mean percentage for center of gravity location, and Table 3 gives the data on articulation of the dummy.
INSTRUMENTA TION Photographic, electronic, and me
chanical systems of instrumentation were used to record decelerations, strains, and the other dynamic phenomena under observation during this impact test. An attempt was made to overlap these recording systems wherever possible, so duplication of data could be obtained for verification purposes and for guarding against complete loss of some phase of essential data due to equipment failure during the impact.
The principal source of photographic data was obtained with the use of an East-
TABLE 3 ARTICULATION OF ITTE DUMMY
This dummy is provided with joints enabling motion comparable with the principal joints of the human body. It wiU be noted that some of the degrees of freedom of human jomts have been omitted since they play no significant part in body dj-namics during crash deceleration. Angle Body Segment Motion (Deg.) Head-(relative to
trunk)
Arm (relative to shoulder)
Forearm (at elbow) Hand (relative to
forearm) Hand (relative to
elbow) Torso Deflection
(Shoulders relative to pelvic girdle)
Thigh (relative to pelvis)
Lower leg (relative to thigh)
Foot (relative to ankle)
Forward flexion Backward flexion Sideward flexion (either side) Rotation (either side) Forward flexion Backward flexion Abduction Forward flexion Forward flexion Backward flexion Rotation (either side)
Forward flexion Backward flexion Rotation to either side Forward flexion Backward flexion Backward flexion Rotation (either side)^ Forward flexion Backward flexion
44 26 25 00
180 180 140 119 90 90 90
25 15 60
110 25
108 90 30 30
Not an anatomically correct articulation smce this motion accomplished the rotation of the dummy's foot relative to the hip by motion at the knee rather than at the hip as with the human.
man high-speed camera, Type III, which was operated at approximately 1,000 frames per second. A 60-cps. timli^ light built into the camera recorded a timing signal on the edge of the highspeed film so that allowance could be made for the acceleration of this film. In addition, two checkerboard patterns were painted on the car at an accurately measured distance of 3 feet apart for the purpose of providing a precise length measurement in the field of the camera at the distance of the test car. As may be seen in Figure 6, this calibrated reference was placed above the car doors and

44
Figure 6. Checker board pattern on car for calibration with photographic f i l m .
was used for length calibration of the film at the instant just before the car impact occurred. Other reference markers were painted on the side of the car and calibrated marker boards were mounted on a fence behind the car and in view of the cameras. This film was subjected to a frame-by-frame analysis using a Bausch and Lomb optical comparator^ to provide accurate information on the deceleration of the car and dummy. A Kodak 16-mm. Cine Special II operated at 64 frames per second and a 4-by-5-inch Speed Graphic camera provided additional photographic records.
Figure 7. C a r - t o - c a r head-on c o l l i s i o n .
The electronic portion of the instrumentation consisted of a Hathaway 12-channel recording oscillograph which received signals from Hathaway accelerometers ^This system produced only an error of 2. 2 percent, described by the paper "Controlled Test to Evaluate the A c curacy of Accelerations Derived from the Analyses of High Speed Camera Film Using a Bausch and Lomb Optical Comparator, " D . Severy and P. Barbour. Unpublished.
mounted in the chest cavity and head of the dummy as well as on the forward surface of the chest belt. The oscillograph also received signals from strain gages mounted to record the impact forces the dummy exerted on the foot rest, on the seat, and on the chest-level safety belt. The cables from these detectors were bound to the cable connecting the selsyn motor to the remote steering selsyn. The other end of this 100-foot cable was connected to the recording and control equipment in the instrument truck. The excess cable was stored on the truck in the manner already described.
TEST SITE AND BARRIER Because of the hazardous and unusual
nature of this investigation, it was necessary to secure the use of a test site which was located in an unpopulated, fenced-in section having a roadway at least 800 feel long. Arrangements were made with the Los Angeles Department of Water and Power to use a portion of its facilities at the Valley Steam Plant. This department also prepared the necessary dirt roadway and constructed a barrier at one end of the road. As may be seen in Figure 6, the barrier, which was 8 feet high and 14 feet wide, was constructed of large-diameter electric-utility poles. These were sunk to a depth of 8 feet in the ground and backed by suitable cross members and braces to provide a rigid structure. The mass of the barrier was augmented by placing dirt against the rearward side of the structure.
The barrier was inspected directly following the high-speed impact. There

45
Figure 8. Accelerometer mounted on crash helmet.
was no indication of significant displacement of the barrier. The timber retained a deformation of approximately 74 inch in several small areas. Although there was no doubt that significant energy was absorbed upon impact, it seems reasonable to conclude that the severity of the collision was not reduced significantly by yielding of the barrier.
The barrier impact imposes a more-rigorous test of the protective qualities of a motorist restraint than would generally be encountered in a car-to-car head-on collision. In the latter there would be mutual penetration, as shown by Figure 7, andcojisequently, a lower deceleration rate than would be the case with the car-barrier impact in which one of the two colliding objects is essentially nonyielding and non-penetrable.
TEST PROCEDURE Immediately preceding the experimental
- Ctttnted Re(«renc« Bfxvds
CONTROL CAR CHASHICAR / p-REMOTE STEERING CONTROL
impact, the test car was slowly pushed until the front bumper rested against the barrier. The high-speed camera was placed at a point 30 feet from the car, directly opposite its front door. The high-speed camera was adjusted at this position, and other photographic equipment was grouped around it and adjusted for operation. The procedure which proved to be the most practical was to utilize remote-control steering, push the
mOH-SPEED CAMERA
KXK
9nn \ \ KJU \ -CAR RAME E C K -
^ G R C 5S AC CEUEF OMETE RS
6O0
500
4O0
300
•vn
RAME E C K -
6O0
500
4O0
300
•vn
\ 6O0
500
4O0
300
•vn
\ 6O0
500
4O0
300
•vn
/ \
6O0
500
4O0
300
•vn /
o o
°
o o
° io IO 6 0 8 0 O 0 1 M H IO H lO II K) 2 X) 2 0 z* K) 2
SMcid (for pomino)
Figure 9. Plan of test setup.
Figure 10. (Top) Head osc i l la t ion with respect to decelerat ion pattern of car and belt. (Bottom) Deceleration-time relat ion
ship for gross accelerometers.
test car up to the desired speed, and allow it to coast into the barrier. Needless to say, numerous dry runs were made before the first impact in order to perfect operational procedures. Following these, the test car was backed away from the barrier about 400 feet in preparation for a low-velocity impact involving the use of a human observer. A Hathaway accelerometer was mounted on the crash helmet (Fig. 8) and a similar unit was secured to the forward surface of the horizontal chest belt used to restrain the human (Fig. 1). The initial impact speed of 10 mph. proved

46
to be the limiting velocity of impact for the volunteer subject under the rigorous conditions Imposed by this particular barrier crash.
An impact speed of 25 mph. was considered advisable for the high-speed test, using an instrumented dummy, so that the data obtained could be compared directly with a previous study (unpublished) conducted by this institute of a headon collision staged at approximately the same speed. Trial runs showed that if the test car were pushed to a speed of 30 mph.' until it was 100 feet from the barrier, it would decelerate, while coasting, to 25 mph. just as it passed to one side of the barrier. This break-away distance of 100 feet enabled the instrument truck which was doing the pushing to break away and decelerate at a moderate rate and stop 40 feet short of the barrier while the test car pulled the instrumentation cable from the cable deck of the truck as it coasted into the barrier at 25 mph. (see Fig. 9). The practical runs familiarized each member of the research team with their respon-> sibilities, and enabled operational problems and equipment failures to be observed and corrected. At the test run speed of 30 mph., the operator experienced some difficulty in remotely controlling the test car by the relatively low-torque selsyn. Fortunately, appropriate corrections were possible so that the car struck the middle of the barrier at 24. 9 mph. (Fig. 6).
TEST RESULTS Head Oscillations and Other Responses of the Body to Crash Deceleration Under Restrained Conditions
Analysis of the motion-picture film revealed that the head of both the human subject and the dummy passed through a 1/4-cycle oscillation. In both cases, the head appeared to be forced as far forward as the neck would flex during the first phase of the impact and, subsequently, as far backwards as the neck would flex. An illustration of head oscillationwith respect to the deceleration pattern of car and belt is shown in Figure 10. In the human test the subject reported that during the low-velocity impact his head whipped forward so abruptly that he could hear a succession of snapping sounds which he attributed to the sound from the flexing of the cervical
vertebrae reaching the audioreceptive organ through the medium of bone conduction. A mild pain in the vicinity of the neck persisted for one day. In the monumental work of Stapp (2) the danger of head-whip was averted by having the subject's head and neck flexed forward as nearly horizontal as possible before impact. It is not believed that such pre-positioning would, however, be feasible for motorists because of the special training required. It is also true that this special collision posture would make it impossible for a driver to see ahead and to apply corrective action up to the instant of impact and thereby reduce the severity of the collision. Thus, since motorists cannot be expected to assume this more-favorable-posture during an impending collision, it was decided not to introduce such a protective measure into this investigation, at least until the effects without it were observed. The relatively heavy, protective helmet carrying a 1-lb. accelerometer attachment worn by the volunteer subject unquestionably increased the severity of this head-whip phenomenon.
Restraming Capacity of the Belt
The chest-type belt was anchored to the rear, on each side of both the subject and the dummy. The belt passed under the arms and across the chest horizontally. At the chest level, this device restrained both the subject and the dummy against any observable forward movement under the influence of deceleration.
Photographic analysis showed that on impact the dummy slid forward in his seat approximately 12 Inches. This would have put his knees near or against the instrument panel if his seat had been the usual distance from the instrument panel, but his head and shoulders still would have remained clear of the steering wheel under such conditions. Actually, the knees did strike the steering wheel, causing momentary elastic deformation of the wheel. The feet were placed on an inclined surface which simulated the usual floor board arrangement of the automobile. They remained in this position during the impact
Figure 6 shows the dummy's position shortly after the instant of maximum deceleration. The arms of the dummy were thrown forward and upward from the lap position in a flailing motion despite the

47
preimposed j oint fixation. This whip action snapped the left arm free from the shoulder and caused the right hand of the dummy to pull loose at the wrist. The arm failure occurred because there was only % sq. in. of wood available to support this average weighted arm against the combined effects of deceleration, which increased the effective weight of the arm on the order of 20 times, and the bending moment at the shoulder which developed due to the preimposed joint fixation. In the case of the dummy's hand, the spring-loaded ball-pin locking device should have been replaced by a positive locking device to make it correspond more closely to the strength of its human counterpart.
Although there is experimental evidence that human arms do not tear loose from decelerations far in excess of 20 G, the arm of the dummy which remained intact was tested to destruction e:q)erimentally. Static loading designed to approximate the dynamic conditions of the barrier impact produced failure for a longitudinal load of 103 lb. and a transverse load of 90 lb. The resultant loading of 137 lb. could be accommodated by an adult male without the occurrence of accidental amputation.
Under the forces of deceleration, the inertia of the dummy's head overcame the resistance of the neck-jomt fixation and the head snapped forward gainst the limit pad with sufficient force to fracture the dummy's neck joint at a location which would correspond to the first thoracic vertebra of the human body. Since this neck joint had not been strengthened for the impact test, it is not reasonable to
TABLE 4 DATA ON THE GROSS MODEL-C
MECHANICAL ACCELEROMETERS
(1) Recording: Accomplished by a jeweled stylis on a rotating smoked rotor.
(2) Bidirectional: Records on two axis, 90 degree opposed. (3) Natural undamped frequency. 70 cps (4) Damping coefficient. 0. 6 to 0. 7 (5) Release mechanism: Adjustable trigger threshold (6) Range: + 50 G (7) Calibration method: Dynamic and static calibration over
the range to be measured. Unit
Number Direction Recorded Location
Reference Figure
Maximum Readmg, G
3 4 6
Frontal Vertical Frame Rear Trunk Deck Frame
2(C), Left — side
2(C), Right side
26.0 20.0 30.5
to the dummy which would suggest that a corresponding injury might have taken place if a human subject had been decelerated in place of the dummy. It should
TABLE 5 Impact Data. I'.em Kum- Derived ber(» Description from Amount Units
1 Year and make of car Data 1937 Plym.
2 Body tyi)e Data 4dr. Seda 1
3 Measured weight with dummy Data 3,077 lb
4 Velocity before impact Film 36.5 ft/sec 5 Velocity after impact Film -5.8 ft/sec 6 Peak deceleration rate Analysis 19.0 G 7 Duration of impact Film 0.250 sec 8 Maximum amount of
collapse Film 2.3 f t 9 Mass (W/g) ' 3 /g 95.6 slugs
10 Sifomentum before impact (I>4xr9) 3,490 lb-sec
11 Momentum after impact (»5x*9) -554 lb-sec
12 Total change in velocity <4 - #5 42.3 ft/sec
13 Kinetic energy before impact %(J0){»4)'63,680 ft-lb
14 Sinetic energy after '^#9)(r5) impact '^#9)(r5) ' -1,608 ft-lb
15 ^Coefficient of restitution f5/r4 0.16 _
16 Change m momentum « 0 - « 1 4,043 lb-sec 17 Loss of kinetic energy
during impact <>13 - t \ k 65,290 ft-lb 18 Average force acting
on car «6/»17 16,170 lb 19 Average rate of energj #17/»7 261,170 ft-lb/sec
dissipation 20 ^rash horse power 19(60) 475 hp
33,000 hp
conclude that comparable injury would have been sustained by a human body subjected to the same deceleration pattern.
There were no signs of damage or strain
be emphasized, however, that the ITTE Dummy does not have flesh and chest-compressibility properties which tend to reduce slightly the deceleration rate for a human subject in one respect, but which would, in anothef respect, permit the generation of destructive shear forces that might produce serious or even fatal injury. This matter will be given special attention in subsequent tests.
Lap Versus Chest Type Safety Belts
A review of Accident Facts (3) will show that the only statistically significant sources of injury to the motorist result from collision or other sources of destructive and rapid deceleration of the automobile. A motorist secured by a safety belt m a vehicle under the usual conditions of vehicular motion, can have only one principal reactionary force prevail during an accident or rapid deceleration which can be anticipated. This is the force of the body against the restraining device as the bo(fy attempts to continue along the original path of motion under a condition in

48
which this motion is being decelerated. Regardless of the gyrations and distortions which the automobile, and consequently its occupants, may suffer during accidental deceleration, the law of conservation of energy states that the human body must dissipate its kinetic energy (of forward motion) by a reactive force on the body through a distance which represents the total work equivalent to the body energy of forward motion.
Those collisions which generate forces from the lateral, vertical, or rearward directions or combinations of these forces with the known forward restraining forces produce unpredictable forces because they do not exist until the peculiarities of a particular accident develop. It therefore seems unrealistic at this point to develop specialized protective passenger restraints to counteract any but the most-frequently encountered force, namely that which restrains the motorist from being thrown against the forward surfaces of the car's interior or, in that general direction, through open doors or through the windshield.
For the average front seat, the lap-type safety belt provides this protection only for the less-vulnerable portion of the anatomy, leaving the vital parts, particularly the head, to destructive deceleration.
The chest-type safety belt, while probably not the final solution to this problem, does provide effective restraint against the only predictable forces of deceleration which can develop during the accident, namely, those which tend to decelerate both the car and the motorist.
A common category of accidents are those in which a relatively minor oblique impact from the opposing vehicle or fixed object results in superficial damage to the car. In such accidents, however, the intial impact serves to disorient the driver, causing him to lose control of the car, so that a secondary and frequently severe collision occurs. Circumstances such as these suggest that a properly designed motorist-restraining device should keep the driver and other occupants in their normal seating positions within the car in order to: (1) prevent vital parts of the anatomy from being subjected to injurious impact; (2) prevent the driver and passengers from being thrown from the car; and (3) guard against loss of
control of the car following impact. A simplified shoulder harness is cur
rently being tested which shows promise of providing a more-effective restraint and of overcoming some of the objectionable features of a chest-level belt.
Deceleration Characteristics of Auto-Barrier Collision
The test car was provided with visual reference targets to facilitate a frame-by-frame analysis of the high-speed-camera film which recorded the motion of the car during impact. For the chest-level belt and the intact portion of the car body. Figure 10 portrays the changes in the deceleration with respect to time.
The curves show the abrupt onset of deceleration, which is characteristic of barrier and headon collisions, followed by a less abrupt recovery from the peak deceleration value. The double peak of the safety-belt deceleration curve is attributed to the mass spring characteristic of the system. This ei^lanation is supported by the fact that comparison of the integrals of these two curves shows a mean deviation of only 1 percent. These curves, of course, are based on photographic observations of points on the car and belt at approximately the same distance behind the front bumper. The final peaking of deceleration at about 180 milliseconds is attributed to the forces of restitution.
Three determinants of the limits of survival for the properly restrained subject e}q)osed to rapid deceleration are: (1) rate of onset of deceleration, (2) the maximum deceleration, and (3) duration of the deceleration period. For this test, the rate of onset of deceleration for the dummy was approximately 600 G per sec., and the dummy was exposed to a maximum deceleration of 24 G. The total deceleration period was 250 milliseconds. These values are substantially below the voluntary tolerance limits for humans as determined by Stapp. Reference to Figure 11 will show the car to be accelerating with a reverse velocity, or away from the barrier, at time 180 milliseconds, which is the logical result of the action of restitutional forces.
It is interesting to note that the head was pitched forward a maximum amount following the second deceleration peak of the belt. It took about 40 milliseconds

49
for the first deceleration peak, applied through the chest, to force the head fully forward. The average velocity of the head at this time was about 15 ft. per
1 1
49M1 H A 1 I
V 1
1 -CAR VELOOTY
1
- -- 1 ! -1 i
- -- 1 ! -1 i
• -1
1
1
1
1 1 1 J _ J _ .
0 20 40 60 80 100 120 MO 160 180 200 220 240 260 TIME AFTER IMPACT-MILLISECONDS
1 1 1 , . I 1 j aSTANCE OF CAR FROM BARRIER (MEASURED
f—IN STANT OF CONTACT '
1 1 1 1 1 1
1 1 \
1 1
1 1 1
1 1 1 1 1 ,
20 40 60 80 n o 120 140 160 IBO 200 220 240 260 TIME AFTER IMPACT-MILLSECONOS
Figure 11. (Top) Rate of acceleration with reverse velocity from barrier. (Bottom) Rate of collapse of forward structure of
car with respect to time.
sec. and assuming, conservatively, that at peak'G the belt had zero velocity, the center of gravity of the head would have moved about 7 inches during the 40 milliseconds. This corresponds approximately with the flexure limits of the dummy's head. Since both the car top and safety belt had the same initial and final velocities, the areas under the curves of Figure 10 [ hould be the same. As already stated these areas have a mean deviation of only 1 percent.
The velocity curve of Figure 11 has been included to show, relative to the common time axis: (1) the portion of each deceleration curve of Figure 10 which corresponds with the car at zero velocity and (2) the fact that although the velocity of the car has been reversed in direction, the decelerative forces remain positive. Thus, deceleration in the forward direction is the same as acceleration in the
reversed direction. This latter point is at once apparent when one refers to Figure 6 and sees that the forces on the intact portion of the car, as well as on the restrained dummy, are the same whether these bodies are being decelerated from a forward velocity or accelerated in a rearward direction.
At this stage of experimental investigation, positive conclusions cannot be reached concerning desired structural modifications. But to the extent that these curves are representative of the modern automobile, they do suggest the need for structural changes which will produce a more-uniform deceleration by reducing the peak deceleration to a level which can be more-safely endured by restrained motorists. These changes would, of course, apply forward of the firewall and would obviously have to be compatible with structural design limitations. It should be pointed out that the trend in modern automotive design toward shortening the space between the front bumper and driver and expanding the trunk space is a sacrifice of space which could be utilized in safer design. Shortening the length of collapsible structure between the driver and front bumper results in the driver being decelerated during a frontal impact at a proportionately increased rate under conditions otherwise comparable. It is suggested that a safer design would be to place some of the storage facilities in a compartment between the firewall and engine.
A maximum deceleration value of 19 G for the intact portions of the car was derived from frame-by-frame analysis of the film taken by the highspeed camera. Figure 3 shows the reference targets painted on the side and top of the car body which were used in this analysis. The top portion of the car was decelerated at a rate exceeding 10 G for a period of 53 milliseconds and 15 Gfor 19 milliseconds. It is interesting to note that the automobile becomes a flexible structure when subjected to the abnormal stresses of crash deceleration. The deceleration of the intact portion of the car body at or near the top of the car may be expected to be somewhat less than the deceleration measured at the frame at the same distance back from the front of the car. This condition was verified, since a peak deceleration of 19 G was measured at the top of the car by photographic means.

50
while the peak readings of two Gross Model C mechanical accelerometers secured to intact portions of the frame of the car were 26 G and 30 G. A third Gross accelerometer secured to the car
nent collapse of the structure was observed for this section of the car. Neglecting the flexing of the car body relative to the frame, the data of Figure 11 indicates that the frontal structure of the car collapsed 2. 3 feet following contact with the barrier.
Frame Deformation Analysis
Figure 12 shows diagrammatically the permanent deformation of the car frame. The graph depicts the deformation of the car frame with respect to distance from the front bumper inasmuch as the abscissa is drawn to the scale of the car.
0 10 20 30 40 so 60 OSTWCE FROM FRONT BUMPER
O 20 30 40 50 60 nSTANCE FROM FRONT BUMPER
Figure 12. (Top) Permanent deformation of car frame. (Bottom) Deformation of car frame with respect to distance from front
bumper.
body registered 20 G. The peak readings were of sufficient duration to be of practical significance, both from engineering and physiological viewpoints.
Figure 10 gives the deceleration-time relationship for the Gross accelerometers. In addition to the photographic and mechanical systems for securing deceleration patterns, a third system involving electronic devices was used, but a readable record was not obtained.
Figure 11 shows the curve of the rate of collapse of the forward structure of the car with respect to time. The high-speed-camera film was used to provide the data. A target painted on the side of the car 8 feet behind the front bumper was used as the reference point, because no perma-
Figure -IS. Marking frame to determine permanent deformation of d i f ferent sections.
In order to determine the permanent deformation of different sections of the car frame, positions on each side of the frame were marked with metal screws at points approximately 1, 2, 3, 4, and 6 feet back from the front edge of the bumper (Fig. 13). ^ The dotted lines of Figure 12 show the deformation of the frame for the 10 reference points measured. The frame of the car was deformed by amounts which varied approximately in-
" The procedure followed in calibrating the frame consisted of driving the car onto a wide sheet of y4-inch plywood and projecting onto the latter, by theplumbbob technique, the points defined by the metal screws. Measurements were then made on the plywood surface. It was found that the marker points could be located with a reproducibility which did not vary more than 0. 05 inch. Following the barrier crash, the car was again placed on the sheet of plywood, and the same reference points on the frame were projected, measured, and recorded. Since there was no evidence of deformation at the 6-foot point, this station was used as the base in evaluating the deformation of the other points.

51
versely with distance from the front bumper. The bumper collapsed completely without contributing appreciably to the deceleration of the car.
The frame-deformation pattern i l lustrates the positions of the frame of the car before and after impact but gives no clue as to the order and rate of assumption of these positions during impact. Thus, for exaiuple, if the first two stations to the rear of the front bumper were to yield completely under a relatively low loading, this would use up a major portion of the total collapsible length of the car without contributing significantly to the absorption of the car's kinetic energy. Most of the energy would, therefore have to be absorbed by the remaining small length of structure between Station 2 and the fire-walL This could be accomplished only at an excessively high rate of deceleration.
Possibly a more-ideal collapse pattern would be a rectangular one in which the frame exclusive of the minor contribution of the bumper would resist collapse until a given loading was reached and then the entire length of frame forward of the firewall would fail at a rate which maintained this loading until either the precrash energy was entirely dissipated or the frontal portion of the frame was totally collapsed. The frame would be designed to fail under a uniform loading which represented the estimated physiological tolerance limit of an average motorist wearing a specific restraint or which would uniformly absorb all of the kinetic energy estimated to be released from an average crash, whichever was least. In the next test an attempt will be made to further Investigate this phenomena.
CALCULATIONS 1. Total Kinetic Energy of Car Imme
diately Prior to Impact
Velocity, v = 36. 5 ft. per sec.; Weight W = 3077 lb.
KE = y. mv'' = y, ^ V* = {%) ^ (36. 5)' = 63,680 ft. -lb.
2. First Approximation of the Amount of Precrash Kinetic Energy Absorbed by Permanent Deformation of the Car Frame
(a) Average total loi^itudinal deformation of car frame, S = 3.4 inches = 0. 283 feet
(b) Average deceleration rate of car frame during Impact = 285 ft. per sec. per sec.
(c) KE (absorbed) = Work = (F) (S) = (ma)(S) = ( | a j (S)
= ( ™ | . 2 8 3 )
= 7707 ft. -lb.
3. Estimate of Percentage of Pre-Crash Kinetic Energy Absorbed by the C"iT Frame, Using Average Deceleration
1
Rate of Frame
Total - Absorbed I KE Total
(100)
100 [63680 - 77071 nnm - 19(1. "B3B5D (100)-12%
4. Estimate of Pre-Crash Kinetic Energy Absorbed by Permanent Deformation of Car Frame, Using Maximum Deceleration Rate of Frame
KE = work =1
= 26,440 ft.-ib
|(. 283)
100 '63550 - 26,440' " . B35515 (100) = 42%
DISCUSSION OF CALCULATORS 3 AND 4 The 12-percent value for the percentage
precrash kinetic energy absorbed by the car frame as shown in Calculation 3 was obtained using the average rate of deceleration for the impact period. In this calculation the assumption is made that the frame will assume permanent deformation for the loading developed by the average deceleration rate of 285 ft. per sec. per sec. The authors have no e:q)erimental evidence upon which to base this assumption, and it is therefore possible that the observed 0. 283 feet permanent deformation resulted from only the peak and near peak deceleration loadings.
Using the peak deceleration rate, an estimated value of 42% of total kinetic energy is calculated to be absorbed by the car frame. This estimate is high for two reasons:

52
First, the peak of 30G was maintained for only about a millisecond which suggests that deceleration rates substantially below this value also contributed to permanent deformation. This becomes apparent when one considers that if the frame became permanently deformed at a rate equal to the maximum velocity of the car, i. e. , 36. 5 ft. per sec., it would require 8 milliseconds to produce the 0. 283 feet permanent deformation. Actually, a much greater period is necessary since the frame was deformed elastically as well as plastically and again because after the instant of contact, the velocity, and therefore the rate, of deformation was very much less than 36. 5 ft. per sec. These factors suggest that the frame of this car absorbed significantly less than 42 percent of the gross kinetic energy. This information may be of value in designing the forward third of the car to be a better energy-absorbing structure.
Secondly, not all of the total weight of the car reacted to load the frame of the car, even though this weight was used to provide a conservative estimate. Possibly as little as half of the gross weight of the car serves to actually load up the frame, since the front-wheel assembly, front fenders, grill, radiator, and other frontal elements of the car tend to carry their own apparent weight by direct contact with the barrier. As soon as these elements have been crushed in by a few inches, the engine also may carry its own weight by direct contact with the opposing force. This latter statement appears to be true in this crash test, since the engine was decelerated rapidly enough to cause the firewall to be forced around it. At least during the later stages of deceleration, it appeared that the ermine supported its own crash weight. From this discussion, it may be estimated that the frame of the car absorbed no more than a third of the precrash kinetic energy.
5. Estimate of Accuracy of - G-t Curves
Procedure: The preimpact velocity obtained from the integral of, or summation of the areas under, each G-t curve has been compared with the observed velocity of 36. 5 ft. per sec. and the percentage deviation is given in Column 6 of Table 6.
Discussion of Table 6
The errors listed in Column 6 are not excessive in that only a portion of these values may be related to the G-t data. The remaining error may be attributed to the graphical integration process used to approximate the G-t curve error.
Column 7 shows close agreement (1% error) between the areas under the G-t curves plotted from independent data. The greater magnitude of error in area agreement (6%), for the gross accelerometer curves, is attributed, at least in part, to the fact that the onset portion of these curves (Fig. 10) had to be extrapolated in order to provide the area information necessary. The onset portions of the gross accelerometer curves are missing because these mechanical devices are preset to tr^ger off at higher deceleration values than those inadvertently encountered during handling and mounting operations.
6. Determination of Percentage Error Between the Change of Momentum and Impulse During Impact for the Purpose of Checking the Accuracy of Evaluating High-Speed Film Data
(a) Chaise in Momentum mAv = Impulse, FT
^ (va - vi) = maT = ^ aT,
where "a" is the average acceleration for the total time of impact T
(b) Thus, V2 - vi = aT
[36. 5 ft. per sec. - (-4. 5 ft. per sec.)]+ 167. 5 ft. per sec. per sec. (. 250 sec.) 41. 0 ft. per sec. ± 41. 8 ft. per sec.
(c) Percentage Error equals
( lk |^)aoo) .4^ This error is small considering the
quantity of data which must be handled and the manipulations necessary to develop the S-t, V-t and G-t curves.
FINDINGS AND CONCLUSIONS 1. This study represents, as far as
can be determined by the authors, the
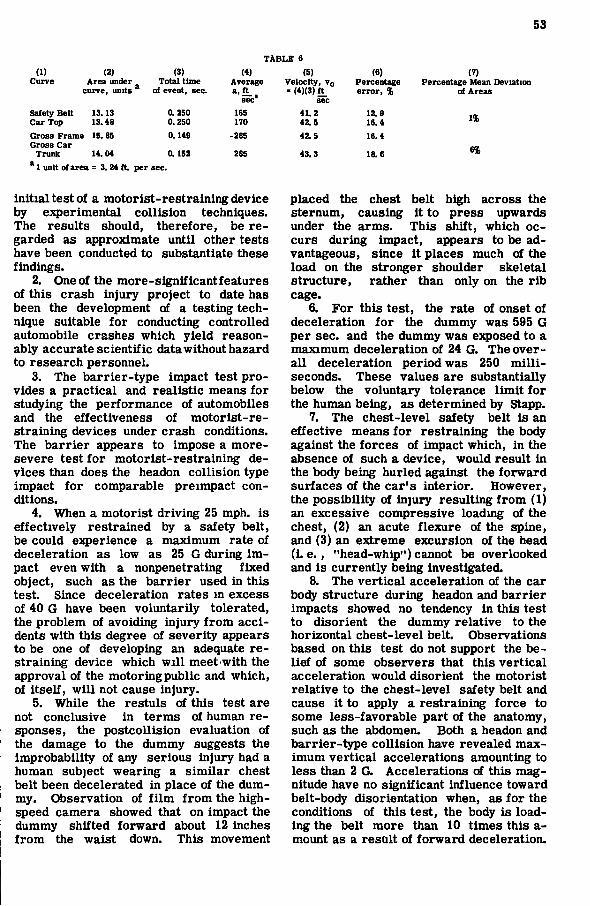
TABLE 6 (1) (2) (3) (4) (5) (6)
Curve Area under Total time Average Velocity, Vg Percentage curve, units of event, sec. a,ft_ = (4)(3)ft^ error, %
sec' sec Safety Belt 13.13 0.250 165 41.2 12.9 Car Top 13.48 0.250 170 42.5 16.4 Gross Frame 15. 85 0.149 -285 42.5 16.4 Gross Car
Trunk 14.04 0.152 285 43.3 18.6 1 unit of area = 3. 24 f t . per sec.
53
(7) Percentage Mean Deviation
of Areas
1%
6%
initial test of a motorist-restraining device by e}q>erimental collision techniques. The results should, therefore, be regarded as approximate until other tests have been conducted to substantiate these findings.
2. One of the more-significantfeatures of this crash injury project to date has been the development of a testing technique suitable for conducting controlled automobile crashes which yield reasonably accurate scientific datawithout hazard to research personnel.
3. The barrier-type impact test provides a practical and realistic means for studying the performance of automobiles and the effectiveness of motorist-restraining devices under crash conditions. The barrier appears to impose a more-severe test for motorist-restraining devices than does the headon collision type impact for comparable preimpact conditions.
4. When a motorist driving 25 mph. is effectively restrained by a safety belt, be could experience a maximum rate of deceleration as low as 25 G during impact even with a nonpenetrating fixed object, such as the barrier used in this test. Since deceleration rates m excess of 40 G have been voluntarily tolerated, the problem of avoiding injury from accidents with this degree of severity appears to be one of developing an adequate re-strainii^ device which will meet with the approval of the motoring public and which, of itself, will not cause injury.
5. While the restuls of this test are not conclusive in terms of human responses, the postcoUision evaluation of the damage to the dummy suggests the improbability of any serious injury had a human subject wearing a similar chest belt been decelerated in place of the dummy. Observation of film from the highspeed camera showed that on impact the dummy shifted forward about 12 inches from the waist down. This movement
placed the chest belt high across the sternum, causing it to press upwards under the arms. This shift, which occurs during impact, appears to be advantageous, since it places much of the load on the stronger shoulder skeletal structure, rather than only on the rib cage.
6. For this test, the rate of onset of deceleration for the dummy was 595 G per sec. and the dummy was exposed to a maximum deceleration of 24 G. The overall deceleration period was 250 milliseconds. These values are substantially below the voluntary tolerance limit for the human being, as determined by Stapp.
7. The chest-level safety belt is an effective means for restraining the body against the forces of impact which, in the absence of such a device, would result in the body being hurled against the forward surfaces of the car's interior. However, the possibility of injury resulting from (1) an excessive compressive loading of the chest, (2) an acute flexure of the spine, and (3) an extreme excursion of the head (i. e., "head-whip") cannot be overlooked and is currently being investigated.
8. The vertical acceleration of the car body structure during headon and barrier impacts showed no tendency in this test to disorient the dummy relative to the horizontal chest-level belt. Observations based on this test do not support the belief of some observers that this vertical acceleration would disorient the motorist relative to the chest-level safety belt and cause it to apply a restraining force to some less-favorable part of the anatomy, such as the abdomen. Both a headon and barrier-type collision have revealed maximum vertical accelerations amounting to less than 2 G. Accelerations of this magnitude have no significant influence toward belt-body disorientation when, as for the conditions of this test, the body is loading the belt more than 10 times this a-mount as a result of forward deceleration.

54
9. Without overlooking the benefits which may be derived from the use of a lap-type belt for rear-seat occupants in cases where there is sufficient forward clearance, it would appear that if the front-seat injury and death toll is to be reduced appreciably, a device which effectively restrains the head and chest, as demonstrated in this test, must be provided. Even with a lap belt, the out-thrust arms cannot be e}Q>ected to resist the forward forces of the upper torso, which exceeded 2,000 lb. in the 25- mph. impact. For front-seat usage, the lap-type belt provides impact protection only for the less-vulnerable portions of the anatomy, leaving the vital parts (head and upper torso) exposed to gross destructive deceleration.
10. A properly designed motorist-restraining device should: (1) restrain the body in such a manner as to prevent the vital parts of the anatomy from being subjected to injurious impact, (2) maintain driver and occupants in their proper seating position in order to prevent loss of control of the car following impact, (3) prevent driver and passengers from being thrown from the car and being injured or killed (a) by impact with fixed objects, (b) by crushing by their own vehicle, or (c) crushing by other vehicles.
11. The bumper collapsed completely during impact without contributing significantly to the deceleration of the car.
12. Under the stresses of severe impact, the automobile responds as a somewhat-flexible structure. A previous headon impact study (4) as well as the barrier-type impact study indicate that the intact portions of the car frame may reach peak rates of deceleration somewhat higher than the adjacent upper parts of the automobile body. Further study of this phenomenon will provide data suggesting the structural member of the car most suitable for securing the anchorages for restraining devices.
13. The deceleration pattern of the crashing car suggests that the severity of a crash would be reduced significantly if the frame of the car was designed with an energy-absorbing section capable of reducing the peak deceleration by about 30 percent. To what extent, if any, this prob
lem has been met in automobiles of more-recent design than the test car used will be evaluated in subsequent tests.
14. Calculations based on this crash test indicate that the frame of this car absorbed appreciably less than 42 percent of the preimpact kinetic energy. As an estimate, based on the discussion of the text of this paper, not more than a third of the preimpact kinetic energy was absorbed by the frame of the car. The amount of permanent deformation of the frame decreased approximately linearily from the front bumper to firewall, as shown by Figure 13. This information may be useful to those interested in designing the frontal portion of a car to be a more-effective energy-absorbing medium.
15. The deformation pattern of the test car frame appears to be triangular, with maximum deformation occurring at the bumper and decreasing nearly linearly from the front section of the frame towards the firewalL Additional investigatioTi is necessary to determine to what extent this pattern deviates from an ideal collapse pattern, as well as the extent to which late-model cars deviate from the ideal.
16. In the past, the coefficient of restitution for the crashing automobile was estimated as being nearly zero. The coefficient of restitution for the automobile-barrier impact was 0.16. The coefficients of restitution for two headon collision studies were 0.03 and 0.10. These coefficients are valuable in problems concerning the calculation of the estimated preimpact speed of vehicles.
REFERENCES 1. "Uber den Schwerpunkt des men-
schlichen K3rpers met Rucksicht auf die Ausrustung des deutchen Infanteristen," A bhandlungend, Wissenschaften, Vol. 15, Part II, Leipzig, (1889).
2. Stapp, J. P . , "Human E}q)osures to Linear Deceleration," USAF, Wright-Patterson Air Force Base, Dayton, Ohio. December 1951.
3. Accident Facts, Annual publication of the National Safety Council, Chicago.
4. Mathewson - Severy, Engineering Analysis of an Instrumental Head-on Collision, October, 1952 — Unpublished.

Publications of the Highway Research Board Relating to Highway Accidents and Safety
Bulletin 73. DRIVER CHARACTERISTICS AND ACCIDENTS (1953) 60 p. $.90
The A. T. A. Case-Interview Plan as a Method for Driver Improvement, Merwyn A. Kraft; A Sampling Study of Drivers on the Highways for the 24-Hr. Period, A. R. Lauer; Relationship of Preventable to Nonpreventable Accidents in the Trucking Industry, Dannie J . Moffie and Carlton Alexander; Rapid-Deceleration Tests of Chest-Level Safety Belt, J . H. Mathewson and D. M. Severy; Discussion by Hugh De Haven.
Bulletin 74. TRAFFIC-ACCIDENT STUDIES (1953) 53 p. $. 90 Traffic-Accident Trends, David M. Baldwin; Relation Between Number of Accidents and Traffic Volume at Divided-Highway Intersections, John W. McDonald; Interstate Highway-Accident Study, Morton S. Raff; Relation of Traffic Signals to Intersection Accidents J . Carl McMonagle.
Bulletin 91. HIGHWAY ACCIDENTS AND RELATED FACTORS (1954) (1954) 54 p. $. 75
Bibliography 2. A SELECTED BIBLIOGRAPHY ON HIGHWAY SAFETY (Annotated) (1947) 46 p. $. 45
Provides an annotated listing of selected references which may be accepted as a guide in the selection of material for a basic library on Highway safety, including many items dealing with matters of design, construction and traffic facilitation which have a direct bearing on safety.
Bibliography 2. Supplement No. 1. A SELECTED BIBLIOGRAPHY ON HIGHWAY SAFETY (Annotated) (1949) 12 p. $. 15
Compiled as a supplement to Bibliography No. 2 and contains references to new material published since that time and revised publications appearing in the original bibliography.

THE NATIONAL ACADEMY OP SCIENCES—NATIONAL RESEARCH COUNCIL is a private, nonprofit organization of scientists, dedicated to the furtherance of science and to its use for the general welfare. The
ACADEMY itself was established in 1863 under a congressional charter signed by President Lincoln. Empowered to provide for all activities appropriate to academies of science, it Was also required by its charter to act as an adviser to the federal government in scientific matters. This provision accounts for the dose ties that have always existed between the ACADEMY and the government, although the ACADEMY is not a governmental agency.
The NATIONAL RESEARCH COUNCIL was established by the ACADEMY in 1916, at the request of President Wilson, to enable scientists generally to associate their efforts with those of the limited membership of the ACADEMY in service to the nation, to society, and to science at home and abroad. Members of the NATIONAL RESEARCH COUNCIL receive their appointments from the president of the ACADEMY. They include representatives nominated by the major scientific and technical societies, representatives oi the federal government designated by the President of the United States, and a number of members at large. In addition, several thousand scientists and engineers take part in the activities of the research council through membership on its various boards and committees.
Receiving funds from both public and private sources, by contribution, grant, or contract, the ACADEMY and its RESEARCH COUNCIL thus work to stimulate research and its applications, to survey the broad possibilities of science, to promote effective utilization of the scientific and technical resources of the country, to serve the government, and to further the general interests of science.
The HIGHWAY R^ISEARCH BOARD was organized November 11, 1020, as an agency of the Division of Engineering and Industrial Research, one of the eight functional divisions of the NATIONAL RESEARCH COUNCIL. The BOARD is a cooperative organization of the highway technologists of America operating under the auspices of the ACADEMY-COUNCIL and with the support of the several highway departments, the Bureau of Public Roads, and many other organizations interested in the development of highway transportation. The purposes of the BOARD are to encourage research and to provide a national clearinghouse and correlation service for research activities and information on highway administration and technoloK' .
/NATIONAL '•:RESEARCH